Abstract
We performed the polarization imaging of a liquid crystal polymer with a terahertz difference-frequency generation (THz DFG) source. The DFG source is an easy-to-operate and practical THz source. Liquid crystal polymers (LCPs) are suitable for applications such as fuel cell components, aircraft parts, and next-generation wireless communication materials. Accordingly, the demand for evaluating the orientation of liquid crystals, which affects the properties of the polymers, is set to increase. Since LCPs exhibit birefringence in the THz range due to the orientation of the liquid crystal molecules, we can determine the alignment of the molecules from the direction of the optical axis.
1. Introduction
Liquid crystal polymers (LCPs) are polymers that exhibit the properties of liquid crystals. Due to their dense crystal structure, LCPs are self-reinforced polymers that exhibit good mechanical characteristics. LCPs have fluidity, which makes them suitable for the production of thin-walled components. Additionally, LCPs exhibit a high dimensional stability, high gas barrier properties, stiffness, and a low thermal expansion. By taking advantage of these characteristics, LCPs are expected to be applied to fuel cell components and aircraft parts. Moreover, in next-generation wireless communication systems, LCPs are expected to be used as electronic materials with a low permittivity and low loss factor (tan δ) [1,2]. LCPs can form flexible, printed, circuit-like, thin-film substrates and are attractive for use in high-frequency, flexible antennas due to their low dielectric loss, low moisture absorption, and resistance to chemicals. The liquid crystal orientation affects the various characteristics of LCPs, such as their mechanical properties. Therefore, nondestructive testing techniques for measuring the liquid crystal orientation of LCPs are becoming increasingly important.
Although LCPs are opaque to light in the UV, VIS, and IR regions, they are transparent to terahertz (THz) waves (0.3–10 THz). THz wave applications in fields including medicine [3], pharmaceutical science [4,5,6], security screening [7] and testing for industrial materials [8,9] have been reported. LCPs exhibit birefringence in the THz range; therefore, the measurement of LCPs based on THz polarized waves was investigated. So far, the polarization imaging of birefringent materials including LCPs has been performed by using THz time-domain spectroscopy (THz-TDS) [10,11,12,13]. However, THz-TDS faces some hurdles in being adopted for practical applications, such as the space required for the bulky optical setup, including a femtosecond laser; the stability of the measurement environment (temperature stability and low vibrations); and the need for skilled operators. Therefore, the development of a compact, stable, and easy-to-use THz light source is expected for industrial applications.
Recently developed compact THz sources, based on intra-cavity difference-frequency generation (DFG) in a dual-color, mid-infrared quantum cascade laser (QCL) integrated with two different laser active regions, use mid-infrared active regions engineered to exhibit a large optical nonlinearity χ(2) for an efficient THz DFG process [14]. Currently, these are the only electrically pumped, monolithic semiconductor and room-temperature-operable sources used at frequencies between 0.6 THz and 6 THz [15,16,17,18].
In this paper, we demonstrate the polarization imaging of an LCP with a compact THz DFG source and show the feasibility of nondestructive testing for LCPs by using this DFG source. This work is the first demonstration of THz polarization imaging for LCP using a very compact, monolithic semiconductor THz DFG source.
2. Materials and Methods
The LCP material used in our experiments was XYDAR® LK-301 (Solvay Specialty Polymers USA, LLC, Alpharetta, GA, USA). An imaging sample in the form of a sheet with a thickness of 0.35 mm was fabricated by T-die extrusion. We obtained the optical properties of the LCP which was fabricated by an injection molding process for the THz-TDS measurements. Our THz-TDS measurement system had a bandwidth of 0.2 to 4.0 THz.
For imaging measurements, a test object was set at the focal point of a transmission imaging system, as shown in Figure 1. A THz wire grid polarizer and an analyzer were inserted in the THz beam, as shown in Figure 1. The THz beam from the DFG source was horizontally polarized. As shown in the inset of Figure 1, φ is the angle of the molecular long axis of the sample with respect to the wire direction of the polarizer. THz imaging was demonstrated with cross-Nicol configuration and open-Nicol configuration. The cross-Nicol configuration was mostly used for imaging of birefringence samples, such as biomedical samples [19]. For the cross-Nicol configuration, the polarizer and the analyzer had an orthogonal relationship, whereas, for the open-Nicol configuration, the polarizer and the analyzer had a parallel relationship.
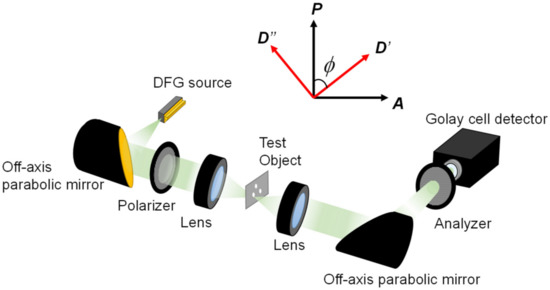
Figure 1.
Schematic diagram of transmission imaging system based on THz DFG-source. The THz radiation from our device was reflected and collimated with an off-axis parabolic mirror (f = 50 mm, 3-inch diameter) and was focused onto a test object by using an aspheric polymer lens (f = 40 mm, 45 mm clear aperture; Tsurupica®, Pax Co., Ltd., Sendai, Japan). Then, the THz beam transmitted through the object was collimated with another aspheric polymer lens (Tsurupica®, f = 40 mm, 45 mm clear aperture) and was collected and coupled into a Golay-cell detector using another off-axis parabolic mirror (f = 100 mm, 3 inch diameter). The inset shows the relationship between the polarizer axis (P), the analyzer axis (A) and the orientation of the liquid crystal polymer sample (D′ is parallel to the molecular long axis, and D″ is perpendicular to the molecular long axis.).
3. Results and Discussion
3.1. Terahertz Optical Properties of LCP
Figure 2a,b show the refractive index and absorption coefficient of the LCP, respectively. The sample was rotated such that its direction was perpendicular and parallel to the polarization of the THz beam. The optical properties (refractive index and absorption coefficient) for both the ordinary and extraordinary polarization can be determined, with the THz electric field polarized perpendicular or along the molecular long axis [12]. The measurement bandwidth was limited to 0.2–2.2 THz due to the attenuation loss of the sample. As shown in Figure 2a, we observed a birefringence △n = 0.1 across this frequency range. The refractive index for the extraordinary axis was higher than for the ordinary axis, similar to the other liquid crystal materials [11,12,13]. The absorption coefficient for the ordinary axis was slightly higher than for the extraordinary axis, similar to the other liquid crystal materials [11,12,13].
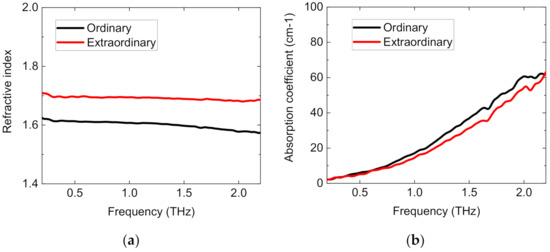
Figure 2.
(a) Refractive index and (b) absorption coefficient of liquid crystal polymer sample.
3.2. THz Imaging of LCP
We demonstrated the THz polarization imaging of the LCP by using the THz DFG source. Since the THz emission from the THz DFG source was ultrabroadband, it was necessary to confirm the frequency dependency of the polarization properties of the THz beam from the DFG source. We obtained the frequency-dependency of the polarization properties by using frequency band pass filters with three different center frequencies. Figure 3 shows the polarization properties of the THz beam from the DFG source at each frequency (2.0 THz, 2.5 THz, and 3.0 THz, respectively). There was no noticeable difference in the polarization properties at each frequency. Considering the frequency-independency of the polarization properties of the THz beam and the constant birefringence across the frequency range, we could demonstrate polarization imaging without frequency filtering.
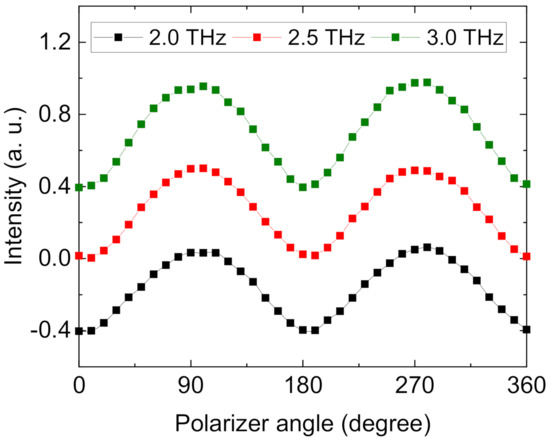
Figure 3.
Terahertz polarization properties at each frequency, obtained using 2.0 THz, 2.5 THz, and 3.0 THz bandpass filters (FB19M150, FB19M120 and FB19M100, respectively, Thorlabs, Inc., Newton, MA, USA).
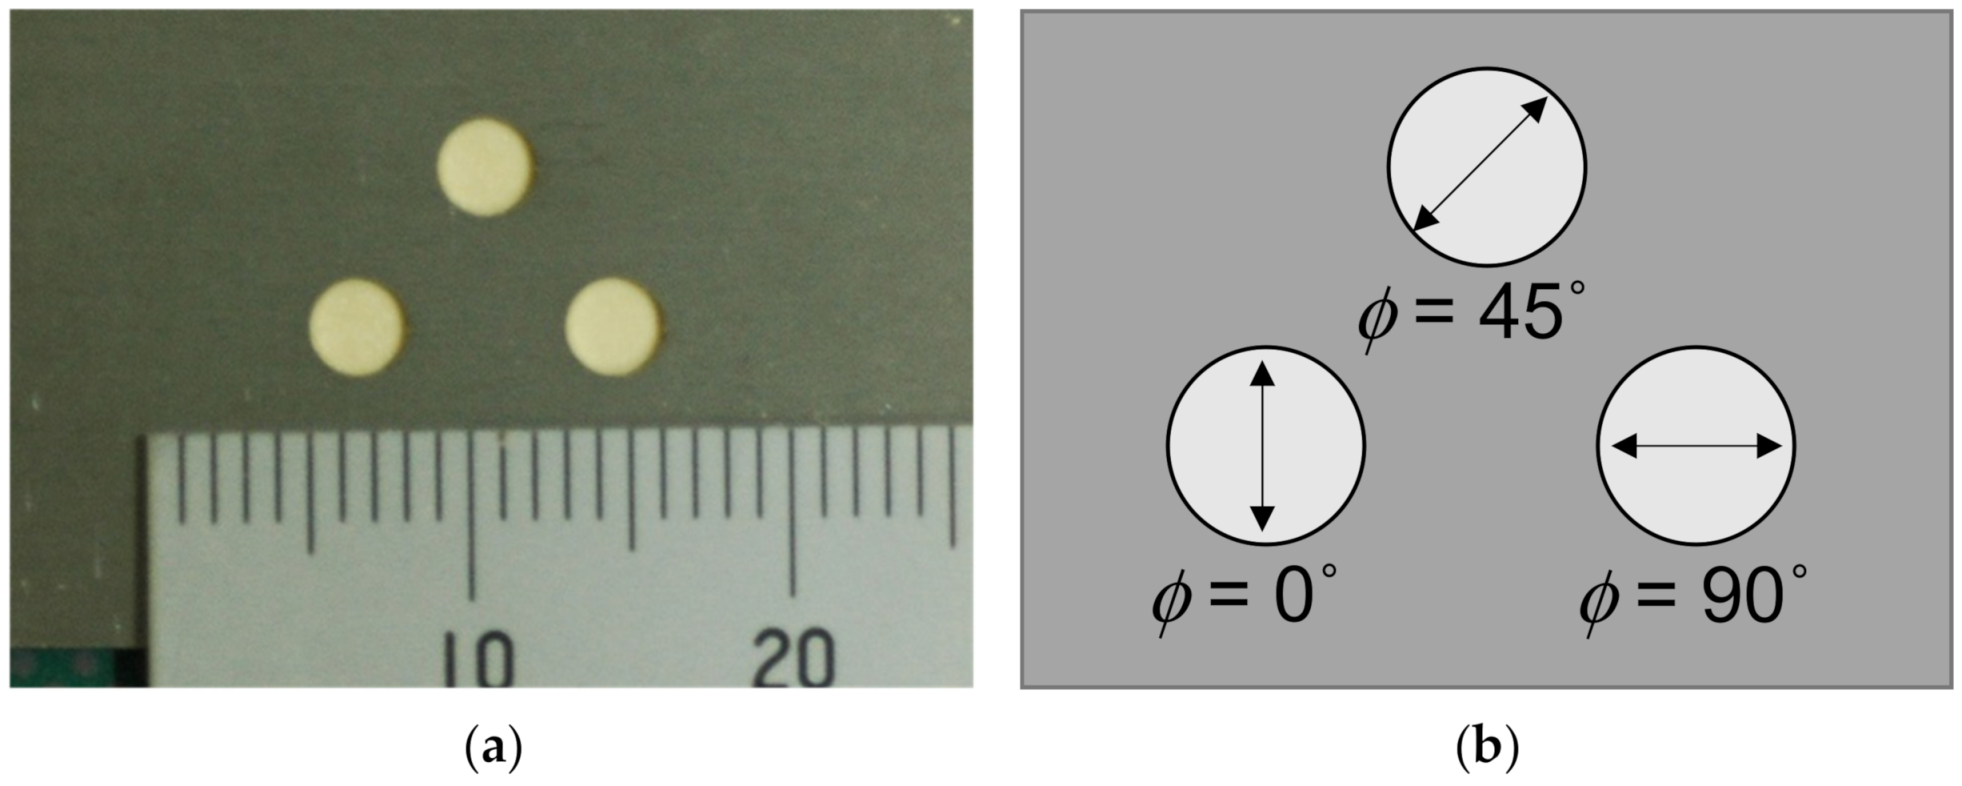
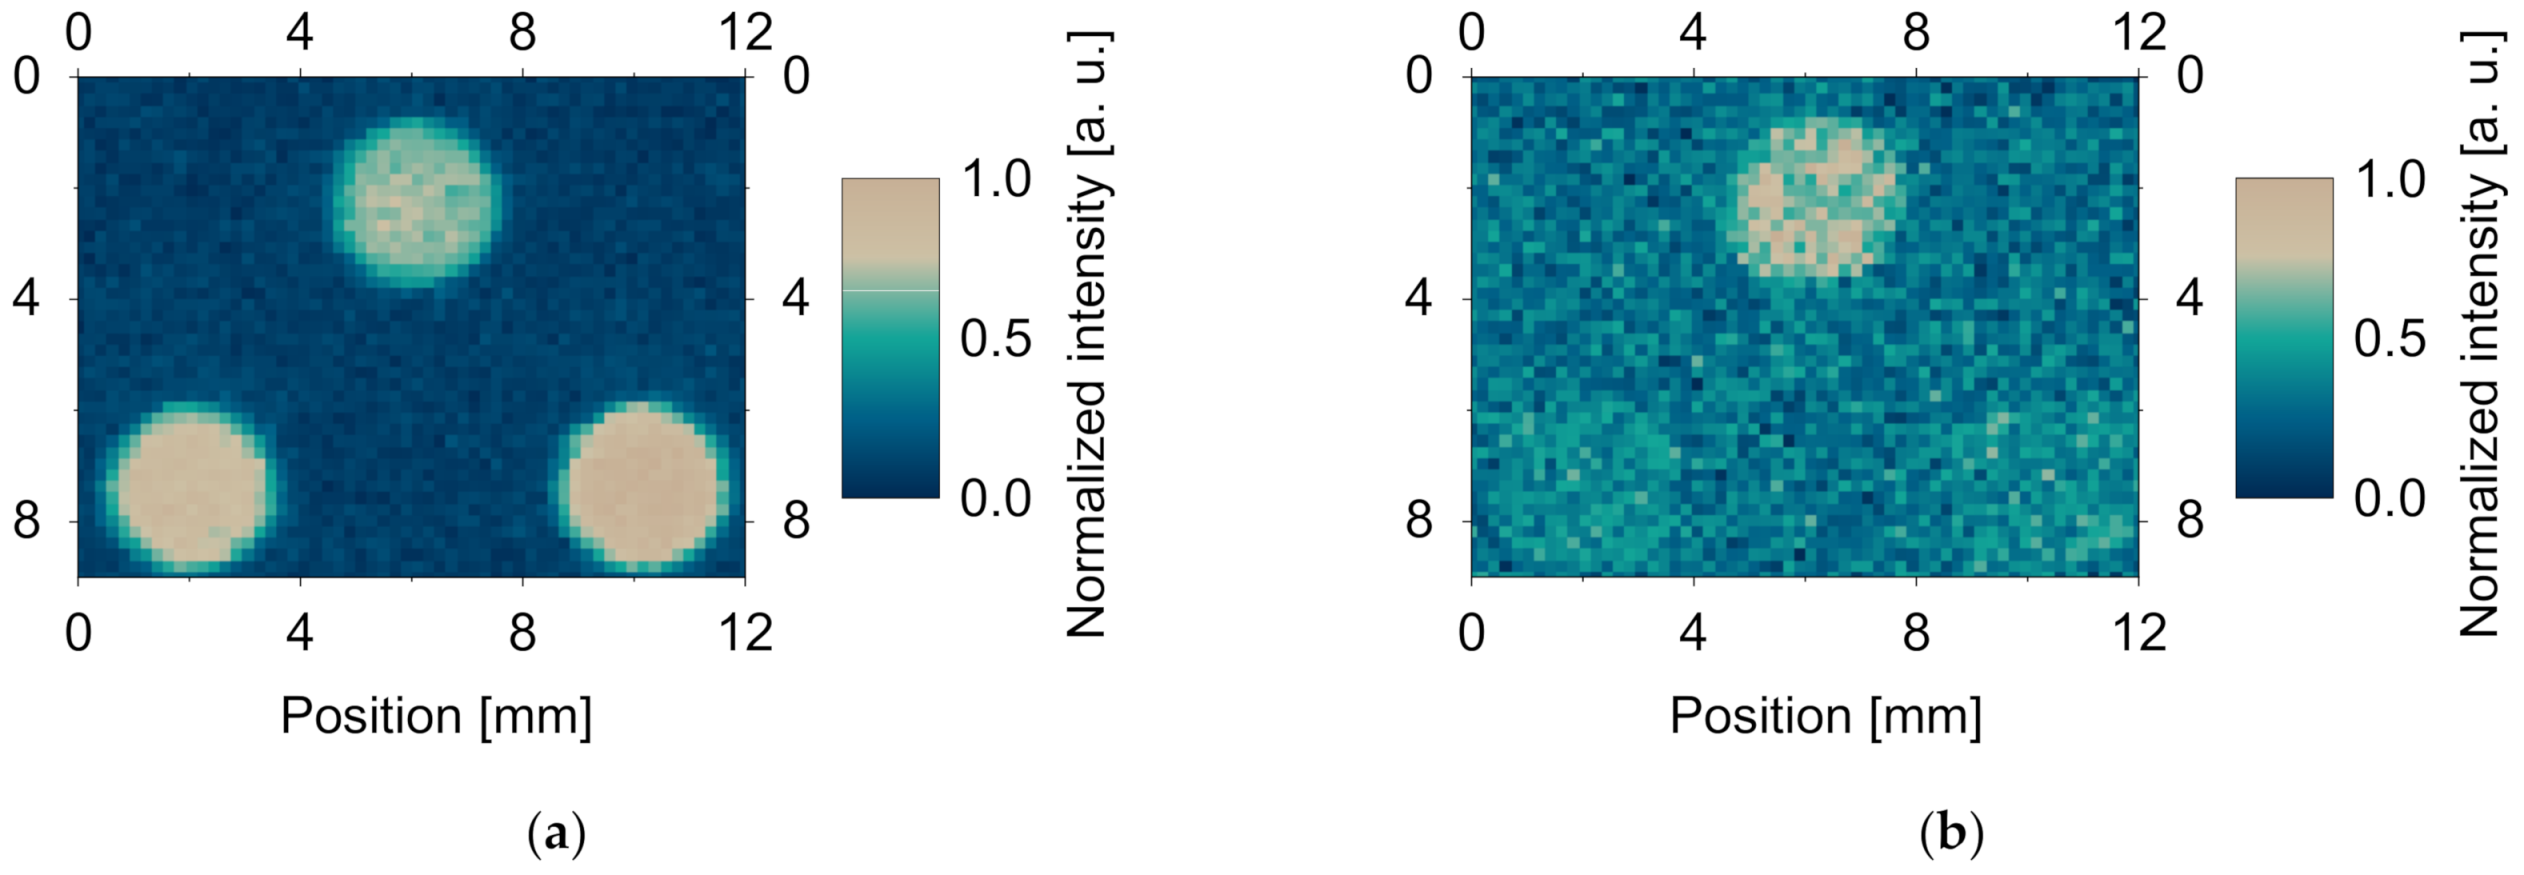
We demonstrated imaging of LCP test objects having different liquid crystal orientations (φ = 0°, 45° and 90°). Figure 4a shows a photograph of the test object and Figure 4b is a schematic illustration of the test object showing the direction of the liquid crystal orientation. As shown in Figure 4a, we could not find any difference in the liquid crystal orientation with visible light. Figure 5a shows a THz image obtained in the open-Nicol configuration. We found that the sample with the molecular long axis parallel, or the sample orthogonal to the polarizer axis (namely, φ = 0° and 90°, respectively), had a relatively high transmission intensity, whereas the sample with the molecular long axis at an angle of 45°, with respect to the polarizer axis (namely, φ = 45°), had a low transmission intensity. For φ = 45°, the THz beam was attenuated by the analyzer because of the elliptical polarization induced by the birefringence of the LCP sample. In contrast, for φ = 0° and 90°, the THz transmission intensity was not attenuated by the analyzer because the THz beam was linearly polarized parallel to the transmission axis of the analyzer.
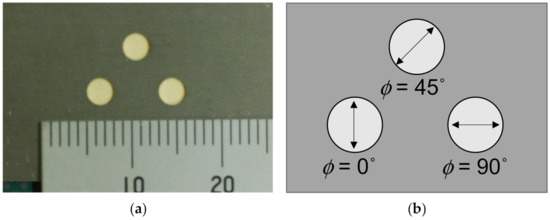
Figure 4.
(a) Photograph of test object. (b) Schematic illustration of test object showing direction of liquid crystal orientation.

Figure 5.
(a) THz image obtained in open-Nicol configuration. (b) THz image obtained in cross-Nicol configuration.
Figure 5b shows the THz image obtained in the cross-Nicol configuration. We found that the transmission image of the sample rotated by 45° (φ = 45°) and was detectable, whereas the transmission images of the sample for 0° and 90° (φ = 0° and 90°, respectively) vanished. For φ = 45°, the THz beam could pass through the analyzer because of the elliptical polarization induced by the birefringence of the LCP sample. In contrast, for φ = 0° and 90°, the THz wave could not pass through the analyzer because the THz beam had a linear polarization orthogonal to the transmission axis of the analyzer.
The observed transmission intensity of the birefringent material is explained by its phase shift and rotation angle.
The phase shift δ is written as:
where h is the thickness of sample, λ is the wavelength of light, and △n is the birefringence. For the cross-Nicol configuration, the transmitted light intensity I can be expressed as:
where I0 is the input light intensity, and φ is the angle between the molecular long axis of the birefringent sample and the polarizer axis. Here, when the direction of the molecular long axis, with respect to the analyzer as, α, is set to α = 90° − φ, then:
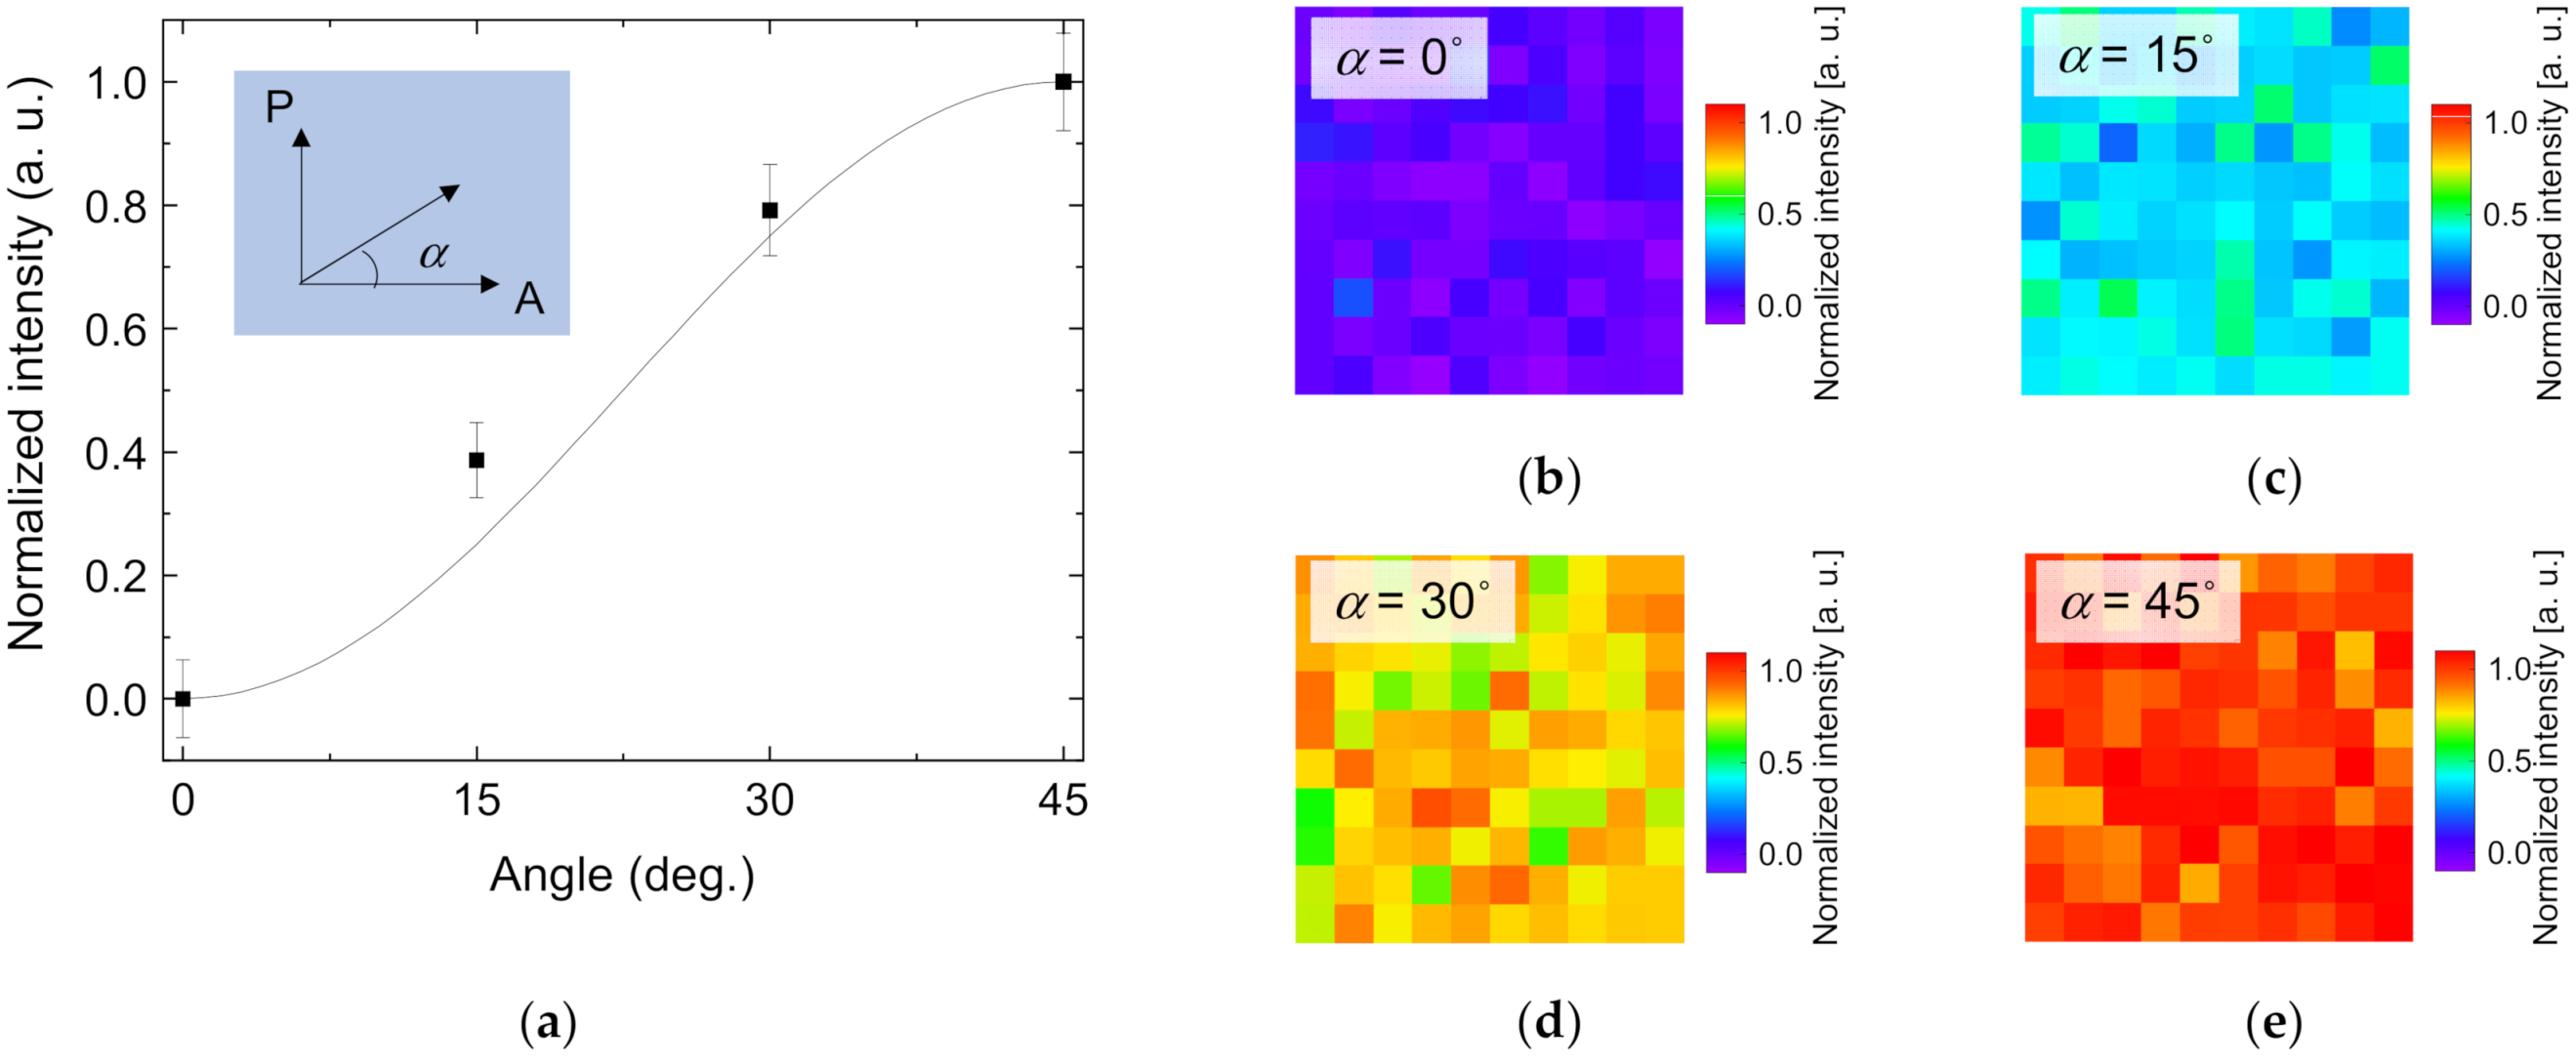
To detect the orientation of the LCP, we obtained THz images while rotating the LCP sample in the cross-Nicol configuration. We obtained THz images of the LPC sample when α was varied from 0° to 45° in steps of 15° (10 × 10 pixels, 0.4 mm steps). To obtain a better signal-to-noise ratio, we acquired and accumulated measurements a total of 40 times. From the obtained images, the average value and standard deviation were calculated. The normalized plots and theoretical results calculated by using Equation (3) are shown in Figure 6a. The experimental value was in good agreement with the theoretically calculated value. Figure 6b–e shows the transmitted images when the LCP sample was rotated in steps from 0° to 45° (α = 0°, 15°, 30°, 45°, respectively). As a result, we could find the orientation of LCP by measuring the THz transmission intensity.
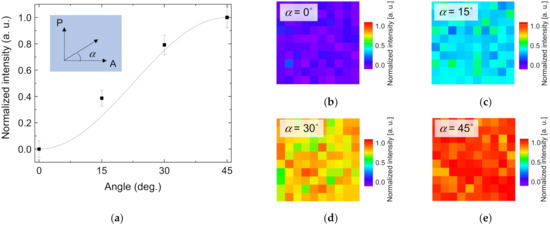
Figure 6.
(a) Normalized transmitted THz intensity when rotating the LCP sample and theoretical results (solid line) calculated by using Equation (3). (b–e) Transmission images when rotating LCP sample in steps from 0° to 45° (α = 0°, 15°, 30°, 45°, respectively). Images were obtained with raster-scanning method.
4. Conclusions
We demonstrated the polarization imaging of an LCP with a THz DFG source. Because the LCP exhibited a birefringence in the terahertz range due to the orientation of the liquid crystal molecules, we could find the alignment of the liquid crystal molecules from the direction of the optical axis. The THz DFG source was compact and easy to handle because it could be operated at room temperature. Furthermore, this THz DFG source is expected to be applied in polarization spectroscopy for frequency-dependent samples because the THz beam from the source produces an ultrabroadband emission.
Author Contributions
Conceptualization, A.N.; methodology, A.N.; investigation, A.N. and S.H.; writing—original draft preparation, A.N.; writing—review and editing, K.F.; supervision, H.S.; project administration, K.F. All authors have read and agreed to the published version of the manuscript.
Funding
This research and development work was supported by MIC/SCOPE #JP195006001.
Institutional Review Board Statement
Not applicable.
Informed Consent Statement
Not applicable.
Acknowledgments
The authors would like to acknowledge A. Ito for the device fabrication and K. Kuroyanagi for technical assistance. The authors also wish to acknowledge T. Edamura for helpful discussions.
Conflicts of Interest
The authors declare no conflict of interest.
References
- Lan, Y.; Xu, Y. Bending Limit Tests for Ultra-Thin Liquid Crystal Polymer Substrate Based on Flexible Microwave Components. Micromachines 2018, 9, 531. [Google Scholar] [CrossRef] [Green Version]
- Jilani, S.F.; Munoz, M.O.; Abbasi, Q.H.; Alomainy, A. Millimeter-Wave Liquid Crystal Polymer Based Conformal Antenna Array for 5G Applications. IEEE Antennas Wirel. Propag. Lett. 2019, 18, 84–88. [Google Scholar] [CrossRef] [Green Version]
- Mizuno, M.; Kitahara, H.; Sasaki, K.; Tani, M.; Kojima, M.; Suzuki, Y.; Tasaki, T.; Tatematsu, Y.; Fukunari, M.; Wake, K. Dielectric property measurements of corneal tissues for computational dosimetry of the eye in terahertz band in vivo and in vitro. Biomed. Opt. Express 2021, 12, 1295–1307. [Google Scholar] [CrossRef] [PubMed]
- Takeuchi, I.; Otsuki, M.; Kuroda, H.; Makino, K. Estimation of crystallinity of indomethacin by usage of terahertz time-domain spectroscopy and calibration curve: Correlation between crystallinity and solubility. J. Drug Deliv. Sci. Technol. 2018, 45, 70–75. [Google Scholar] [CrossRef]
- Bawuah, P.; Zeitler, J.A. Advances in terahertz time-domain spectroscopy of pharmaceutical solids: A review. TrAC Trends Anal. Chem. 2021, 139, 116272. [Google Scholar] [CrossRef]
- Puc, U.; Abina, A.; Jeglic, A.; Zidansek, A.; Kasalynas, I.; Venckevicius, R.; Valusis, G. Spectroscopic Analysis of Melatonin in the Terahertz Frequency Range. Sensors 2018, 18, 4098. [Google Scholar] [CrossRef] [PubMed] [Green Version]
- Cheng, Y.; Wang, Y.; Niu, Y.; Zhao, Z. Concealed object enhancement using multi-polarization information for passive millimeter and terahertz wave security screening. Opt. Express 2020, 28, 6350–6366. [Google Scholar] [CrossRef] [PubMed]
- Okano, M.; Watanabe, S. Inspection of internal filler alignment in visibly opaque carbon-black–rubber composites by terahertz polarization spectroscopy in reflection mode. Polym. Test. 2018, 72, 196–201. [Google Scholar] [CrossRef]
- Naftaly, M.; Vieweg, N.; Deninger, A. Industrial Applications of Terahertz Sensing: State of Play. Sensors 2019, 19, 4203. [Google Scholar] [CrossRef] [PubMed] [Green Version]
- Rutz, F.; Hasek, T.; Koch, M.; Richter, H.; Ewert, U. Terahertz birefringence of liquid crystal polymers. Appl. Phys. Lett. 2006, 89, 221911. [Google Scholar] [CrossRef]
- Vieweg, N.; Jansen, C.; Shakfa, M.K.; Scheller, M.; Krumbholz, N.; Wilk, R.; Mikulics, M.; Koch, M. Molecular properties of liquid crystals in the terahertz frequency range. Opt. Express 2010, 18, 6097–6107. [Google Scholar] [CrossRef] [PubMed]
- Vieweg, N.; Shakfa, M.K.; Koch, M. BL037: A nematic mixture with high terahertz birefringence. Opt. Commun. 2011, 284, 1887–1889. [Google Scholar] [CrossRef]
- Park, H.; Parrott, E.P.; Fan, F.; Lim, M.; Han, H.; Chigrinov, V.G.; Pickwell-MacPherson, E. Evaluating liquid crystal properties for use in terahertz devices. Opt. Express 2012, 20, 11899–11905. [Google Scholar] [CrossRef] [PubMed]
- Belkin, M.A.; Capasso, F.; Belyanin, A.; Sivco, D.L.; Cho, A.Y.; Oakley, D.C.; Vineis, C.J.; Turner, G.W. Terahertz quantum-cascade-laser source based on intracavity difference-frequency generation. Nat. Photonics 2007, 1, 288–292. [Google Scholar] [CrossRef]
- Belkin, M.A.; Capasso, F. New frontiers in quantum cascade lasers: High performance room temperature terahertz sources. Phys. Scr. 2015, 90, 118002. [Google Scholar] [CrossRef]
- Lu, Q.; Razeghi, M. Recent Advances in Room Temperature, High-Power Terahertz Quantum Cascade Laser Sources Based on Difference-Frequency Generation. Photonics 2016, 3, 42. [Google Scholar] [CrossRef]
- Fujita, K.; Jung, S.; Jiang, Y.; Kim, J.H.; Nakanishi, A.; Ito, A.; Hitaka, M.; Edamura, T.; Belkin, M.A. Recent progress in terahertz difference-frequency quantum cascade laser sources. Nanophotonics 2018, 7, 1795–1817. [Google Scholar] [CrossRef]
- Fujita, K.; Hayashi, S.; Ito, A.; Hitaka, M.; Dougakiuchi, T. Sub-terahertz and terahertz generation in long-wavelength quantum cascade lasers. Nanophotonics 2019, 8, 2235–2241. [Google Scholar] [CrossRef]
- Minamikawa, T.; Ichimura-Shimizu, M.; Takanari, H.; Morimoto, Y.; Shiomi, R.; Tanioka, H.; Hase, E.; Yasui, T.; Tsuneyama, K. Molecular imaging analysis of microvesicular and macrovesicular lipid droplets in non-alcoholic fatty liver disease by Raman microscopy. Sci. Rep. 2020, 10, 18548. [Google Scholar] [CrossRef] [PubMed]


Publisher’s Note: MDPI stays neutral with regard to jurisdictional claims in published maps and institutional affiliations. |
© 2021 by the authors. Licensee MDPI, Basel, Switzerland. This article is an open access article distributed under the terms and conditions of the Creative Commons Attribution (CC BY) license (https://creativecommons.org/licenses/by/4.0/).