Article

Optimization Analysis of Excavation Procedure Design of Underground Powerhouses under High In Situ Stress in China

1
State Key Laboratory of Water Resources and Hydropower Engineering Science, Wuhan University, Wuhan 430072, China
2
Key Laboratory of Rock Mechanics in Hydraulic Structural Engineering Ministry of Education, Wuhan University, Wuhan 430072, China
3
Key Laboratory of Geotechnical Mechanics and Engineering of Ministry of Water Resources, Changjiang River Scientific Research Institute, Wuhan 430010, China
*
Authors to whom correspondence should be addressed.
Appl. Sci. 2021, 11(21), 10252; https://doi.org/10.3390/app112110252
Submission received: 5 October 2021 / Revised: 25 October 2021 / Accepted: 27 October 2021 / Published: 1 November 2021

Abstract

:
To recommend the excavation procedures and design parameters for underground powerhouses, excavation procedures of fifty-one underground powerhouses in China were summarized and analyzed based on in situ stress conditions. Firstly, the complex stress environment in China was introduced and fifty-one underground powerhouses with their engineering scale, size, lithology, rock classification and in situ stress level were listed in detail. Subsequently, to evaluate the influence of in situ stress levels on excavation procedure design, the correlation between excavation procedures and in situ stress level in three main excavation zones were analyzed accordingly. Moreover, to provide the excavation design recommendations, the strength–stress ratio (SSR) was promoted to analyze and recommend the design parameters, and the blasting excavation design based on the stress transient unloading control was also supplemented. The results show that excavation procedures have different priorities under different in situ stress levels, and the design parameters show an obvious relationship with in situ stress levels. Moreover, the excavation procedure parameters are suggested to adjust accordingly under different SSR. The discussion of influencing factors and specification ensures its rationality and accuracy. It is believed that the summary and recommendations can provide a good reference for excavation procedure optimization of underground powerhouse under high in situ stress.

1. Introduction

With the continuous development and utilization of underground space, more and more hydropower projects are being constructed at increasing depths, which means high in situ stress appears easily. The effect of a high in situ stress on the excavation stability of hydropower underground caverns is being obvious, especially under high hollow ratio, multi-intersection and large section. Underground caverns, such as Ertan, Jinping I, Houziyan, etc., are usually faced with failure phenomena, including spalling, slabbing, rock-burst and so on [1,2,3,4,5]. The failure phenomena are not only related to internal factors such as geological conditions, in situ stress and rock mechanical properties, but also have connections with external factors, including cavern arrangement, excavation procedure and support timing [6,7,8]. To control and reduce the influence of high in situ stress, the optimization design of excavation procedure for hydropower caverns is often selected as one of the most important solutions. For large-scale underground cavern construction, the main excavation method is the drill-blasting method. The selection of excavation procedures and specific construction parameters, such as middle-drift method, bench method and specific stratification scheme, is directly related to the excavation quality and construction efficiency. Therefore, especially under high in situ stress, the reasonable selection of excavation procedure and construction method is of particular importance. Figure 1 presents the arrangement and typical excavation section of hydropower caverns, including the main powerhouse, main transformer room and tailrace gate chamber. Three caverns are of large scale and the excavation methods of them are basically the same. Due to the characteristic of the large size, numerous intersections and high hollow ratio, the main powerhouse has become a typical representative of them and deserves the most attention.
With the technology development, a set of corresponding excavation methods has been formed for hydropower caverns in China on the basis of construction experience, theoretical and experimental research. An excavation procedure design of underground powerhouse is mainly to divide the large cavern into various little parts and excavate them from top to bottom, following the principle of multi-sequences and cross-sequences [10]. For the main powerhouse, the excavation procedure design today is mainly divided into four parts (see Figure 2): top arch zone, rock anchor beam zone, high side-wall zone and machine pit zone.
In the recent decades, more and more experts have realized that the blasting excavation procedure design can influence the excavation stability, especially under high in situ stress. From the change of stress state, different excavation procedures correspond to different stress paths or stress histories. It not only affects the stress distribution, damaged depth and deformation range during the construction period, but also influences these of surrounding rock after the final forming [11]. When in situ stress level becomes relatively higher, in situ stress will become the dominant factor of rock failure [12], such as ‘V-shaped’ failure in tunnels [13]. Today, it is generally believed that there is a coupling effect between stress transient unloading and blasting excavation [14,15,16]. For a blasting excavation disturbance, the dynamic blasting disturbance is one of the most important rock-failure mechanisms [17,18] that trigger the rock-burst around underground excavation, exactly as the two largest rock-bursts (8 September 1995 and 30 April 1996) occurred during the blasting excavation process at the Ertan underground powerhouse [19].
For the stress transient unloading effect, numerous research results show that the redistribution of surrounding rock stress caused by stress dynamic unloading has an important influence on the formation and development of the excavation-disturbed area [20,21,22]. Niu et al. [23] proposed that the damage zone is influenced by both the magnitude of in situ stress and waveform of the dynamic disturbance. It will be larger with the increase of in situ stress degree [24]. Furthermore, through the mechanical analysis of the excavation load release process, the transient dynamic effect of in situ stress under medium and high in situ stress was proposed and demonstrated by the construction process, especially the coupling process of different construction methods and high-level in situ stress dynamic redistribution [4]. Simultaneously, the unloading effect under high in situ stress was considered as the main inducement of a rock loosening zone [25,26,27]. The combined action of explosion and stress transient release was also confirmed by the analysis of excavation vibration [28]. From this, the excavation control technology based on the transient unloading effect control was established through the excavation procedure optimization, contour blasting methods comparison and active prevention methods of rock burst in deep-buried caverns, etc. [14].
Based on the above-mentioned theoretical research, the non-simultaneous excavation of adjacent caverns was suggested to minimize the excavation impact of adjacent caverns through the numerical simulation and engineering practice [29,30,31]. The reasonable arrangement of excavation time and space distance in each area of the powerhouse is very effective to reduce the excavation damage and it was suggested to reduce the excavation volume of each step as much as possible. Xiao et al. [32] illustrated that more energy release caused by large-scale integral excavation could aggravate the possibility of rock-burst. Furthermore, the step-style deformation curve is the most common in powerhouse excavation, which shows the sudden adjustment of surrounding rock stress with the excavation sequence [33]. Correspondingly, Xu et al. [34] calculated the creep deformation curve and the corresponding optimal supporting time point. To make the construction procedure adjustment more scientific, the dynamic feedback and planning method was proposed and applied [35].
At present, blasting technology is relatively mature. Both presplitting blasting and smooth blasting can obtain a smooth excavation profile, meanwhile presplitting blasting can form pre-cracking to make isolation and crack resistance [36]. Lu et al. [15] found that middle-drift excavation beforehand would make the crack formation easier, which is proved in powerhouses, such as Ertan, Guandi, Jinping I and II, etc. In addition, the reserved protective cover was more adapted to the actual construction for vibration control. Meanwhile, the deep presplitting followed by thin stratification excavation gradually becomes the main choice of hydropower station under high in situ stress, such as Xiluodu, Baihetan, Changheba, etc. [37,38]. Furthermore, the fine construction was emphasized, including the selection of drilling equipment, drilling accuracy and blasting parameters, Xu and Yin [39] achieved a good excavation effect in the Xiangjiaba powerhouse where the influence depth caused by blasting excavation and stress unloading was a new record of 0.7~0.9 m.
To a certain extent, previous studies have shown that the engineering analogy method can provide guidance for construction procedure design today. Li [40] summarized the excavation characteristics of nine typical underground powerhouses in China and provided the procedure suggestions from construction access road, machinery and vibration control. Yang et al. [41] made a detailed statistics of failure events during the construction period, and basically established the relationship between the surrounding rock failure and the rock strength–stress ratio under the high in situ stress. It was found that the lower the strength–stress ratio is, the more events are. Zhang et al. [42] established the layout design method of large underground caverns based on rock strength–stress ratio, and put forward the specific quantitative formulas about spacing, rock pillar thickness and axis direction of a cavern group.
To sum up, the existing methods are basically derived from the on-site engineering experience and not summarized well in parameter selection of the excavation procedure. It is also common and rigescent for the relevant provisions to select the excavation procedure parameters without considering high in situ stresses in detail. The current numerical simulation methods [43,44,45,46,47], such as Finite Element Method (FEM), Fast Lagrangian Analysis of Continua (FLAC), Discrete Element Method (DEM) and Discontinuous Deformation Analysis (DDA), are quite different in generalizing geological structure and predicting the excavation damage zone, especially for high in situ stress. It can be seen that the existing excavation procedure design method is more and more unsuitable for stability control of underground cavern excavation of large hydropower stations with increasingly complex construction conditions, especially in the case of high in situ stress and low rock strength–stress ratio.
To this end, a short introduction on the basis of the stress environment and excavation procedure technology development in China was given firstly. In addition, fifty-one underground powerhouses in China were summarized and listed to compare the excavation procedures and to analyze their correlations with in situ stress levels. Afterwards, the strength–stress ratio was introduced to evaluate the cavern excavation stability. The recommended partition values for excavation procedure parameters were summarized and the blasting excavation design based on the stress transient unloading control was supplemented. It is beneficial to quantify the correlation between excavation procedure parameters and in situ stress, and to recommend a better excavation procedure optimization.

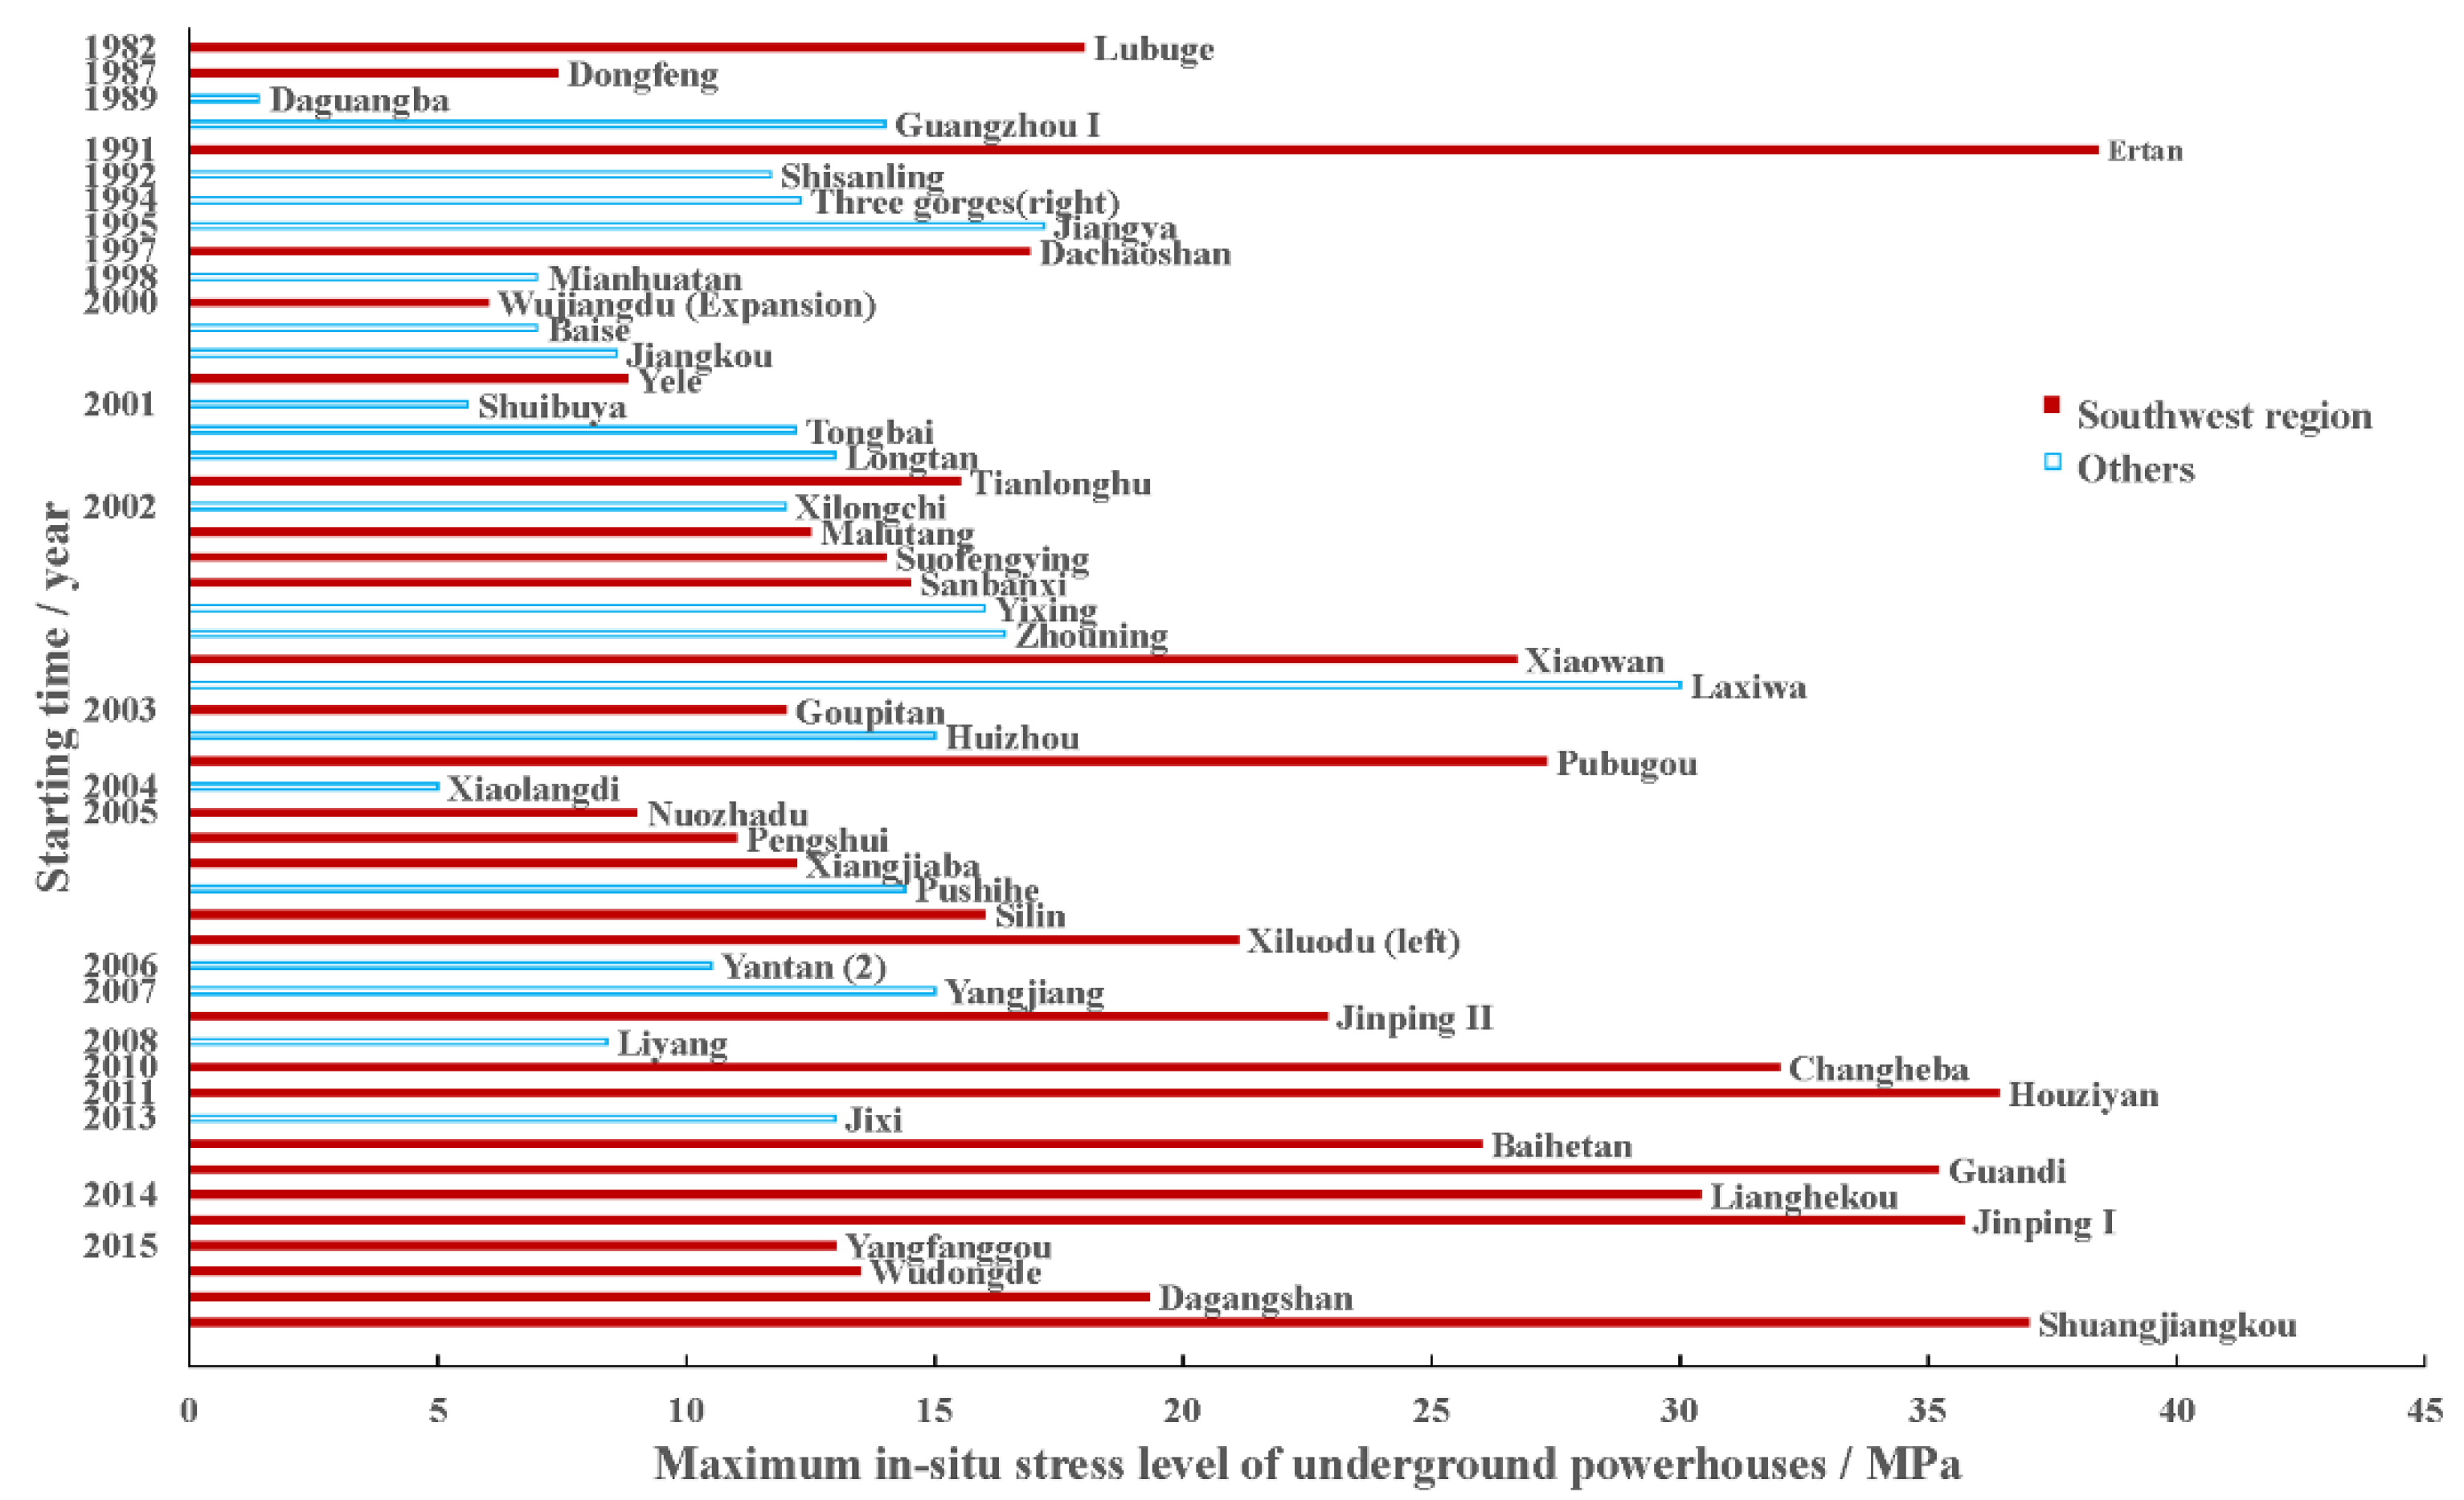
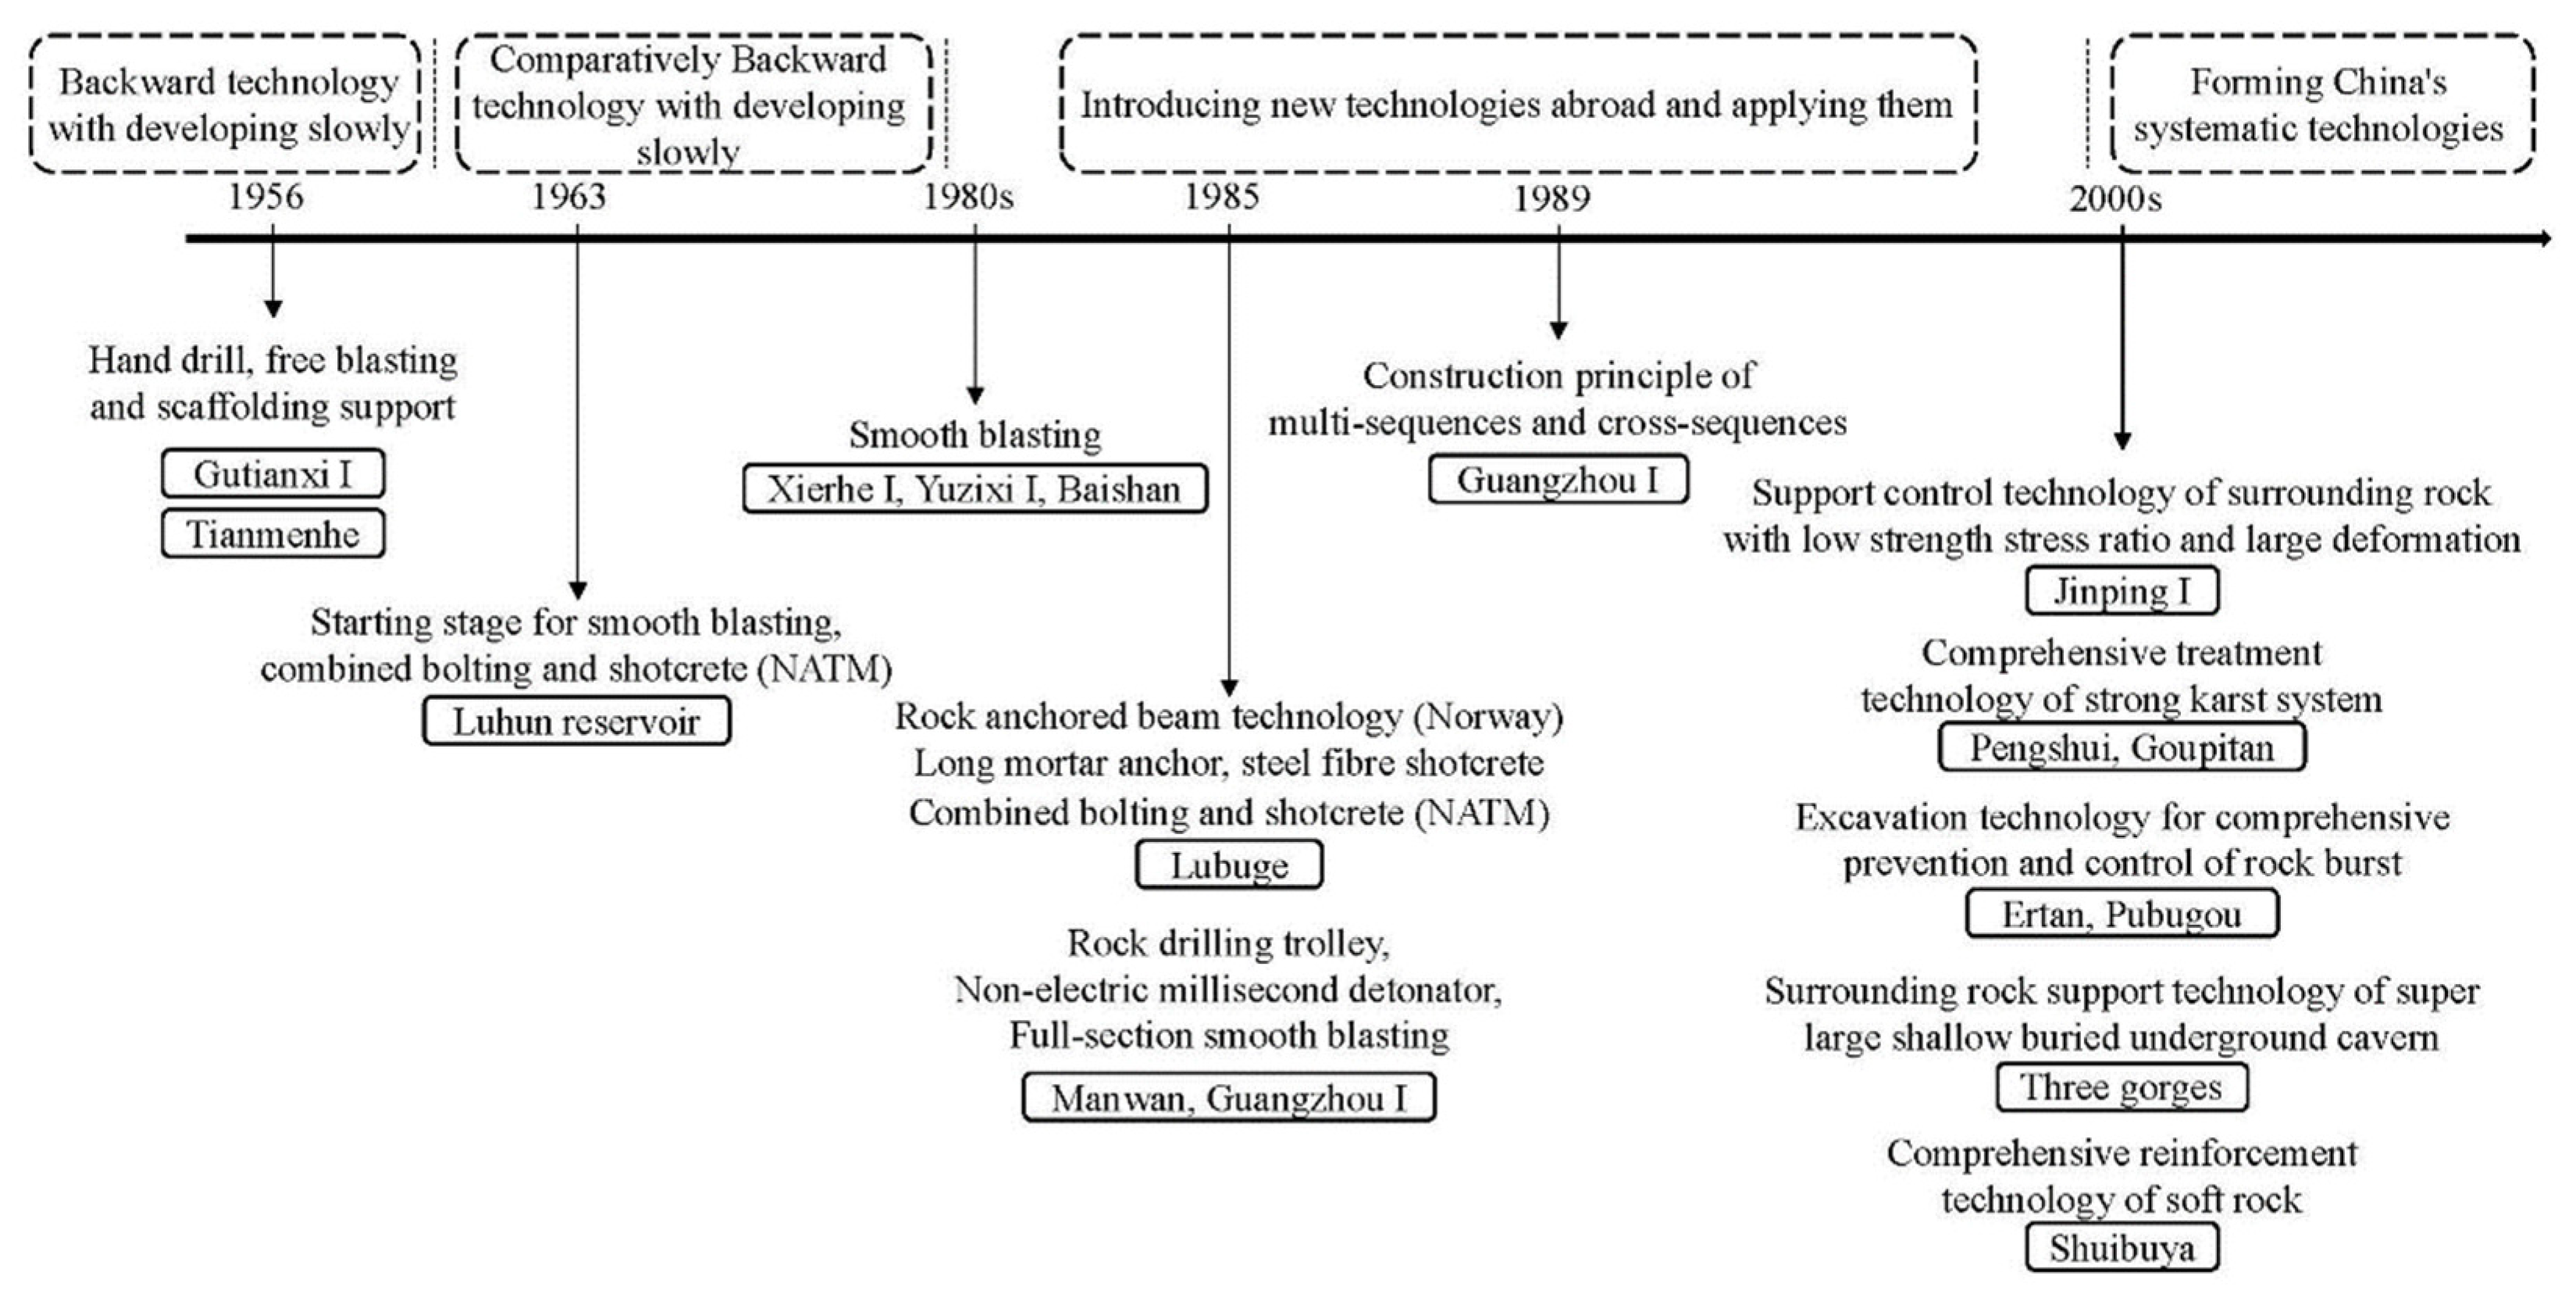
2. Overviews of In Situ Stress and Fifty-One Underground Powerhouses in China

Owing to strong uplift of the Tibetan Plateau, the southwest region (Sichuan, Yunnan and Guizhou province) of China is under a high in situ stress concentration. In situ stress is the natural stress that exists in the stratum, which is firstly put forward by the Swiss geologist A. Heim in 1912 [48]. In addition, the horizontal stress component has stronger effect than the vertical stress component under a certain thickness of the upper crust [49]. Especially in the southwest region of China, the maximum horizontal principal stress increases with the depth by 1.1~8.8 MPa per 100 m, and the lateral pressure coefficient (horizontal stress/vertical stress) is generally 1~1.5 [48]. To express the complicated stress distribution throughout the world, Heidbach et al. [50,51] considered faulting as the main cause of stress concentration and drew the world stress map. Figure 3 shows the detailed distribution of high in situ stress field in China where the main incentives include Normal Faulting (NF), Strike Slip (SS) and Thrust Faulting (TF), etc. At present, there is no unified standard for the division of in situ stress levels. Generally speaking, when the maximum principal stress reaches 20~30 MPa, it is considered that the rock mass is in the state of high in situ stress. Generally, when the local stress is at a small value, the surrounding rock stability is less affected by in situ stress while the surrounding rock will be greatly affected with the local stress being higher.
Since the late 20th century, the deep-rock excavation has gradually become a continuous trend for geotechnical engineering development, including hydropower underground powerhouses. Globally, there are more than 560 established underground powerhouses of large hydropower stations (see Figure 4) [52], accounting for about 18% in China, 10% in Italy, 8% in Japan, and both 7% in Norway and Sweden. In China, there are nearly 100 underground powerhouses of large-scale hydropower projects (including pumped storage). Figure 5 shows the detailed distribution, where about 44% of them are located in Sichuan, Yunnan and Guizhou province under high in situ stress field.
To perform research into the underground powerhouses in China, fifty-one of them are collected and listed in order of in situ stress levels to introduce the stress environment and other characteristics, as shown in Table 1.
Table 1 presents the engineering scale, size, lithology, rock classification and in situ stress level of underground powerhouses in detail. The surrounding rock condition is very complex where a variety of lithology and more than two classifications exist at hydropower stations. In situ stress level basically covers 0~40 MPa, which will lead to more complex construction issues. Since 1980s, the construction of underground powerhouses has been faced with complicated problems caused by high in situ stress in China. In addition, the high in situ stress gradually becomes the main factor affecting the excavation stability. Figure 6 shows the development history of numerous underground powerhouses in China. It is pretty obvious that in situ stress levels of hydropower powerhouses are gradually increasing with construction development. In addition, most of the hydropower powerhouses are located in the southwest region, such as Ertan, Xiaowan and Houziyan, etc.
All the powerhouses above are arranged in deep rock, and basically adopt the design mode that the main powerhouse, main transformer room and tailrace gate chamber are arranged in parallel, the same as shown in Figure 1b. Specifically, it is obvious that in situ stress levels of powerhouses gradually increase with the construction starting time basically except for Ertan. In addition, hydropower powerhouses under high in situ stress are mainly located in the southwest region of China. In the recent decades, under the construction demand of numerous underground powerhouses mentioned above, a series of construction technology and excavation procedures have gradually occurred. Facing the new problems such as high in situ stress, etc., excavation technology has been optimized as the engineering construction increases afterwards. Figure 7 presents the improvement history of excavation technology for underground powerhouse in China.
In Figure 7, there are mainly four stages for excavation technology development in China [64]. Since the construction of the Gutianxi I station, the backward technology of blasting construction in China has gradually developed. In addition, smooth blasting, presplitting blasting and buffer blasting are gradually used in underground engineering. With the introduction of NATM [65,66], the excavation method of hand drill, free blasting and scaffolding support was replaced by the technology of combined bolting and shotcrete. In 1985, the rock anchored beam technology was introduced into the Lubuge hydropower station in Norway [67], and further improved and developed in China [52]. In this stage, the construction principle of multi-sequences and cross-sequences was summarized. After opening to the outside world, blasting excavation technology and procedure design have been developed rapidly. Therefore, a series of systematic excavation methods has been formed in China, including various typical excavation and support technologies as shown in Figure 7 [10].
The drill-blasting method has always been the main technical method for powerhouse excavation and the relevant excavation method system has been basically formed [5,6,7]. However, there is no good basis for parameter setting of excavation procedures in the face of so complex conditions [41,42]. Thus, under high in situ stress, it is quite necessary to adopt reasonable excavation procedures and parameters to control rock-burst, peeling, large deformation and so on, which are induced by blasting disturbance and stress transient unloading effect.

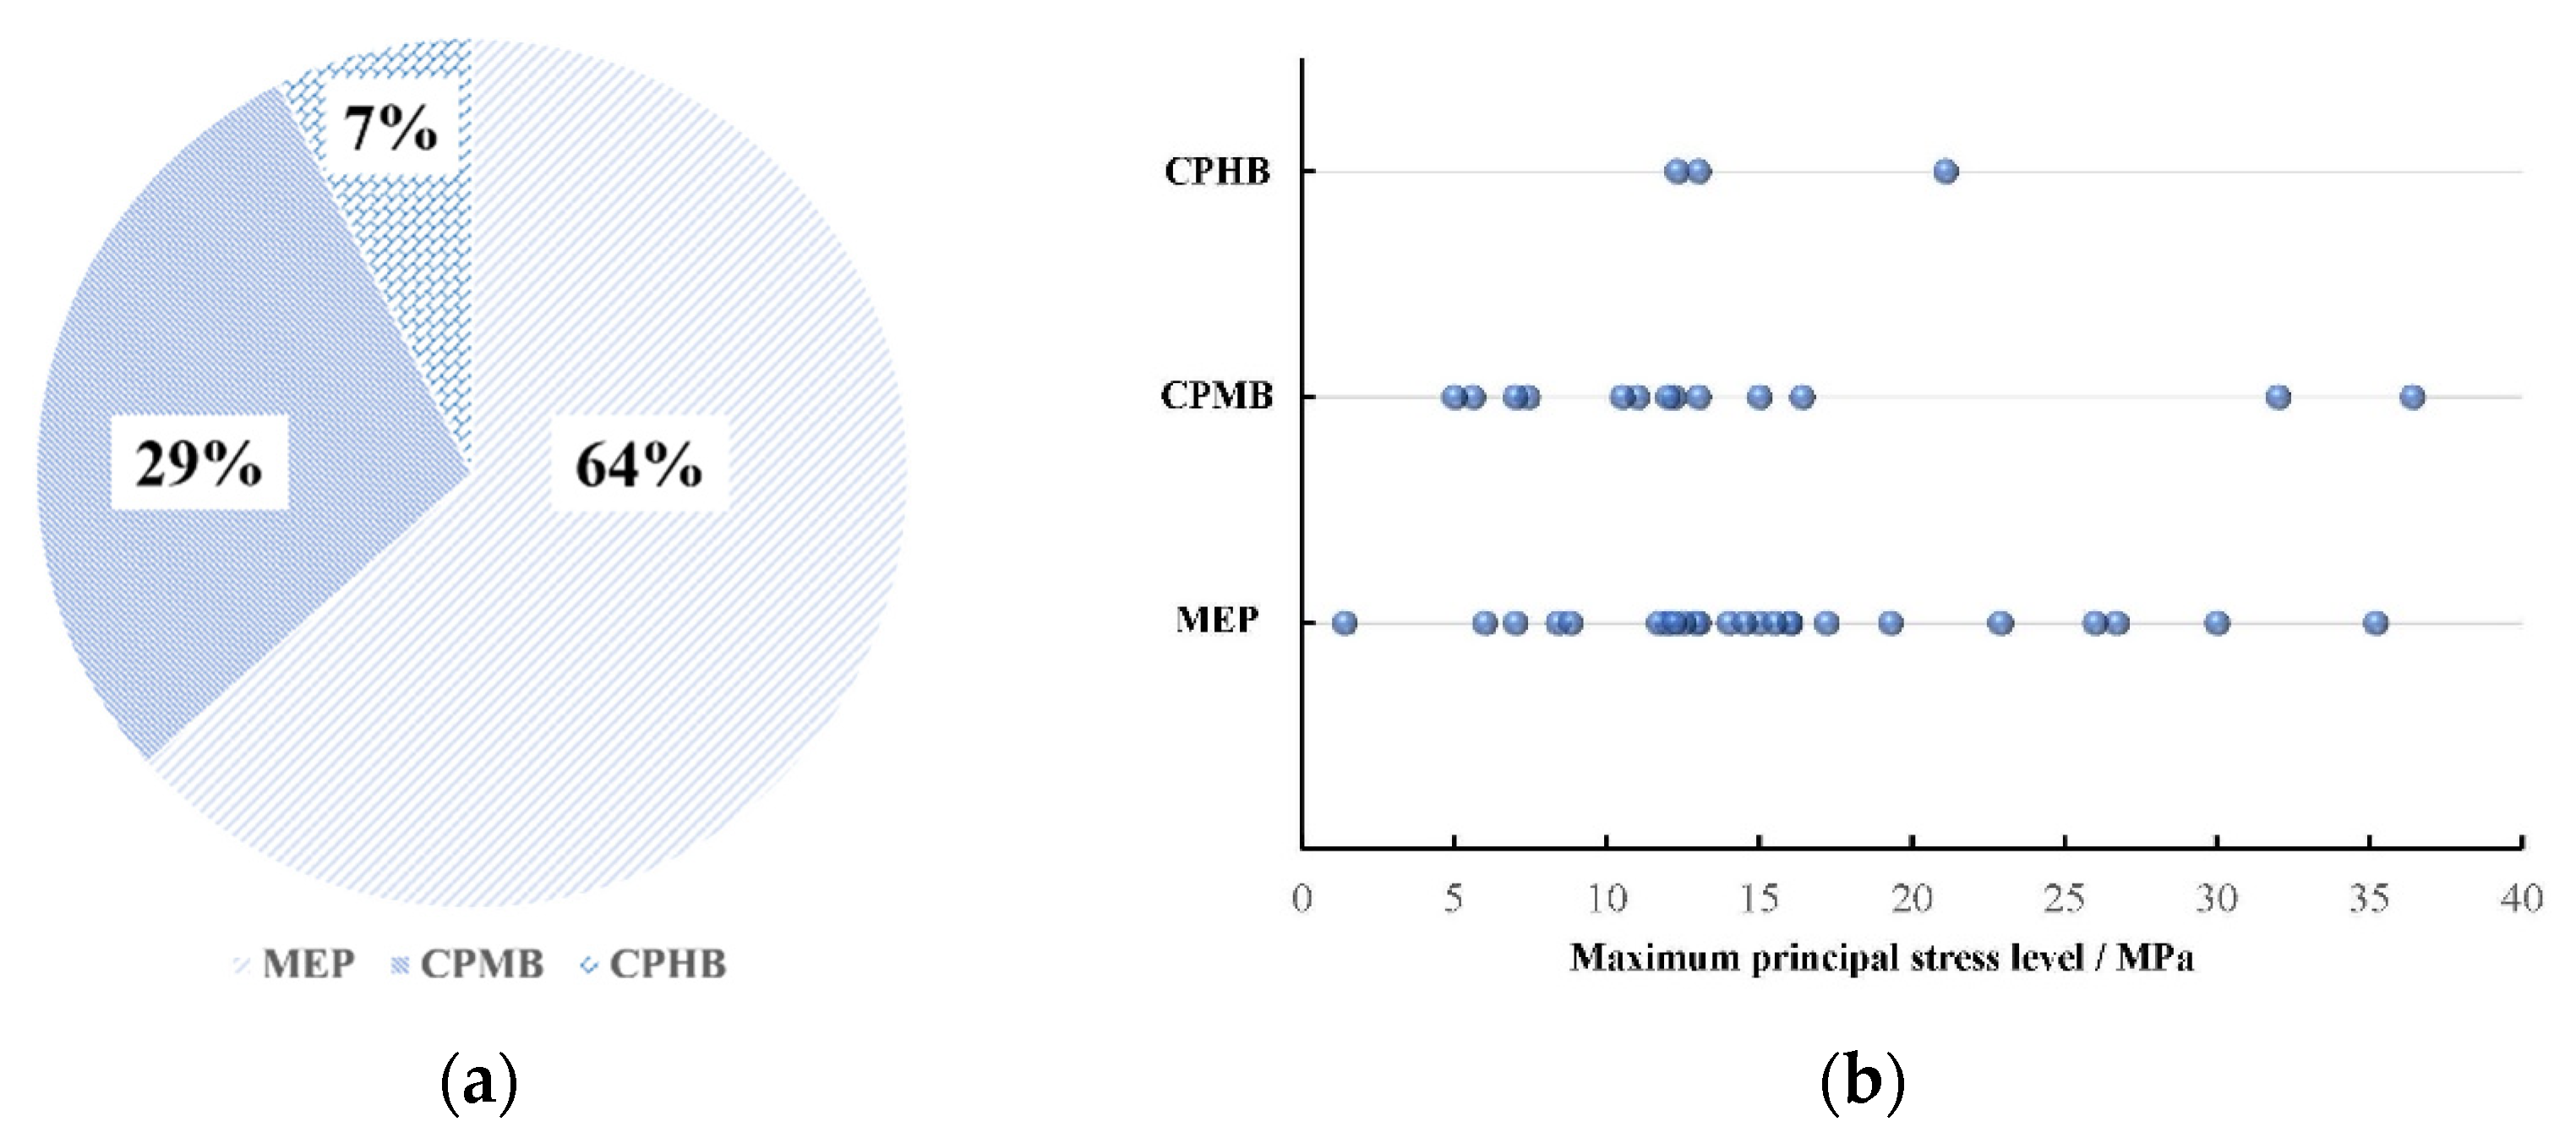
3. Excavation Procedures and In Situ Stress Level
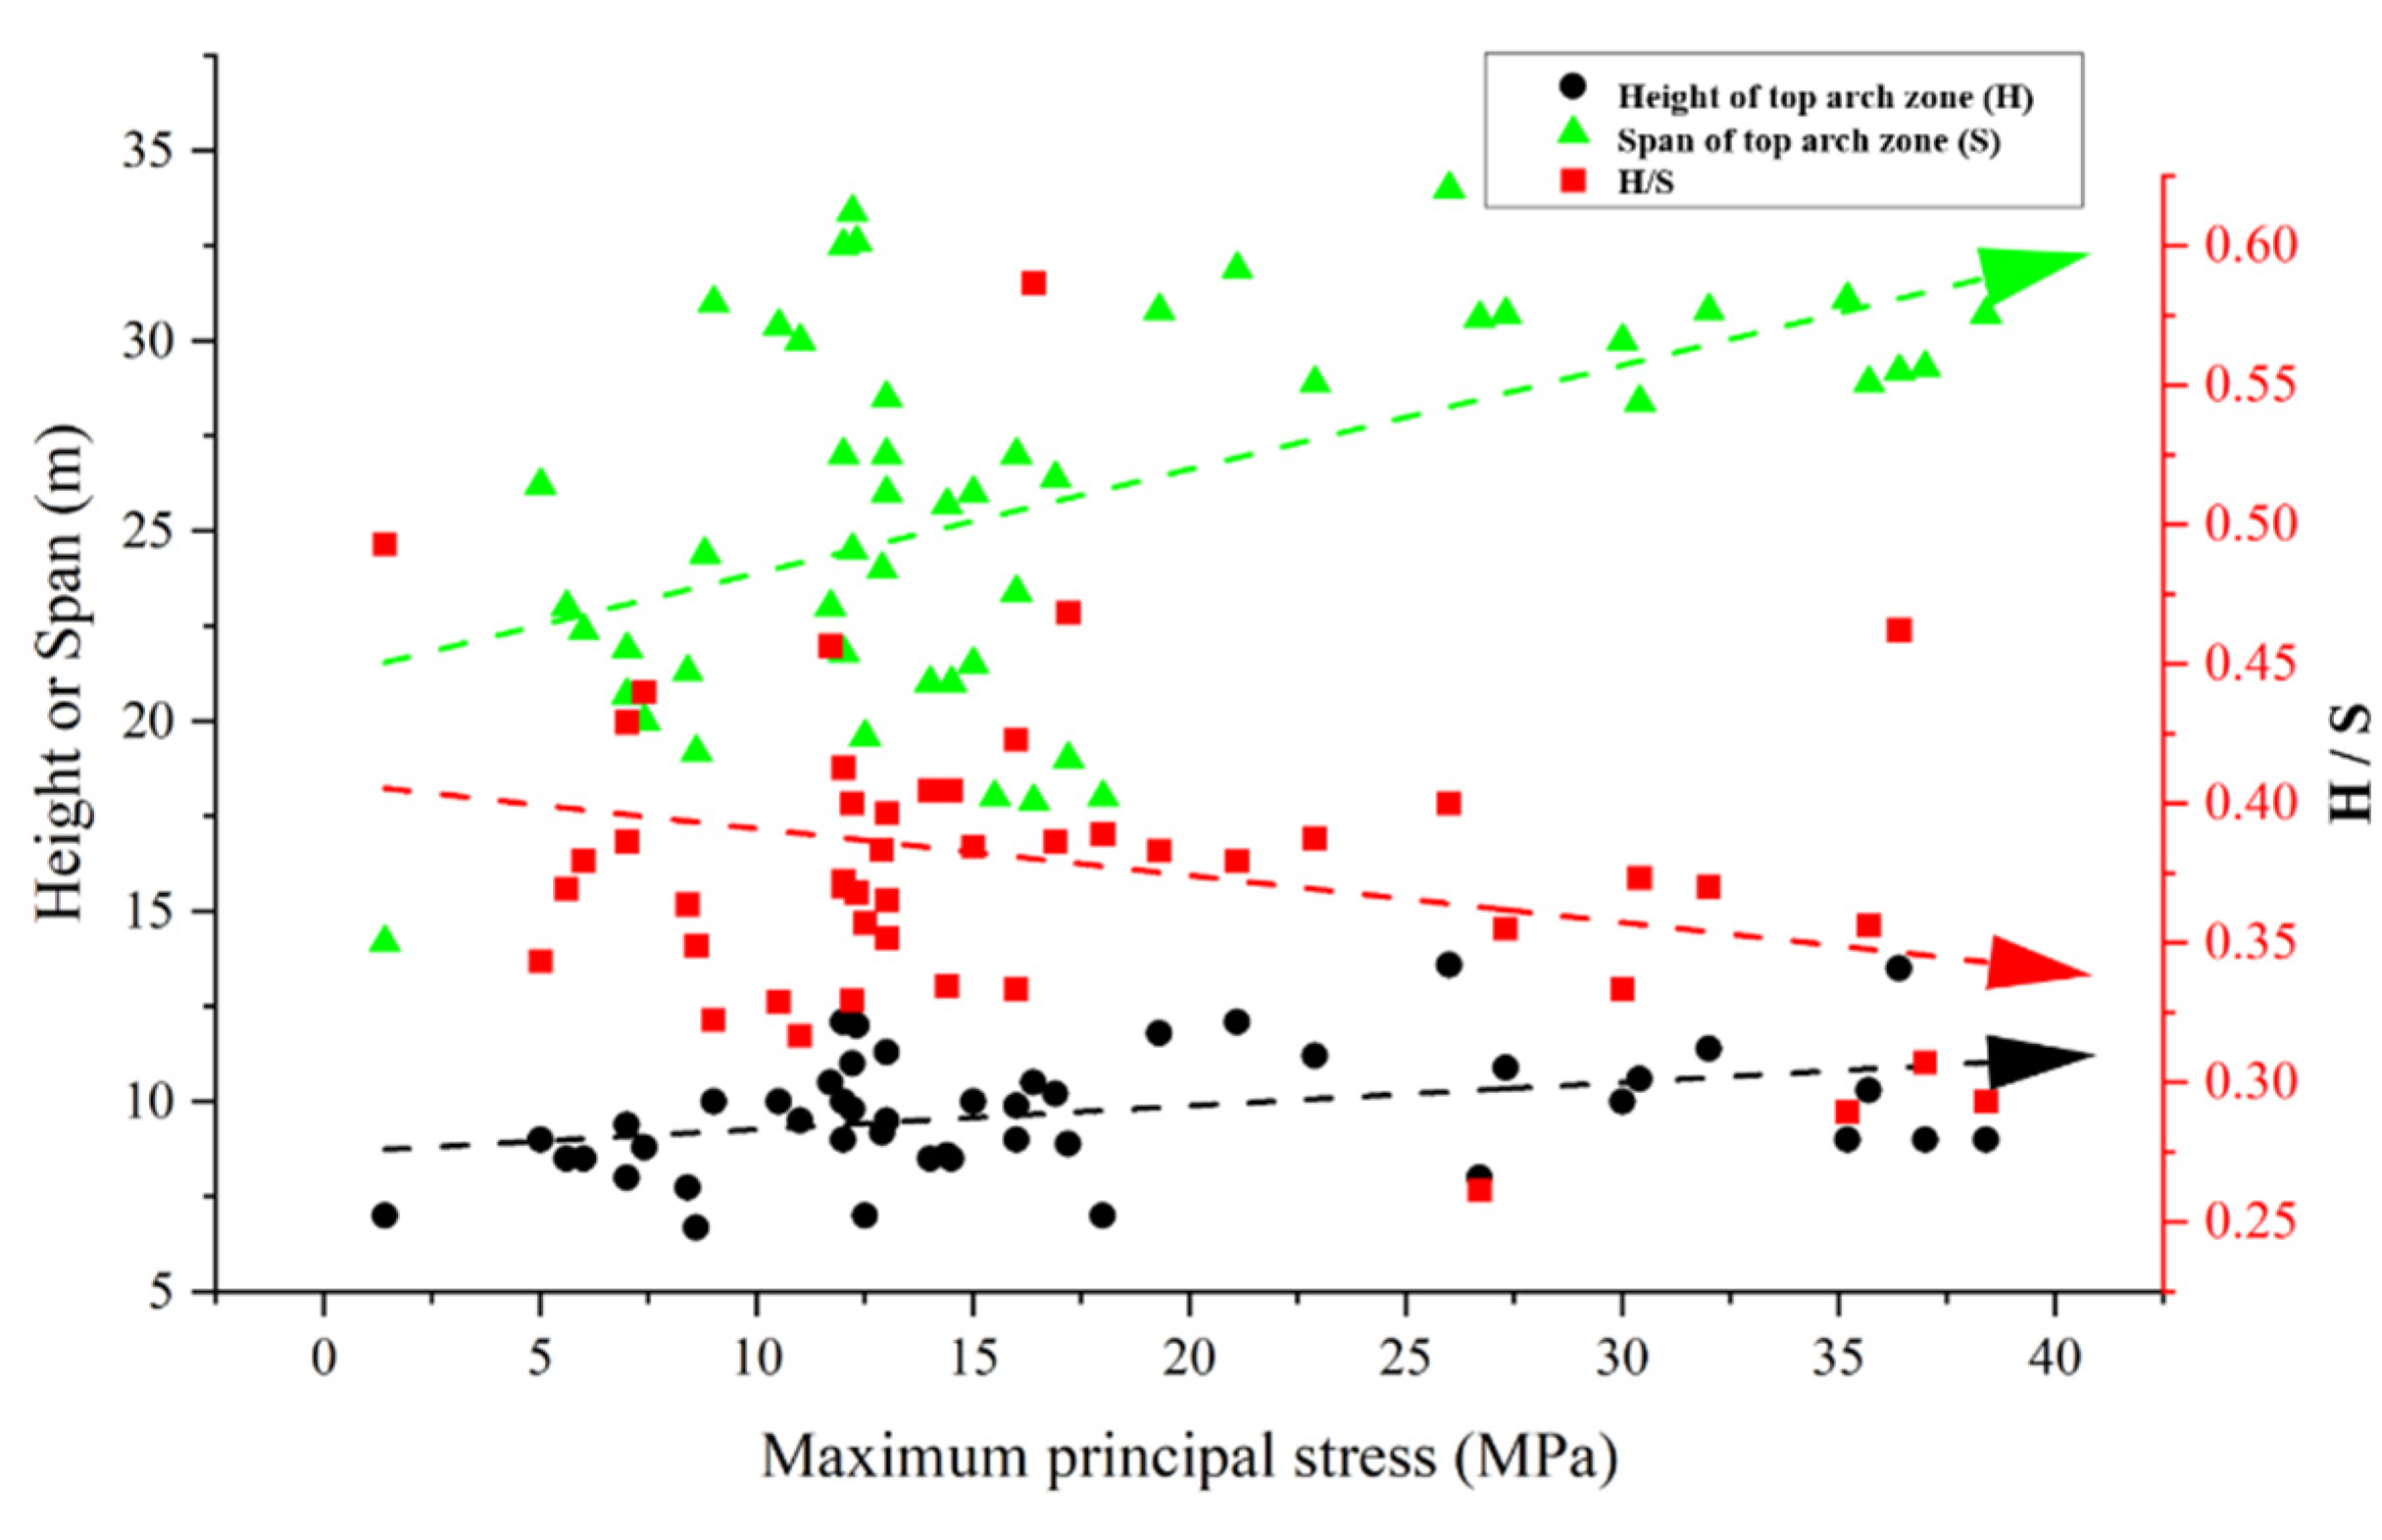
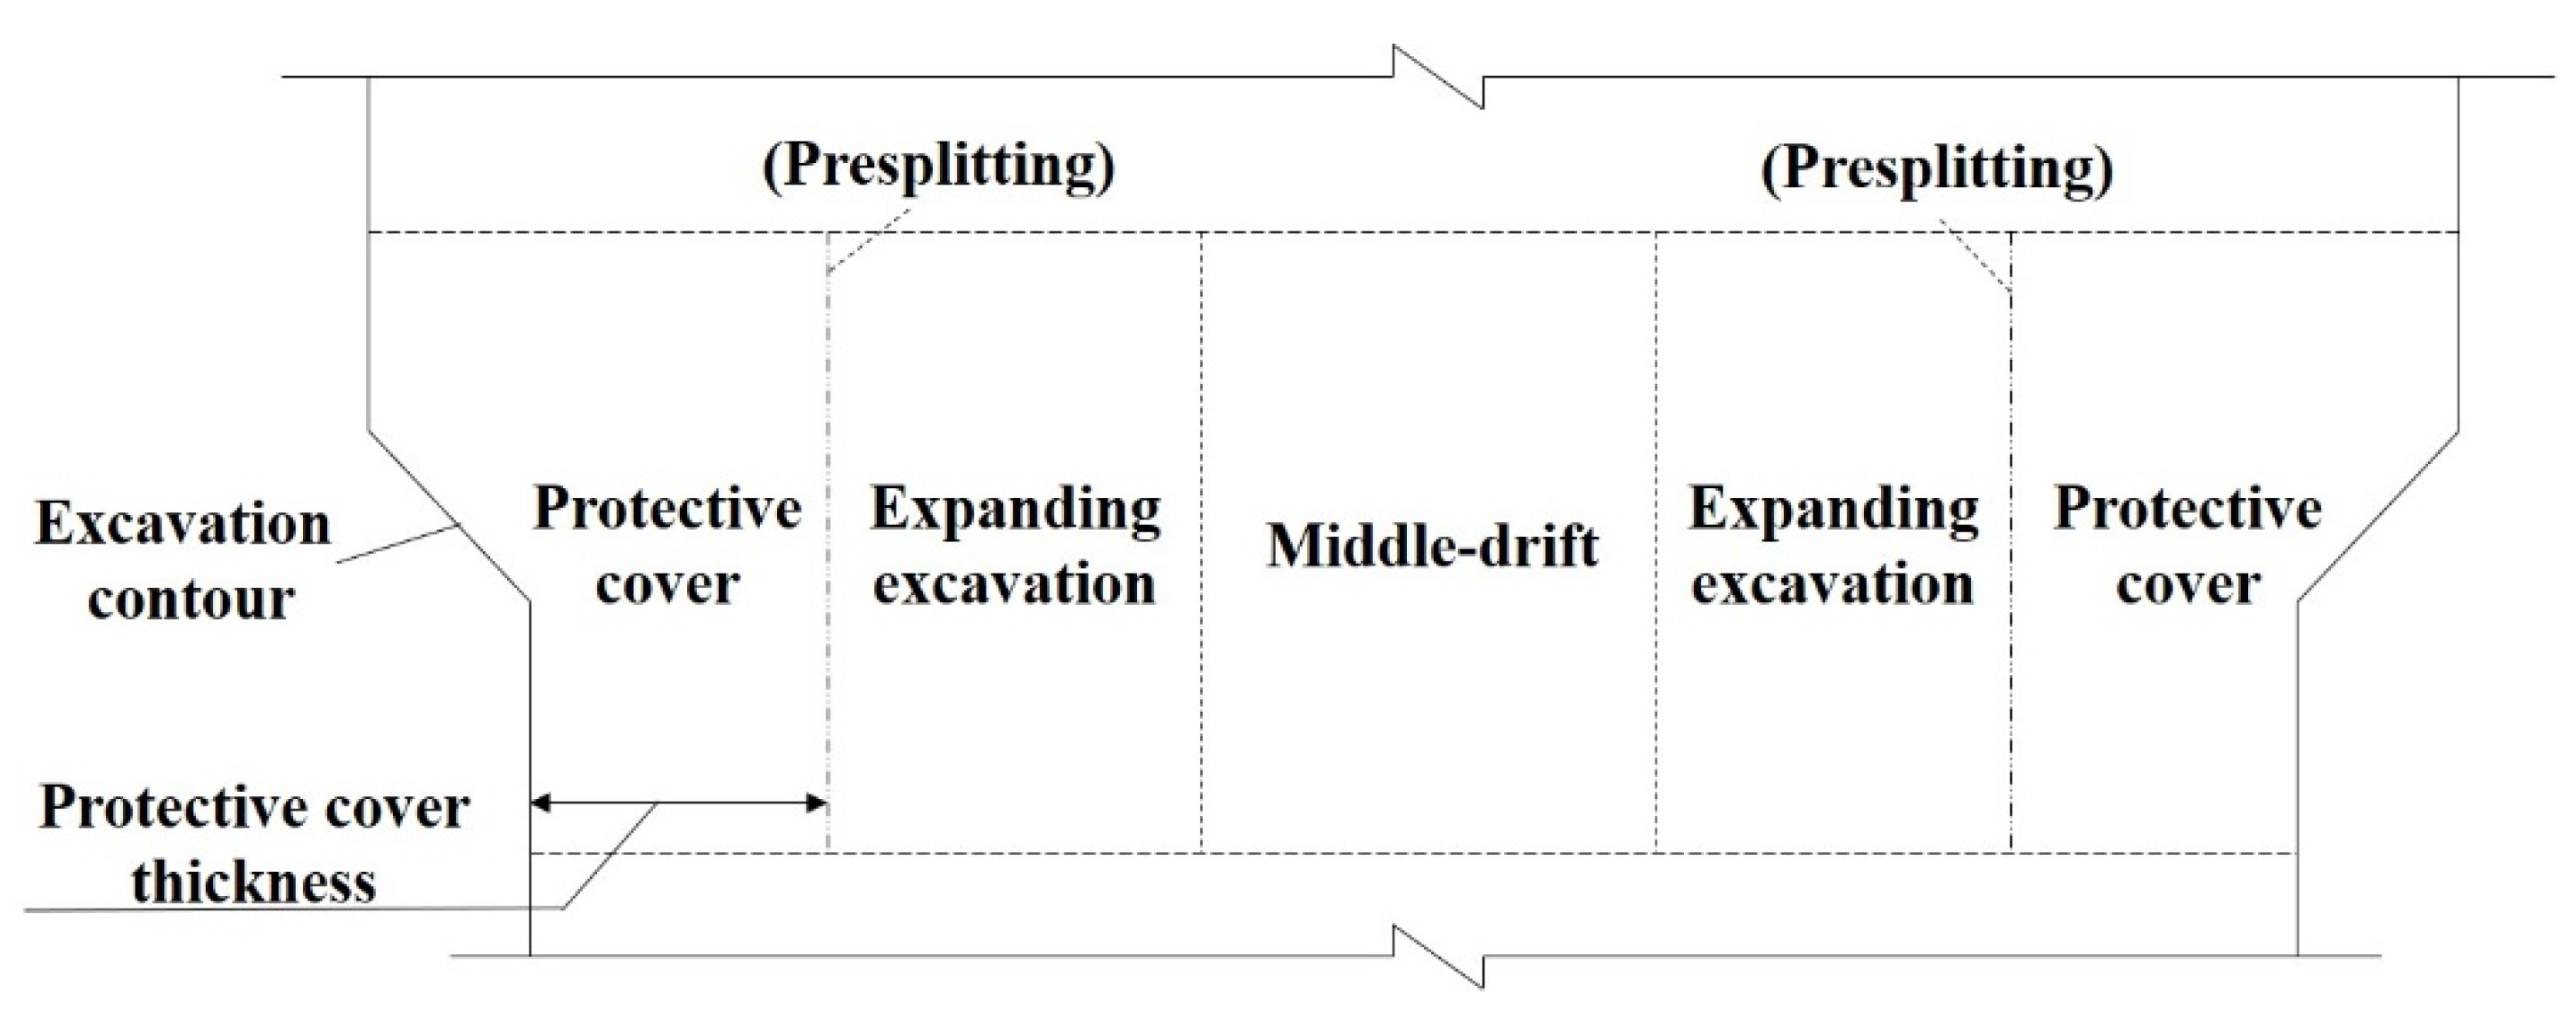
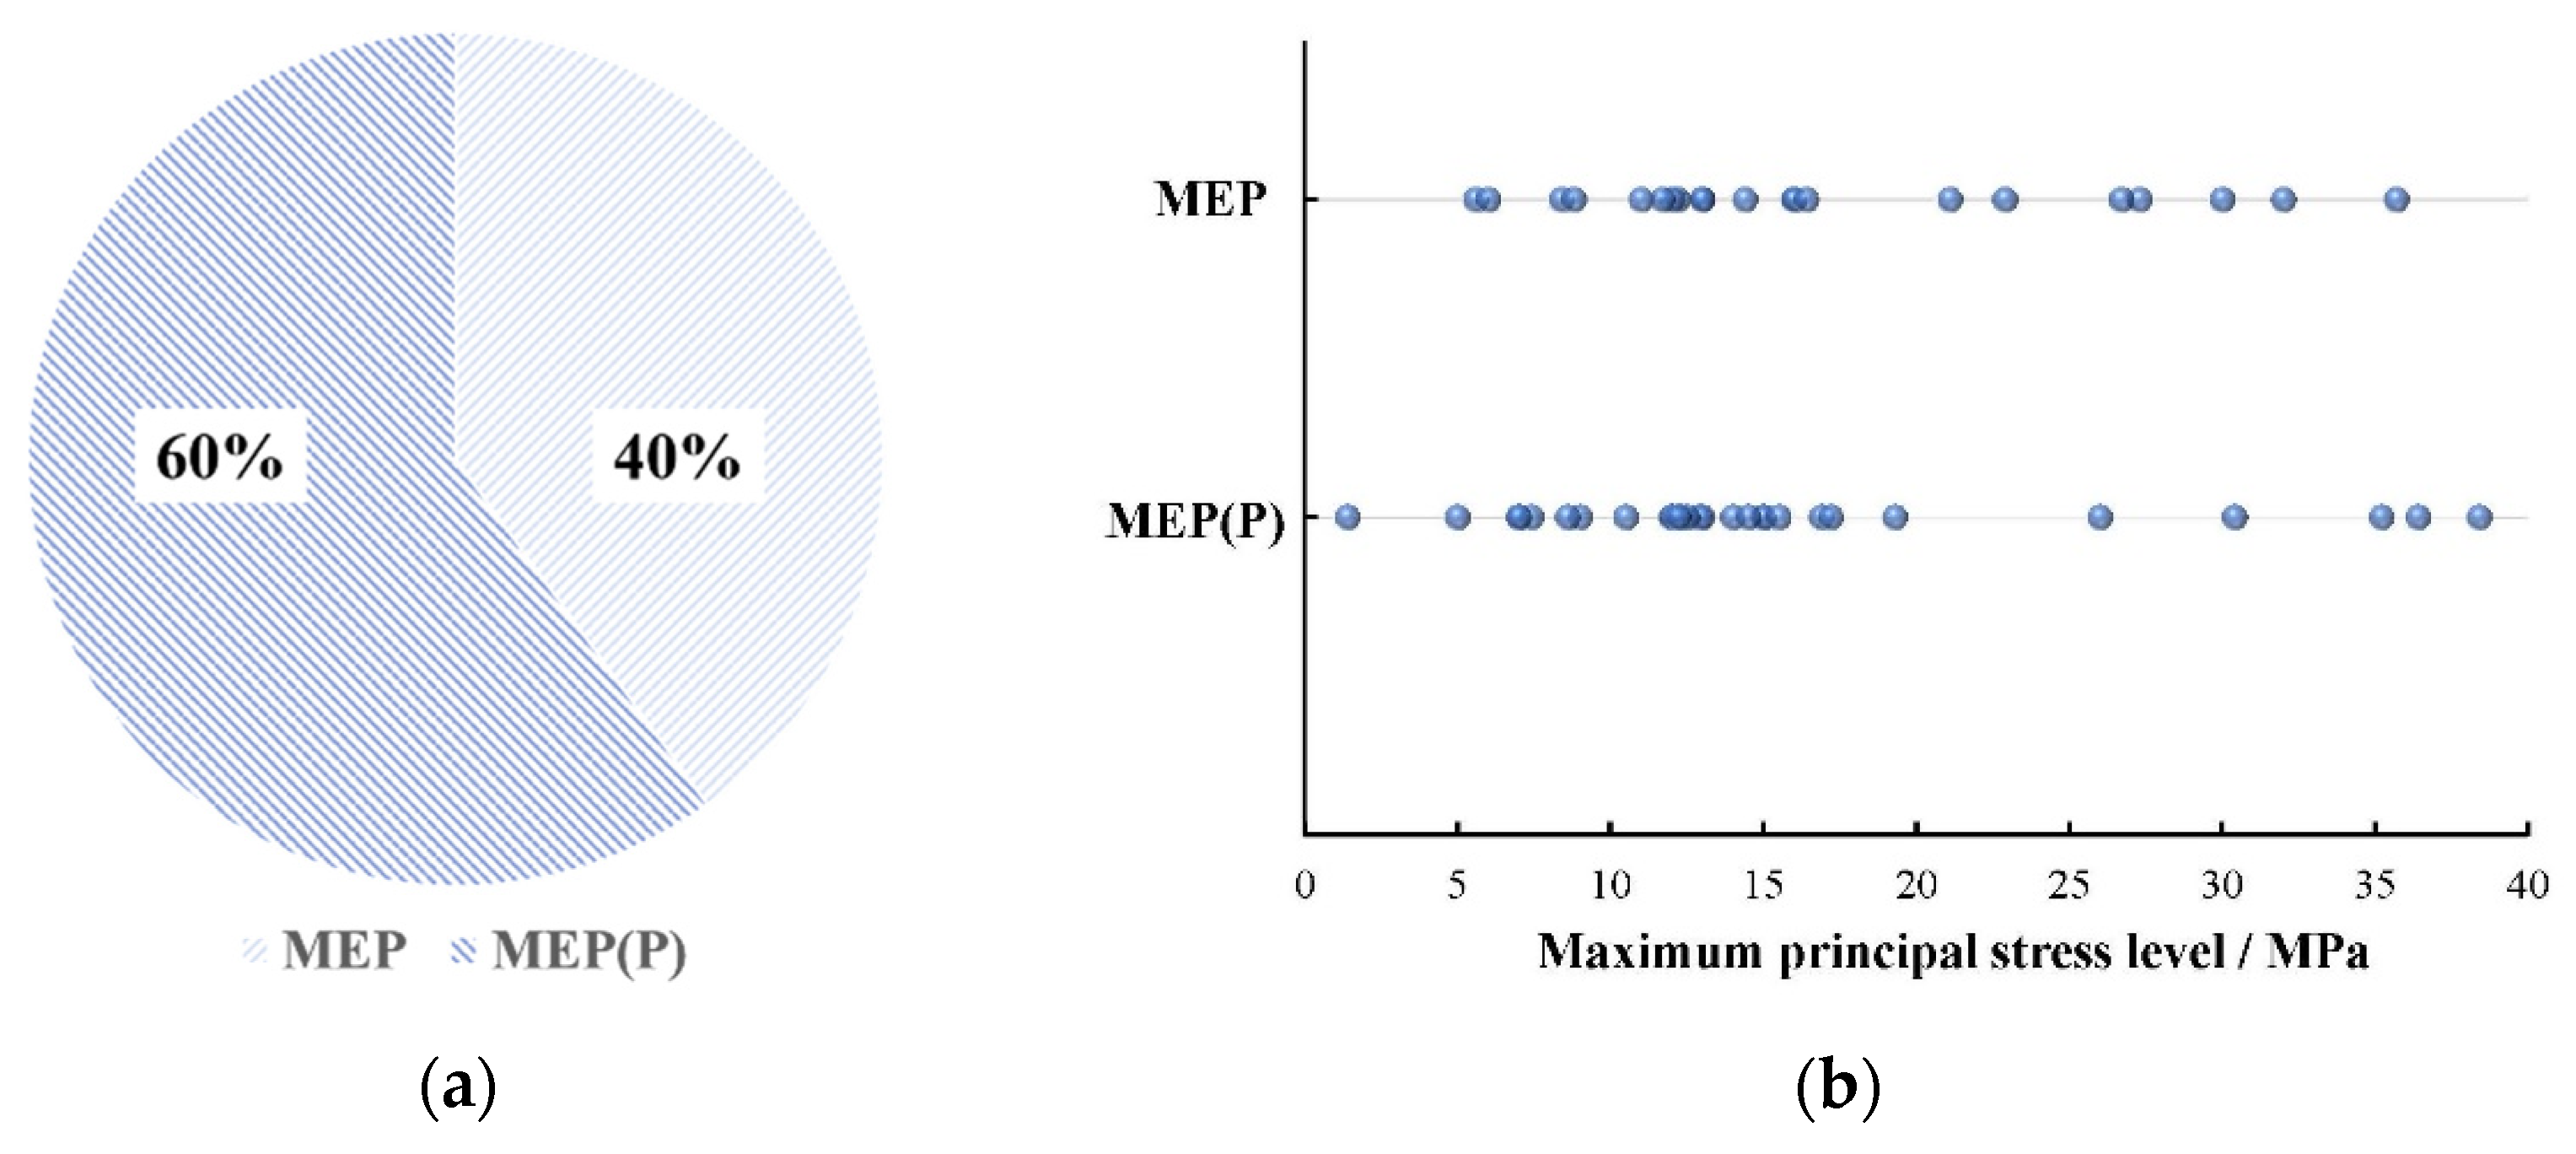
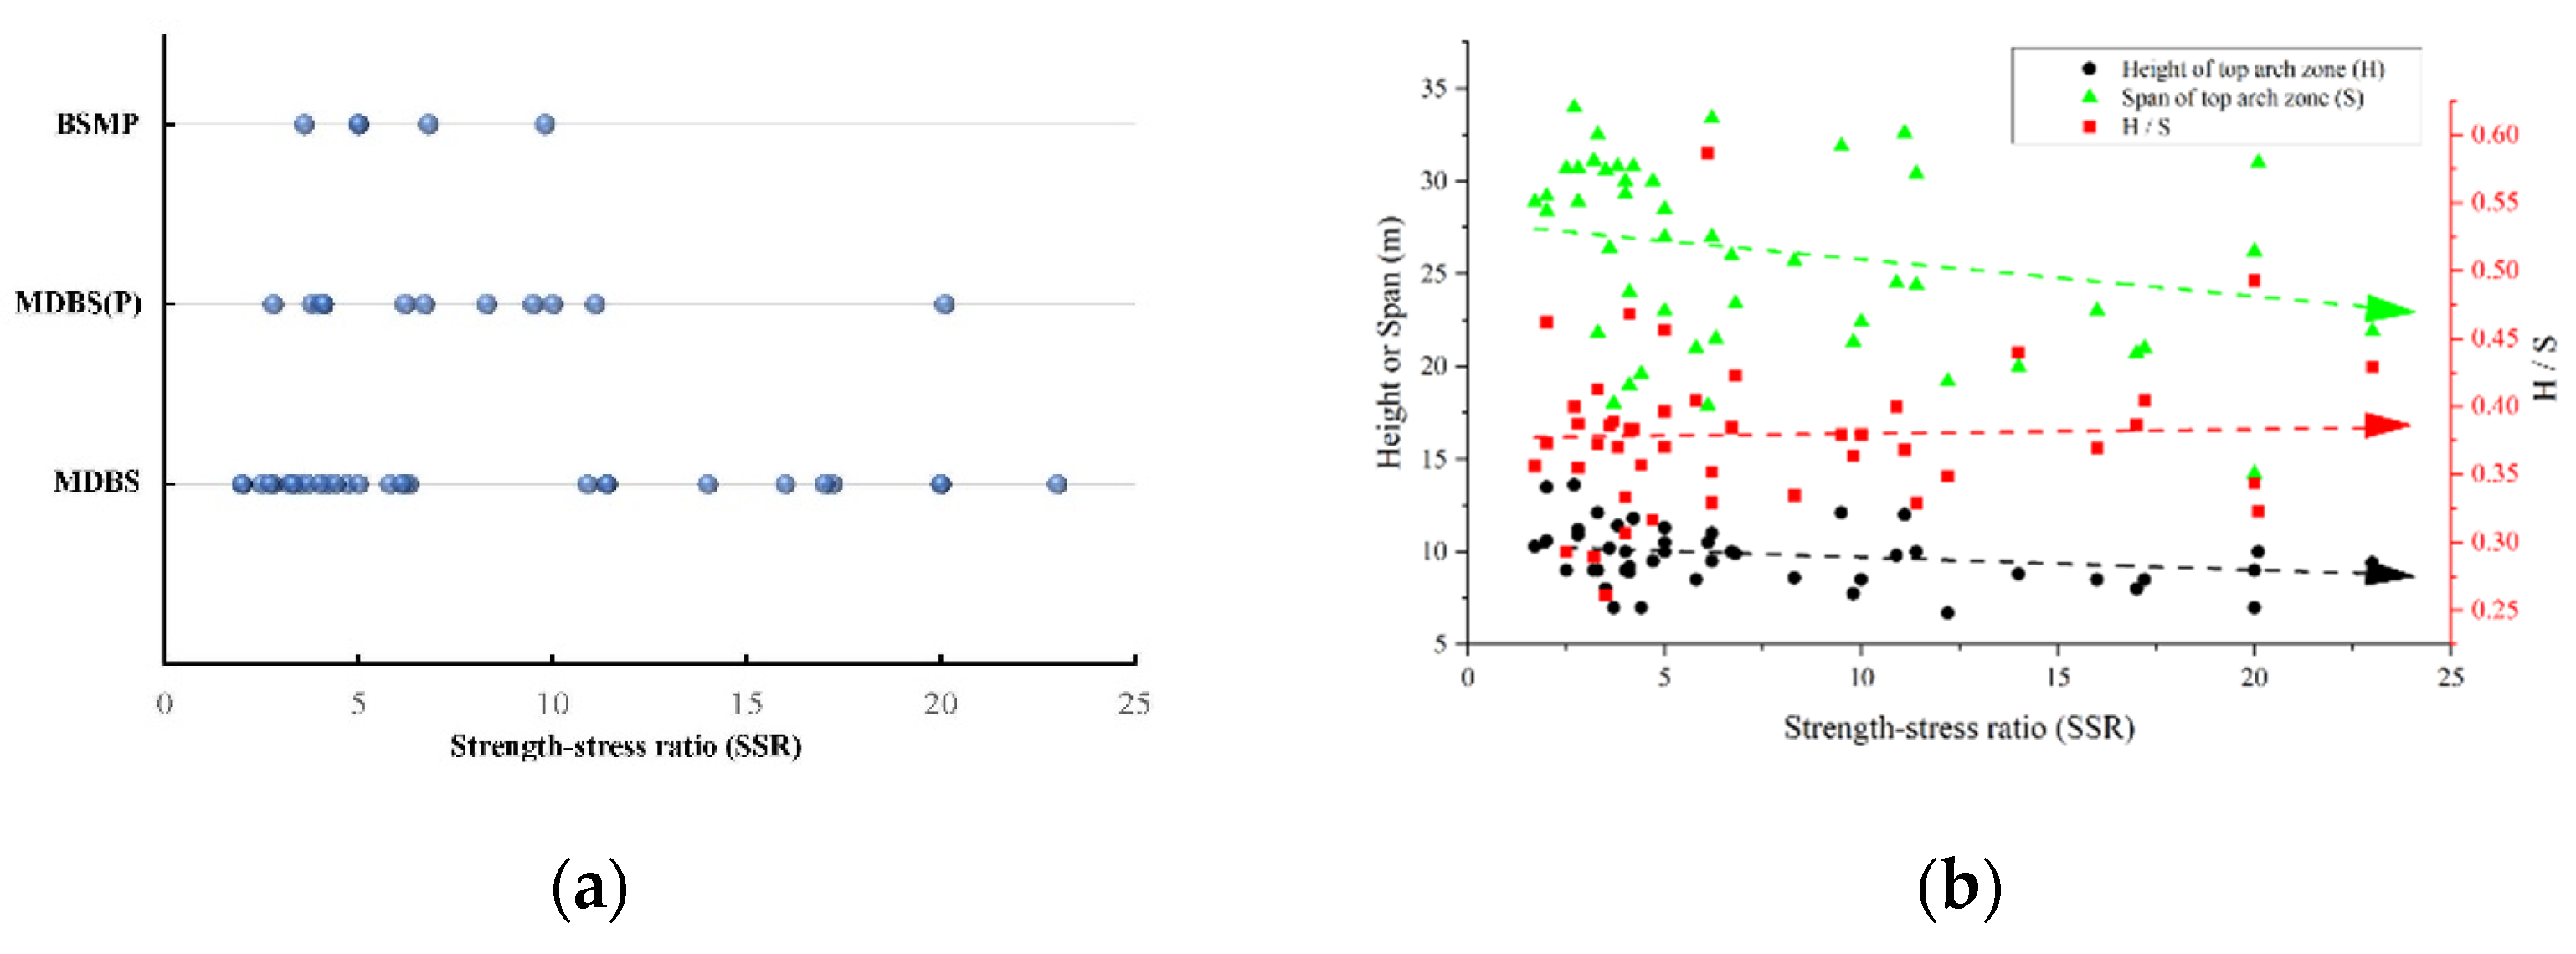
For three main caverns of hydropower station, the main powerhouse is basically constructed firstly and followed by main transformer room and tailrace gate chamber (see Figure 1b). The excavation method is applied from top to bottom, following the principle of multi-sequences and cross-sequences, which means construction can be carried out in different zones or different places of the same zone with no mutual influence. The typical excavation zones (see Figure 2) (top arch zone, rock anchor beam zone, high side wall zone) of the main powerhouse are taken as examples to study the excavation procedures and key design parameters.

3.1. Top Arch Zone

The top arch zone, self-stability structure, has been widely used in underground excavation development [68,69], as shown in Figure 8. Today, the height of the top arch zone in powerhouses is generally about 7~8.5 m [53] and the arch design of large underground caverns tends to have a higher rise-span ratio, generally 0.30~0.35 [70]. Besides, the three-center circle was used to replace the single-center circle in order to reduce the stress concentration failure around the arch abutment. To control the excavation effect under high in situ stress, Zhang et al. [42] also suggested that the rise-span ratio should be adjusted according to the stress level or strength–stress ratio.
Due to the large section of the top arch zone, the excavation method of once-forming construction is generally not adopted. The more conventional method is to divide the zone into three parts: middle and both sides. Based on different excavation sequence of the parts, there are generally two main kinds of excavation procedures described in the following.
Figure 9 shows the detailed design and sequence of two main excavation procedures. In Figure 9a, the method of middle-drift connection followed by both-sides excavation (MDBS) is presented. The middle-drift connection is to solve the difficulty of ventilation and to diagnose the rock state, the requirements of which on contour are not strict. The forming of the middle-drift connection is helpful to restrict the deformation of the middle of the top arch early. Moreover, the zone of 1-1 and 1-2 in Figure 9a can be a combination, which is the most commonly used and simple without repeated support procedures. Especially under high in situ stress, it started to carry out the reserved protective cover near the excavation contour, that is the MDBS(P) method. The reserved protective cover is beneficial to control the excavation damage and vibration of surrounding rock. Moreover, the method of both sides heading followed by middle pier excavation (BSMP) is provided in Figure 9b. It is suitable for large-span underground caverns (>15 m), where only simple support is needed. The BSMP method needs to carry out undercut blasting twice in 1-1 and 1-2 separately, which has high excavation cost and slow progress. Yet, it can make the stress concentration zones reinforced, firstly, on both sides, to protect the spandrel, which has also become a construction option.
Combined with powerhouses in Table 1, the excavation procedures and the key design parameters used in the top arch zone were further summarized and plotted in Figure 10.
Obviously, the MDBS method is the most common excavation procedure used in the top arch zone of underground powerhouses, about 90% (see Figure 10a), including Ertan, Houziyan, etc. Among it, there is a new trend to set a protection cover (generally 0.5~2.0 m) near the blasting contour, about 27%, that is the MDBS(P) method. For the large section, BSMP is in common use, accounting for 10%, such as Longtan station. Furthermore, in situ stress distribution of methods are presented in Figure 10b. It can be found that the MDBS and MDBS(P) methods are the most common at each stress level while the BSMP is mainly used under in situ stress of 20 MPa. The initial stress level has an important influence on the method selection, just as Kong et al. [69] found that the influence of in situ stress on cavern excavation stability was obviously greater than that of GSI and rise-span ratio.
To study the influence of in situ stress level on the key design parameters of top arch zone excavation, the relationship between height (H), span (S), H/S of the top arch zone and in situ stress level is analyzed, and the results are plotted in Figure 11.
Evidently, H and S of the top arch zone will increase as in situ stress level rises, which also reflects the current trend of an increasing powerhouse scale. However, the ratio of H/S gradually falls off with the increase of the maximum principal stress. Under lower stress level (<10 MPa), H/S covers about 0.3~0.45 while it is around 0.28~0.4 under high in situ stress (>20 MPa). The reasonable value of H/S is mainly to control the stress concentration and relaxation failure at the arch abutment caused by excavation unloading under high in situ stress. In terms of support, about 6~12 m long anchors with a diameter of 25~32 mm and inter-row spacing of 1.5~3.0 m are most commonly used in the top arch zone to support the excavation stability. Meanwhile, for the situation of H/S being too small, such as 0.26 of the main powerhouse and 0.24 of the main transformer room in Jinping I, it also led to serious deformation and damage at the arch waist [42].

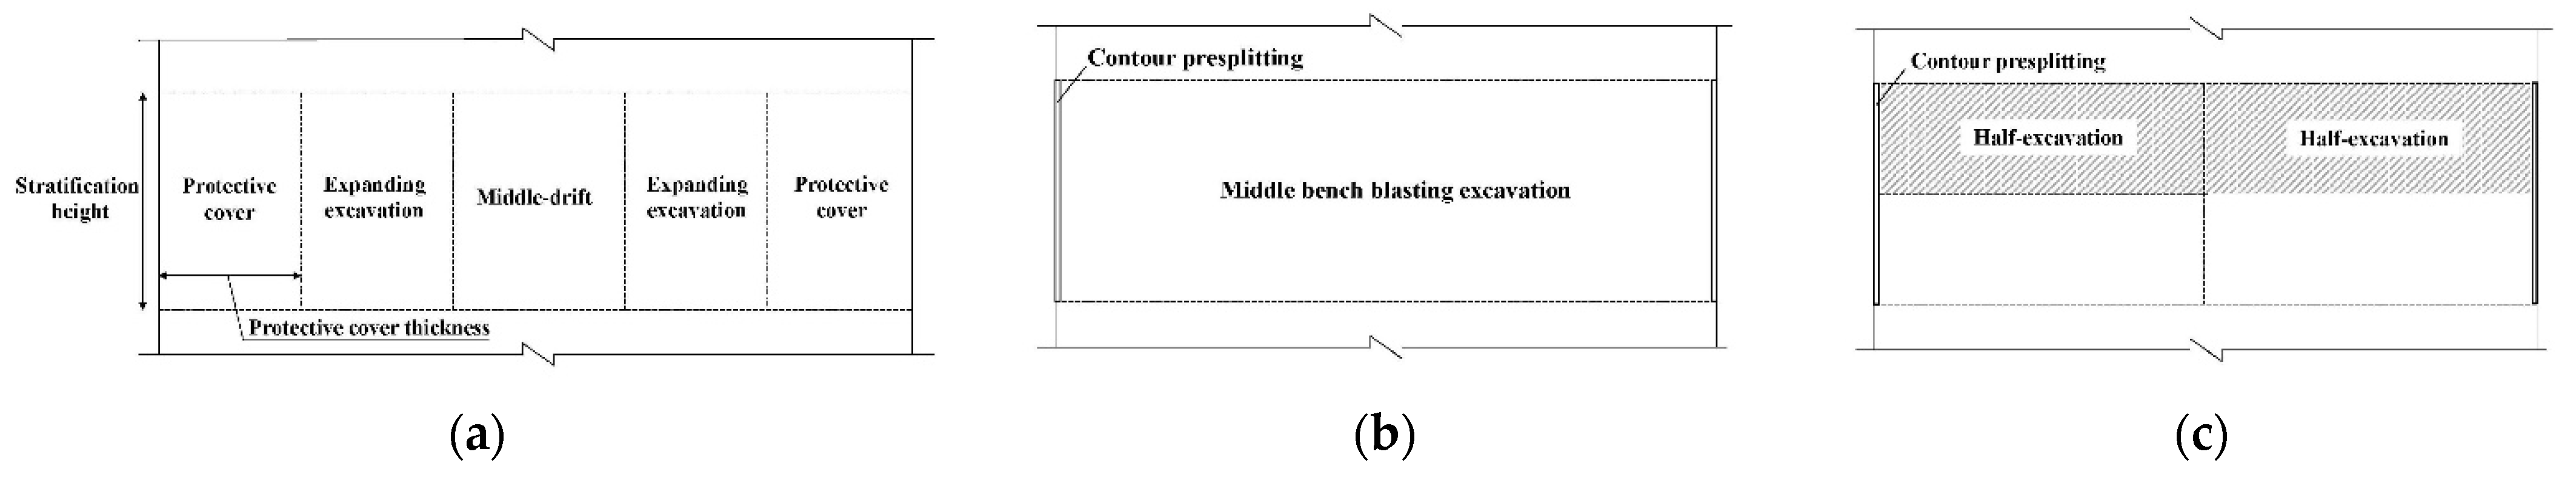
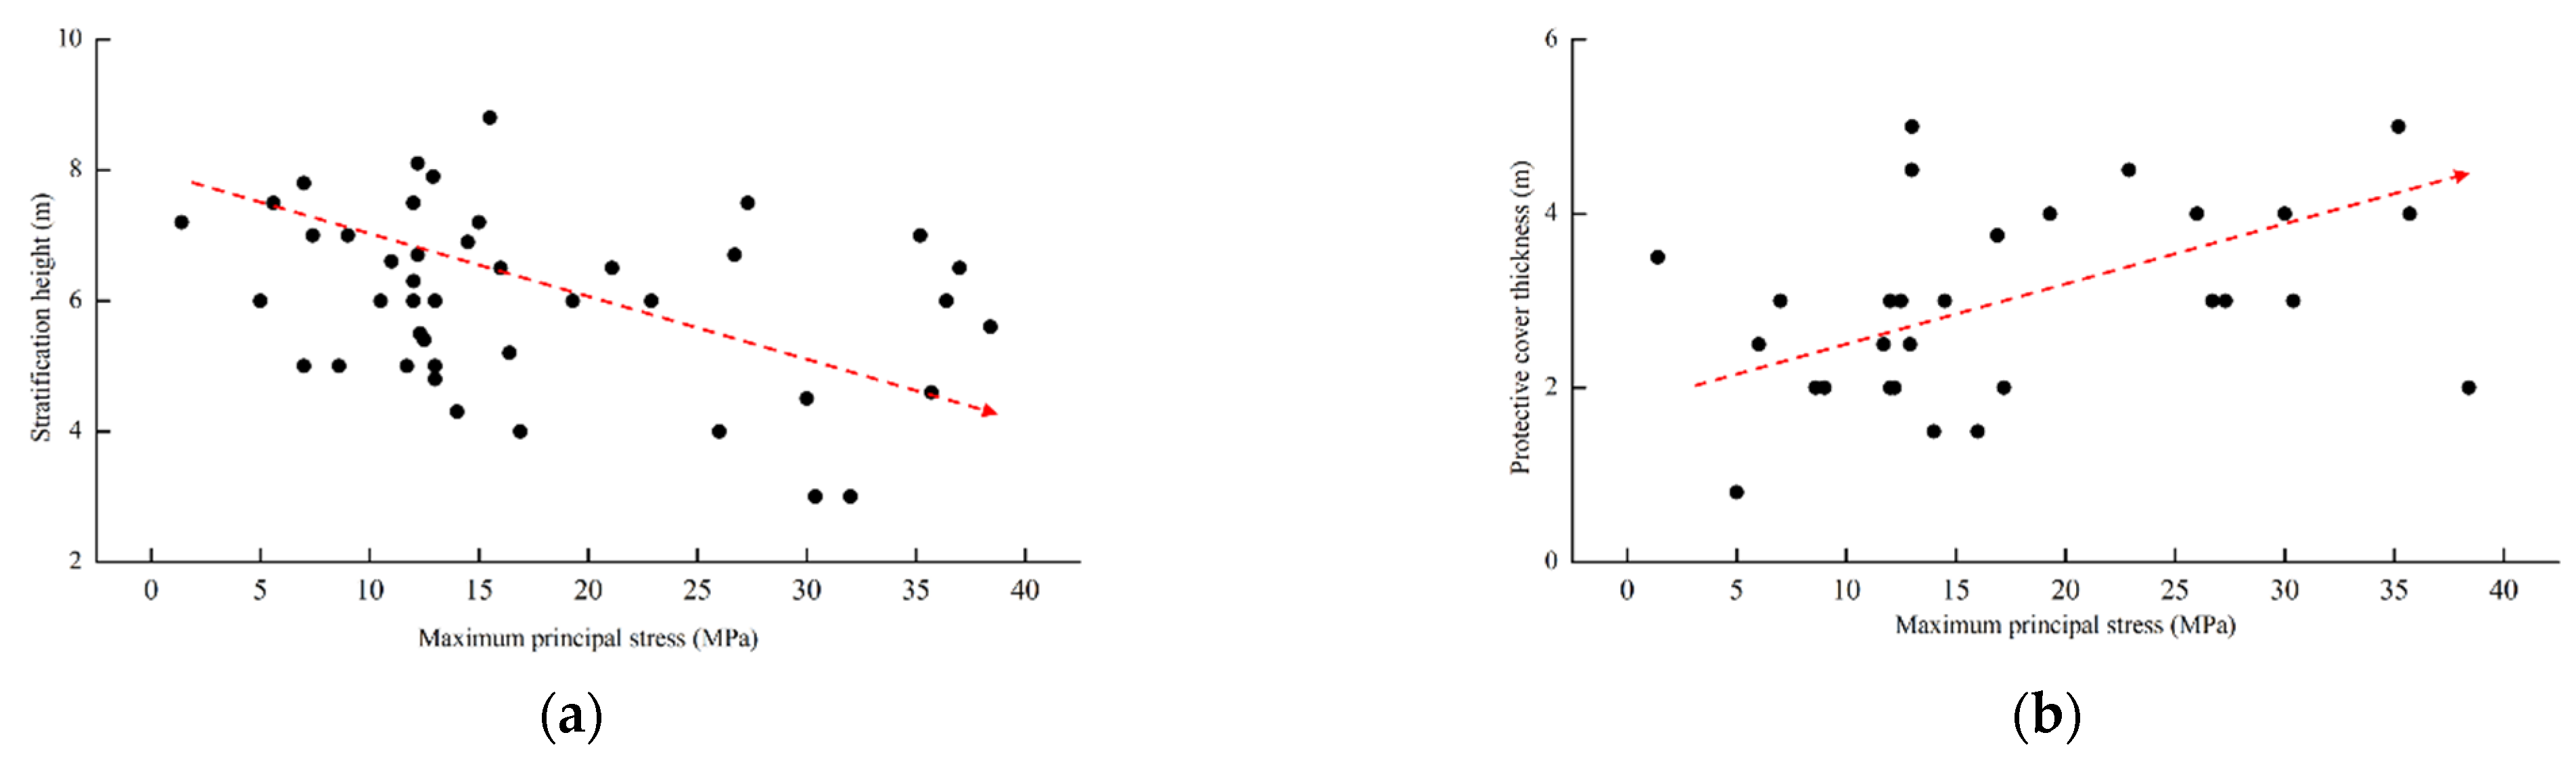
3.2. Rock Anchor Beam Zone

Rock anchored beam zone refers to the zone that the crane beam structure is arranged in polygonal-shape. When the zone is excavated, the reinforced concrete beam will be firmly anchored to the rock by grouting a long bolt, which means that the load it bears is transmitted to the rock mass through the friction force. Due to the responsibility for the subsequent installation and maintenance of electromechanical equipment of powerhouses, the rock excavation quality of the rock anchor beam zone is directly related to the installation efficiency and safety. Thus, the layout of structure requires a high quality of surrounding rock in this zone. The outline of a rock-anchored beam is presented in Figure 12.
The existence of the rock anchor beam reduces the excavation span of the powerhouse, which increases the cavern stability and reduces engineering cost. It has been proved that the rock anchor beam is affected by the blasting vibration wave, and the adjustment of blasting construction procedure should be considered carefully [71]. In general, to handle the blasting vibration situation, the excavation of the rock anchor beam zone is carried out after the blasting test in other parts firstly. Now, the main construction method is: ‘middle-drift excavation firstly, expanding excavation followed by protective cover excavation’, that is the MEP method, as shown in Figure 13. The MEP is the basic excavation procedure method for the rock anchor beam zone while the MEP(P) method is an improved means to control the vibration by presplitting blasting.
Combined with the powerhouses in Table 1, the procedures and the key design parameter used in the rock anchor beam zone were summarized and plotted in Figure 14.
Today, the MEP method has become the mainstream excavation procedure for the rock anchor beam excavation of underground powerhouses. By reserving protective cover, the influence of blasting vibration on the rock anchor beam is reduced. Meanwhile, the auxiliary technology, presplitting blasting, plays the role of isolation and crack resistance. It has also become the key choice to ensure the rock platform excavation quality. From Figure 14b, the methods are used at various in situ stress levels. However, the value of the key parameter, protective cover thickness, has not been determined well. To study the influence of in situ stress level on the protective cover thickness of the rock anchor beam zone excavation, the relationship between protective cover thickness and in situ stress level is analyzed, and the results are shown in Figure 15.
In Figure 15, the basic distribution of protective cover thickness in the rock anchor beam zone is between about 1.0~6.0 m, and the protective cover thickness will increase as in situ stress level rises, which is indicated by the arrow. Therefrom, it is suggested that the protective cover thickness has to be about 1.0~5.0 m under lower in situ stress (<10 MPa) or 3.0~6.0 m under high in situ stress (>20 MPa), to control the excavation disturbance induced by high in situ stress.

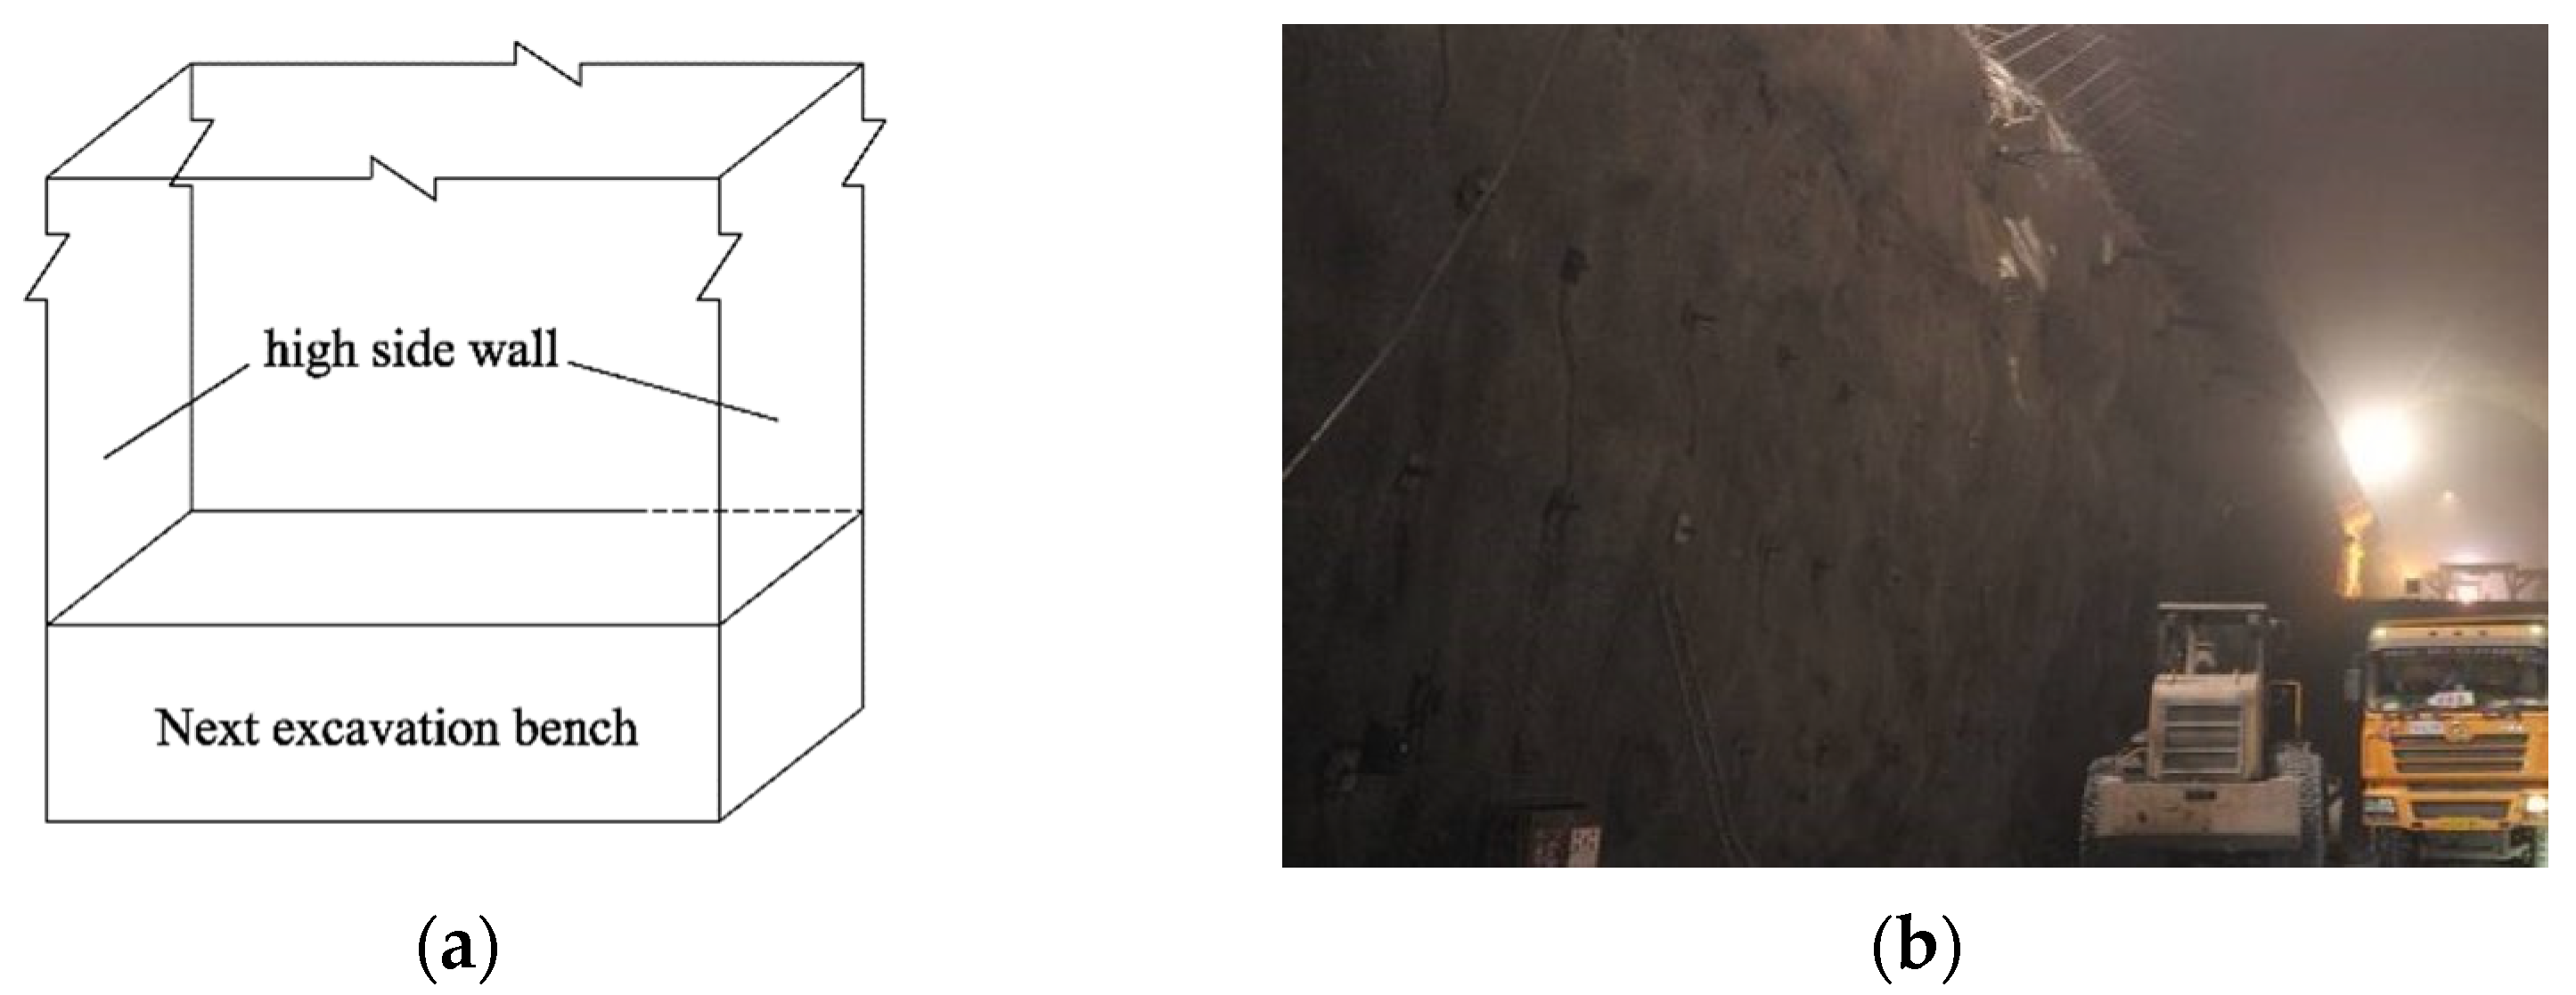
3.3. High Side Wall Zone

The excavation and support of high side wall zone are generally carried out in stratification mode, the characteristic of which are a large section, as shown in Figure 16. Generally, deep-hole bench millisecond blasting is used to excavate the middle rock mass, and smooth blasting and presplitting blasting are used to control the excavation contour.
Many construction experiences show that there are three main excavation methods (see Figure 17) for the high side wall zone: ① MEP method, which is the same as that of the rock anchor beam zone; ② Contour presplitting followed by middle bench blasting excavation, that is CPMB; ③ Contour presplitting followed by half blasting excavation, that is CPHB. For the zone nearest to the rock anchor beam zone, the MEP method will be replaced by the MEP(P) method to improve the excavation quality by presplitting blasting. The second method (CPMB) continues to emphasize the role of contour presplitting on isolation and crack resistance, and then uses the middle trench excavation to gradually expand the excavation. The third method (CPHB) is two-half excavation combined with deep-hole presplitting blasting at the contour. It aims to reduce the influence of blasting on surrounding rock and ensure the excavation quality.
Combined with the powerhouses in Table 1, the procedures and the key design parameter used in the high side wall zone were summarized and plotted in Figure 18.
According to the statistics, the MEP method has become the main construction method in a high side wall zone, accounting for about 64% while the CPMB method accounts for about 29% and the CPHB method accounts for about 7%. For high in situ stress (>20 MPa), the MEP and CPMB methods are in a dominant position to adjust the excavation disturbance process. The key excavation parameters, such as stratification height and protective cover thickness, play a leading role in the stress adjustment path. Different stratification height and protective cover thickness correspond to different stress paths, which will lead to a different stress re-distribution.
To study the influence of in situ stress level on the key design parameters of the high side wall zone excavation, the relationship between stratification height, protective cover thickness and in situ stress level is analyzed, and the results are shown in Figure 19.
As shown in Figure 19, with in situ stress level increasing to about 40 MPa, the stratification height shows a downward trend, and the protective cover thickness increases gradually. Specifically, to control the excavation disturbance effect, when the local stress level is low (<10 MPa), the stratification height is about 5.0~8.0 m, and the protective cover thickness is about 1.0~3.5 m. When the local stress level is high (>20 MPa), the stratification height is about 3.0~7.0 m, and the protective cover thickness is about 3.0~5.0 m. It is basically consistent with the requirements in the specification (NBT35090-2016) [72], where the stratification height is generally 4~8 m.
The analyses above reveal the influence of high in situ stress level on excavation procedures and indicate the correlation between the key design parameters and in situ stress. They are very useful to preliminarily judge the influencing trend of in situ stress level on excavation design parameters. Due to the differences in geological conditions, construction technique, and quality requirement of various hydropower projects, the recommended values based merely on in situ stress level cannot be applied to all kinds of projects accurately. Therefore, considering both in situ stress level and surrounding rock strength, strength–stress ratio (SSR) is introduced to evaluate the cavern excavation stability comprehensively and recommend the excavation design, where the blasting excavation design based on the stress transient unloading control is supplemented simultaneously.

4. Excavation Design Based on SSR and Stress Unloading Effect

The change of geological conditions, rock strength or in situ stress level of surrounding rock will ultimately affect the bearing capacity. The existing codes and research generally describe the influence of stress on the stability of surrounding rock by strength–stress ratio (SSR), such as rock-burst classification, failure mode of surrounding rock and the layout design method of underground caverns [41,42]. Therefore, the strength–stress ratio (SSR) is introduced to improve the blasting excavation design.
SSR is defined as the proportion of rock strength to in situ stress. The formula for calculating the criterion is as follows:
SSR = R b σ max
where R b is the uniaxial compressive strength of the saturated rock; considering the most unfavorable situation, σ max is the maximum principal stress of surrounding rock, which may be calculated by the depth from the ground surface multiplied by the average rock density.
In the current design code (GB 50287-2016) [73], SSR and σ max are used as the classification standard of initial in situ stress, as shown in Table 2. To a great extent, SSR can represent the rock bearing capacity of underground caverns. When the strength–stress ratio of surrounding rock is higher, the bearing capacity of surrounding rock is stronger, otherwise it is weaker. In the practical application of engineering, it is easily obtained and used.
Forty-eight underground powerhouses are collected and listed in order of the SSR to introduce the bearing capacity of surrounding rock, as shown in Table 3.

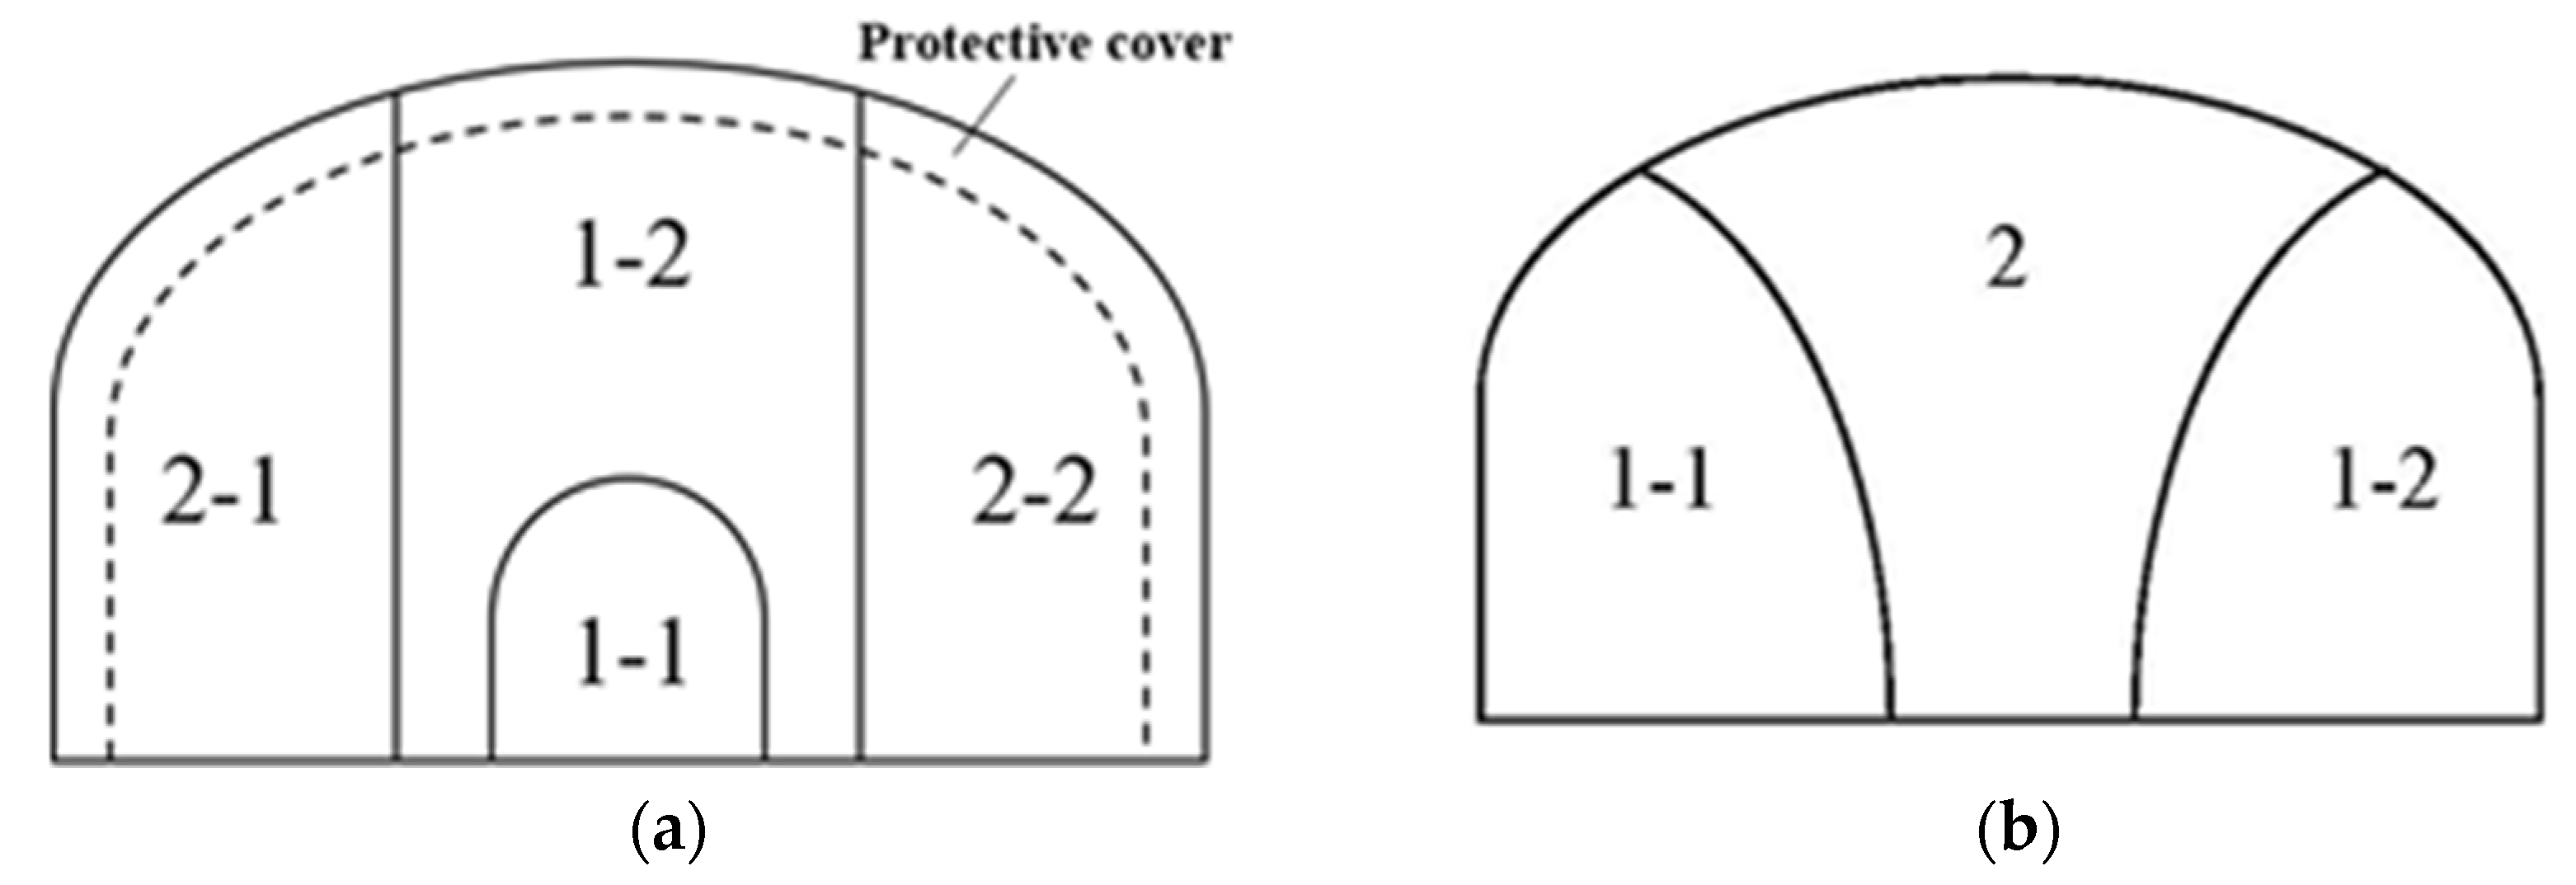
4.1. Excavation Procedure Design Based on the SSR

Based on SRR, the coupling effect of in situ stress, surrounding rock structure and rock strength is fully considered. On the basis of the traditional design, the selection trend and value range of the excavation procedure and design parameters can be suggested qualitatively and quantitatively.
(1) Excavation procedure selection and H/S of top arch zone. Figure 20 presents the excavation procedure distribution and the value suggestion of the key parameter. For excavation procedures, the MDBS and MDBS(P) methods are distributed in various ranges of SSR, mainly in the range of SSR < 7.0. The BSMP method is mainly focused on medium strength–stress ratio (4.0 < SSR < 7.0), as shown in Figure 20a. Thus, the methods of MDBS and MDBS(P) are more suitable under the low strength–stress ratio. Figure 20b shows the relationship between the excavation height (H), excavation span (S), H/S and SSR. With the increasement of SSR, the excavation height (H) and span (S) show a certain trend of slight reduction while H/S is relatively dispersive around 0.38.
(2) Protective cover thickness for the rock anchor beam zone. Figure 21 and Figure 22 show the excavation procedure distribution trend in the rock anchor beam zone and the value suggestion of the protective cover thickness. For excavation procedures in Figure 21, the MEP and MEP(P) methods are basically applicable in the entire range of SSR. To control the vibration effect, the MEP(P) method becomes a new trend. In Figure 22, SSR is divided into three intervals. The protective cover thickness is between 1.0 m and 6.0 m entirely. In addition, when SSR is 2~4, the protective cover thickness is concentrated around 3.5~6.0 m. When SSR is high (>7.0), the protective cover thickness is about 1.0~5.0 m.
(3) Stratification height and protective cover thickness at the high side wall zone. Powerhouses are excavated in layers in most projects, as listed in Figure 1. The stratification height determines the rock volume of each excavation, which means the charge quantity and free surface of each excavation. In general, as the stratification height increases, the vibration, deformation and damage caused by blasting excavation increases as pointed in many research reports of field monitoring and numerical simulation. Therefore, stratification height is vital for excavation design and compared through statistical analysis here. The recommended value is given by the concentration range in the corresponding graph. For excavation procedures in Figure 23, the MEP and CPMB methods are distributed across the entire range of the strength–stress ratio, mainly in the range of SSR < 7.0. The CPHB method is mainly distributed in high SSR (SSR > 7.0). The SSR has obvious influence on the determination of stratification height and protective cover thickness. In Figure 24, as SSR rises, the stratification height presents a certain increasing trend. For low SSR (2 < SSR < 4), the excavation height is generally concentrated on about 3.0~7.0 m, and the value of 3.0~5.0 m is mainly the refined excavation method in the recent years under the high in situ stress power station, which aims to further weaken the unloading effect of high in situ stress. When the SSR is relatively high (>7.0), the suitable stratification height is 5.0~8.0 m, which means that the excavation height can be increased appropriately as SSR > 7.0. For the MEP method in the high side wall area, the protective cover thickness increases with the decrease of SSR. When the SSR is 2~4, the protective cover thickness is about 3.0~5.0 m. When the SSR is high (>7), the protective cover thickness can be reduced to 1.0~3.5 m, as shown in Figure 25.
To sum up, the influence of SSR on the selection of the excavation procedure was investigated and recommended, as shown in Table 4.

4.2. Blasting Excavation and Stress Transient Unloading Effect
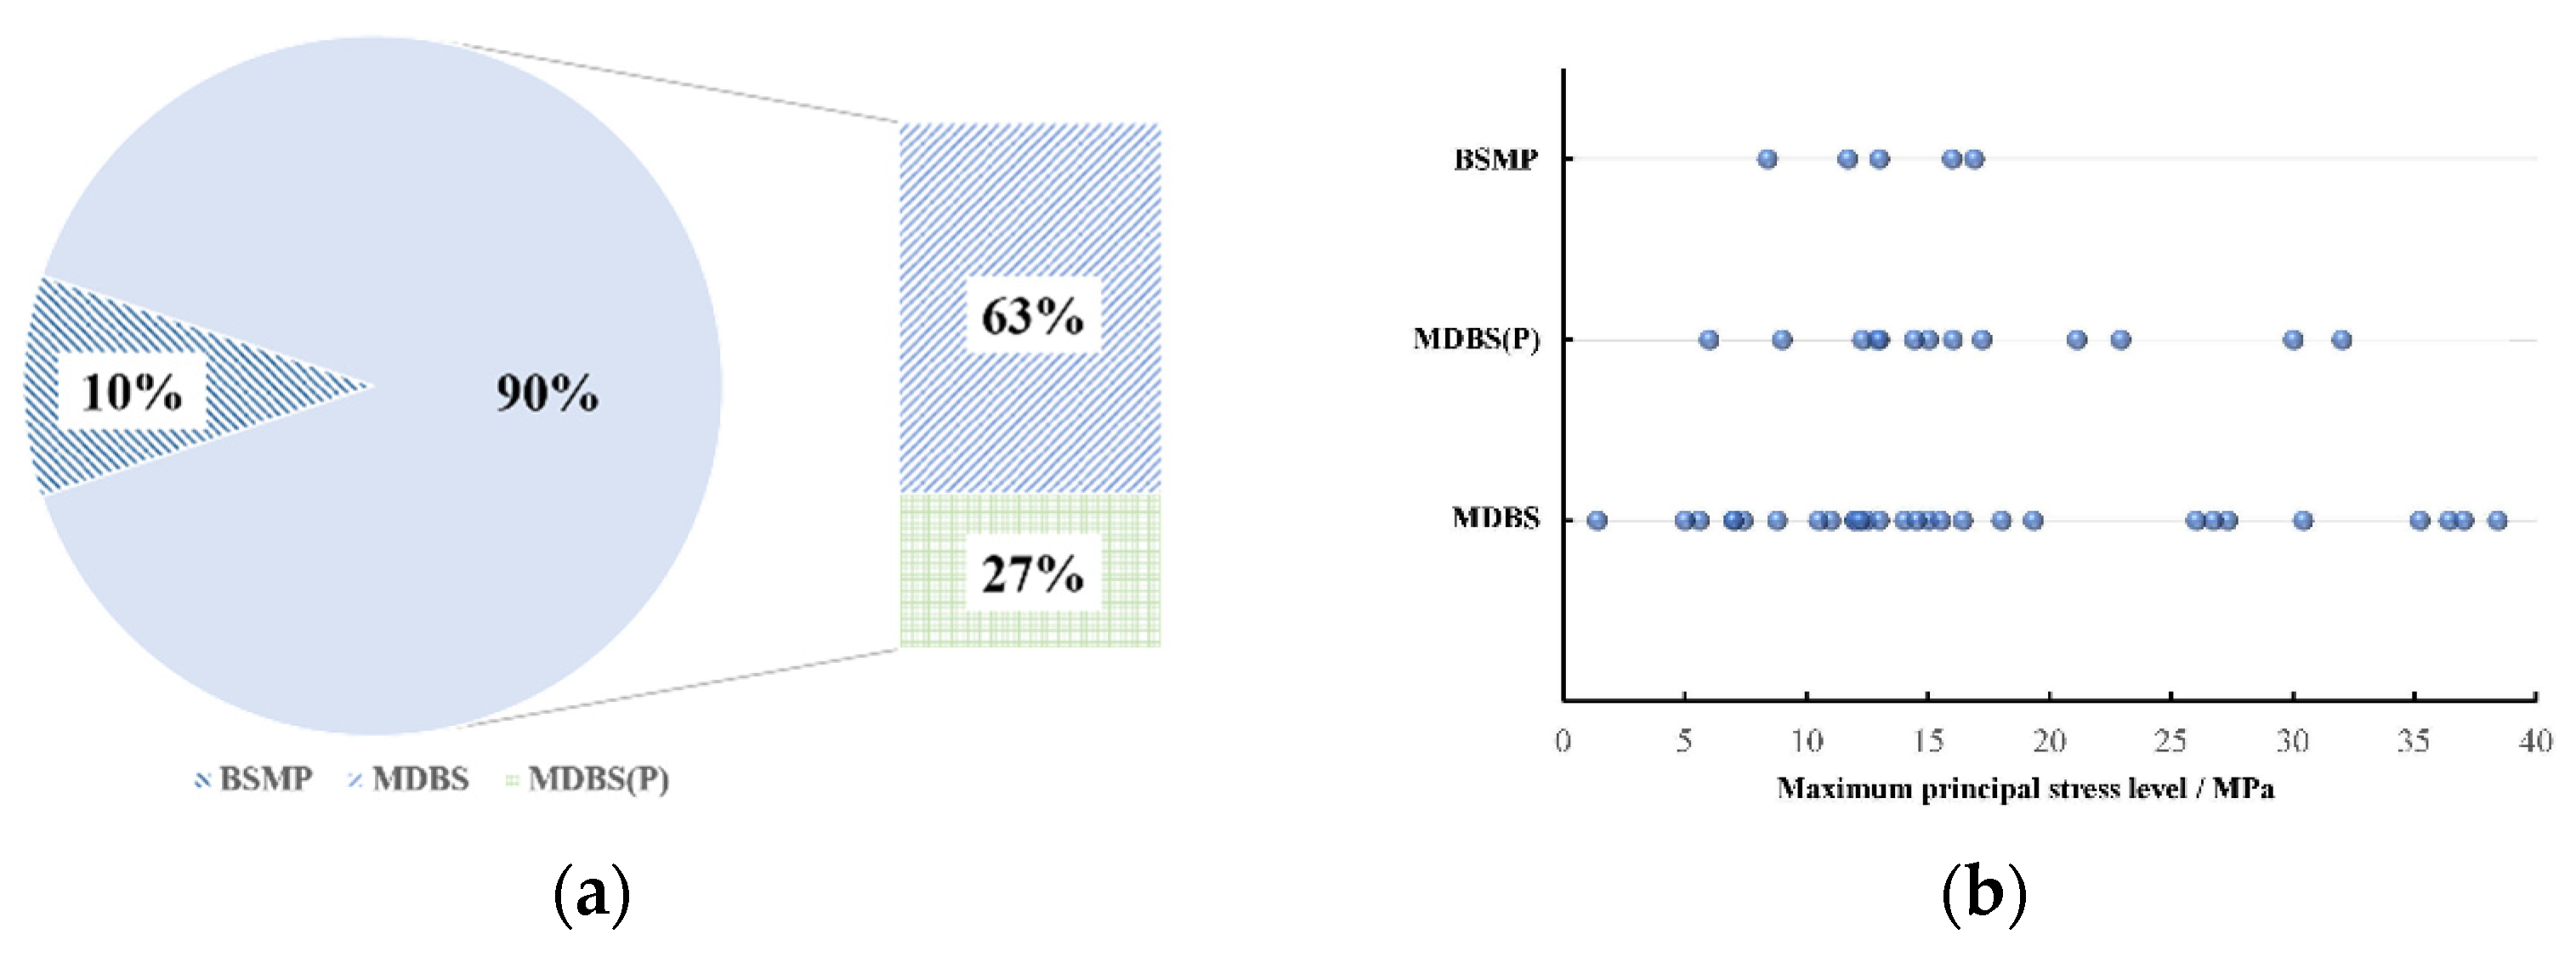
As previously stated, when in situ stress is high enough, transient unloading effect of high in situ stress is considered to be one of the key factors on excavation disturbance. Specifically, for the drill-blasting method, the forming time of new excavation contour in the blasting excavation process is about several milliseconds to tens of milliseconds, so the stress unloading accompanied by blasting excavation is a transient process. It will inevitably produce dynamic stress in surrounding rock, leading to dynamic damage or cracking of rock mass, and ultimately affect the surrounding rock stability [14]. Obviously, the method of treating rock excavation unloading as a transient process has advantages on excavation design optimization. Therefore, considering the control of stress transient unloading effect under high in situ stress, the supplementary suggestions for blasting excavation design are summarized.
At present, research shows that deformation and vibration induced by blasting excavation are obviously affected by stress transient unloading. In addition, the deformation curve is of step-style shape as the excavation contour forms [33]. The vibration induced by stress transient unloading is proportionate to in situ stress level, which can be more than 50% of the total vibration in cutting blasting [74,75,76]. During the cavern excavation in Baihetan, Jinping II, Ertan, etc., a large number of rock-cracking phenomena, such as spalling rib, slabbing, deep cracks parallel to the excavation contour and so on, occurred due to the strong unloading effect and drastic adjustment of the surrounding rock stress field, as shown in Figure 26.
For the high side wall zone, due to the large-section and larger excavation volume, the transient unloading effect of high in situ stress is particularly obvious. The vibration induced by middle-drift or expanding excavation is cut off by the reasonable use of presplit blasting. Thus, the MEP method in the high side wall zone can be evolved into five types [14], as shown in Figure 27 and Table 5.
The methods above are the combinations of presplitting blasting and smooth blasting, which mainly reduce the influence of transient unloading effect on side wall and rock anchor beam, and ensure the shaping effect and excavation quality of surrounding rock. Furthermore, Lu et al. [14] pointed out the crack forming difficulty of different blasting methods before bench excavation. It can be found that the clamping stress of presplitting blasting directly in AA (see Figure 27) is 126.3% of in situ stress in the far field while that of middle-drift firstly followed by presplitting is 86%. The improvement effect of middle-drift is emphasized on the difficulty of excavation under high in situ stress, therefore, the suggestions on blasting excavation technology are shown in Table 6. Under lower in situ stress (<10 MPa), presplit blasting, middle-drift excavation and expanding excavation can be selected as the blasting methods while presplit blasting is not recommended to be used firstly under higher ground stress.
Besides, the excavation disturbance induced by transient unloading is not only related to in situ stress level, but also to the loading size and loading area. The dynamic unloading effect of initial in situ stress can be reduced by controlling the maximum single blasting charge, reducing the hole diameter and detonating firstly in low stress position, etc.

5. Discussion

When the analysis results are summarized in this study, for underground powerhouses, there exist differences at various considerations, such as geological structure, rock structure, cavern scale, cavern size, construction technique and quality requirement, etc. The differences could lead to the relative dispersion of statistical results, and the goodness of linear fitting is not the best. Therefore, the rationality of statistical results and the accuracy of analysis results are analyzed and discussed here.
In terms of research methods, the existing powerhouse excavation design is mainly carried out from theoretical analysis, numerical simulation and local excavation test. Theoretical analysis and numerical simulation are convenient for the prediction and control of excavation disturbance, and they can show research results qualitatively and intuitively. However, it is too simplistic to reflect the real and detailed excavation results. For the excavation design of a large underground powerhouse, a field excavation test is the most ideal and real method, but it is impossible to judge the excavation stability of the next powerhouse by building one powerhouse firstly. The local excavation test can only reflect the excavation response of some areas. From a macro point of view, the excavation design analyses and recommendations summarized in this paper can be regarded as the summary of the actual excavation tests of large-scale factory buildings under various conditions, including 51 actual excavation tests. Considering the detailed and practical conditions, the results are authentic. At the same time, it also takes various special factors into account, such as soft rock, hard rock, karst and so on. The results are detailed and comprehensive.
For the main influencing factors, construction technique and quality requirement are basically the same because the NATM has been used in most statistical engineering, and the blasting methods are basically the same. Geological structure and rock structure mainly affect the quality of surrounding rock, the influence degree of which can be represented by classification of surrounding rock. Figure 28 shows the distribution of surrounding rock classifications of the fifty underground powerhouses of Figure 1. It can be found that the distribution of surrounding rock types is similar to a normal distribution. Nearly 35~40 underground powerhouses have II~III surrounding rock, accounting for 81%. From this, the underground powerhouse is mainly composed of II~III surrounding rock, and the others are I, IV, V. Various underground powerhouses have little difference in surrounding rock classification. Thus, the results are very representative from the view of geological conditions. The influence of cavern scale and size on powerhouse excavation lies in the stress disturbance during the forming process of typical excavation section (see Figure 2). According to the existing statistics, the width of a typical section is between 20~30 m and the height is between 40~90 m, but the design of the height–width ratio is not affected by in situ stress level, which is around 2.3~2.5 (see Figure 29). Therefore, the shape of the stress redistribution field of each powerhouse is basically the same, and the influence of the cavern size and height width ratio on the results is small.
Besides, in terms of excavation sequence, the stress changes induced by the previous excavation behavior are also one factor to determine the next excavation procedure, which can be monitored with a string of sensors [77]. The surrounding rock damage caused by excavation behavior should be considered in a specific situation, even if there are support measures. In addition, the minor and intermediate stresses of complex stress field are also an important factor but increase the complexity of recommendations. In this paper, to make it simple and convenient in engineering design, the relationships between stress conditions and design parameters are studied based on maximum principal stress, which can also reflect the stress environment of a cavern.

6. Conclusions

The conclusions are as follows:
(1) Fifty-one underground powerhouses in China were summarized in detail, including their engineering scale, size, lithology, rock classification and in situ stress level. The complex stress environment and excavation technologies in China are also introduced. The detailed summaries provide convenience for analysis of excavation procedure and design parameters.
(2) Excavation procedure methods and key parameters of three typical excavation zones (top arch zone, rock anchor beam zone, high side wall zone) in main powerhouse are influenced by in situ stress levels. The priority of each excavation procedure is different under different in situ stress levels. In addition, there are basically linear relationships between in situ stress levels and the key parameters.
(3) Considering the bearing capacity of surrounding rock, the strength–stress ratio (SSR) is introduced to evaluate the cavern excavation stability comprehensively and recommend the excavation design. The results show that different SSR conditions correspond to different design parameters, and the parameters should be adjusted to guide the actual construction design quantitatively and control the cavern stability according to the specific SSR. Meanwhile, the suggestions on blasting excavation design are supplemented to control the stress transient unloading effect under high in situ stress.
Besides, the downward excavation of large-span powerhouse leads to an increasing construction depth. It means increasing stress conditions to a certain degree, which also deserves further consideration. The rationality and accuracy of the study is determined by analyzing the influencing factors and comparing with the specification. So, the recommendations are relatively more accurate and scientific. It is believed that the summary and recommendations above will provide a good reference for the excavation procedure optimization of underground powerhouse under high in situ stress.

Author Contributions

Conceptualization, P.Y. and M.C.; methodology, X.L. and P.Y.; formal analysis, X.L., P.Y. and S.L.; investigation, X.L. and A.L.; writing—original draft preparation, X.L. and P.Y.; writing—review and editing, W.L., G.W. and S.H. All authors have read and agreed to the published version of the manuscript.

Funding

This research was funded by the National Natural Science Foundation of China (No. 51779192), Open Research Fund Project of Changjiang River Scientific Research Institute (No. CKWV2019742/KY), the Outstanding Youth Fund project of Hubei Natural Science Foundation (No. 2019CFA060) and the Key Program of the National Natural Science Foundation of China (No. 51939008).

Acknowledgments

The authors would like to thank the WSM Team and the PowerChina HuaDong Engineering Corporation Limited for the support of stress environment drawing and engineering investigation. In addition, this work is completed with the contributions of many researchers and their achievements. The authors wish to express thanks to all of them. In case of any omission, we express thanks to all supporters.

Conflicts of Interest

The authors declare no conflict of interest.

References

  1. Li, A.; Dai, F.; Liu, Y.; Du, H.; Jiang, R. Dynamic stability evaluation of underground cavern sidewalls against flexural toppling considering excavation-induced damage. Tunn. Undergr. Space Technol. 2021, 112, 103903. [Google Scholar] [CrossRef]
  2. Dai, F.; Li, B.; Xu, N.; Zhu, Y. Microseismic early warning of surrounding rock mass deformation in the underground powerhouse of the Houziyan hydropower station, China. Tunn. Undergr. Space Technol. 2017, 62, 64–74. [Google Scholar] [CrossRef]
  3. Xiao, P.; Li, T.; Xu, N.; Zhou, Z.; Liu, X. Microseismic monitoring and deformation early warning of the underground caverns of Lianghekou hydropower station, Southwest China. Arab. J. Geosci. 2019, 12, 496. [Google Scholar] [CrossRef]
  4. Xu, J.; Jiang, J.; Xu, N.; Liu, Q.; Gao, Y. A new energy index for evaluating the tendency of rockburst and its engineering application. Eng. Geol. 2017, 230, 46–54. [Google Scholar] [CrossRef]
  5. Xie, L.; Yan, P.; Lu, W.; Chen, M.; Wang, G. Comparison of seismic effects during deep tunnel excavation with different methods. Earthq. Eng. Eng. Vib. 2018, 17, 208–224. [Google Scholar] [CrossRef]
  6. Wang, W.; Liu, G.; Su, Q.; Han, R. Analysis of Excavation Procedure and Stability in Jointed Rock Masses of the Large Underground Caverns; Springer International Publishing: Cham, Switzerland, 2019; pp. 1358–1362. [Google Scholar]
  7. Li, H.-B.; Liu, M.-C.; Xing, W.-B.; Shao, S.; Zhou, J.-W. Failure mechanisms and evolution assessment of the excavation damaged zones in a large-scale and deeply buried underground powerhouse. Rock Mech. Rock Eng. 2017, 50, 1883–1900. [Google Scholar] [CrossRef]
  8. Qin, Z.; Cao, B.; Liu, Y.; Li, T. Study on in situ stress measurement and surrounding rock control technology in deep mine. Geofluids 2020, 2020, 8839333. [Google Scholar] [CrossRef]
  9. Cai, H. Safety Monitoring and Engineering Treatment Measures for the Underground Plant of a Pumped Storage Power Station in Pushi River. Ph.D. Thesis, Jilin University, Jilin, China, 2013. [Google Scholar]
  10. He, S.; Ma, L. Summary of construction technology of hydropower and water conservancy underground engineering in China. Water Conserv. Hydropower Constr. 2016. [Google Scholar]
  11. Yan, P.; He, Q.; Lu, W.; He, Y.; Zhou, W.; Chen, M. Coring damage extent of rock cores retrieved from high in-situ stress condition: A case study. KSCE J. Civ. Eng. 2017, 21, 2946–2957. [Google Scholar] [CrossRef]
  12. Yang, L.; Chen, S.; Fang, S.; Huang, C.; Xie, H. Model experimental study on the effects of in situ stresses on pre-splitting blasting damage and strain development. Int. J. Rock Mech. Min. Sci. 2021, 138, 104587. [Google Scholar] [CrossRef]
  13. Manouchehrian, A.; Cai, M. Simulation of unstable rock failure under unloading conditions. Can. Geotech. J. 2016, 53, 22–34. [Google Scholar] [CrossRef]
  14. Lu, W.; Yang, J.; Yan, P.; Chen, M.; Fan, Y. Mechanism and Effect of Transient Unloading in Deep Rock Excavation; Science Press: Beijing, China, 2018; ISBN 978-7-03-056868-7. [Google Scholar]
  15. Yang, J.; Lu, W.; Li, P.; Yan, P. Evaluation of rock vibration generated in blasting excavation of deep-buried tunnels. KSCE J. Civ. Eng. 2017, 22, 2593–2608. [Google Scholar] [CrossRef]
  16. Yang, Y.; Zhang, Z. Surrounding rock effect on coal burst under unloading condition: A numerical study. Arab. J. Geosci. 2021, 14, 1742. [Google Scholar] [CrossRef]
  17. Chen, M.; Lu, W.B.; Yan, P.; Hu, Y.G. Blasting excavation induced damage of surrounding rock masses in deep-buried tunnels. KSCE J. Civ. Eng. 2016, 20, 933–942. [Google Scholar] [CrossRef]
  18. Wu, P.; Yang, T.; Jia, W. Reliability analysis and prediction on tunnel roof under blasting disturbance. KSCE J. Civ. Eng. 2019, 23, 4036–4046. [Google Scholar] [CrossRef]
  19. Chen, F.; He, C.; Deng, J. Concept of high geostress and its qualitative and quantitative definitions. Rock Soil Mech. 2015, 4, 971–980. [Google Scholar] [CrossRef]
  20. Yang, J.-C.; Liu, K.-W.; Li, X.-D.; Liu, Z.-X. Stress initialization methods for dynamic numerical simulation of rock mass with high in-situ stress. J. Cent. South. Univ. 2020, 27, 3149–3162. [Google Scholar] [CrossRef]
  21. Fan, Y.; Zheng, J.; Hu, X.; Cui, X.; He, W. Study on energy release of surrounding rock under the multiple unloading disturbance during tunnel excavation. Math. Probl. Eng. 2020, 2020, 6486815. [Google Scholar] [CrossRef]
  22. Jiang, Y.; Zhou, H.; Lu, J.; Gao, Y.; Zhang, C.; Chen, J. Analysis of stress evolution characteristics during TBM excavation in deep buried tunnels. Bull. Int. Assoc. Eng. Geol. 2019, 78, 5177–5194. [Google Scholar] [CrossRef]
  23. Niu, L.; Zhu, W.; Cheng, Z.; Guan, K.; Qin, T. Numerical simulation on excavation-induced damage of rock under quasi-static unloading and dynamic disturbance. Environ. Earth Sci. 2017, 76, 614. [Google Scholar] [CrossRef]
  24. Jian-Po, L.; Yuan-Hui, L.; Shi-Da, X. Relationship between microseismic activities and mining parameters during deep mining process. J. Appl. Geophys. 2018, 159, 814–823. [Google Scholar] [CrossRef]
  25. Wang, C.; Xie, M.-Z.; Xiong, Z.-Q.; Wang, C.; Cheng, L.-P. Energy evolution law of ore-bearing rock during unloading under high static stress and frequent disturbance. Complexity 2020, 2020, 3806521. [Google Scholar] [CrossRef]
  26. Chen, S.-J.; Feng, F.; Wang, Y.-J.; Li, D.-Y.; Huang, W.-P.; Zhao, X.-D.; Jiang, N. Tunnel failure in hard rock with multiple weak planes due to excavation unloading of in-situ stress. J. Cent. South Univ. 2020, 27, 2864–2882. [Google Scholar] [CrossRef]
  27. Cheng, Y.; Song, Z.; Chang, X.; Wang, T. Energy evolution principles of shock-wave in sandstone under unloading stress. KSCE J. Civ. Eng. 2020, 24, 2912–2922. [Google Scholar] [CrossRef]
  28. Lu, W.; Yang, J.; Yan, P.; Chen, M.; Zhou, C.; Luo, Y.; Jin, L. Dynamic response of rock mass induced by the transient release of in-situ stress. Int. J. Rock Mech. Min. Sci. 2012, 53, 129–141. [Google Scholar] [CrossRef]
  29. Zhang, J. Study on Excavation Sequence Selection of Large Underground Caverns and Construction Technology of Underground Powerhouse; University Tianjin: Tianjin, China, 2007. [Google Scholar]
  30. Qiu, S.; Eliasson, V. Interaction and coalescence of multiple simultaneous and non-simultaneous blast waves. Shock Waves 2015, 26, 287–297. [Google Scholar] [CrossRef]
  31. Peng, Y.; Liu, G.; Wu, L.; Zuo, Q.; Liu, Y.; Zhang, C. Comparative study on tunnel blast-induced vibration for the underground cavern group. Environ. Earth Sci. 2021, 80, 68. [Google Scholar] [CrossRef]
  32. Qinghua, X.; Jianguo, L.; Shenxiang, L.; Bo, G. A new method for calculating energy release rate in tunnel excavation subjected to high in situ stress. Perspect. Sci. 2016, 7, 292–298. [Google Scholar] [CrossRef] [Green Version]
  33. Li, Z.-P.; Xu, G.; Dong, J.; Li, Z.; Wang, J.; Chen, C. Deformation and fracture of surrounding rock mass of underground caverns at Houziyan Hydropower Station. Chin. J. Rock Mech. Eng. 2014, 33, 2291–2300. [Google Scholar] [CrossRef]
  34. Xu, W.-Y.; Nie, W.-P.; Zhou, X.-Q.; Shi, C.; Wang, W.; Feng, S.-R. Long-term stability analysis of large-scale underground plant of Xiangjiaba hydro-power station. J. Cent. South Univ. 2011, 18, 511–520. [Google Scholar] [CrossRef]
  35. Jiang, Q.; Su, G.; Feng, X.-T.; Chen, G.; Zhang, M.-Z.; Liu, C. Excavation optimization and stability analysis for large underground caverns under high geostress: A case study of the Chinese Laxiwa Project. Rock Mech. Rock Eng. 2018, 52, 895–915. [Google Scholar] [CrossRef]
  36. Hu, Y.; Lu, W.; Wu, X.; Liu, M.; Li, P. Numerical and experimental investigation of blasting damage control of a high rock slope in a deep valley. Eng. Geol. 2018, 237, 12–20. [Google Scholar] [CrossRef]
  37. Wang, M.; Li, H.-B.; Han, J.-Q.; Xiao, X.-H.; Zhou, J.-W. Large deformation evolution and failure mechanism analysis of the multi-freeface surrounding rock mass in the Baihetan underground powerhouse. Eng. Fail. Anal. 2019, 100, 214–226. [Google Scholar] [CrossRef]
  38. Huang, J. Study on Fine Blasting Excavation of Deep Underground Cavern Based on Timing Sequence Control Fracture and Borehole Notching; Wuhan University of Technology: Wuhan, China, 2018. [Google Scholar]
  39. Xu, C.; Yin, Q. Fine blasting technology in excavation of super large underground powerhouse of hydropower station. In Proceedings of the 9th National Engineering Blasting Academic Conference, Qingdao, China, 12–17 September 2008. [Google Scholar]
  40. Li, H. Study on Construction Procedure and Excavation Method of Large Underground Powerhouse; Wuhan University: Wuhan, China, 2004. [Google Scholar]
  41. Yang, J.; Huang, S.; Liu, Z. Relationship between deformation failure and strength-to-stress ratio of surrounding rock of large-scale underground hard rock caverns under high geo-stress. J. Yangtze River Sci. Res. Inst. 2019, 36, 67–74. [Google Scholar] [CrossRef]
  42. Zhang, Y.; Xiao, P.; Chen, L.-J. Method of layout design based on ratio of rock strength to in-situ stress for large underground caverns. Chin. J. Rock Mech. Eng. 2014, 33, 2314–2331. [Google Scholar] [CrossRef]
  43. Li, B.; Ding, Q.-F.; Xu, N.-W.; Lei, Y.-F.; Xu, Y.; Zhu, Z.-P.; Liu, J.-F. Mechanical response and stability analysis of rock mass in high geostress underground powerhouse caverns subjected to excavation. J. Cent. South Univ. 2020, 27, 2971–2984. [Google Scholar] [CrossRef]
  44. Vazaios, I.; Vlachopoulos, N.; Diederichs, M.S. Mechanical analysis and interpretation of excavation damage zone formation around deep tunnels within massive rock masses using hybrid finite–discrete element approach: Case of Atomic Energy of Canada Limited (AECL) Underground Research Laboratory (URL) test tunnel. Can. Geotech. J. 2019, 56, 35–59. [Google Scholar] [CrossRef]
  45. Wang, Z.-Y.; Gu, D.-M.; Zhang, W.-G. Influence of excavation schemes on slope stability: A DEM study. J. Mt. Sci. 2020, 17, 1509–1522. [Google Scholar] [CrossRef]
  46. Han, H.; Fukuda, D.; Liu, H.; Salmi, E.F.; Sellers, E.; Liu, T.; Chan, A. FDEM simulation of rock damage evolution induced by contour blasting in the bench of tunnel at deep depth. Tunn. Undergr. Space Technol. 2020, 103, 103495. [Google Scholar] [CrossRef]
  47. Tao, J.; Yang, X.-G.; Li, H.-T.; Zhou, J.-W.; Qi, S.-C.; Lu, G.-D. Numerical investigation of blast-induced rock fragmentation. Comput. Geotech. 2020, 128, 103846. [Google Scholar] [CrossRef]
  48. Chai, C.; Ling, S.; Wu, X.; Hu, T.; Sun, D. Characteristics of the in situ stress field and engineering effect along the Lijiang to Shangri-La Railway on the Southeastern Tibetan Plateau, China. Adv. Civ. Eng. 2021, 2021, 6652790. [Google Scholar] [CrossRef]
  49. Hasegawa, H.S.; Adams, J.; Yamazaki, K. Upper crustal stresses and vertical stress migration in eastern Canada. J. Geophys. Res. Space Phys. 1985, 90, 3637–3648. [Google Scholar] [CrossRef]
  50. Heidbach, O.; Rajabi, M.; Cui, X.; Fuchs, K.; Müller, B.; Reinecker, J.; Reiter, K.; Tingay, M.; Wenzel, F.; Xie, F.; et al. The world stress map database release 2016: Crustal stress pattern across scales. Tectonophysics 2018, 744, 484–498. [Google Scholar] [CrossRef]
  51. Heidbach, O.; Rajabi, M.; Cui, X.; Fuchs, K.; Müller, B.; Reinecker, J.; Tingay, M.; Reiter, K.; Wenzel, F.; Xie, F.; et al. World Stress Map Database Release 2016: Crustal stress pattern across scales. Tectonophysics 2018, 744, 484–498. [Google Scholar] [CrossRef]
  52. Ma, H.; Zhou, Y.; He, S. Construction of Underground Hydro Works in China; China Water and Power Press: Beijing, China, 2011; ISBN 978-7-5084-8304-7. [Google Scholar]
  53. Jiang, J.; Gao, B. Summarization of underground chambers blasting excavation. J. Yangtze River Sci. Res. Inst. 2003, 20, 32–34. [Google Scholar] [CrossRef]
  54. Xiao, X.-H.; Xiao, P.-W.; Dai, F.; Li, H.-B.; Zhang, X.-B.; Zhou, J.-W. Large deformation characteristics and reinforcement measures for a rock pillar in the Houziyan underground powerhouse. Rock Mech. Rock Eng. 2017, 51, 561–578. [Google Scholar] [CrossRef]
  55. Duan, S.-Q.; Feng, X.-T.; Liu, G.-F.; Pei, S.-F.; Fan, Y.-L.; Jiang, Q. In situ observation of failure mechanisms controlled by rock masses with weak interlayer zones in large underground cavern excavations under high geostress. Rock Mech. Rock Eng. 2017, 50, 2465–2493. [Google Scholar] [CrossRef]
  56. Hu, Z.; Xu, N.; Li, B.; Xu, Y.; Xu, J.; Wang, K. Stability analysis of the arch crown of a large-scale underground powerhouse during excavation. Rock Mech. Rock Eng. 2020, 53, 2935–2943. [Google Scholar] [CrossRef]
  57. Feng, X.-T.; Xu, H.; Qiu, S.-L.; Li, S.-J.; Yang, C.-X.; Guo, H.-S.; Cheng, Y.; Gao, Y.-H. In situ observation of rock spalling in the deep tunnels of the China Jinping underground laboratory (2400 m depth). Rock Mech. Rock Eng. 2018, 51, 1193–1213. [Google Scholar] [CrossRef]
  58. Zhou, Y.-Y.; Xu, D.-P.; Gu, G.-K.; Liu, K.; Wan, L.-P.; Wang, T.-L.; Yang, J.-B. The failure mechanism and construction practice of large underground caverns in steeply dipping layered rock masses. Eng. Geol. 2019, 250, 45–64. [Google Scholar] [CrossRef]
  59. Xue, R.; Liang, Z.; Xu, N. Rockburst prediction and analysis of activity characteristics within surrounding rock based on microseismic monitoring and numerical simulation. Int. J. Rock Mech. Min. Sci. 2021, 142, 104750. [Google Scholar] [CrossRef]
  60. Zhou, Y.-Y.; Xu, D.-P.; Liu, K.; Chen, D.-F. Understanding the failure mechanism of a large underground cavern in steeply dipping layered rock mass using an enhanced ubiquitous-joint model. Bull. Int. Assoc. Eng. Geol. 2021, 80, 4621–4638. [Google Scholar] [CrossRef]
  61. Zhang, C.; Liu, Z.; Pan, Y.; Gao, Y.; Zhou, H.; Cui, G. Influence of amygdale on crack evolution and failure behavior of basalt. Eng. Fract. Mech. 2020, 226, 106843. [Google Scholar] [CrossRef]
  62. Zhao, J.; Feng, X.-T.; Zhang, X.; Yang, C. Brittle and ductile creep behavior of Jinping marble under true triaxial stress. Eng. Geol. 2019, 258, 105157. [Google Scholar] [CrossRef]
  63. Zhao, J.-S.; Feng, X.-T.; Jiang, Q.; Zhou, Y.-Y. Microseismicity monitoring and failure mechanism analysis of rock masses with weak interlayer zone in underground intersecting chambers: A case study from the Baihetan Hydropower Station, China. Eng. Geol. 2018, 245, 44–60. [Google Scholar] [CrossRef]
  64. Wang, A.; Deng, Z. Development of underground powerhouse of hydropower station in China. Water Power 2015, 41, 65–68. [Google Scholar] [CrossRef]
  65. Du, B.; Du, Y.; Xu, F.; He, P. Conception and exploration of using data as a service in tunnel construction with the NATM. Engineering 2018, 4, 123–130. [Google Scholar] [CrossRef]
  66. Yu, W.; Li, K. Deformation mechanism and control technology of surrounding rock in the deep-buried large-span chamber. Geofluids 2020, 2020, 8881319. [Google Scholar] [CrossRef]
  67. Broch, E. Planning and utilisation of rock caverns and tunnels in Norway. Tunn. Undergr. Space Technol. 2016, 55, 329–338. [Google Scholar] [CrossRef]
  68. Kong, X.; Liu, Q.; Zhang, Q.; Wu, Y.; Zhao, J. A method to estimate the pressure arch formation above underground excavation in rock mass. Tunn. Undergr. Space Technol. 2018, 71, 382–390. [Google Scholar] [CrossRef]
  69. Kong, X.; Liu, Q.; Pan, Y.; Liu, J. Stress redistribution and formation of the pressure arch above underground excavation in rock mass. Eur. J. Environ. Civ. Eng. 2021, 25, 722–736. [Google Scholar] [CrossRef]
  70. Shi, G.-B.; Li, N. Arch shape optimization of large Caverns under high land stress. Chin. J. Appl. Mech. 2005, 4, 661–664. [Google Scholar] [CrossRef]
  71. Li, X.; Lv, J.; Luo, Y.; Liu, T. Mechanism study on elevation effect of blast wave propagation in high side wall of deep underground powerhouse. Shock Vib. 2018, 2018, 1–15. [Google Scholar] [CrossRef] [Green Version]
  72. Hydropower and Water Conservancy Planning and Design Institute. Design Code for Underground Powerhouses of Hydro-Power Stations (NBT35090-2016); Ministry of Housing and Urban Rural Development: Beijing, China, 2017. [Google Scholar]
  73. China Federation of Electric Power Enterprises. Code for Hydropower Engineering Geological Investigation (GB 50287-2016); National Energy Administration: Beijing, China, 2016. [Google Scholar]
  74. Yan, P.; Lu, W.; Li, H.; Chen, M.; Zhou, C. Influences of geo-stress on energy distribution of vibration induced by blasting excavation. Explos. Shock Waves 2009, 29, 182–187. [Google Scholar] [CrossRef]
  75. Yang, J.; Lu, W.; Jiang, Q.; Yao, C.; Jiang, S.; Tian, L. A study on the vibration frequency of blasting excavation in highly stressed rock masses. Rock Mech. Rock Eng. 2016, 49, 2825–2843. [Google Scholar] [CrossRef]
  76. Sun, D.; Li, Y.; Chen, X.; Yang, Q. A study on the normal transmission of a one-dimensional P-wave across a single nonlinear joint in a rockmass. Adv. Civ. Eng. 2019, 2019, 5762487. [Google Scholar] [CrossRef]
  77. Skrzypkowski, K. Case studies of rock bolt support loads and rock mass monitoring for the room and pillar method in the Legnica-Gogów Copper District in Poland. Energies 2020, 13, 2998. [Google Scholar] [CrossRef]
Figure 1. The arrangement and typical excavation section of hydropower caverns. (a) The arrangement of hydropower caverns [9]. (b) The typical excavation section of hydropower caverns.
Applsci 11 10252 g001
Figure 2. Four excavation zones of the main powerhouse.
Applsci 11 10252 g002
Figure 3. Stress distribution map of China [50,51].
Applsci 11 10252 g003
Figure 4. Distribution of underground powerhouses all over the world.
Applsci 11 10252 g004
Figure 5. Distribution of underground powerhouses in China.
Applsci 11 10252 g005
Figure 6. Development history of underground powerhouse in China.
Applsci 11 10252 g006
Figure 7. The improvement history of excavation technology for underground powerhouses in China.
Applsci 11 10252 g007
Figure 8. Top arch zone of an underground powerhouse. (a) The excavation diagram of the top arch zone. (b) The engineering scene of the top arch zone.
Applsci 11 10252 g008
Figure 9. Excavation procedures of the top arch zone. (a) Middle-drift connection followed by sides excavation (MDBS/MDBS(P)). (b) Both sides heading followed by middle pier excavation (BSMP).
Applsci 11 10252 g009
Figure 10. Statistics of excavation procedures at the top arch zone. (a) The usage proportion of excavation procedures. (b) In situ stress distribution of excavation procedures.
Applsci 11 10252 g010
Figure 11. The relationship between height (H), span (S), H/S of the top arch zone and in situ stress level.
Applsci 11 10252 g011
Figure 12. Rock anchor beam zone of underground powerhouse. (a) The excavation diagram of the rock anchor beam zone. (b) The engineering scene of the rock anchor beam zone.
Applsci 11 10252 g012
Figure 13. MEP and MEP(P) methods of the rock anchor beam zone.
Applsci 11 10252 g013
Figure 14. Statistics of excavation procedures at the rock anchor beam zone. (a) The usage proportion of excavation procedures. (b) In situ stress distribution of excavation procedures.
Applsci 11 10252 g014
Figure 15. The relationship between protective cover thickness and in situ stress level at the rock anchor beam zone.
Applsci 11 10252 g015
Figure 16. High side wall zone of underground powerhouse. (a) The excavation diagram of the high side wall zone. (b) The engineering scene of the high side wall zone.
Applsci 11 10252 g016
Figure 17. Excavation procedures of the high side wall zone. (a) MEP method; (b) CPMB method; (c) CPHB method.
Applsci 11 10252 g017
Figure 18. Statistics of excavation procedures at the high side wall zone. (a) The usage proportion of excavation procedures. (b) In situ stress distribution of excavation procedures.
Applsci 11 10252 g018
Figure 19. The relationship between key design parameters and in situ stress level at the high side wall zone. (a) The changing trend of stratification height. (b) The changing trend of protective cover thickness.
Applsci 11 10252 g019
Figure 20. Statistics of excavation procedures at the top arch zone. (a) The distribution of excavation procedures based on SSR. (b) The relationship between H, S, H/S and SSR.
Applsci 11 10252 g020
Figure 21. The distribution of excavation procedures based on SSR.
Applsci 11 10252 g021
Figure 22. The dominant distribution of protective cover thickness under different SSR at the rock anchor beam zone.
Applsci 11 10252 g022
Figure 23. The distribution of excavation procedures based on SSR.
Applsci 11 10252 g023
Figure 24. The dominant distribution of stratification height under different SSR at the high side wall zone.
Applsci 11 10252 g024
Figure 25. The dominant distribution of protective cover thickness under different SSR at the high side wall zone.
Applsci 11 10252 g025
Figure 26. Rock-cracking phenomena in deep-buried caverns of Baihetan station. (a) Collapse of the top arch zone in powerhouse. (b) Cracking of the high side wall in powerhouse.
Applsci 11 10252 g026
Figure 27. The excavation diagram of evolved methods at the high side wall zone.
Applsci 11 10252 g027
Figure 28. The distribution of surrounding rock classification (Ⅰ, Ⅱ, Ⅲ, Ⅳ, Ⅴ are different surrounding rock classifications that reflect the quality of rock mass).
Applsci 11 10252 g028
Figure 29. The relationship between height–width ratio of underground powerhouse and in situ stress level.
Applsci 11 10252 g029
Table 1. Summary of fifty-one underground powerhouses in China [10,40,41,42,52,53,54,55,56,57,58,59,60,61,62,63].
Project NameInstallation Capacity
(MW);
Main Powerhouse Size
(Length × Width × Height)/m
LithologyRock
Classification
In Situ Stress Level (MPa)
Ertan6 × 550280.3 × 30.7 × 65.6Syenite, BasaltII, III17.2~38.4
Shuangjiangkou4 × 500132.6 × 29.3 × 63.0GraniteII16.0~37.0
Houziyan4 × 425219.5 × 29.2 × 68.7LimestoneII, III21.5~36.4
Jinping I6 × 600277.0 × 28.9 × 68.8MarbleIII20.0~35.7
Guandi4 × 600243.4 × 31.1 × 76.3BasaltII, III25.0~35.2
Changheba4 × 650228.8 × 30.8 × 73.4GraniteII, III16.0~32.0
Lianghekou6 × 500275.9 × 28.4 × 66.0Sandy slateIII21.6~30.4
Laxiwa6 × 700311.8 × 30.0 × 75.0GraniteI, II14.6~30.0
Pubugou6 × 550294.1 × 30.7 × 70.2GraniteII, III21.1~27.3
Xiaowan6 × 700298.4 × 30.6 × 79.4GneissI, II16.5~26.7
Baihetan16 × 1000438.0 × 34.0 × 86.7BasaltIII19.0~26.0
Jinping II8 × 600352.4 × 28.9 × 72.2MarbleIII10.1~22.9
Xiluodu (left)9 × 770439.7 × 31.9 × 75.6BasaltI, II14.8~21.1
Dagangshan4 × 650226.6 × 30.8 × 73.8GraniteII, III11.4~19.3
Lubuge4 × 150125.0 × 18.0 × 38.4Limestone, DolomiteII, III, IV13.5~18.0
Jiangya3 × 100107.0 × 19.0 × 46.5LimestoneII17.2
Dachaoshan6 × 225233.5 × 26.4 × 63.0BasaltII, III13.0~16.9
Zhouning2 × 12566.8 × 17.9 × 42.2GraniteI, II14.6~16.4
Silin4 × 262.5177.8 × 27.0 × 73.5LimestoneII, III 9.7~16.0
Yixing4 × 250155.3 × 23.4 × 52.4SandstoneIII, IV 8.3~16.0
Tianlonghu18077.0 × 18.0 × 39.6Metasandstone, PhylliteIII, IV, V 9.7~15.5
Yangjiang6 × 400216.0 × 26.0 × 59.8Biotite graniteI, II14.0~15.0
Huizhou8 × 300152.0 × 21.5 × 48.3GraniteI, II12.0~15.0
Sanbanxi4 × 250146.4 × 21.0 × 56.4SandstoneII, III14.5
Pushihe4 × 300173.3 × 25.7 × 54.6Migmatitic graniteII, III14.4
Guangzhou I4 × 300146.5 × 21.0 × 44.5GraniteII, III14.0
longtan9 × 700388.5 × 28.5 × 76.4Sandstone, ShaleII, III12.0~13.0
Yangfanggou4 × 375228.5 × 27.0 × 75.6GranodioriteII, III12.6~13.0
Jixi6 × 300210.0 × 26.0 × 53.4GraniteII, III10.0~13.0
Suofengying3 × 200135.5 × 24.0 × 58.3LimestoneII, III12.9
Malutang II3 × 10097.4 × 19.6 × 41.1GneissI9.0~12.5
Three gorges (right)6 × 700311.3 × 32.6 × 87.3graniteI, II11.2~12.3
Tongbai4 × 300182.7 × 24.5 × 62.3GraniteII, III10.9~12.2
Xiangjiaba4 × 800255.4 × 33.4 × 85.2SandstoneII8.2~12.2
Wudongde12 × 850330.0 × 32.5 × 89.8Limestone, DolomiteII, III6.0~12.0
Xilongchi4 × 300149.3 × 21.8 × 49.0LimestoneIII12.0
Goupitan5 × 600230.5 × 27.0 × 75.3Limestone, ClaystoneII, III12.0
Shisanling4 × 200145.0 × 23.0 × 46.6Conglomerate, AndesiteII, III9.5~11.7
Pengshui5 × 350252.0 × 30.0 × 68.5Limestone, Calcareous shaleII, III8.5~11.0
Yantan (2)2 × 300127.2 × 30.4 × 68.6DiabaseII, III10.5
Nuozhadu9 × 700418.0 × 31.0 × 77.8GraniteII, III6.0~9.0
Yele2 × 12072.1 × 24.4 × 39.5Quartz dioriteIII, IV8.8
Jiangkou3 × 10089.8 × 19.2 × 47.0Limestone, DolomiteI, II7.7~8.6
Liyang6 × 250179.9 × 21.3 × 53.4Quartz sandstoneIII, IV8.4
Dongfeng3 × 170105.5 × 20.0 × 38.0Limestone, Shale/7.4
Mianhuatan4 × 150129.5 × 21.9 × 52.8graniteI, II6.5~7.0
Baise4 × 135147.0 × 20.7 × 49.0DiabaseII, III5.0~7.0
Wujiangdu (Expansion)2 × 25084.2 × 22.4 × 63.8LimestoneII, III6.0
Shuibuya4 × 400168.5 × 23.0 × 65.4LimestoneII, IV5.6
Xiaolangdi4 × 300251.5 × 26.2 × 61.4Sandstone, Clay RockII, III5.0
Daguangba4 × 6087.1 × 14.2 × 37.4GraniteI, II1.4
Table 2. In situ stress classification of rock mass.
Classification of In Situ StressMaximum Principal Stress σ max (MPa)Strength–Stress Ratio (SSR)
Extremely high σ max ≥ 40<2
high 20     σ max < 402~4
Medium10 ≤ σ max < 204~7
Low σ max < 10>7
Table 3. Summary of SSR in forty-eight underground powerhouses.
Project NameSSRProject NameSSRProject NameSSR
Jinping I2.0~3.8Laxiwa4Pushihe8.3
Houziyan2.0~4.0Shuangjiangkou4Xiluodu (left)9.5~20.2
Lianghekou2.0~4.6Jiangya4.1Wujiangdu (Expansion)10
Ertan2.5~8.7Suofengying4.1Tongbai10.9
Baihetan2.7~4.7Dagangshan4.2~7.0Three gorges (right)11.1
Pubugou2.8~22Malutang II4.4~6.0Yantan (2)11.4
Jinping II2.8~8.0longtan5.0~10.0Yele11.4
Guandi3.2~7.3Goupitan5Jiangkou12.2
Liyang3.2~16.3Shisanling5Dongfeng14
Wudongde3.3Guangzhou I5.8Shuibuya16
Xilongchi3.3~5.0Zhouning6.1~7.9Baise17
Pengshui3.3~6.0Yangfanggou6.2Sanbanxi17.2
Xiaowan3.5Xiangjiaba6.2~9.8Xiaolangdi20
Dachaoshan3.6~6.5Huizhou6.3Daguangba20
Lubuge3.7Yangjiang6.7Nuozhadu20.1~30.2
Changheba3.8~7.5Yixing6.8Mianhuatan23
Table 4. Recommendations for excavation procedure design based on SSR (m).
SSRRock Anchor Beam ZoneHigh Side Wall Zone
Protective Cover Thickness Stratification HeightProtective Cover Thickness
2.0~4.03.5~6.03.0~7.03.0~5.0
4.0~7.02.5~5.04.5~8.01.5~5.0
>7.01.0~5.05.0~8.01.0~3.5
Table 5. The evolved methods of the high side wall zone.
Evolved MethodsExcavation Procedures and Sequences
MEP-1BB(Presplitting)→Z1 (Middle-drift)→AA (Presplitting)→Z2 (Expanding)→Z3 (buffer blasting)
MEP-2Z1(Middle-drift)→Z2(Expanding)→BB(smooth blasting)→Z3(Loose blasting)→AA(smooth blasting)
MEP-3BB (Presplitting)→Z1 (Middle-drift)→Z2 (Expanding)→Z3(buffer blasting)→AA (smooth blasting)
MEP-4Z1 (Middle-drift)→BB (Presplitting)→Z2 (Expanding)→Z3(Loose blasting)→AA (smooth blasting)
MEP-5Z1 (Middle-drift)→BB (Presplitting)→Z2 (Expanding)→AA(Presplitting)→Z3 (Loose blasting)
Table 6. The recommended blasting technology according to in situ stress condition.
The Stress Perpendicular to the Axis of Powerhouse (MPa)Recommended Blasting Excavation Technology Firstly
<10Contour presplitting, Middle-drift, Expanding
>(10~12)Middle-drift, Expanding
Publisher’s Note: MDPI stays neutral with regard to jurisdictional claims in published maps and institutional affiliations.

