1. Introduction
The application of non-destructive structural evaluation techniques to the structural condition monitoring of composite materials is useful to investigate the material properties, and find defects, without inducing sample breakage. Ultrasonic inspection, acoustography, low-frequency methods, acousto-ultrasonic inspection, shearography, and radiographic inspection have previously been tried as such evaluation techniques [
1]. However, because of the size and weight of these technique systems, it is hard or impossible to use such evaluation techniques in an operational structure. Nondestructive techniques with optical signals have been recently suggested to overcome these drawbacks using fiber Bragg gratings as point sensors [
2,
3], or the optical fiber itself as a distributed sensor [
4]. Sensing optical fibers are small and lightweight, and can either be attached to the surface of the tested structure, or embedded inside, acting in many ways as the equivalent of the human nervous system, while having little impact on the structure itself [
1,
5]. Standard telecommunication fibers, despite being very small, have a size of 125 µm, which is much larger than that of the commonly used composite fibers of (5–10) µm for carbon fiber. However, when standard telecommunication fibers are embedded in parallel to composite fibers, they exhibit minimal intrusive behavior, similar to that of composite fibers [
4].
Two of our previous papers applied optical nondestructive techniques using Brillouin scattering in optical fiber to composite materials, and the residual strain measurement after external impact was successfully reported for the first time [
6,
7]. Other authors had earlier found that, because of the difficulty of detection and strength degradation of composite materials, the detection of barely visible impact damage (BVID) caused by low-velocity impacts was a major obstacle to detecting the structural damage to composite materials [
8,
9,
10]. Our next paper then showed that it was possible to detect the BVID by measuring the residual strain in aluminum-coated optical fiber after impact events [
11]. In our most recent paper, we embedded a standard single mode optical fiber in composite material, and measured the residual strain as a two-dimensional damage image according to the external impact energy [
12].
In recent years, fiber optic Brillouin scattering sensor technologies have been dramatically improved to measure the strains distributed along sensing optical fibers. These technologies used the stimulated Brillouin scattering (SBS) effect, which occurs due to the correlation between the probe and pump lights traveling in opposite directions. One of these sensing technologies is termed Brillouin optical correlation domain analysis (BOCDA) [
13]. Our previous works applied this BOCDA sensing measurement system to damage detection of composite materials [
11,
12]. However, because the system must use a fixed optical delay line selected by calculation, freely changing measurement spatial resolution is limited for this technology. We proposed the system without an optical delay line, which is called time differential (TD)-BOCDA, and demonstrated that the system can measure the sensing fiber while freely varying the spatial resolution without changing the system hardware [
14].
Although our group first reported the two-dimensional damage mapping technique of composite materials using the conventional BOCDA technique, the spatial resolution was low, because a 2 Gigabit per second (Gbps) modulated optical signal was used. In this study, we applied a 16 Gbps light signal of eight-fold higher modulation speed to improve the spatial resolution. Furthermore, we also used the novel measurement system without an optical delay line, called time differential (TD)-BOCDA, for damage detection in an optical-fiber-embedded composite cylinder. Thus, following the impacts on the cylinder, the damage maps were drawn and compared using different spatial resolutions.
2. The Fabrication and the Damage Mapping Method of a Composite Cylinder with an Optical Fiber
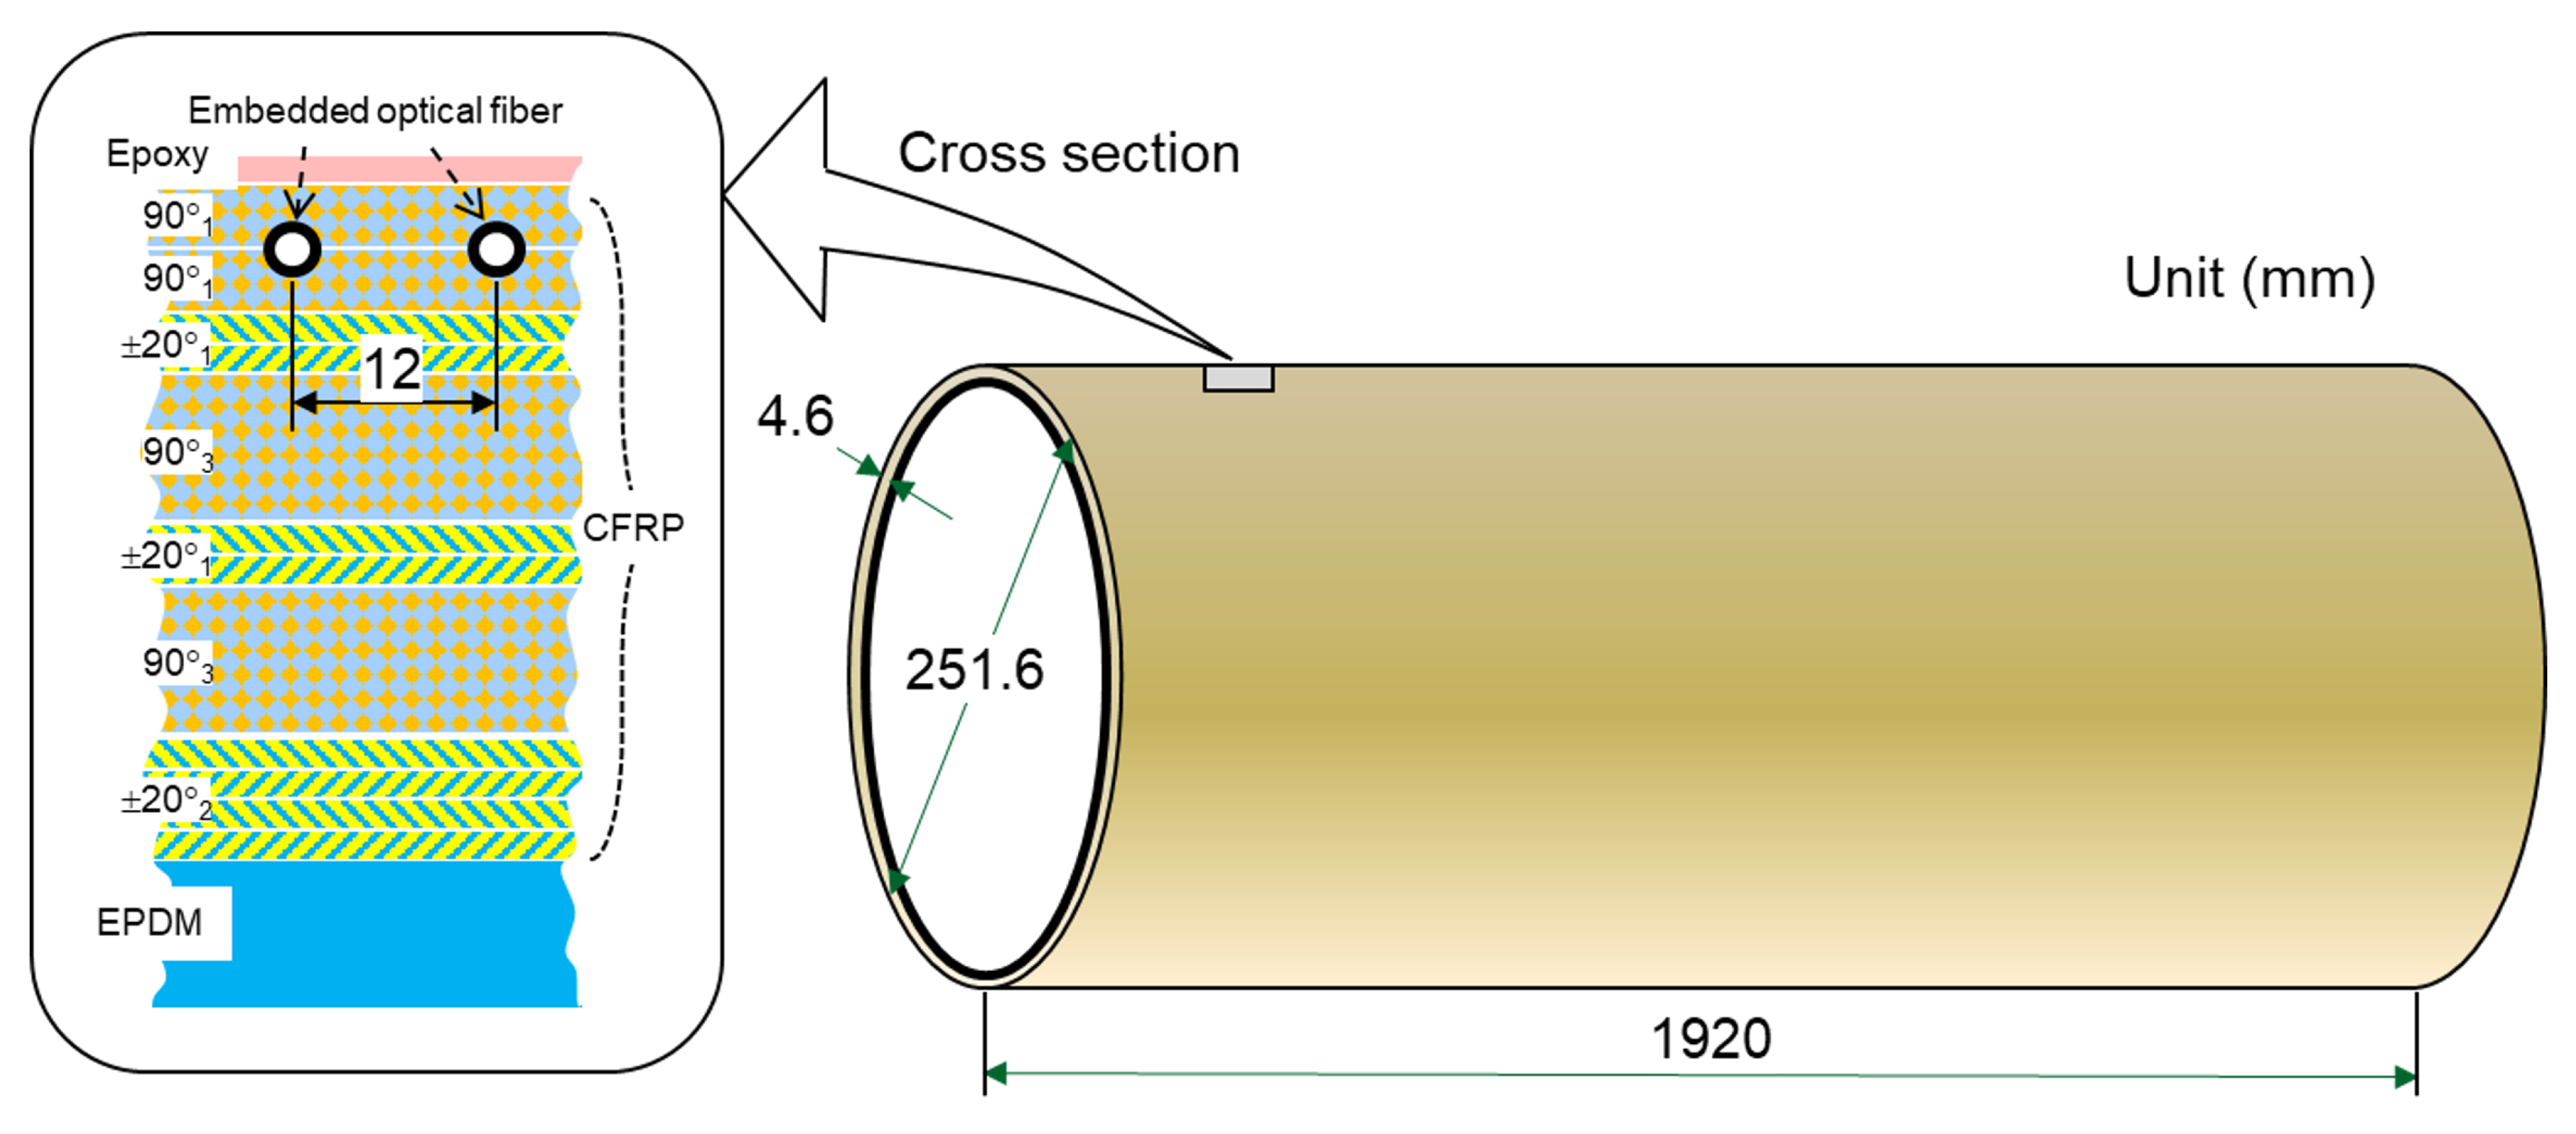
A composite cylinder with an embedded optical fiber was fabricated through a filament winding process using T700 carbon fiber tape;
Figure 1 shows its schematic. The lay-up configuration of this cylinder enlarged as the cross section in the figure is [90°
1/OF/90°
1/±20°
1/90°
3/±20°
1/90°
3/±20°
2/EPDM]
T. EPDM is ethylene propylene diene monomer, a kind of rubber pad that is used to cover the mandrel of the cylinder. The OF (optical fiber), which was purchased from Fibrecore Co in UK, in the carbon fiberlayers is the sensing optical fiber embedded in this cylinder. All of the 15 carbon fiber layers were fabricated in the CFRP (Carbon Fiber Reinforced Plastic) part. The cross angled lay-up of ±20° was fabricated to have the longitudinal stiffness of the cylinder, and the hoop winding of 90° was wound for the hoop directional stiffness of the cylinder. This fiber has the same structure and materials as standard single-mode optical fiber (SSMF) for telecommunication, except that, instead of an acrylate coating, it has a polyimide coating. This OF was placed between 90° hoop carbon layers, and processed to move longitudinally at the pitch of 12 mm in one rotation in the filament winding process. The thickness of the total layers was 4.6 mm. During the remainder of the fabrication process, both ends of the optical fiber were handled with care so as not to break, leading to the outside of the cylinder. They were then connected to the TD-BOCDA sensor system. The figure shows that the diameter and length of the cylinder were 251.6 and 1920 mm, respectively. The length of the optical fiber for one turn around the cylinder was 786 mm. This value was slightly smaller than the outer circumference of the cylinder, 790 mm, so it agrees well with the position of the optical fiber in the multilayer composite structure in
Figure 1. The longitudinal distance of the cylinder in which the optical fiber was embedded was 1.8 m, which is slightly shorter than the cylinder length of 1.92 m. The overall number of winding cycles was 160 turns. Therefore, the total optical fiber length in the cylinder was approximately (786 mm × 160)/1000 ≅ 125 m. After the cylinder fabrication with SSMF embedment, the total insertion loss of the optical fiber was measured as less than 1 dB, including the loss of fiber connectors for the measurement.
When the cylinder was impacted from the outside, the deformation of the composite material, albeit in small amounts, was transferred to the imbedded optical fiber along the circumferential and longitudinal directions of the cylinder. In general, the impacted composite cylinder recovers its initial shape. However, if the cylinder sustains damage to the material under impact, then some amount of strain remains at the impact position in the form of matrix cracks and delamination. Because the residual deformation of the composite material varies around the position of the optical fiber, the residual strain along the optical fiber also depends on the position after impact. Based on the fact that the proportional constant between the Brillouin frequency of the used optical fiber and the residual strain is 0.049 MHz/με for the SSMF, this residual strain can be quantified by measuring the Brillouin frequency of the optical fiber [
6,
11]. Thus, it is possible to shape the cylinder damage by mapping the Brillouin frequency measured in this manner according to the position of the optical fiber. The spatial resolution with the Brillouin frequency measurement is decided by the bandwidth of the optical signal modulation, and this determines the sharpness of the image in the circumferential direction of the cylinder.
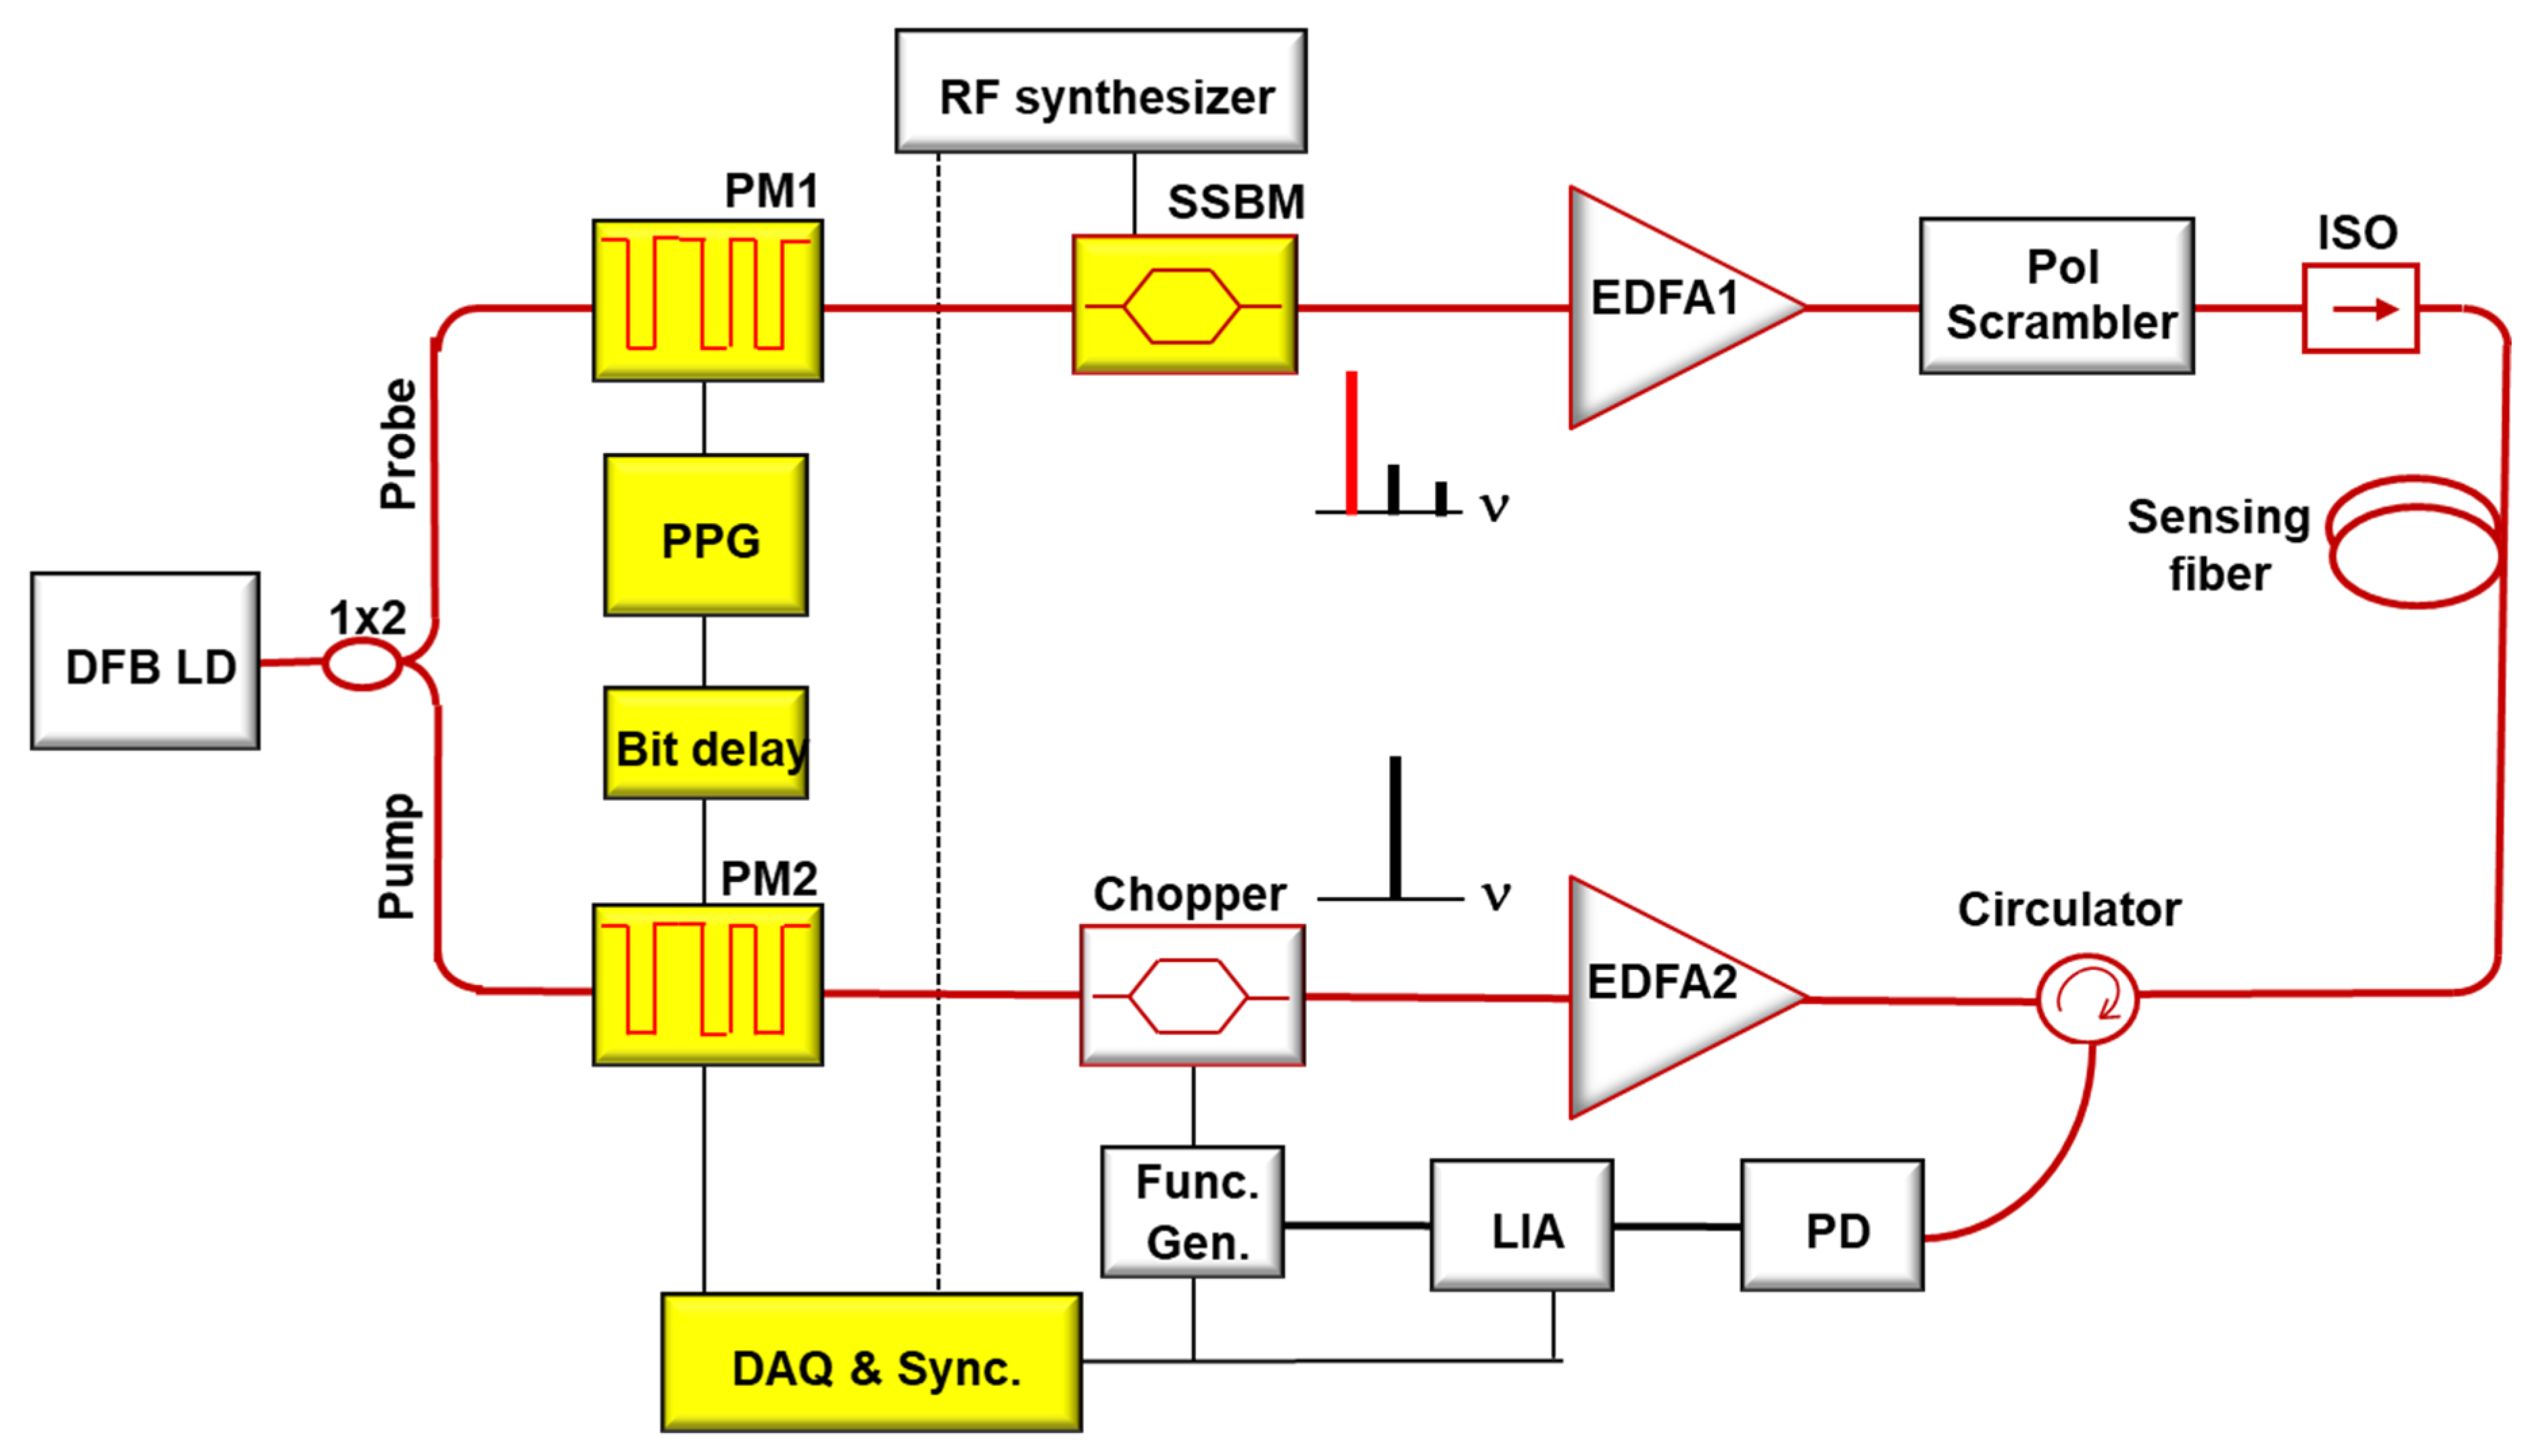
3. Experimental Setup for the TD-BOCDA Sensor System
Figure 2 shows that the experimental setup of the TD-BOCDA sensor system was composed of a closed optical fiber loop including a sensing optical fiber. Optical light wave is generated from a distributed feedback (DFB) laser diode (LD) of 15 dBm output. This light is split by a 3 dB coupler into two separate directions for the probe and the pump. The probe light is modulated by a phase modulator (PM) of LiNbO3. This causes the phase of the light to be moved into one of two states between 0 and 180°, according to a pseudo random bit sequence (PRBS) code pattern with a length of 2
15–1. This pattern length was chosen to be longer than the length of the sensing fiber, so that only one correlation peak would produce SBS gain in the fiber. After phase modulation, the probe is again modulated by a single sideband modulator (SSBM), using a sinusoidal waveform of around 11 Gbps. This causes the peak frequency of the probe light wave to be down-shifted. Thus, the probe and pump are generated from the same light source, but as a result, their frequencies are different. This frequency difference is crucial for SBS gain caused by the correlation between the probe and the pump. The difference that gives the best gain is called the Brillouin frequency. After two modulators, the probe is inserted into a polarization scrambler that removes the polarization dependency of the SBS gain.
The pump is also phase-modulated using the same PRBS pattern as that for the probe, but with bit delay, which is called the time differential, between them. Delayed bits, similar to the time differential between the pump and the probe, cause the position of the correlation peak to move proportionally, and the number of delayed bits decides the measurement position. This is controlled by the computer system. This proposed TD-BOCDA sensor technique makes the traditionally used optical delay unnecessary. The modulated pump is inserted into the chopper and optical amplifier. This chopper is used for SBS gain detection using a lock-in amplifier (LIA). The pump is propagated into the sensing fiber after passing through a circulator. This circulator blocks the propagation of the probe traveling to the pump, and further passes the probe towards the optical receiver. The pump passes through the sensing fiber, and is blocked by the isolator in front of the polarization scrambler. Thus, the circulator and isolator are positioned at the two ends of the sensing fiber.
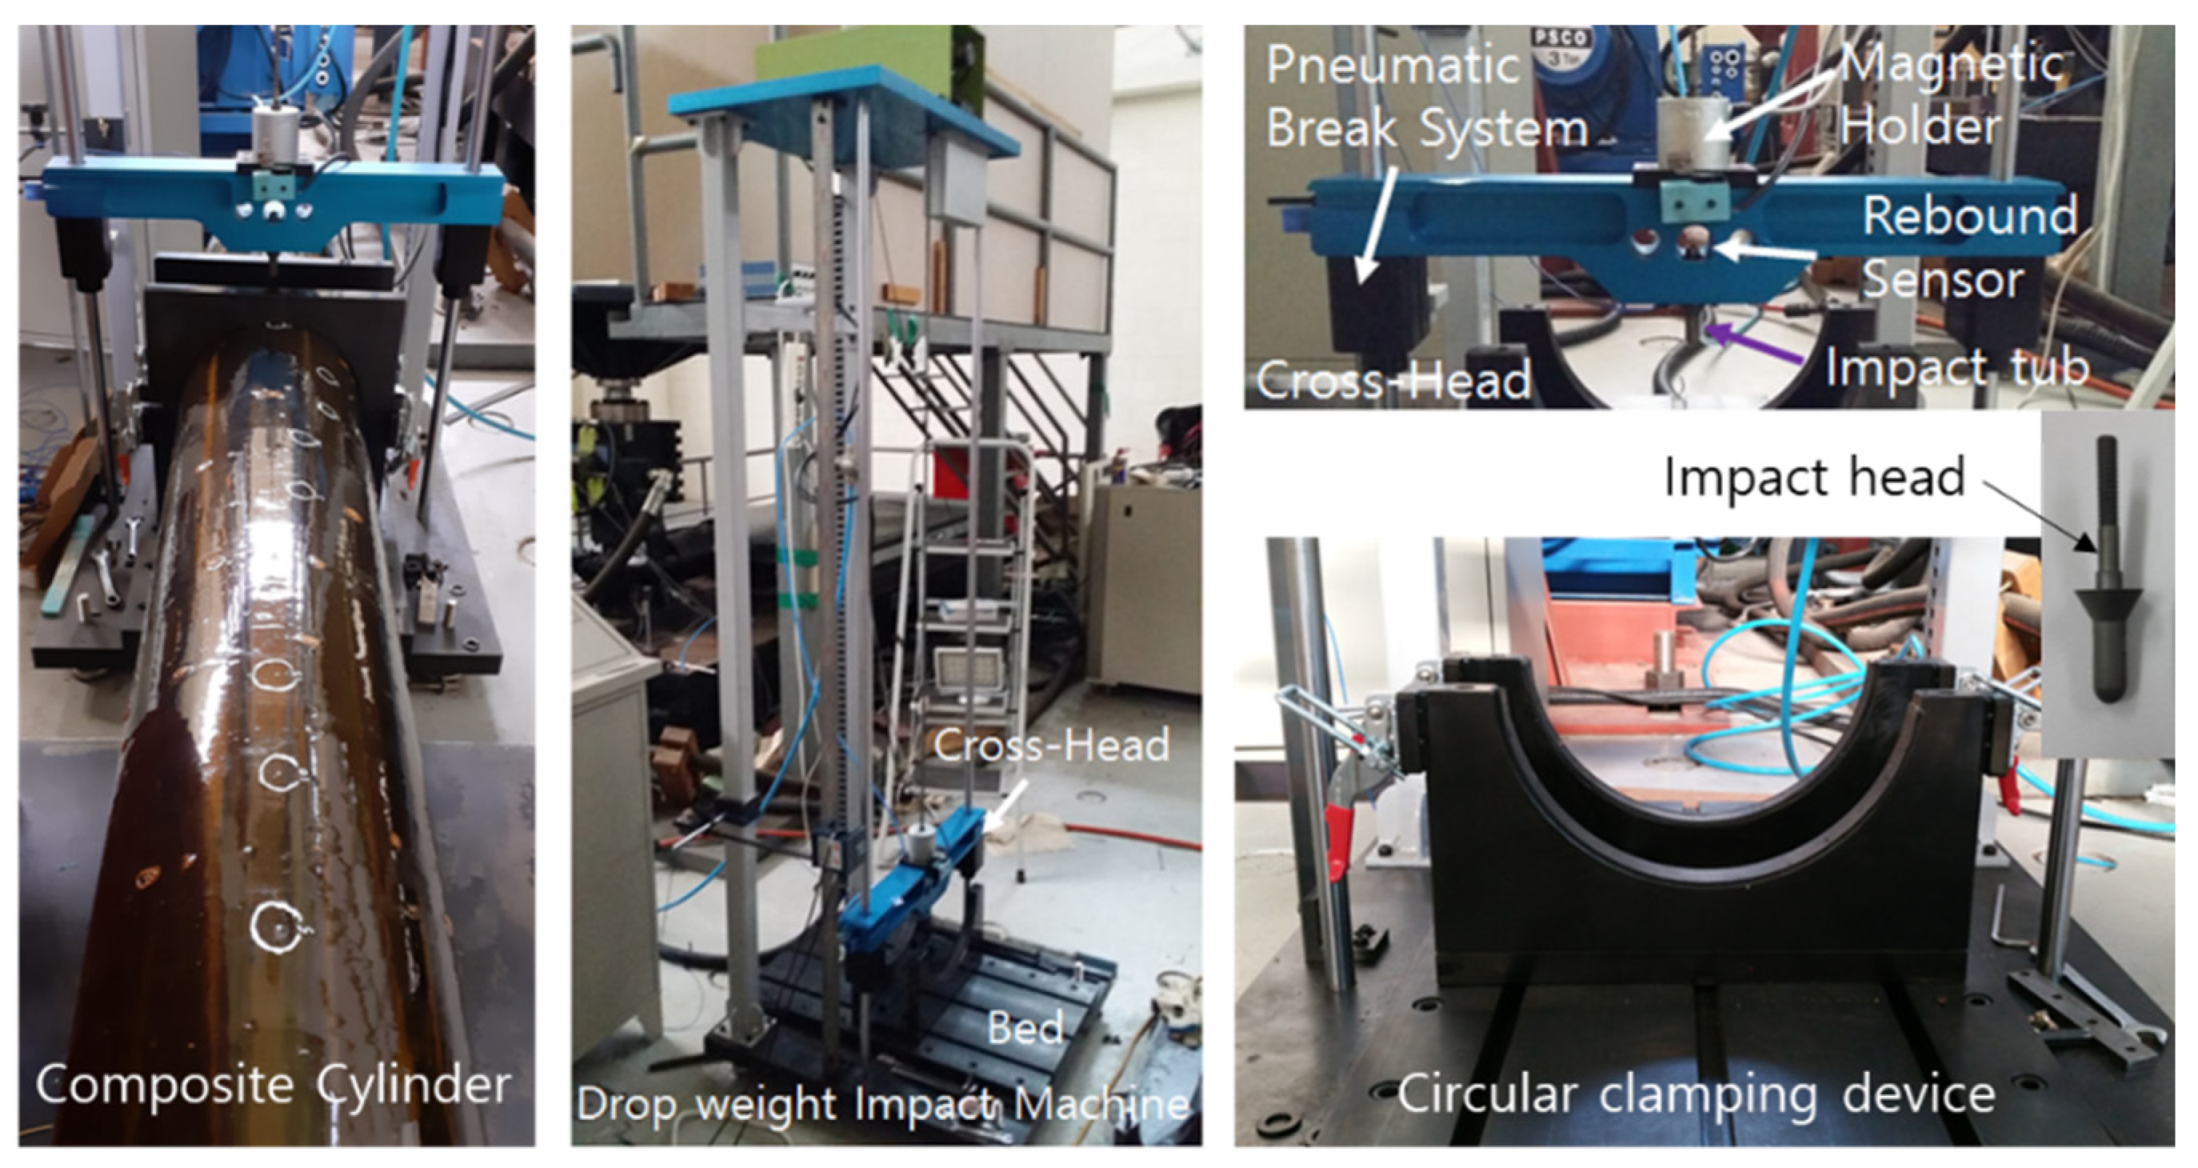
4. Damage Detection Results by TD-BOCDA Sensor System
Impact events of four different energy levels from 5 J of the lowest energy to 10, 15, and 20 J were applied to the composite cylinder with optical fiber embedment. These four impact events were repeated three times. Thus, a total of 12 impact events were applied to the cylinder. Even the largest value of 20 J caused an impact on the cylinder that was weak enough to cause BVID.
Figure 3 shows that a drop weight impact machine was used for these impacts. The figure shows that the cylinder is firmly held by two external circular clamping devices in the machine, and the blue bar lying horizontally above these clamping devices contains an impactor. When the impactor hits the surface of the cylinder, the effect of each impact event is limited to a 12 cm section between the two circular clamps. The tip of the impact is hemispherical with a diameter and length of 12.7 and 25 mm, respectively. This blue bar with an impactor is controlled by a brake system to prevent multiple bounces after impact. The white circles mark the locations where the impacts are be applied.
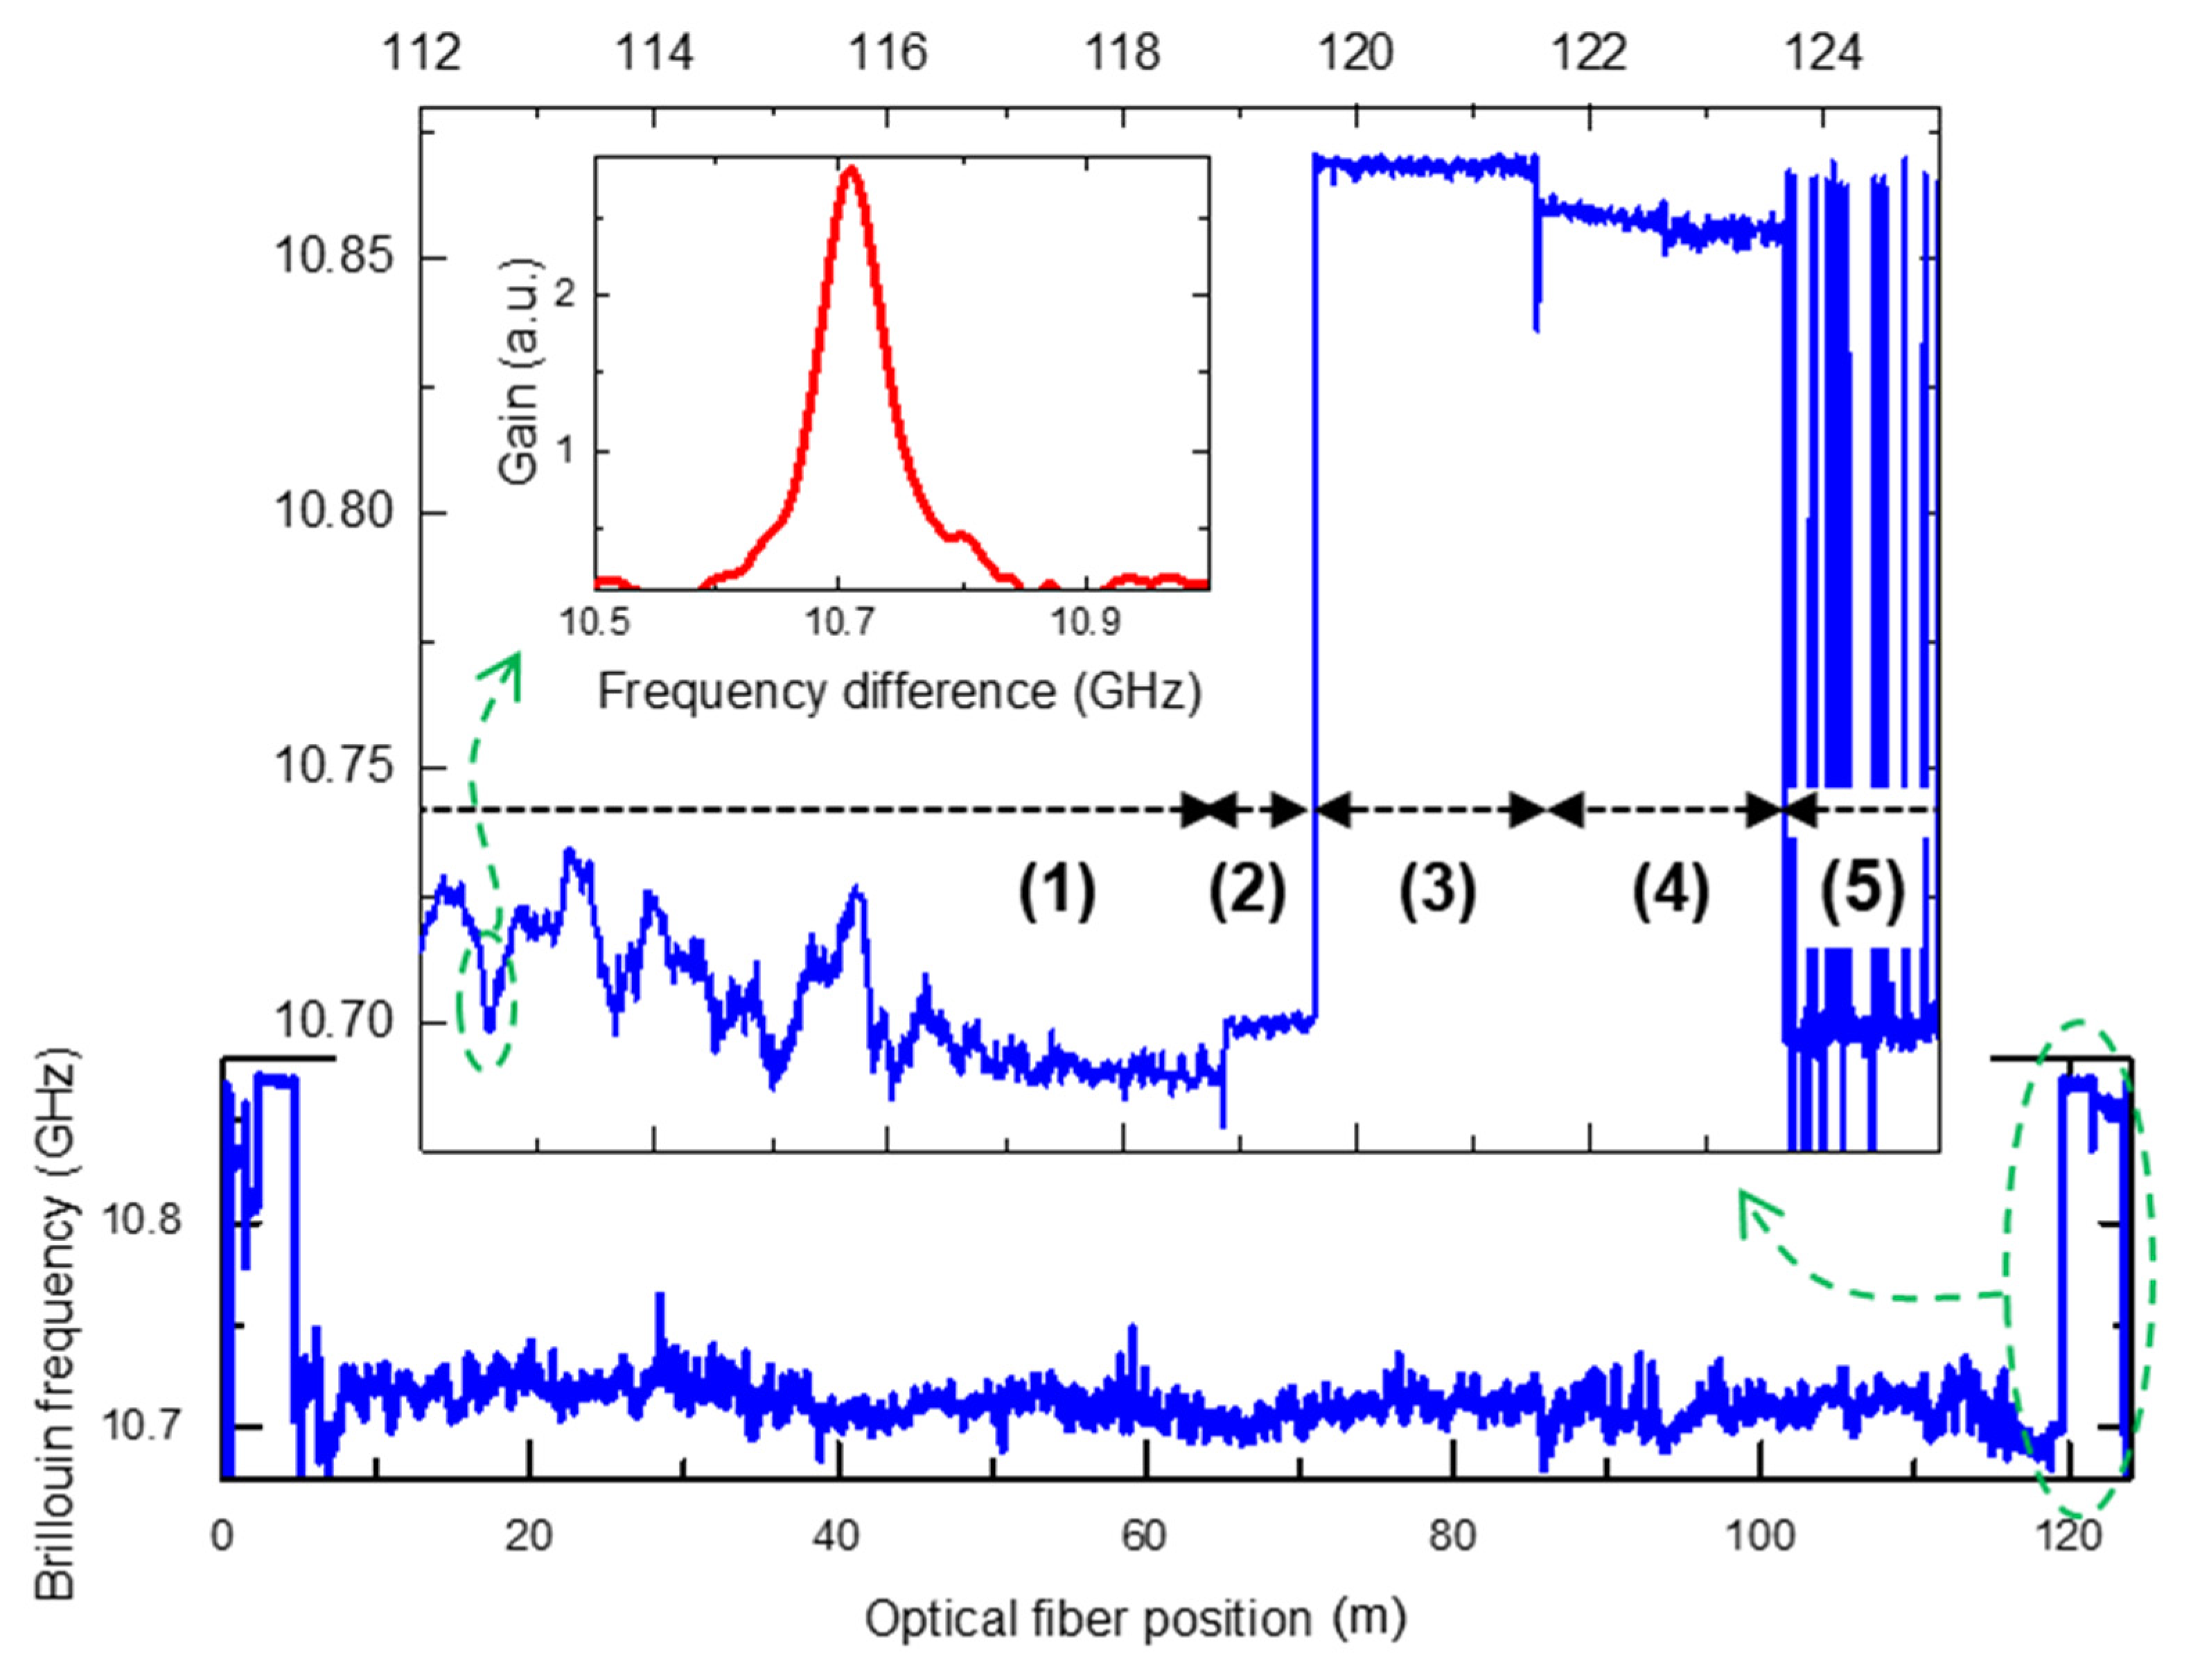
To measure the strain caused by the impact machine, the Brillouin frequencies of the optical fiber before and after impact should be compared. Therefore, first, before the impact events, the Brillouin frequency at each position of the composite cylinder was measured using the TD-BOCDA sensor system of 16 Gbps phase modulation. The frequency difference between the pump and the probe was scanned from 10.5 to 11 GHz. The inset in the top graph of
Figure 4 shows the Brillouin frequency as the peak frequency for the highest SBS gain that was obtained at each fiber location. The Brillouin frequency is an intrinsic characteristic of the optical fiber that is determined by the manufacturing conditions and materials used. This intrinsic frequency changes with the stress applied to the material.
Figure 4 shows that the changed frequency was measured throughout the whole fiber locations of 125 m. The top graph enlarges the dotted circle area on the bottom graph, which corresponds to one end of the cylinder at around 120 m. The inset in the top graph shows the Brillouin gain spectrum around this end, where the horizontal axis is the frequency difference between the pump and the probe, and the vertical axis is the Brillouin gain in arbitrary units. The peak frequencies were collected from the spectrum measured at each location, and
Figure 4 plots them as the Brillouin frequency graph. These measured frequencies on the top graph are divided into five segments for explanation. These segments clearly show the conditions of the sensing optical fiber. Up to segment (1), the sensing fiber is embedded in the composite cylinder. The bottom graph shows that the frequency significantly fluctuates throughout the whole embedded region. This is because, during the filament winding process of embedding the optical fiber, the tension applied to the optical fiber was not uniform, so that the optical fiber was installed inside the cylinder under different tension states according to the location. The frequencies of segment (2) confirm this explanation, where the optical fiber exits the cylinder to connect to the BOCDA sensor system. There are no winding tensions in the fiber, so the frequencies in this segment show the uniform value of 10.7 GHz, as in the graph in the inset of the top graph. This segment is 70 cm, which exactly corresponds to the length of the optical fiber exposed outside the cylinder. Segment (3) shows the frequencies from another SSMF that is spliced to the optical fiber of the cylinder. This fiber in segment (3) is produced by a different company than that of the SSMF embedded in the cylinder, and so the Brillouin frequencies of the two SSMFs are quite different. Segment (4) shows the frequencies for another different SSMF attached to an optical isolator, which was explained as the end of the sensing fiber in
Figure 2 of the experimental setup. Its manufacturing company is also different, and so the frequencies differ from those of segments (2) and (3). At the border of the segments (3) and (4), there is a sharp frequency shift. This shift to low frequency means that compression stress was applied to this location. At its real position, an adaptor for fiber connecters was used to connect these two different SSMFs, and the adaptor mechanically applies a compressive force to the optical fiber at this position. This result means that the TD-BOCDA system can detect the optical fiber adaptor points. In segment (5), the frequency is not specified. This is because, due to the isolator, the pump can no longer propagate to this segment, so there is no peak gain frequency, but only noise.
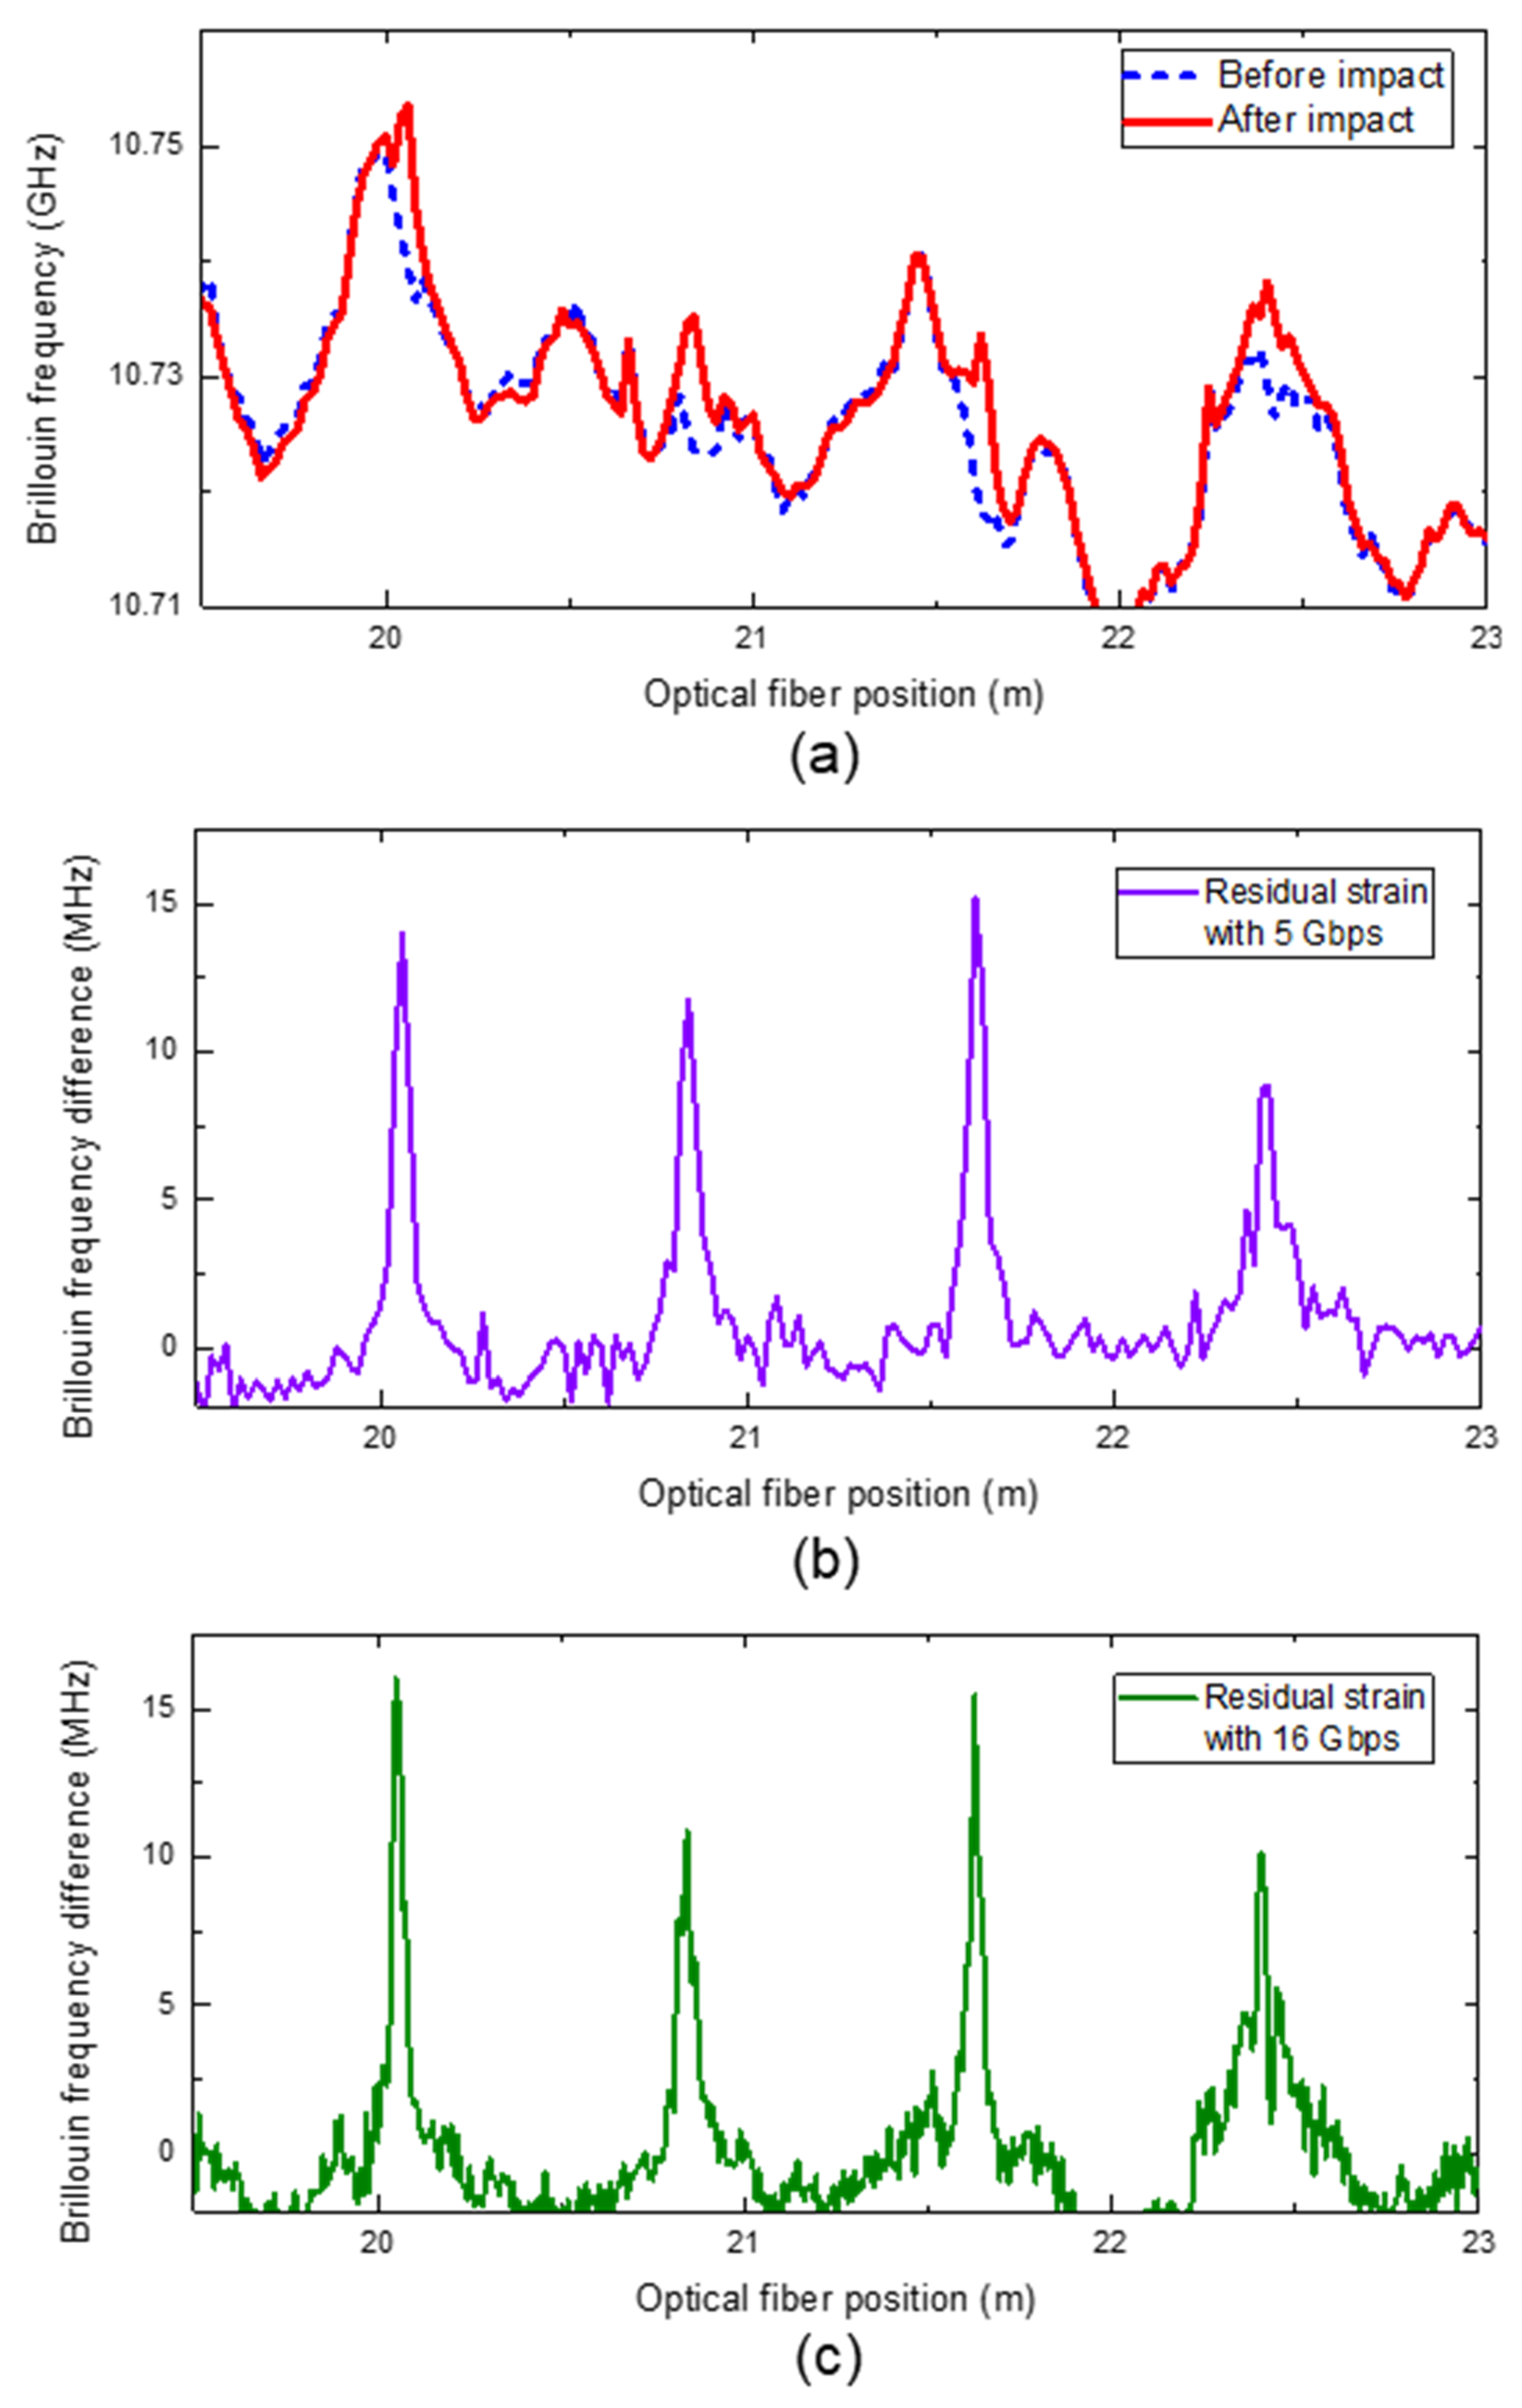
The Brillouin frequencies after impact events were also measured, and the top graph of
Figure 5 plots the frequencies before and after impact as solid and dashed lines, respectively. The graph is enlarged for the position of around 21 m out of a total of 125 m, and this is the position impacted by 20 J. The Brillouin frequency difference was measured using three different phase modulations of 5, 10, and 16 Gbps, which correspond to the spatial resolutions of 20, 10, and 6.25 mm, respectively. When the resolution is varied, nothing in the experimental setup needs to be changed. This is the very strong advantage of our TD-BOCDA system. For the conventional BOCDA systems, in order to change the spatial resolution, the optical delay line has to be replaced; moreover, the real fiber location has to be recalculated for the changed phase modulation rate. However, for the TD-BOCDA, no optical delay is needed, and the fiber location only needs to be transferred to their points according to other modulation rates. The middle and bottom graphs give the difference between the two Brillouin frequencies before and after impact for the 5 and 16 Gbps modulations. The peaks in the graphs show the effects after external impacts. These shifts to higher frequency mean that the expansion deformation remains at the impact point. The intervals between these peaks in the graphs are exactly 786 mm, which corresponds to one circumferential turn of the embedded optical fiber around the cylinder. The linewidth of the peaks in the graph with 16 Gbps modulation is much narrower than that in the graph with 5 Gbps, because the graph with 16 Gbps has more resolvable measurement points than that with 5 Gbps.
These one-dimensional measurement points in
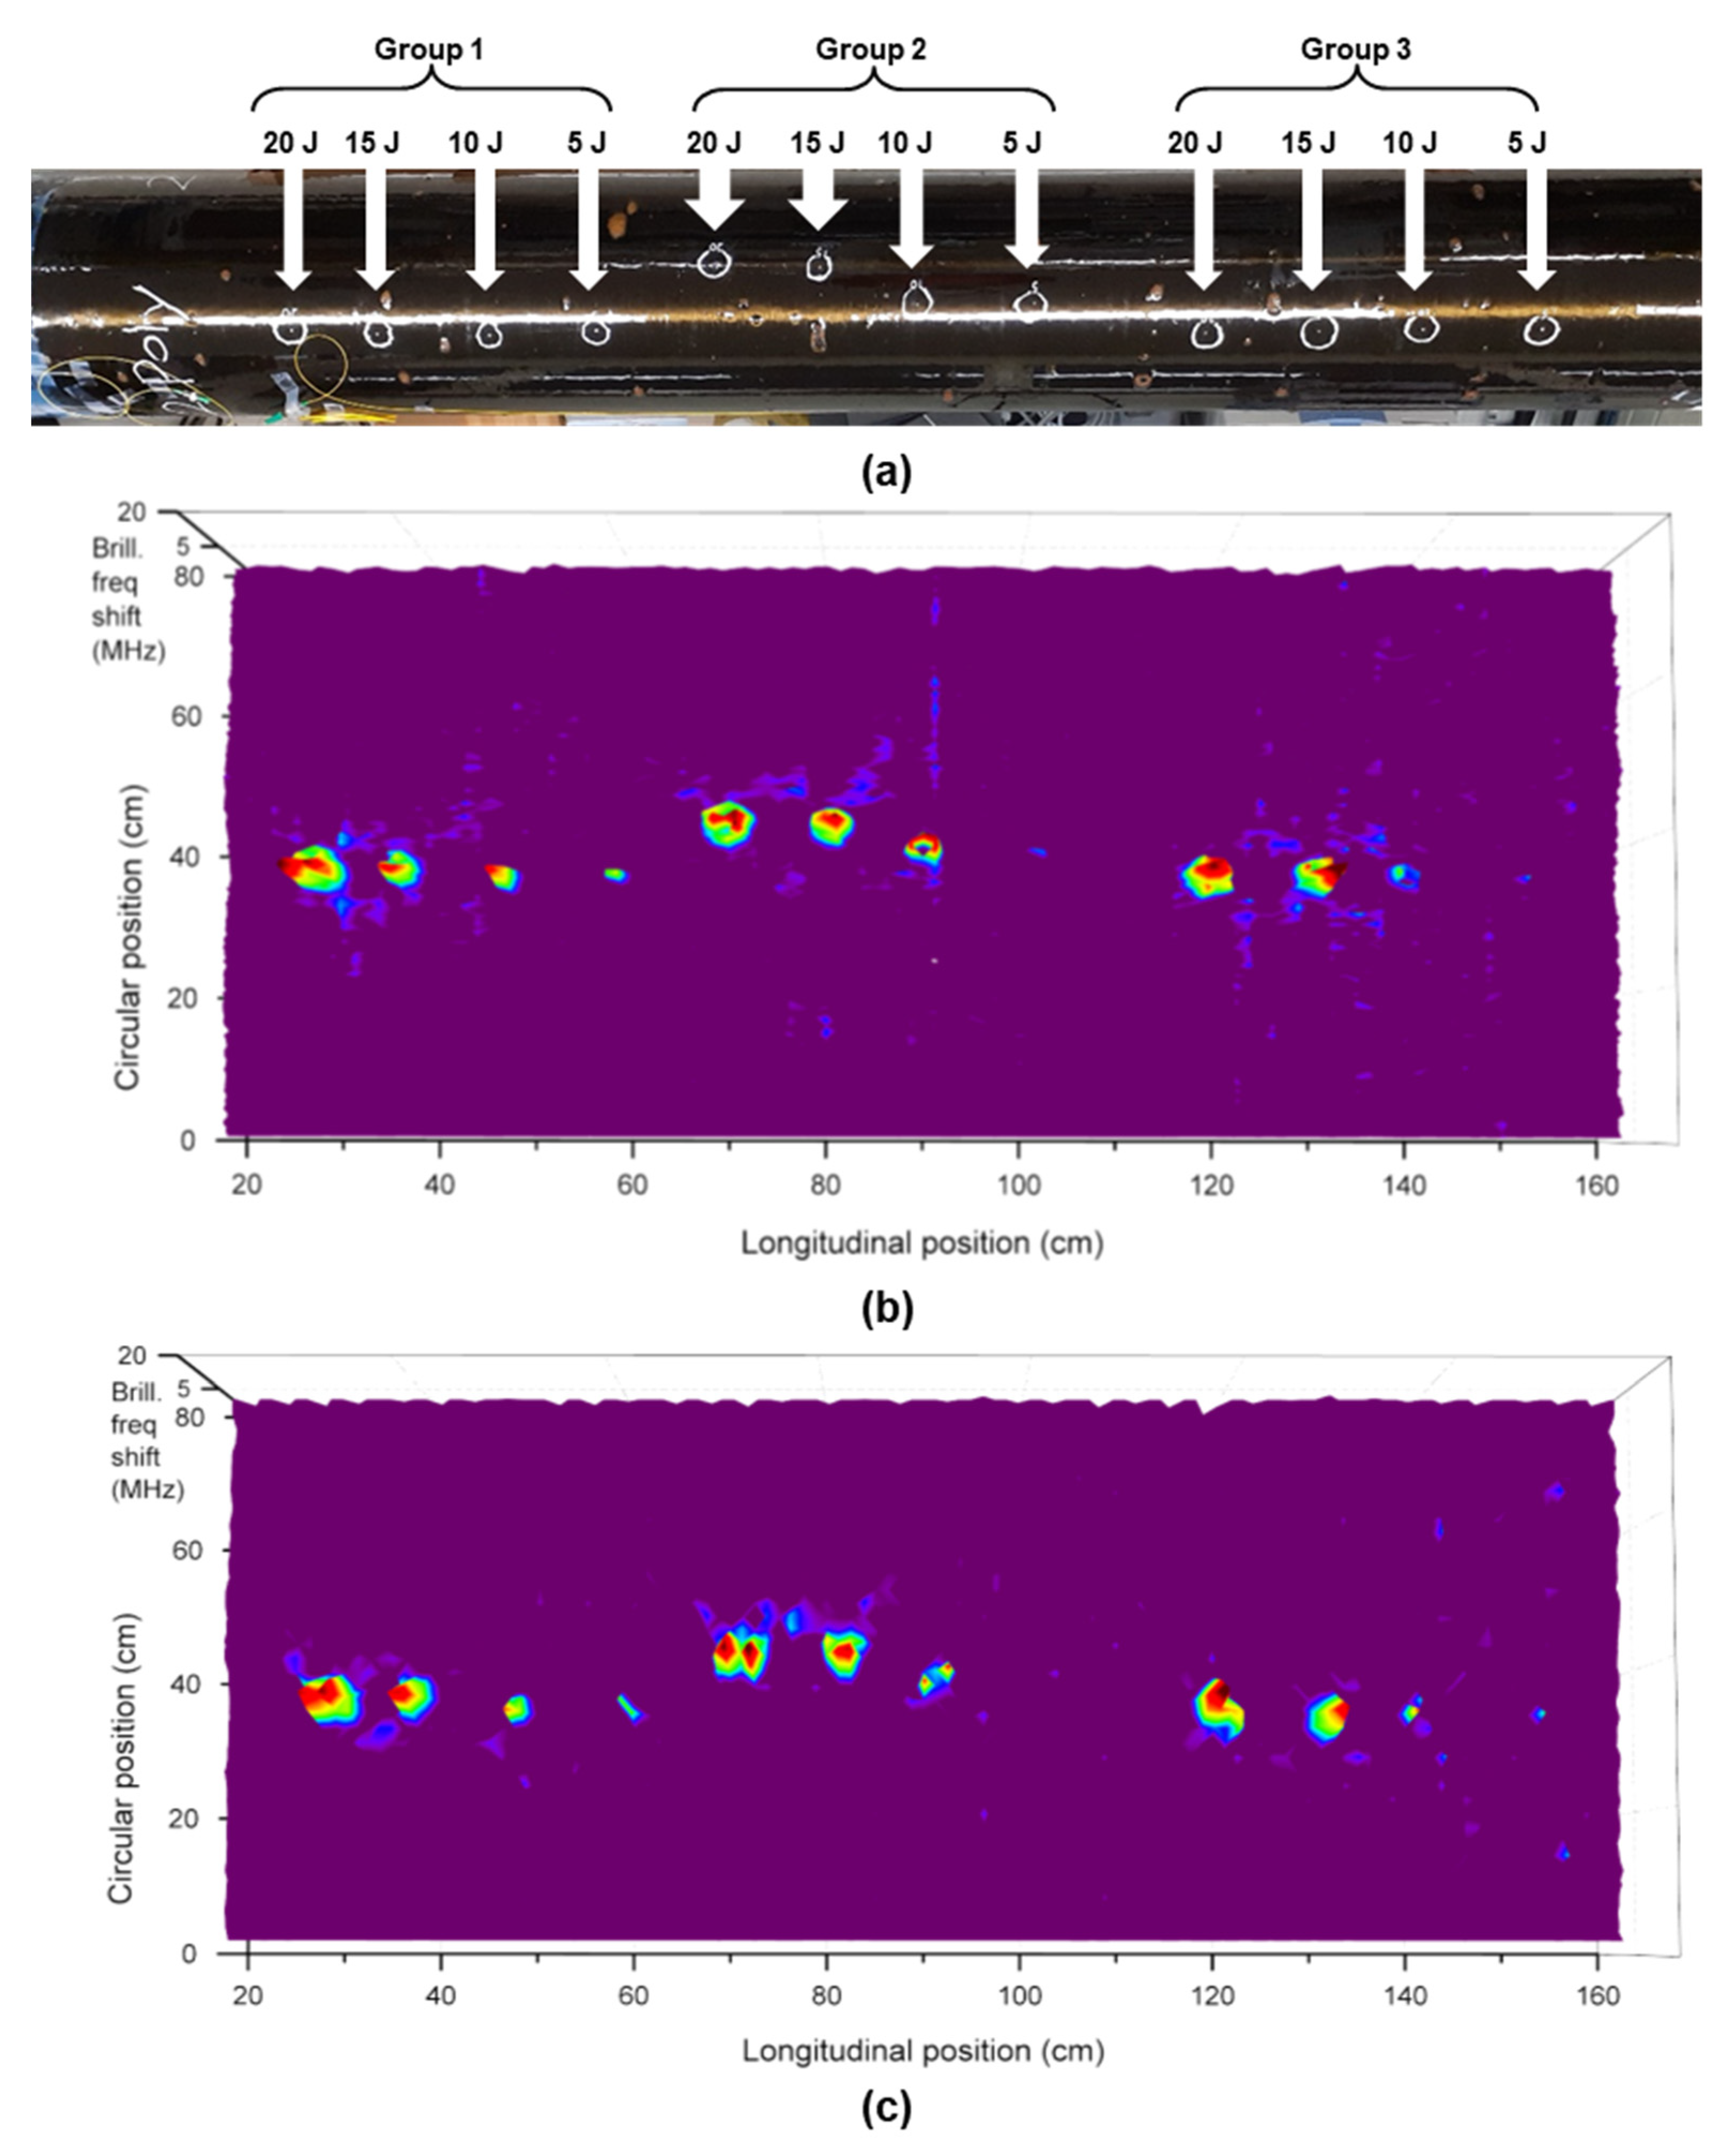
Figure 5 were cut into 79 cm segments of the length of the cylindrical circumference, and
Figure 6 rearranges them along the vertical axis of the graph, so this figure realizes the damage map for the cylinder surface of 80 cm × 190 cm. In
Figure 6a, the photo of the cylinder and the points of impact on its surface are marked with white circles, and the amount of impact applied to each point is also marked on the circles. The impact group of 5, 10, 15, and 20 J was repeated three times, as previously mentioned.
Figure 6b shows the damage map with 16 Gbps measurement. The graph means that the frequency shift increases from purple to red in the order of the colors of the rainbow. All impact points are clearly visible, except for the 5 J impacts in groups 2 and 3. These two points had insufficient damage area in the two-dimensional view, but could be confirmed in the one-dimensional frequency graph. These 5 J measurement results indicate that the system’s signal-to-noise ratio needs to be further improved if it is required to detect residual strain of less than 5 J. An important topic in future research will be to increase the accuracy of measurement of the residual strain for impact energy of less than 5 J and obtain its high-resolution damage image. Almost all impact points lie on one horizontal axis, but two impact locations for the 15 and 20 J impacts in groups 2 are off the axis in the cylinder photo. The randomness of these positions is clearly measured in the damage map. For comparison,
Figure 6c shows the damage map with 5 Gbps modulation. In this figure, all the impact points are well measured, so the two maps look broadly similar.
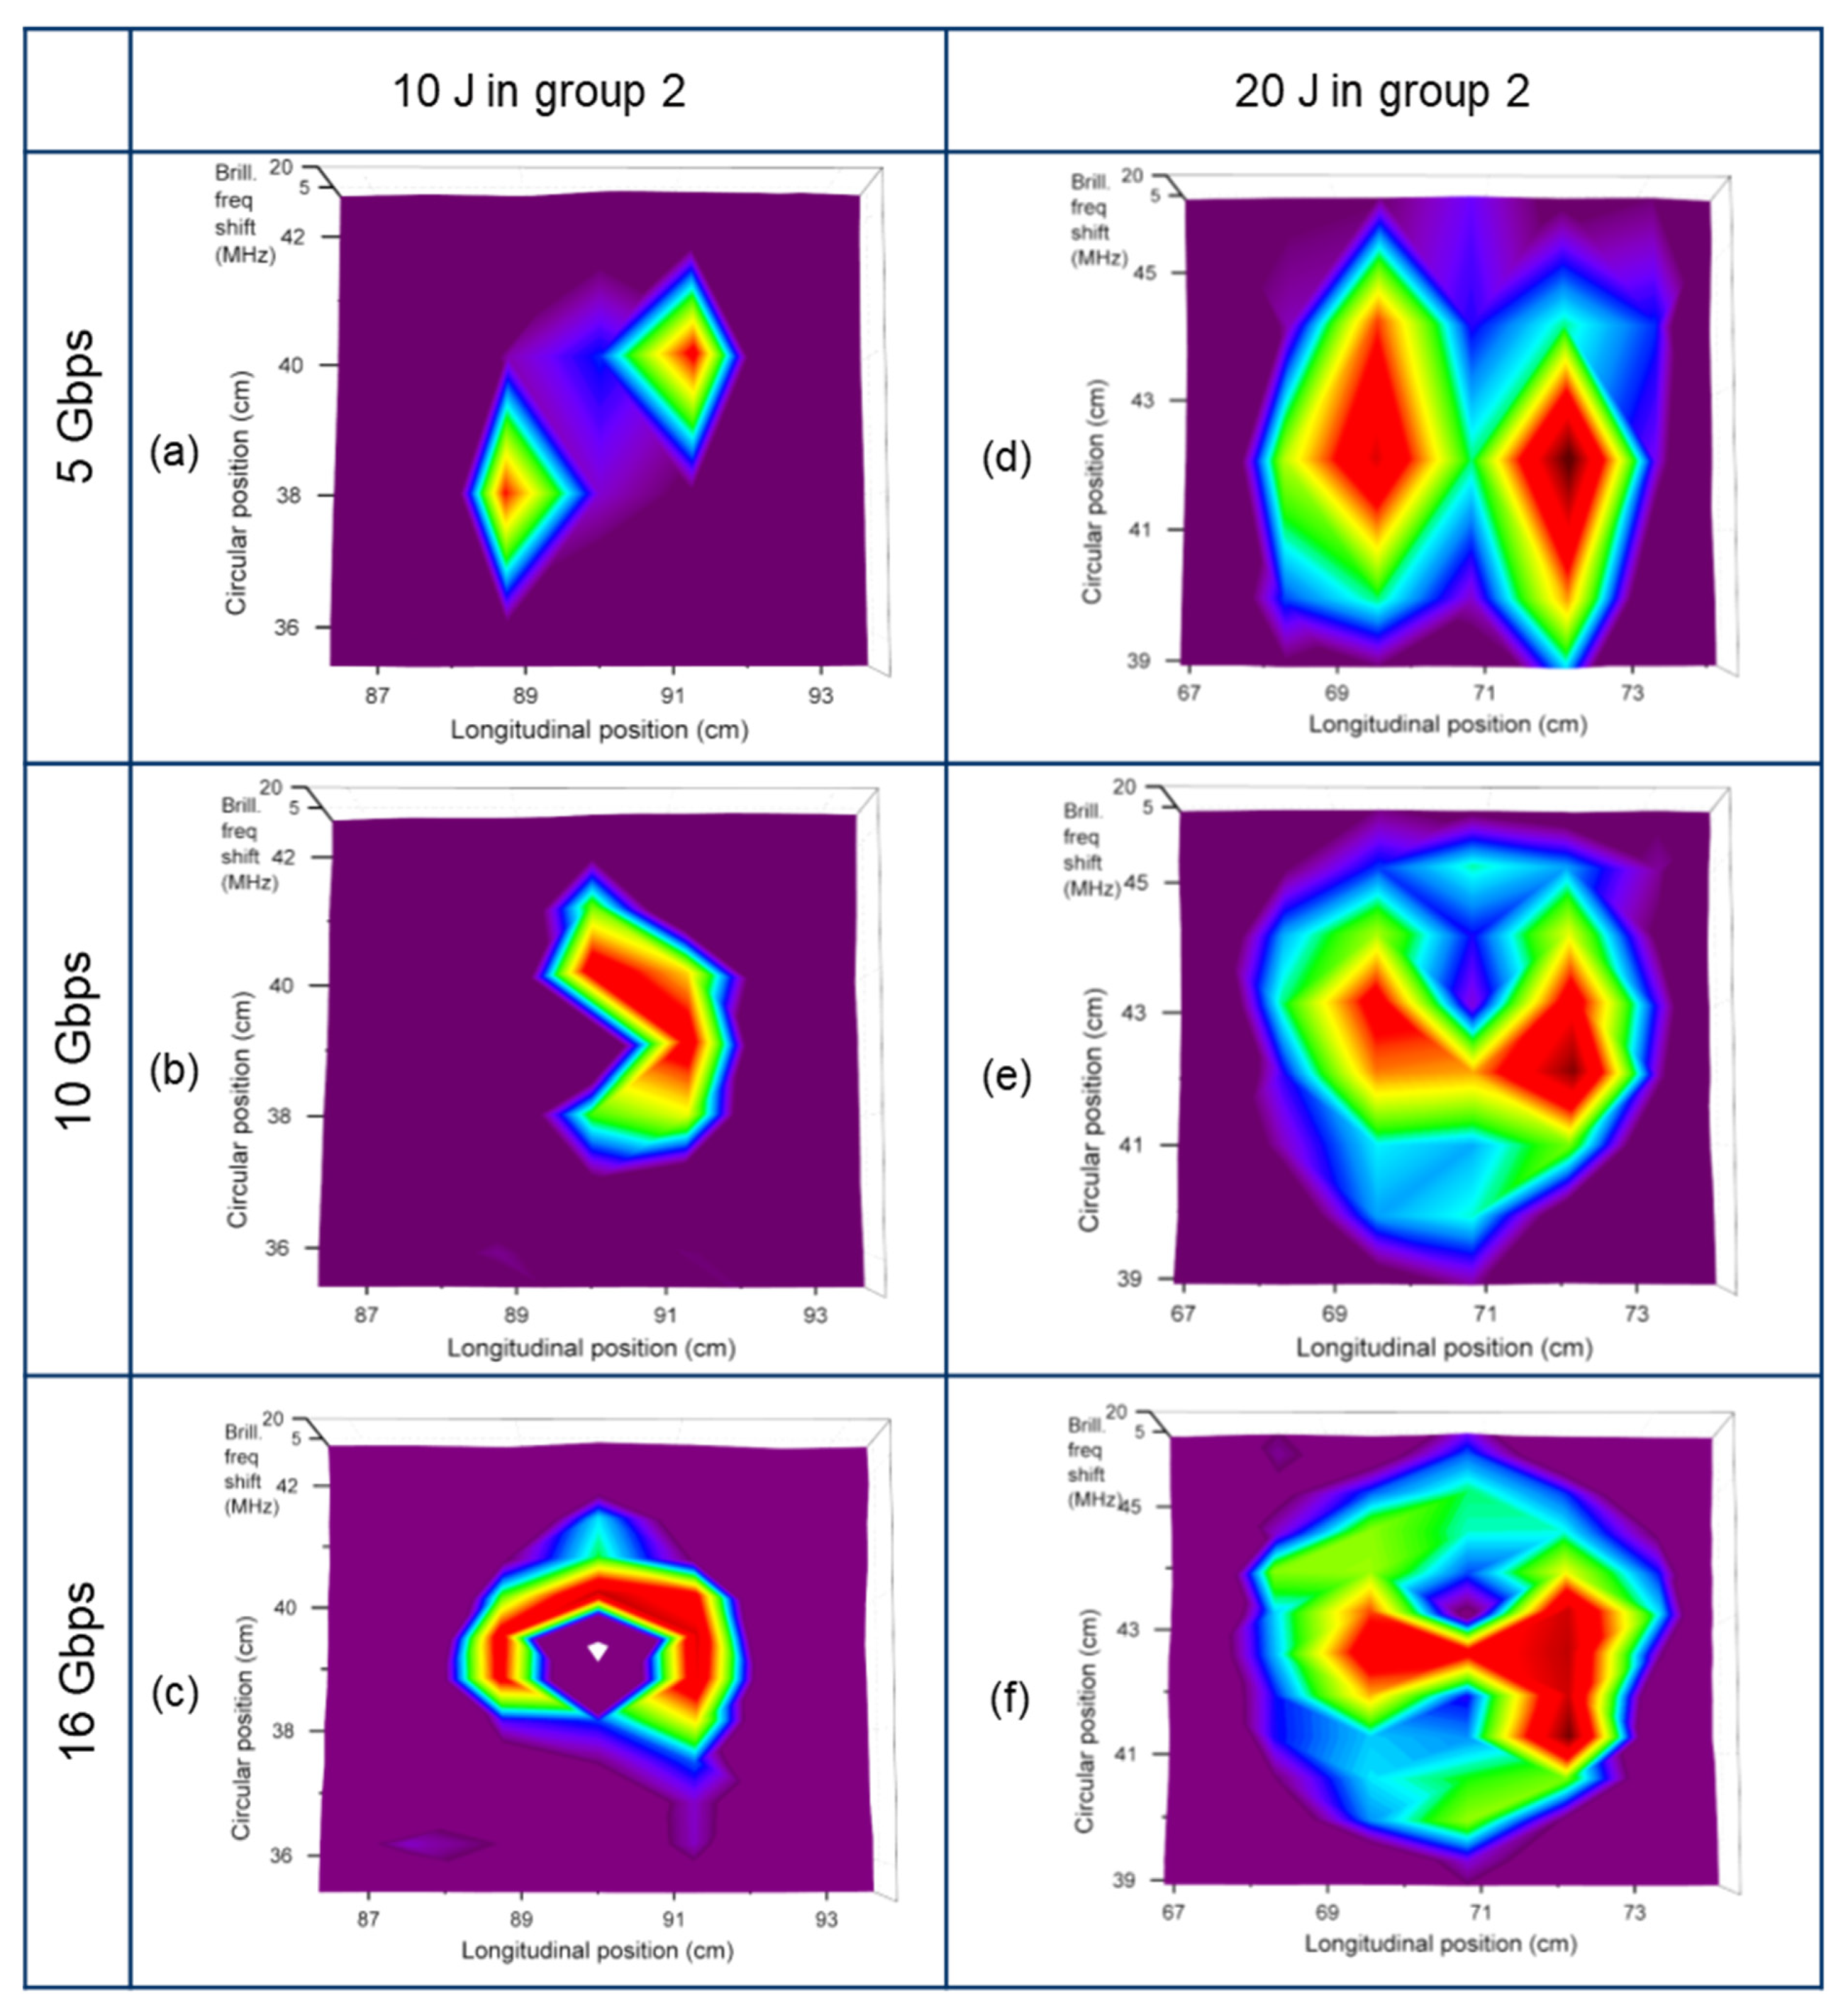
Figure 7 compares the damage maps for the 10 and 20 J impacts in detail, according to the modulation rate. In these six maps, the resolution on the vertical axis for the circular position is varied by the modulation rate, while the resolution on the horizontal axis for the longitudinal position is independent of the rate. The maps all have the same unit scale for both axes. For the 10 J impact in group 2, map (a) of 5 Gbps does not show a sufficient two-dimensionally symmetric damage image, but as the resolution increases to 16 Gbps, a circularly symmetrical damage map is clearly evident. Considering the hemispherical tip of the impactor, point symmetric damage is expected, and the map of 16 Gbps, which has the highest resolution, shows this well. The same trend is also seen for maps (d)–(f) of the 20 J impact. The definite difference between the 10 and 20 J maps (comparison between (a)–(c) and (d)–(f)) is in the size of the damaged image, which means that the large impact left a larger deformation. The multi-circle structure shown in the 16 Gbps maps suggests that the expansion deformation did not occur linearly with respect to the center of the circle.
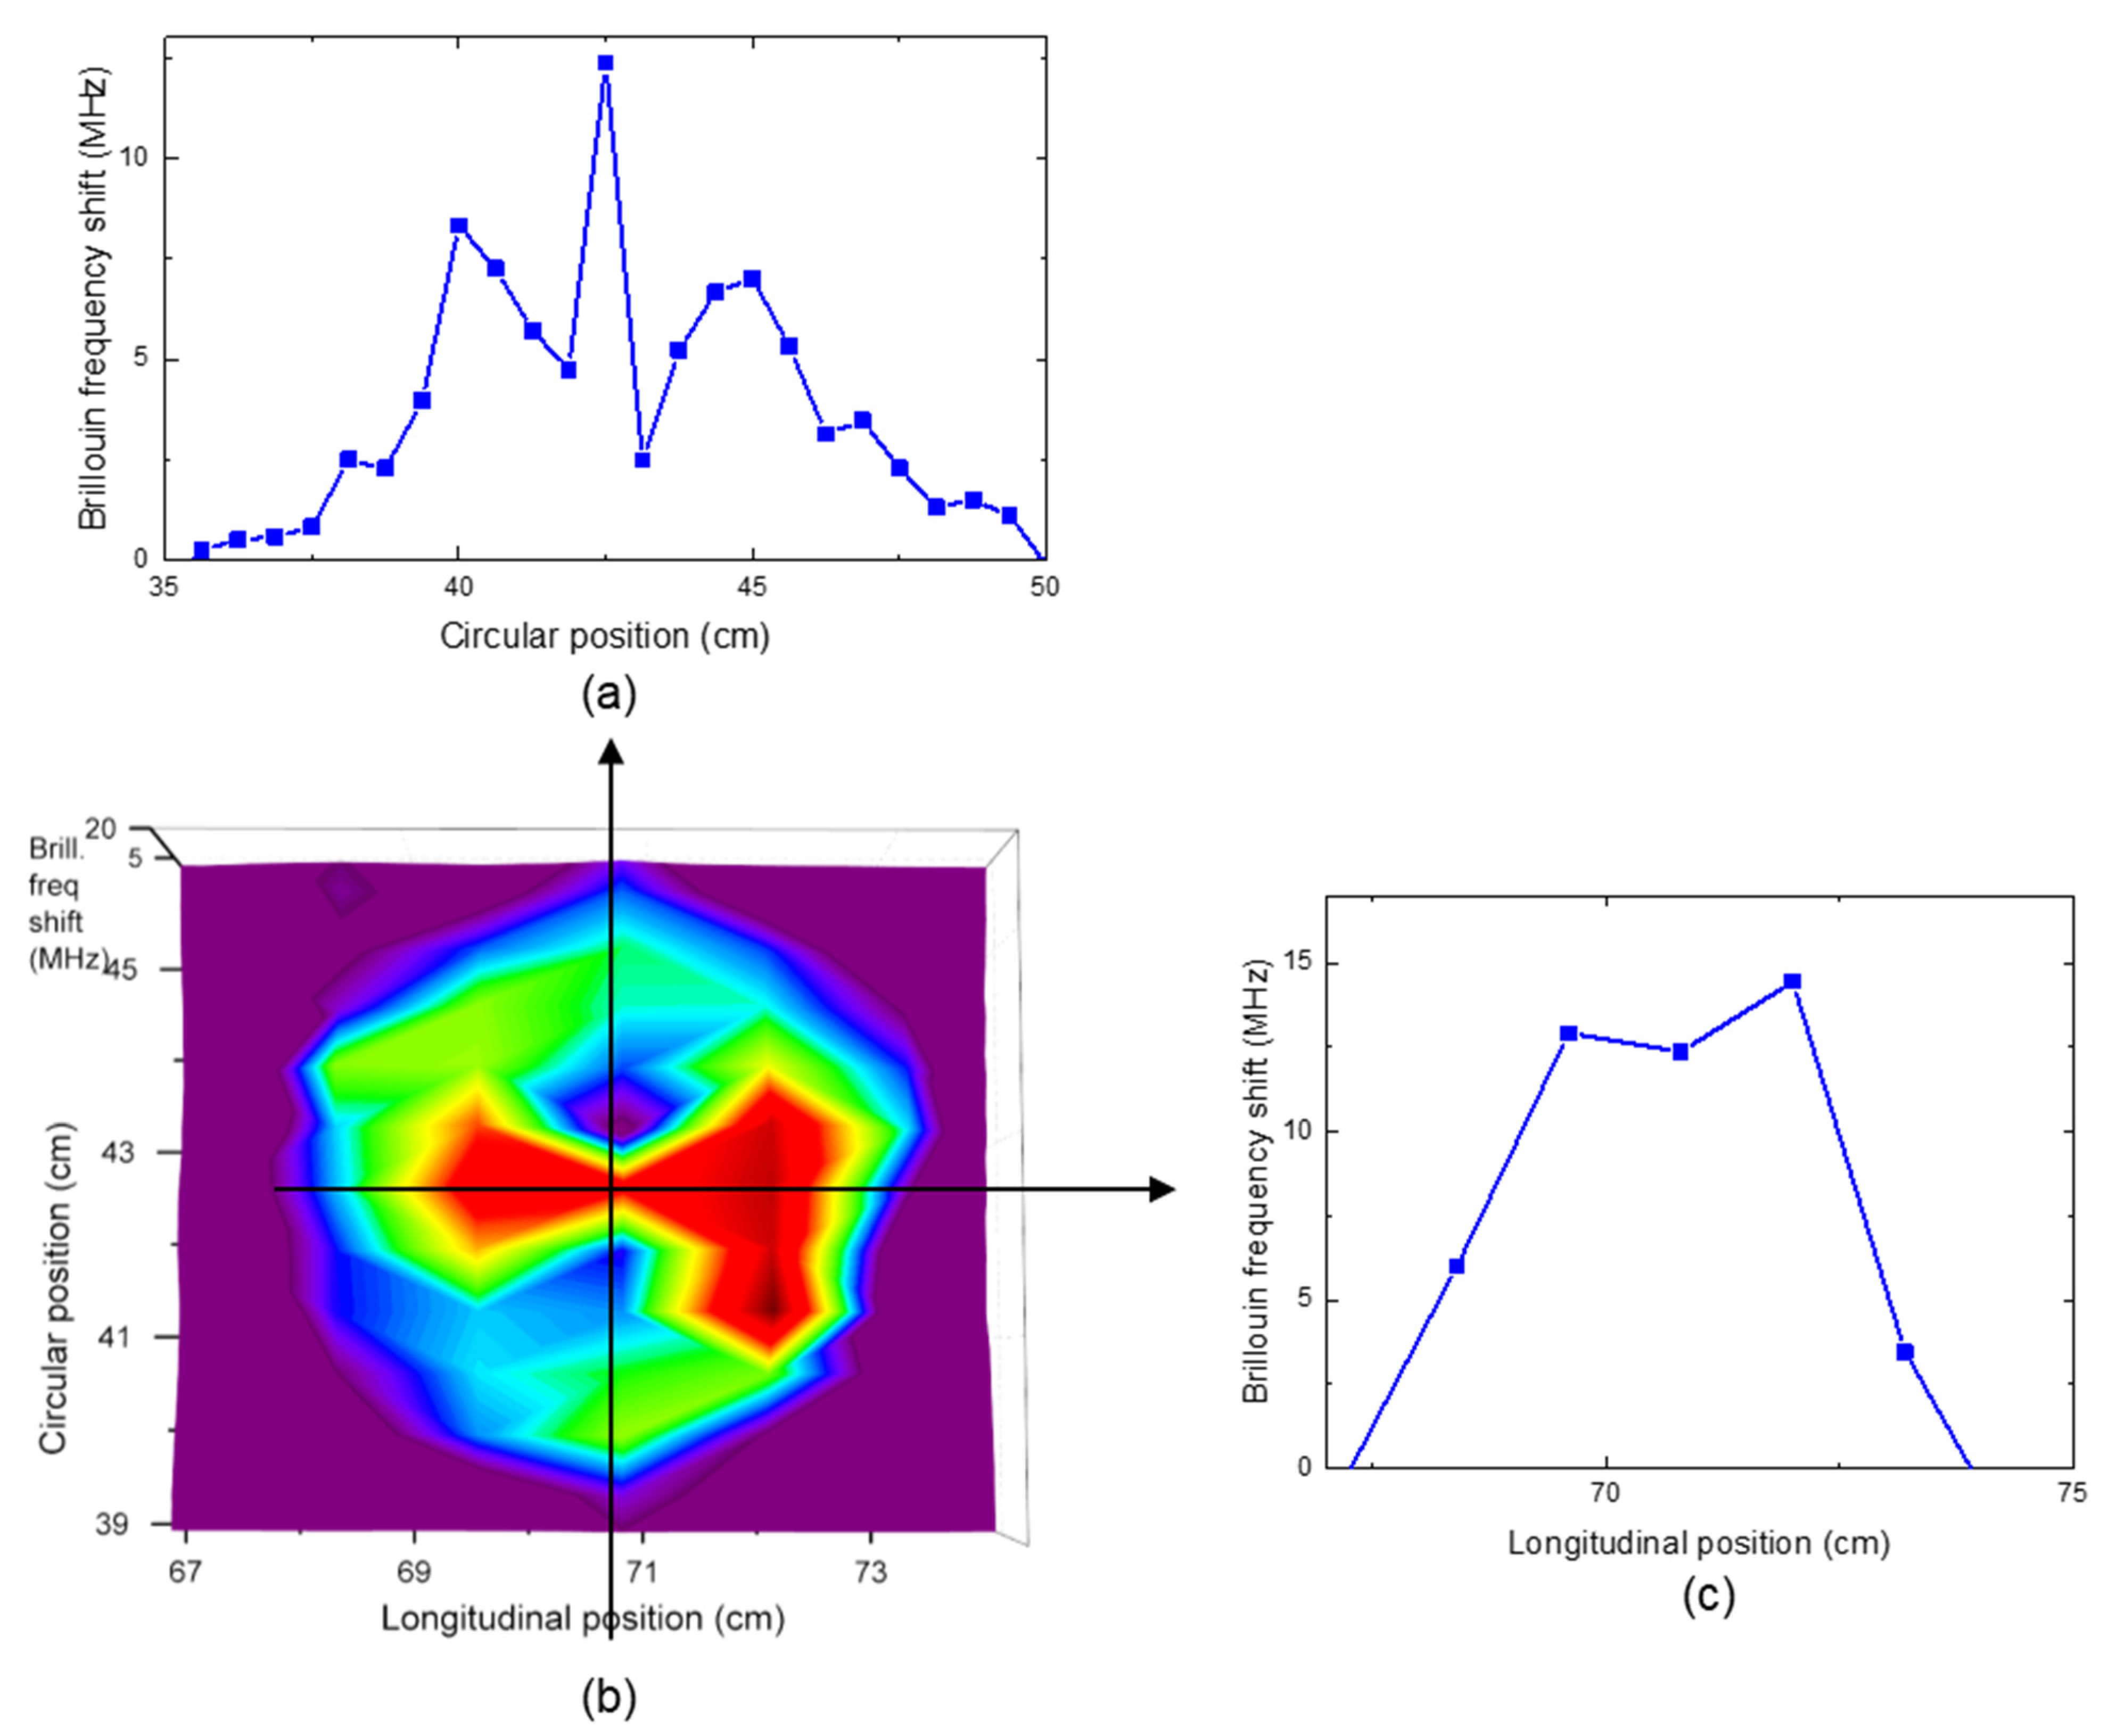
To confirm this,
Figure 8 analyzes the 20 J impact map of group 2 with 16 Gbps. The vertical axis for the circular position is about twice the resolution of the horizontal axis for the longitudinal position in the graph of
Figure 8b.
Figure 8c shows the one-dimensional deformation graph of residual strain along the horizontal axis with respect to the center of the circle. This shows that the expansion deformation due to impact is rather decreased at the center point of the circle. This phenomenon is more evident in another one-dimensional deformation graph of
Figure 8a for the vertical axis with high resolution. Both the up- and down-shifts of the Brillouin frequency in
Figure 8a mean that material expansion and compression alternated with respect to the impact point. It is highly interesting that this is very similar to the deformation of the surface of a liquid shaped by a thrown object. Our previous experiment also observed results similar to this phenomenon [
11]. However, in that case, the optical fiber was installed on the composite surface, whereas in this experiment, it was embedded inside the composite. Considering the two experimental results together confirms that the residual strain pattern shown in
Figure 8 extends from the surface to the inside of the composite material.
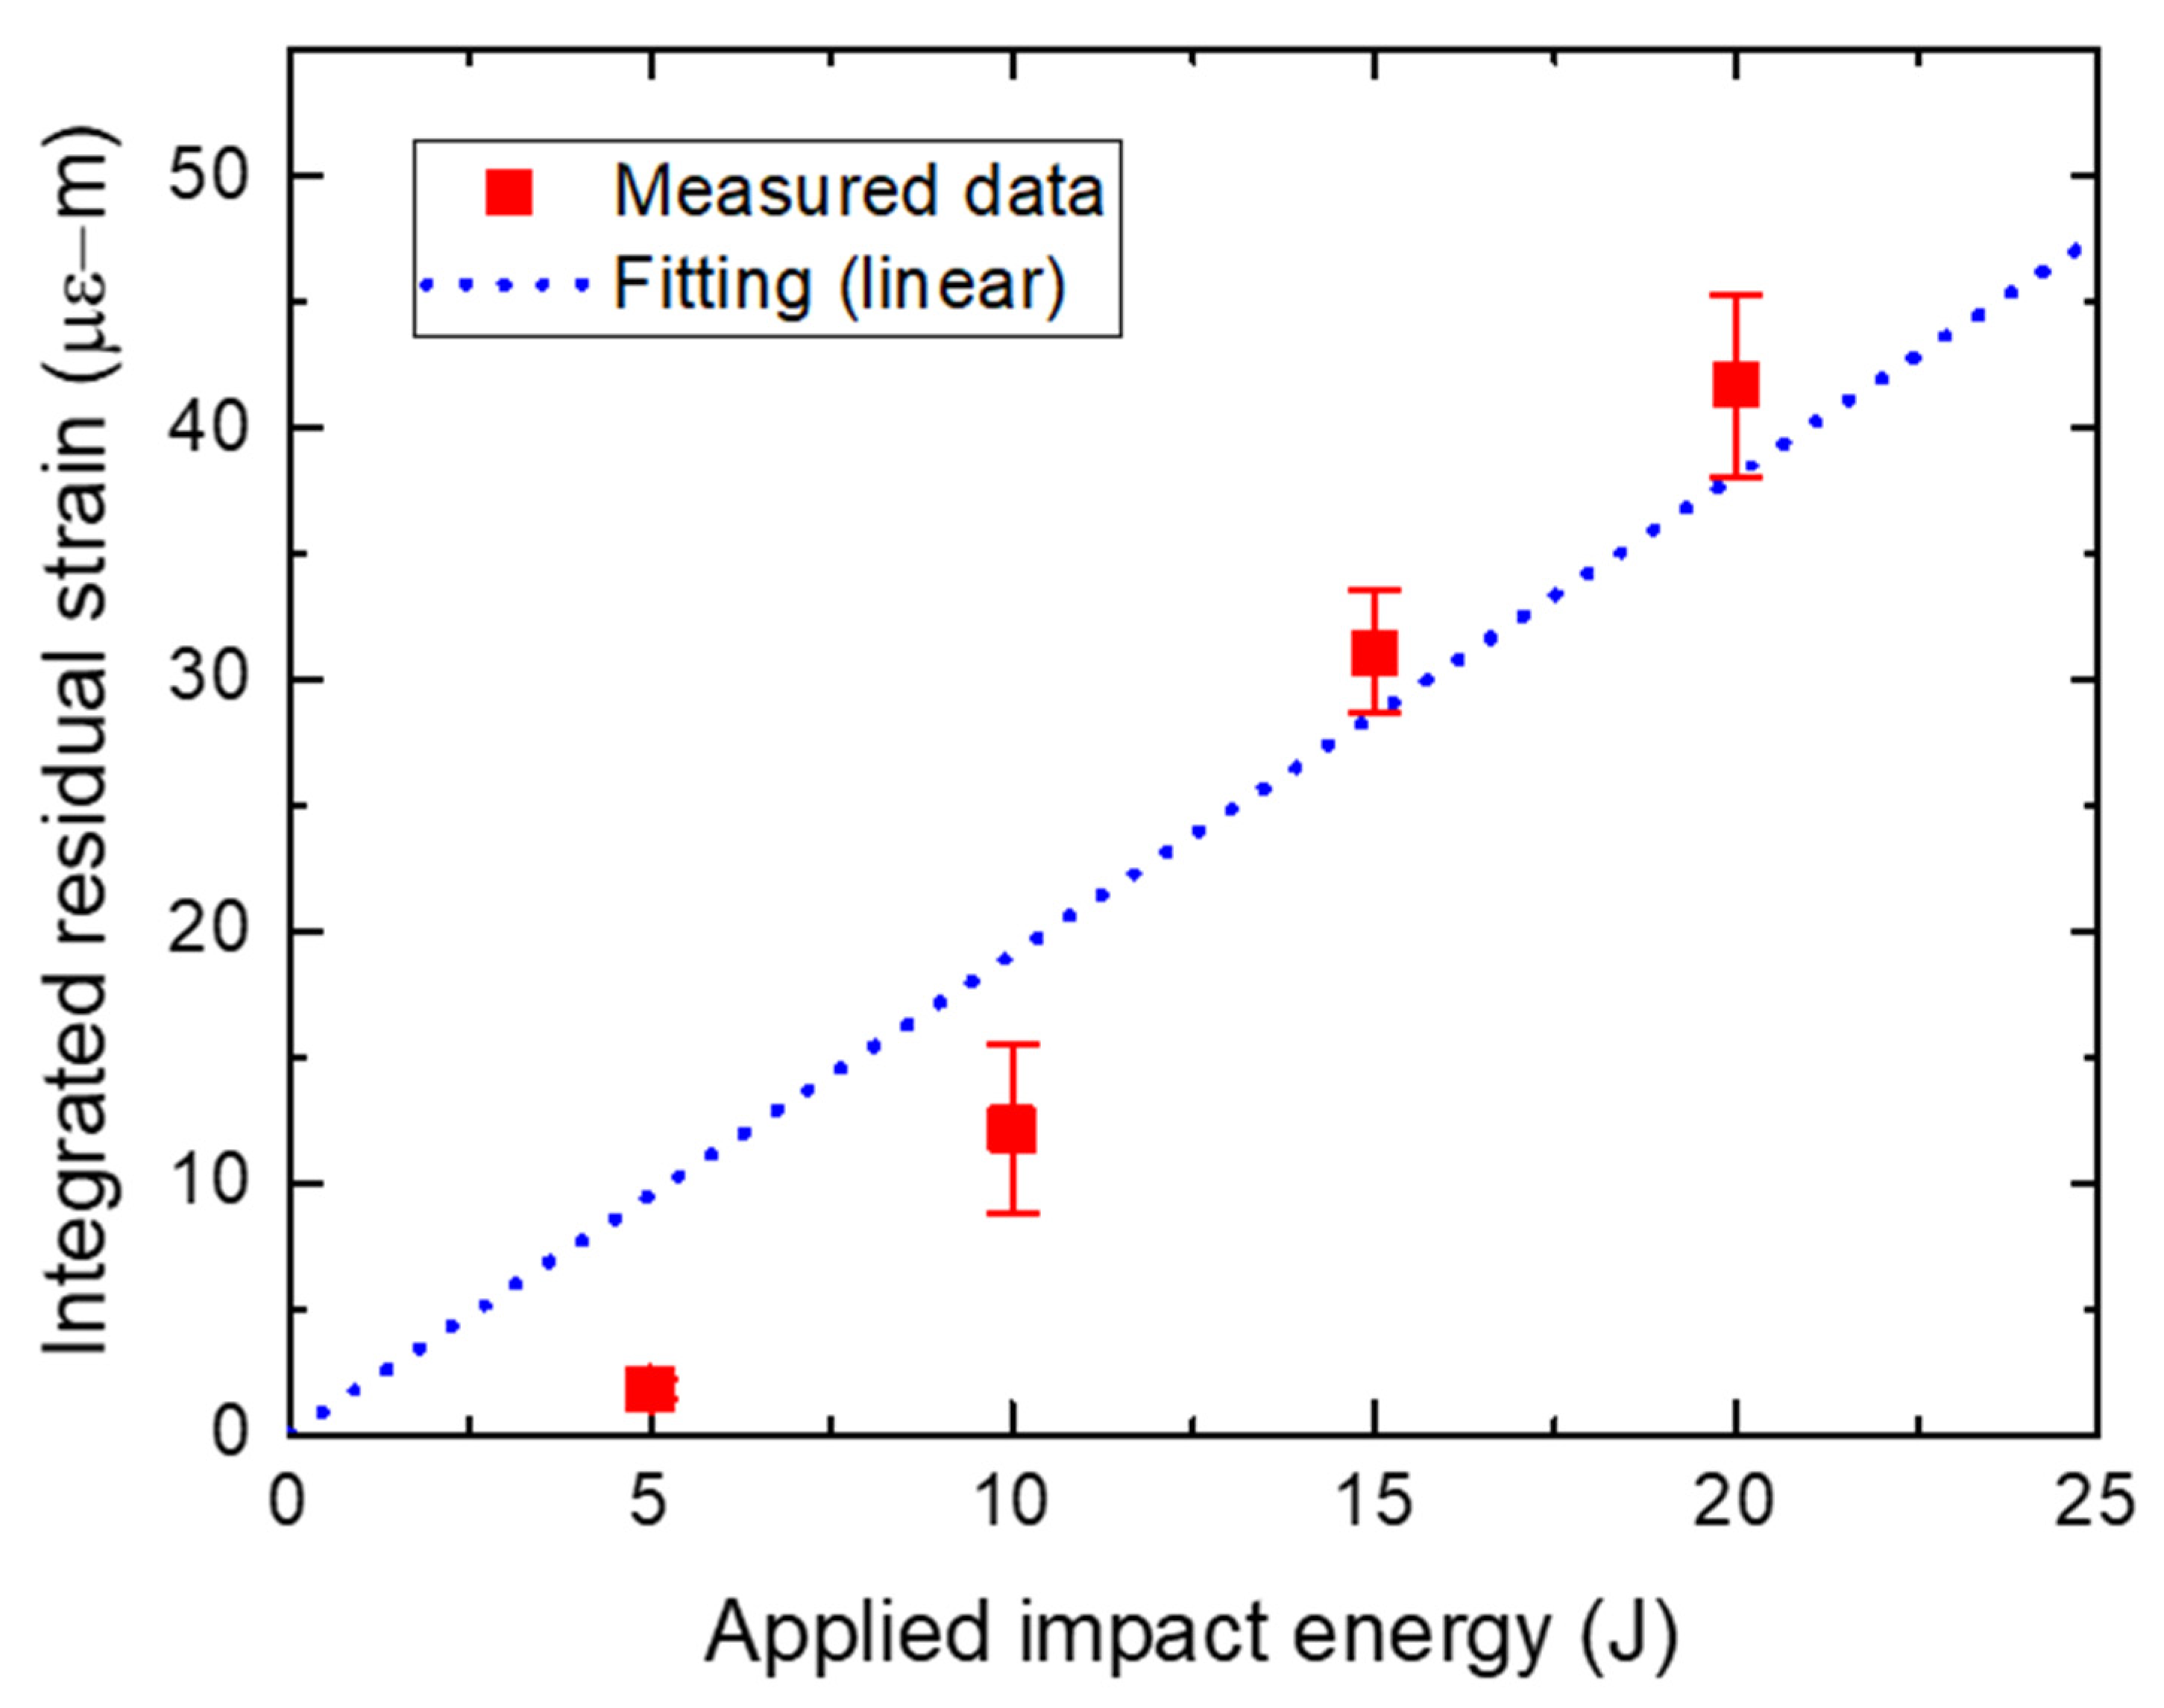
To calculate the total representative amount of residual strain on the impact point, the overall amount of the Brillouin frequency shifts was integrated from the one-dimensional plot on the horizontal axis, and then these values were all added along the vertical axis in
Figure 8b. Using this integrated frequency shift and the proportional coefficient between the frequency shift and strain, the total amount of residual strain was obtained at each impact event.
Figure 9 shows the result according to the impact energy. Because the impact events of 5, 10, 15, and 20 J were repeated three times, each integrated residual strain is shown with the measurement deviation. The graph shows that the total amount of residual strain at each impact point is linearly proportional to the applied impact energy, although as the impact energy is reduced, there is some difference from the fitted proportional line.
5. Conclusions
In order to apply the fiber optic TD-BOCDA sensor system for impact damage detection of a composite cylinder, a composite cylinder with an embedded optical fiber was fabricated through the filament winding process so that the optical fiber was positioned between the 90° hoop carbon layers to have an interval of 12 mm in the longitudinal direction of the cylinder. The optical fiber was wound 160 turns around the circumference of the cylinder, and the total straight length was about 125 m. The residual strain in the cylinder was measured using the proposed TD-BOCDA sensor system. Both the optical pump and probe in the system were phase-modulated in this measurement system using the same pseudo random bit sequence (PRBS) code pattern of 215–1, but with a bit delay relationship between the two. Modulation rates of up to 16 Gbps were applied, which was an eight-fold increase over our past optical-fiber-embedded composite experiments. This made it possible to measure a spatial resolution of 6.25 mm.
A total of twelve impact events of 5, 10, 15, and 20 J were applied to the cylinder using a drop weight machine with a hemispherical impactor. Before impact, the Brillouin frequencies of the embedded optical fiber were measured, and the measurements showed well the stress environment of the optical fiber at each location, including different winding pressure and fiber adaptor pressure. After impact, the frequencies were again measured, and the residual strain was obtained using the difference of both the frequencies, and the proportionality constant. The damage images were derived by mapping this residual strain onto the structure of the cylinder. These damage maps were measured and compared using three spatial resolutions of 20, 10, and 6.25 mm. There were no hardware changes in the measurement system, such as needing to replace the optical delay line when changing the modulation rate to adjust the resolution. This is a clear advantage of the proposed system compared to the conventional BOCDA sensor system. The expansion deformation in the measured damage map due to the impact was measured at all impact points, and the impact locations on the map were observed to be exactly the same as their actual locations on the cylinder. As the measurement resolution increased, the damage showed a point-symmetrical shape on a two-dimensional plane more clearly. Furthermore, the total amount of measured residual strain at each impact point was linearly proportional to the applied impact energy.


