1. Introduction
The use of composite materials is expanding in various products, including aircrafts and wind wings. At the same time, the need for nondestructive inspection of defects in composite materials is emerging; studies are underway to detect defects in composite materials by applying existing nondestructive inspection techniques that employ X-rays and ultrasound waves [
1,
2,
3,
4]. THz waves are not suitable for nondestructive inspection of metals due to their high reflectivity. However, they can be used for nondestructive inspection of most nonmetallic materials because they pass through nonmetallic materials [
5]. Therefore, imaging technologies that can be applied to nondestructive inspection are being developed in the THz region, and studies on detection of defects in specific synthetic materials are also being conducted [
6,
7,
8].
For nondestructive inspection of composite materials, it is possible to image defects using THz imaging technology in the laboratory, but further research is needed to actually use this technology in the field. Field application of THz imaging technology requires rapid measurement, miniaturization of equipment, environmental non-dependence, and cost effectiveness. With a focus on rapid measurements, we have developed high-speed THz tomography technologies.
The available methods of obtaining three-dimensional (3D) images using THz waves can be classified into transmission and reflection types [
9]. The transmission type includes the computed tomography technique, which has major drawbacks including a long measurement time and the need for rotation of an imaging target or a transmitter-receiver pair. The reflection type uses the time-of-flight principle. The position information of interfaces in an imaging target is obtained by detecting reflected THz waves from the interfaces and calculating the position of the interfaces from the round-trip times. By acquiring the depth-direction information at multiple points on the plane perpendicular to the depth direction, it is possible to obtain a 3D image of the imaging target [
10,
11,
12].
Reflection-type THz tomography can be divided into time- and frequency-domain THz tomography, depending on the A-scan method. Time-domain THz tomography uses pulsed THz waves to measure time-domain data, which is used as A-scan data [
13]. Time-domain data are acquired through optical sampling with varied time delays between the pump and probe pulses. Here, the A-scan rate depends on the scan rate of the time delay. Continuous THz waves are employed in frequency-domain THz tomography, where frequency-domain data are measured as the frequency of the continuous THz wave is varied. A-scan data are obtained through fast Fourier transform (FFT) of frequency-domain data [
14]. Here, the A-scan rate depends on the frequency scan rate of the continuous THz wave. In addition, C-scan methods include moving the imaging target using translation stages [
15] and steering a beam without moving the imaging target [
16].
We previously developed a high-speed time-domain THz tomography system using electronically controlled optical sampling (ECOPS) combined with beam steering [
16,
17]. ECOPS is used for fast A scan, and beam steering can speed up C scan more than moving an imaging target. A telecentric f-θ lens and a galvanometer scanner are used for beam steering. In addition, we developed a high-speed frequency-domain THz tomography system that relies on fast frequency sweep of continuous-wave (CW) THz radiation [
18,
19]. High-speed broadband THz frequency sweep is performed for fast A scan by using the THz photomixing technique with a wavelength-swept laser (WSL) and a distributed-feedback laser diode (DFB-LD) [
19].
In this paper, we test and compare the performance of the time- and frequency-domain THz tomography systems for nondestructive inspection of GFRP laminate samples with various artificial internal defects.
2. Experiments
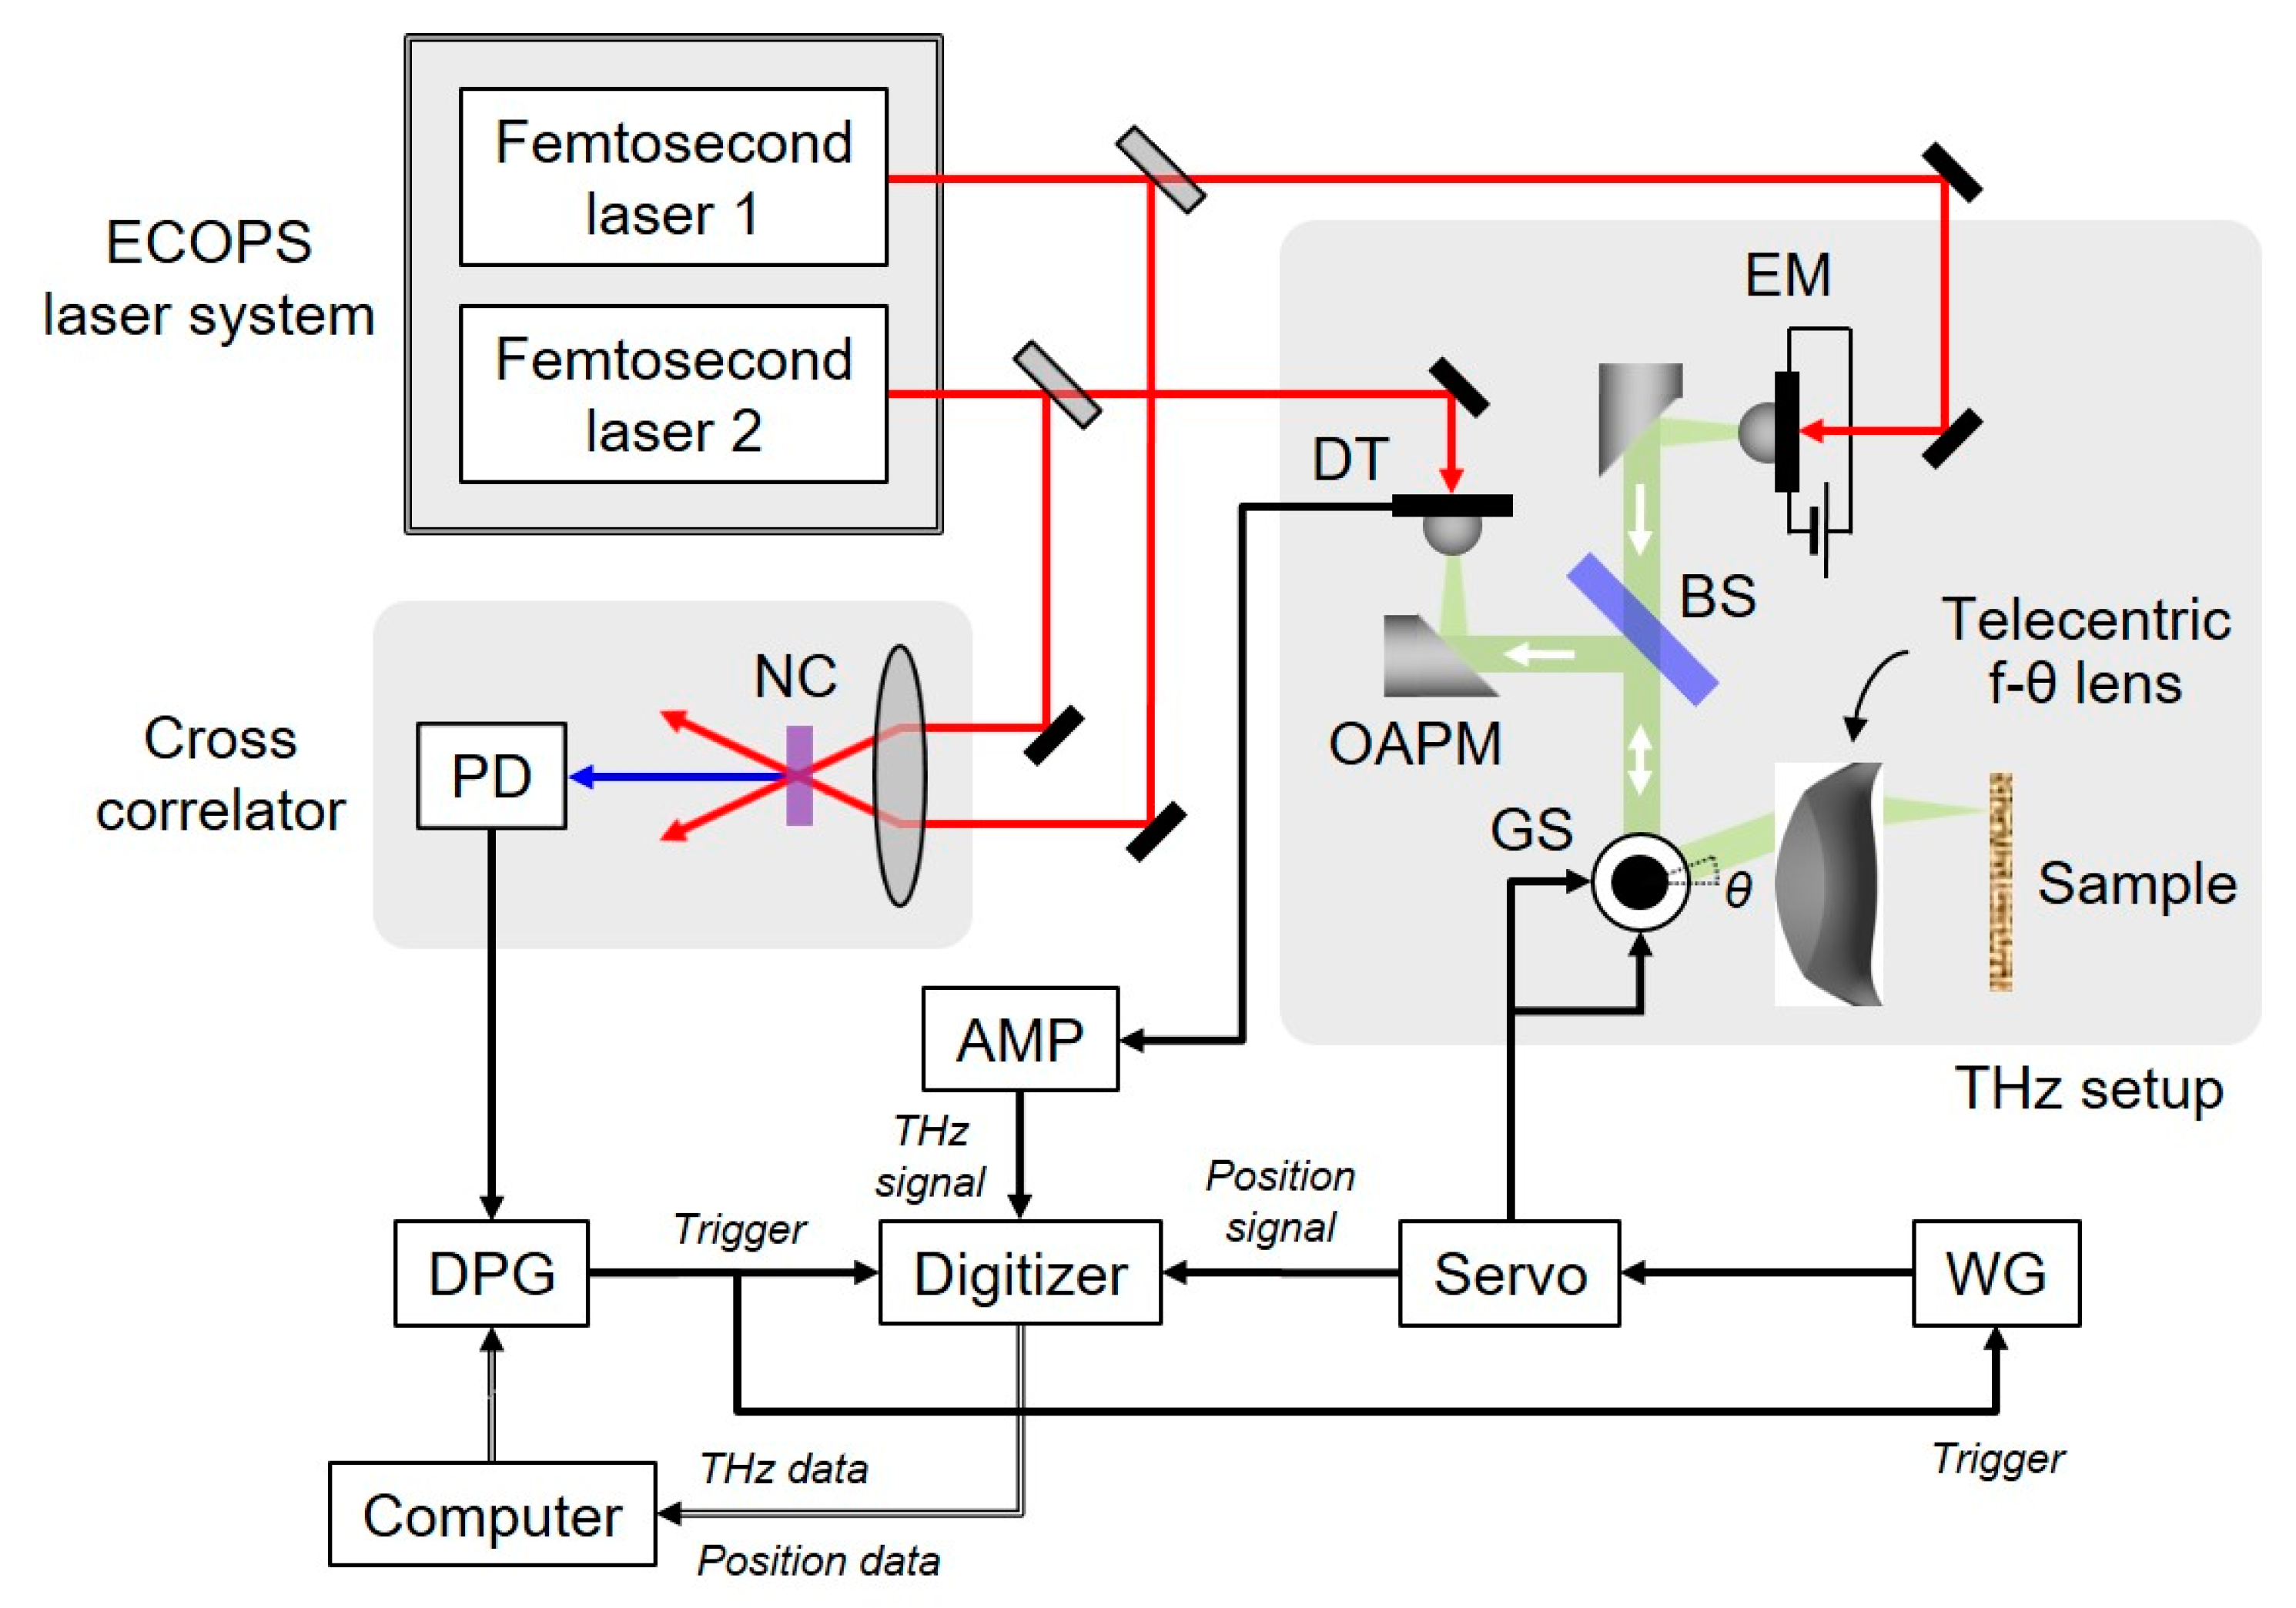
A schematic diagram of our time-domain THz tomography system is shown in
Figure 1. The photoconductive antenna emitter and detector are irradiated by the optical pulse trains from the pump and probe lasers, respectively, which make up the ECOPS laser system. The THz pulse train output from the emitter is transmitted through the silicon beam splitter and then steered by a two-dimensional (2D) galvanometer scanner with an optical angle (θ) ranging from −20° to +20° in both the X and Y directions. Through a telecentric f-θ Teflon lens, the THz beam is focused on and normally incident onto the flat focal plane regardless of the optical angle. The lens was designed to have a focal length of 146.9 mm and the beam size on the focal plane was measured to be about 4 mm [
16,
18]. A sample is placed on the flat focal plane. The reflected THz wave from the sample propagates back to the beam splitter along the same path. The reflected THz wave from the beam splitter is detected by the detector.
A 7.8-mm A-scan range, corresponding to a time delay window of 52 ps, can be scanned by ECOPS at a scan rate of 1 kHz. The telecentric f-θ lens was designed to have a C-scan area of 100 × 100 mm2. As a result, a volume of 100 × 100 × 7.8 mm3 can be scanned in 40 s, producing 200 × 200 × 725 voxels. It is possible to further reduce the total scan time by decreasing the number of transverse pixels or by increasing the A-scan rate while reducing the A-scan range.
Our frequency-domain THz tomography system that uses the high-speed broadband frequency sweep of CW THz radiation is illustrated in
Figure 2. To achieve the high-speed broadband THz frequency sweep, an optical beat source with a kHz beat-frequency sweep rate is used in THz photomixing. The optical beat source consists of a DFB-LD and a WSL. The DFB-LD operates at a fixed wavelength of 1545 nm, and the output wavelength of the WSL is swept from 1544 to 1558 nm at a 1 kHz sweep rate. Frequency-domain THz data are measured in the frequency range up to 1.5 THz. The optical output of the WSL is amplified by an optical fiber amplifier and then combined with that of the DFB-LD via a 3 dB fiber coupler. One of the two output arms of the coupler is connected to a THz CW transmitter module and the other to a THz CW receiver module via a variable optical delay line.
During the frequency sweep, frequency-domain THz interferograms are measured using the coherent homodyne detection method and trace averaging is used for noise reduction. The FFT results of the frequency-domain data are used as A-scan data. The total scan time depends on the number of points in the C-scan range and the number of averaged traces for each A-scan dataset. For example, it takes 100 s to acquire A-scan data for 100 × 100 points with 5 averaged traces at a frequency sweep rate of 1 kHz and 4000 s for 200 × 200 points with 50 averaged traces.
3. Results and Discussion
We fabricated GFRP laminate samples with artificial internal defects to test the performance of our THz tomography systems for nondestructive inspection of GFRP composites.
Figure 3a,b shows the design of GFRP samples A-1 and A-2, which have dimensions of 130 × 130 × 5 mm
3 and contain internal defects of various thicknesses. The red rectangles and the blue squares represent delaminations and Teflon inclusions, respectively; these are located at a depth of 1.5 mm. Sample A-1 has defects of 0.025, 0.05, 0.1 and 0.2 mm nominal thickness, while sample A-2 has defects of 0.2, 0.4, 0.7 and 1 mm nominal thickness.
Figure 4a shows the C-scan images of samples A-1 and A-2 measured with the time-domain THz tomography system. The C-scan data consist of the maximum values in the A-scan data in which the data from the surface were excluded. A-scan data obtained in places with a defect and without any defect using the time-domain THz tomography system are shown in
Figure S4a. The 0.025 mm-thick Teflon inclusion is visible, as is the 0.025 mm-thick delamination. We analyzed the amplitudes of the THz signals from defects with various thicknesses in the C-scan images.
Figure 4c shows the amplitude of the THz signal according to defect thickness. For both delamination and Teflon inclusion, the amplitude is greatest at a thickness of 0.2 mm and decreases as the thickness either increases or decreases. This is due to Fabry–Perot reflection from the defect layers [
15]. Since GFRP and Teflon have refractive indices of about 2.1 and 1.43, respectively, the reflectivity between air and GFRP is higher than that between Teflon and GFRP [
20,
21]. Thus, overall, the THz signals from the delaminations are greater than those from the Teflon inclusions, and delaminations are easier to detect than Teflon inclusions.
Figure 4e and
Video S4e show the 3D images of samples A-1 and A-2 measured with the time-domain THz tomography system. Thinner defects are not visible in the 3D visualization, unlike in the C-scan images. Furthermore, the THz signals from thicker defects are separated into two parts, which indicate the upper and lower interfaces of the defect layers.
Figure 4b,d,f shows the C-scan images, the amplitude of the THz signal versus the defect thickness, and the 3D images of samples A-1 and A-2, respectively, measured with the frequency-domain THz tomography system. In the C-scan images (
Figure 4b), delaminations with a thickness of as little as 0.025 mm can be seen, but only Teflon inclusions with a thickness of no less than 0.1 mm are visible. This is because the signal-to-noise ratio of A-scan data is lower in the frequency-domain THz tomography system than in the time-domain THz tomography system. The results for the amplitude of the THz signal versus the defect thickness in
Figure 4d are similar to those in
Figure 4c. The 3D images in
Figure 4f and
Video S4f are consistent with the C-scan images in
Figure 4b and are similar to the 3D images in
Figure 4e and
Video S4e.
Figure 3c shows the design of GFRP sample B, which has dimensions of 130 × 130 × 5 mm
3 and contains internal defects of different sizes. Sample B contains square Teflon inclusions that are 1, 2, 3, 4, 5, 6, 7, 8, and 9 mm in size and rectangular delaminations with widths of 1, 2, 3, 4, 5, 6, 7, and 8 mm. All of these defects are 0.2 mm thick and lie at a depth of 1.5 mm.
Figure 5a shows the C-scan image of sample B measured with the time-domain THz tomography system. In this image, even delaminations with a width of 1 mm are visible (though dimly), but only Teflon inclusions with a size of at least 4 mm can be seen.
Figure 5c shows the amplitude of the THz signal versus the defect size. For both delamination and Teflon inclusion, the signal amplitude reduces as the size decreases.
Figure 5e and
Video S5e show the 3D image of sample B measured with the time-domain THz tomography system. Fewer small defects are visible in the 3D visualization than in the C-scan image.
Figure 5b,d,f shows the C-scan image, the amplitude of the THz signal versus the defect size, and the 3D image of sample B, respectively, measured with the frequency-domain THz tomography system. In the C-scan image (
Figure 5b), delaminations with a width of 2 mm or greater and Teflon inclusions with a size of 6 mm or more are visible. The results for the amplitude of the THz signal versus the defect size in
Figure 5d are similar to those in
Figure 5c. The 3D image in
Figure 5f and
Video S5f is consistent with the C-scan image in
Figure 5b. Small defects are not visible in either the C-scan or 3D images.
Figure 3d shows the design of sample C, which has dimensions of 130 × 130 × 5 mm
3 and contains internal defects at different depths. Sample C has 9 mm-wide rectangular delaminations and 8 mm square Teflon inclusions. All of the defects are 0.2 mm thick. The delaminations and Teflon inclusions lie at depths of 0.5, 1, 1.5, 2, 2.5, 3, 3.5, and 4 mm.
Figure 6a shows the C-scan image of sample C measured with the time-domain THz tomography system. This image shows delaminations at a depth of 3 mm or less and Teflon inclusions at a depth of 1.5 mm or less. The measurable depth is limited to 7.8 mm by ECOPS [
16]. Defects at a depth of 3.5 mm or more cannot be seen, considering GFRP’s refractive index of 2.1.
Figure 6c shows the amplitude of the THz signal versus the defect depth. For both delamination and Teflon inclusion, the amplitude of the THz signal decreases with increasing depth due to attenuation of the THz beam through GFRP.
Figure 6e and
Video S6e show the 3D image of sample C, which is consistent with the C-scan image.
Figure 6b,d,f shows the C-scan image, the amplitude of the THz signal versus the depth of the defect, and the 3D image of sample C, respectively, measured with the frequency-domain THz tomography system. In the C-scan image (
Figure 6b), delaminations at a depth of 2 mm or less and Teflon inclusions at a depth of 1.5 mm or less are visible. Due to the WSL, the coherence length of CW THz radiation is shorter in the frequency-domain THz tomography system than in the time-domain THz tomography system [
19]. The reduction in coherence with increasing depth results in a greater decrease in the THz signal amplitude in the frequency-domain THz tomography system than the time-domain THz tomography system. Thus, the results for the amplitude of the THz signal versus the depth of the defect in
Figure 6d show a greater decrease in the amplitude with increasing depth than those in
Figure 6c.
Figure 6f and
Video S6f show the 3D image of sample C, which is consistent with the C-scan image.
4. Conclusions
In conclusion, herein, we presented and compared the performance of our time- and frequency-domain THz tomography systems to detect internal defects in GFRP composites. The imaging performance of the THz tomography systems for a variety of thicknesses, sizes, and depths of defects is summarized in
Table 1. In the time-domain THz tomography system, the minimum detectable thickness and size and the maximum detectable depth for delaminations are 0.025, 1, and 3 mm, respectively. The minimum detectable thickness and size and the maximum detectable depth for Teflon inclusions are 0.025, 4, and 1.5 mm, respectively. In the frequency-domain THz tomography system, the minimum detectable thickness and size and the maximum detectable depth for delaminations are 0.025, 2, and 2 mm, respectively. The minimum detectable thickness and size and the maximum detectable depth for Teflon inclusions are 0.1, 6, and 1.5 mm, respectively.
In the high-speed THz tomography systems, high-speed A scan and beam steering are core technologies, as they enable users to rapidly acquire image data without moving an imaging target. This time-domain THz tomography technology is suitable for high-speed measurements, but is not well-suited for equipment miniaturization, environmental non-dependence, and cost effectiveness due to the use of femtosecond pulsed lasers and phase-locked loops. Currently, the measurement speed of the frequency-domain THz tomography system is inferior to that of the time-domain THz tomography system due to the low signal-to-noise ratio of the THz CW transmitter-receiver pair. However, the frequency-domain THz tomography technology is advantageous to equipment miniaturization, environmental non-dependence, and cost effectiveness because of the CW laser features. Therefore, the frequency-domain THz tomography technology will be more promising as a nondestructive inspection technology for composite materials that is usable in the field, along with further advancements in THz CW transmitters and receivers. THz tomography is a promising imaging technology for rapid non-contact nondestructive inspection of composite materials, and further research and development is required for practical applications.


