Abstract
This study presents an experimental comparison of three characterization methods for phase change materials (PCM). Two methods were carried out with a calorimeter, the first with direct scanning (DSC) and the second with step scanning (STEP). The third method is a fluxmetric (FM) characterization performed using a fluxmeter bench. For the three methods, paraffin RT58 and polymer PEG6000, two PCM suitable for domestic hot water (DHW) storage, were characterized. For each PCM, no significant difference was observed on the latent heat and the total energy exchanged between the three characterization methods. However, DSC and STEP methods did not enable the accurate characterization of the supercooling process observed with the FM method for polymer PEG6000. For PEG6000, the shape of the enthalpy curve of melting also differed between the experiments on the calorimeter—DSC and STEP—methods, and the FM method. Concerning the PCM comparison, RT58 and PEG6000 appeared to have an equivalent energy density but, as the mass density of PEG6000 is greater, more energy is stored inside the same volume for PEG6000. However, as PEG6000 experienced supercooling, the discharging temperature was lower than for RT58 and the material is therefore less adapted to DHW storage operating with partial phase change cycles where the PCM temperature does not decrease below 52 °C.
1. Introduction
In residential buildings, the share of the final energy consumption dedicated to domestic hot water (DHW) production is estimated to be between 15% and 30% [1,2,3]. This share will likely rise in coming years as stricter regulations will lead, in many countries, to a reduction of space heating consumption, especially with the development of net zero energy building [3]. Thus, reducing the energy consumption of DHW production and developing technologies using renewable energies for DHW production is a major challenge for reducing the greenhouse gases emissions of the building sector. Nowadays, solar collectors are the most developed technology to produce DHW from a renewable energy source. However, the mismatch between the solar resource and the DHW demand requires the use of a thermal energy storage (TES) system.
Over the past decades, hot water tanks, using only sensible heat, were the most common TES systems used to store heat production from solar collectors. However, in recent years, a growing interest in scientific research concerning latent heat thermal energy storage (LHTES) systems [4] appears as a promising alternative to conventional hot water tanks. LHTES systems use the latent heat transfers occurring during the melting and solidification processes of phase change materials (PCM) to store and release heat. The main advantage of PCM is that it is able to store a large amount of thermal energy on the phase change temperature range between solid and liquid states. Compared with conventional hot water tanks, LHTES enable a reduction in the volume of the TES system [5]. A smaller volume of DHW storage enables the reduction of thermal losses, and also creates new opportunities for the implementation of solar collectors on existing buildings. Indeed, the size of the storage is a crucial factor as the building was not initially designed to leave space for a DHW storage dedicated to solar production.
In order to select the most appropriate PCM for DHW storage, it is necessary to identify the thermal properties of the PCM with a complete and accurate characterization. For example, an improvement of the accuracy on the phase change temperature from ±1 °C to ±0.25 °C leads to a reduction of 25% of the uncertainties on the heat transfers of a PCM-air unit [6]. An inaccurate characterization of thermal properties might lead to a wrong sizing of the system and to lower performances than expected. Currently, the most widespread method is to characterize PCM by direct scanning calorimeter (DSC). This method enables the identification of the enthalpy curve of the PCM with fast experiments on a small sample of a few milligrams of PCM. However, most PCM have a low thermal conductivity and there is a thermal gradient between the heat source and the internal temperature of the PCM. As the enthalpy curve of DSC experiments is computed with the heat source temperature, the thermal response of the PCM sample is influenced by the heating/cooling rate [7,8]. Moreover, for PCM experiencing supercooling, the recalescence process, defined by a short reheating of the PCM when the metastable state is broken, cannot be observed with DSC experiments, and this is for two reasons. First, as mentioned earlier, only the heat source temperature is monitored and a short increase in the PCM temperature might remain unseen by the sensor. Secondly, the sample is very small and the cooling rate of the experiments is usually too fast to enable a reheating of the PCM. In these conditions, the latent heat release during the recalescence is evacuated directly to the surroundings and is materialized by a heat flux peak.
For PCM characterization with a calorimeter, the step scanning (STEP) method overcomes the dependency of the results with the heating/cooling rate [9,10]. Compared with the DSC method, where a heating/cooling rate is applied to the sample, the STEP method consists of applying temperature steps to the sample. The energy exchanged by the sample between two steps is measured and, once the thermal equilibrium is reached, the next temperature step is applied. The sum of energy exchanged between each step enables the construction of the enthalpy curve of the PCM.
Some authors use a fluxmetric method (FM) to characterize pure PCM [11,12,13,14] or mortars containing encapsulated PCM [15,16]. For this method, the characterization is not performed with a calorimeter, as for DSC and STEP methods, but with a fluxmeter bench. The PCM is inserted inside a rectangular brick and two heat exchangers apply thermal loads to the sample. Fluxmeters measure the heat flux exchanged by the sample and a thermocouple is inserted inside the PCM to monitor the temperature. Compared with DSC and STEP methods, the FM method enables the characterization of larger samples, to directly monitor the PCM temperature and apply various thermal loads to the sample. This method also enables the numerical identification of the PCM properties by inverse methodology, and to model the thermal behavior of the sample for various thermal loads [11,12,17].
Many different kinds of PCM present a phase change temperature range and a latent heat suitable for DHW storage. However, other criteria including thermodynamic, kinetic, chemical and economic properties must be considered to select the most appropriate PCM for DHW storage [18,19,20]. Paraffins are the most commonly used PCM for DHW storage from solar production [21,22]. Gulfam et al. [23] present a recent and detailed review on paraffin-based PCM, and Lizana et al. [24] provide a complete list of commercial paraffins. The specific heat of commercial paraffins is close to 2000 J·kg−1·k−1 [22] and the latent heat is between 150 kJ·kg−1 and 230 kJ·kg−1 [24]. However, these good thermal performances are mitigated by a low density of around 800 kg·m−3 [24], which reduces the volumetric energy density. However, the main drawback of paraffins is their low thermal conductivity, usually close to 0.2 W·m−1·K−1 [24]. Therefore, in order to reach the required power for DHW production, it is necessary to enhance thermal transfers between the PCM and the heat exchanger, by composite materials or fins [25,26,27].
In comparison with paraffin-based materials, fewer studies investigate the thermal performance of polymers as PCM for DHW storage. Sharma et al. [28] report promising potential for polyethylene-glycol 6000 (PEG6000), which appears to be economically competitive compared with conventional paraffin-based materials. As for paraffins, the specific heat of polymer PEG6000 is close to 2000 J·kg−1·k−1 [29]. Most studies find a latent heat of around 180 kJ·kg−1 [29,30,31,32], but higher values, close to 220 kJ·kg−1 [28,33], or lower values, close to 150 kJ·kg−1 [34], might be observed in the literature for PEG6000. The thermal conductivity of PEG6000 appears to be slightly higher than paraffin-based materials with values of around 0.3–0.4 W·m−1·K−1 depending on the studies [12,29,30,35]. Concerning the phase change range of PEG6000, the melting temperature is suitable for DHW storage with a value close to 60 °C [28,30,31,32,33,34,35]. For the cooling process, polymers, such as PEG6000, are known to experience supercooling [36,37,38,39], and it is natural to observe a different phase change temperature between heating/cooling processes. The degree of supercooling is influenced by the cooling rate [12,39,40,41,42], the size of the sample [43,44,45], and the roughness of the sample surface [46]. In the literature, various temperatures of crystallization may be found as experiments are carried out in different set-ups with different procedures: crystallization temperatures of 38 °C by Yan et al. [35], 41.3 °C by Shen et al. [32], 44.0 °C by Wang et al. [34], and 37.8 °C and 39.6 °C by Tang et al. [30,33] have been found. However, results from the literature come from DSC experiments performed on a very small sample (a few milligrams of PCM) with a fast cooling rate (a few degrees per minute). It has been shown that fast cooling rates increase the supercooling degree [12,39,41] and large samples reduce the supercooling degree [43,44]. Therefore, the cooling behavior of a real-scale DHW storage might be different than for DSC results, and it appears necessary to characterize PEG6000 on a large sample with various thermal loads.
This study presents an experimental comparison of three characterization methods for two PCM suitable for DHW storage. Two methods, DSC and STEP, are carried out on a calorimeter. The third characterization is an FM method performed on a fluxmeter bench. The two PCM selected for the experimental characterizations are paraffin RT58 and polymer PEG6000. Paraffin RT58, from Rubitherm, is a well-known material for DHW storage. PEG6000 is widely used in the medical and cosmetic sectors, however, despite a lower cost than paraffin, this material is less common for DHW storage with PCM. The objective of this study is to investigate and compare, with the three characterization methods, the thermal performances of a well known paraffin-based material (RT58) with a less common polymer (PEG6000), which has a great potential for DHW storage. To the best knowledge of the authors, no scientific study as yet compares the experimental results of DSC, STEP and FM methods for two PCM with different thermal behavior, one with no supercooling (RT58) and the other with supercooling (PEG6000). Moreover, the authors did not identify any study directly comparing the thermal performances of a paraffin-based material and polymer PEG6000 with the same experimental set-up and the same experimental protocol.
The first section of this study details the experimental set-up and the experimental protocol for the three characterization methods. The second section presents the results from the DSC and STEP methods for the two PCM. The third section focuses on the results of the experimental characterization with the FM method. The last section compares the results obtained with the three characterization methods and discusses the advantages and drawbacks of each method.
2. Characterization Methods for Phase Change Materials
2.1. Direct Scanning and Step Scanning Calorimeter Methods
Paraffin RT58 and PEG6000 were analyzed with a PerkinElmer Pyris Diamond calorimeter. For each material, the DSC and STEP methods were performed with a mass sample of 6.25 mg for PEG6000 and 4.72 mg for RT58.
As the PCM was introduced in a solid state inside the measuring cell, there was poor contact between the PCM and the sensor, which did not enable it to correctly measure the heat flux. To overcome this limitation, experiments with the DSC method were performed with three successive cycles of heating/cooling separated by isothermal steps. For each cycle, a heating/cooling rate of 0.5 K·min−1 was set. Figure 1 shows the principle of the DSC method.
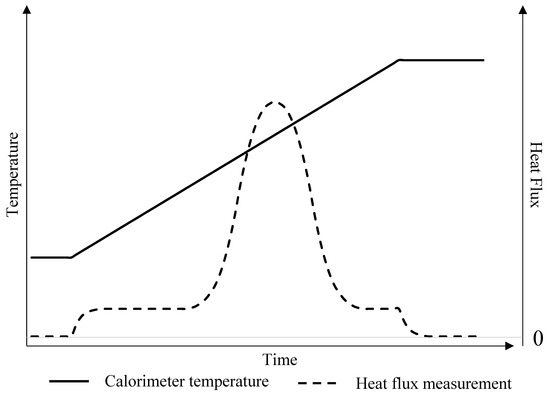
Figure 1.
Principle of the DSC method.
The STEP method was performed with a temperature step of 1 K. The energy exchanged by the PCM was measured between each step. It was necessary to reach thermal equilibrium, with a heat flux equal to zero, before applying the next temperature step. Figure 2 illustrates the principle of the STEP method.
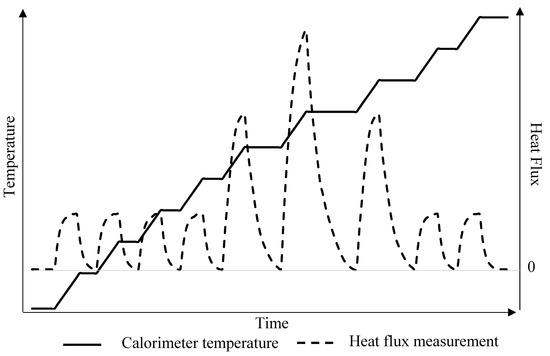
Figure 2.
Principle of the STEP method.
2.2. Fluxmetric Method
A fluxmeter bench, shown as a schematic diagram in Figure 3, was used to experimentally characterize the two studied PCM, paraffin RT58 and polymer PEG6000. Similar fluxmeter benches have been used in previous studies to characterize samples of pure PCM [11,12,13,14], or mortars containing encapsulated PCM [15,16]. The fluxmeter bench consisted of a poly (methyl methacrylate) (PMMA) brick filled with PCM, which was heated or cooled by two heat exchangers. The PMMA brick measured 210 mm × 140 mm × 18 mm and the thickness of the PMMA walls was 4 mm. Two heat exchangers applied thermal loads on the large sides of the sample. The four lateral sides represented 17% of the total surface of the sample and were enclosed with an insulation layer of extruded polystyrene foam, in order to limit thermal losses through these sides.
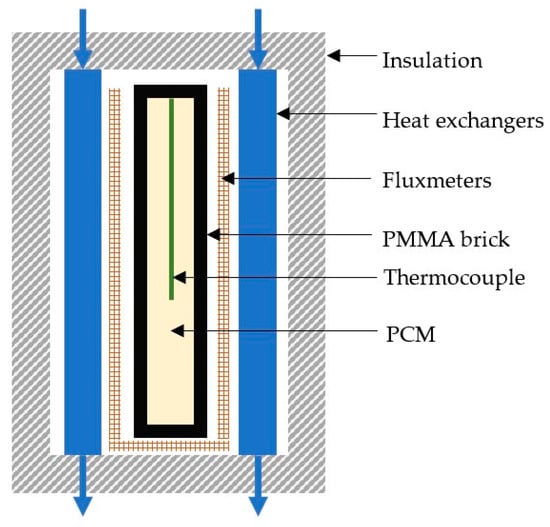
Figure 3.
Experimental apparatus of the fluxmeter bench (sectional view).
Measurements of PCM temperature and heat transfers between the large sides enabled the accurate characterization of the PCM inside the brick. The heat flux was monitored by two fluxmeters located between the outer brick wall and the heat exchanger. The fluxmeters had a sensitivity of 177 μV/(W·m−2) and, once calibrated, the accuracy of the measurement was close to 3%. A T-type thermocouple, with an accuracy of 0.1 °C, was inserted inside the brick to monitor the PCM temperature. Fluxmeters were also implemented on the lateral sides, except on the top side to pass the thermocouple wire, to quantify the thermal losses through the insulated sides.
Four experiments were carried out to experimentally characterize RT58 and PEG6000. For each experiment, the same temperature was applied to the brick sample by the two heat exchangers. For the two first experiments, a heating/cooling ramp was applied between 20 °C and 70 °C. The first experiment had a fast heating/cooling ramp of 4 h, and the second experiment had a slow heating/cooling ramp of 18 h. The two last experiments consisted of two step loads with a sharp variation of the heat exchangers’ temperature. The first step load enabled the simulation of a fast charging process, with a quasi-instantaneous increase in the heat exchangers’ temperature from 20 °C to 70 °C. Conversely, the second step load imitated a fast discharging, with a sharp decrease in the temperature from 70 °C to 20 °C.
The solid and liquid densities of the PCM were determined by weighing. The PMMA brick was weighed, the first time empty, and the second time once the PCM had been poured inside the brick in a liquid state at 70 °C. To fill the brick sample, it was necessary to incorporate 215 g of RT58 and 285 g of PEG6000. With the inner volume of the brick and the mass difference between the empty brick and the brick containing the PCM, it was possible to compute the liquid density of the PCM. During the solidification process, the PCM height inside the brick decreased with the shrinkage of the PCM. The solid density was deduced from the height difference inside the brick between the liquid and solid states. Table 1 presents the results obtained for the solid and liquid densities of RT58 and PEG6000. Concerning RT58, the results were in good agreement with the values given by the manufacturer: ρS = 770 kg·m−3 and ρL = 880 kg·m−3.

Table 1.
Values of solid and liquid densities identified experimentally.
3. Results of the Direct Scanning and Step Scanning Calorimeter Methods
3.1. Results for Paraffin RT58
The results of DSC characterization are presented in Figure 4. The thermograms show a very good reproducibility, even if the first heating was always slightly different because of the poor contact between the sample (introduced in solid form) and the measuring cell. The melting was progressive with a starting temperature located at around 51.2 °C. The temperature at the end of the melting process could not be determined with precision because of the sample’s internal heat transfers. An empirical method enabled the estimation of the temperature between the top of the thermogram and the inflection point during the heat flux decrease. For RT58, the end of the melting process was evaluated at around 59.5 °C. On cooling, an abrupt variation was observed at 58.7 °C. This is characteristic of the break of supercooling. The supercooling is thus weak and of the order of the degree Celsius.
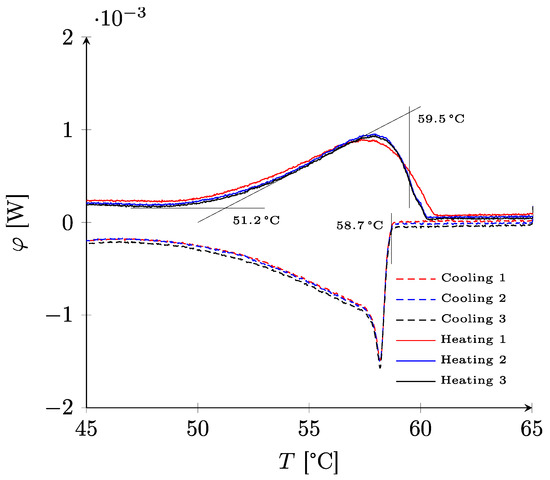
Figure 4.
Thermograms for paraffin RT58.
In Figure 5, the enthalpy was reconstructed in an approximate way by integrating the thermogram of DSC and fixing an arbitrary reference at the temperature of 51.2 °C identified on the thermogram. Curves with a similar appearance were obtained, with stabilization occurring from 60 °C which corresponded to the temperature above, where the material was completely in a liquid state. The latent heat of melting, which was approximated by the variation of the enthalpy between the temperature at the beginning of melting (impossible to determine with precision, but estimated at 51.2 °C) and the end of melting (approximately 60 °C) gave a probable value ranging between 132 and 145 kJ/kg. The STEP analysis gave similar results, with an estimation of the latent heat in the low range. The cooling curves show a supercooling of about 1.5 °C.
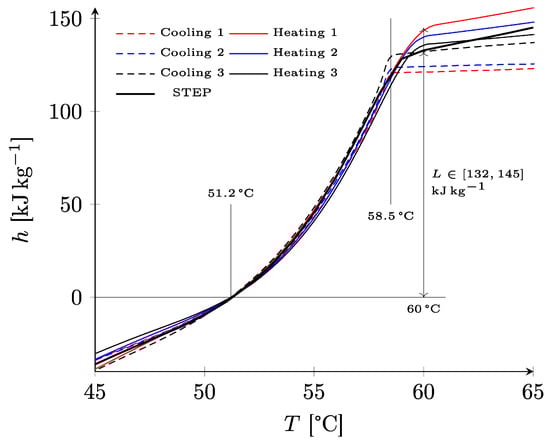
Figure 5.
Specific enthalpy of paraffin RT58 deduced from DSC and STEP experiments.
3.2. Results for Polymer PEG6000
Concerning PEG6000, the thermograms of heating and cooling experiments are visible in Figure 6. Except for the first cycle to “fit” the sample in the cell, the two following cycles were quite similar. On heating, three partially overlapping peaks were observed. All the peaks were located on the interval from 56 °C to 63.1 °C with the main peak in central position spreading between 58.3 °C and 61.8 °C.

Figure 6.
Thermograms for polymer PEG6000.
During the cooling process, these three peaks were also discernible, although they were mainly overlapping. A much higher supercooling degree was noted, of the order of 12 °C, which led to a discharging temperature of close to 50 °C.
In Figure 7, the mass enthalpy was reconstructed for the three cycles by DSC, and with the STEP method. Concordant results were obtained between each cycle, except for the first heating. The most energetic transformation, visible on the thermogram between 58.3 °C and 61.8 °C, was well characterized with a starting temperature identified at 59.4 °C. A secondary transformation starting around 61 °C was also observed and was responsible for the secondary peak visible on the thermogram between 61.8 °C and 63.8 °C. The global enthalpy variation was estimated to be between 178 and 190 kJ·kg−1.
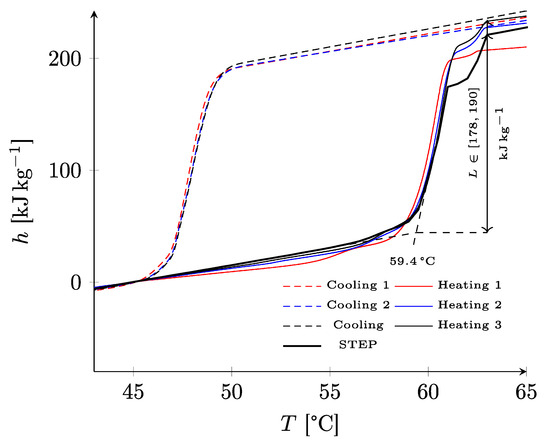
Figure 7.
Specific enthalpy of polymer PEG6000 deduced from DSC and STEP experiments.
4. Results of the Fluxmetric Method
For the FM method, the results of the four experiments carried out on RT58 and PEG6000 are presented in Figure 8. The 4 h fast heating/cooling rate and the 18 h slow heating/cooling ramp are plotted in Figure 8A,B, respectively. Figure 8C shows the experiment with a charging step load, and Figure 8D shows the experiment with a discharging step load. For all the experiments performed, the thermal losses through the insulation layer in mineral wool, measured by the lateral fluxmeters, represented only between 2% and 3% of the total monitored heat flux. As the heat flux occurred almost entirely between the brick sample and the heat exchangers, only the temperature of the heat exchangers influenced the thermal behavior of the sample.
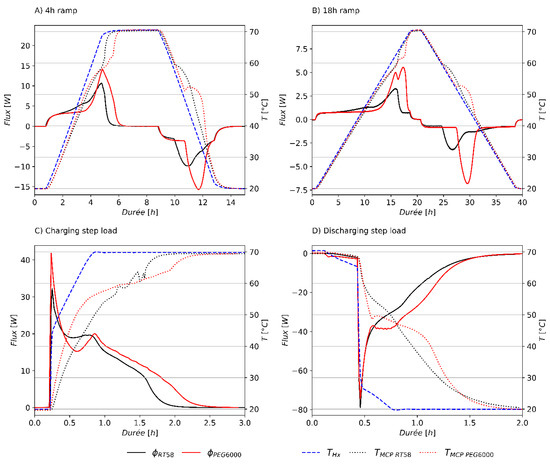
Figure 8.
Heat flux and temperature measurements of RT58 and PEG6000 for a 4 h ramp (A), 18 h ramp (B), charging step load (C), and discharging step load (D).
A first overall comparison, between RT58 and PEG6000 on the four experiments, showed a greater heat flux for PEG6000. This observation is validated with Figure 9 which compares the total energy exchanged for each PCM between 20 °C and 70 °C, under the various heat loads tested. In Figure 9, red bars represent the heating cycles and blue bars represent the cooling cycles. The 4 h ramp, 18 h ramp and step loads are plotted with a clear shade, a medium shade and a dark shade, respectively. The mean total energy stored, PMMA brick included, equaled 83.9 kJ for RT58 and 103.4 kJ for PEG6000. The energy density was deduced by removing the sensible energy stored inside the PMMA brick and dividing the remaining energy by the mass of PCM incorporated inside the brick. Results showed an energy density, between 20 °C and 70 °C, of 289.6 kJ·kg−1 for RT58 and 282.8 kJ·kg−1 for PEG6000. This meant that if only considering the energy density, RT58 and PEG6000 had similar thermal performances. However, as PEG6000 has a greater mass density than RT58, the energy stored inside the same volume is greater for PEG6000. This leads to a potential duration of DHW production (Figure 8D), where the PCM temperature is above 40 °C, being 22.7% longer for PEG6000. Therefore, to store a given amount of energy, PEG6000 can enable a more compact design, not because of a higher mass energy density, but due to a greater volumetric energy density.
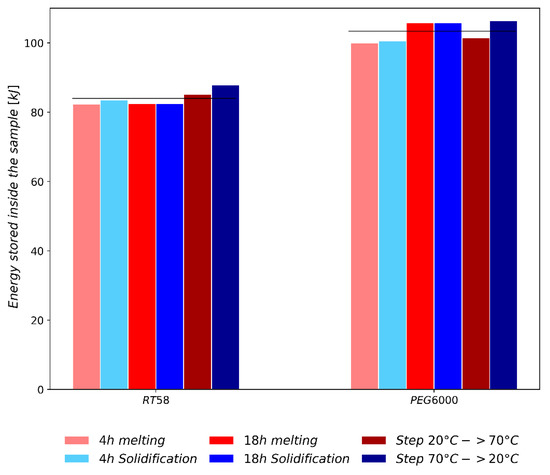
Figure 9.
Comparison of the total energy stored between 20 °C and 70 °C inside the sample (PMMA brick + PCM) for the different thermal loads tested.
Figure 10 compares RT58 and PEG6000 to show the higher volumetric energy density for PEG6000, and presents the evolution of the heat stored inside the sample, as a function of the PCM temperature. The 18 h heating/cooling ramp was selected because slow rates minimized the thermal gradient inside the sample. With a fast heating/cooling rate, as for the charging and discharging step loads, the PCM temperature will not be representative of the measured heat flux. Moreover, slow heating/cooling rates highlight the different thermal behaviors, which are dependent on the temperature level and the phase change process, melting or solidification, of the PCM. Figure 10 clearly illustrates the supercooling phenomenon during the cooling process of PEG6000 with a short reheating of the PCM.
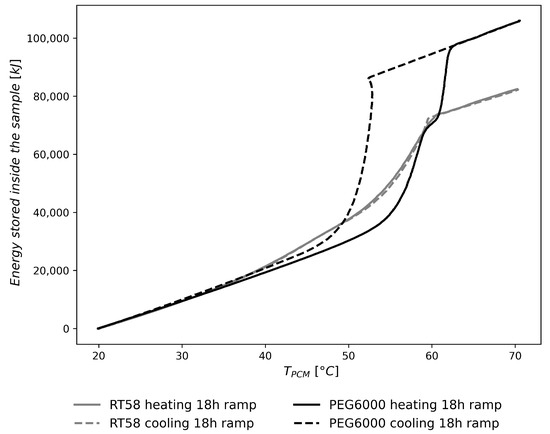
Figure 10.
Energy stored inside the sample (PMMA brick + PCM) as a function of the PCM temperature for the 18 h heating/cooling ramp.
For RT58, Figure 8A,B show a main heat flux peak between 50 and 60 °C, but also a minor heat flux peak between 40 °C and 50 °C. This minor heat flux peak is not mentioned by the manufacturer but has previously been observed experimentally in the literature on DSC experiments [47,48,49]. This minor heat flux peak may come from a solid–solid phase change process of the paraffin, or from a solid–liquid phase change process of another material, as the commercial paraffin might not be composed exclusively of one material. This minor heat flux peak is also observed in Figure 10, where the slope of the energy stored increases above 40 °C. For the discharging process of RT58, solidification appears to begin a few degrees lower for the step loads than for the two cooling ramps. Even if paraffins are usually classified as PCM with little or no supercooling [50], this might suggest a slight supercooling for discharging step loads.
For PEG6000, a double heat flux peak appeared only on the heating cycle of the experiment with a 18 h ramp. However, a double plateau of temperature was observed for the heating cycles of the 4 h and 18 h ramps, and less clearly for the charging step load. This phenomenon has been reported in the literature [12,31] and might be explained by the different thermal behaviors of the crystals within the crystallin structure of the solid state [51,52,53]. This particular behavior would have remained unseen if only one experiment, with a heat flux measurement, had been carried out for the 4 h heating ramp or the charging step load. Indeed, fluxmeters measure the global thermal behavior of the sample, whereas a thermocouple reflects a local behavior. Therefore, in order to perform a complete characterization of the PCM, it was necessary to monitor both the heat flux and temperature for various thermal loads. Concerning the cooling cycles of PEG6000, a supercooling phenomenon was observed for the two cooling ramps and the discharging step load. The beginning of the crystallization seemed slightly dependent on the cooling rate of the PCM. A crystallization temperature of 52.5 °C was observed for the 18 h slow cooling rate, 51.5 °C for the 4 h fast cooling rate and 48.6 °C for the discharging step load. Therefore, as for the heating process, both heat flux and temperature measurements were necessary to characterize the cooling process of PEG6000.
5. Comparison between Direct Scanning Calorimeter, Step Scanning Calorimeter and Fluxmetric Methods
This section compares the results between the three characterization methods to obtain the enthalpy curve h(T) for RT58 and PEG6000. The characterization methods rely on two different pieces of equipment, a calorimeter for the DSC and STEP methods, and a specific apparatus for the FM method, using two very different masses of sample, being ten milligrams for the DSC and STEP methods, and between two hundred and three hundred grams for the FM method.
Figure 11 shows the results for RT58. A very good consistency was observed between the three curves, despite the differences in method and apparatus. In particular, the curves on heating and cooling are nearly congruent, confirming that this PCM showed very little supercooling.
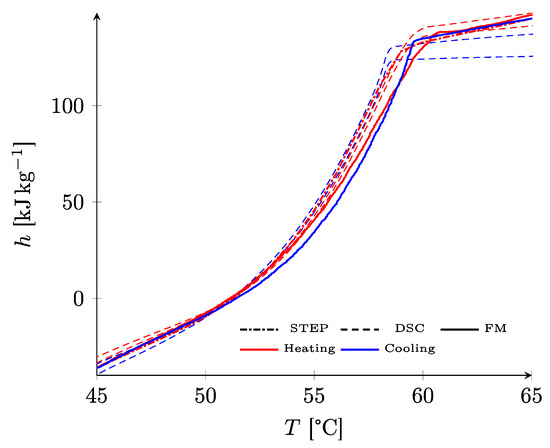
Figure 11.
Comparison of the results obtained by the three methods for RT58.
For PEG6000, the results visible in Figure 12 show differences both in heating and cooling. During the heating process, there was a noticeable difference in the onset of melting, in the range of 55 °C to 60 °C. The repeatability of the determinations on small samples (DSC, STEP) suggested an effect related to heat transfers within the macroscopic sample. The total mass enthalpy changed during melting (which is, by abuse of language, called latent heat of melting, which is defined only for a pure substance), however, this was consistent for all methods.
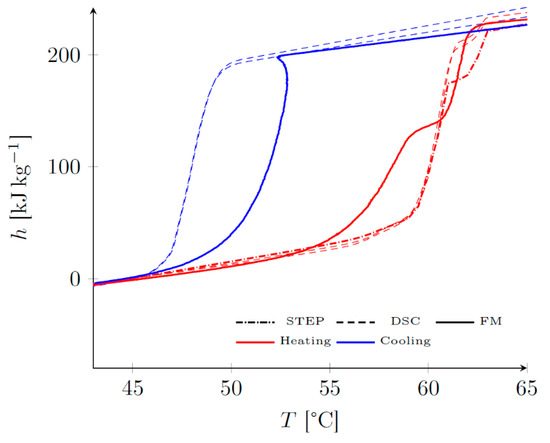
Figure 12.
Comparison of the results obtained by the three methods for PEG6000.
During cooling, a difference of nearly 5 °C on the supercooling rupture temperature between the FM method and the DSC and STEP methods, was observed. This can be explained by the difference in volume of the two samples; it is indeed well known [54,55] that the degree of supercooling increases with the reduction of the size of the sample considered. As the PCM mass was roughly 50,000 times greater for the FM method than for DSC and STEP methods, the observed behavior was therefore consistent. For a fictive latent heat storage with 100 kg of PCM, the mass ratio between the system and the sample characterized would be close to 400 for the FM method and around 20 million for the DSC and STEPS methods. Therefore, the FM method enables to get closer to the thermal behavior of real scale storage of DHW.
The FM method showed a rise in temperature at the moment of rupture: locally, i.e., at the location of the metastability rupture, the material reached its equilibrium state characterized by the “real” h(T) curve, i.e., at heating. This phenomenon was totally masked by the calorimeter because of the small volume of the sample and the control device which had the function of regulating the temperature. For the fluxmeter device, as the parietal exchanges are limited, a slight rise in temperature was observed. It is noteworthy that the qualifier “real” attributed to the results in heating allowed support of the fact that there was no hysteresis phenomenon related to the function h(T), which is a state quantity: the curves in cooling resulting both from the supercooling and from the internal transfers in the sample.
6. Conclusions and Outlooks
This study presents an experimental comparison of three characterization methods (DSC, STEP, FM) for two PCM (paraffin RT58 and polymer PEG6000) suitable for DHW storage. The two PCM studied have very different thermal behaviors, as PEG6000 experiences supercooling, whereas RT58 has a similar behavior between melting and solidification processes. The following findings are recommended to perform an experimental characterization of a PCM:
- -
- Results from the DSC method are sufficient where a high accuracy is not required and when the PCM does not experience supercooling. The accuracy of the characterization might be improved using a calorimeter with the STEP method, but the experiments will be longer and it will be more complex to configure the settings of the calorimeter;
- -
- A complete and accurate characterization of a PCM, with observations and quantification of local and global thermal behaviors, require experiments under various heat loads, with both heat flux and temperature measurements. Only the FM method can conduct this complete characterization. However, compared with DSC and STEP methods, no commercial device exists, the experimental set-up is complex and the experiments are time-consuming;
- -
- Large samples enable a closer resemblance to the thermal behavior of a real-scale system, especially concerning supercooling, which is strongly influenced by the size of the sample. The FM method enables a much closer resemblance to the PCM mass of a storage, than DSC and STEP methods.
Table 2 summarizes the advantages and disadvantages of the three characterization methods used in this study.
Table 2.
Synthesis of advantages and disadvantages of the three characterization methods studied.
Concerning the comparison between RT58 and PEG6000 for DHW storage, the experimental results show:
- -
- An experimental identification of specific heat, latent heat and phase change temperature consistent with the literature for the two PCM;
- -
- Similar values of specific heat and latent heat for RT58 and PEG6000. This means an equivalent energy density for the two PCM. However, a greater amount of energy is stored inside a same volume for PEG6000, as the mass density is more important;
- -
- The RT58 shows a melting and solidification behavior over a wider temperature range than PEG6000. Therefore, for RT58, the full potential of latent heat might not be fully exploited under the operating conditions of DHW applications. PEG6000 offers a narrower temperature range for the changes of state but, when tap water is drawn off, the PCM temperature must decrease below the supercooling breakthrough temperature to release the latent heat. However, once the solidification process has started, the heat peak is significant;
- -
- Selection of the PCM must be made according to the selected application considering the complete system including the heat exchangers. An accurate modelling of the system is therefore required as PEG6000 and RT58 show different thermal behaviors, especially during the cooling process;
- -
- Because of supercooling, PEG6000 seems more suited to a DHW storage operating with full charging and discharging cycles;
- -
- For a DHW frequently operating with partial phase change cycles, if the PCM temperature does not drop below 52 °C, latent heat will not be released for PEG6000 and the selection of RT58 is recommended, where most of the latent heat is released between 59 °C and 53 °C.
For future research on PCM characterization, it is recommended to investigate the thermal behavior of PCM for partial cycles, with an interruption of the heating and cooling loads during the phase change process. Concerning the experimental comparison of PCM suitable for DHW storage, the investigation might be extended to other PCM, and especially bio-based materials to improve the environmental impact of the storage.
Author Contributions
Conceptualization, M.T., L.Z., S.G., G.F., E.F., M.P.; methodology L.Z., S.G., G.F., M.T.; investigation, L.Z., S.G., E.F.; data curation, M.T., L.Z., S.G.; writing—editing, M.T., S.G., L.Z., G.F.; funding acquisition G.F. All authors have read and agreed to the published version of the manuscript.
Funding
This research was funded by the French Association National de la Recherche (ANR) for the EUROPA project, grant number ANR-18-CE05-0034-01.
Acknowledgments
This study is a part in the EUROPA research project funded by the ANR (French National Research Agency).
Conflicts of Interest
The authors declare that they have no known competing financial interests or personal relationships that could have appeared to influence the work reported in this paper.
References
- Evarts, J.C.; Swan, L.G. Domestic hot water consumption estimates for solar thermal system sizing. Energy Build. 2013, 58, 58–65. [Google Scholar] [CrossRef]
- Fuentes, E.; Arce, L.; Salom, J. A review of domestic hot water consumption profiles for application in systems and buildings energy performance analysis. Renew. Sustain. Energy Rev. 2018, 81, 1530–1547. [Google Scholar] [CrossRef]
- Pomianowski, M.; Johra, H.; Marszal, A.J.; Zhang, C. Sustainable and energy-efficient domestic hot water systems: A review. Renew. Sustain. Energy Rev. 2020, 128, 109900. [Google Scholar] [CrossRef]
- Calderón, A.; Barreneche, C.; Hernández-Valle, K.; Galindo, E.; Segarra, M.; Fernández, A.I. Where is Thermal Energy Storage (TES) research going?—A bibliometric analysis. Sol. Energy 2020, 200, 37–50. [Google Scholar] [CrossRef]
- Sharif, M.K.A.; Al-Abidi, A.A.; Mat, S.; Sopian, K.; Ruslan, M.H.; Sulaiman, M.Y.; Rosli, M.A.M. Review of the application of phase change material for heating and domestic hot water systems. Renew. Sustain. Energy Rev. 2015, 42, 557–568. [Google Scholar] [CrossRef]
- Dolado, P.; Mazo, J.; Lazaro, A.; Marin, J.M.; Zalba, B. Experimental validation of a theoretical model: Uncertainty propagation analysis to a PCM-air thermal energy storage unit. Energy Build. 2012, 45, 124–131. [Google Scholar] [CrossRef]
- Lazaro, A.; Peñalosa, C.; Solé, A.; Diarce, G.; Haussmann, T.; Fois, M.; Zalba, B.; Gshwander, S.; Cabeza, L.F. Intercomparative tests on phase change materials characterisation with differential scanning calorimeter. Appl. Energy 2013, 109, 415–420. [Google Scholar] [CrossRef]
- Dumas, J.-P.; Gibout, S.; Zalewski, L.; Johannes, K.; Franquet, E.; Lassue, S.; Bédécarrats, J.-P.; Tittelein, P.; Kuznik, F. Interpretation of calorimetry experiments to characterise phase change materials. Int. J. Therm. Sci. 2014, 78, 48–55. [Google Scholar] [CrossRef]
- Barreneche, C.; Solé, A.; Miró, L.; Martorell, I.; Fernandez, A.I.; Cabeza, L.F. Study on differential scanning calorimetry analysis with two operation modes and organic and inorganic phase change material (PCM). Thermochim. Acta 2013, 553, 23–26. [Google Scholar] [CrossRef]
- Lin, W.; Dalmazzone, D.; Fürst, W.; Delahaye, A.; Fournaison, L.; Clain, P. Accurate DSC measurement of the phase transition temperature in the TBPB–Water system. J. Chem. Thermodyn. 2013, 61, 132–137. [Google Scholar] [CrossRef]
- Thonon, M.; Fraisse, G.; Zalewski, L.; Pailha, M. Towards a better analytical modelling of the thermodynamic behaviour of phase change materials. J. Energy Storage 2020, 32, 101826. [Google Scholar] [CrossRef]
- Thonon, M.; Fraisse, G.; Zalewski, L.; Pailha, M. Analytical modelling of PCM supercooling including recalescence for complete and partial heating/cooling cycles. Appl. Therm. Eng. 2021, 190, 116751. [Google Scholar] [CrossRef]
- Joulin, A.; Younsi, Z.; Zalewski, L.; Lassue, S.; Rousse, D.R.; Cavrot, J.-P. Experimental and numerical investigation of a phase change material: Thermal-energy storage and release. Appl. Energy 2011, 88, 2454–2462. [Google Scholar] [CrossRef]
- Younsi, Z.; Zalewski, L.; Lassue, S.; Rousse, D.R.; Joulin, A. A Novel Technique for Experimental Thermophysical Characterization of Phase-Change Materials. Int. J. Thermophys. 2010, 32, 674–692. [Google Scholar] [CrossRef]
- Joulin, A.; Zalewski, L.; Lassue, S.; Naji, H. Experimental investigation of thermal characteristics of a mortar with or without a micro-encapsulated phase change material. Appl. Therm. Eng. 2014, 66, 171–180. [Google Scholar] [CrossRef]
- Tittelein, P.; Gibout, S.; Franquet, E.; Johannes, K.; Zalewski, L.; Kuznik, F.; Dumas, J.-P.; Lassue, S.; Bédécarrats, J.-P.; David, D. Simulation of the thermal and energy behaviour of a composite material containing encapsulated-PCM: Influence of the thermodynamical modelling. Appl. Energy 2015, 140, 269–274. [Google Scholar] [CrossRef]
- Tittelein, P.; Gibout, S.; Franquet, E.; Zalewski, L.; Defer, D. Identification of Thermal Properties and Thermodynamic Model for a Cement Mortar Containing PCM by Using Inverse Method. Energy Procedia 2015, 78, 1696–1701. [Google Scholar] [CrossRef]
- Seddegh, S.; Wang, X.; Henderson, A.D.; Xing, Z. Solar domestic hot water systems using latent heat energy storage medium: A review. Renew. Sustain. Energy Rev. 2015, 49, 517–533. [Google Scholar] [CrossRef]
- Nazir, H.; Batool, M.; Osorio, F.J.B.; Isaza-Ruiz, M.; Xu, X.; Vignarooban, K.; Phelan, P.; Inamuddin; Kannan, A.M. Recent developments in phase change materials for energy storage applications: A review. Int. J. Heat Mass Transf. 2019, 129, 491–523. [Google Scholar] [CrossRef]
- Jouhara, H.; Żabnieńska-Góra, A.; Khordehgah, N.; Ahmad, D.; Lipinski, T. Latent thermal energy storage technologies and applications: A review. Int. J. Thermofluids 2020, 5–6, 100039. [Google Scholar] [CrossRef]
- Kalidansan, B.; Pandey, A.K.; Shahabuddinc, S.; Samykanod, M.; Thirugnanasambandam, M.; Saidurb, R. Phase Change Materials Integrated Solar Thermal Energy Systems: Global Trends and Current Practices in Experimental Approaches. J. Energy Storage 2020, 27, 101118. [Google Scholar]
- Douvi, E.; Pagkalos, C.; Dogkas, G.; Koukou, M.K.; Stathopoulos, V.N.; Caouris, Y.; Vrachopoulos, M.G. Phase change materials in solar domestic hot water systems: A review. Int. J. Thermofluids 2021, 10, 100075. [Google Scholar] [CrossRef]
- Gulfam, R.; Zhang, P.; Meng, Z. Advanced thermal systems driven by paraffin-based phase change materials—A review. Appl. Energy 2019, 238, 582–611. [Google Scholar] [CrossRef]
- Lizana, J.; Chacartegui, R.; Padura, A.B.; Valverde, J.M. Advances in thermal energy storage materials and their applications towards zero energy buildings: A critical review. Appl. Energy 2017, 203, 219–239. [Google Scholar] [CrossRef]
- Kanimozhi, B.; Prabhu, A.; Anish, M.; Kumar, P.K.H. Review on Heat Transfer Enhancement Techniques in Thermal Energy Storage Systems. J. Eng. Res. Appl. 2014, 4, 144–149. [Google Scholar]
- Zhang, J.; Zhu, X.; Mondejar, M.E.; Haglind, F. A review of heat transfer enhancement techniques in plate heat exchangers. Renew. Sustain. Energy Rev. 2019, 101, 305–328. [Google Scholar] [CrossRef]
- Al-Maghalseh, M.; Mahkamov, K. Methods of heat transfer intensification in PCM thermal storage systems: Review paper. Renew. Sustain. Energy Rev. 2018, 92, 62–94. [Google Scholar] [CrossRef]
- Sharma, R.; Ganesan, P.; Tyagi, V.; Mahlia, T. Accelerated thermal cycle and chemical stability testing of polyethylene glycol (PEG) 6000 for solar thermal energy storage. Sol. Energy Mater. Sol. Cells 2016, 147, 235–239. [Google Scholar] [CrossRef]
- Kou, Y.; Wang, S.; Luo, J.; Sun, K.; Zhang, J.; Tan, Z.; Shi, Q. Thermal analysis and heat capacity study of polyethylene glycol (PEG) phase change materials for thermal energy storage applications. J. Chem. Thermodyn. 2019, 128, 259–274. [Google Scholar] [CrossRef]
- Tang, B.; Qiu, M.; Zhang, S. Thermal conductivity enhancement of PEG/SiO2 composite PCM by in situ Cu doping. Sol. Energy Mater. Sol. Cells 2012, 105, 242–248. [Google Scholar] [CrossRef]
- Verheyen, S.; Augustijns, P.; Kinget, R.; Mooter, G.V.D. Melting behavior of pure polyethylene glycol 6000 and polyethylene glycol 6000 in solid dispersions containing diazepam or temazepam: A DSC study. Thermochim. Acta 2001, 380, 153–164. [Google Scholar] [CrossRef]
- Shen, J.; Zhang, P.; Song, L.; Li, J.; Ji, B.; Li, J.; Chen, L. Polyethylene glycol supported by phosphorylated polyvinyl alcohol/graphene aerogel as a high thermal stability phase change material. Compos. Part B Eng. 2019, 179, 107545. [Google Scholar] [CrossRef]
- Tang, B.; Wei, H.; Zhao, D.; Zhang, S. Light-heat conversion and thermal conductivity enhancement of PEG/SiO2 composite PCM by in situ Ti4O7 doping. Sol. Energy Mater. Sol. Cells 2017, 161, 183–189. [Google Scholar] [CrossRef]
- Wang, C.; Chen, K.; Huang, Z.; Wang, T.; Chen, F. Effect of polymer-derived silicon carbonitride on thermal performances of polyethylene glycol based composite phase change materials. Sol. Energy 2020, 208, 282–288. [Google Scholar] [CrossRef]
- Yan, D.; Ming, W.; Liu, S.; Yin, G.; Zhang, Y.; Tang, B.; Zhang, S. Polyethylene glycol (PEG)/silicon dioxide grafted aminopropyl group and carboxylic multi-walled carbon nanotubes (SAM) composite as phase change material for light-to-heat energy conversion and storage. J. Energy Storage 2021, 36, 102428. [Google Scholar] [CrossRef]
- Feng, L.; Song, P.; Yan, S.; Wang, H.; Wang, J. The shape-stabilized phase change materials composed of polyethylene glycol and graphitic carbon nitride matrices. Thermochim. Acta 2015, 612, 19–24. [Google Scholar] [CrossRef]
- Sundararajan, S.; Samui, A.B.; Kulkarni, P.S. Synthesis and characterization of poly(ethylene glycol) acrylate (PEGA) copolymers for application as polymeric phase change materials (PCMs). React. Funct. Polym. 2018, 130, 43–50. [Google Scholar] [CrossRef]
- Mondal, S. Phase Change Materials for Smart Textiles—An Overview. Appl. Therm. Eng. 2008, 28, 1536–1550. [Google Scholar] [CrossRef]
- Safari, A.; Saidur, R.; Sulaiman, F.; Xu, Y.; Dong, J. A review on supercooling of Phase Change Materials in thermal energy storage systems. Renew. Sustain. Energy Rev. 2017, 70, 905–919. [Google Scholar] [CrossRef]
- Clausse, D.; Dumas, J.-P. Supercooling, Crystallization and Melting within Emulsions and Divided Systems: Mass, Heat Transfers and Stability; Bentham Science Publishers Ltd.: Sharjah, United Arab Emirates, 2016. [Google Scholar]
- Nejman, A.; Cieslak, M. The impact of the heating/cooling rate on the thermoregulating properties of textile materials modified with PCM microcapsules. Appl. Therm. Eng. 2017, 127, 212–223. [Google Scholar] [CrossRef]
- Mollova, A.; Androsch, R.; Mileva, D.; Schick, C.; Benhamida, A. Effect of Supercooling on Crystallization of Polyamide 11. Macromolecules 2013, 46, 828–835. [Google Scholar] [CrossRef]
- García-Romero, A.; Diarce, G.; Ibarretxe, J.; Urresti, A.; Sala, J. Influence of the experimental conditions on the subcooling of Glauber’s salt when used as PCM. Sol. Energy Mater. Sol. Cells 2012, 102, 189–195. [Google Scholar] [CrossRef]
- Adachi, T.; Daudah, D.; Tanaka, G. Effects of Supercooling Degree and Specimen Size on Supercooling Duration of Erythritol. ISIJ Int. 2014, 54, 2790–2795. [Google Scholar] [CrossRef] [Green Version]
- Zhou, G.; Xiang, Y. Experimental investigations on stable supercooling performance of sodium acetate trihydrate PCM for thermal storage. Sol. Energy 2017, 155, 1261–1272. [Google Scholar] [CrossRef]
- Faucheux, M.; Muller, G.; Havet, M.; LeBail, A. Influence of surface roughness on the supercooling degree: Case of selected water/ethanol solutions frozen on aluminium surfaces. Int. J. Refrig. 2006, 29, 1218–1224. [Google Scholar] [CrossRef]
- Ukrainczyk, N.; Kurajica, S.; Šipuši, J. Thermophysical Comparison of Five Commercial Paraffin Waxes as Latent Heat Storage Materials. Chem. Biochem. Eng. Q. 2010, 24, 129–137. [Google Scholar]
- Gasia, J.; Miró, L.; De Gracia, A.; Barreneche, C.; Cabeza, L.F. Experimental Evaluation of a Paraffin as Phase Change Material for Thermal Energy Storage in Laboratory Equipment and in a Shell-and-Tube Heat Exchanger. Appl. Sci. 2016, 6, 112. [Google Scholar] [CrossRef]
- Feliński, P.; Sekret, R. Experimental study of evacuated tube collector/storage system containing paraffin as a PCM. Energy 2016, 114, 1063–1072. [Google Scholar] [CrossRef]
- Beaupere, N.; Soupremanien, U.; Zalewski, L. Nucleation triggering methods in supercooled phase change materials (PCM), a review. Thermochim. Acta 2018, 670, 184–201. [Google Scholar] [CrossRef]
- Strobl, G. Crystallization and melting of bulk polymers: New observations, conclusions and a thermodynamic scheme. Prog. Polym. Sci. 2006, 31, 398–442. [Google Scholar] [CrossRef]
- Ginés, J.; Arias, M.; Moyano, J.; Sánchez-Soto, P.J. Thermal investigation of crystallization of polyethylene glycols in solid dispersions containing oxazepam. Int. J. Pharm. 1996, 143, 247–253. [Google Scholar] [CrossRef]
- Hobbs, J. In situ atomic force microscopy of the melting of melt-crystallized polyethylene. Polymer 2006, 47, 5566–5573. [Google Scholar] [CrossRef]
- Wilson, P. Supercooling; IntechOpen: London, UK, 2012. [Google Scholar]
- De With, G. Liquid-State Physical Chemistry: Fundamentals, Modeling, and Applications; Wiley-VCH: Weinheim, Germany, 2013. [Google Scholar]
Publisher’s Note: MDPI stays neutral with regard to jurisdictional claims in published maps and institutional affiliations. |
© 2021 by the authors. Licensee MDPI, Basel, Switzerland. This article is an open access article distributed under the terms and conditions of the Creative Commons Attribution (CC BY) license (https://creativecommons.org/licenses/by/4.0/).