
Layout Model of Bike-Sharing Facilities in the Transfer-Influenced Area of a Subway Station


Abstract
:1. Introduction
2. Methodology
2.1. Data Collection
2.1.1. Data Description
2.1.2. Data Cleaning
- Deletion of null data. The original data contained abnormal data for system reasons, such as GPS equipment and data transmission. For example, there were null values in the riding time and geographic location information. These null data were deleted.
- Deletion of duplicate field data. The order number must be a unique value. Abnormal data with duplicate fields in the order data were deleted.
- Deletion of cross-border data. The coordinates of the city area of Nanjing are from 31°14″ N to 32°37″ N, and from 118°22″ E to 119°14″ E, so it was necessary to delete the data located outside the coordinate range.
- Deletion of abnormal usage time data. It was necessary to delete the records in which the rental date and return date were not the same day.
- Deletion of abnormal data of riding time. The 98% quantile of the original riding data was 40 min, so 30 min was used as the cleaning standard for the time dimension, and data with a riding time exceeding 40 min were deleted. Taking into account the operation time for the user to pick up and return the bicycle, records with less than 60 s were deleted.
- Deletion of abnormal data of riding distance. Due to the bike-sharing company’s policy of rewarding users for using bike-sharing, some users have generated many abnormal orders, so the records of travel distances less than 150 m were excluded in this research. In this study, the main role of bike-sharing was to transfer to rail transit, so the data concerning long-distance travel were excluded. The upper distance limit was 5 km.
2.1.3. Transfer-Ride Data Extraction
2.2. Transfer-Cost Function Establishment
2.2.1. Travel-Time Cost
- Walking. When the traveler chooses to walk to the subway station to transfer to the rail transit, travel time indicates the time for the traveler to walk to the station. The walking travel-time cost is shown in Equation (2).
- Bike-sharing. When the traveler chooses to ride a shared bike to the rail station, the travel time includes the time for the traveler to walk to the bike-sharing facility , the time for opening and locking the bicycle , and the time for the traveler to cycle to the station . The bike-sharing travel-time cost is shown in Equation (3).
- Bus. When the traveler chooses to take the bus to the rail station, the travel time includes the time for the traveler to walk to the bus stop , the waiting time at the bus stop , and the time to take the bus to the station . The bus travel time cost is shown in Equation (4).
2.2.2. Travel Expense
2.2.3. Transfer Cost
2.3. Alternative Facility Location Prediction
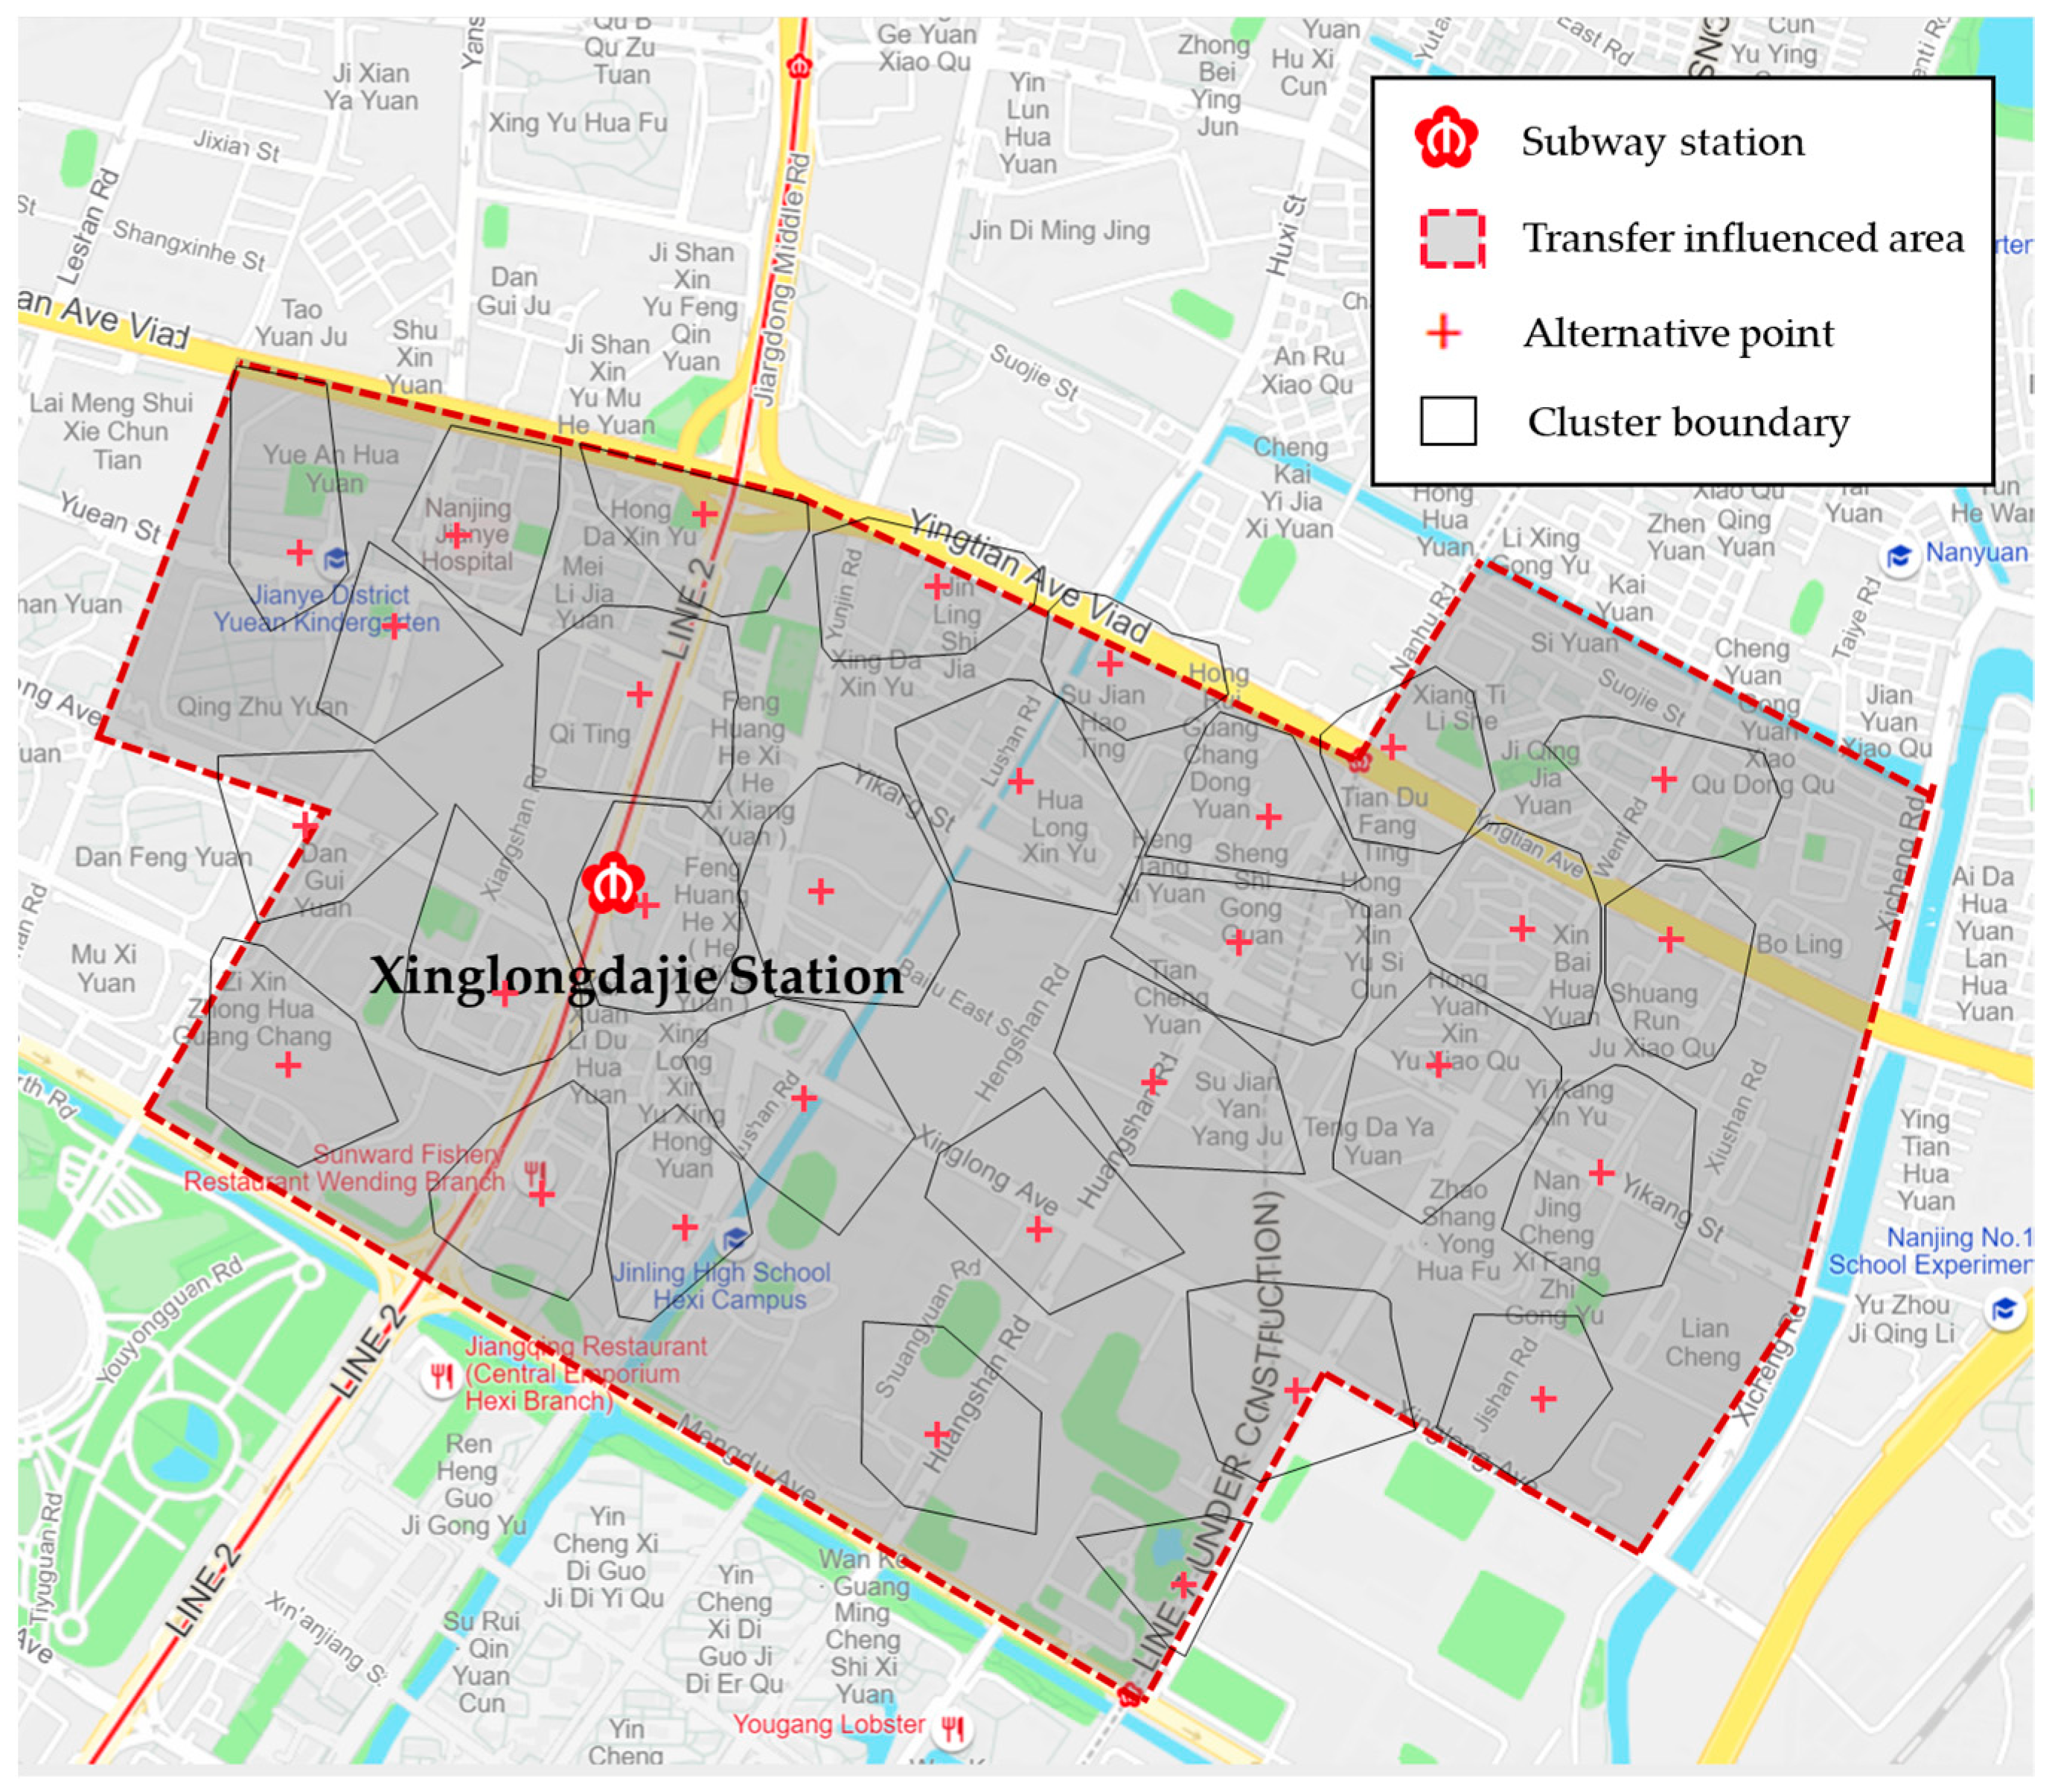
2.3.1. Transfer-Influenced Area Determination
2.3.2. Location Prediction
- Filtering the bike-sharing order data of the destination coordinates within 50 m of each exit of the subway station. The purpose of these bike-sharing orders was considered to transfer to rail transit in this paper.
- Filtering the bike-sharing order data again to obtain the coordinates of the origin located in the transfer-influenced area of the subway station, and modifying the acquired order data in the transfer-influenced area based on the actual land characteristics.
- Clustering the origin coordinates of the bike-sharing order data, and adjusting the clustering value K continuously, so that the area of the convex hull composed by the origin coordinates of the same class was small enough to be within walking distance.
- Integrating the resulting data into ArcGIS, marking the cluster center, and drawing the cluster boundary.
2.3.3. Allocation Prediction
2.4. Bi-Level Programming Model of Bike-Sharing Facility Layout and Configuration Based on Alternative Locations
2.4.1. Upper Model
- Bike-sharing ride volume (Equation (9)), which refers to the number of people who use shared bikes to transfer to rail transit in each traffic zone in the transfer-influenced area.
- Facility-operation cost (Equation (10)), which mainly includes the operation cost of bike-sharing facilities and overload penalty.
- Overall transfer cost (Equation (11)), which mainly includes the cost of walking, bike-sharing and bus transfer to subway station.
2.4.2. Lower Model
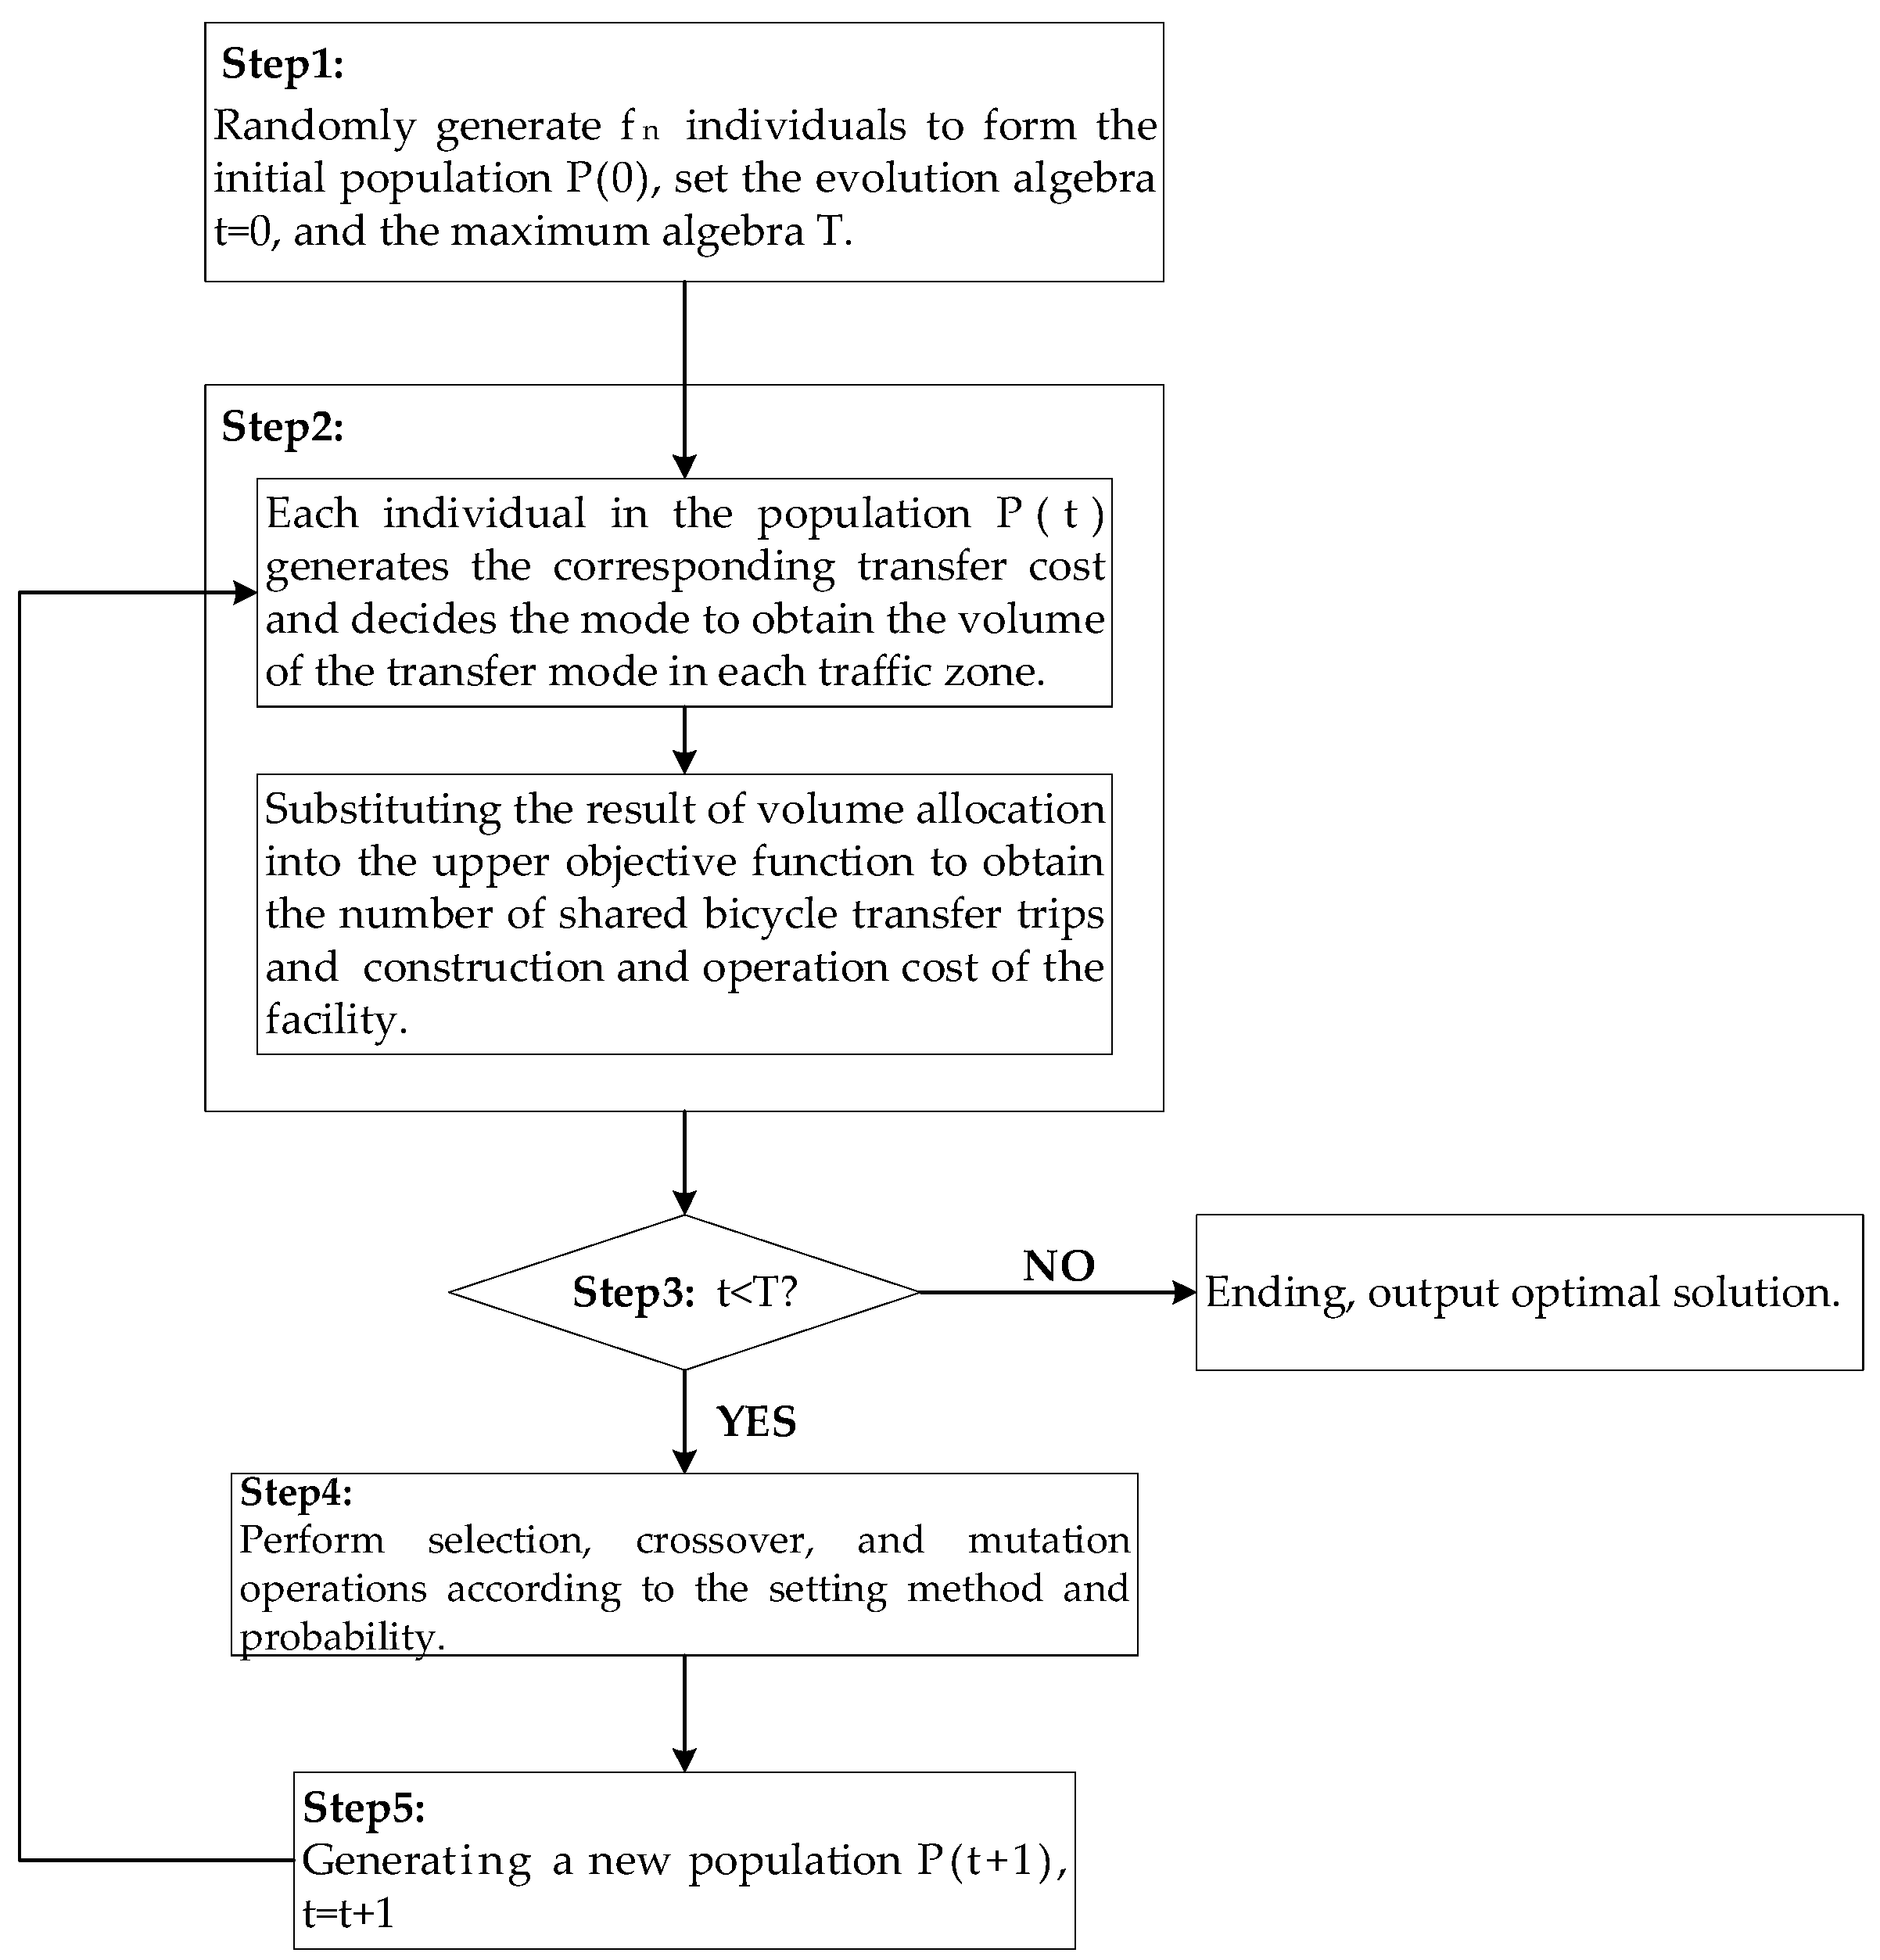
2.5. Model Solving
3. Results and Discussion
3.1. Transfer-Influenced Area and Traffic Zone Division Results
3.2. Alternative Location Point Prediction Results
3.3. Model Paremeters
- The unit time value. According to the relevant statistical data, in 2019, the per capita disposable income of Nanjing residents was 64,372 yuan. According to Equation (1), the unit time value of Nanjing residents is 0.51 yuan/min (40-h week).
- Walking speed. Generally speaking, the walking speed of travelers is between 1–1.5 m/s. In this paper, the walking speed was 1.25 m/s.
- Single ride cost. There are two common billing rules for bike-sharing: the first is the normal single payment, and the second is the monthly card payment. The normal payment for a single ride is based on the time spent on each bike. According to the latest Mobike pricing rules in November 2019, a single ride costs 1.5 yuan within 15 min, and if it exceeds 15 min, the duration fee is 0.5 yuan/15 min. The price increase trend makes it more cost-effective to pay with monthly cards. With the purchase of monthly cards, there is no limit to the number of rides users can take. Travelers who use shared bikes to transfer to rail transit use shared bikes frequently, so the monthly card payment method is cheaper. In this paper, it was assumed that all users who transferred to transportation used monthly cards to pay. As an example, with Mobike’s latest monthly card of 25 yuan the cost of each riding is 0.5 yuan (22-day month, twice per day).
- Riding speed. According to the riding report published by Mobike, the average riding speed of bike-sharing is 8 km/h.
- Opening and locking time. Considering that travelers need to spend time opening and locking the bike in addition to actual traveling time, this paper estimates that the opening and locking time of a single trip is 2 min.
- Bus fare. The regular bus lines currently operating in Nanjing all adopt the one-ticket system, and the fare is 2 yuan. Therefore, the value of a single bus fare is 2 yuan.
- Bus speed. The operating speed of a bus is affected by road traffic conditions and the time it takes to pick up and drop off passengers. Bus operating speed was checked in real time through the Baidu map API interface, and the operating speed of the bus in Nanjing was found to be 20 km/h.
- Bus waiting time. There are four bus lines in the affected area of the Xinglongdajie subway station, and the average waiting time for passengers is 8 min.
3.4. Layout and Configuration Results
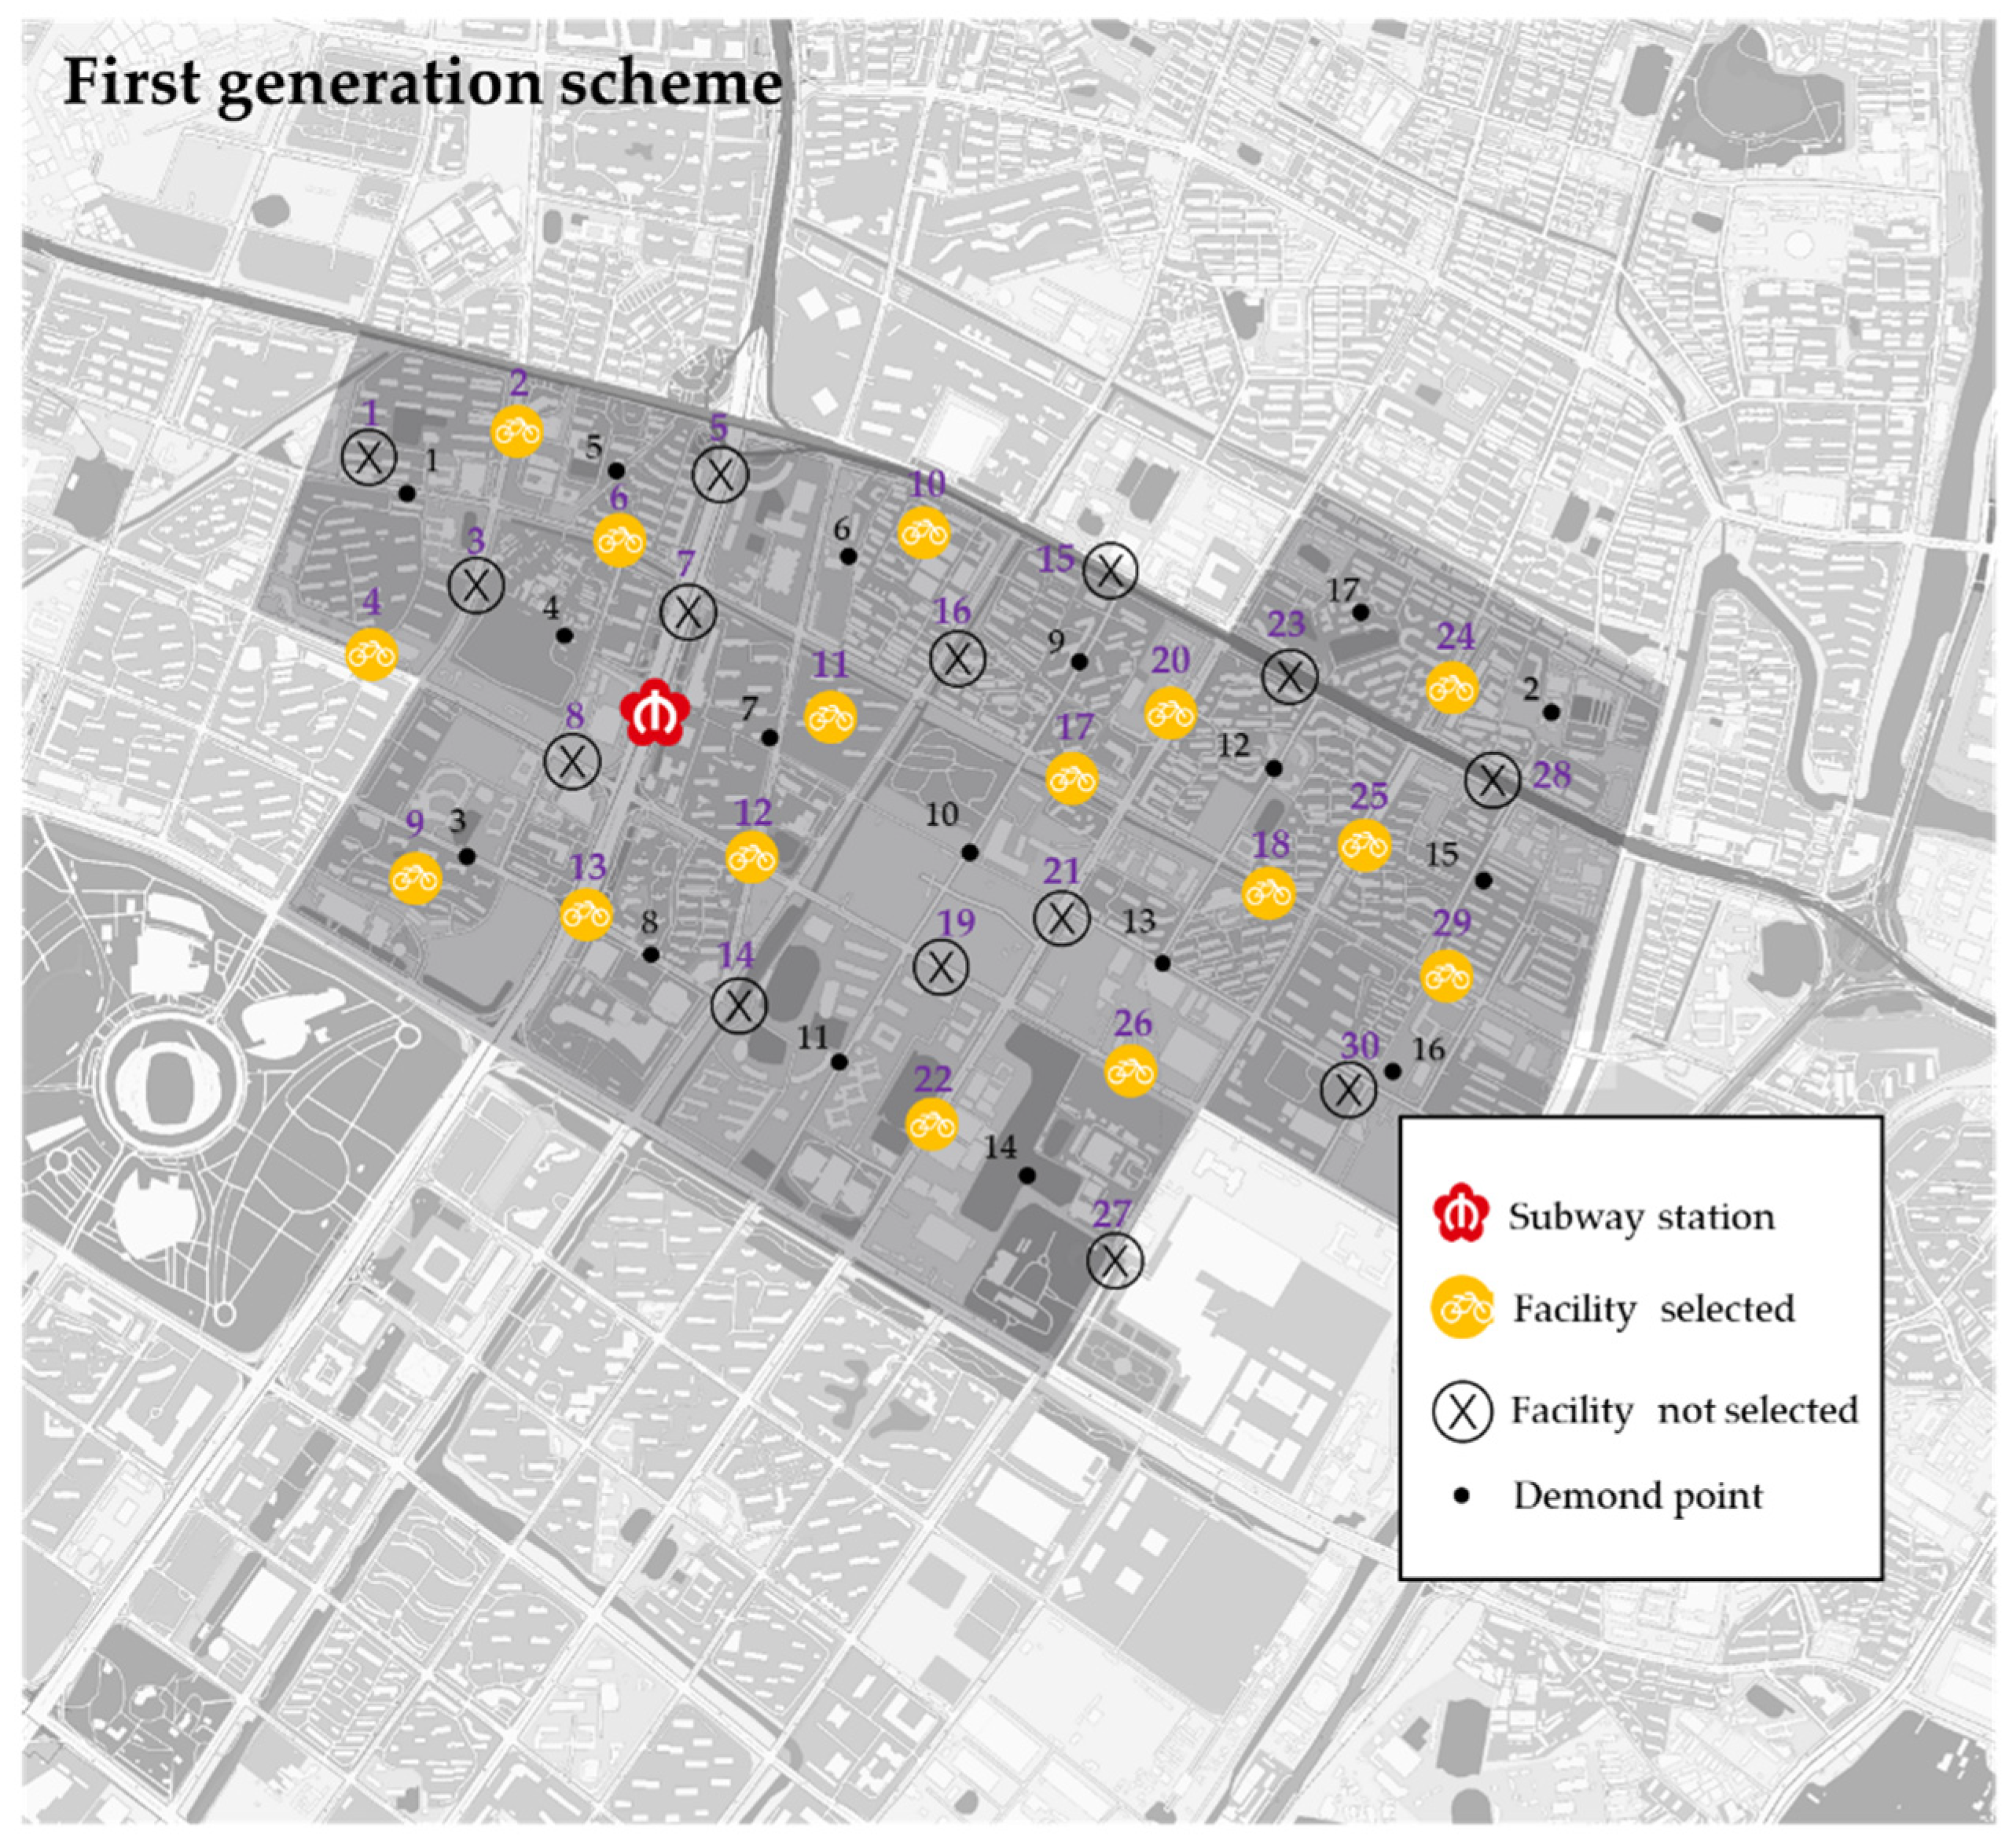
- Overall supply. The first-generation scheme was equipped with 16 shared bike facilities for a total of 477 shared bikes; the optimal plan was equipped with 20 facilities for 560 shared bikes. The optimal scheme increased the number of facilities compared to the first generation, which meant it could provide more shared bikes to meet potential transfer-ride demands.
- Spatial location. There was a certain difference between the optimal scheme and the first-generation scheme. The optimal scheme added facilities 5, 14, 19, 23 and 30 to serve the adjacent traffic zones, therefore, the travelers in traffic zones 1, 5, 11, 16 and 17 had more choices for transferring to the subway station, which reduced the transfer cost for travelers.
- Single-point allocation. Compared with the first-generation scheme, the optimal scheme had a more balanced bike allocation. The maximum number of bikes allocated in the first-generation scheme was 54 and the minimum was 10, and there was an overload penalty according to the number of bikes allocated exceeding the limitation. Correspondingly, the maximum number of bicycles allocated for the optimal scheme was 41 and the minimum was 14, which met the basic bike allocation requirement for facilities. Combined with real-time shared bicycle scheduling during peak periods, this could help avoid possible problems of bike accumulation and shortages.
- The model optimization effect is related to the multi-objective weight of the facility layout in the transfer-influenced area. Theoretically, to maximize riding volume and minimize the number of facilities, it is necessary to reduce the transfer costs and choose the facility location with the shortest walking distance wherever possible, and provide sufficient shared bikes to meet demand. On the one hand, if the number of facilities is too small, the accumulation of a large number of shared bikes will increase the overload penalty corresponding to the number of transfer rides, while on the other hand, too many facilities will trigger resource waste penalties due to oversupply. Therefore, the optimal layout scheme needs to consider the comprehensive effect of multi-objective optimization at the same time, and solve the layout scheme with optimal comprehensive benefit.
- The optimization effect is related to the input parameters of the model. The bi-level programming model is an optimization model in which the upper-level location plan and the lower-level division interact each other and dynamically change. Assuming that the overall demand remains unchanged, changes in the single-use cost parameters of bike-sharing and bus will lead to changes in transfer cost, which will cause changes in the sharing rate of transfer modes, and indirectly affect the layout scheme. The total number of facilities supplied and the number of basic bikes allocated will directly affect the number of facilities and bikes allocated, which in turn has an impact on the final result of the sharing rate of transfer mode division.
3.5. Parameter Sensitivity Analysis
3.5.1. Multi-Objective Weight Parameter
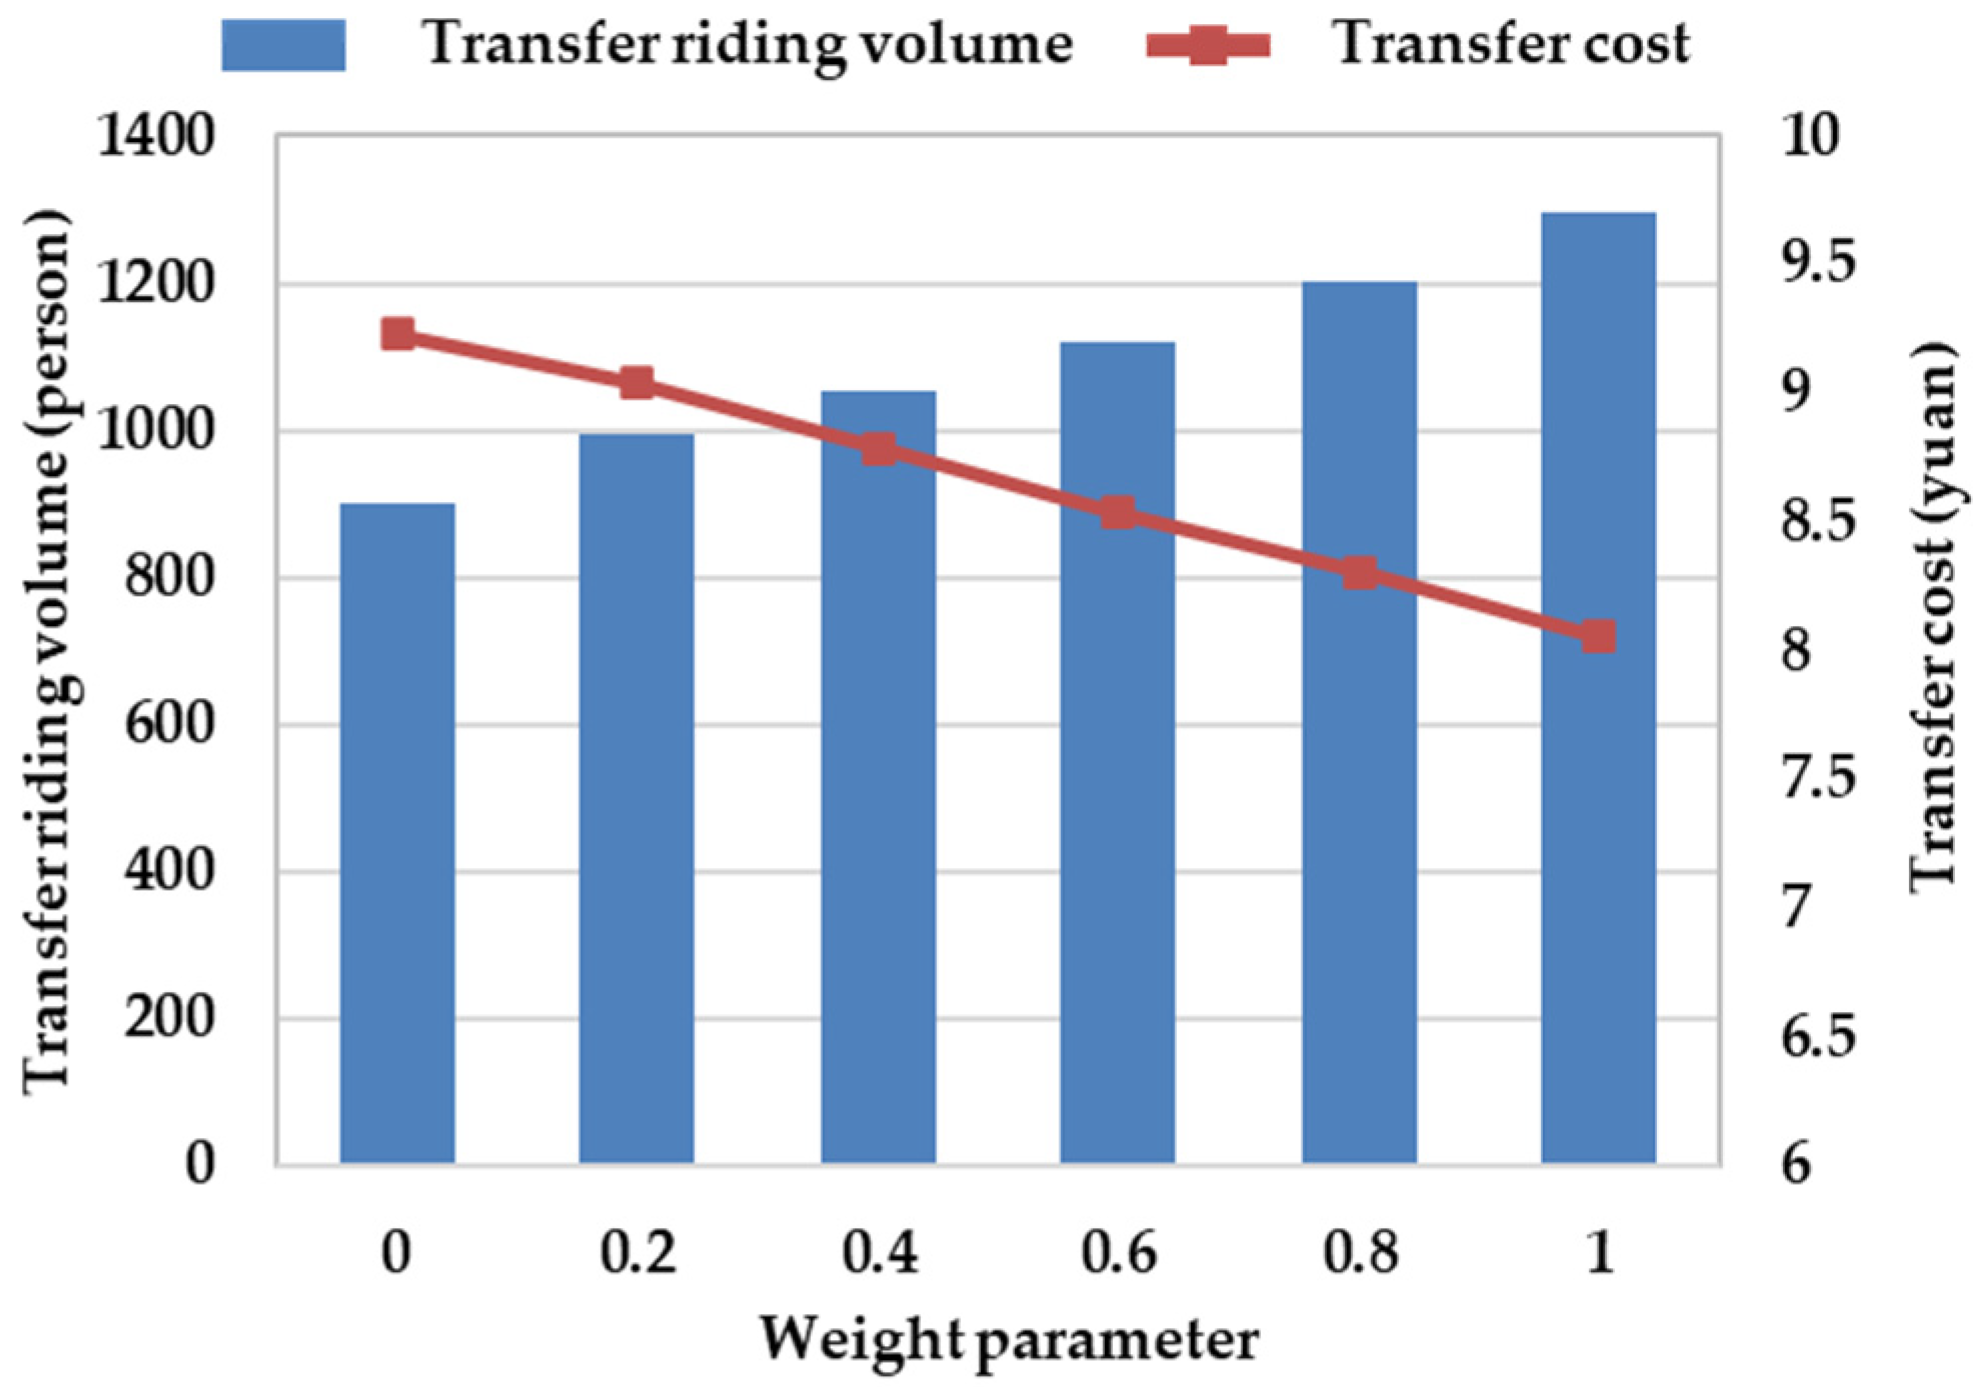
- The target weight parameter has a significant impact on the overall transfer-ride volume. Therefore, within the range of acceptable facility operating costs, managers can appropriately adjust the weights in the objective function of the two-level programming model to obtain a more suitable configuration plan. This plan aims to increase the transfer-ride volume of shared bikes and promote the conversion of combined travel modes.
- Under the premise of controlling other input parameters unchanged, the transfer cost of a single transfer-ride is opposite to the change trend of the transfer-ride volume. That is, under the precondition of giving priority to the promotion of transferring and riding, the optimized configuration plan reduces the transfer-ride cost through the corresponding facility configuration, thereby enhancing the relative advantage of choosing walking and bus for transfer to the rail station, attracting more travelers choose the bike-sharing.
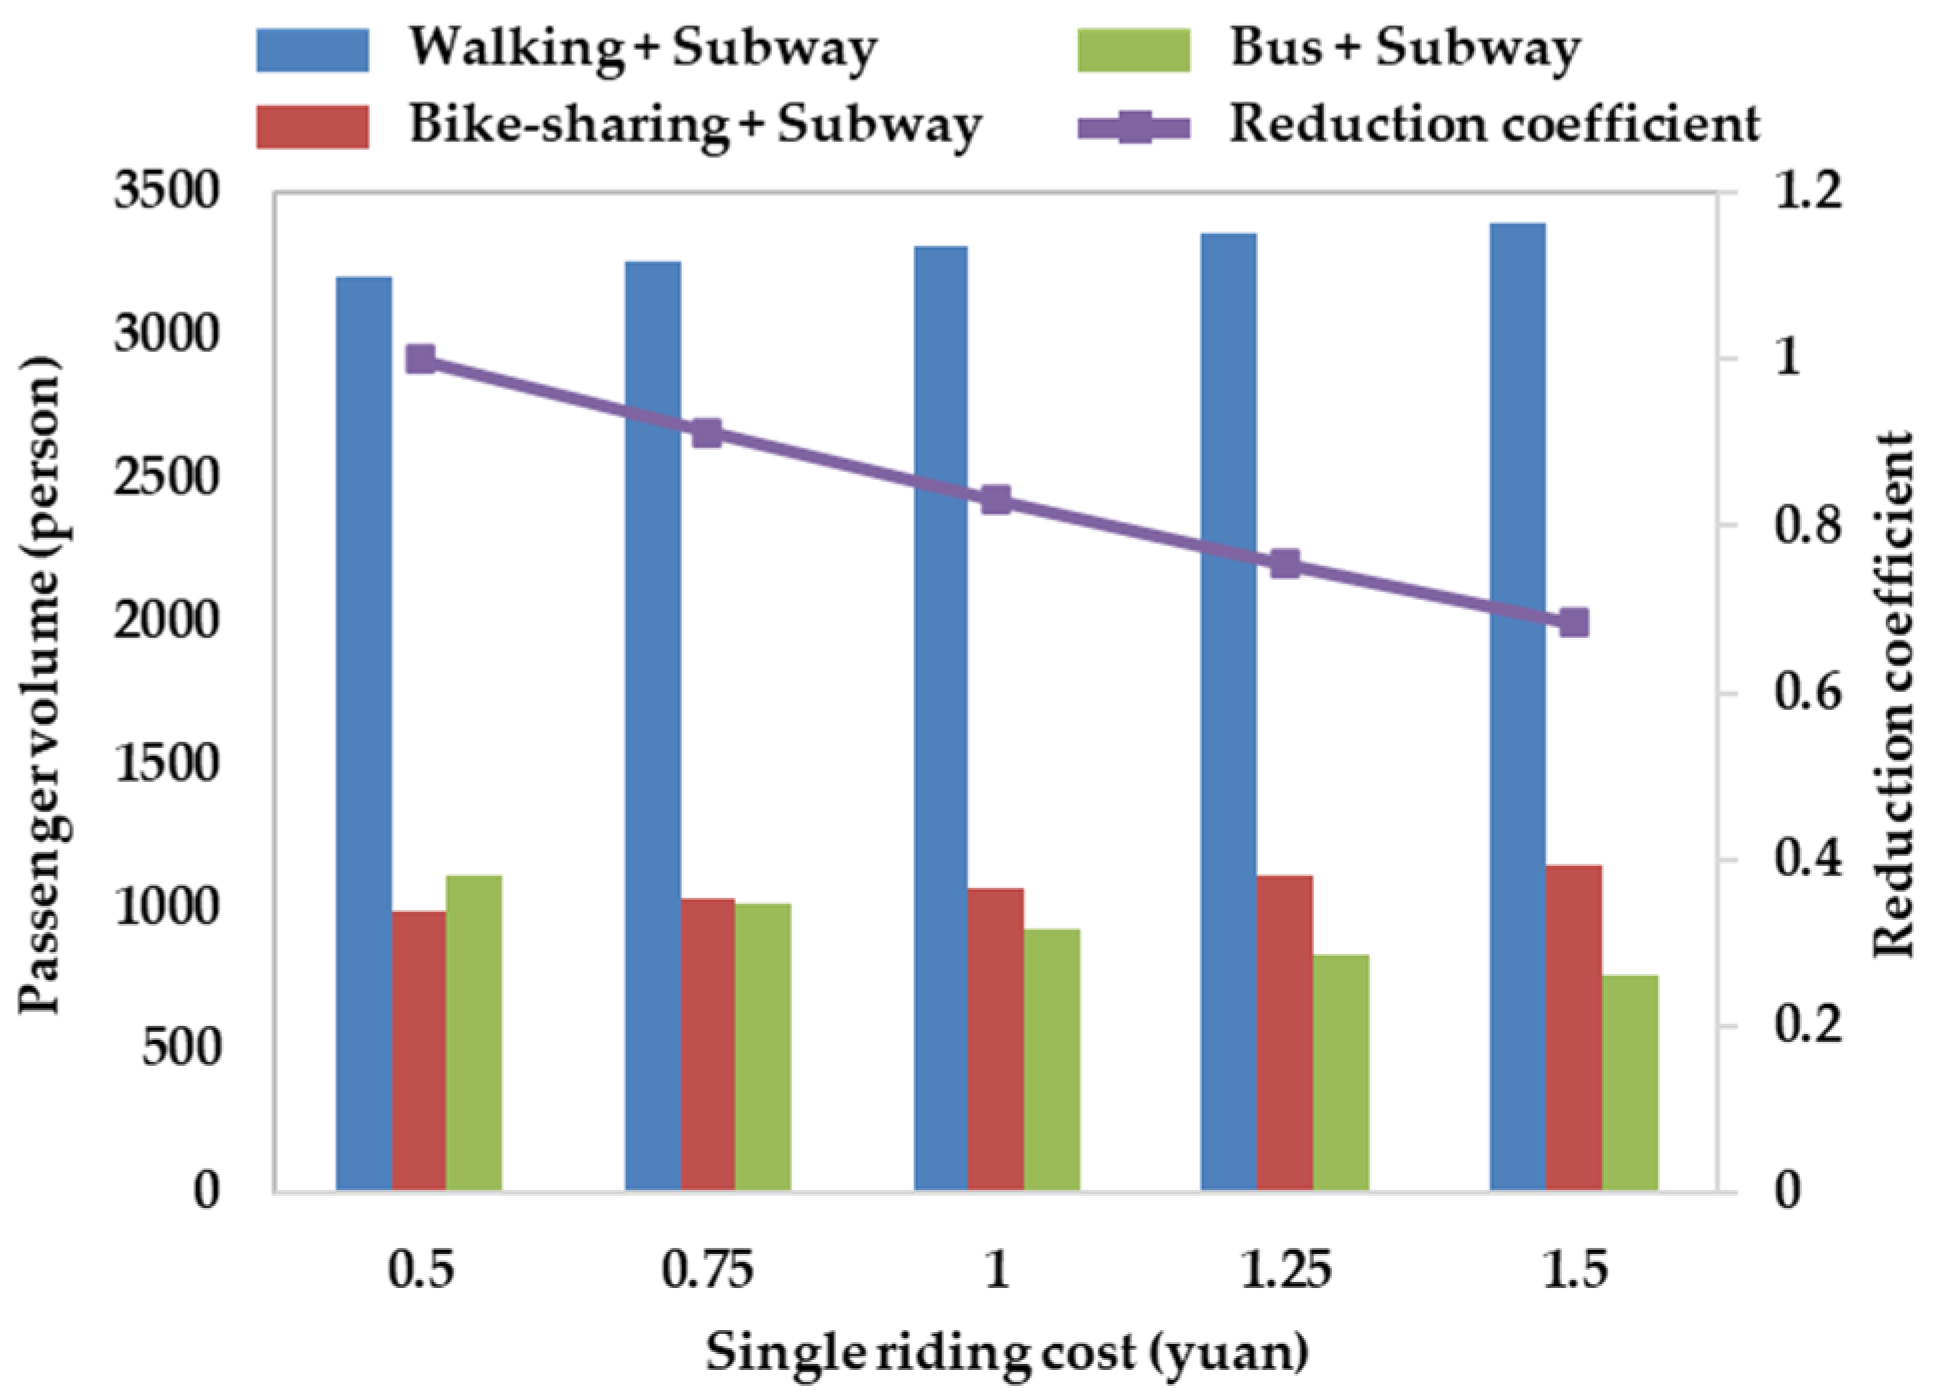
3.5.2. Single Ride Cost
- Travelers who use bike-sharing to transfer to rail transit are more sensitive to the cost of a single trip. With the increase in the cost of a single bike-share ride, the change in the transfer volume of bike-sharing showed a gradual decline. When the cost was 0.5 yuan, the maximum volume of bike-sharing transferring to rail transit was 1121. The minimum volume was 758 when the cost was 1.5 yuan.
- With the increase in the single-ride cost of bike-sharing, the travelers who originally chose bike-sharing to transfer to rail transit changed to walking or bus, which indicates that while the transfer cost of bike-sharing is gradually increasing, some travelers are not willing to spend more and will choose alternative modes of transfer to rail transit.
- The above analysis shows that in order to increase the number of bike-sharing rides and guide travelers to choose the combined travel mode of “bike-sharing + subway” while rationally deploying facilities, formulating reasonable cycling prices or monthly subscription policies is an effective method.
3.5.3. Upper- and Lower-Limit Parameters of Bike-Sharing Allocation
- Under the premise that other parameters remain unchanged, the number of selected bike-sharing facilities would firstly decrease and then remain stable with the increase in the upper limit of bike-sharing allocation. If the upper limit parameter of a single facility is less than 80, the optimal layout and configuration scheme provides more choice for transferring and riding for travelers by adding facilities, and shares the ride demand of a single facility point as much as possible, so as to avoid the overload penalty of excessive demand on the comprehensive benefit value of a single point. If the upper limit parameter exceeds 80, as shown in Figure 10, theoretically all the travel needs of each traffic zone can be met by a single facility, and only the corresponding optimal facility points need to be deployed, so the layout and configuration scheme will no longer change, and the number of optimal facilities also no longer decrease. Compared with the first-generation scheme (Figure 6), we found that multiple sub-optimal facilities (such as 2, 4, 12) were selected. The transfer cost of bike-sharing was affected by the sub-optimal facility. Compared with the optimal facility scheme (Figure 7), the basic layout and configuration scheme is similar, because it is possible to build some facilities with large numbers of bikes (such as 1, 25, 26), so as to reduce the number of facility points.
- With the increase in the upper limit parameter, the transfer-ride volume increases at first and then remains stable. When the upper limit parameter is less than 80, the maximum supply of the optimal facility relative to a travel zone cannot meet all the transfer-ride needs, and travelers need to choose the next best neighboring facility, which affects the transfer-ride volume. When the upper limit parameter is greater than 80, this indicates that the supply of single facility point is sufficient, the original problem is equivalent to finding the scheme with the largest transfer-ride volume and the least number of facilities in the influenced area. At this time, all travelers in different traffic zones can meet the demand of transfer and riding by choosing the nearest facility, without causing overload penalty and reducing the comprehensive benefit value; therefore, the optimal scheme will no longer change, and the volume will no longer increase.
4. Conclusions
Author Contributions
Funding
Institutional Review Board Statement
Informed Consent Statement
Data Availability Statement
Conflicts of Interest
References
- Tolley, R. Sustainable Transport; CRC Press: Boca Raton, FL, USA, 2003. [Google Scholar]
- Márquez, L.; Soto, J.J. Integrating perceptions of safety and bicycle theft risk in the analysis of cycling infrastructure preferences. Transp. Res. Part A Policy Pract. 2021, 150, 285–301. [Google Scholar] [CrossRef]
- D’Apuzzo, M.; Santilli, D.; Evangelisti, A.; Nicolosi, V. Some Remarks on Soft Mobility: A New Engineered Approach to the Cycling Infrastructure Design. In Proceedings of the 21st International Conference on Computational Science and Its Applications(ICCSA 2021), Cagliari, Italy, 13–16 September 2021; pp. 441–456. [Google Scholar]
- D’Apuzzo, M.; Santilli, D.; Evangelisti, A.; Nicolosi, V. A conceptual framework for risk assessment in road safety of vulnerable users. In Proceedings of the 21st International Conference on Computational Science and Its Applications(ICCSA 2021), Cagliari, Italy, 13–16 September 2021; pp. 542–556. [Google Scholar]
- Libby, T.; Laura, S.; Charlie, Z.; Wesley, K.; Katy, L.; Bo, L.; Zachary, H.; Andrew, B.; Joseph, T.; Robert, J.S. Systemic Pedestrian Safety Analysis; The National Academies Press: Washington, DC, USA, 2018; p. 113. [Google Scholar]
- Santilli, D.; D’Apuzzo, M.; Evangelisti, A.; Nicolosi, V. Towards Sustainability: New Tools for Planning Urban Pedestrian Mobility. Sustainability 2021, 13, 9371. [Google Scholar] [CrossRef]
- Pucher, J.; Buehler, R. Cycling towards a more sustainable transport future. Transp. Rev. 2017, 37, 689–694. [Google Scholar] [CrossRef] [Green Version]
- Wang, Z.; Cheng, L.; Li, Y.; Li, Z. Spatiotemporal Characteristics of Bike-Sharing Usage around Rail Transit Stations: Evidence from Beijing, China. Sustainability 2020, 12, 1299. [Google Scholar] [CrossRef] [Green Version]
- Hao, J. Research on Layout Allocation of Shared Bicycle Facilities in Urban Rail Transit Interchange Affected Area. Master’s Thesis, Southeast University, Nanjing, China, 2020. [Google Scholar]
- Nair, R.; Miller-Hooks, E. Fleet Management for Vehicle Sharing Operations. Transp. Sci. 2010, 45, 524–540. [Google Scholar] [CrossRef]
- Shu, J.; Chou, M.C.; Liu, Q.; Teo, C.-P.; Wang, I.L. Models for Effective Deployment and Redistribution of Bicycles Within Public Bicycle-Sharing Systems. Oper. Res. 2013, 61, 1346–1359. [Google Scholar] [CrossRef]
- Lin, J.-R.; Yang, T.-H. Strategic design of public bicycle sharing systems with service level constraints. Transp. Res. Part E Logist. Transp. Rev. 2011, 47, 284–294. [Google Scholar] [CrossRef]
- Çelebi, D.; Yörüsün, A.; Işık, H. Bicycle sharing system design with capacity allocations. Transp. Res. Part B Methodol. 2018, 114, 86–98. [Google Scholar] [CrossRef]
- Yan, S.; Lu, C.-C.; Wang, M.-H. Stochastic fleet deployment models for public bicycle rental systems. Int. J. Sustain. Transp. 2018, 12, 39–52. [Google Scholar] [CrossRef]
- Frade, I.; Ribeiro, A. Bike-sharing stations: A maximal covering location approach. Transp. Res. Part A Policy Pract. 2015, 82, 216–227. [Google Scholar] [CrossRef]
- Martinez, L.M.; Caetano, L.; Eiró, T.; Cruz, F. An Optimisation Algorithm to Establish the Location of Stations of a Mixed Fleet Biking System: An Application to the City of Lisbon. Procedia Soc. Behav. Sci. 2012, 54, 513–524. [Google Scholar] [CrossRef] [Green Version]
- Jiang, Y. Research on the Demand Analysis and Rental Location of Urban Public Bicycles. Master’s Thesis, Southeast University, Nanjing, China, 2018. [Google Scholar]
- Yan, S.; Lin, J.-R.; Chen, Y.-C.; Xie, F.-R. Rental bike location and allocation under stochastic demands. Comput. Ind. Eng. 2017, 107, 1–11. [Google Scholar] [CrossRef]
- Caggiani, L.; Camporeale, R.; Ottomanelli, M.; Szeto, W.Y. A modeling framework for the dynamic management of free-floating bike-sharing systems. Transp. Res. Part C Emerg. Technol. 2018, 87, 159–182. [Google Scholar] [CrossRef]
- Reiss, S.; Bogenberger, K. Validation of a Relocation Strategy for Munich’s Bike Sharing System. Transp. Res. Procedia 2016, 19, 341–349. [Google Scholar] [CrossRef]
- Zhang, J.; Li, W.; Wang, G.; Yu, J. Feasibility Study of Transferring Shared Bicycle Users with Commuting Demand to Flex-Route Transit—A Case Study of Nanjing City, China. Sustainability 2021, 13, 6067. [Google Scholar] [CrossRef]
- Zhang, S.; Chen, L.; Li, Y. Shared Bicycle Distribution Connected to Subway Line Considering Citizens’ Morning Peak Social Characteristics for Urban Low-Carbon Development. Sustainability 2021, 13, 9263. [Google Scholar] [CrossRef]
- Liu, W. Study on Reasonable Attracting Scope of Bike Transfer to Rail Transit. Master’s Thesis, East China Jiaotong University, Nanchang, China, 2016. [Google Scholar]
- Kono, T.; Kishi, A.; Seita, E.; Yokoi, T. Limitations of using generalized transport costs to estimate changes in trip demand: A bias caused by the endogenous value of time. Transp. A Transp. Sci. 2018, 14, 192–209. [Google Scholar] [CrossRef]
- Lin, D.; Zhang, Y.; Zhu, R.; Meng, L. The analysis of catchment areas of metro stations using trajectory data generated by dockless shared bikes. Sustain. Cities Soc. 2019, 49, 101598. [Google Scholar] [CrossRef]
- Ai, Y.; Li, Z.; Gan, M. A solution to measure traveler’s transfer tolerance for walking mode and dockless bike-sharing mode. J. Supercomput. 2019, 75, 3140–3157. [Google Scholar] [CrossRef]
- Cascetta, E. Transportation Systems Analysis: Models and Applications; Springer: Berlin/Heidelberg, Germany, 2009; Volume 29, p. 742. [Google Scholar]
- He, L.; Li, X.; Chen, D. An Optimization Model of the Layout of Public Bike Rental Stations Based on B+R Mode. Lect. Notes Electr. Eng. 2014, 277, 1341–1348. [Google Scholar] [CrossRef]
- Lin, C.; Chen, Y.; Huang, J.; Xiang, X. A Survey on Models and Solutions of Multi-Objective Optimization for QoS in Services Computing. Chin. J. Comput. 2015, 38, 1907–1923. [Google Scholar] [CrossRef]
- Pei, Y.; Ma, B.; Yang, S. Analysis on the Competitiveness of Public Transport and Private Transportation of Urban Residents. J. Chongqing Univ. Technol. (Nat. Sci.) 2020, 34, 169–175. [Google Scholar]
- He, S. Analysis of Travel Mode Choice Behavior of Urban Residents Based on Generalized Cost. Mod. Transp. Technol. 2016, 13, 79–83. [Google Scholar] [CrossRef]
- Duan, C. Optimizing the Layout of Bike-sharing Rental Stations with Facility Disruption. Master’s Thesis, Chang’an University, Xi’an, China, 2017. [Google Scholar]
- Zhou, X.; Ling, X. Review on the theory and technology of genetic algorithm. Comput. Inf. Technol. 2010, 4, 37–39. [Google Scholar]


| Order ID | Bike ID | Borrowing Time | Origin Longitude | Origin Latitude | Returning Time | Destination Longitude | Destination Latitude |
|---|---|---|---|---|---|---|---|
| MBK0200021 *****05690903775 | 200021552 | 07:28:35 2017/09/18 | 118.867007 | 31.9525406 | 07:36:55 2017/09/18 | 118.871392 | 31.9421487 |
| MBK0200021 *****05733298952 | 200021552 | 19:15:11 2017/09/18 | 118.871392 | 31.9421487 | 19:18:00 2017/09/18 | 118.870768 | 31.9429941 |
| … | … | … | … | … | … | … | … |
| MBK0200037 *****05718149712 | 200037808 | 15:02:34 2017/09/18 | 118.707891 | 31.7227853 | 15:06:30 2017/09/18 | 118.709543 | 31.7261972 |
| MBK0200037 *****05725336101 | 200037808 | 17:02:20 2017/09/18 | 118.709543 | 31.7261972 | 17:58:14 2017/09/18 | 118.709840 | 31.7261814 |
| Parameter | Value | Unit |
|---|---|---|
| Unit travel time cost | 0.51 | yuan/min |
| Walking speed | 4.5 | km/h |
| Riding speed | 8 | km/h |
| Bus speed | 20 | km/h |
| Riding cost | 0.5 | yuan |
| Bus fare | 2 | yuan |
| Locking time | 2 | min |
| Bus waiting time | 8 | min |
| Alternative Point ID | Bicycle Allocation | Alternative Point ID | Bicycle Allocation | Alternative Point ID | Bicycle Allocation |
|---|---|---|---|---|---|
| 1 | 0 | 11 | 10 | 21 | 0 |
| 2 | 47 | 12 | 23 | 22 | 49 |
| 3 | 0 | 13 | 35 | 23 | 0 |
| 4 | 27 | 14 | 0 | 24 | 44 |
| 5 | 0 | 15 | 0 | 25 | 30 |
| 6 | 33 | 16 | 0 | 26 | 40 |
| 7 | 0 | 17 | 22 | 27 | 0 |
| 8 | 0 | 18 | 17 | 28 | 0 |
| 9 | 20 | 19 | 0 | 29 | 54 |
| 10 | 11 | 20 | 16 | 30 | 0 |
| Alternative Point ID | Bicycle Allocation | Alternative Point ID | Bicycle Allocation | Alternative Point ID | Bicycle Allocation |
|---|---|---|---|---|---|
| 1 | 20 | 11 | 14 | 21 | 0 |
| 2 | 33 | 12 | 0 | 22 | 40 |
| 3 | 0 | 13 | 34 | 23 | 28 |
| 4 | 20 | 14 | 29 | 24 | 42 |
| 5 | 25 | 15 | 0 | 25 | 30 |
| 6 | 29 | 16 | 24 | 26 | 41 |
| 7 | 0 | 17 | 25 | 27 | 0 |
| 8 | 0 | 18 | 18 | 28 | 0 |
| 9 | 21 | 19 | 28 | 29 | 39 |
| 10 | 0 | 20 | 0 | 30 | 19 |
| First-Generation Scheme | Optimal Scheme | Change Rate | |
|---|---|---|---|
| Number of facilities | 16 | 20 | 25% |
| Riding volume | 955 | 1121 | 17.4% |
| Total transfer cost | 32300 | 30235 | −6.4% |
| Facility operating cost | 17600 | 20000 | 13.6% |
| Average facility operating cost | 1100 | 1000 | −9.1% |
| Riding Cost (Yuan) | Combined Travel Mode (Volume: Person) | ||
|---|---|---|---|
| Walking + Subway | Bus + Subway | Bike-Sharing + Subway | |
| 0.50 | 3207 | 982 | 1121 |
| 0.75 | 3261 | 1027 | 1012 |
| 1.00 | 3309 | 1069 | 922 |
| 1.25 | 3355 | 1109 | 836 |
| 1.50 | 3397 | 1145 | 758 |
| Upper Limit | Number of Facilities in The Optimal Scheme | Transfer-Ride Volume |
|---|---|---|
| 30 | 25 | 1060 |
| 40 | 22 | 1035 |
| 50 | 20 | 1121 |
| 60 | 18 | 1175 |
| 70 | 17 | 1240 |
| 80 | 16 | 1295 |
| 90 | 16 | 1295 |
| 100 | 16 | 1295 |
| Alternative Point ID | Bicycle Allocation | Alternative Point ID | Bicycle Allocation | Alternative Point ID | Bicycle Allocation |
|---|---|---|---|---|---|
| 1 | 72 | 11 | 18 | 21 | 0 |
| 2 | 0 | 12 | 0 | 22 | 39 |
| 3 | 0 | 13 | 38 | 23 | 28 |
| 4 | 0 | 14 | 28 | 24 | 42 |
| 5 | 33 | 15 | 0 | 25 | 74 |
| 6 | 39 | 16 | 0 | 26 | 67 |
| 7 | 0 | 17 | 43 | 27 | 0 |
| 8 | 0 | 18 | 0 | 28 | 0 |
| 9 | 25 | 19 | 27 | 29 | 0 |
| 10 | 29 | 20 | 0 | 30 | 48 |
Publisher’s Note: MDPI stays neutral with regard to jurisdictional claims in published maps and institutional affiliations. |
© 2021 by the authors. Licensee MDPI, Basel, Switzerland. This article is an open access article distributed under the terms and conditions of the Creative Commons Attribution (CC BY) license (https://creativecommons.org/licenses/by/4.0/).
Share and Cite
Zhong, H.; Liu, Z.; Chen, J.; Hao, J.; Wang, W. Layout Model of Bike-Sharing Facilities in the Transfer-Influenced Area of a Subway Station. Appl. Sci. 2021, 11, 10188. https://doi.org/10.3390/app112110188
Zhong H, Liu Z, Chen J, Hao J, Wang W. Layout Model of Bike-Sharing Facilities in the Transfer-Influenced Area of a Subway Station. Applied Sciences. 2021; 11(21):10188. https://doi.org/10.3390/app112110188
Chicago/Turabian StyleZhong, Hongming, Zijian Liu, Jun Chen, Jun Hao, and Wei Wang. 2021. "Layout Model of Bike-Sharing Facilities in the Transfer-Influenced Area of a Subway Station" Applied Sciences 11, no. 21: 10188. https://doi.org/10.3390/app112110188
APA StyleZhong, H., Liu, Z., Chen, J., Hao, J., & Wang, W. (2021). Layout Model of Bike-Sharing Facilities in the Transfer-Influenced Area of a Subway Station. Applied Sciences, 11(21), 10188. https://doi.org/10.3390/app112110188