Abstract
The extraction of a road network is critical for city planning and has been widely studied in previous research using high resolution images, whereas the high cost of high-resolution remote sensing data and the complexity of its analysis also cause huge challenges for the extraction. The successful launch of a high resolution (130 m) nighttime remote sensing satellite, Luojia 1-01, provides great potential in the study of urban issues. This study attempted to extract city roads using a Luojia 1-01 nighttime lighting image. The urban regions were firstly distinguished through a threshold method. Then, an unsupervised PCNN (pulse coupled neural network) was established to extract the road networks in urban regions. A series of optimizing methods was proposed to enhance the image contrast and eliminate the residential regions along the roads. The final extraction results after optimizing were compared with OSM (OpenStreetMap) data, showing the high precision of the proposed approach with the accuracy rate reaching 83.2%. We also found the precision of city centers to be lower than suburban regions due to the influence of intensive human activities. Our study confirms the potential of Luojia 1-01 data in the extraction of city roads and provides new thought for more complex and microscopic study of city issues.
1. Introduction
With the rapid development of remote sensing technology, the spatial resolution of remote sensing images has improved dramatically, along with the increase in remote sensing data categories, thus providing new thoughts in high-accuracy urban monitoring and ground-object identification. As a kind of fundamental ground object, an accurate and expedient road network extraction is critical for various fields in urban applications, such as navigation, transportation and facility planning [1,2,3]. Although previous studies have devoted considerable effort to the extraction of road network information [4,5,6], complex urban environments often bring many challenges to the extraction work. Therefore, the exploration of more practical methods and the introduction of a new data source is needed in the extraction of the road network.
A great deal of studies have focused on the extraction of road networks through very high-resolution images [7,8,9,10]. Generally, the extraction methods can be distinguished into the following two categories [11]: automatic and semiautomatic methods. The purpose of semiautomatic methods is to put a priori knowledge obtained through human observation, such as road direction and starting point, into a computer system. In fact, the human visual system is thought to have high discriminability in the extraction of road networks through remote sensing images. The accuracy of ground-object identification through visual observation is very high. The combination of a priori knowledge obtained from human observation and powerful computation ability from the computer system have improved the extraction accuracy. The main steps of the semiautomatic methods are as follows: (1) Artificially choose several initial road seed points in original images and record the road directions. (2) Put the initial road seed points into a computer system and formulate the specific growth pattern to distinguish the pixels with a high probability of being road. (3) Make an optimization of the initial extraction results in aspects such as shape, topotaxy and other a priori knowledge. Many studies have proposed or improved the semiautomatic extraction models, such as the snake model [12], dynamic programming algorithm [2], region growing method [13] and edge tracking method [14].
The limitation of the semiautomatic methods is also obvious: it is over-reliant on prior knowledge, which means the final extraction accuracy is largely determined by the quality of the prior knowledge, whereas the key process during the acquisition of prior knowledge—road networks’ recognition and seed points’ selection—needs a mass of time-consuming and high-cost artificial work. In addition, the characteristics of road networks in different places are often different, which means the prior knowledge obtained through the labor-intensive preparation work can only be used in specific areas. Therefore, some studies have attempted to establish the automatic extraction models, which do not need prior knowledge [5,15]. The automatic methods can distinguish road regions and non-road regions automatically. The extraction process is conducted according to the essential characteristics and judging criteria of the road network, through which the feed points are distinguished and then extended to the road sections. The road sections are finally connected with each other and formed into road networks through a series of optimizing processes. Although there exist several typical extraction methods, including the parallel lines method, spectral classification method and mathematical morphology, the accuracy of these methods is generally low compared with semiautomatic methods. The current characteristics are still limited for a computer system to extract road networks through remote sensing images.
A considerable number of studies have realized the automatic methods can be the future development tendency and then attempt to introduce new methods into the road extraction studies, including deep learning technology. Methods such as convolutional neural network(CNN) [16] and self-organizing map neural network (SOMNN) [17] are introduced to improve the accuracy of the extraction results; however, the computation complexity has not been decreased due to the redundant information in high-resolution images. Although high-resolution images can provide high resolution object information in the extraction process, the following problems still exist: (1) High cost: the high-resolution images are not free for the public. The extraction of roads in a large area or long-term monitoring of road network changing requires numerous images, which will increase the cost substantially. (2) Too much redundant information: road information is just a small part of the high-resolution images, which means the images also contain a lot of texture information and spectral information of other ground objects, such as buildings, trees, water and mountains. The residential information largely weakens the major characteristics of roads. Therefore, the application of a new data source with low cost and distinguishing characteristics of road networks is required in the extraction.
Satellite-derived nighttime light data, as one of the new generation remote sensing data, has been proven existing in high correlation with human activities and has been widely adopted in researching human activities [18,19], including GDP spatialization [20], fossil fuel combustion [21], material stock estimation [22], disaster damage assessment [23] and energy consumption prediction [24]. Satellite-derived nighttime light data are the electromagnetic wave information of an overnight light source in a near-visible infrared band through earth surface reflection. Compared with census data, which are collected by administrative boundaries, nighttime light data are much timelier with lower cost and flexible spatial scale.
Hence, this study attempted to prove the capability of the Luojia 1-01 data source in the extraction of city roads, through the establishment of a hybrid model. The extraction is based on the following few steps: firstly, the image is enhanced (sharpened) using Laplace-filtering with an elimination of the diffusion, then urban areas are detected using the threshold value in the light intensity. Afterwards, the PCNN is established for pattern recognition. The final step, before road extraction itself, includes optimization methods such as clean, edge loss filling and close. The results of the road extraction in representative parts of Wuhan city are compared with Open Street Map data.
2. Data Source and Preprocessing
2.1. NPP-VIIRS Nighttime Light Dataset and Preprocessing
The earliest nighttime light data are the stable Nighttime Light Data on the Defense Meteorological Satellite Program/Operational Linescan System (DMSP/OLS). The DMSP/OLS nighttime light data are free for the public with coarse spatial resolution (15 arc seconds, 2~5 km) and long period (1992–2013) [25]. Several limitations of DMSP/OLS data also restrict its furthering application: The range of DN (digital number) values in DMSP/OLS data is small (0–63), which results in an over-saturation in city centers; the DMSP/OLS data are available just between 1992 and 2003, which also restricts the study of social economy issues after 2013 [26]; and the DMSP/OLS data are obtained through different satellites, which makes the data quality uneven in contiguous years. In October 2011, the Suomi National Polar-Orbiting Partnership (NPP) satellite with the Visible Infrared Imaging Radiometer Suite (VIIRS) was launched by the National Oceanic and Atmospheric Administration (NOAA)/National Geophysical Data Center (NGDC). The NPP-VIIRS nighttime light data are superior in spatial and radiometric resolution (15 arc seconds, 400~700 m), radiometric detection range and onboard calibration [27,28,29], compared with DMSP/OLS. However, the spatial resolution of the NPP-VIIRS nighttime light data is still not enough to study microcosmic topics; current research using NPP-VIIRS data mainly focus on the distinguishing of large-scale hot spots [30] and the economic inequality of a country [31]. On 2 June 2018, the Luojia 1-01 satellite produced by Wuhan University, China, was launched with the purpose of acquiring high resolution nighttime light data. The comparisons of Luojia 1-01, DMSP/OLS and NPP-VIIRS data are shown in Table 1, through which the spatial resolution of Luojia 1-01 can be found to be much higher than the previous two data sources.

Table 1.
The comparisons between Luojia 1-01 satellite and the other two nighttime light satellites DMSP/OLS and NPP-VIIRS.
The nighttime light data used in this study are the Luojia 1-01 nighttime light data of Wuhan, China, obtained in July 2018. The data can be accessed from the official website of Hubei data and application center (http://www.hbeos.org.cn/, accessed on 29 September 2021). Located in the center of China, Wuhan is the capital city of Hubei Province. As one of the biggest central cities in China, Wuhan is also the national transportation hub and a famous tourism city in China. The rapid development of Wuhan makes it meaningful to find more appropriate ways to extract city roads.
In this study, the following preprocessing steps were taken before the analysis of Luojia 1-01: (1) To reduce the influence of background noise and abnormal lights, the maximum radiance value derived city centers, where most commercial facilities and human activities are concentrated, were set as the upper threshold [32,33]. (2) Most of the faintly lit pixels, which could be urban roads, have very low radiance values as a result of the blooming effect of nearby lit pixels, and the radiance values were normally larger than water, due to their reflectivity difference [34]. Thus, the minimum radiance value obtained from the locations of lakes or rivers was set as the lower threshold to keep all the potential road pixels and eliminate the influence of pixels with 0 radiance value, which are either non-lit areas or noises [35]. In this way, the light values smaller than the lower threshold or larger than the upper threshold were treated as the noises and their values were set as 0. The position of Wuhan and its nighttime light data after preprocessing are shown in Figure 1.
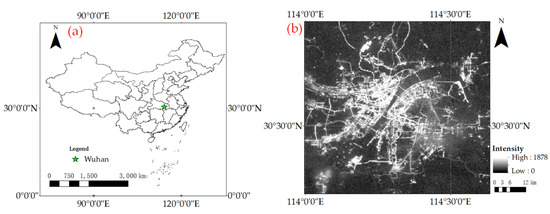
Figure 1.
Location of Wuhan (a) and its nighttime light data after preprocessing (b).
2.2. City Roads Extracted from OSM
The city roads used in this study to test the extraction accuracy from Luojia 1-01 nighttime light data were derived from OpenStreetMap (www.openstreetmap.org/, accessed on 29 September 2021), an online map collaboration program that was established by Steve Coast in July 2004. As an open community formed by millions of cartographers, OpenStreetMap aims to provide free map data to the public with high accuracy and timeliness. The data are updated and maintained every day by over 1.5 million map editors through aerial images and high-precision GPS data. The data we downloaded from the OSM website included the road networks of Wuhan. The dataset was obtained in January 2018. The city roads extracted from OSM data are shown in Figure 2.
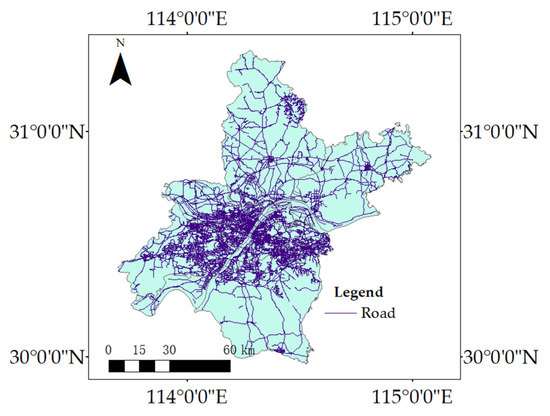
Figure 2.
City roads extracted from OpenStreetMap.
3. Method
The proposed approach consisted of four parts, which are described in Figure 3. The three steps were as follows: (1) Image enhancement: Image sharpening was conducted to increase contrast of original Luojia 1-01 image, thus improving the characteristics of city roads. (2) Distinguishing of urban regions: Different from high-resolution images, the light intensity in nighttime light data is highly correlated with human activities and regions’ development degree. The light intensity in rural areas was too weak to extract the roads. Therefore, the extraction process could just be conducted in urban regions. (3) Road extraction: An unsupervised neural network-PCNN was established to extract the road networks in urban regions. The aim of the PCNN was to identify the objects edges in an image. (4) Shape Optimizing: A series of optimizing operations were proposed to eliminate the residential regions along the roads and extrude the shape or extracted roads. The final extraction results after shape optimizing were then compared with OSM (OpenStreetMap) data.
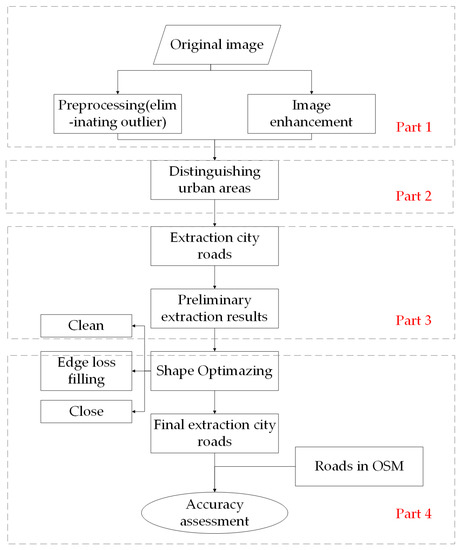
Figure 3.
Flowchart of the proposed extraction approach.
3.1. Image Enhancement
Due to the similarity of the DN values between facilities and roads, the edges of roads were difficult to extract from the nearby environment. In image processing, some image enhancement methods were often used to enhance the difference between pixels, thus emphasizing the characteristics of interest areas. As a representative image enhancing technology, image sharpening was often used in the image enhancement tasks, the principle of which is to compensate the contours of an image and enhance the edge gradation jump parts, thus enlarging the main characteristics of images. Compared with traditional histogram equalization, which often loses the image details and increases noise, image sharpening can effectively distinguish the small edges of objects and avoid noises. In image sharpening, the following three kinds of first order-based derivative operators [36,37]: Roberts, Prewitt and Sobel, are often used. However, it is difficult for the first order-based derivative operator to distinguish the steep edges and slow change edges. In this way, a second order-based derivative operator, Laplacian, which is more sensitive to distinguish the isolated points, was used in this study. For a discrete point in an image, the first order partial derivative is defined as [38]:
Additionally, the second order partial derivative is calculated as follows:
In this way, the final expression of the Laplacian operator is defined as follows:
To eliminate the influence caused by diffusion, images operated by Laplacian operator can be enhanced using the following method:
where denotes the correlation coefficient of diffusion, which is often set as 1. Additionally, the formula is as follows [38]:
3.2. Distinguishing of Urban Areas
Due to the differences of light intensity of roads between urban area and rural areas, it was essential to distinguish the urban boundary of Wuhan. Although the administrative boundary could be obtained from the census data, some rural areas still existed within the administrative boundary.
Different from Landsat data with several bands, Luojia 1-01 data only contained a single band of DN values. Therefore, we used a thresholding method to achieve the extraction, the principle of which was to find an optimal threshold intensity that could keep the major characteristics of urban-area pixels and eliminate rural-area pixels at the same time.
The accuracy of this method highly relies on the choosing of a threshold intensity value. According to previous studies, the methods for finding out optimal threshold value can be distinguished into the following four categories [28,39,40,41]: (1) Experience threshold method. In this kind of method, threshold value is determined according to expert knowledge, which is obtained through years of experience or a great deal of previous experiments. Though the advantage of this method is obvious―quick and simple, the over-reliance on historical knowledge also imitates its further use in a new field where the historical knowledge is lacking. (2) Statistical analysis method. In this kind of method, a number of candidate intensity values are chosen to extract the urban area of target city and the area of each extraction will be recorded. The optimal is the one that makes the area of extraction most close to the statistical data in the yearbook. However, the area information is mainly accurately measured in metropolitan cities, which limits the performing of this method in county-level and town-level cities. (3) Image comparison method. In this kind of method, external data sources, such as Landsat satellite images, Google Earth Images and MODIS images, through which the land use information can be derived, are adopted to match with nighttime light data and to help distinguish the boundary of an urban area. However, the method requires a mass of artificial participation to delineate the urban boundary, which can be high in cost and time consuming when performing analysis on multiple cities. (4) Mutation detection method. In this kind of method, the urban boundary is extracted according to the structure characteristics of an urban area. In a rural area, the perimeter of pixels, the intensity of which is larger than a certain value, will decrease with the increase in the value. However, the perimeter of urban-area pixels will show a fluctuating tendency with the increase in intensity value, causing the influence of polycentric features of an urban area. Additionally, the threshold value can be found through the fluctuating tendency, which can be described as follows [42]:
where represents the light intensity, ranging from 0 to the maximum value , and makes the function reach its minimal value. represents the function of urban perimeter and each light intensity value; represents the number of pixels, the DN value of which is . There may exist several values because of the complex city structure. To avoid the data loss, the minimum was considered as the threshold value .
3.3. Extraction of City Roads through a PCNN
A PCNN is a kind of unsupervised artificial neural network, which does not have a training process. Different from other neural networks, the output of a PCNN is a series of pulse signals, each associated to one pixel or to a cluster of pixels. When applied to image processing, the output of a PCNN is a binary image, which describes the mutation information in images. Therefore, a PCNN has been widely used in the edge detection of objects in remote sensing images with its simple architecture and high accuracy [43,44].
A PCNN model consists of the following three parts: the input tree, the linking modulation and the pulse generator [45]. The structure of a PCNN is given in Figure 4. The input tree contains the following two channels: the linking channel and the feeding channel. The linking channel can only receive simulation from a neighborhood neural. The feeding channel can receive simulation both from the neighborhood neural and external input data. The two channels then transfer their input L and F to the linking modulation, and form a state U, which is then transformed to the pulse generator. The pulse generator contains a dynamic threshold value T, which is compared with U. The output of pulse generator Y is generated by the comparison through U and the initial T value. Additionally, a pulse signal will be produced through the numerical value of Y. Y will also reversely adjust the threshold value T, and then influence the next comparison process.
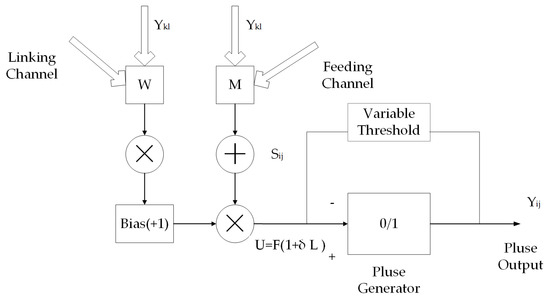
Figure 4.
Structure of PCNN we established.
The iterative process is described as an iteration by the following equations:
where represents the value of the feeding channel, and represents the value of the linking channel. The decay constants of the two channels were and . The feeding channel take consideration of the external dataset, represented by . Both the feeding channel and the linking channel take consideration of the influence of the outputs from neighborhood neurons in the previous iteration (n − 1). M and W represent the weights of the neighborhood neuron in the feeding channel and the linking channel, respectively. The constants and are normalizing constants. The two values from the feeding channel and the linking channel were then transformed to the linking modulation, and formed a new state U.
where is used to indicate the incidence of influence from neighborhood neurons. The stale is then transformed to the pulse generator and decides the output of PCNN.
where represents the dynamic threshold value, which is decided by the output of PCNN in the last iteration, as follows:
It needs to be declared that the threshold value of the iteration is ; therefore, the threshold value in the next iteration will be decided by the output of n iteration ().
3.4. Shape Optimization through Morphological Operations
The original extraction results from PCNN may have contained not only the road regions, but also some non-road regions, such as dark vehicles, shadows and trees, which have an intensity value less than that of an urban road. To eliminate influence from these pixels, thus improving the extraction accuracy, the following three morphological operations were conducted to the extraction results: clean, edge loss filling and close [46].
- (1)
- Clean: The purpose of this operation was to eliminate the isolated pixels in extraction results. The shape of the road was often similar to a long strip. Additionally, there existed a high connectivity between roads. Thus, we designed a 3 × 3 filter to distinguish pixels surrounded by 0 values and these pixels were marked as ‘noises’, the intensity of which were then set as 0 to avoid being detected as road pixels.
- (2)
- Edge loss filling: Due to the existence of vehicles, trees, shadows, ground noises or data loss, some road pixels, especially those located in the road edge, can be some tiny cavities with 0 light intensity, which can cause edge loss in final extraction results and influence the integrality and continuity or road networks. Therefore, we adopted this operation to fill up the tiny cavities in binary images. The main steps were as follows: searching for a potential road path, which can be realized by connecting furcate road pixels with terminal road pixels; calculating the average road width and comparing average road width with the width of each road unit to find out units influenced by cavities and need edge loss filling; performing the filling process in edge loss pixels to keep the width of road unit consistent with the average road width. The process can be described as Figure 5, where a short part of road is observed as narrower than the main part, caused by background noises or shadows. We recorded the coordinate of the central point of this small part and the central points and of two nearby road units. We adopted the following formulation to calculate the theoretical location of central point without influences from tiny cavities [13]:where is a constant. If , then , ; if , then , . Finally, the road pavements were then filled according to its new central point and average width.
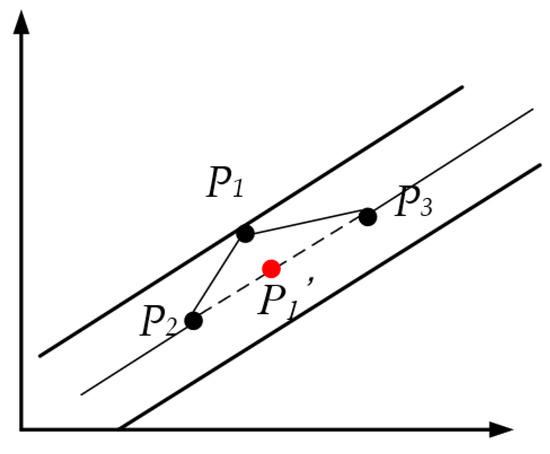 Figure 5. Process of edge loss filling.
 - (3)
- Close: In an extraction process, a continuous road may be separated into seral isolated parts due to background noises or data loss. Therefore, we adopted the ‘close’ operation to connect these separated parts into a continuous road. The operation included two steps—dilation and erosion. The purpose of dilation is to enlarge the edge of roads to make adjacent roads connected. This step can be achieved through a structural element , which will set the pixel value of location as the maximum value of their product in image [47]:
After the dilation step, most road edges will be wider than the original edges and some unrelated roads may also be connected. The purpose of erosion is to shrink the edge of roads to separate roads that were not supposed to connect with each other. This step can be achieved through the structural element , which will set the pixel value of location as the minimum value of their product in image :
Therefore, the whole operation can be described by the following:
Through this operation, some tiny parts of roads, which were separated from main stem because of background noises, can become connected.
3.5. The Accuracy Assessment of Extraction Results
To evaluate the accuracy of the model, we introduced the following two indexes that were widely used in the performance evaluation of machine learning methods: precision and recall [48]. Precision describes how many positive samples were distinguished exactly in the predicted positive samples. Recall describes how many positive samples were distinguished exactly in the total positive samples. For the better explain of precision and recall, a confusion matrix of the classification results is shown in Table 2.

Table 2.
Confusion matrix of classification results.
Where TP represents the true positive samples, FP represents the false positive samples, FN represents the false negative samples and TN represents the true negative samples. Generally, the two indexes are both meaningful in the description of model equality; however, they are also contradictory: higher recall only means a larger sample data set, thus leading to lower precision. Therefore, an -score, which is the harmonic mean value of precision and recall, is often used to describe the quality of the following binary classification models:
where P represents the precision and R represents the recall. The higher -score indicated the higher classification quality of the model.
4. Results
4.1. Results of Urban Areas
To distinguish the boundary between urban areas and rural areas, the perimeter of the region extracted by each DN value was calculated and shown in Figure 6. The curve describes the changing trend of the perimeter with the increase in the DN values in Wuhan. A decreasing trend is shown with DN values ranging between 151 to 190, reaching the extreme point (190,0.925). The perimeter then shows an increasing trend from 190~238 and turns to keep decreasing when the DN values are more than 238. According to the extraction model, the extreme point (190,0.925) is thought to be the threshold value of the boundary between urban areas and rural areas. The extraction results when adopting 190 as the threshold are shown in Figure 7.
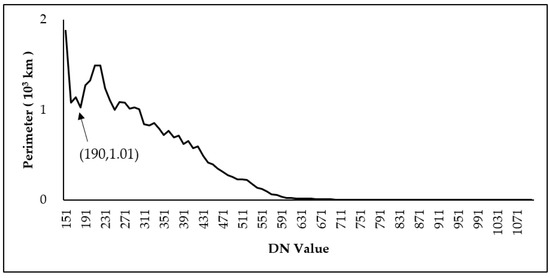
Figure 6.
Changing trend of perimeters of Wuhan.
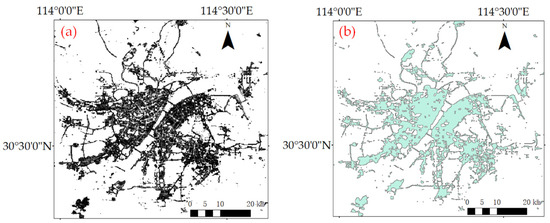
Figure 7.
(a): Urban area intensity of Wuhan when threshold value is 190; (b): urban area boundary of Wuhan when threshold value is 190.
4.2. Results of Image Enhancement
After the extraction of urban areas of Wuhan, image sharpening was conducted to the original image. To decrease the noises produced by the sharpening process, a median filter was used. Additionally, the results were compared with the original image and are shown in Figure 8.
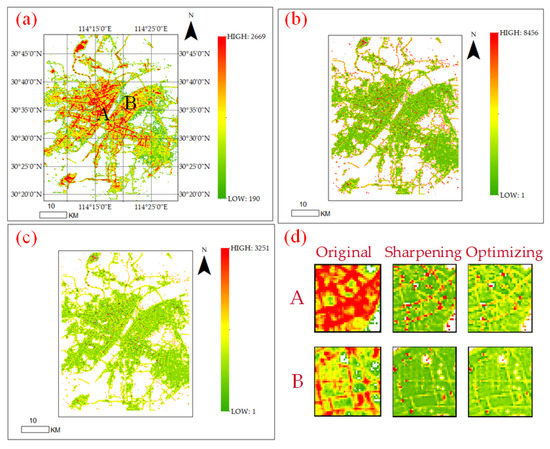
Figure 8.
(a): the original urban regions; (b): the image after sharpening; (c): the image after sharpening and median filtering. (d): the case regions A and B.
Figure 8a shows the original extraction result of the urban areas and the DN values range between 190~2669. Additionally, the image after the sharpening process is shown in Figure 8b, where the DN values range between 1 and 8456. We can find the range of the DN values has been extended comparing Figure 8a,b: The minimum value has decreased from 191 to 1, and the maximum value has increased from 2669 to 8456. Therefore, the image contrast of Figure 8b is higher than the original image. The road profile in Figure 8b is also clearer than that in Figure 8a. However, some abnormal points also emerged in Figure 8b, the DN values of them were much larger than the nearby pixels. Through the middle filter, we can find the number of these points has been decreased, as shown in Figure 8c. Two regions, A and B, were chosen to show the details in Figure 8d. A represents the regions with high light intensity. B represents the regions with low light intensity.
The histograms of the original image and the sharpened image (also after middle filtering processing) were shown in Figure 9. Through the comparison, we can find that the range has been obviously expanded. The DN values of the histogram of the original image were distributed mainly between 200 and 350, and the DN values showed a decreasing trend with the increasing DN values. The DN values of the histogram of the sharpened image were distributed in a larger range (50 to 800) with an obvious fluctuation.
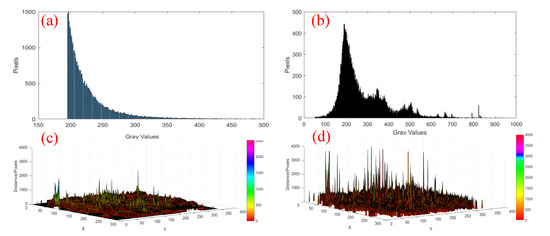
Figure 9.
(a): the statistical information of pixels in original image; (b): the statistical information of pixels in sharpened image; (c): the spatial distribution of DN values in original image; (d): the spatial distribution of DN values in sharpened image.
4.3. Extraction Results of City Road
The image after enhancement was then fed into the PCNN to extract the road networks in Wuhan. Four parts, namely A, B, C and D, were chosen as the case areas to show the extraction process. The locations of the four case areas are displayed in Figure 10.
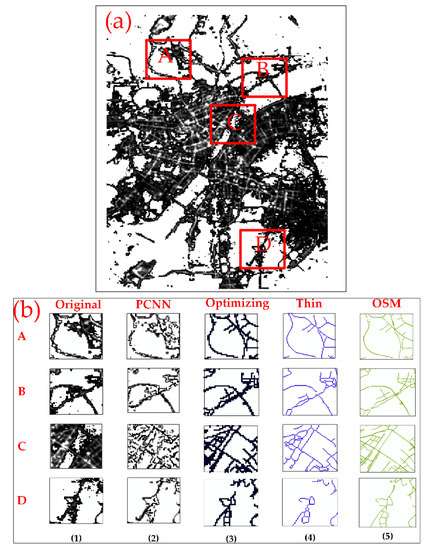
Figure 10.
(a): the locations of A, B, C and D in original nighttime light data; (b): the extraction results and comparison with OSM data.
Case A is located in the north of Wuhan, where a wide range of forests exists. The coverage of the forests may shield the road lighting, thus leading to the discontinuity in the original image. Through the extraction process, the road network regions were extracted with some residential areas, which were then eliminated through the optimizing process. Additionally, the rough outline was finally formed through the thin process. The comparison with the OSM network showed that the shape and direction of the main streets have been correctly extracted, except three short roads were missed.
Case B is also located in the north of Wuhan. Additionally, the region mainly includes several riverside roads and a bridge called ‘Yangtze River Bridge’. We can find the riverside road and the bridge has been extracted correctly. However, some short roads near the riverside road were just extracted partly caused by the mixed-up pixels in the connection of the riverside road and bridge, which also caused the small break between them.
Case C is located in the middle, the city center, of Wuhan, covering several blocks, containing many high DN value pixels and two bridges. Due to the similarity of the DN values between the residential areas and road networks in city center, the identification of the road network is much more difficult than regions in suburban areas. Therefore, many crush plaques of residential areas were also extracted after the PCNN process. Through shape optimizing, most crush plaques have been effectively eliminated. The final extraction results were close to the OSM data, although a few short roads in the top left were not distinguished clearly.
Case D is located in the south of Wuhan, covering the connection regions of two lakes. Through PCNN, the main road network regions have been extracted. A small break emerged in the extraction results, which was caused by the large difference of DN values along the roads.
Table 3 shows the accuracy assessment of the extraction results. The F1 index of the four regions were 0.910, 0.852, 0.816 and 0.852, respectively. Additionally, the F1 index of the whole of Wuhan is 0.832. Overall, caused by the instability of the DN values and shield, a few short roads in some suburban regions may have been ignored or extracted out of shape, which caused the recall value of Wuhan to be lower than the precision value. Additionally, the precision of the extraction results in city centers with dense residential areas was lower than other regions, such as Case C, the F1 (0.849) of which is lower than the other three case regions. However, all the main roads have been correctly extracted through Luojia 1-01 nighttime lighting data. The extraction results were close to the OSM data.

Table 3.
The accuracy assessment of extraction results.
5. Discussion
Benefiting from the development of remote sensing technology, nighttime light data, as one of the new typical remote sensing data, has been widely used in the study of social economy. Additionally, the main nighttime light data sources used in previous studies were DMSP-OLS and NPP-VIIRS, with low resolutions of 1 km and 700 m, respectively. Therefore, they can only be used in the study of some macro problems. Although several high-resolution nighttime data, such as JL1-3B [49], have been introduced in previous studies, these data were not available to the public freely. Therefore, the study and application of high-resolution nighttime data is really lacking. Luojia 1-01, with its high resolution (130 m) and availability to the public, will potentially be used in the study of more microcosmic city issues, such as urban traffic evaluation. This study investigated the potentiality of using Luojia 1-01 data in the study of urban traffic. During the COVID-19 pandemic, major roads were found to be less used through NPP-VIIRS nighttime light data [50]. The Luojia-01 data set and the approach we proposed in this study may make it possible to further investigate the dynamic road occupation and traveling preferences during the pandemic.
However, some challenges still exist in the extraction of road networks, which need to be further addressed. The first challenge is to distinguish the light intensity of residential buildings from urban roads. Although most buildings can be removed through their different shape with roads, some buildings nearby the roads may still affect the extraction results. The second challenge is the data lacking in some pixels, due to data noises, trees and the shielding of high buildings, which will cause some tiny cavities in the extraction results. Although morphologic optimizing methods have been introduced to fill these cavities, the accurate identification of these cavities is still difficult. The adoption of external data sources can be a potential solution, which needs further attempts. The third challenge is that the available Luojia 1-01 images are still limited. Therefore, it is still difficult to obtain the average light intensity data source with the more stable light intensity of urban roads, which will fix the flux reduction problem in public and private lighting at night.
With the increase in the data size of the Luojia 1-01 satellite over time, the extraction precision of ground objects such as road networks and residential buildings will be highly improved. In future application, the combination of Luojia 1-01 data with high resolution images or Landsat images will also optimize the current road extraction project and reduce expenses significantly.
6. Conclusions
Nighttime light imagery, with its high correlation with human activities, has been widely used in the study of social economy and environmental issues [51,52,53]. The Luojia 1-01 data source, with a much higher resolution compared with DMSP and VIIRS data sources, will provide new thoughts on the study of urban planning. This paper investigated the potential of the Luojia 1-01 data source in the extraction of city roads. The main work can be concluded as follows:
- (1)
- We proved the possibility of extracting city roads through a nighttime lighting data source, which provides more thoughts in the study of the extraction of ground objects.
- (2)
- An unsupervised neural network-PCNN was established in the extraction of road networks. To improve the extraction precision, the urban regions were extracted through a threshold method. We also adopted a series of optimizing methods to enhance the image contrast and eliminate the residential regions along the roads. The method we proposed takes consideration of the negative effects and do not need enormous training data, which gave it potential in the road extraction project.
- (3)
- The results showed that the extraction quality of city centers was lower than suburban areas, which indicated that there existed a great similarity of light intensity in city centers.
In general, the extraction quality of Wuhan reached 83.2%, which proved the possibility of using Luojia-01 data to extract city roads. In this study, we just adopted one single image in the experiment, which may limit the improvement of extraction accuracy. In future work, we will adopt a more stable Luojia-01 data set through the observation of a long time, and use more external datasets, such as high-resolution images and Landsat data, to obtain more precise results.
Author Contributions
L.W., H.Z. and H.F. conceived and designed the main idea and experiments. H.X., Y.W. and A.Z. helped with the data processing. L.W. and Y.W. performed the experiments. L.W. wrote the paper. L.W., A.Z. and H.Z. made revisions. All authors have read and agreed to the published version of the manuscript.
Funding
This research was funded by the National Natural Science Foundation of China (Grant Nos. 72001046, 91746206, 42001389) and the National Key Research and Development Program of China (Grant Nos. 2017YFB0503601).
Institutional Review Board Statement
Not applicable.
Informed Consent Statement
Not applicable.
Data Availability Statement
The data presented in this study are available in this article.
Conflicts of Interest
The authors declare no conflict of interest.
References
- Heipke, C. Evaluation of Automatic Road Extraction. Int. Arch. Photogramm. Remote Sens. 1997, 32, 47–56. [Google Scholar]
- Gruen, A.; Li, H. Road extraction from aerial and satellite images by dynamic programming. Isprs J. Photogramm. Remote Sens. 1995, 50, 11–20. [Google Scholar] [CrossRef]
- Baumgartner, A. Automatic Road Extraction Based on Multi-Scale, Grouping, and Context. Photogramm. Eng. Remote Sens. 1999, 65, 777–785. [Google Scholar]
- Doucette, P.; Agouris, P.; Stefanidis, A.; Musavi, M. Self-organized clustering for road extraction in classified imagery. Isprs J. Photogramm. Remote Sens. 2001, 55, 347–358. [Google Scholar] [CrossRef]
- Mena, J.B. State of the art on automatic road extraction for GIS update: A novel classification. Pattern Recognit. Lett. 2003, 24, 3037–3058. [Google Scholar] [CrossRef]
- Mena, J.B.; Malpica, J.A. An automatic method for road extraction in rural and semi-urban areas starting from high resolution satellite imagery. Pattern Recognit. Lett. 2005, 26, 1201–1220. [Google Scholar] [CrossRef]
- Miao, Z.; Shi, W.; Zhang, H.; Wang, X. Road Centerline Extraction from High-Resolution Imagery Based on Shape Features and Multivariate Adaptive Regression Splines. IEEE Geosci. Remote Sens. Lett. 2013, 10, 583–587. [Google Scholar] [CrossRef]
- Cheng, J.; Guan, Y.; Ku, X.; Sun, J. Semi-automatic road centerline extraction in high-resolution SAR images based on circular template matching. In Proceedings of the International Conference on Electric Information and Control Engineering, Wuhan, China, 15–17 April 2011; pp. 1688–1691. [Google Scholar]
- Li, G.; An, J.; Chen, C. Automatic Road Extraction from High-Resolution Remote Sensing Image Based on Bat Model and Mutual Information Matching. J. Comput. 2011, 6, 2417–2426. [Google Scholar] [CrossRef]
- Liu, X.; Tao, J.; Yu, X.; Cheng, J.J.; Guo, L.Q. The rapid method for road extraction from high-resolution satellite images based on USM algorithm. In Proceedings of the International Conference on Image Analysis and Signal Processing, Huangzhou, China, 9–11 November 2021; pp. 1–6. [Google Scholar]
- Lisini, G.; Tison, C.; Tupin, F.; Gamba, P. Feature fusion to improve road network extraction in high-resolution SAR images. IEEE Geosci. Remote Sens. Lett. 2006, 3, 217–221. [Google Scholar] [CrossRef]
- Liu, J.; Sui, H.; Tao, M.; Sun, K.; Mei, X. Road extraction from SAR imagery based on an improved particle filtering and snake model. Int. J. Remote Sens. 2013, 34, 8199–8214. [Google Scholar] [CrossRef]
- Yu, J.; Yu, F.; Zhang, Z.; Liu, Z. High Resolution Remote Sensing Image Road Extraction Combining Region Growing and Road-unit. Geomat. Inf. Sci. Wuhan Univ. 2013, 38, 761–764. [Google Scholar]
- Ma, H.; Qin, Q.; Du, S.; Wang, L.; Jin, C. Road extraction from ETM panchromatic image based on Dual-Edge Following. In Proceedings of the Geoscience and Remote Sensing Symposium, Barcelona, Spain, 23–28 July 2007; pp. 460–463. [Google Scholar]
- Amini, J.; Saradjian, M.R.; Blais, J.A.R.; Lucas, C.; Azizi, A. Automatic road-side extraction from large scale imagemaps. Int. J. Appl. Earth Obs. Geoinf. 2003, 4, 95–107. [Google Scholar] [CrossRef]
- Wei, Y.; Wang, Z.; Xu, M. Road Structure Refined CNN for Road Extraction in Aerial Image. IEEE Geosci. Remote Sens. Lett. 2017, 14, 709–713. [Google Scholar] [CrossRef]
- Shu, Z.; Wang, D.; Zhou, C. Road Geometric Features Extraction based on Self-Organizing Map (SOM) Neural Network. J. Netw. 2014, 9, 190–197. [Google Scholar] [CrossRef]
- Tan, L.; Zhou, Y.; Bai, L. Human Activities along Southwest Border of China: Findings Based on DMSP/OLS Nighttime Light Data; Social Science Electronic Publishing: Rochester, NY, USA, 2017. [Google Scholar]
- Zhang, Q.; Seto, K.C. Can Night-Time Light Data Identify Typologies of Urbanization? A Global Assessment of Successes and Failures. Remote Sens. 2013, 5, 3476–3494. [Google Scholar] [CrossRef]
- Han, X.; Zhou, Y.; Wang, S.; Liu, R.; Yao, Y. GDP Spatialization in China Based on Nighttime Imagery. J. Geo-Inf. Sci. 2012, 14, 128–136. [Google Scholar] [CrossRef]
- Ou, J.; Liu, X.; Li, X.; Li, M.; Li, W. Evaluation of NPP-VIIRS Nighttime Light Data for Mapping Global Fossil Fuel Combustion CO2 Emissions: A Comparison with DMSP-OLS Nighttime Light Data. PLoS ONE 2015, 10, e0138310. [Google Scholar] [CrossRef]
- Vilaysouk, X.; Islam, K.; Miatto, A.; Schandl, H.; Hashimoto, S. Estimating the total in-use stock of Laos using dynamic material ow analysis and nighttime light. Resour. Conserv. Recycl. 2021, 170, 105608. [Google Scholar] [CrossRef]
- Zheng, Y.; Shao, G.; Tang, L.; He, Y.; Wang, X.; Wang, Y.; Wang, H. Rapid Assessment of a Typhoon Disaster Based on NPP-VIIRS DNB Daily Data: The Case of an Urban Agglomeration along Western Taiwan Straits, China. Remote Sensing 2019, 11, 1709. [Google Scholar] [CrossRef]
- Stokes, E.C.; Roman, M.O.; Seto, K.C. The Urban Social and Energy Use Data Embedded in Suomi-NPP VIIRS Nighttime Lights: Algorithm Overview and Status. In Proceedings of the AGU Fall Meeting, New Orleans, LA, USA, 13–17 December 2021. [Google Scholar]
- Liu, Z.; He, C.; Zhang, Q.; Huang, Q.; Yang, Y. Extracting the dynamics of urban expansion in China using DMSP-OLS nighttime light data from 1992 to 2008. Landsc. Urban Plan. 2012, 106, 62–72. [Google Scholar] [CrossRef]
- Lu, H.; Zhang, M.; Sun, W.; Li, W. Expansion Analysis of Yangtze River Delta Urban Agglomeration Using DMSP/OLS Nighttime Light Imagery for 1993 to 2012. ISPRS Int. J. Geo-Inf. 2018, 7, 52. [Google Scholar] [CrossRef]
- Arnone, R.; Ladner, S.; Fargion, G.; Martinolich, P.; Vandermeulen, R.; Bowers, J.; Lawson, A. Monitoring bio-optical processes using NPP-VIIRS and MODIS-Aqua ocean color products. J. Comp. Neurol. 2013, 437, 363–383. [Google Scholar]
- Shi, K.; Huang, C.; Yu, B.; Yin, B.; Huang, Y.; Wu, J. Evaluation of NPP-VIIRS night-time light composite data for extracting built-up urban areas. Remote Sens. Lett. 2014, 5, 358–366. [Google Scholar] [CrossRef]
- Shi, K.; Yu, B.; Huang, Y.; Hu, Y.; Yin, B.; Chen, Z.; Chen, L.; Wu, J. Evaluating the Ability of NPP-VIIRS Nighttime Light Data to Estimate the Gross Domestic Product and the Electric Power Consumption of China at Multiple Scales&58; A Comparison with DMSP-OLS Data. Remote Sens. 2014, 6, 1705–1724. [Google Scholar]
- Li, X.; Li, D.; Xu, H.; Wu, C. Intercalibration between DMSP/OLS and VIIRS night-time light images to evaluate city light dynamics of Syria’s major human settlement during Syrian Civil War. Int. J. Remote Sens. 2017, 38, 1–18. [Google Scholar] [CrossRef]
- Ma, T.; Zhou, Y.; Wang, Y.; Zhou, C.; Haynie, S.; Xu, T. Diverse relationships between Suomi-NPP VIIRS night-time light and multi-scale socioeconomic activity. Remote Sens. Lett. 2014, 5, 652–661. [Google Scholar] [CrossRef]
- He, X.; Cao, Y.; Zhou, C. Evaluation of Polycentric Spatial Structure in the Urban Agglomeration of the Pearl River Delta (PRD) Based on Multi-Source Big Data Fusion. Remote Sens. 2021, 13, 3639. [Google Scholar] [CrossRef]
- Wang, Y.; Wang, M.; Huang, B.; Li, S.; Lin, Y. Estimation and Analysis of the Nighttime PM2.5 Concentration Based on LJ1-01 Images: A Case Study in the Pearl River Delta Urban Agglomeration of China. Remote Sens. 2021, 13, 3405. [Google Scholar] [CrossRef]
- Mukherjee, S.; Srivastav, S.K.; Gupta, P.K.; Hamm, N.A.S.; Tolpekin, V.A. An Algorithm for Inter-calibration of Time-Series DMSP/OLS Night-Time Light Images. Proc. Natl. Acad. Sci. India 2017, 87, 721–731. [Google Scholar] [CrossRef]
- Wang, L.; Fan, H.; Wang, Y. Estimation of consumption potentiality using VIIRS night-time light data. PLoS ONE 2018, 13, e0206230. [Google Scholar] [CrossRef]
- Ibrahim, H.; Kong, N.S.P. Image sharpening using sub-regions histogram equalization. IEEE Trans. Consum. Electron. 2009, 55, 891–895. [Google Scholar] [CrossRef]
- Pardo-Igúzquiza, E.; Chica-Olmo, M.; Atkinson, P.M. Downscaling cokriging for image sharpening. Remote Sens. Environ. 2006, 102, 86–98. [Google Scholar] [CrossRef]
- Wang, F.; Liu, Z.; Zhu, H.; Wu, P. A Parallel Method for Open Hole Filling in Large-Scale 3D Automatic Modeling Based on Oblique Photography. Remote Sens. 2021, 13, 3512. [Google Scholar] [CrossRef]
- Small, C.; Elvidge, C.D.; Baugh, K. Mapping urban structure and spatial connectivity with VIIRS and OLS night light imagery. In Proceedings of the Urban Remote Sensing Event, Sao Paulo, Brazil, 21–23 April 2013; pp. 230–233. [Google Scholar]
- Zhang, Q.; Wang, P.; Chen, H.; Huang, Q.; Jiang, H.; Zhang, Z.; Zhang, Y.; Luo, X.; Sun, S. A novel method for urban area extraction from VIIRS DNB and MODIS NDVI data: A case study of Chinese cities. Int. J. Remote Sens. 2017, 38, 6094–6109. [Google Scholar] [CrossRef]
- Dou, Y.; Liu, Z.; He, C.; Yue, H. Urban Land Extraction Using VIIRS Nighttime Light Data: An Evaluation of Three Popular Methods. Remote Sens. 2017, 9, 175. [Google Scholar] [CrossRef]
- Wang, L.; Fan, H.; Wang, Y. An estimation of housing vacancy rate using NPP-VIIRS night-time light data and OpenStreetMap data. Int. J. Remote Sens. 2019, 40, 8566–8588. [Google Scholar] [CrossRef]
- Yang, S.; Wang, M.; Jiao, L. Contourlet hidden Markov Tree and clarity-saliency driven PCNN based remote sensing images fusion. Appl. Soft Comput. J. 2012, 12, 228–237. [Google Scholar] [CrossRef]
- Shi, C.; Miao, Q.; Xu, P. A novel algorithm of remote sensing image fusion based on Shearlets and PCNN. Neurocomputing 2013, 117, 47–53. [Google Scholar]
- Biswas, B.; Sen, B.K.; Choudhuri, R. Remote Sensing Image Fusion using PCNN Model Parameter Estimation by Gamma Distribution in Shearlet Domain. Procedia Comput. Sci. 2015, 70, 304–310. [Google Scholar] [CrossRef][Green Version]
- Kumar, T.G.; Murugan, D.; Kavitha, R.; Manish, T.I. New information technology of performance evaluation of road extraction from high resolution satellite images based on PCNN and C-V model. Informatologia 2014, 47, 121–134. [Google Scholar]
- Lv, Q. Research on Road Network Extraction Technology of Remote Sensing Image Based on Deep Learning; National University of Defense Technology: Zunyi, China, 2019. [Google Scholar]
- Goutte, C.; Gaussier, E. A Probabilistic Interpretation of Precision, Recall and F-Score, with Implication for Evaluation. In Proceedings of the European Conference on Information Retrieval, Santiago de Compostela, Spain, 21–23 March 2005; pp. 345–359. [Google Scholar]
- Wang, F.; Zhou, K.; Wang, M.; Wang, Q. The Impact Analysis of Land Features to JL1-3B Nighttime Light Data at Parcel Level: Illustrated by the Case of Changchun, China. Sensors 2020, 20, 5447. [Google Scholar] [CrossRef] [PubMed]
- Jechow, A.; Hlker, F. Evidence That Reduced Air and Road Traffic Decreased Artificial Night-Time Skyglow during COVID-19 Lockdown in Berlin, Germany. Remote Sens. 2020, 12, 3412. [Google Scholar] [CrossRef]
- Bhandari, L.; Roychowdhury, K. Night Lights and Economic Activity in India: A study using DMSP-OLS night time images. Proc. Asia-Pac. Adv. Netw. 2011, 32, 218. [Google Scholar] [CrossRef]
- Fan, J.; Ma, T.; Zhou, C.; Zhou, Y.; Xu, T. Comparative Estimation of Urban Development in China’s Cities Using Socioeconomic and DMSP/OLS Night Light Data. Remote Sens. 2014, 6, 7840–7856. [Google Scholar] [CrossRef]
- Hlaing, S.; Harmel, T.; Gilerson, A.; Foster, R.; Weidemann, A.; Arnone, R.; Wang, M.; Ahmed, S. Evaluation of the VIIRS ocean color monitoring performance in coastal regions. Remote Sens. Environ. 2013, 139, 398–414. [Google Scholar] [CrossRef]
Publisher’s Note: MDPI stays neutral with regard to jurisdictional claims in published maps and institutional affiliations. |
© 2021 by the authors. Licensee MDPI, Basel, Switzerland. This article is an open access article distributed under the terms and conditions of the Creative Commons Attribution (CC BY) license (https://creativecommons.org/licenses/by/4.0/).