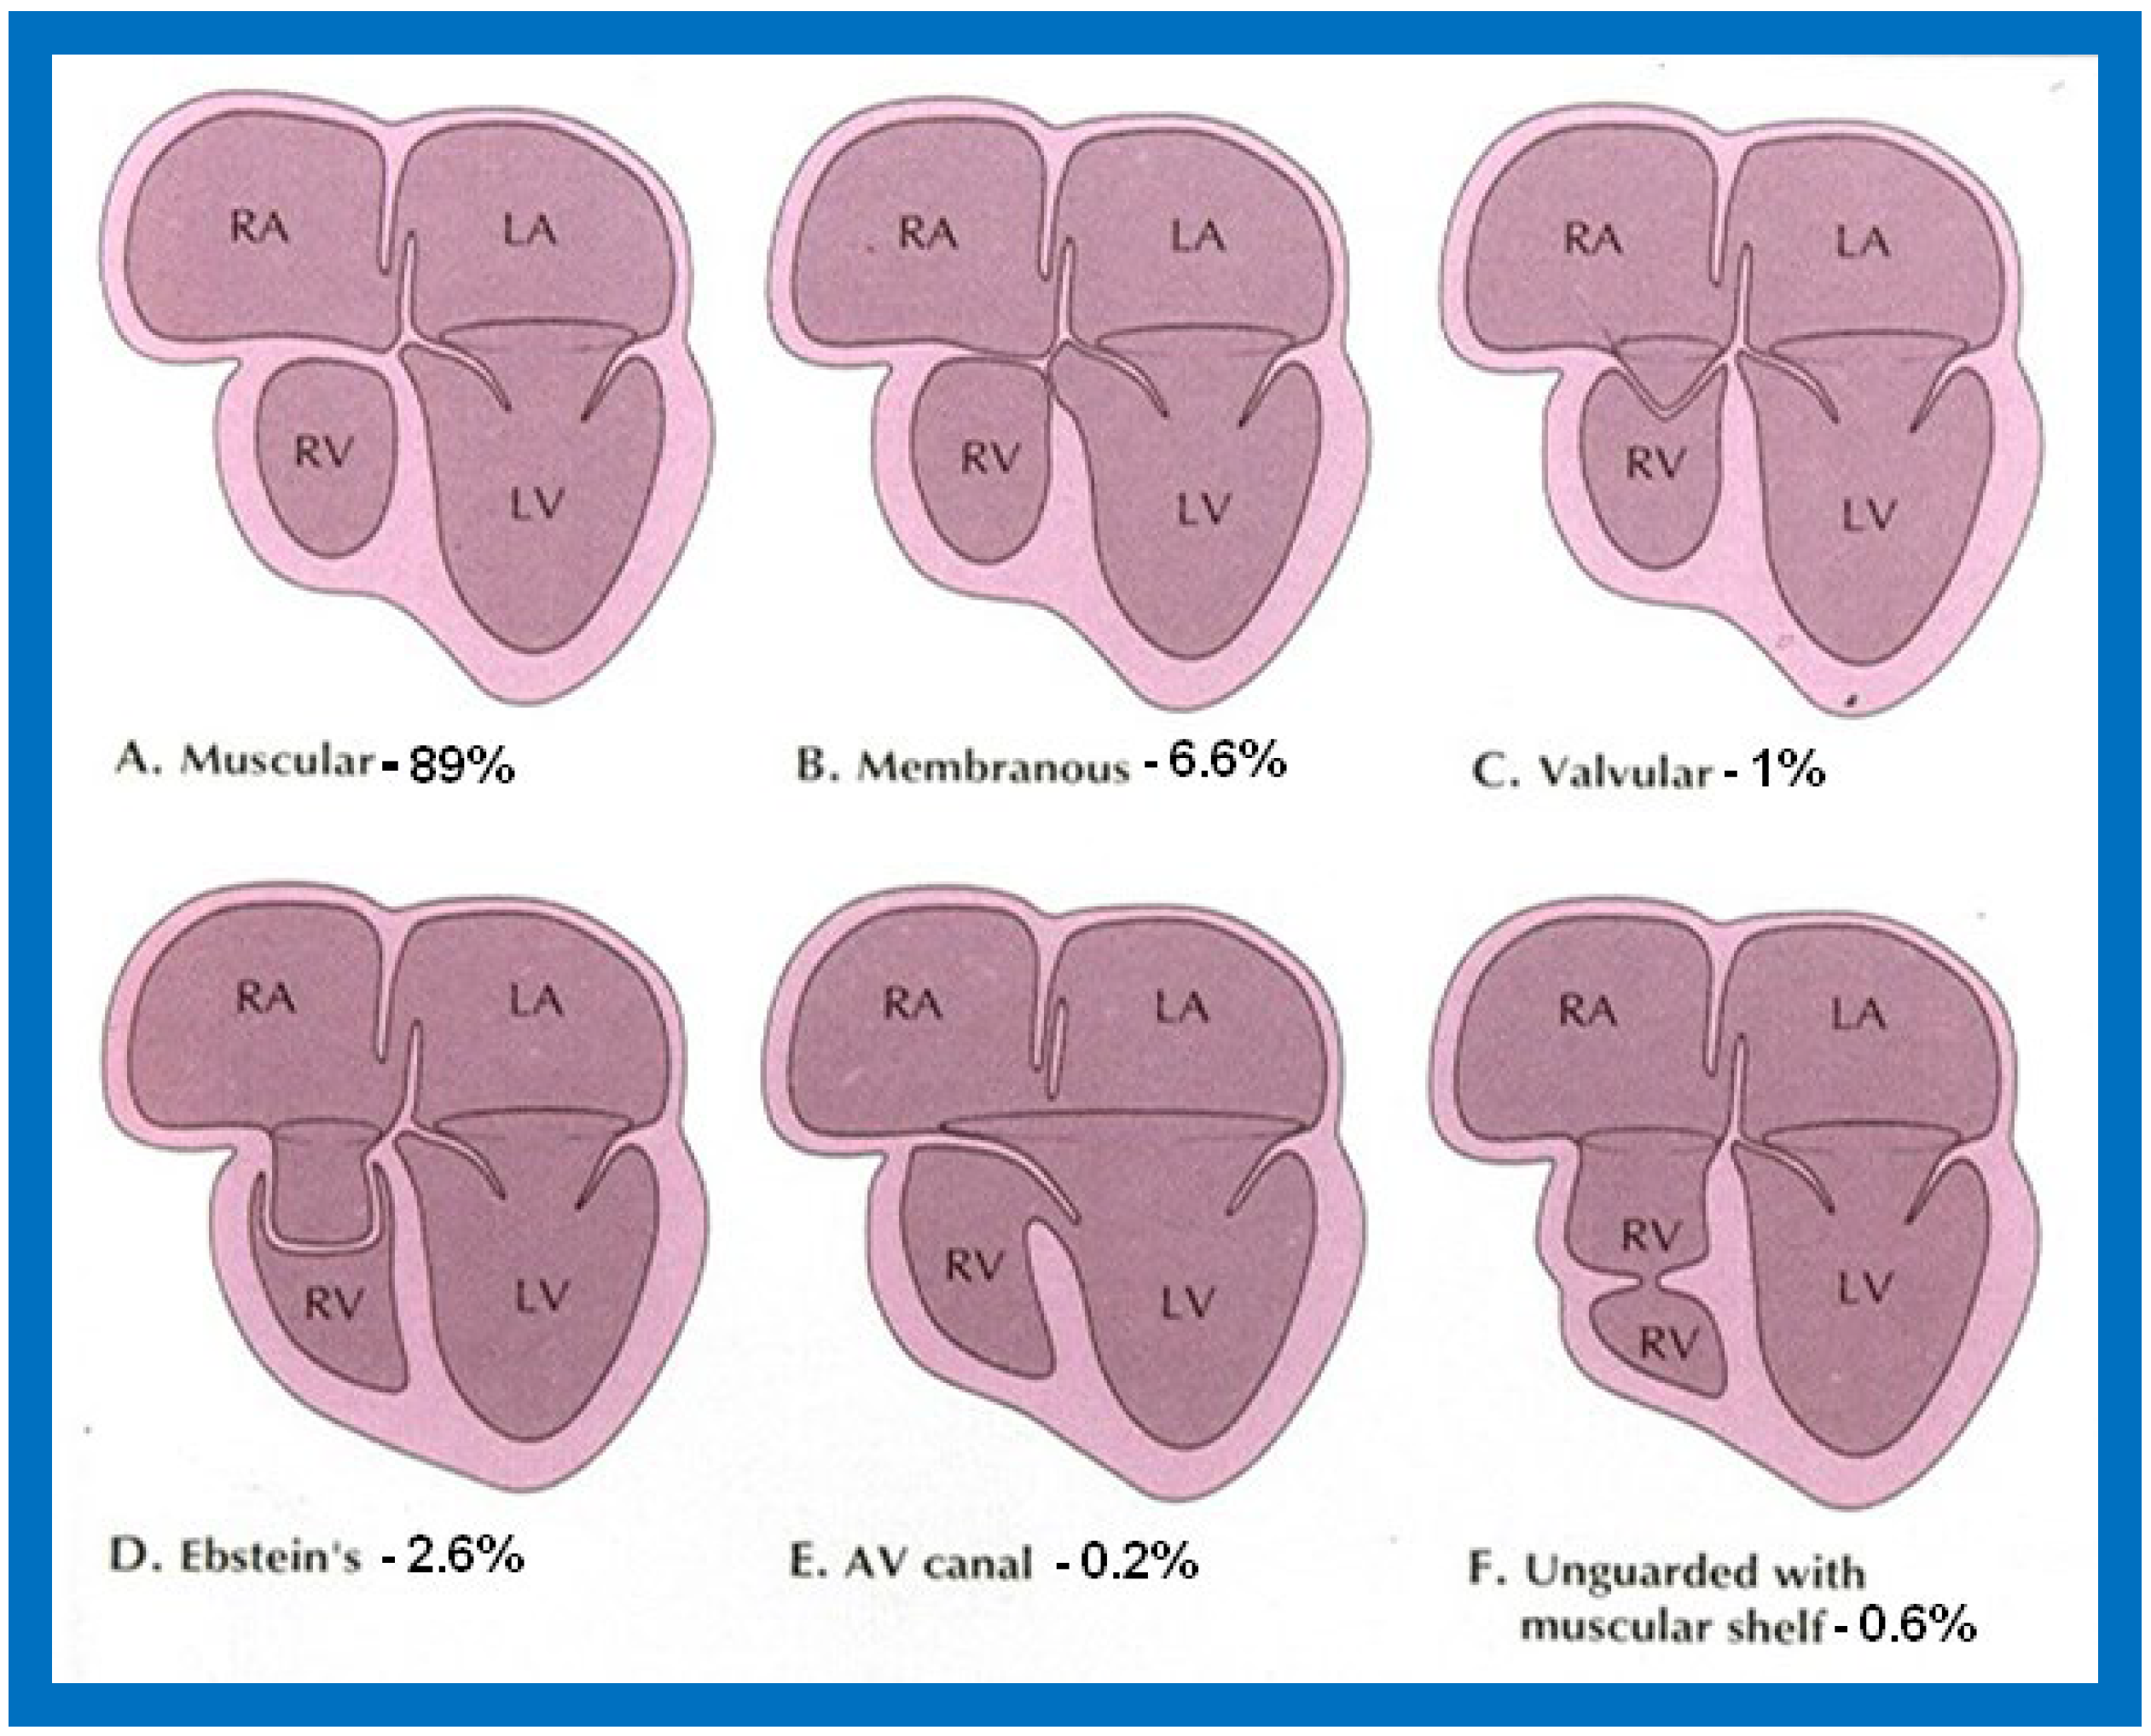
Figure 1.
Diagrammatic portrayal of anatomic types of tricuspid atresia based on the morphology of the atretic tricuspid valve. (
A) muscular type, (
B) membranous type, (
C) valvular type, (
D) Ebstein’s type, (
E) atrioventricular canal type, and (
F) unguarded valve with muscular shelf. The prevalence of each type is shown under each diagram. For the sake of simplicity, the great vessels are not shown. Also note that no ventricular septal defects are shown. LA, left atrium; LV, left ventricle; RA, right atrium; RV right ventricle. Modified from Rao PS, Alapati S.
Neonatology Today 2012;7(5):1–12 [
11].
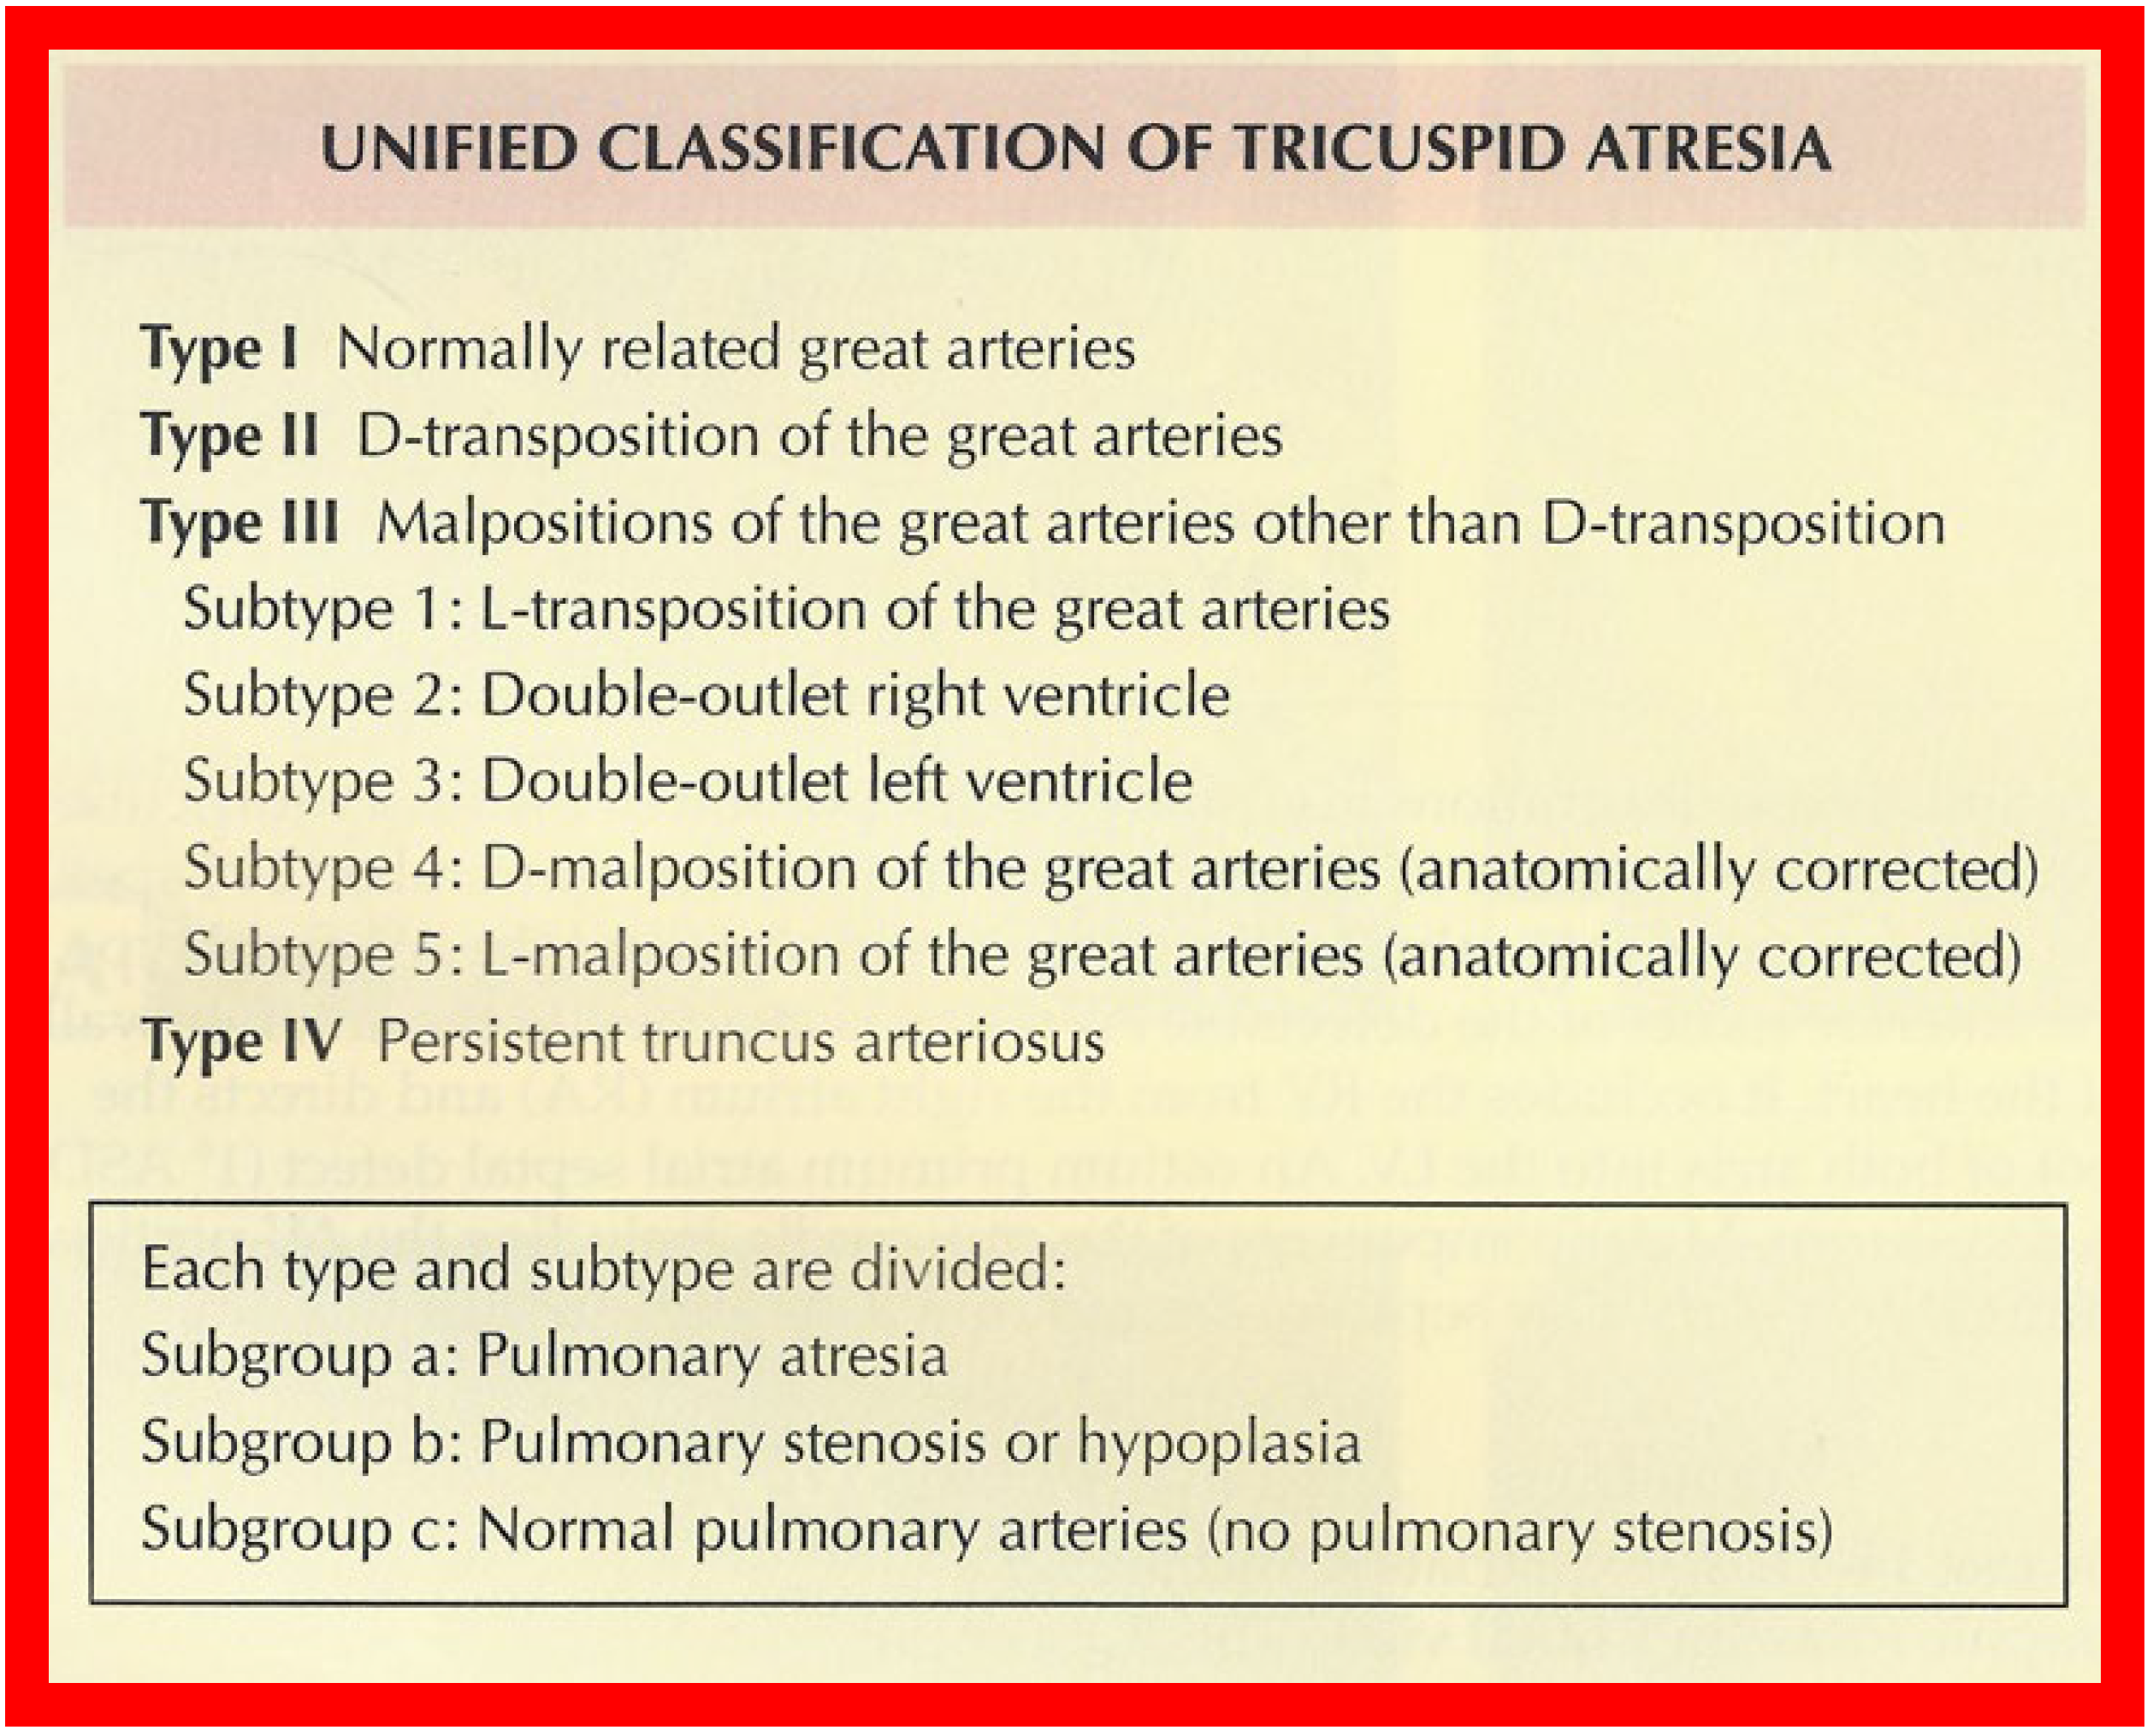
Figure 2.
Classification of Tricuspid Atresia. Reproduced from [
12].
Figure 2.
Classification of Tricuspid Atresia. Reproduced from [
12].
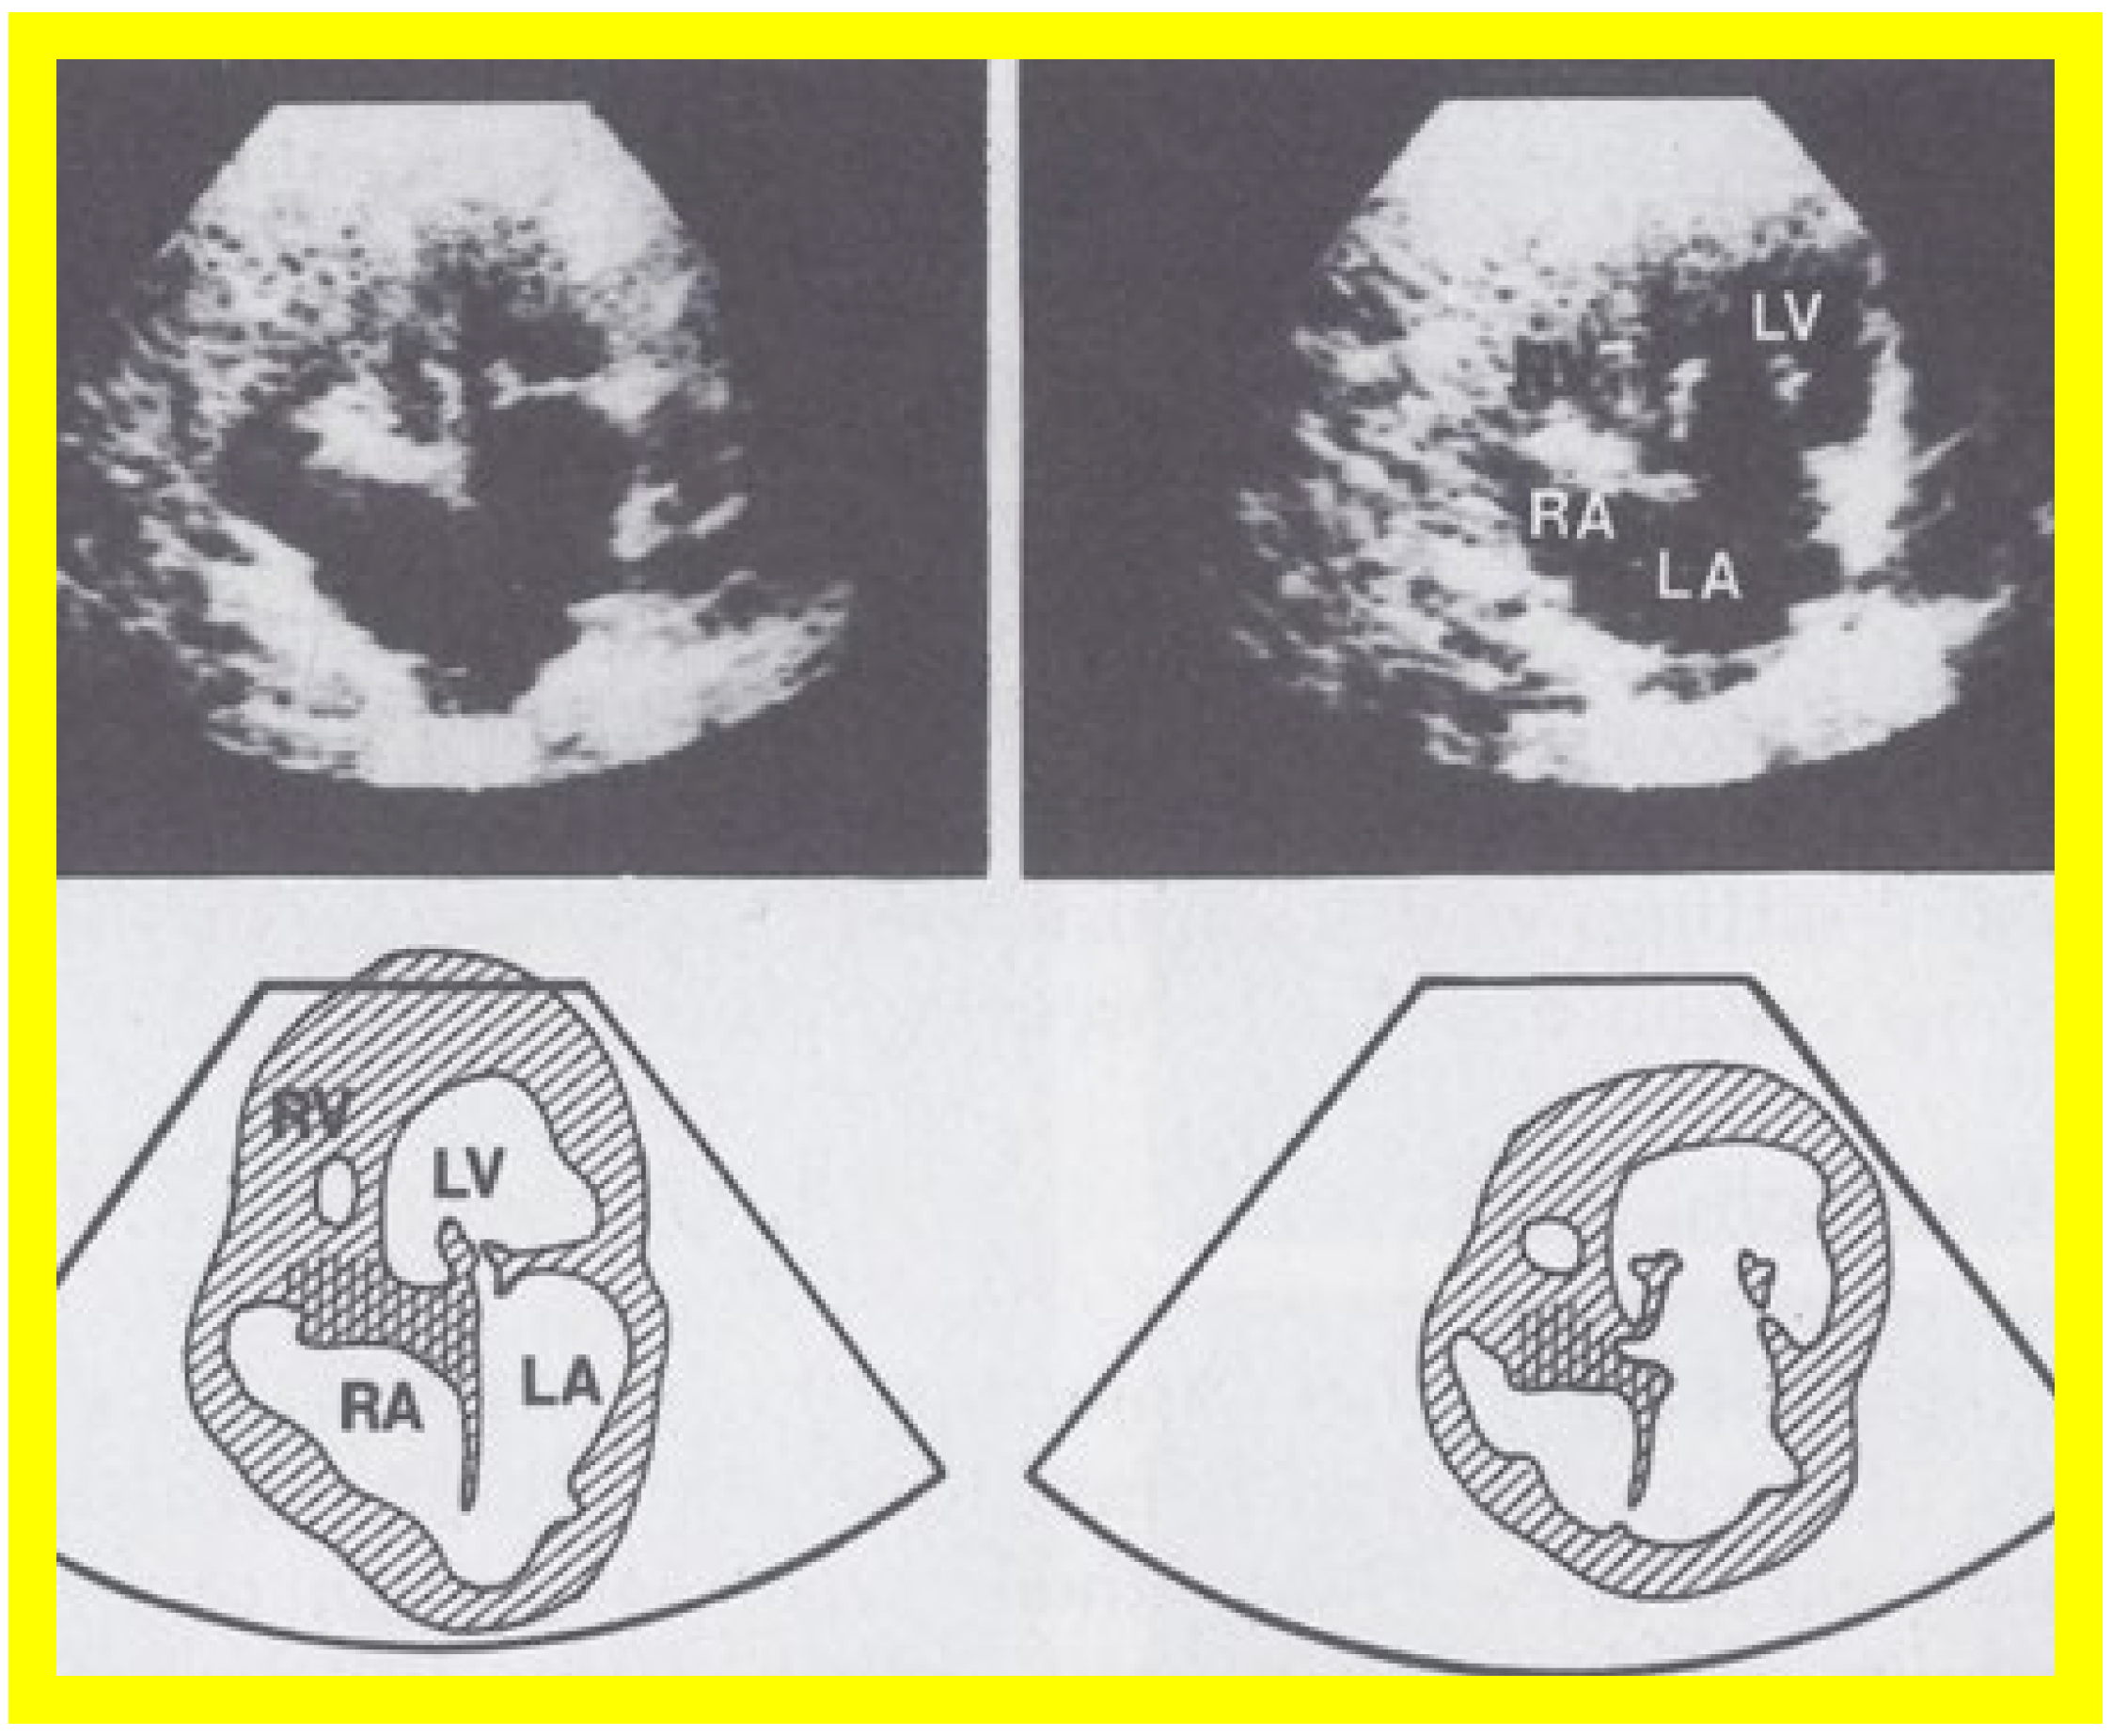
Figure 3.
Selected video frames from apical four chamber view of a two dimensional (2D) echocardiographic study, demonstrating a dense band of echoes between the right atrium (RA) and hypoplastic right ventricle (RV). Line drawings are shown beneath the 2D frames. Note that the mitral valve is closed in the left image, while it is open in the right image. The atretic tricuspid valve echoes remain unchanged. LA, left atrium; LV, left ventricle. Reproduced from Reference [
24].
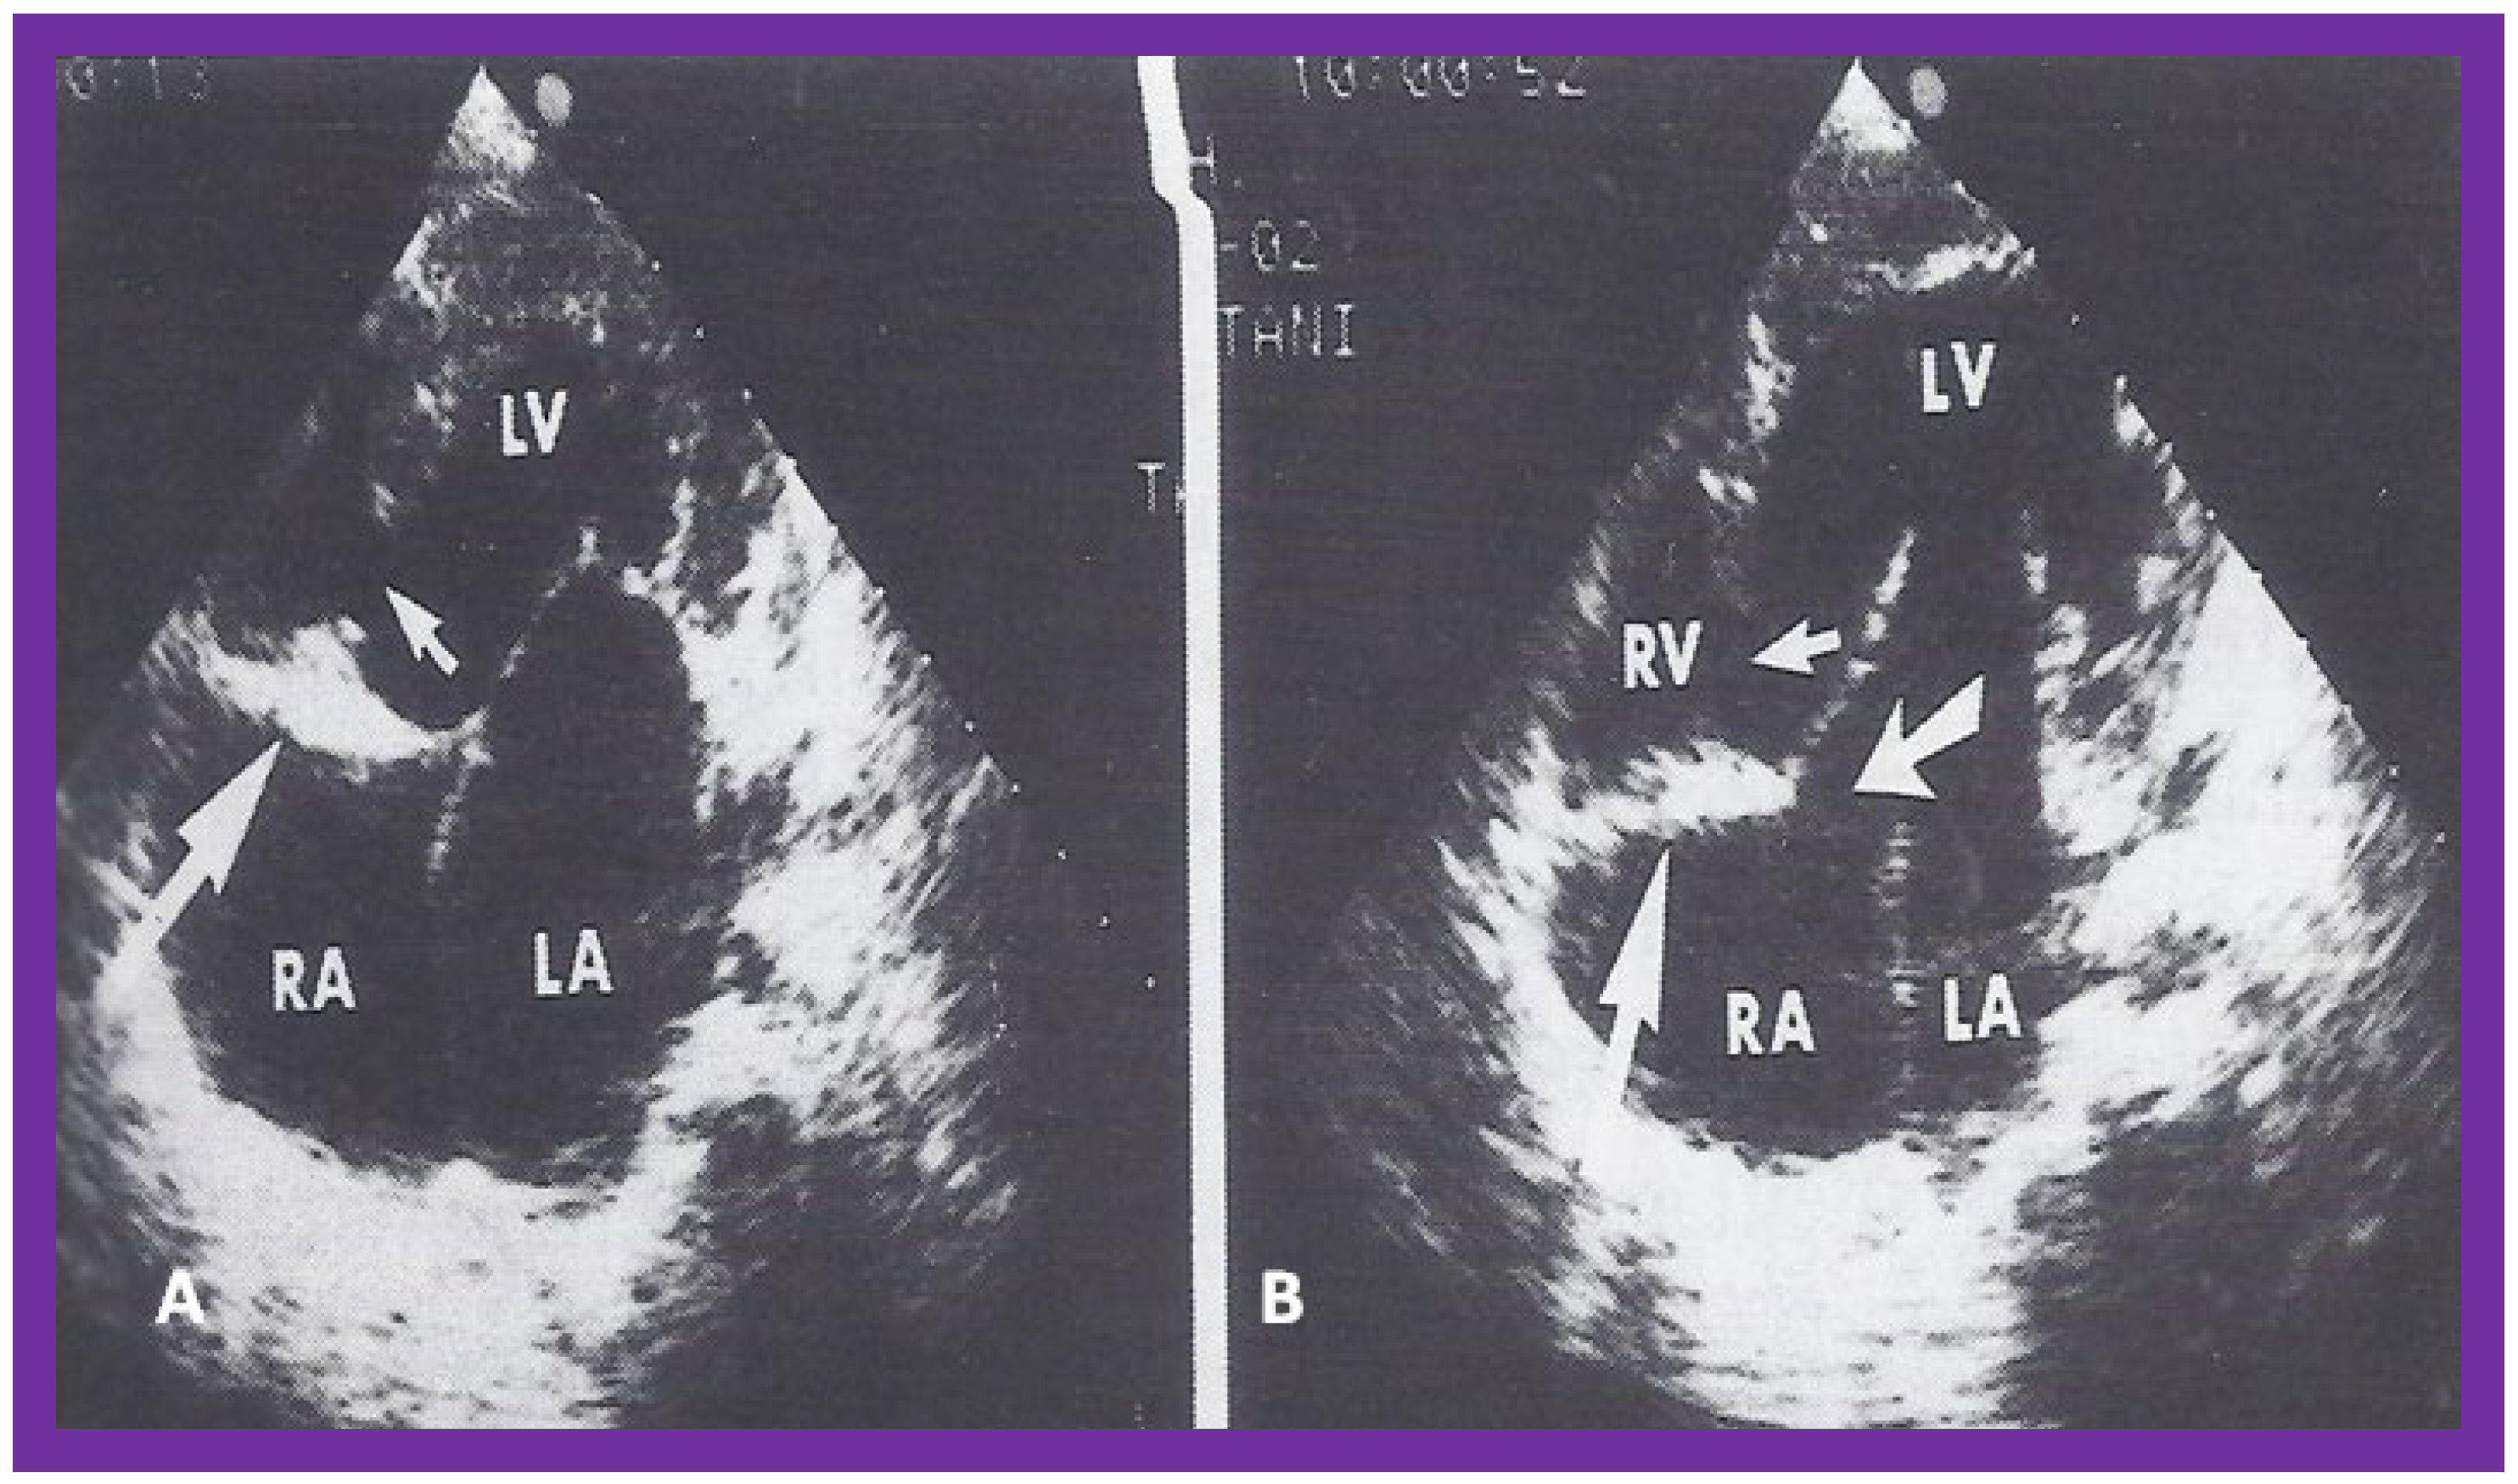
Figure 4.
Selected video frames from subcostal four chamber view of a two dimensional echocardiographic study demonstrating an atretic tricuspid valve (ATV) (thick arrow), represented by a dense band of echoes between the right atrium (RA) and hypoplastic right ventricle (RV). In (
A), the mitral valve (MV) is closed while in (
B), it is open. Note the improvement from the pictures shown in
Figure 2. LA, left atrium; LV, left ventricle. Reproduced from Reference [
27].
Figure 5.
Apical four chamber view pictures of an infant with tricuspid atresia with ostium primum atrial septal defect (large arrow in the middle of (
B)). Note the small right ventricle (RV) and a ventricular septal defect (small arrow in (
A,
B)). LA, left atrium; LV, left ventricle; RA, right atrium. Reproduced from Reference [
28].
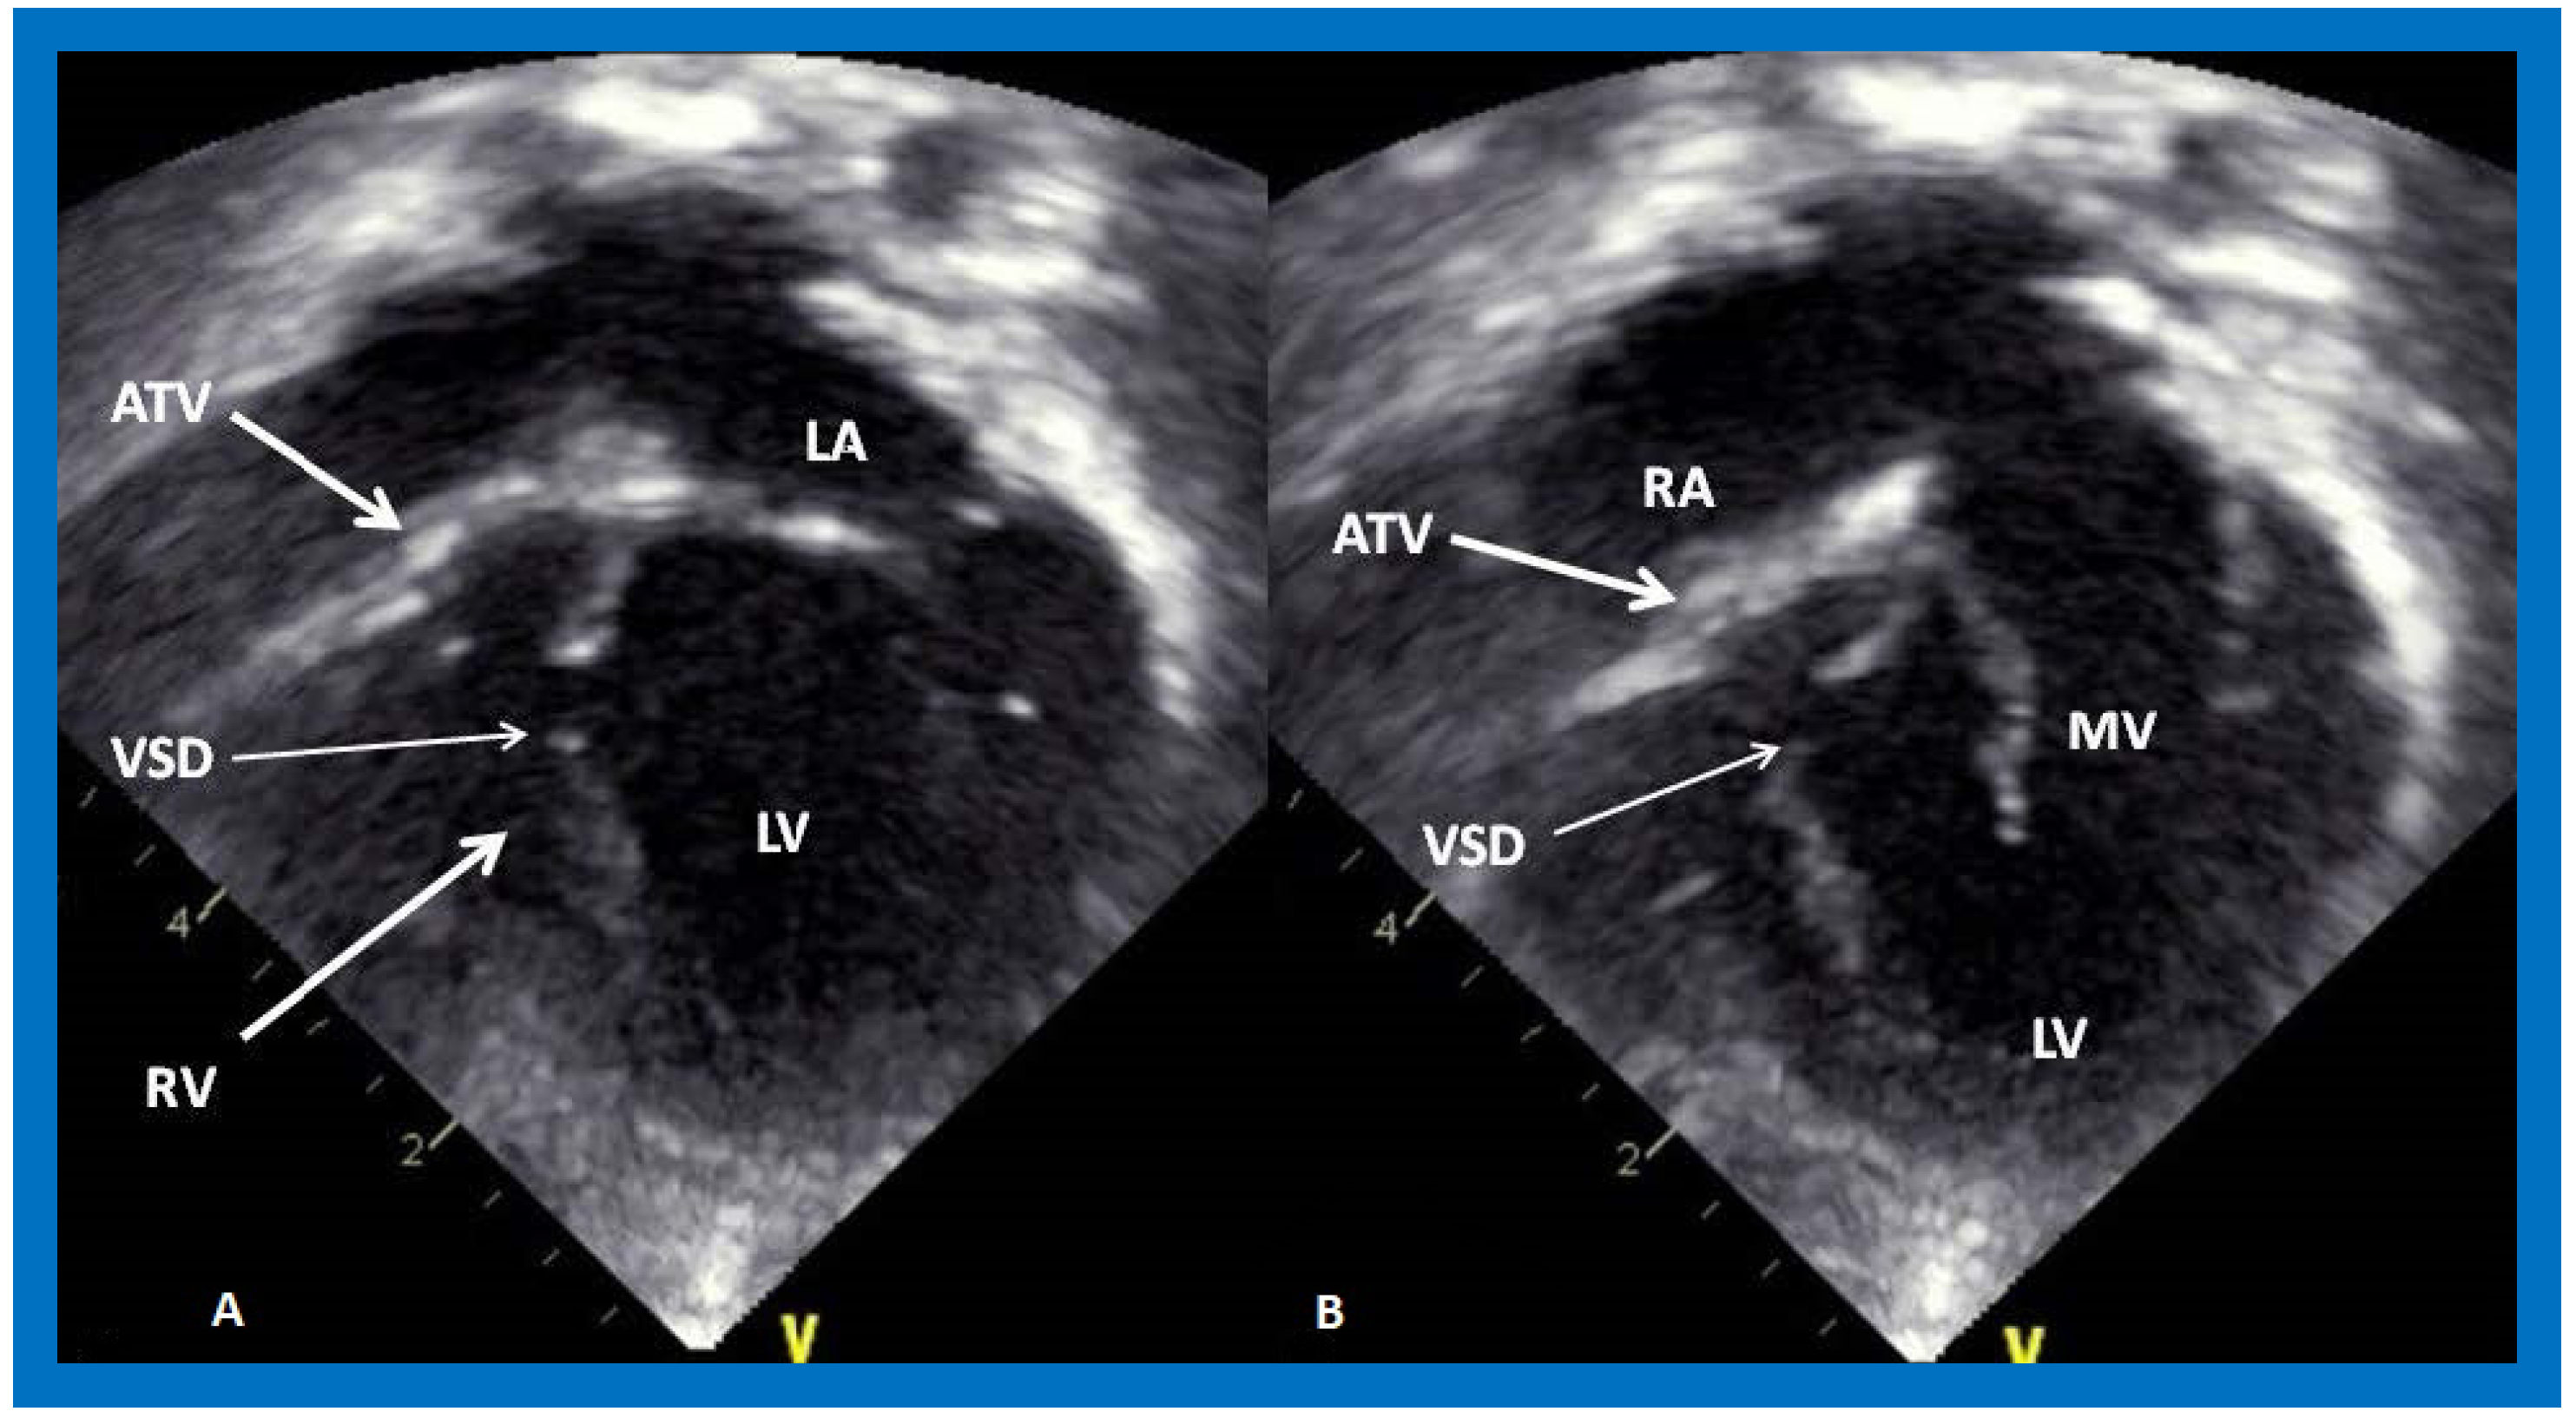
Figure 6.
Selected video frames from apical four chamber, two dimensional echocardiographic views of a patient with tricuspid atresia showing an enlarged left ventricle (LV), a small right ventricle (RV) and a dense band of echoes at the site where the tricuspid valve echo should be (ATV) (thick arrow) with a closed (
A) and open (
B) mitral valve. A moderate sized ventricular septal defect (VSD) (thin arrow) is shown. LA, left atrium; RA, right atrium. Reproduced from Reference [
29].
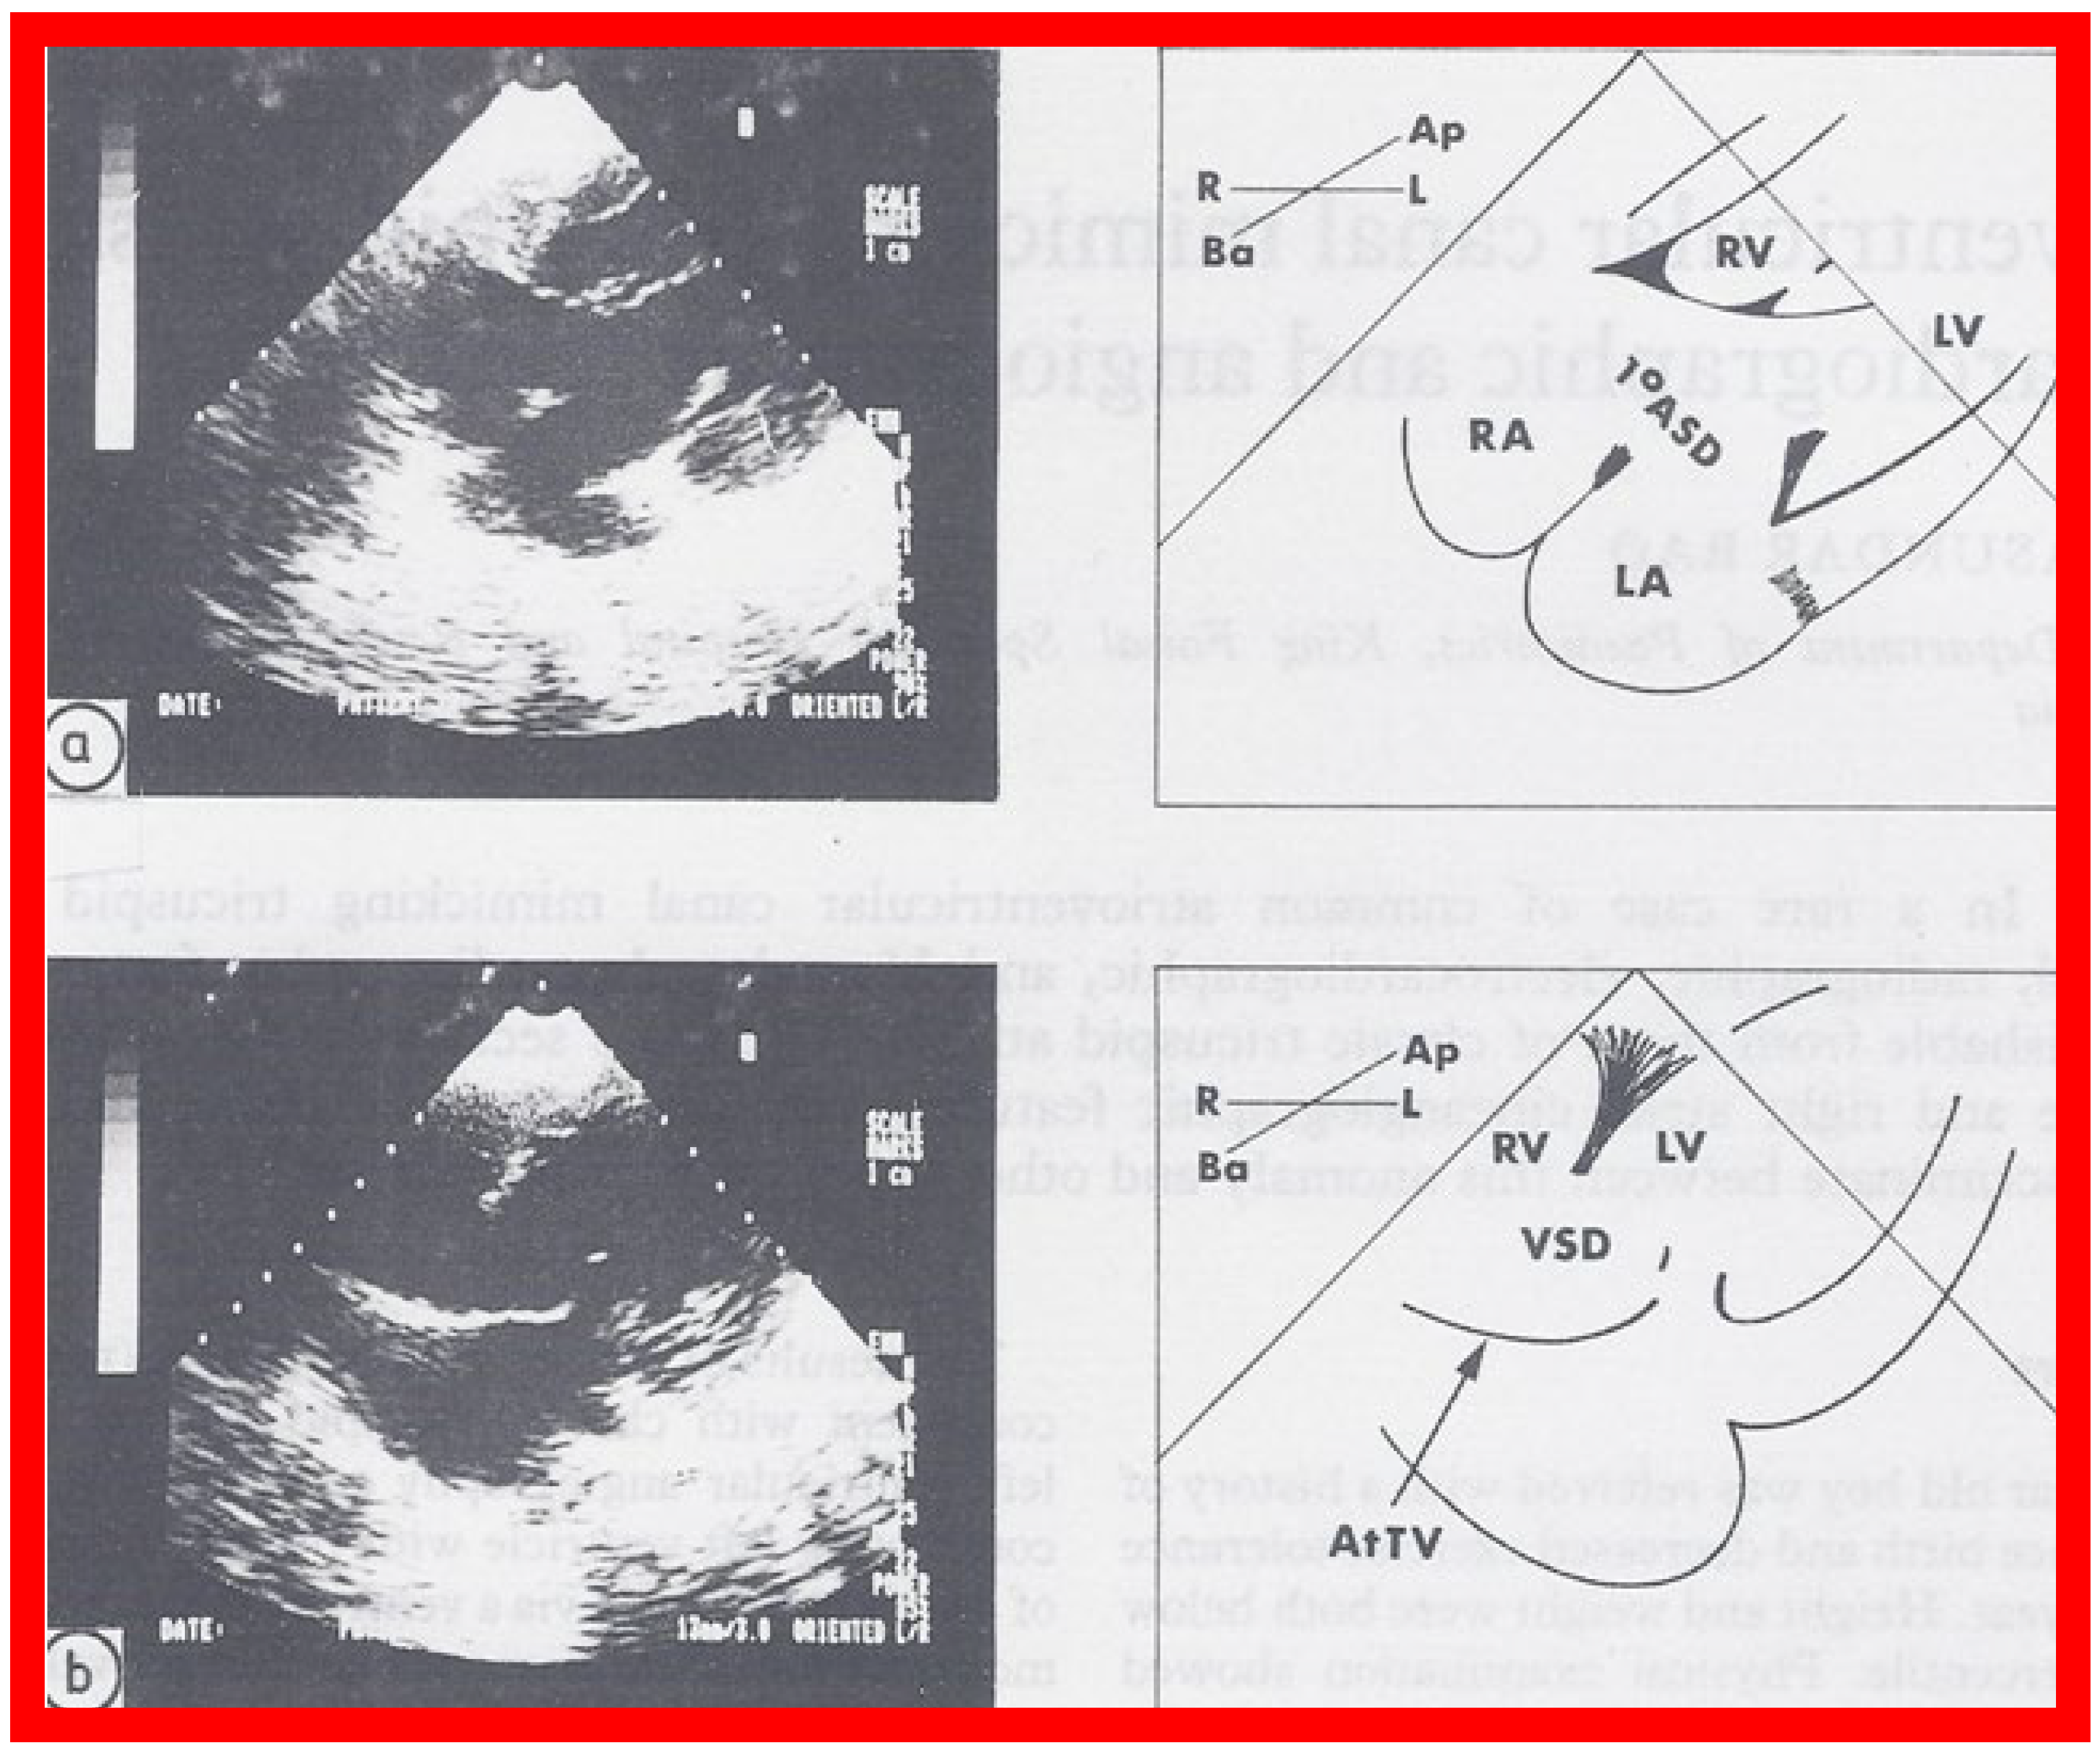
Figure 7.
Selected two dimensional, subcostal, four chamber echocardiographic frames with an open (
a) and closed (
b) atrioventricular valve. Line drawings on the right of (
a,
b) are made for greater clarity and for labeling. A large ostium primum atrial septal defect (1
0 ASD) is shown in (
a). When the large atrioventricular valve leaflet is open (
a), it completely closes the right ventricle (RV) from the right atrium (RA) and the ventricular septal defect (VSD) and allows the emptying of blood from both atria into the left ventricle (LV). When the atrioventricular valve leaflet is closed, (
b), it continues to occlude the RV from the RA while allowing the VSD to freely communicate between the RV and LV. Ap, Apex; AtTV, atretic tricuspid valve; Ba, base; L, left; LA, left atrium; R, right. Reproduced from Rao PS.
Brit Heart J 1987;58:409–412 [
30].
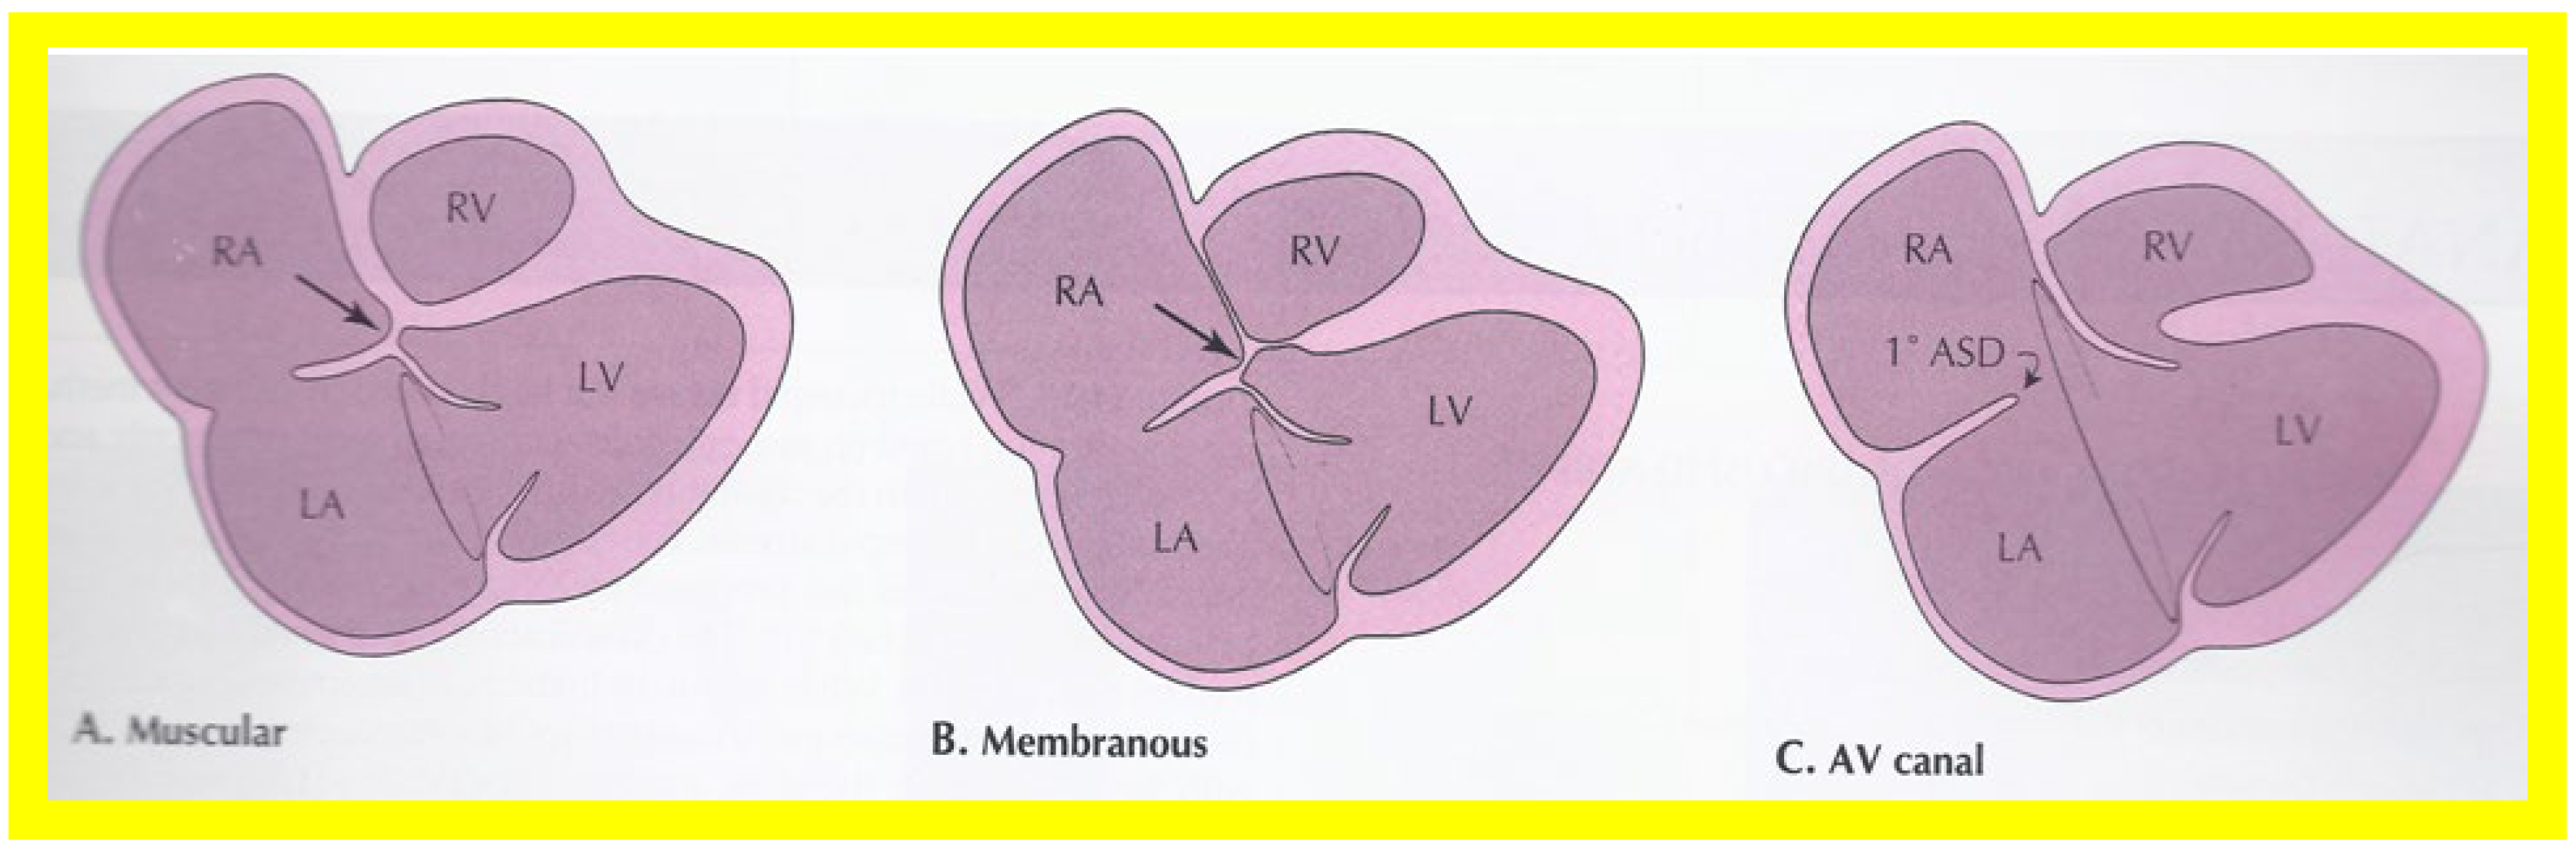
Figure 8.
Line drawings demonstrating two dimensional echocardiographic appearances in a subcostal four chamber view of the muscular (
A), membranous (
B), and atrioventricular canal (
C) variants of tricuspid atresia. (
A) The atretic tricuspid valve is represented by a thick band of echoes between the right atrium (RA) and the small right ventricle (RV) in the muscular type. (
B) The tricuspid valve is represented by a thin line in the membranous type. Note that crux of the heart (arrows in (
A,
B)) is clearly seen in both these types (
A,
B). The attachment of the anterior leaflet of the detectable atrioventricular valve to the left side of the interatrial septum is evident. (
C) In the atrioventricular canal type of tricuspid atresia, the anterior leaflet of the detectable atrioventricular canal is attached to the anterior wall of the heart, occluding the right ventricle from the right atrium, and allows the exit of blood from both atria into the left ventricle (LV). The crux cordis and the atrioventricular portion of the interventricular septum are not seen. Reproduced from Rao PS.
Brit Heart J 1987;58:409–412 [
30] and from Reference [
12].

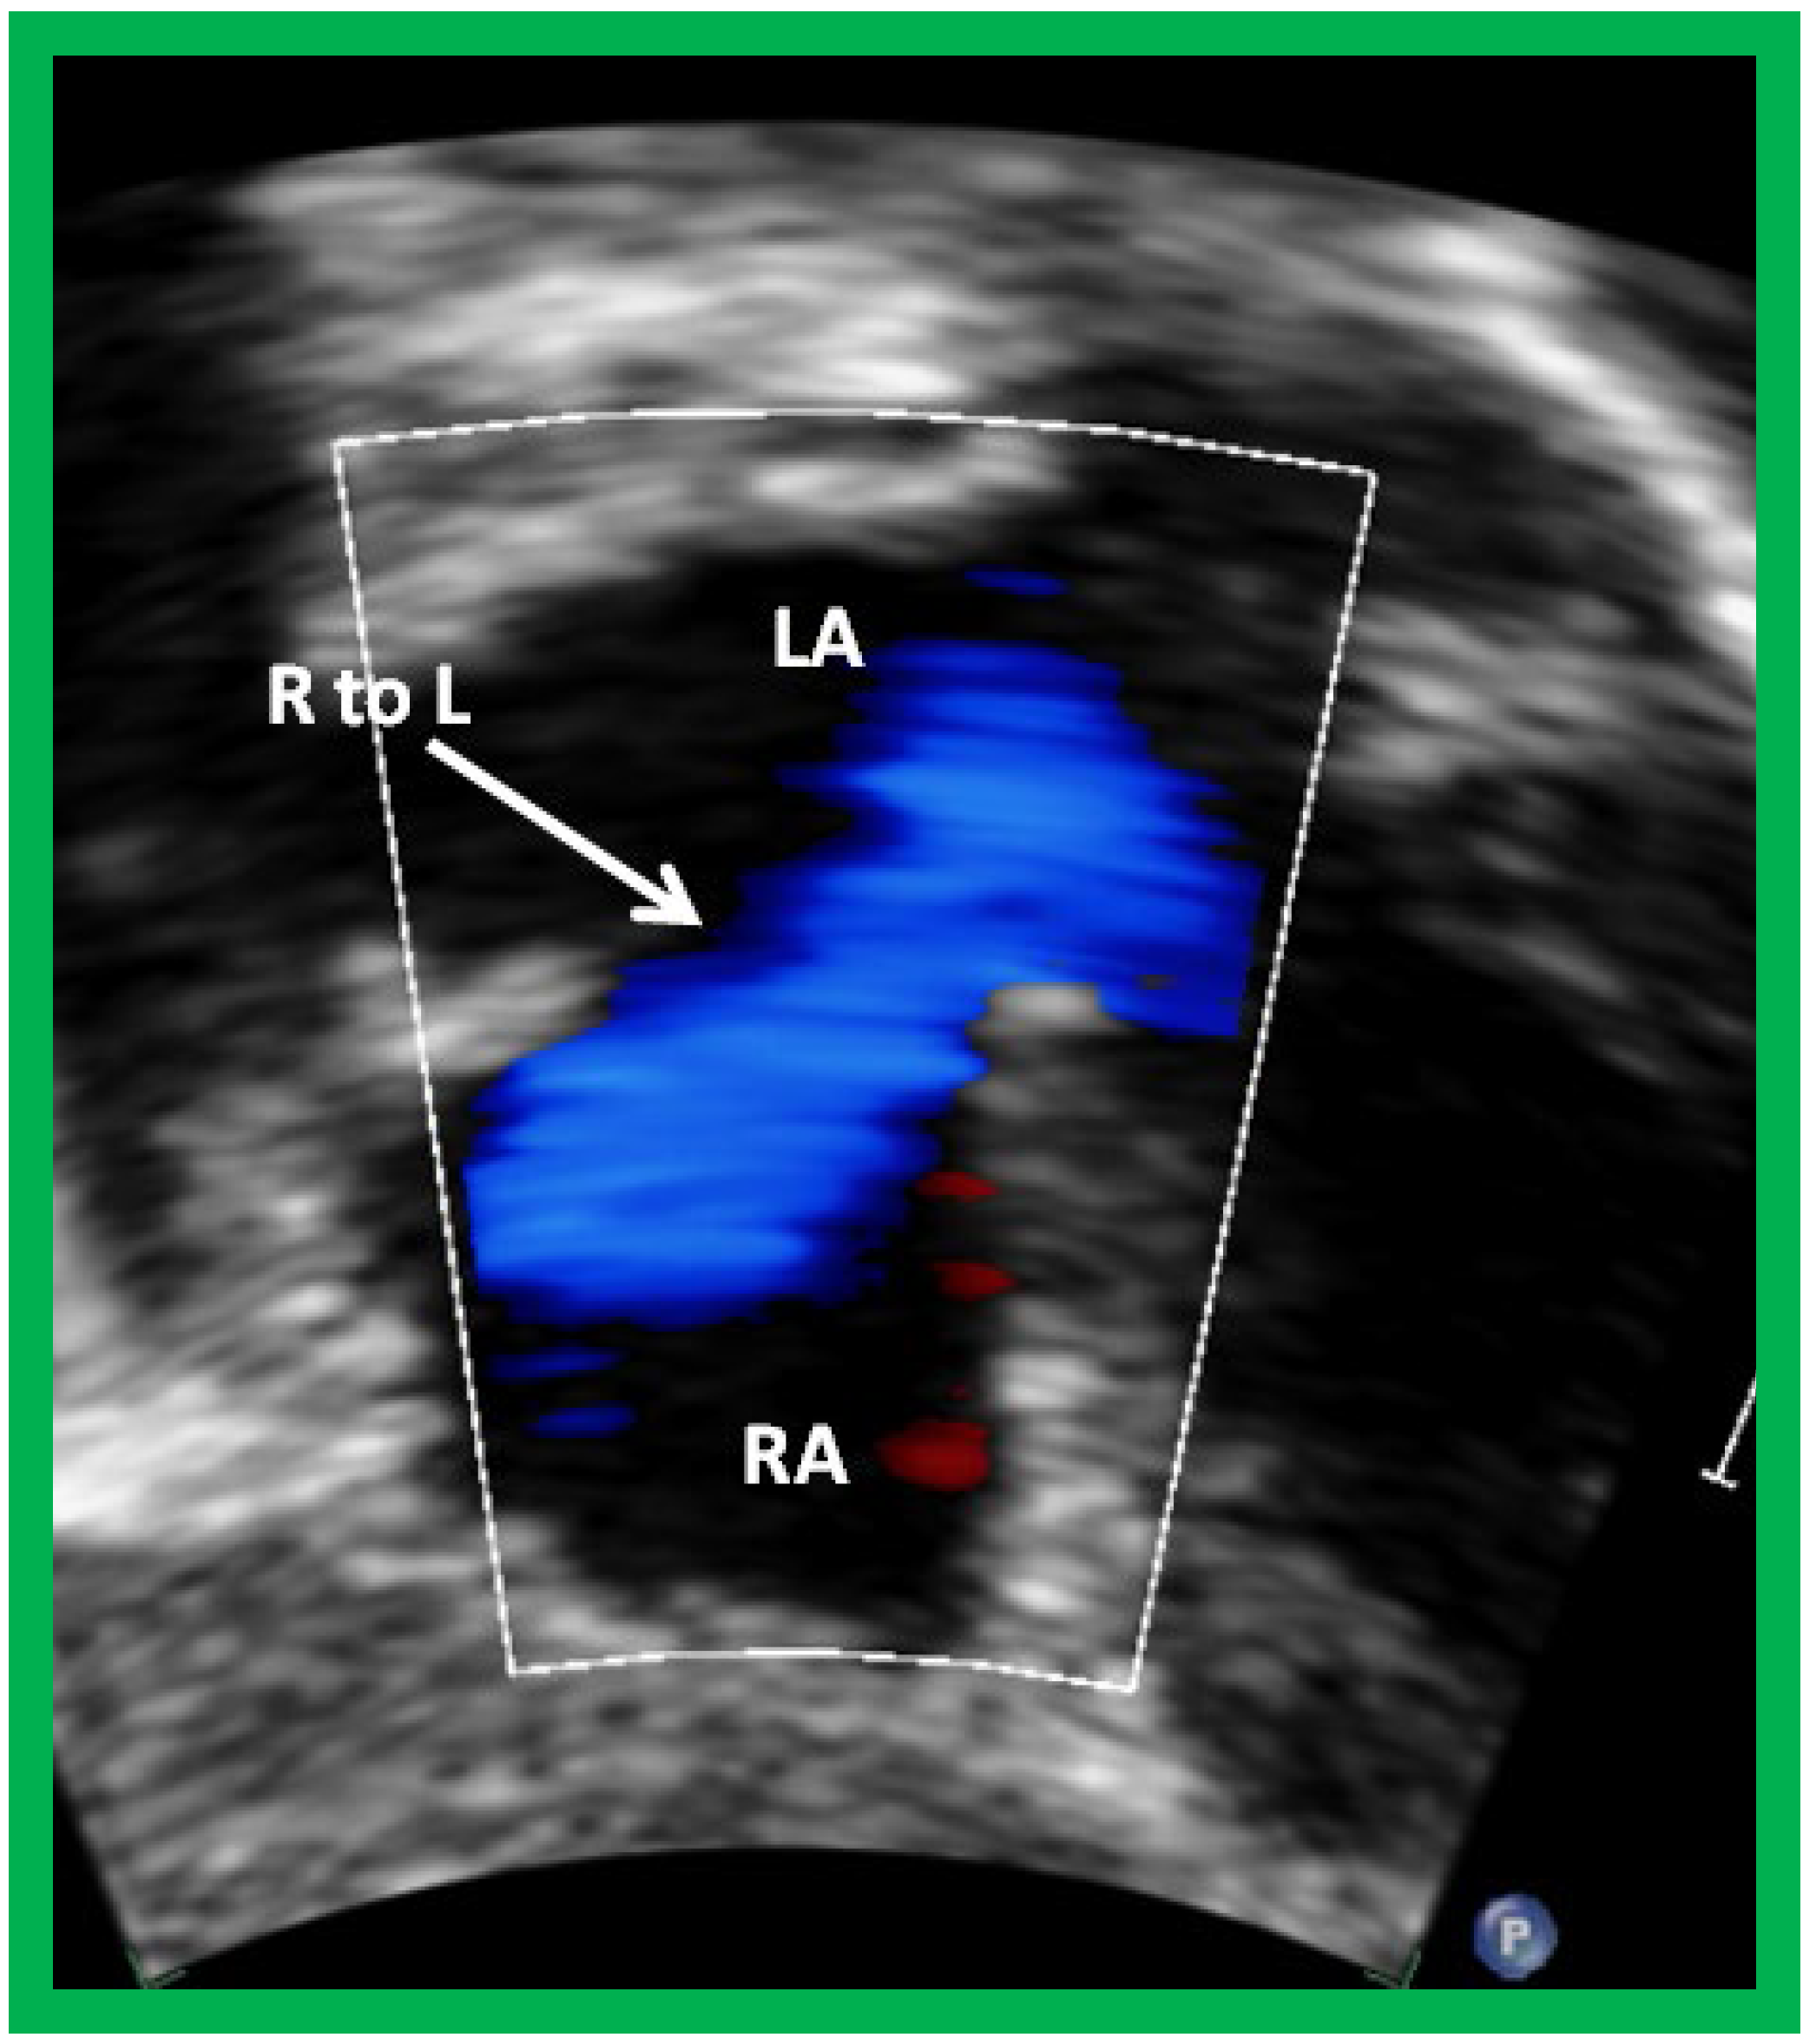
Figure 9.
Selected video frame from subcostal view of a patient with tricuspid atresia demonstrating right to left (R to L) shunt (arrow) across the interatrial communication. LA, left atrium; RA, right atrium. Reproduced from Reference [
29].
Figure 9.
Selected video frame from subcostal view of a patient with tricuspid atresia demonstrating right to left (R to L) shunt (arrow) across the interatrial communication. LA, left atrium; RA, right atrium. Reproduced from Reference [
29].
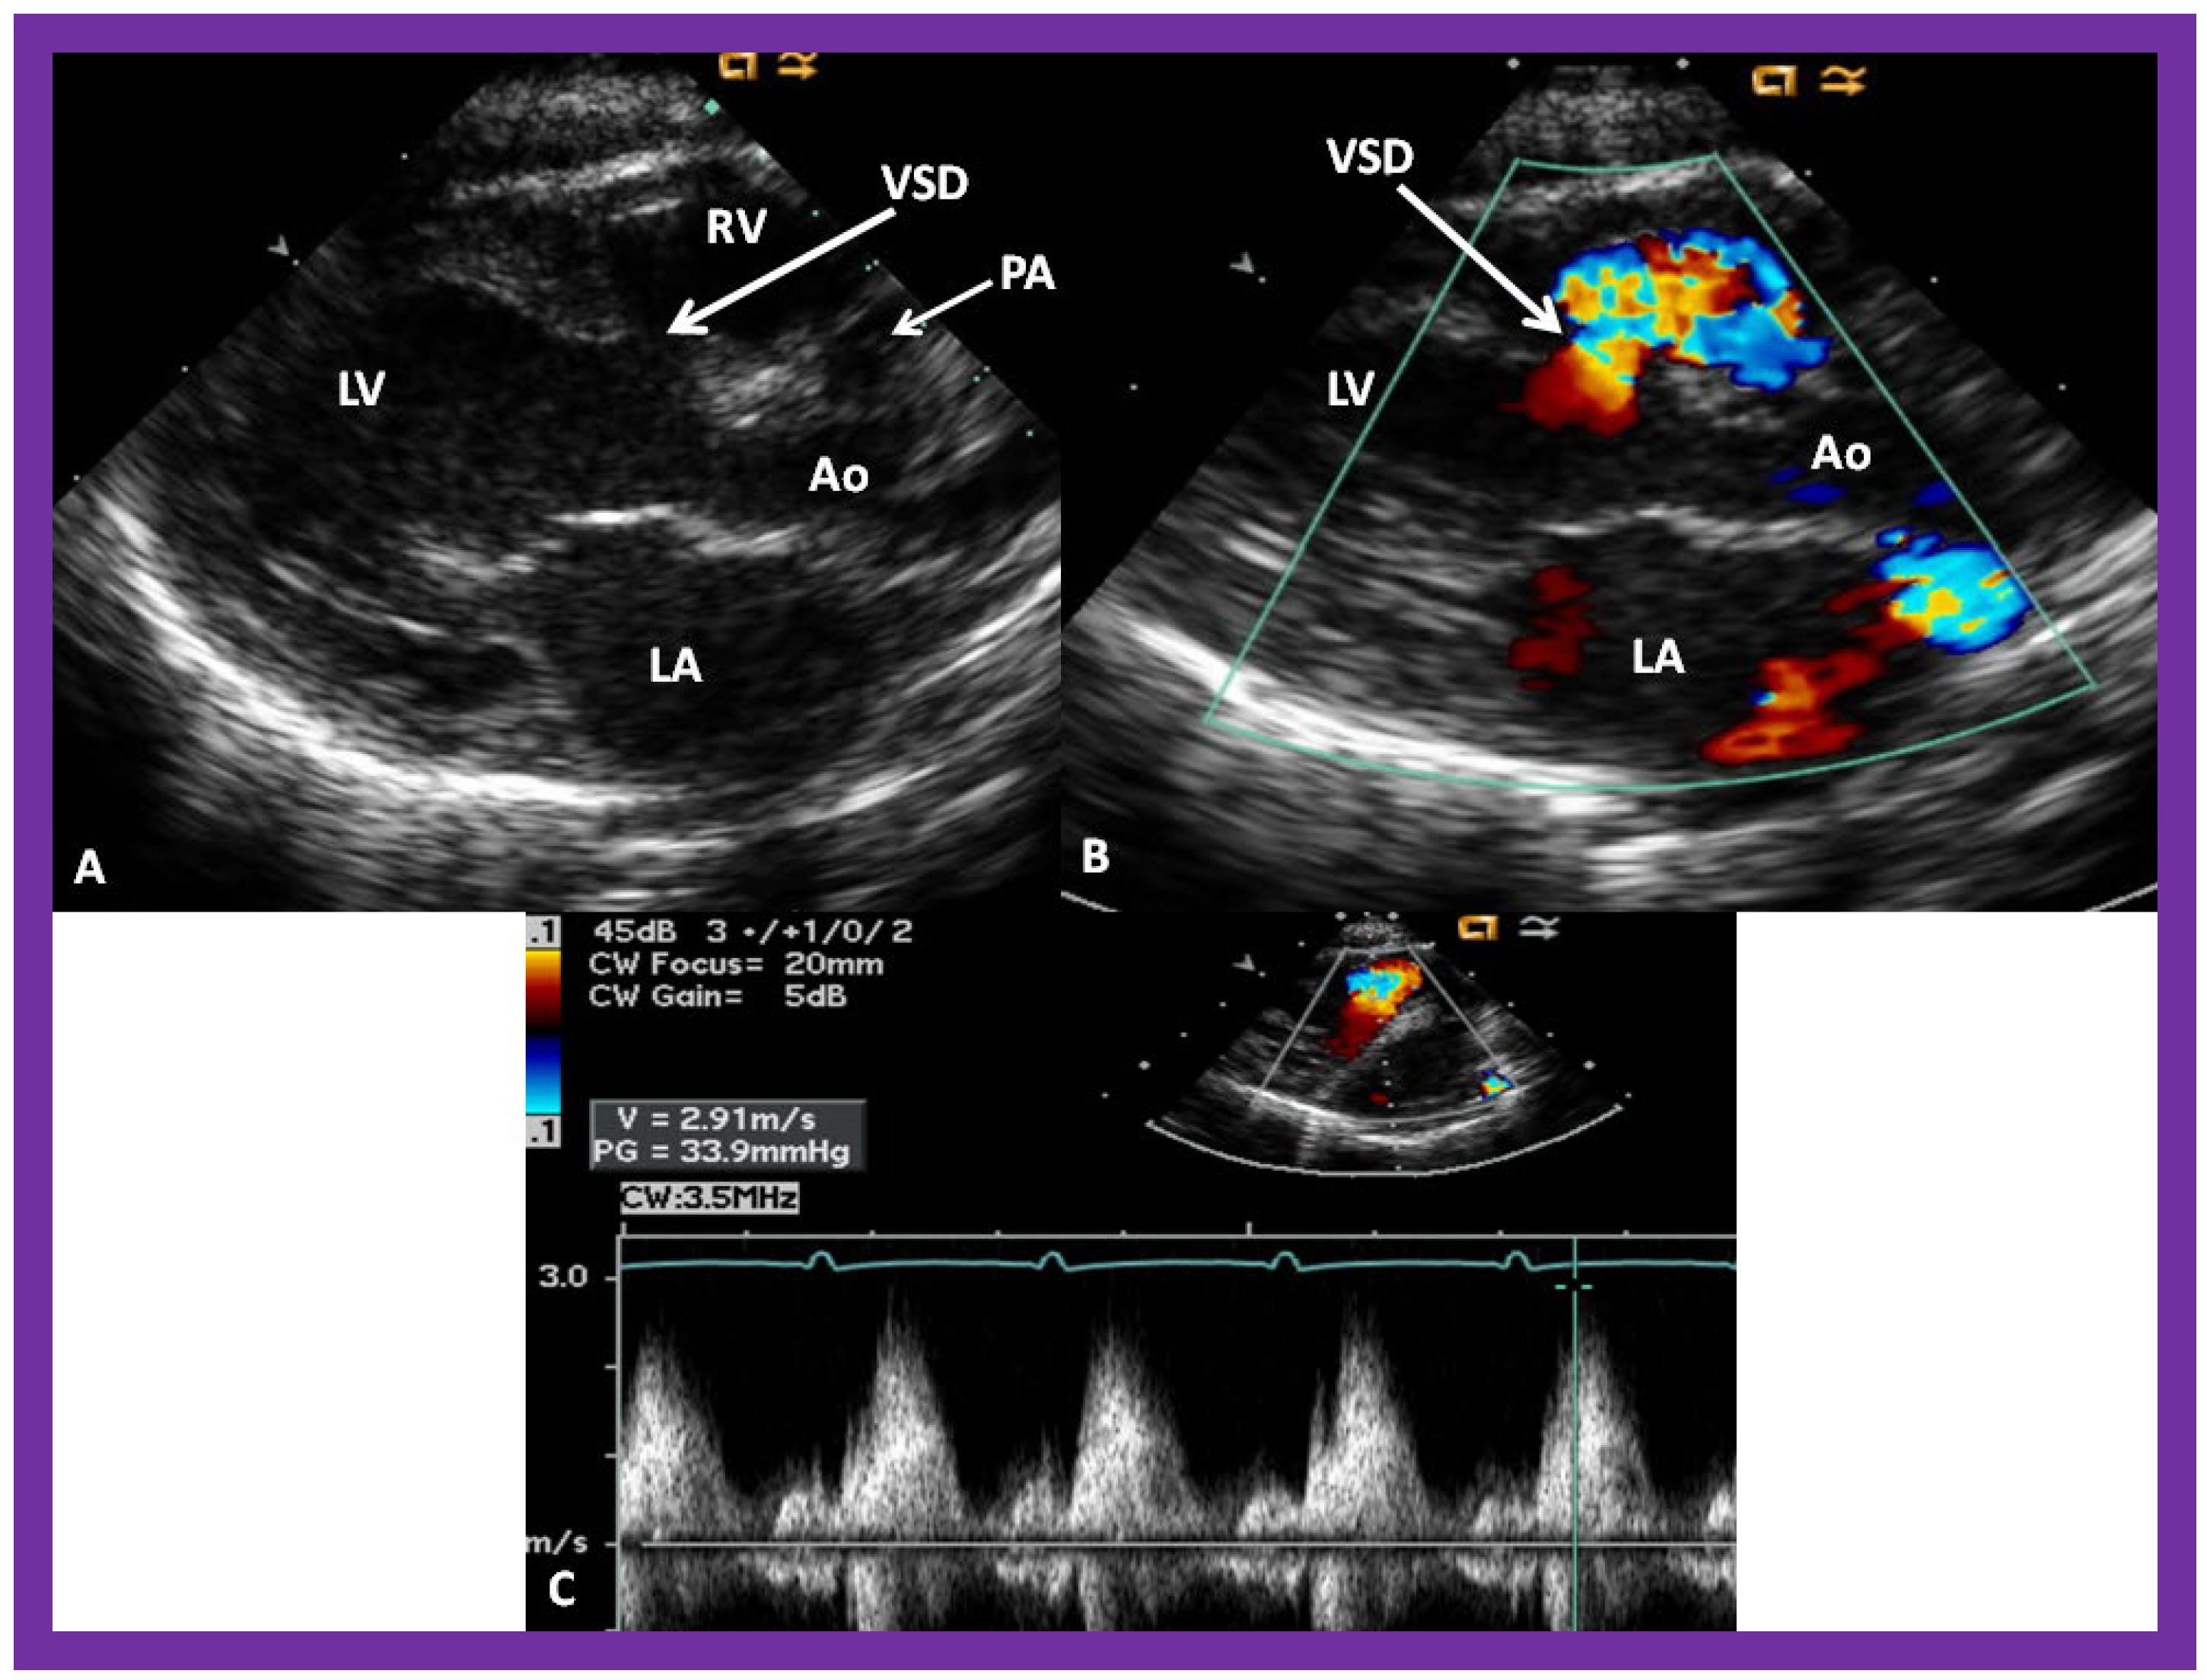
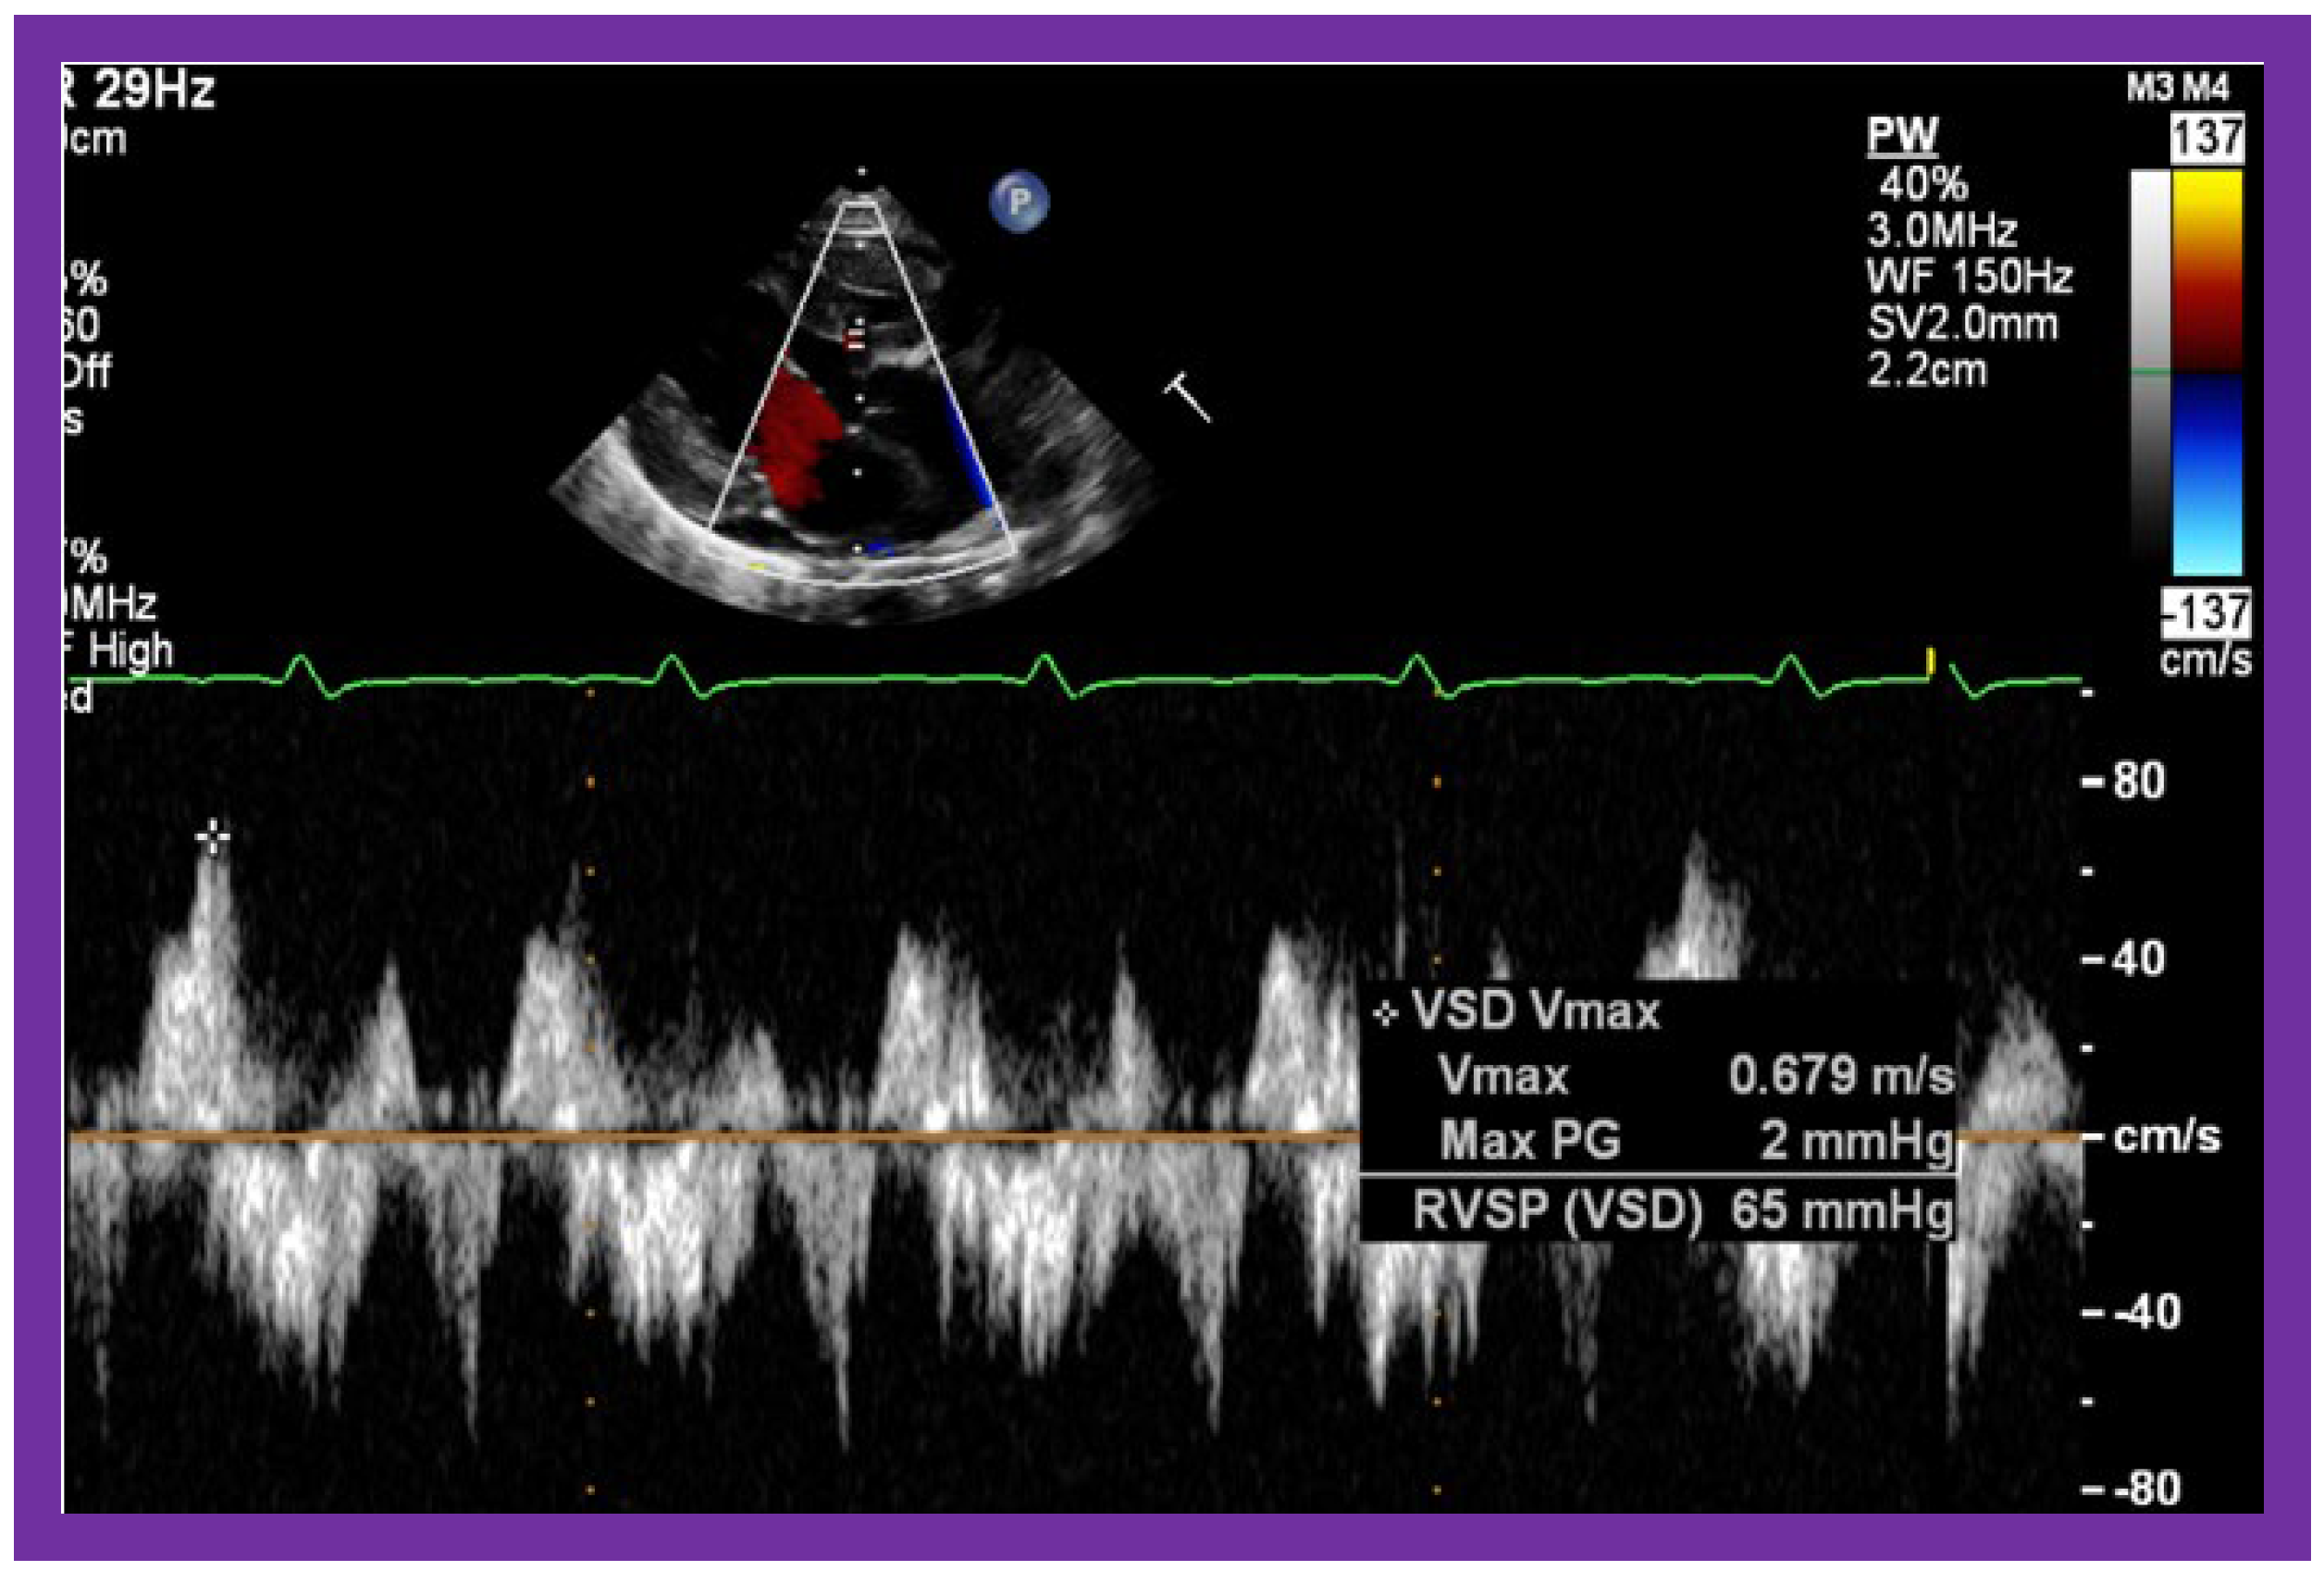
Figure 10.
Selected video frames from parasternal long axis views of a patient with tricuspid atresia with normally related great arteries demonstrating an enlarged left atrium (LA) and left ventricle (LV), a small right ventricle (RV) and a moderate sized defect (VSD) (thick arrow) on 2D (
A) and color flow (
B) imaging. The turbulent flow (
B), with a Doppler flow velocity of 2.91 m/s by continuous wave Doppler (
C) across the VSD, suggests some restriction of the VSD. Ao, Aorta; PA, pulmonary artery. Reproduced from Reference [
29].
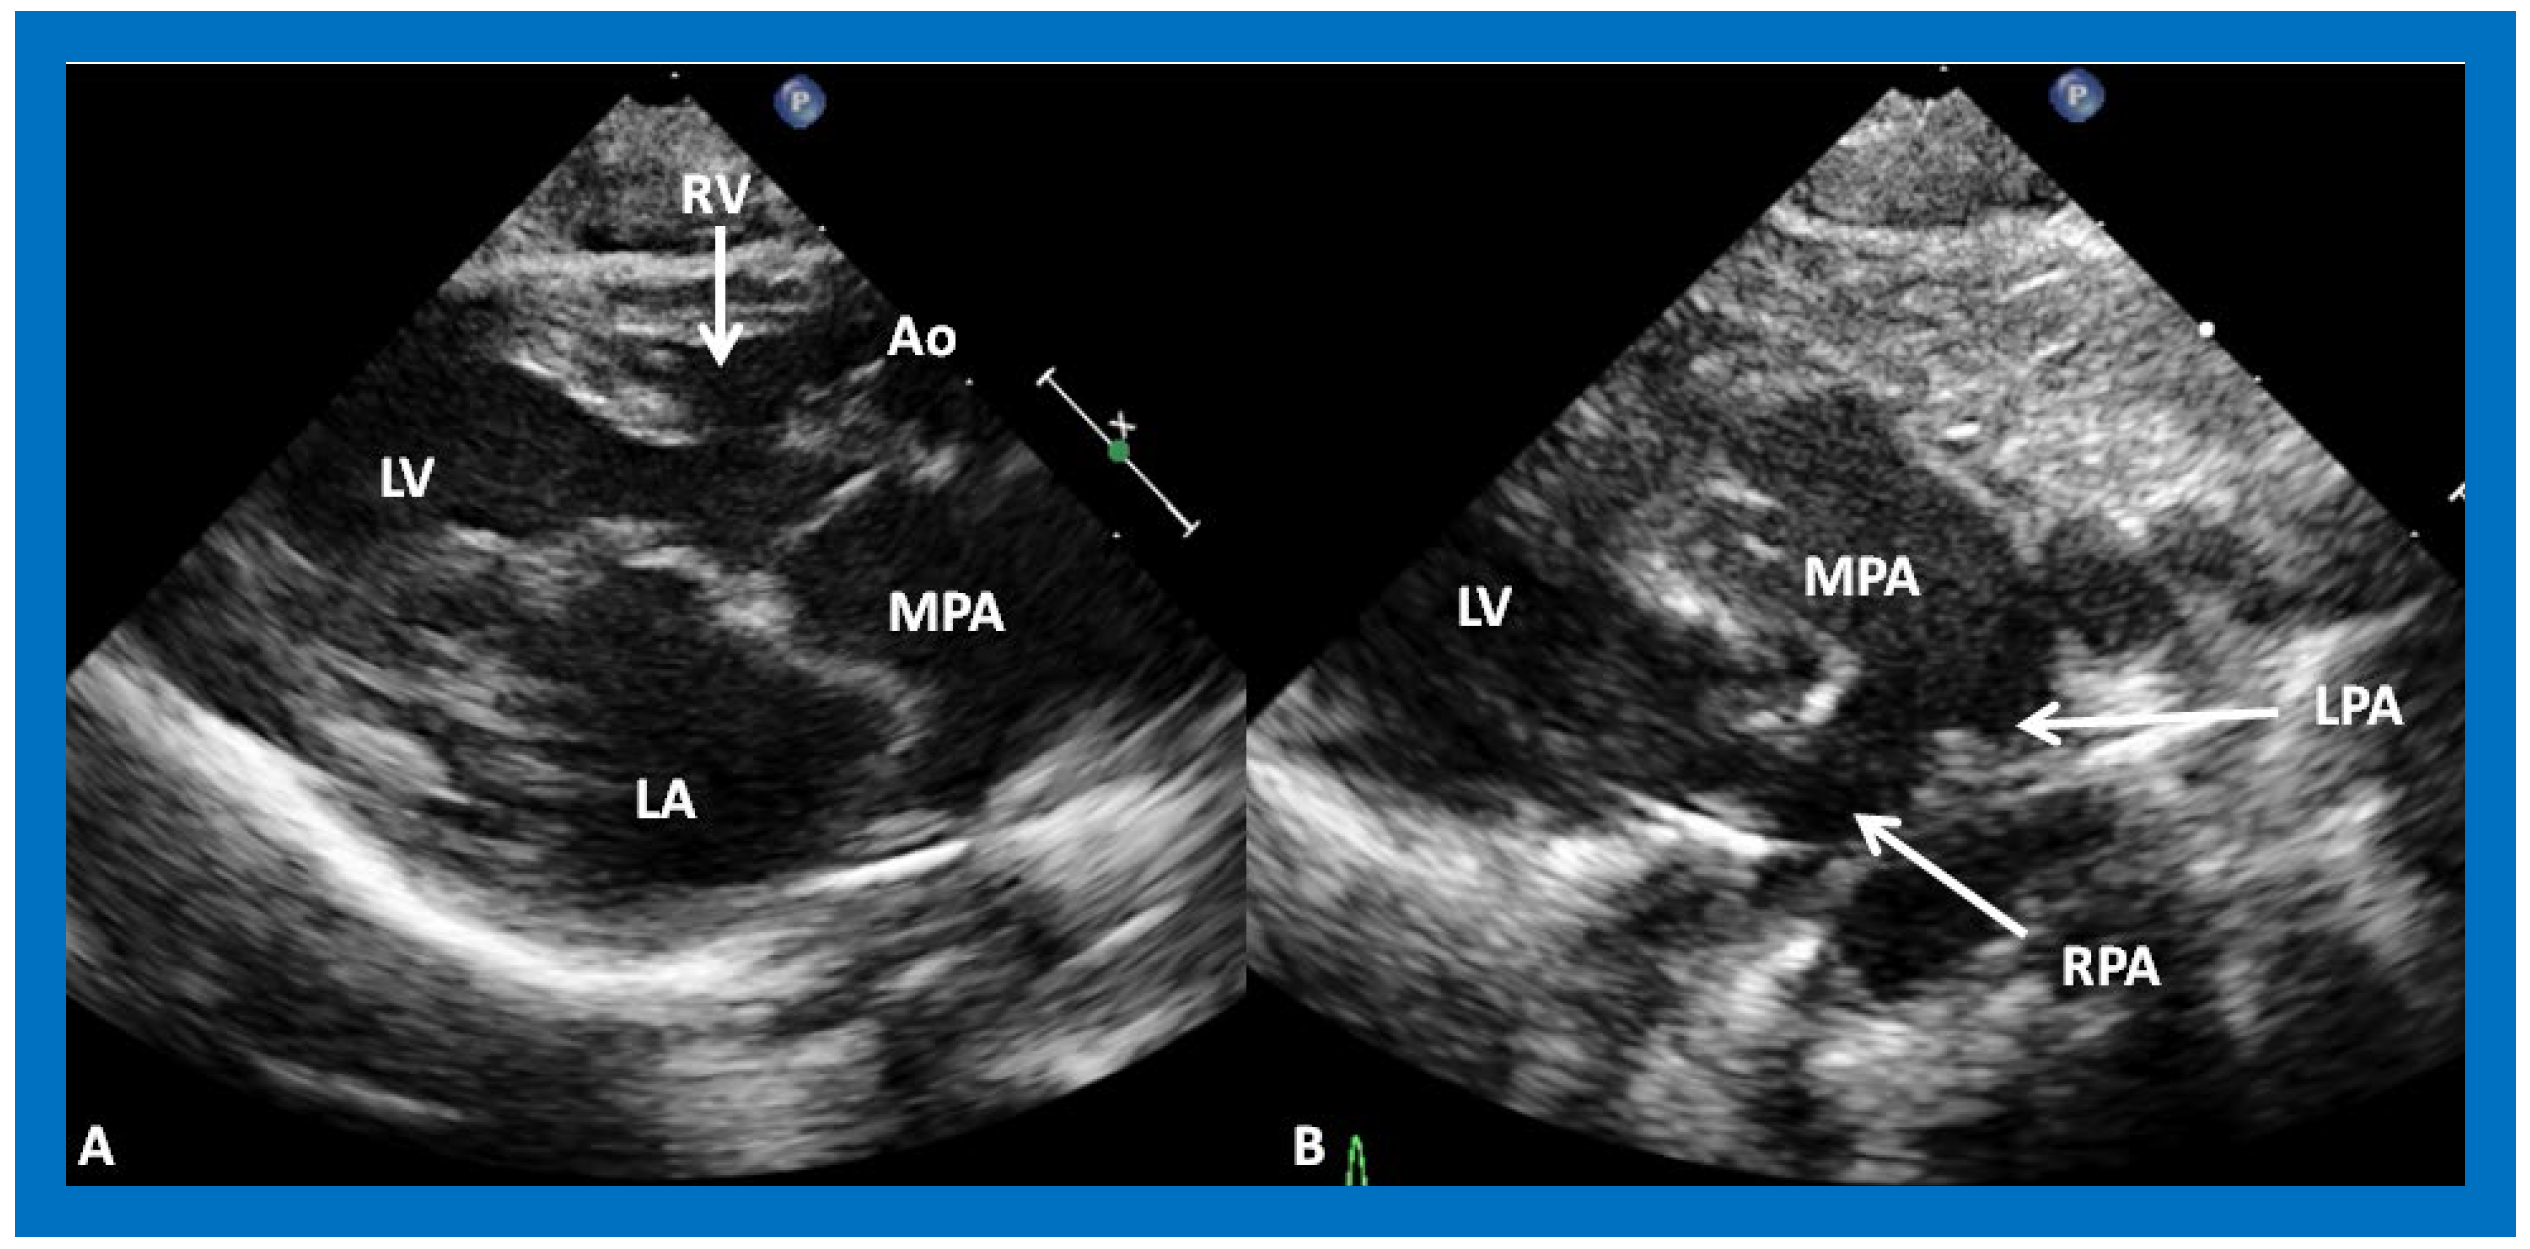
Figure 11.
(
A) A selected video frame from parasternal long axis views of a patient with tricuspid atresia and transposition of the great arteries demonstrating the left atrium (LA), left ventricle (LV), a very small right ventricle (RV) and a moderate sized ventricular septal defect (not marked). The vessel coming off the LV is traced in (
B) and shown to bifurcate into the left (LPA) and right (RPA) pulmonary arteries, confirming that this vessel is the main pulmonary artery (MPA), consistent with transposition of the great arteries. Ao, Aorta. Reproduced from Reference [
29].
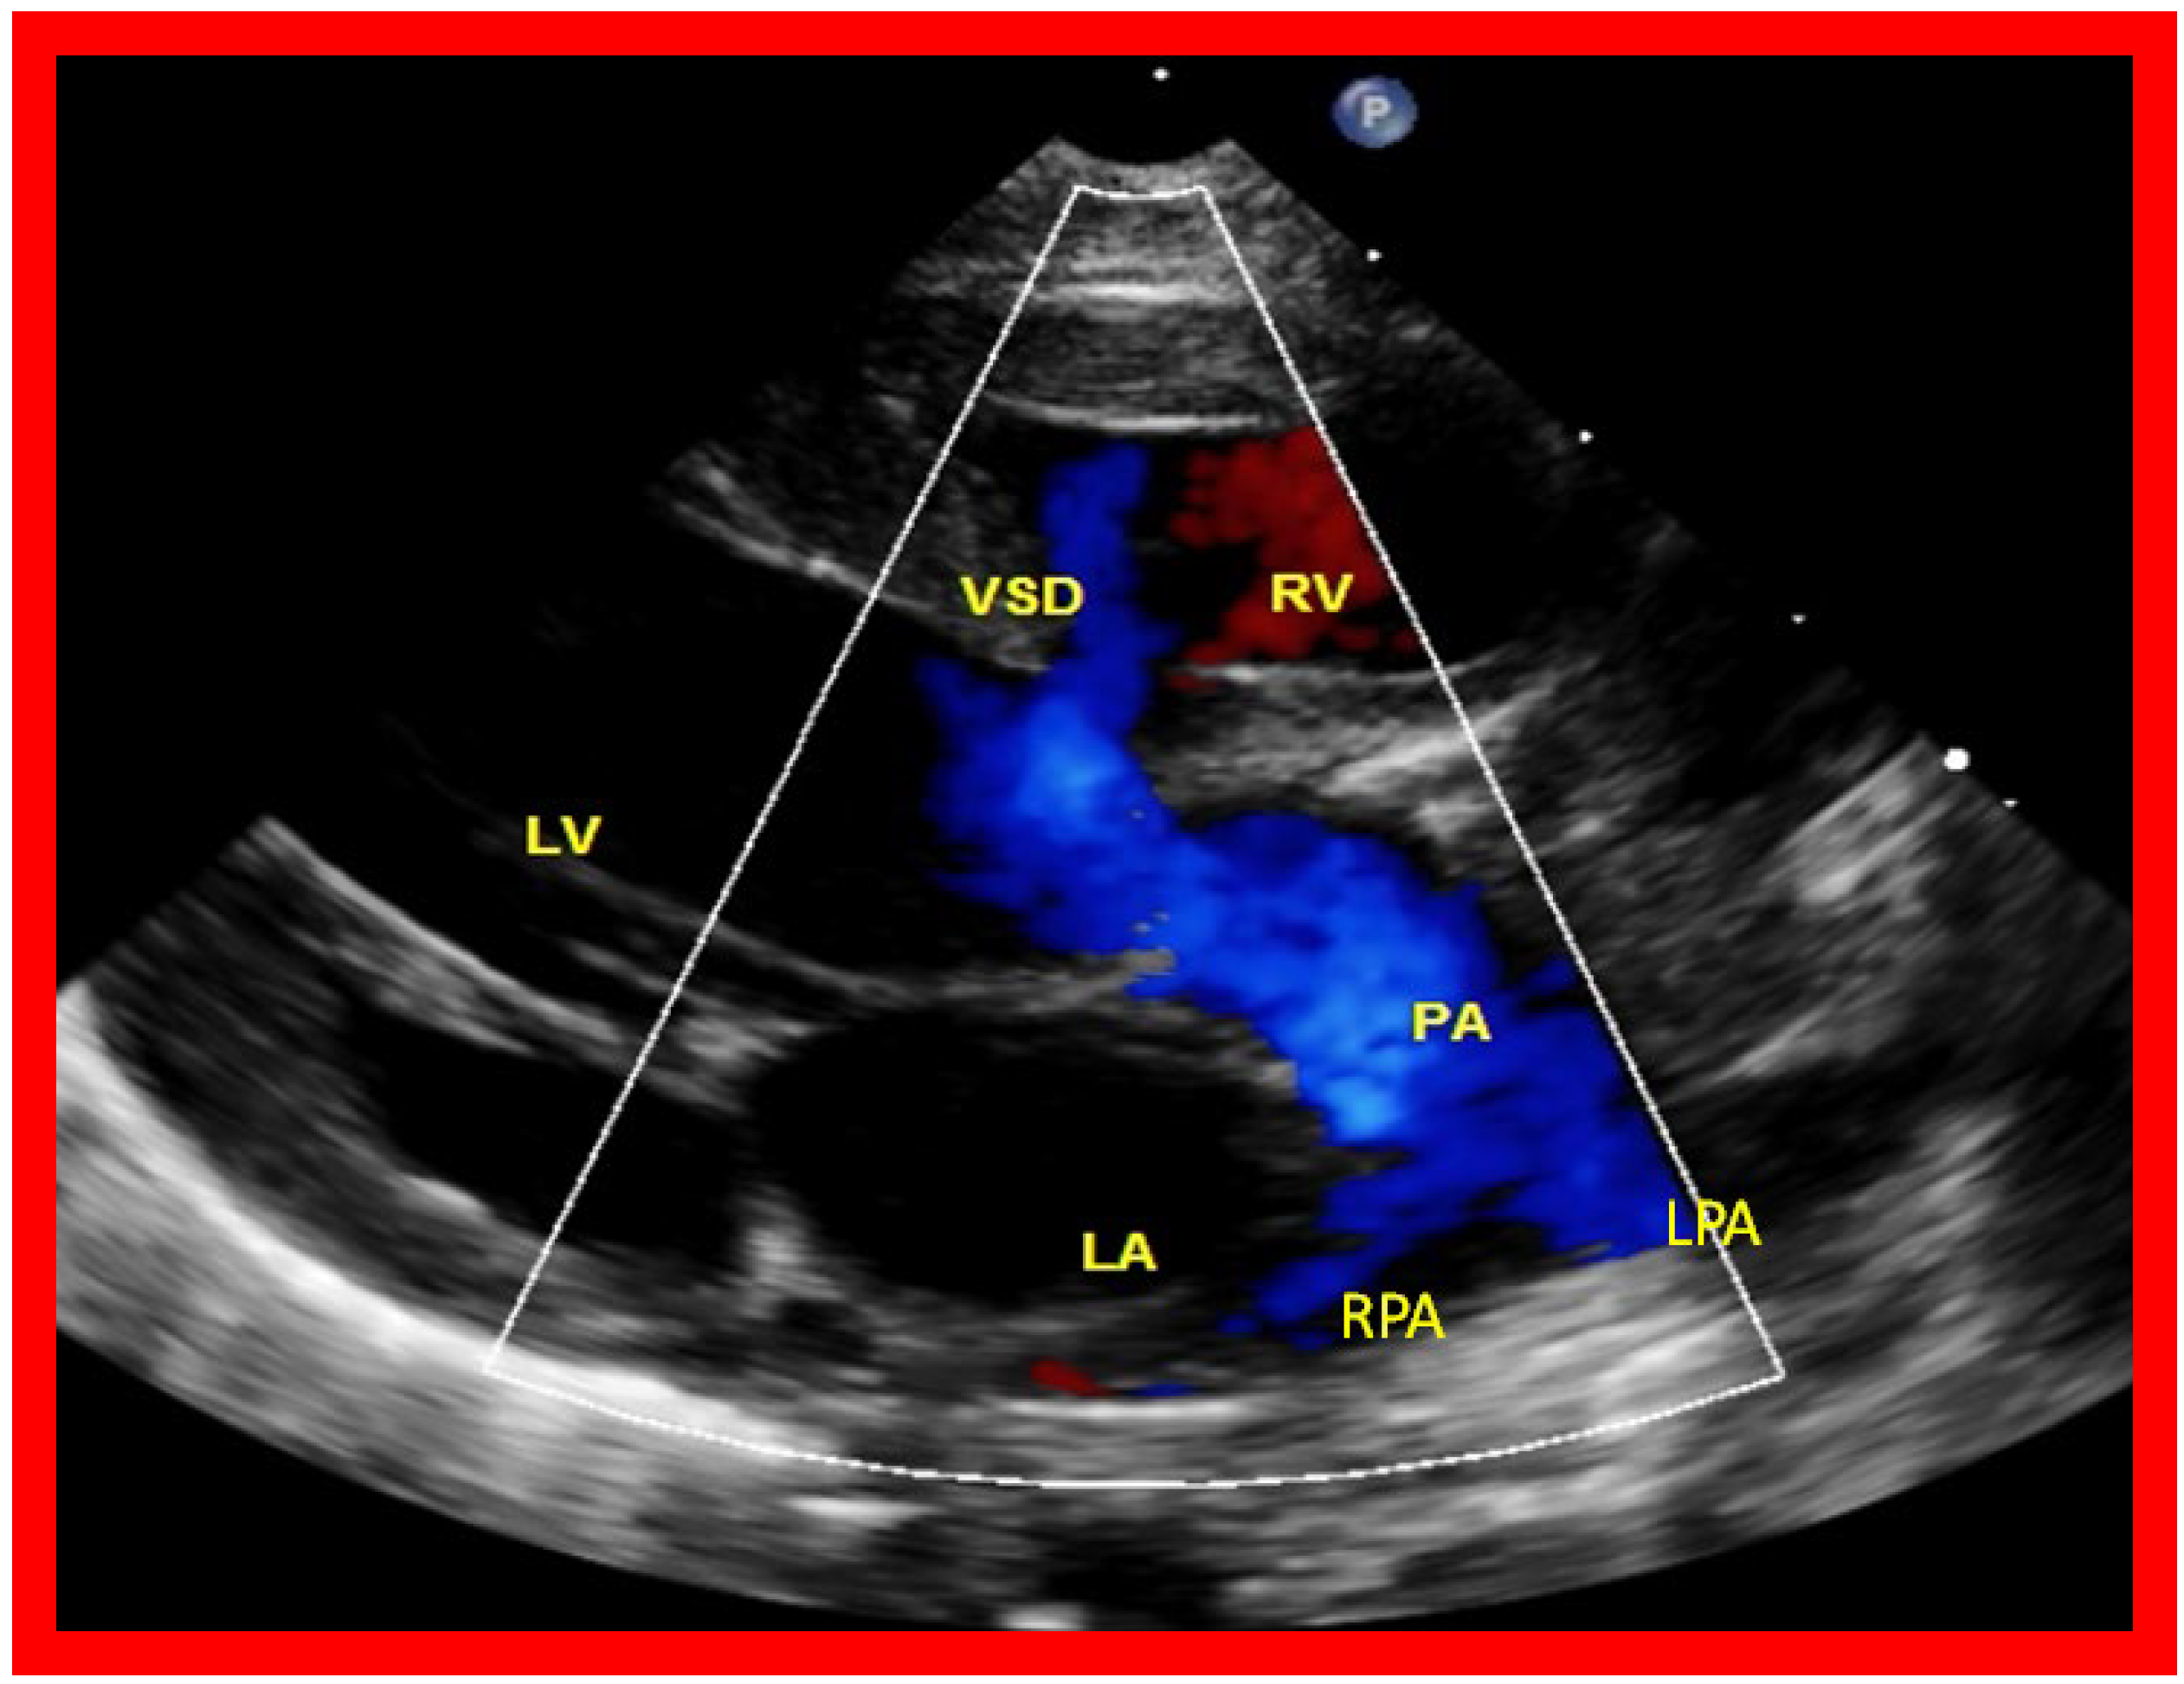
Figure 12.
A selected video frame from a parasternal long axis view with color flow mapping of another patient with tricuspid atresia and transposition of the great arteries demonstrating the left atrium (LA), left ventricle (LV), a small right ventricle (RV) and a moderate sized ventricular septal defect (VSD). The vessel coming off the LV bifurcates into right (RPA) and left (LPA) pulmonary arteries. Reproduced from Reference [
29]. PA, pulmonary artery.
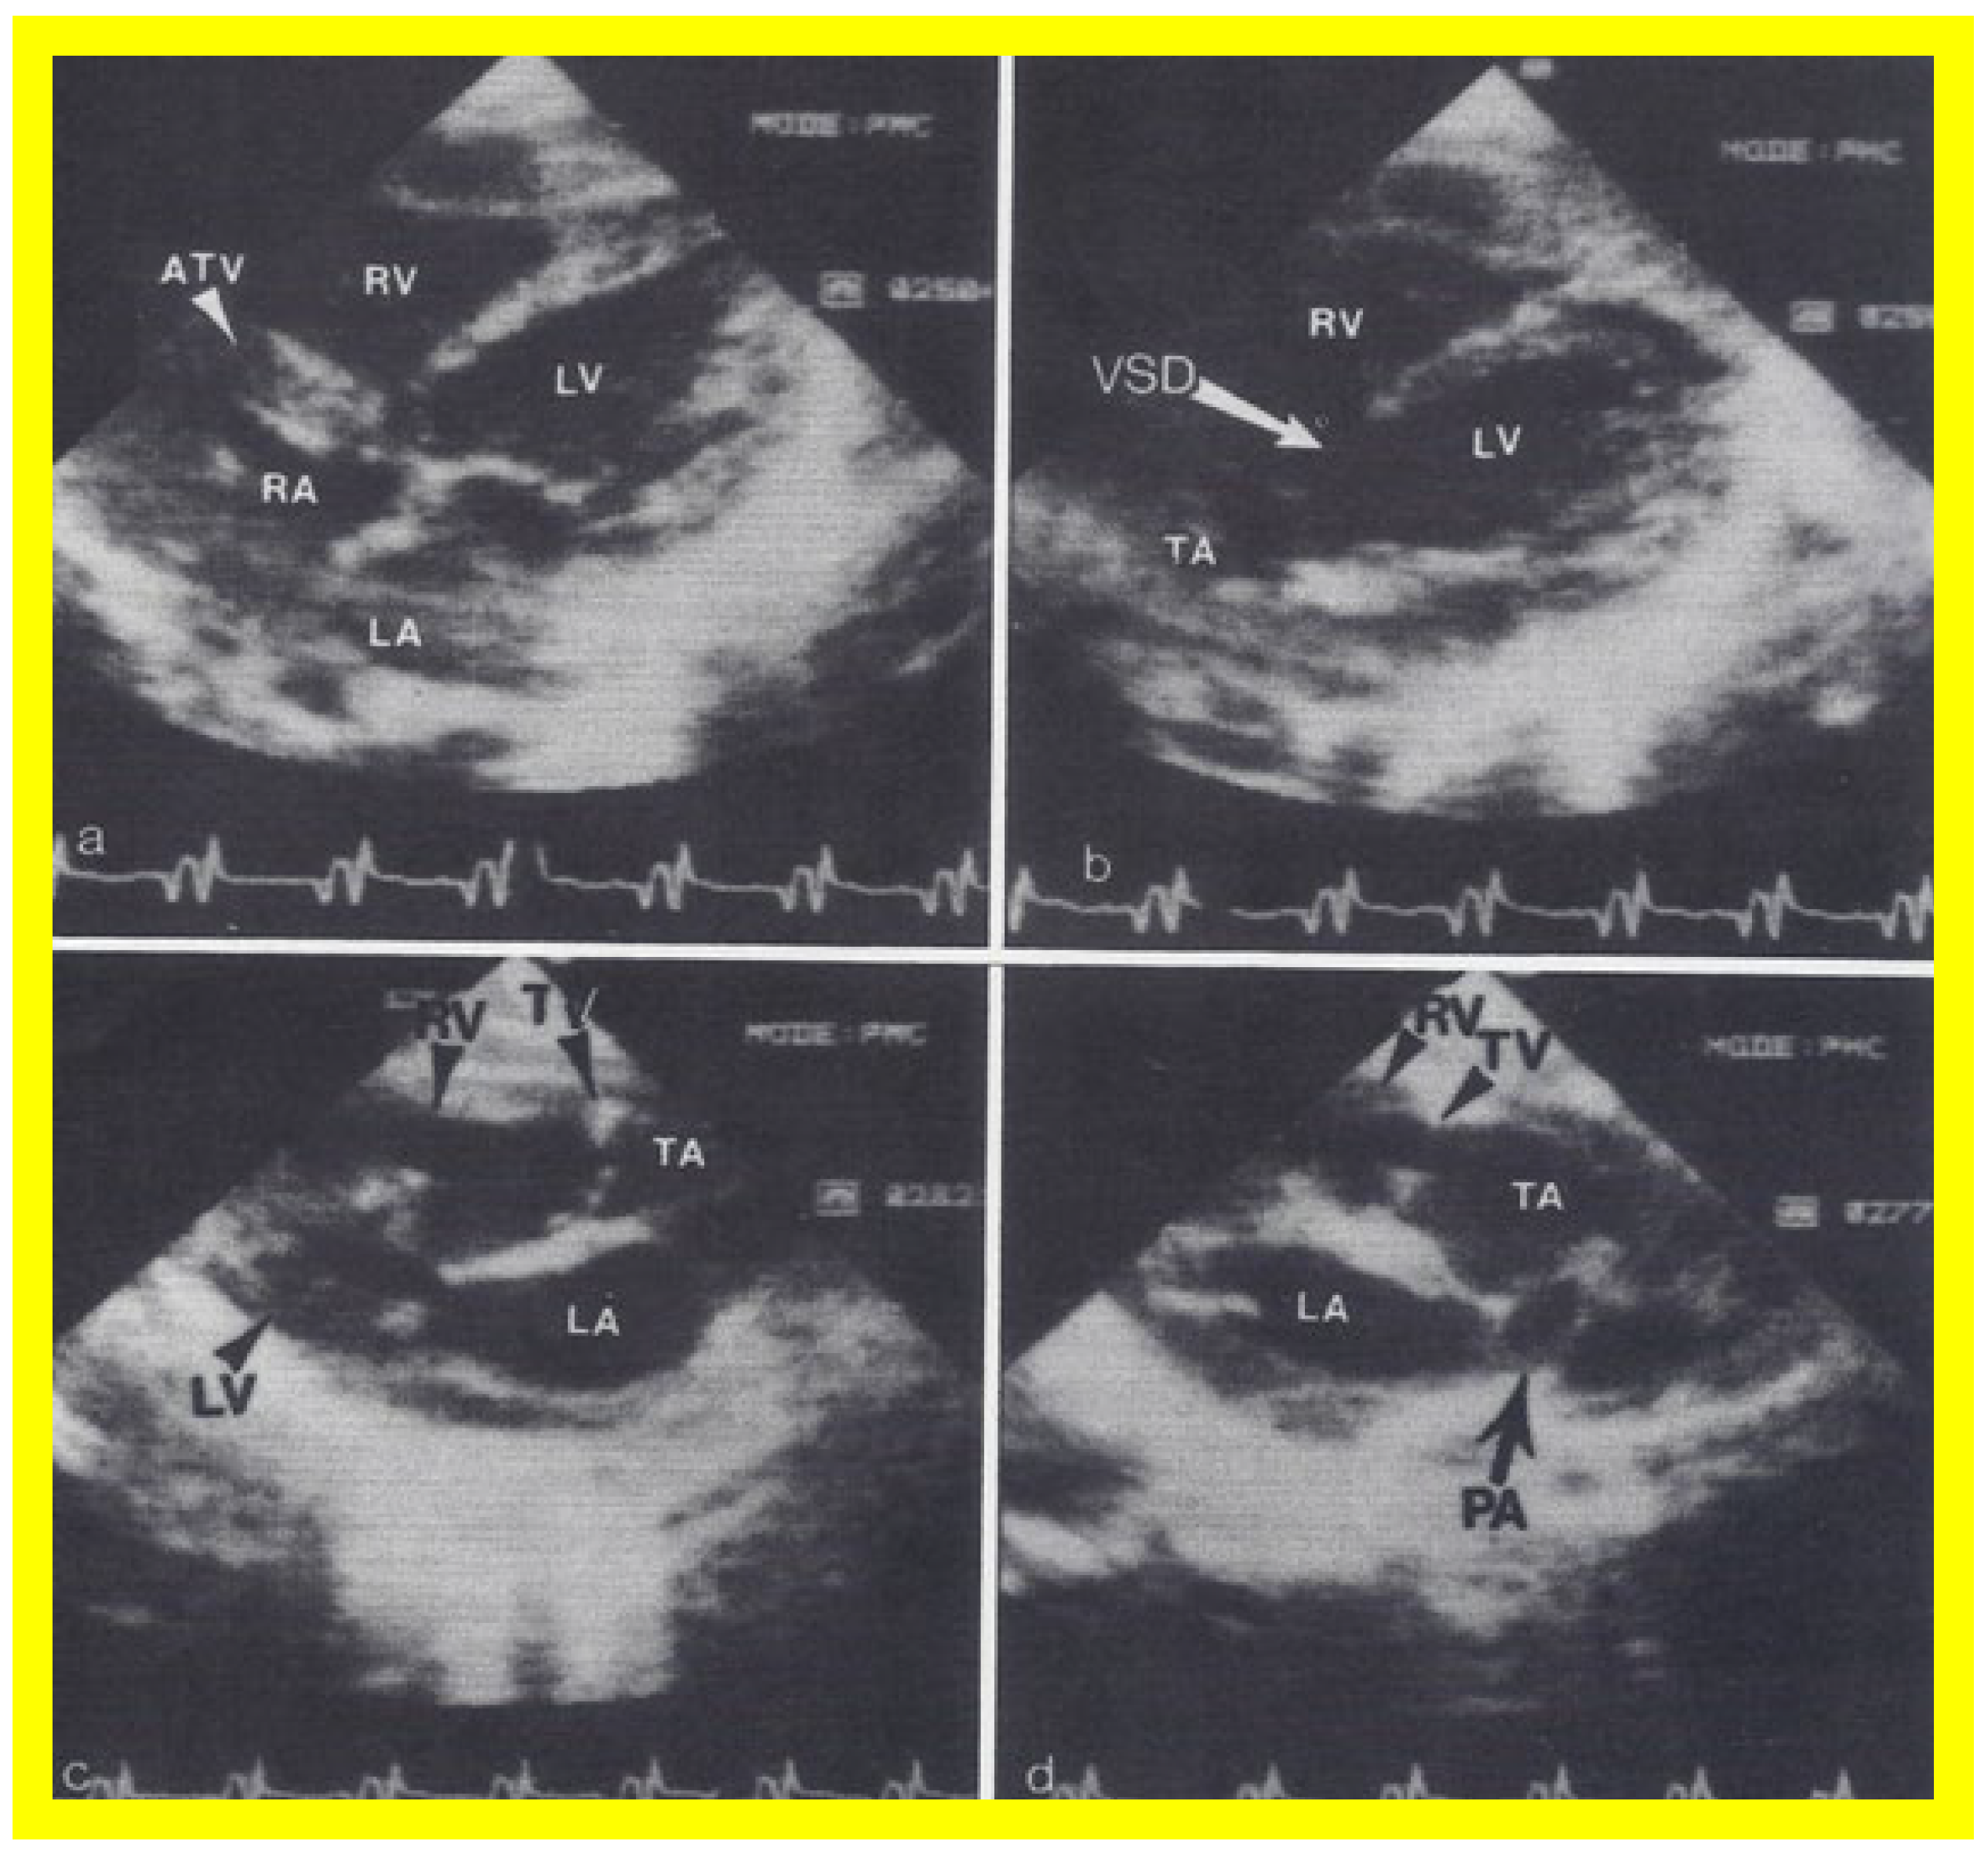
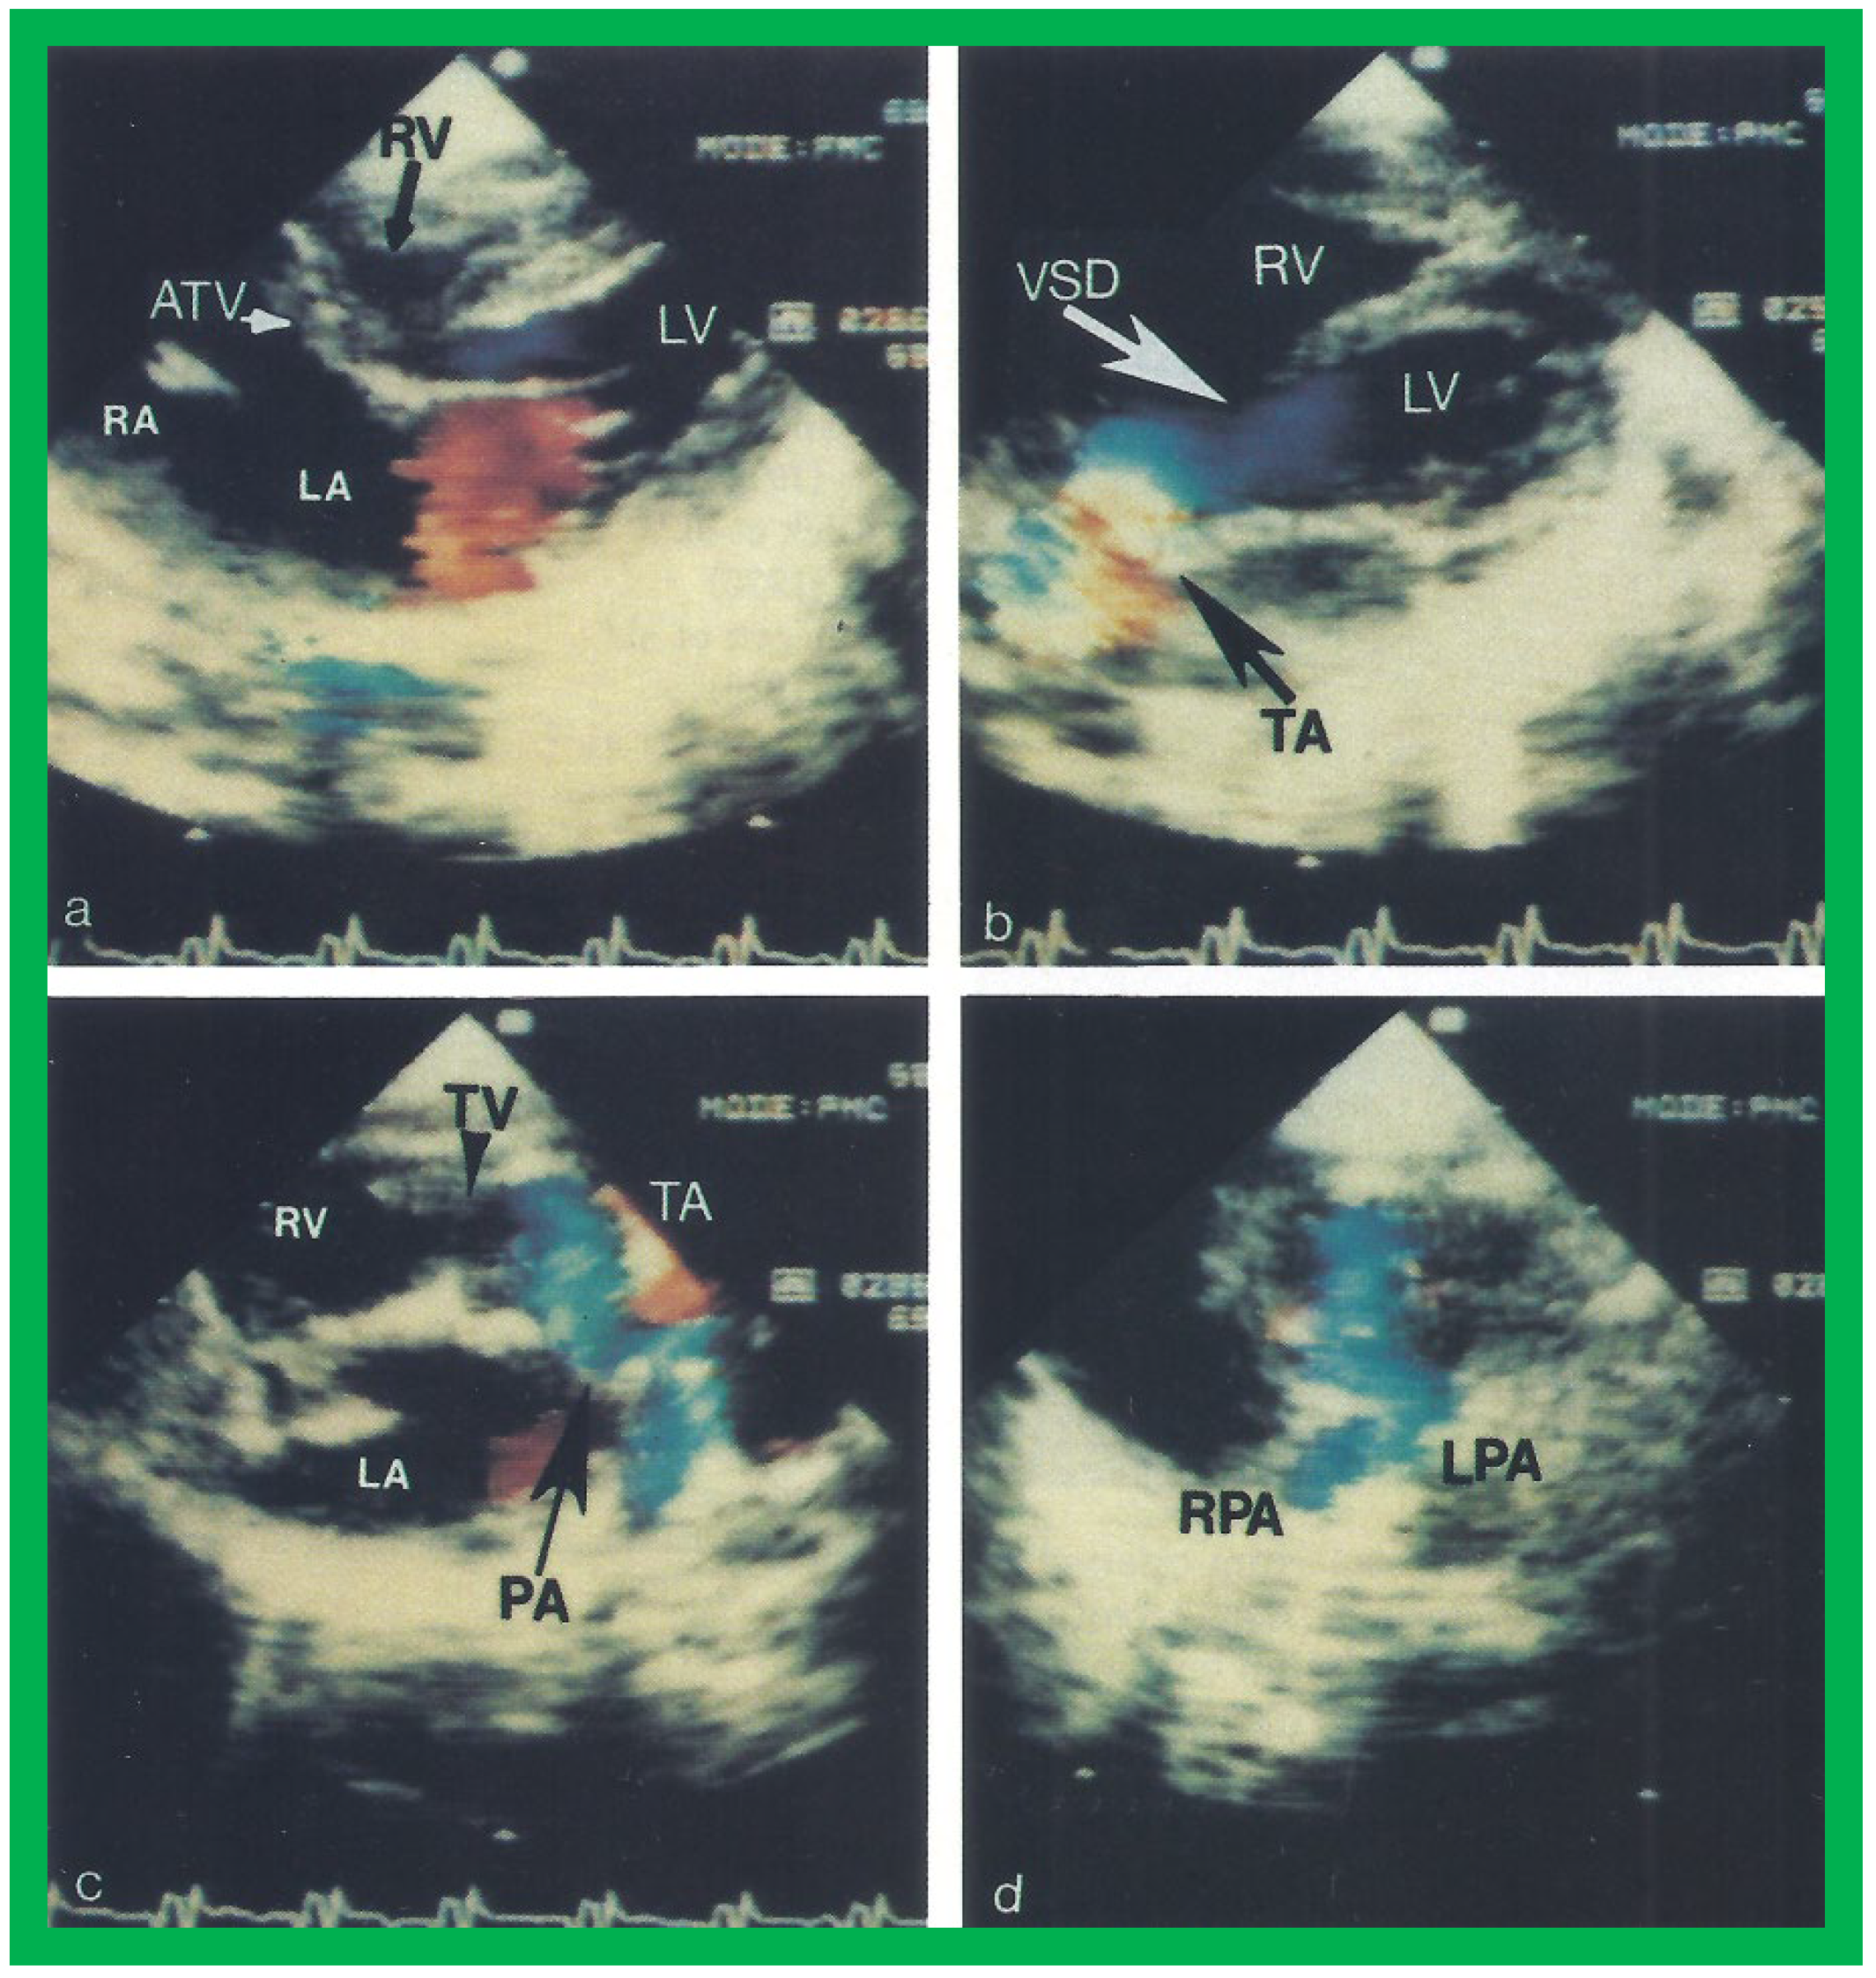
Figure 13.
Two dimensional echocardiographic video frames demonstrating (
a) an atretic tricuspid valve (ATV) between the right atrium (RA) and right ventricle (RV), (
b) a large subtruncal ventricular septal defect (VSD), (
c) thickened and somewhat domed truncal valve (TV) leaflets, and (
d) the origin of the pulmonary artery (PA) from the posterior aspect of the truncus arteriosus (TA). LA, left atrium; LV, left ventricle. Reproduced from Rao PS, et al.
Am Heart J 1991;122:829–835 [
31].
Figure 14.
Video frames from a two dimensional echocardiographic and color Doppler study demonstrating (
a) an atretic tricuspid valve (ATV) between the right atrium (RA) and right ventricle (RV), and blood flow from the left atrium (LA) into the left ventricle (LV) across the mitral valve. The RV (arrow) is very small and hypoplastic. (
b) LV and RV with a large ventricular septal defect (VSD) below the truncus arteriosus (TA). Turbulent flow across the truncal valve suggests truncal valve stenosis. (
c) The origin of the pulmonary artery (PA) from the TA by color flow (arrow), and (
d) the division into right (RPA) and left (LPA) pulmonary arteries from the PA in a short-axis view. TV, truncal valve leaflets. Reproduced from Rao PS, et al.
Am Heart J 1991;122:829–835 [
31].
Figure 15.
Selected video frame of continuous wave Doppler across the ventricular septal defect of the same patient, as is shown in
Figure 11. The low velocity flow across the ventricular septal defect suggests that the defect is nonobstructive. Reproduced from Reference [
29].
Figure 15.
Selected video frame of continuous wave Doppler across the ventricular septal defect of the same patient, as is shown in
Figure 11. The low velocity flow across the ventricular septal defect suggests that the defect is nonobstructive. Reproduced from Reference [
29].
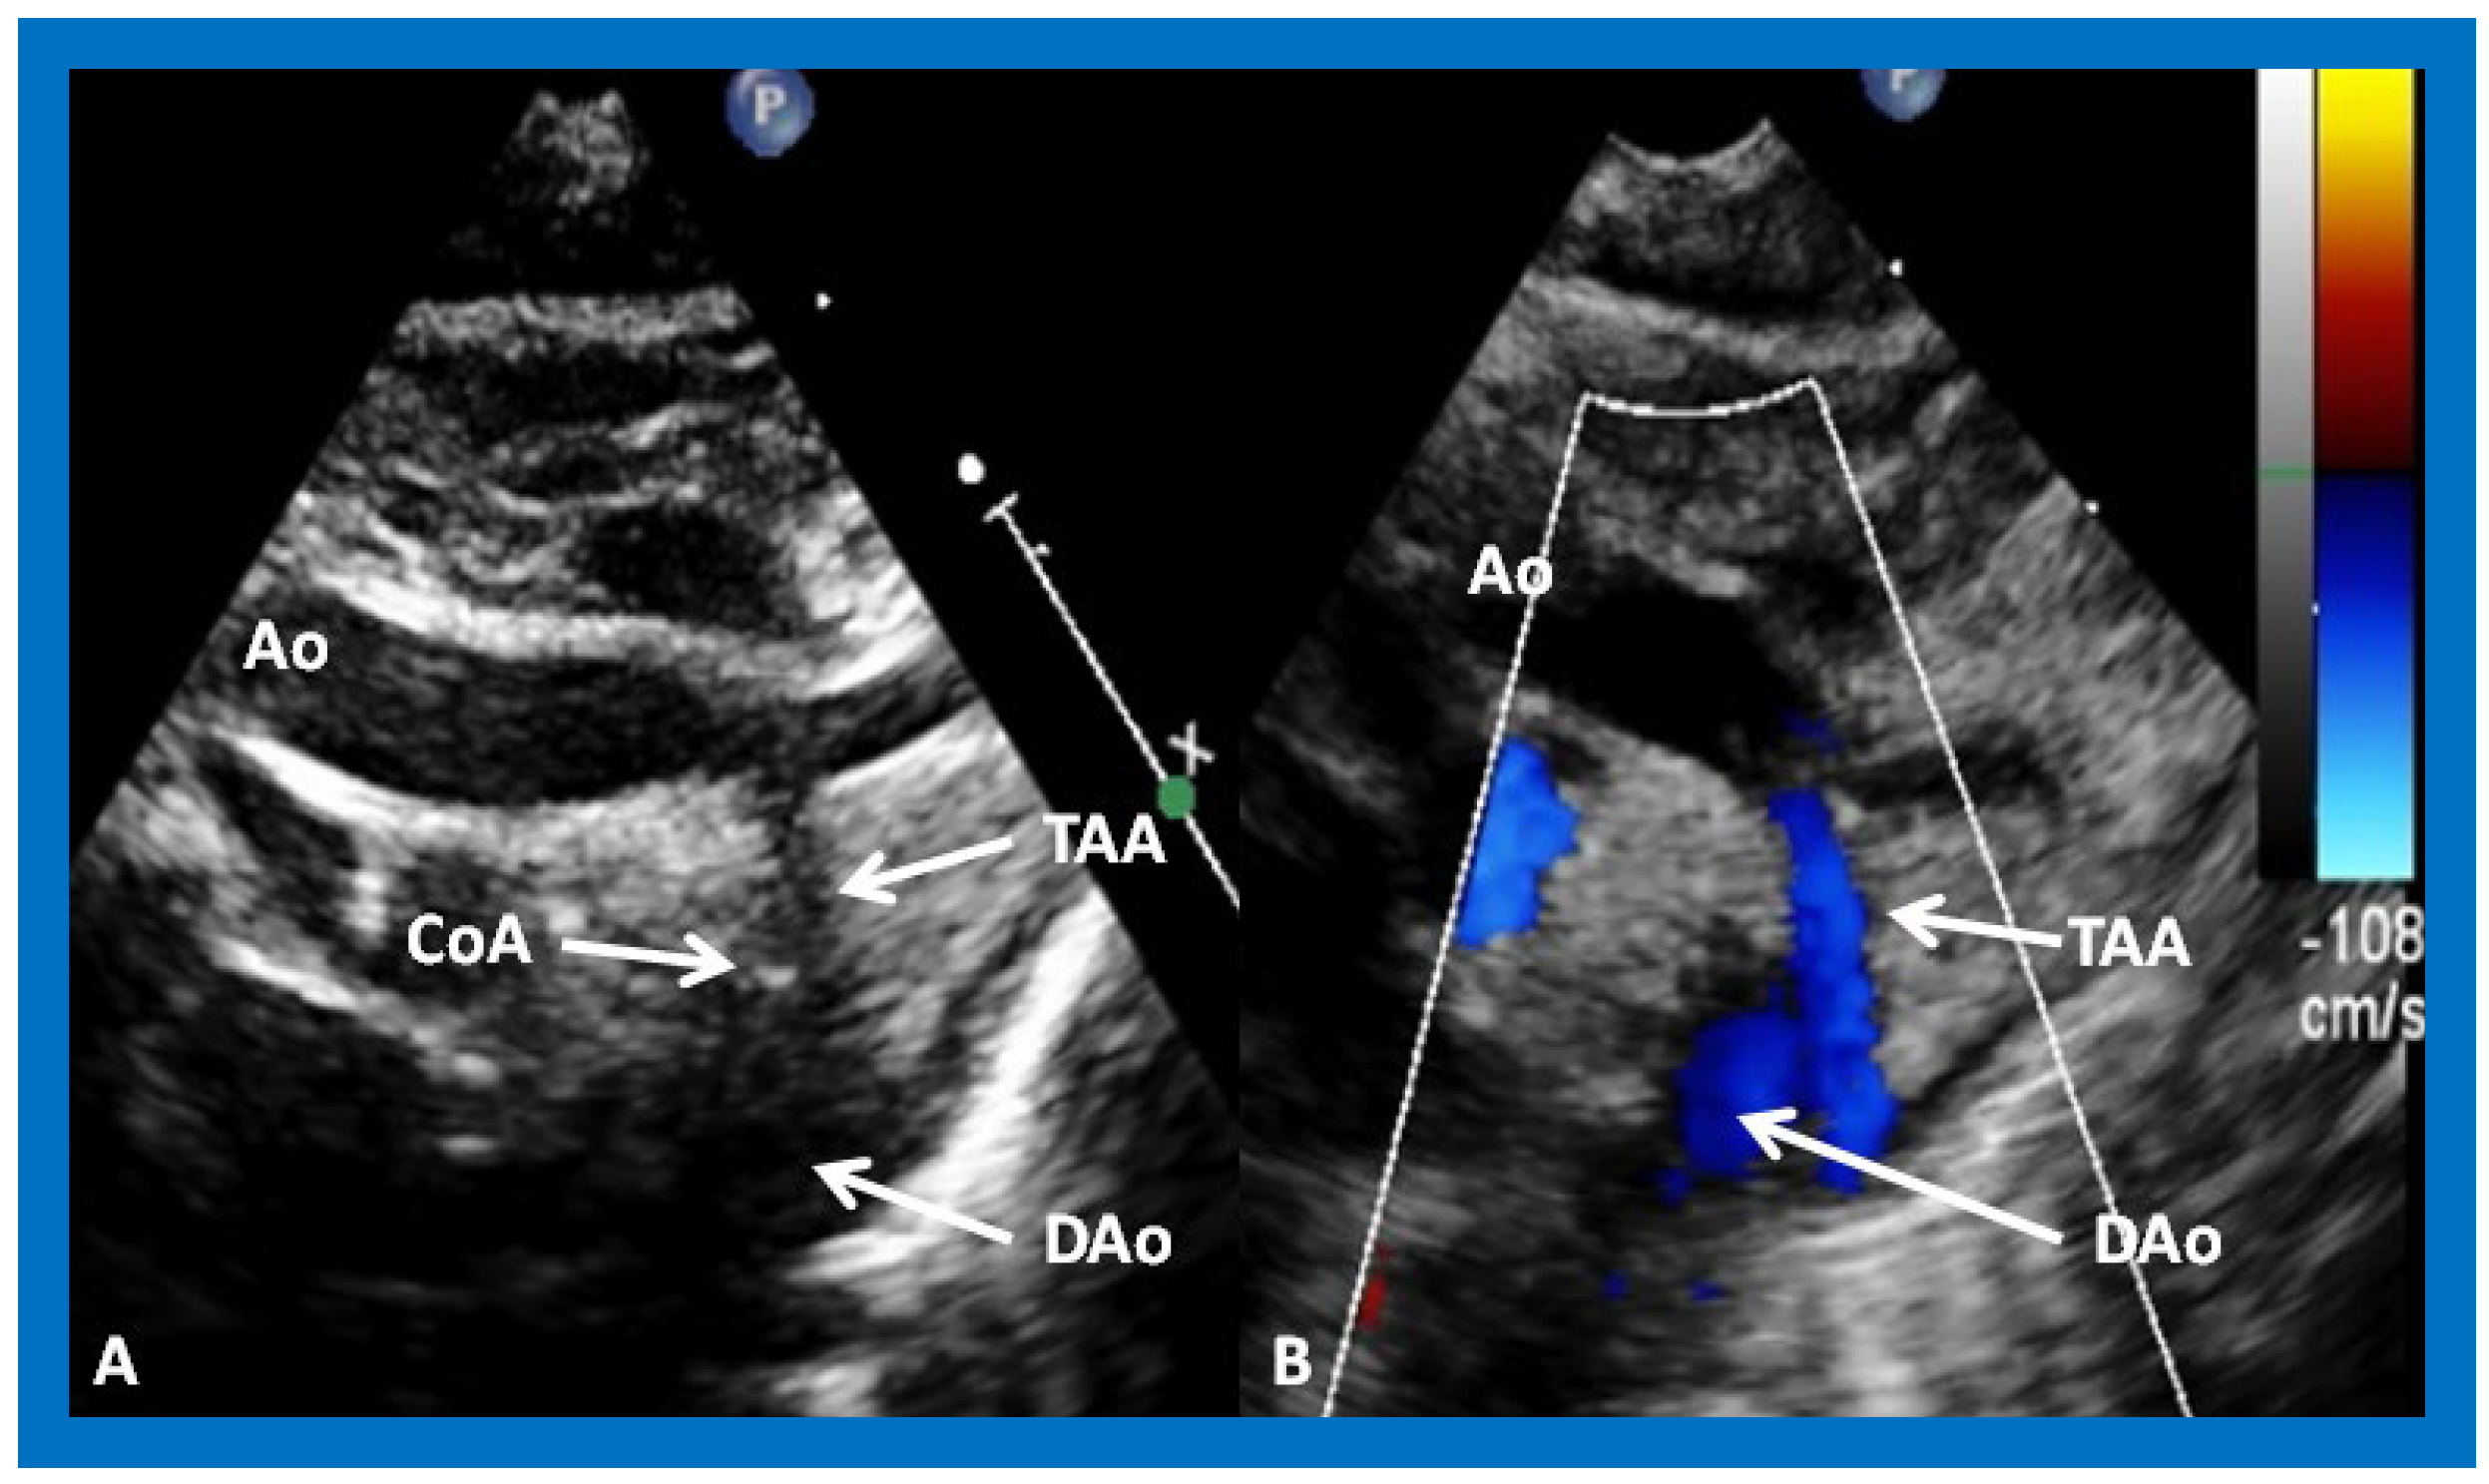
Figure 16.
Selected video frames from suprasternal notch views of the aortic (Ao) arch in 2D (
A) and color flow (
B) images of a neonate with tricuspid atresia and transposition of the great arteries, demonstrating coarctation of the aorta (CoA) and a hypoplastic transverse aortic arch (TAA) and isthmus. The association of CoA with tricuspid atresia, plus transposition of the great arteries, is well known. DAo, descending aorta. Reproduced from Reference [
29].
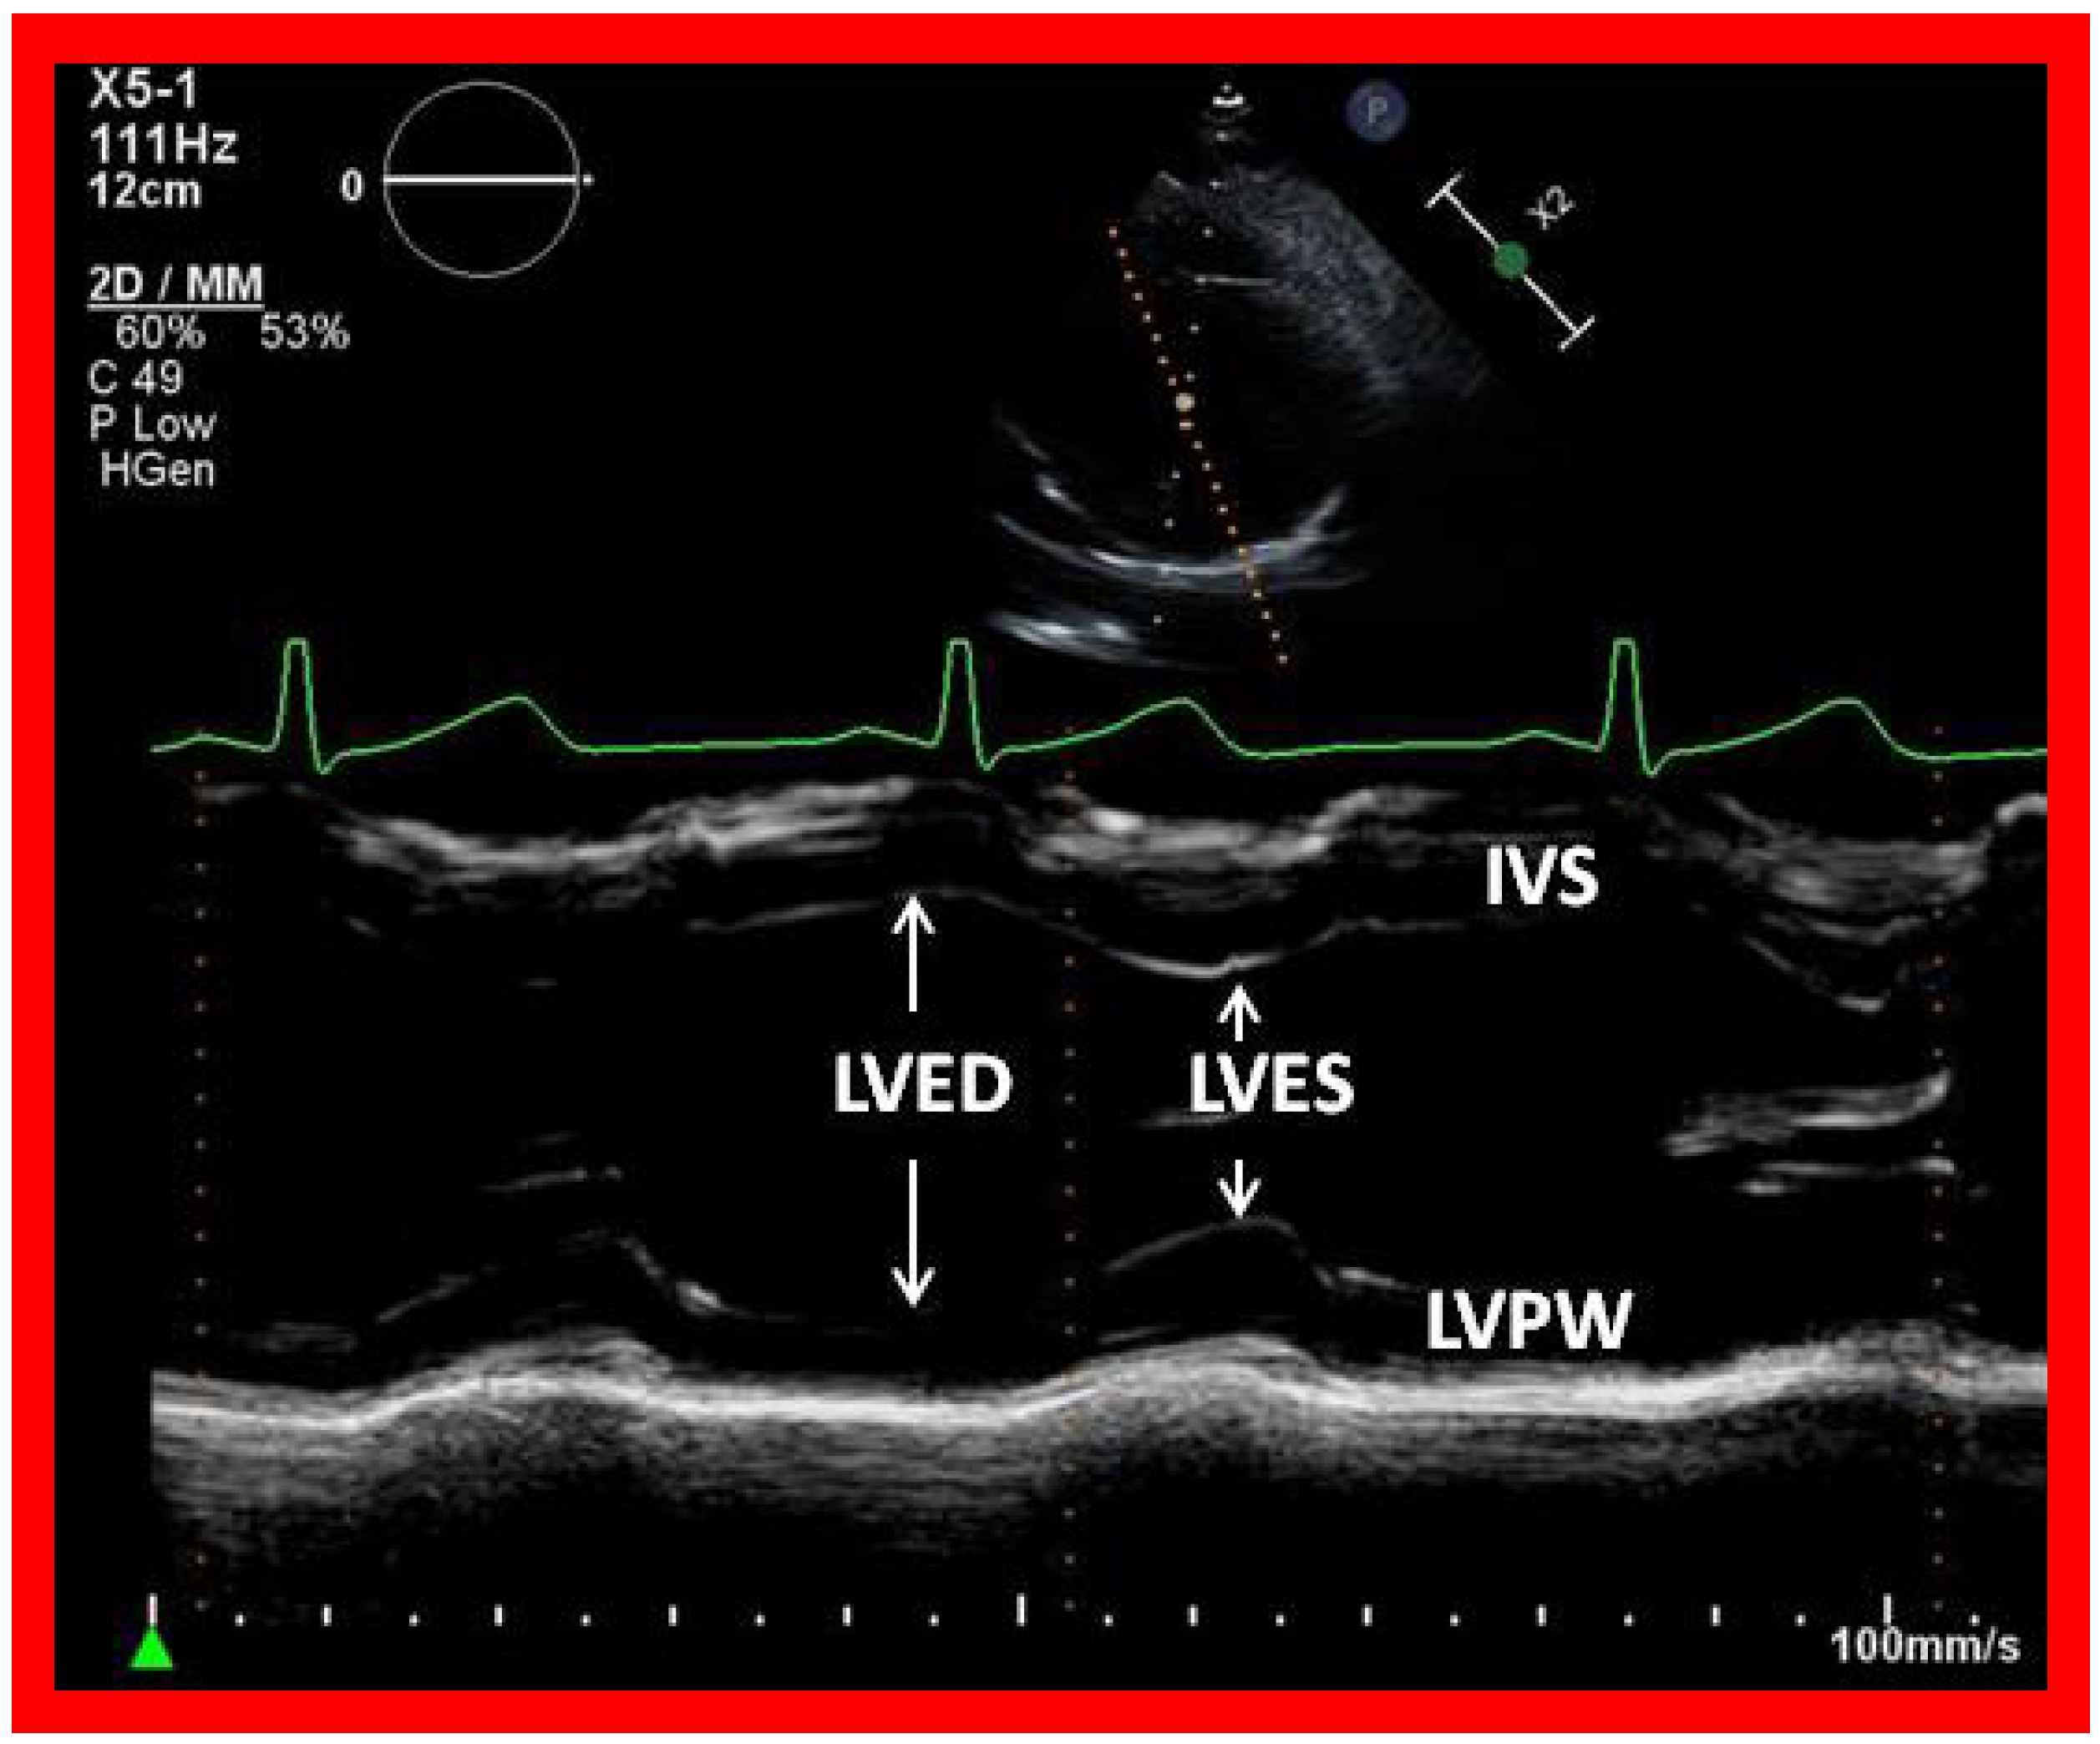
Figure 17.
Selected video frame showing left ventricle in end diastole (LVED) and in end systole (LVES) demonstrating normal function. IVS, interventricular septum; LVPW, left ventricular posterior wall.
Figure 17.
Selected video frame showing left ventricle in end diastole (LVED) and in end systole (LVES) demonstrating normal function. IVS, interventricular septum; LVPW, left ventricular posterior wall.
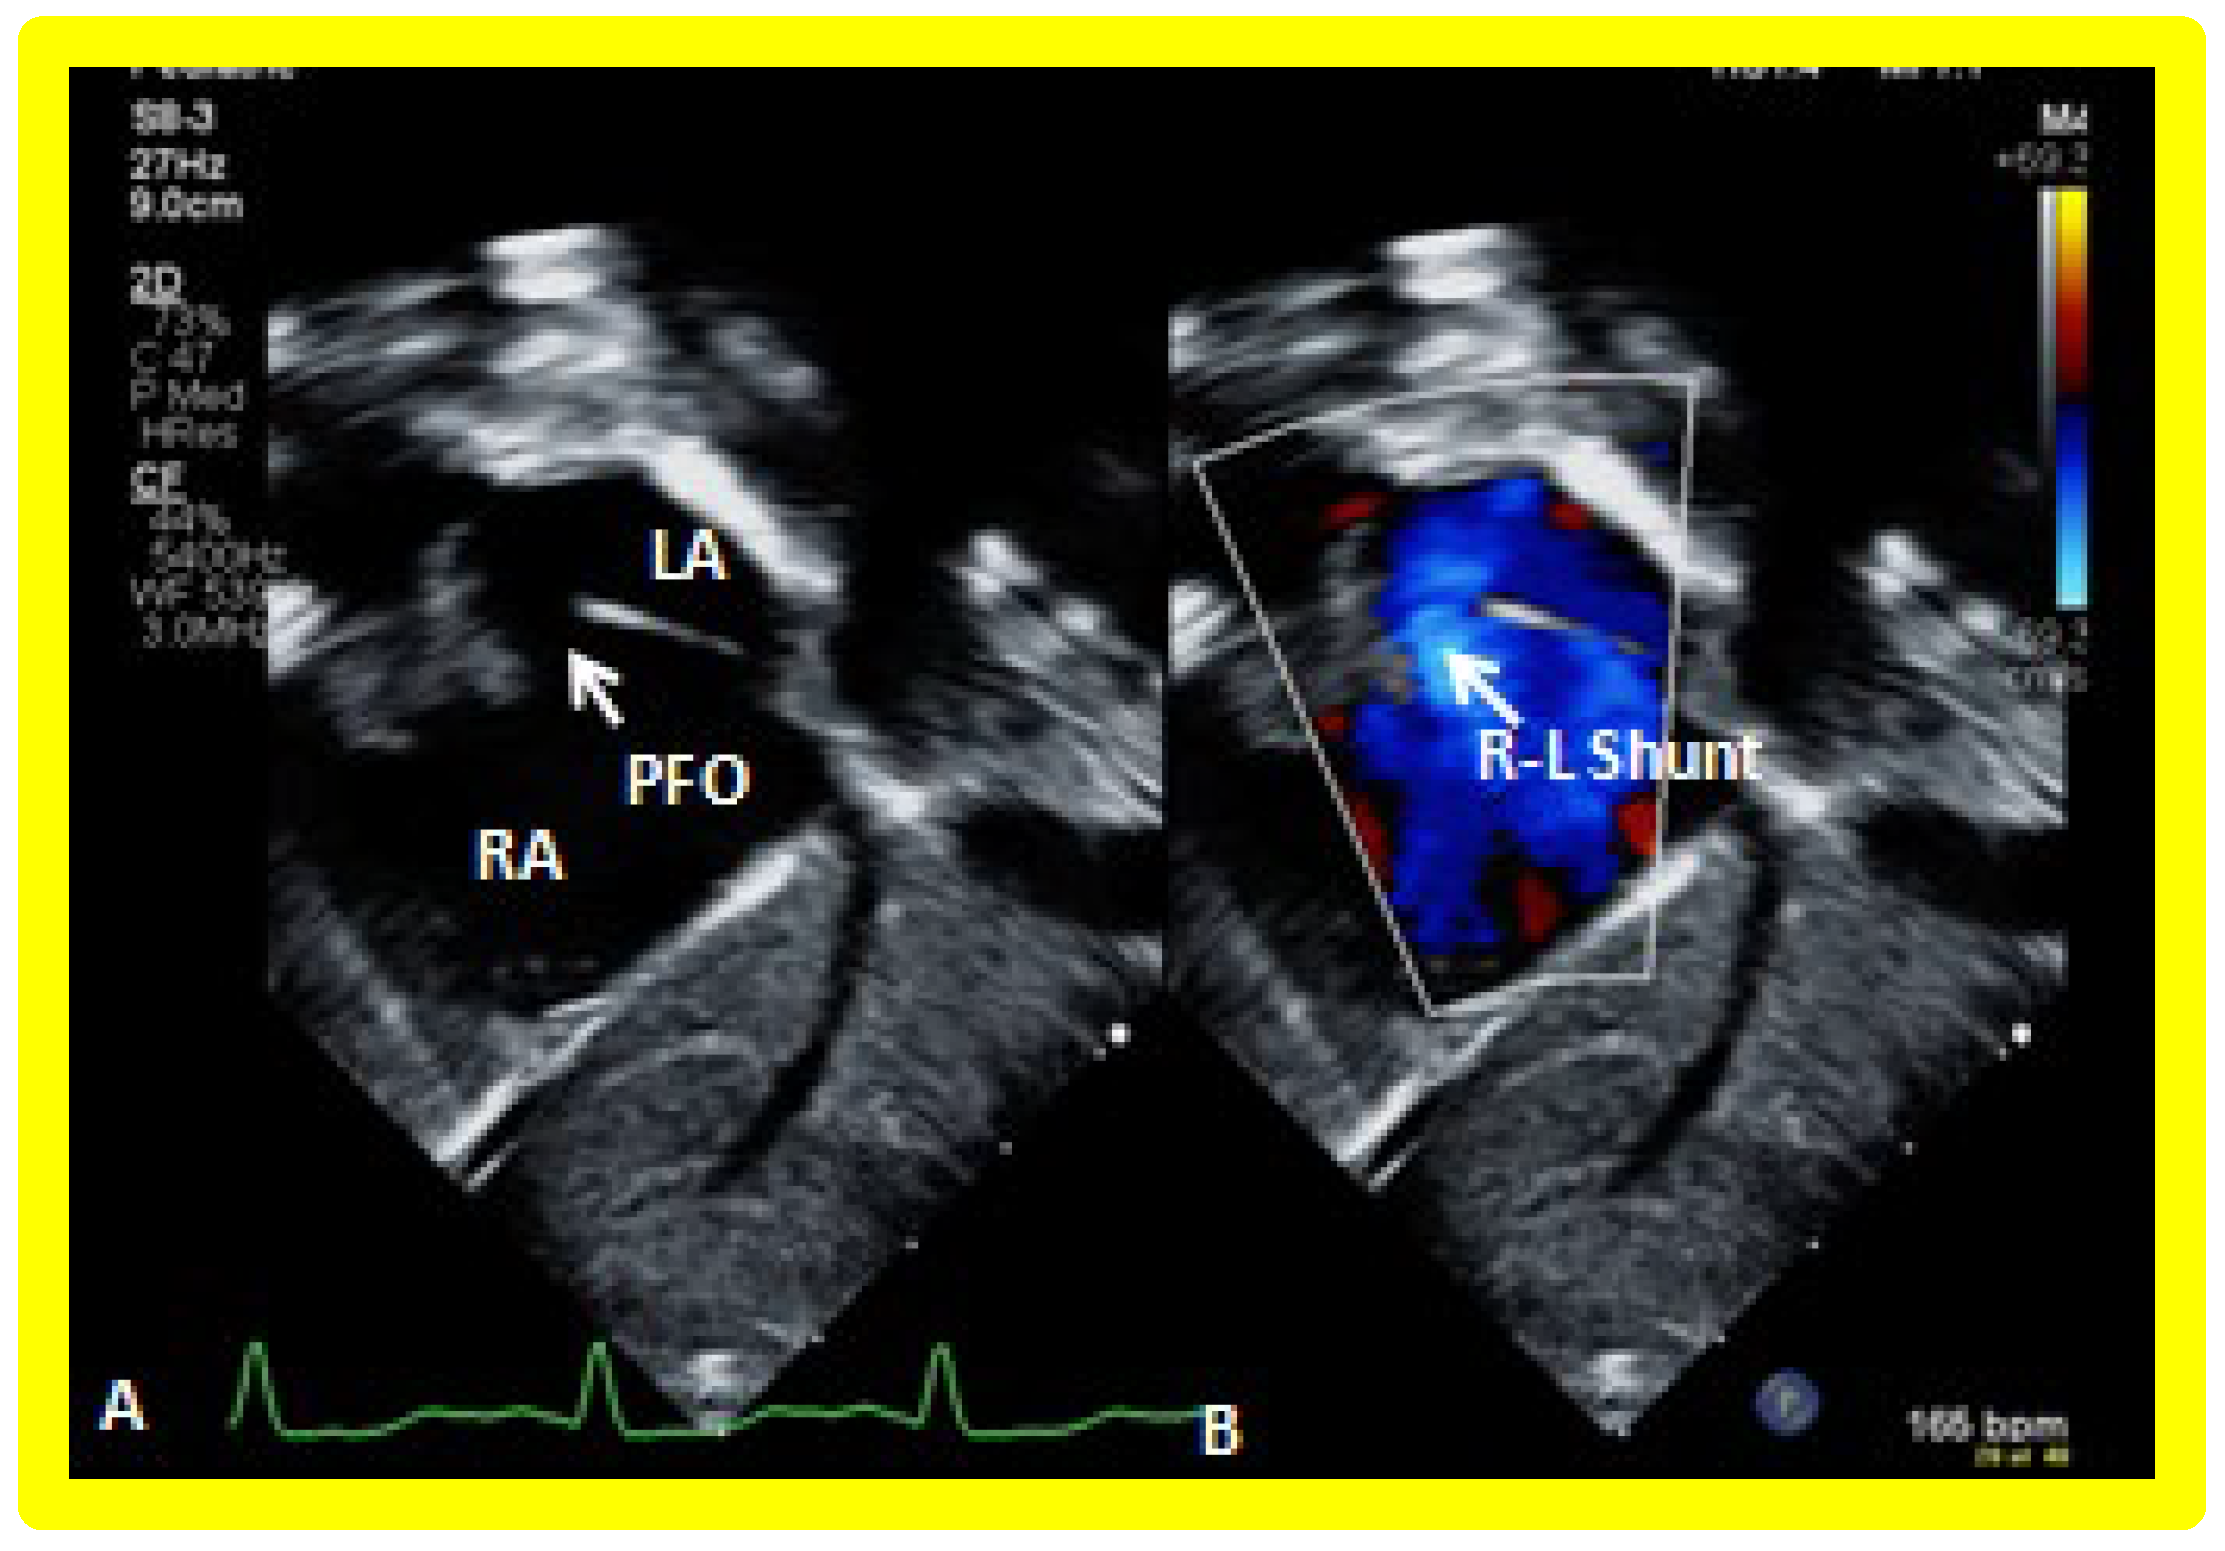
Figure 18.
Selected video frames from a subcostal echocardiographic study demonstrating patent foramen ovale (PFO) (arrow in (A)) with right to left shunt (R-L Shunt) across the PFO (arrow in (B)). Note laminar flow across the PFO in B. LA, left atrium, RA, right atrium.
Figure 18.
Selected video frames from a subcostal echocardiographic study demonstrating patent foramen ovale (PFO) (arrow in (A)) with right to left shunt (R-L Shunt) across the PFO (arrow in (B)). Note laminar flow across the PFO in B. LA, left atrium, RA, right atrium.
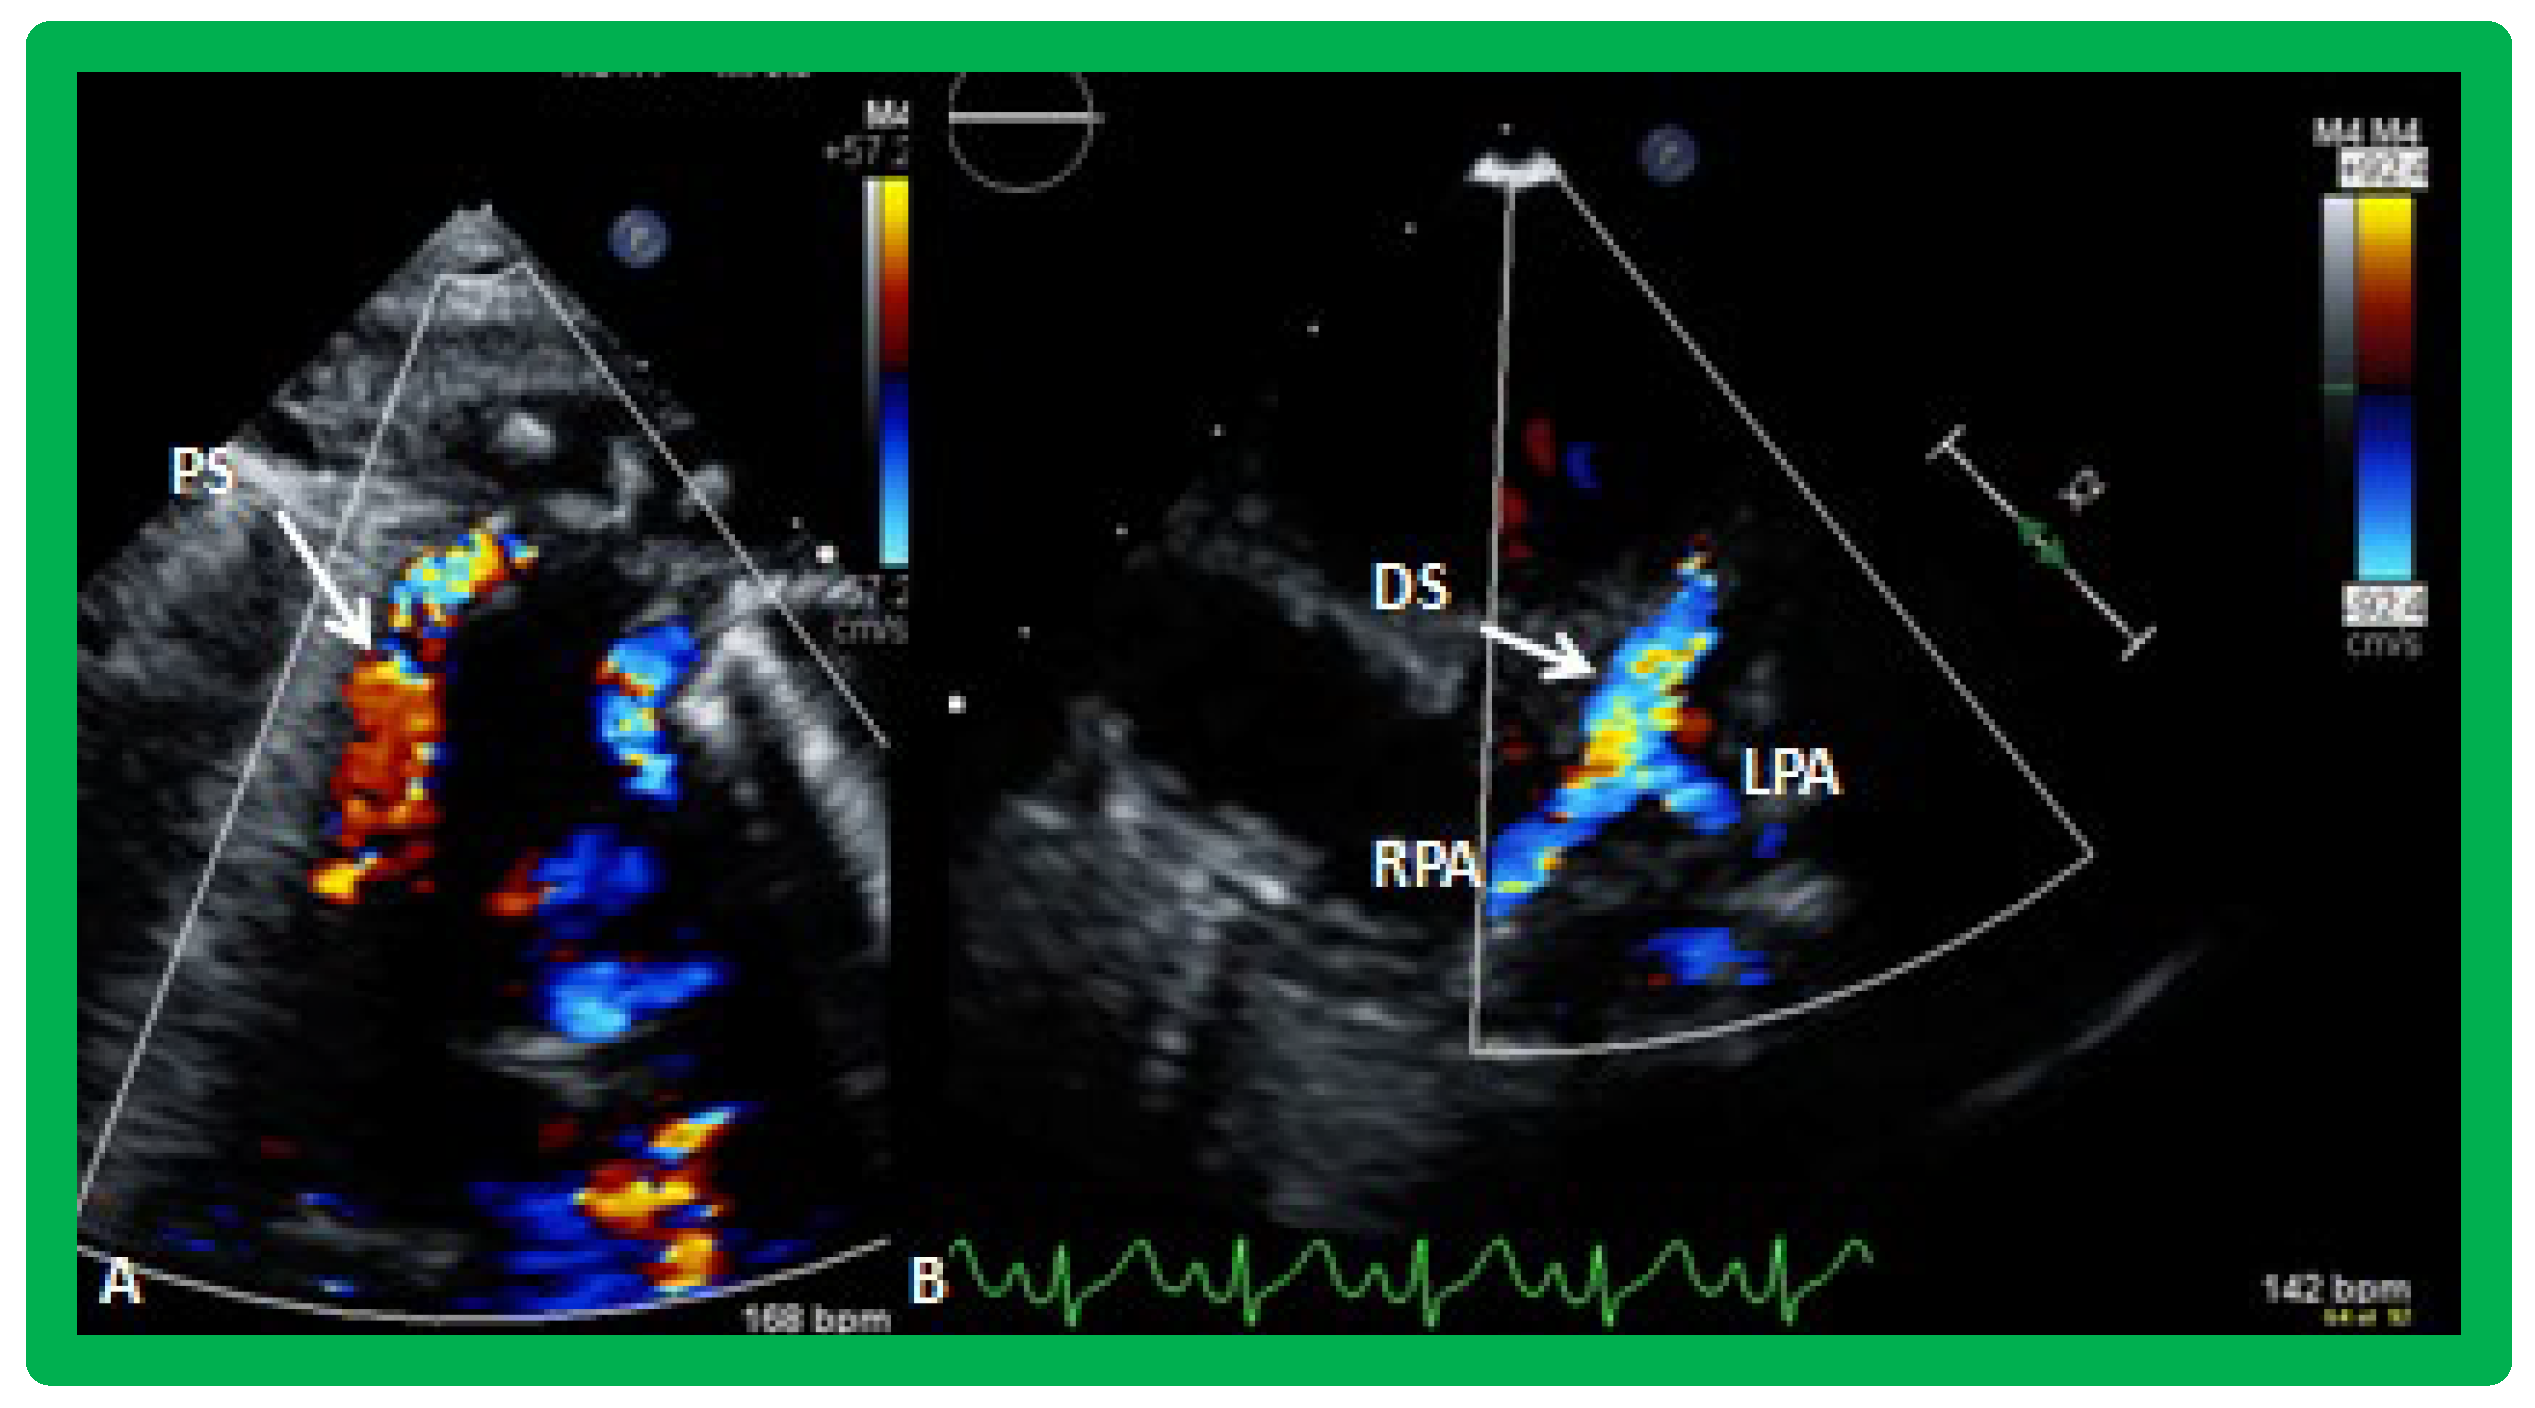
Figure 19.
Selected video frames from suprasternal notch view demonstrating proximal shunt (PS) by color flow imaging (A). In a slightly different view, (B), the flow from the distal shunt (DS) into right (RPA) and left (LPA) pulmonary arteries is shown.
Figure 19.
Selected video frames from suprasternal notch view demonstrating proximal shunt (PS) by color flow imaging (A). In a slightly different view, (B), the flow from the distal shunt (DS) into right (RPA) and left (LPA) pulmonary arteries is shown.
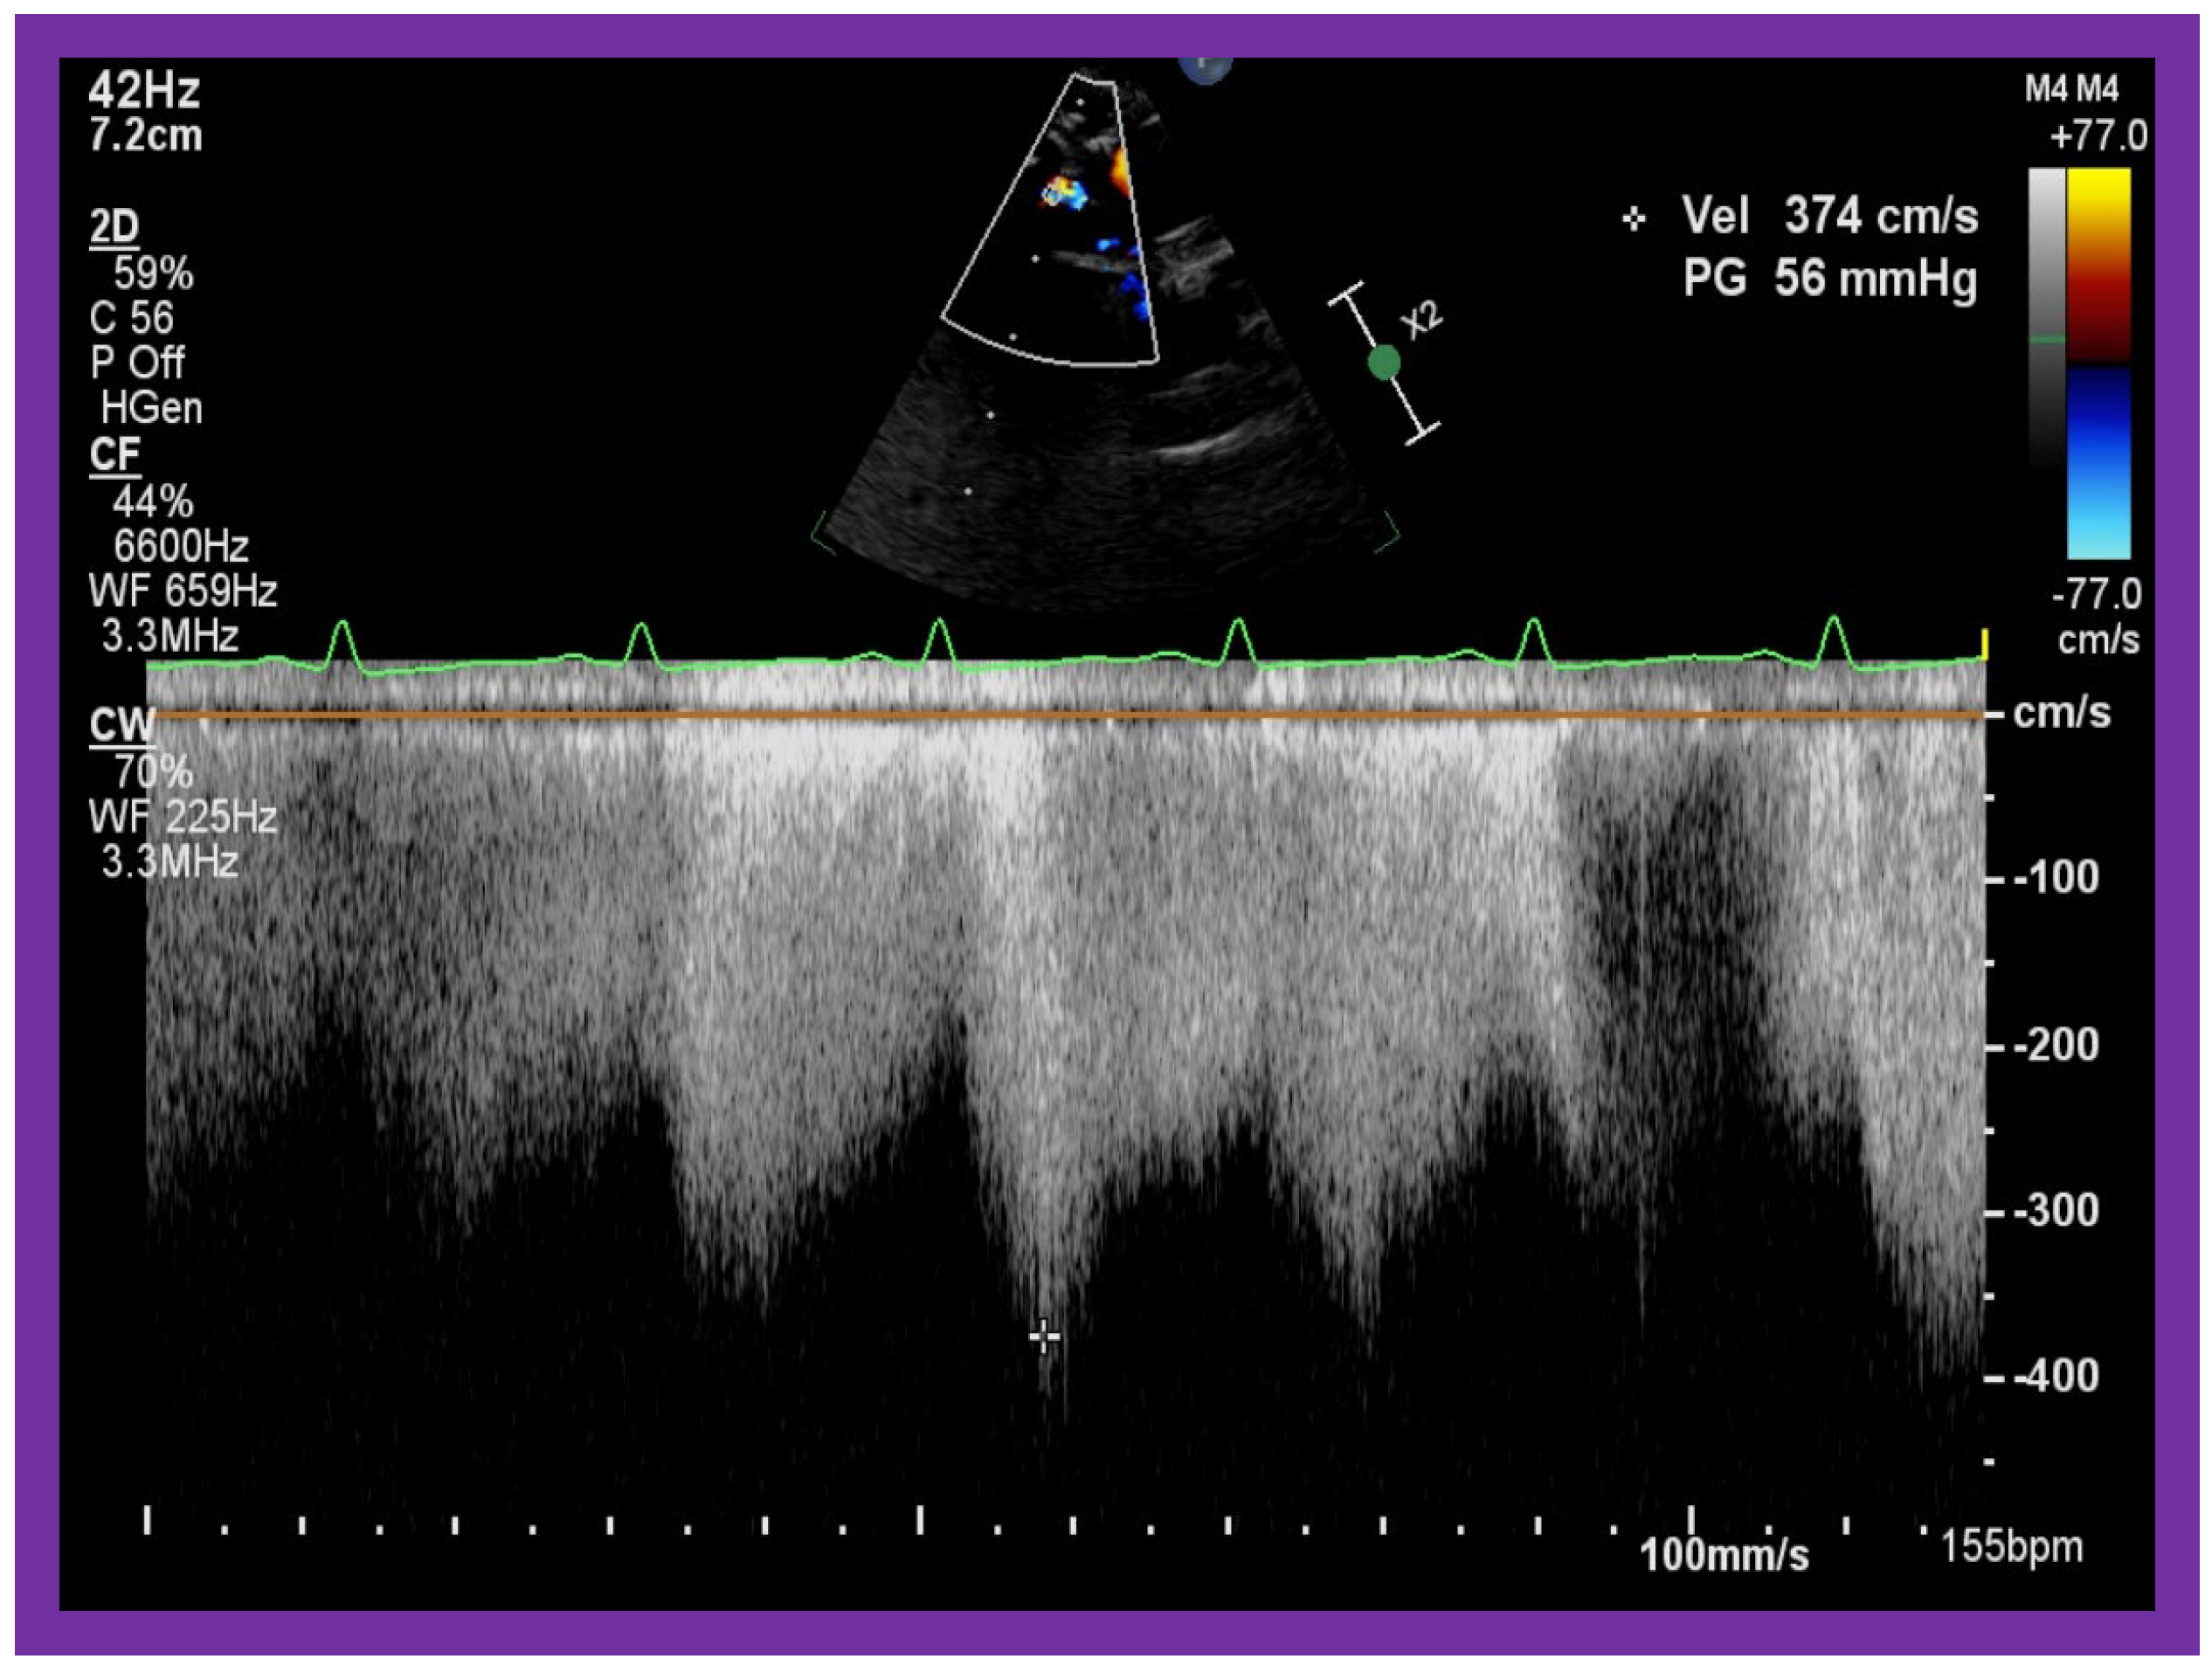
Figure 20.
Selected video frames from suprasternal notch view demonstrating high Doppler flow velocity across Blalock–Taussig shunt.
Figure 20.
Selected video frames from suprasternal notch view demonstrating high Doppler flow velocity across Blalock–Taussig shunt.
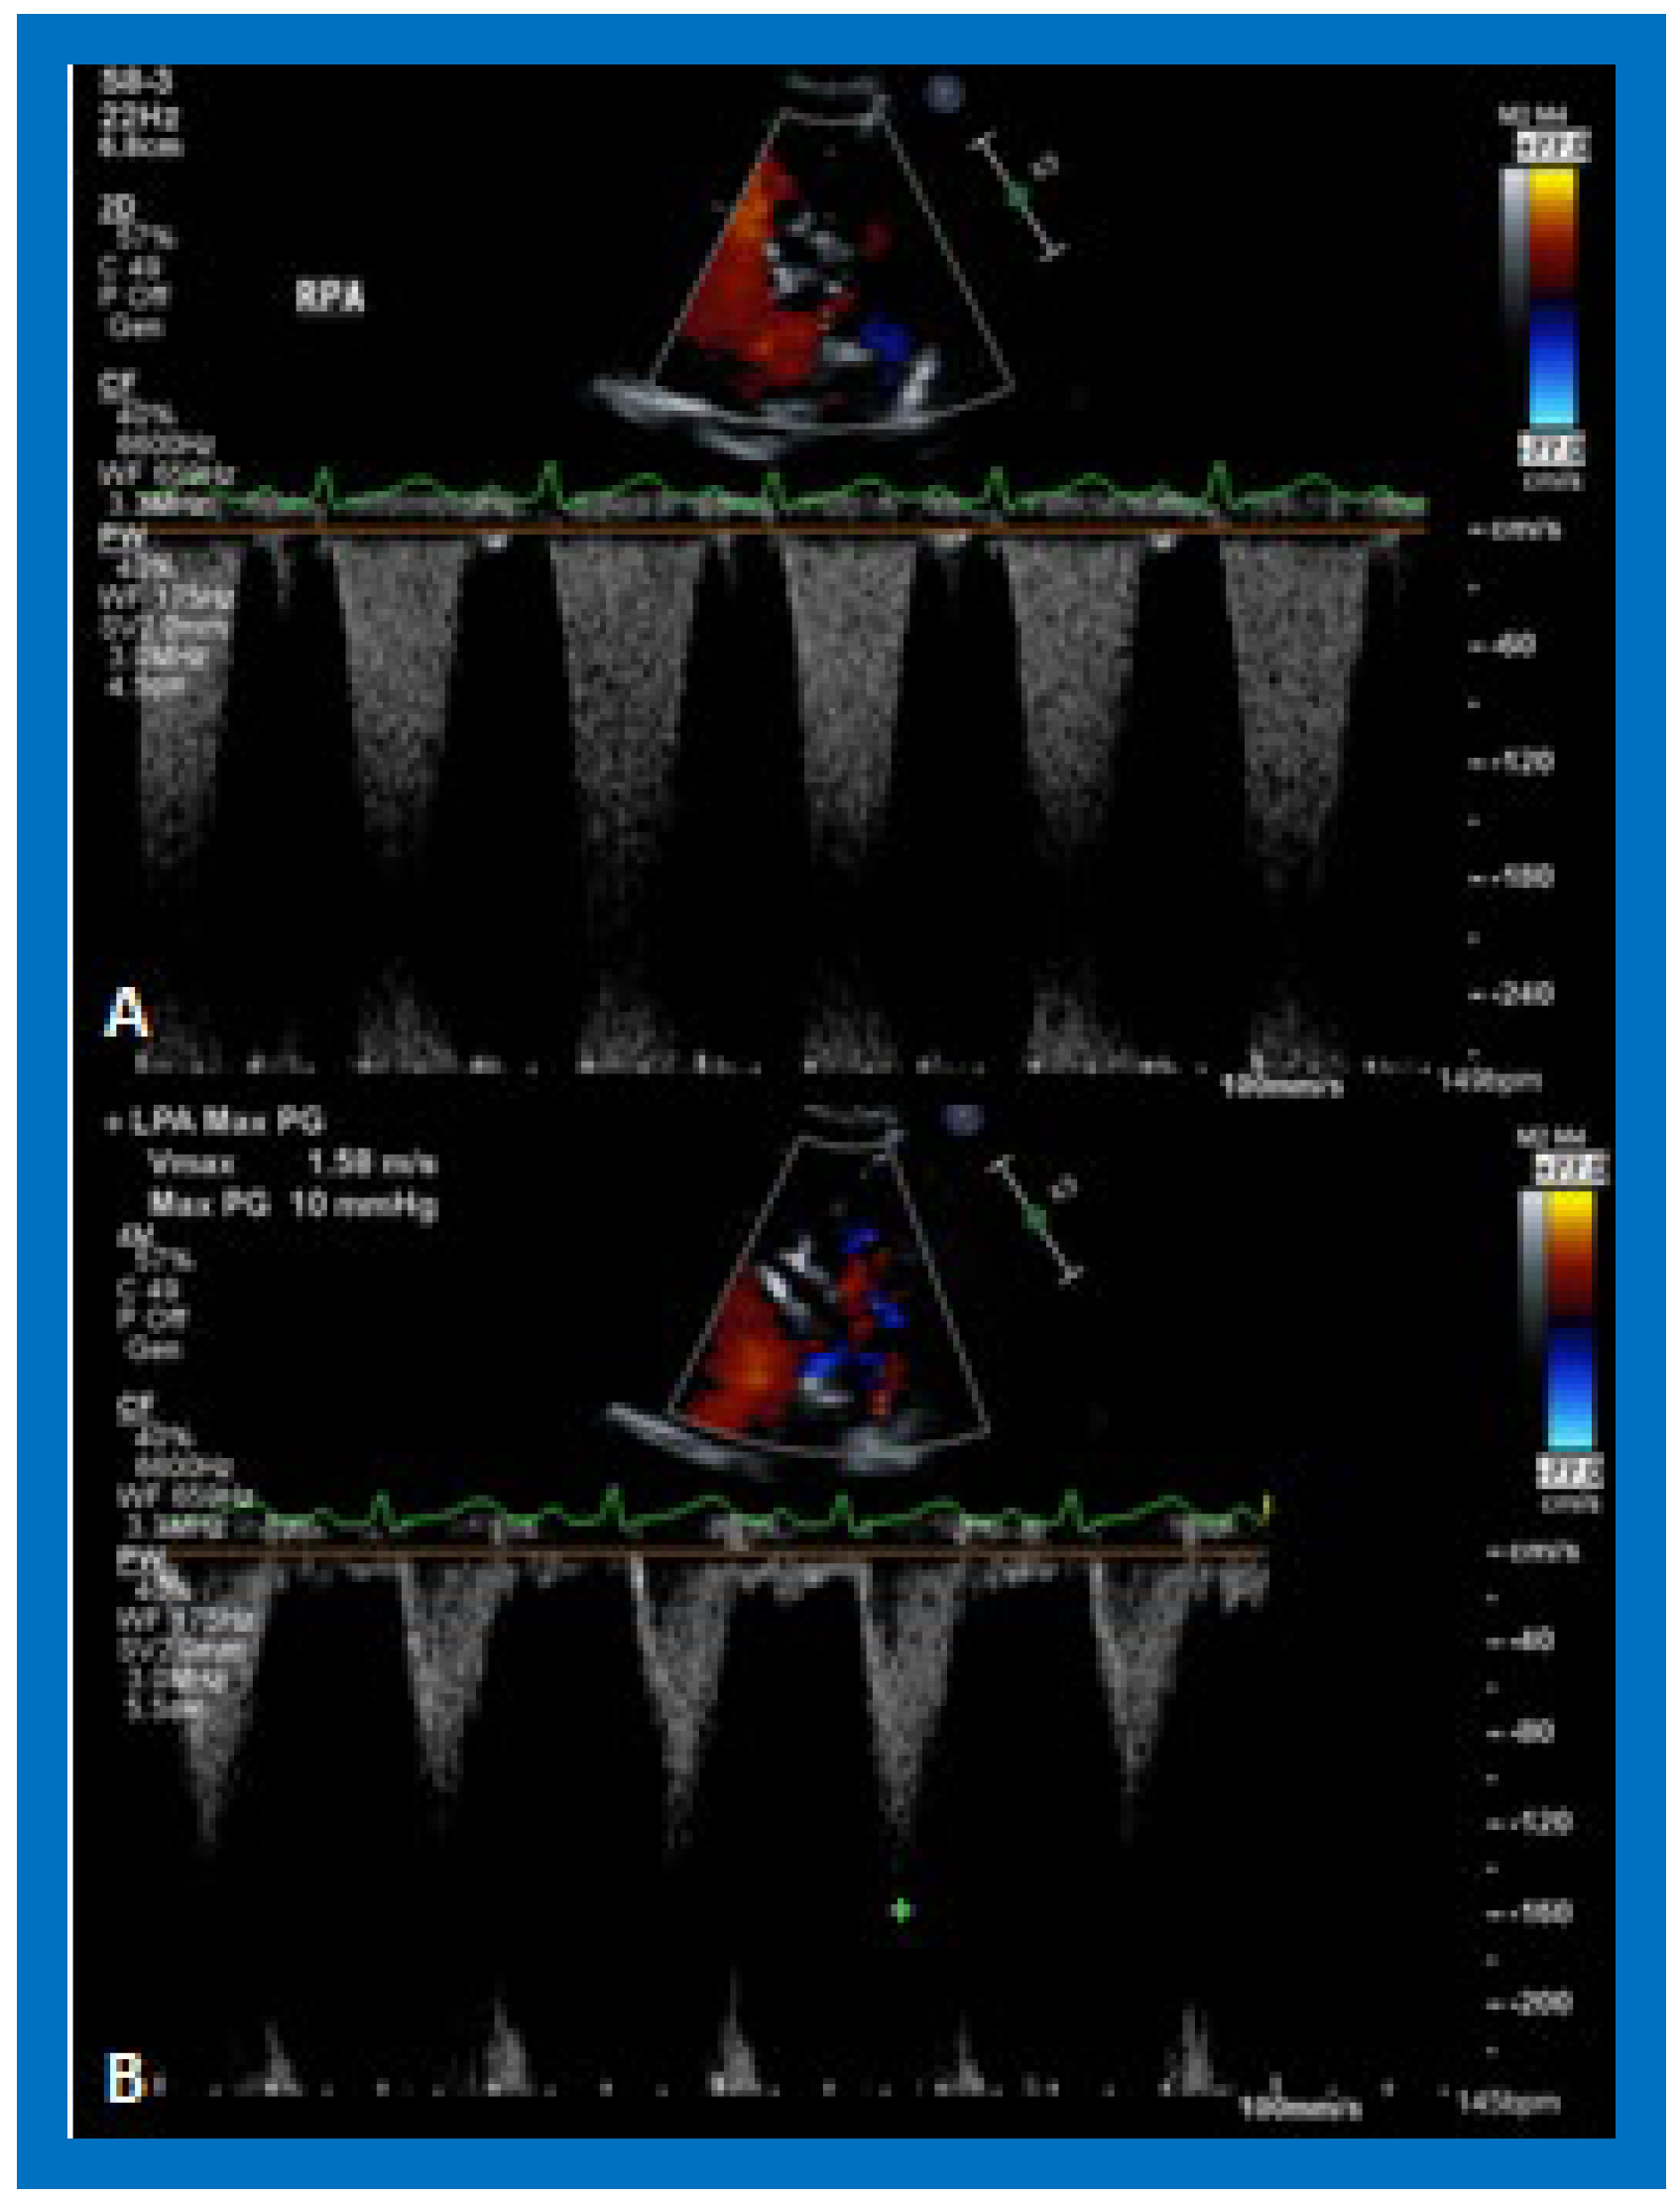
Figure 21.
Selected video frames demonstrating flow acceleration across the right (RPA) (A) and left (LPA) (B) pulmonary arteries in a patient with a Blalock–Taussig shunt. These slightly higher than normal velocities do not indicate stenosis of the branch pulmonary arteries.
Figure 21.
Selected video frames demonstrating flow acceleration across the right (RPA) (A) and left (LPA) (B) pulmonary arteries in a patient with a Blalock–Taussig shunt. These slightly higher than normal velocities do not indicate stenosis of the branch pulmonary arteries.
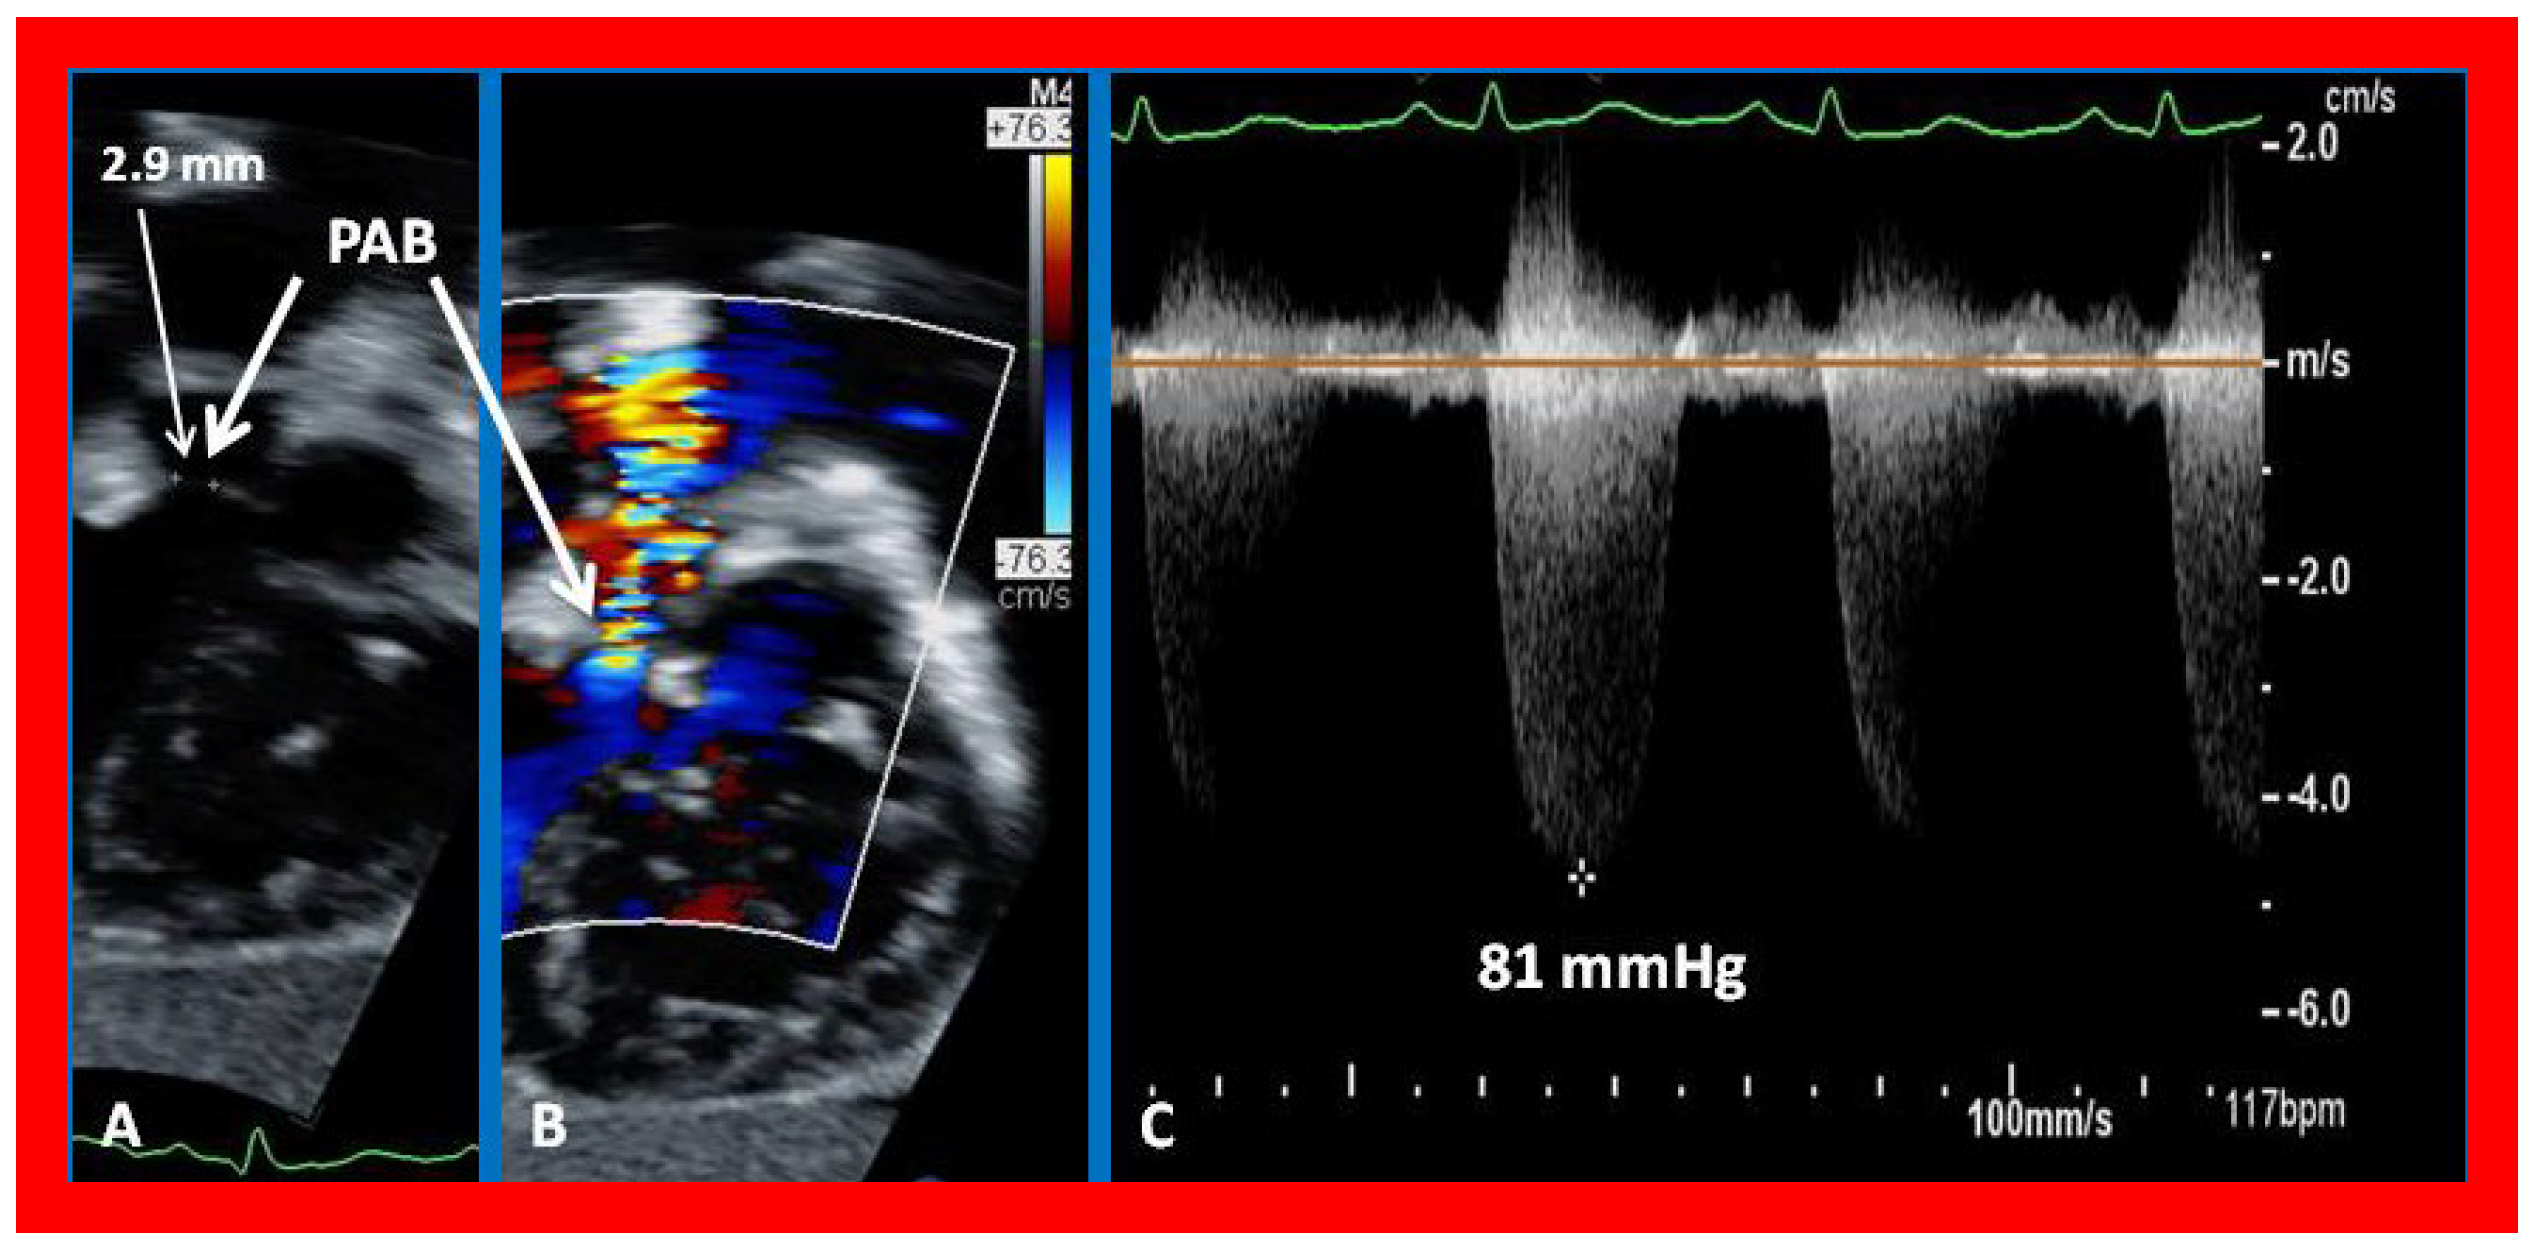
Figure 22.
Selected echocardiographic video frames demonstrating pulmonary artery band (PAB) with narrow diameter of 2.9 mm by 2D (A) and by color flow (B) and a high gradient (81 mmHg) by continuous wave Doppler (C) are shown.
Figure 22.
Selected echocardiographic video frames demonstrating pulmonary artery band (PAB) with narrow diameter of 2.9 mm by 2D (A) and by color flow (B) and a high gradient (81 mmHg) by continuous wave Doppler (C) are shown.
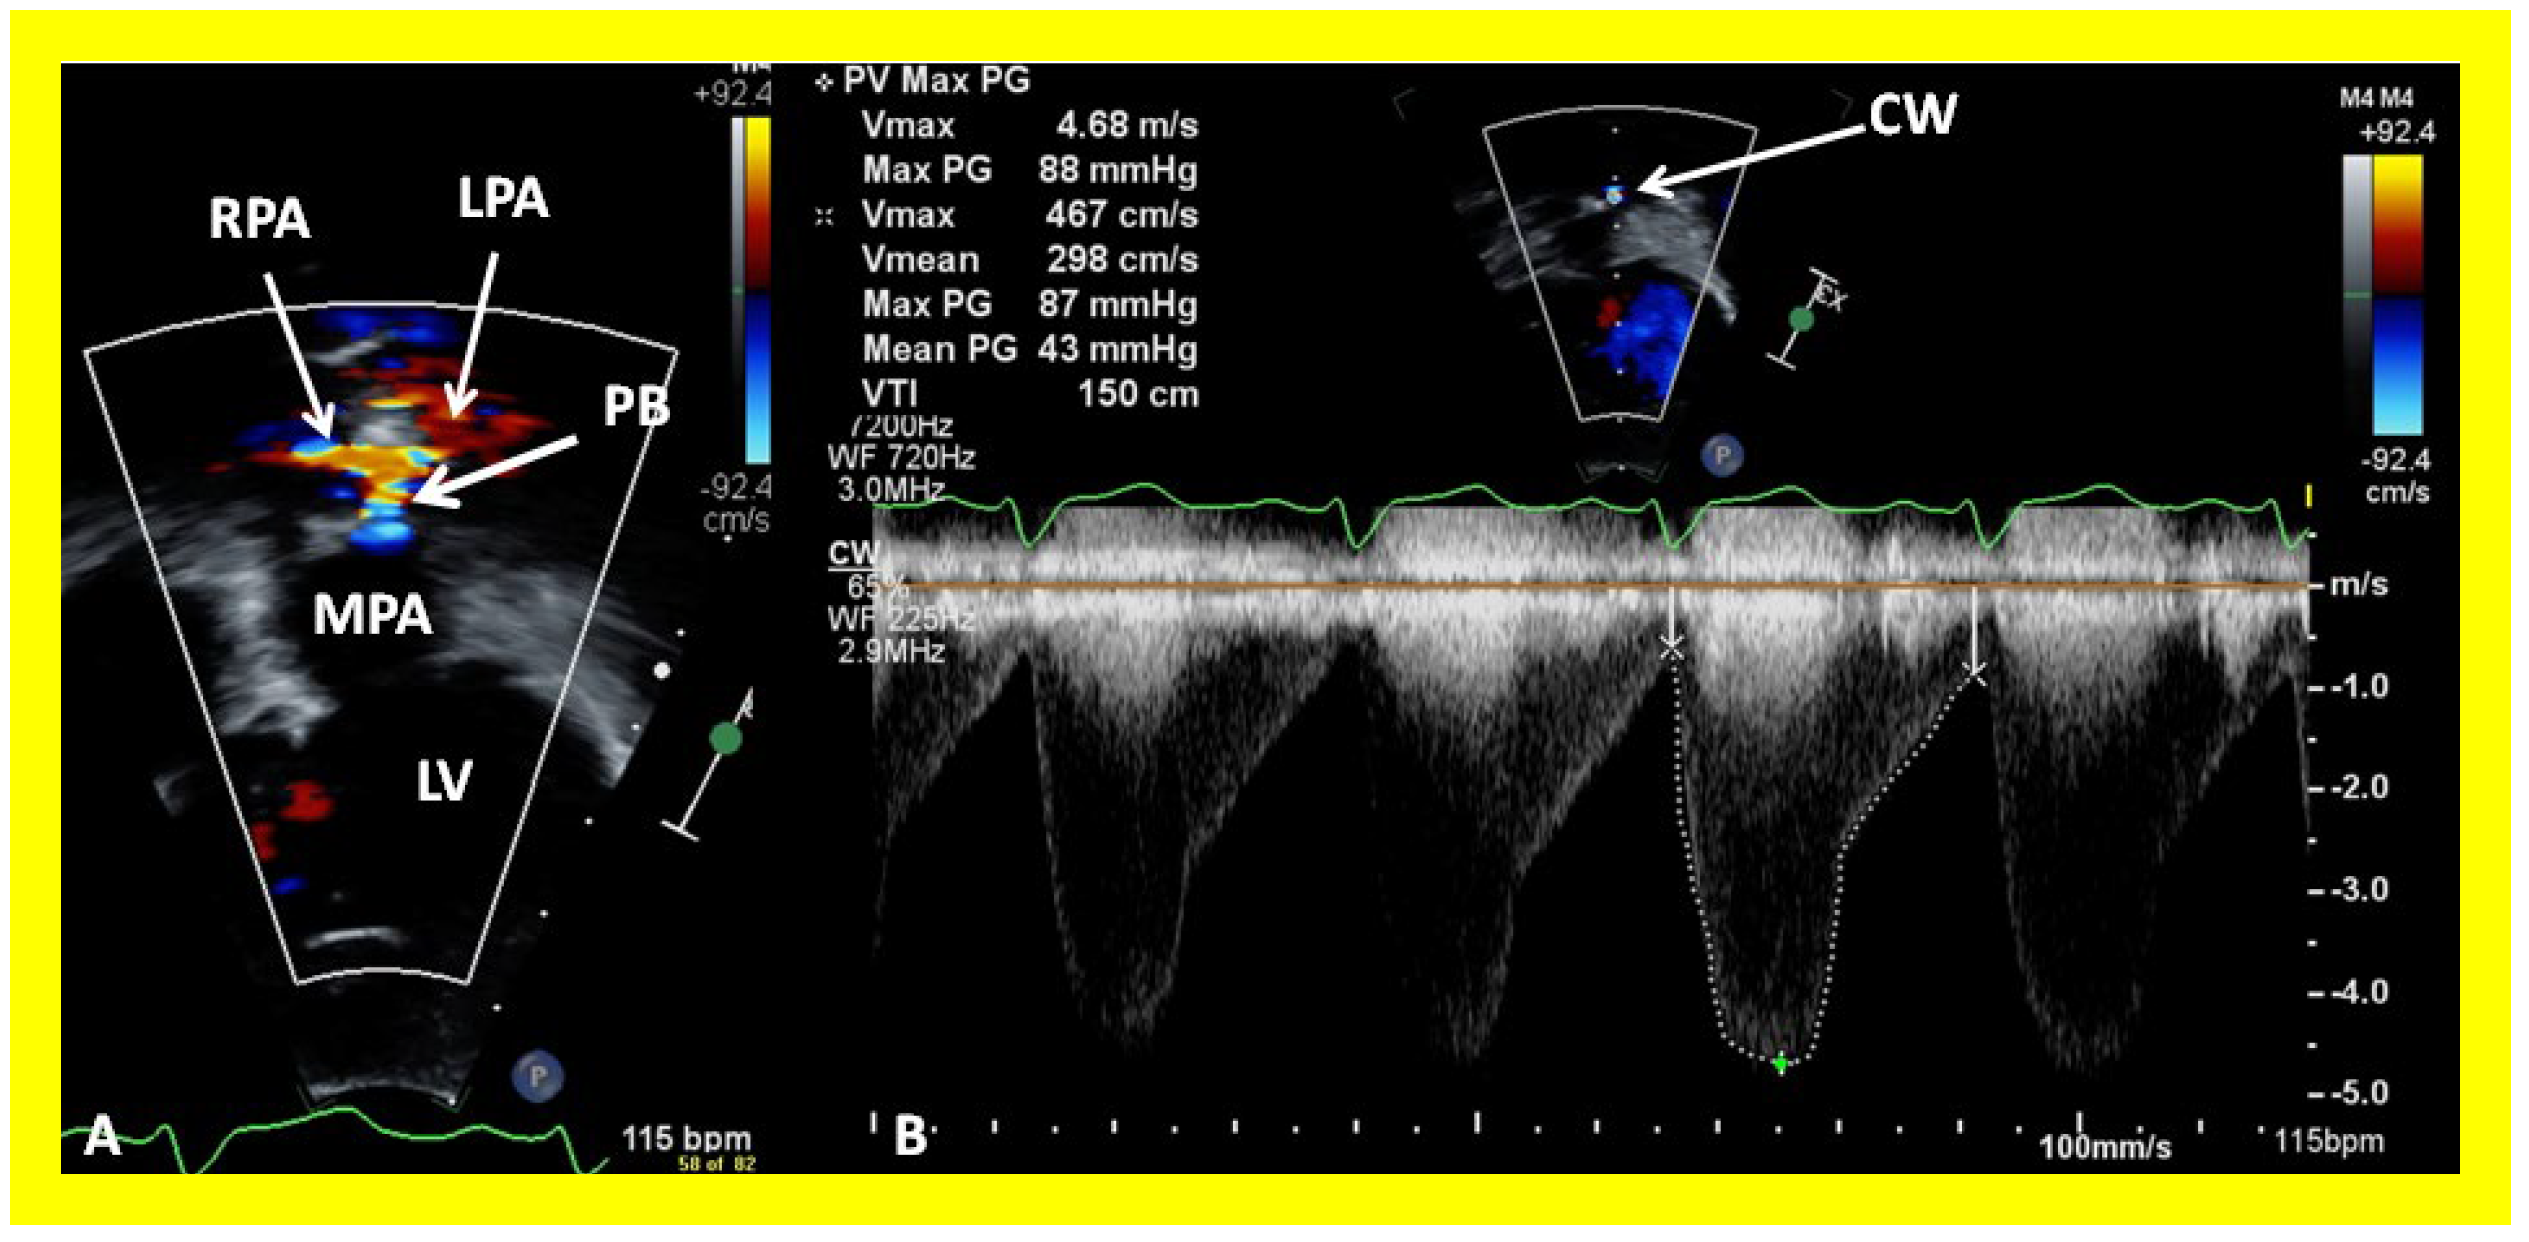
Figure 23.
Selected echocardiographic video frames demonstrating pulmonary artery band (PAB) with narrow diameter by color flow (A) and a high gradient (88 mmHg) by continuous wave Doppler (B) are shown.
Figure 23.
Selected echocardiographic video frames demonstrating pulmonary artery band (PAB) with narrow diameter by color flow (A) and a high gradient (88 mmHg) by continuous wave Doppler (B) are shown.
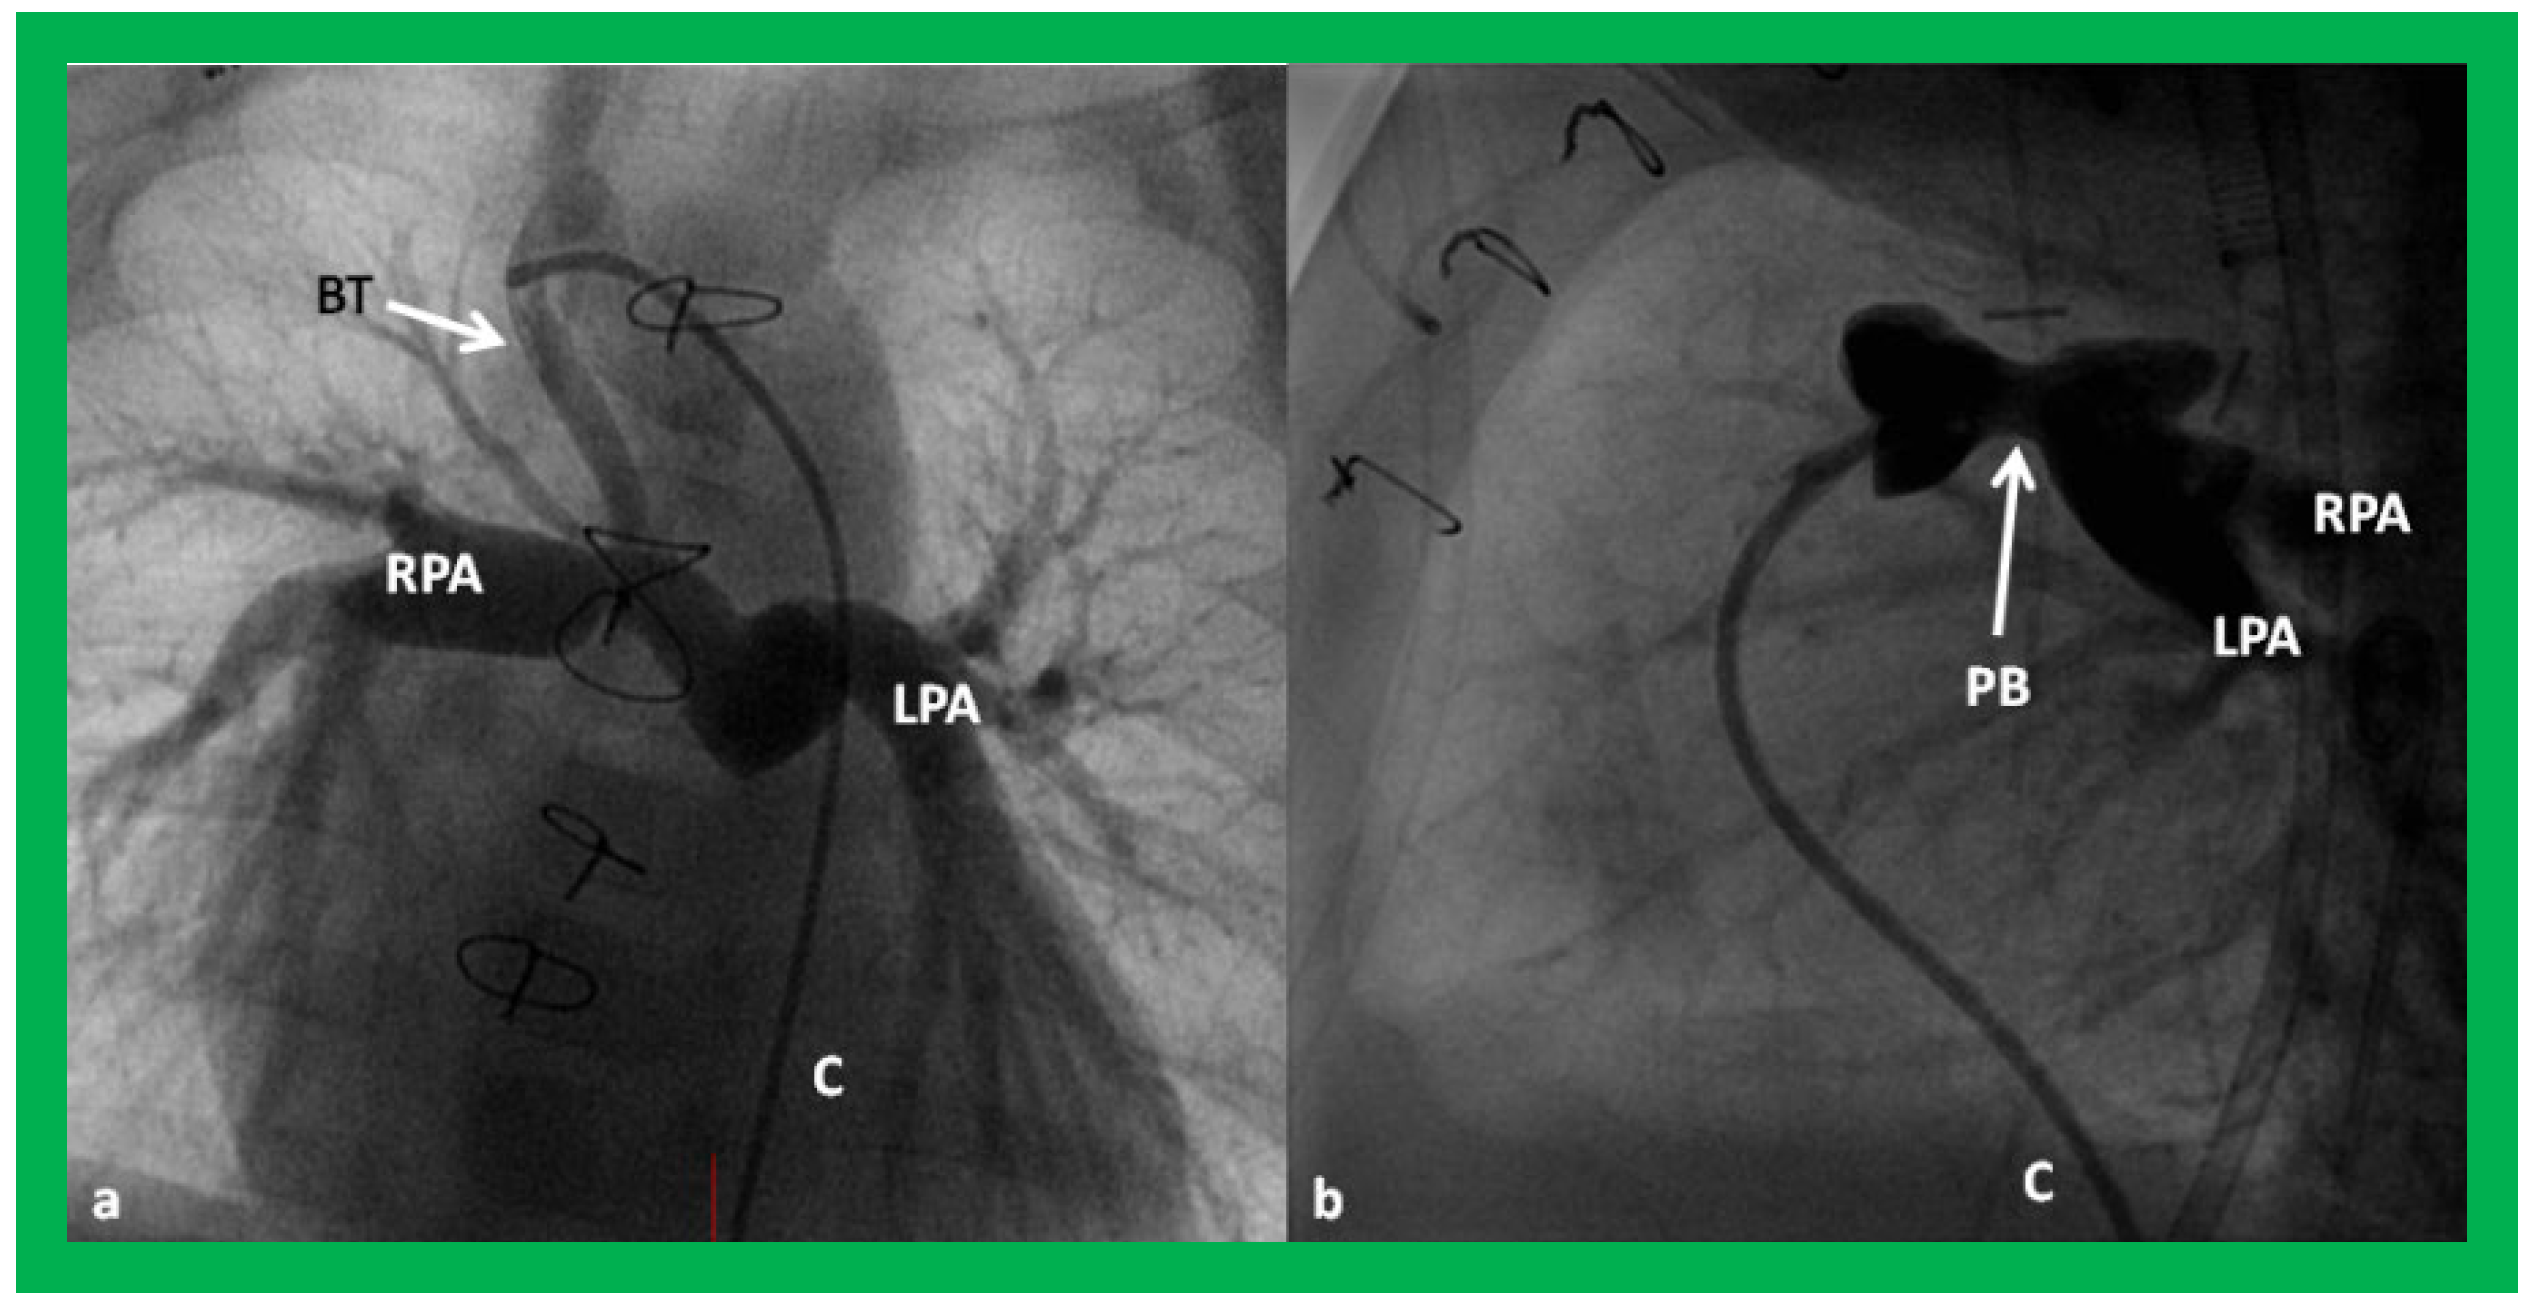
Figure 24.
Selected cine frames in postero–anterior (
a) and lateral (
b) views, demonstrating a Blalock–Taussig (BT) shunt (arrow in a) to care for infants with decreased pulmonary blood flow (
a) and pulmonary artery banding (PB) (arrow in (
b)) in babies with increased pulmonary blood flow (
b), respectively, during Stage I of Fontan procedure. C, catheter; LPA, left pulmonary artery; RPA, right pulmonary artery. Neonates with adequate pulmonary blood flow do not need any intervention and can go directly to Stage II at about the age of 3 months. Reproduced from Rao PS,
Indian J Pediatr 2015;82:1147–1156 [
36].
Figure 25.
Selected video frames from suprasternal notch view demonstrating bidirectional Glenn shunt; the superior vena cava (SVC) is shown emptying into the right (RPA) and left (LPA) pulmonary arteries by color flow imaging (A). Low Doppler flow velocity across the shunt (B) indicates unobstructed Glenn.
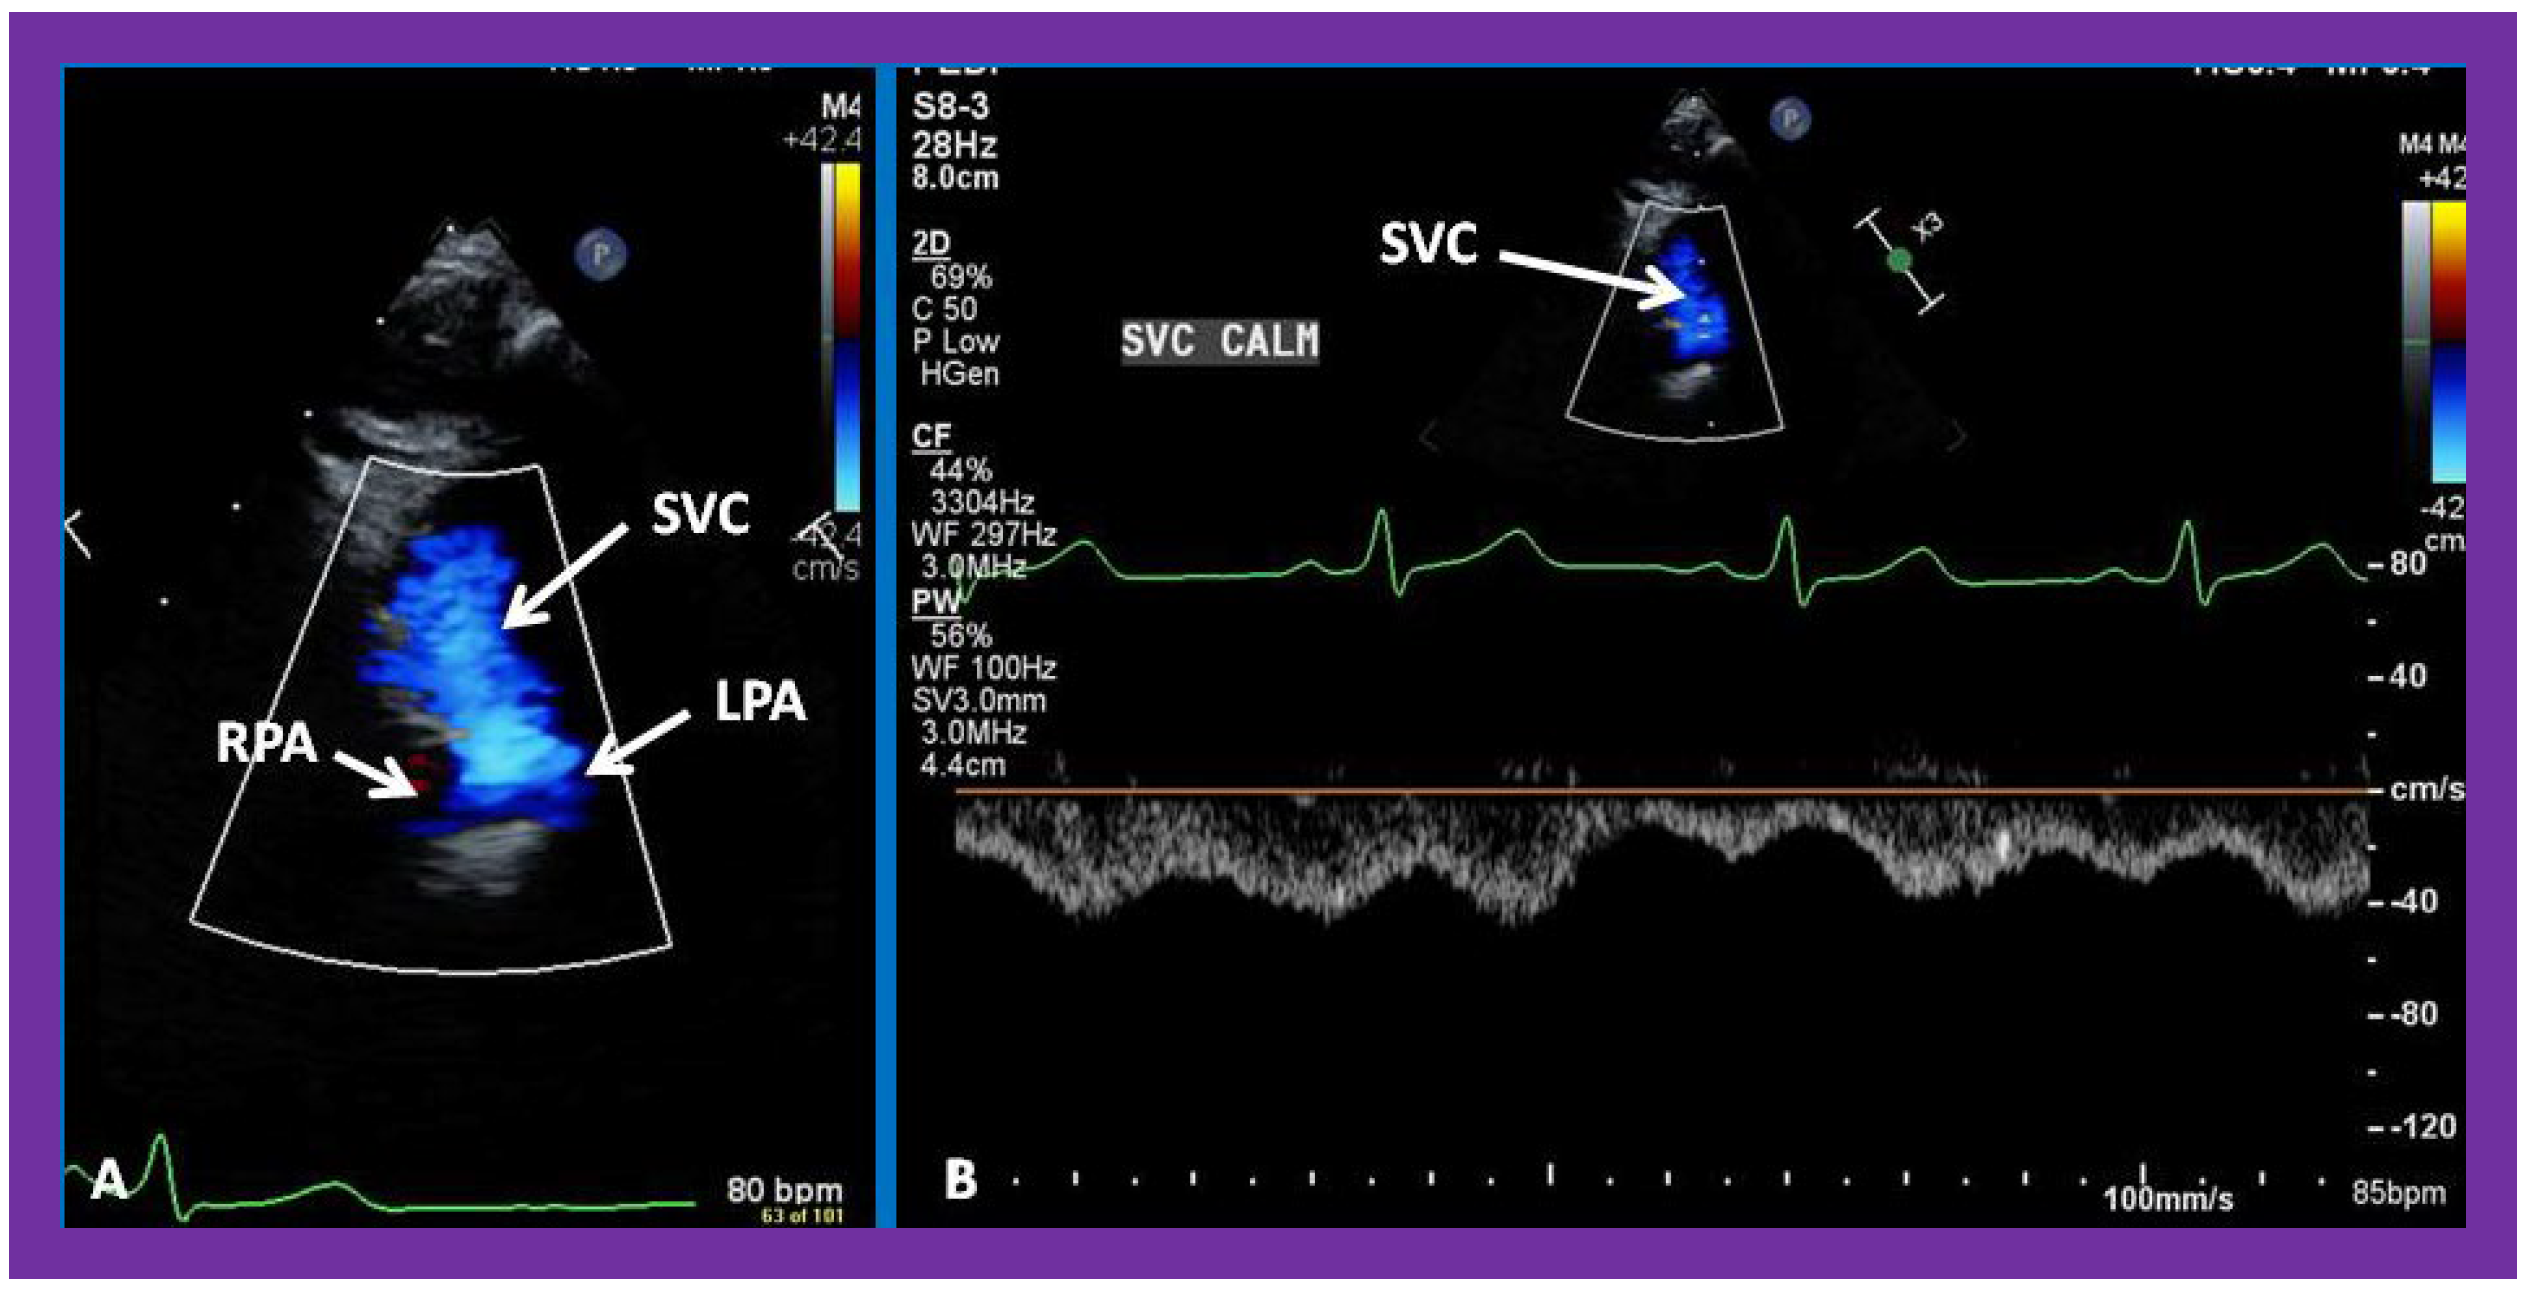
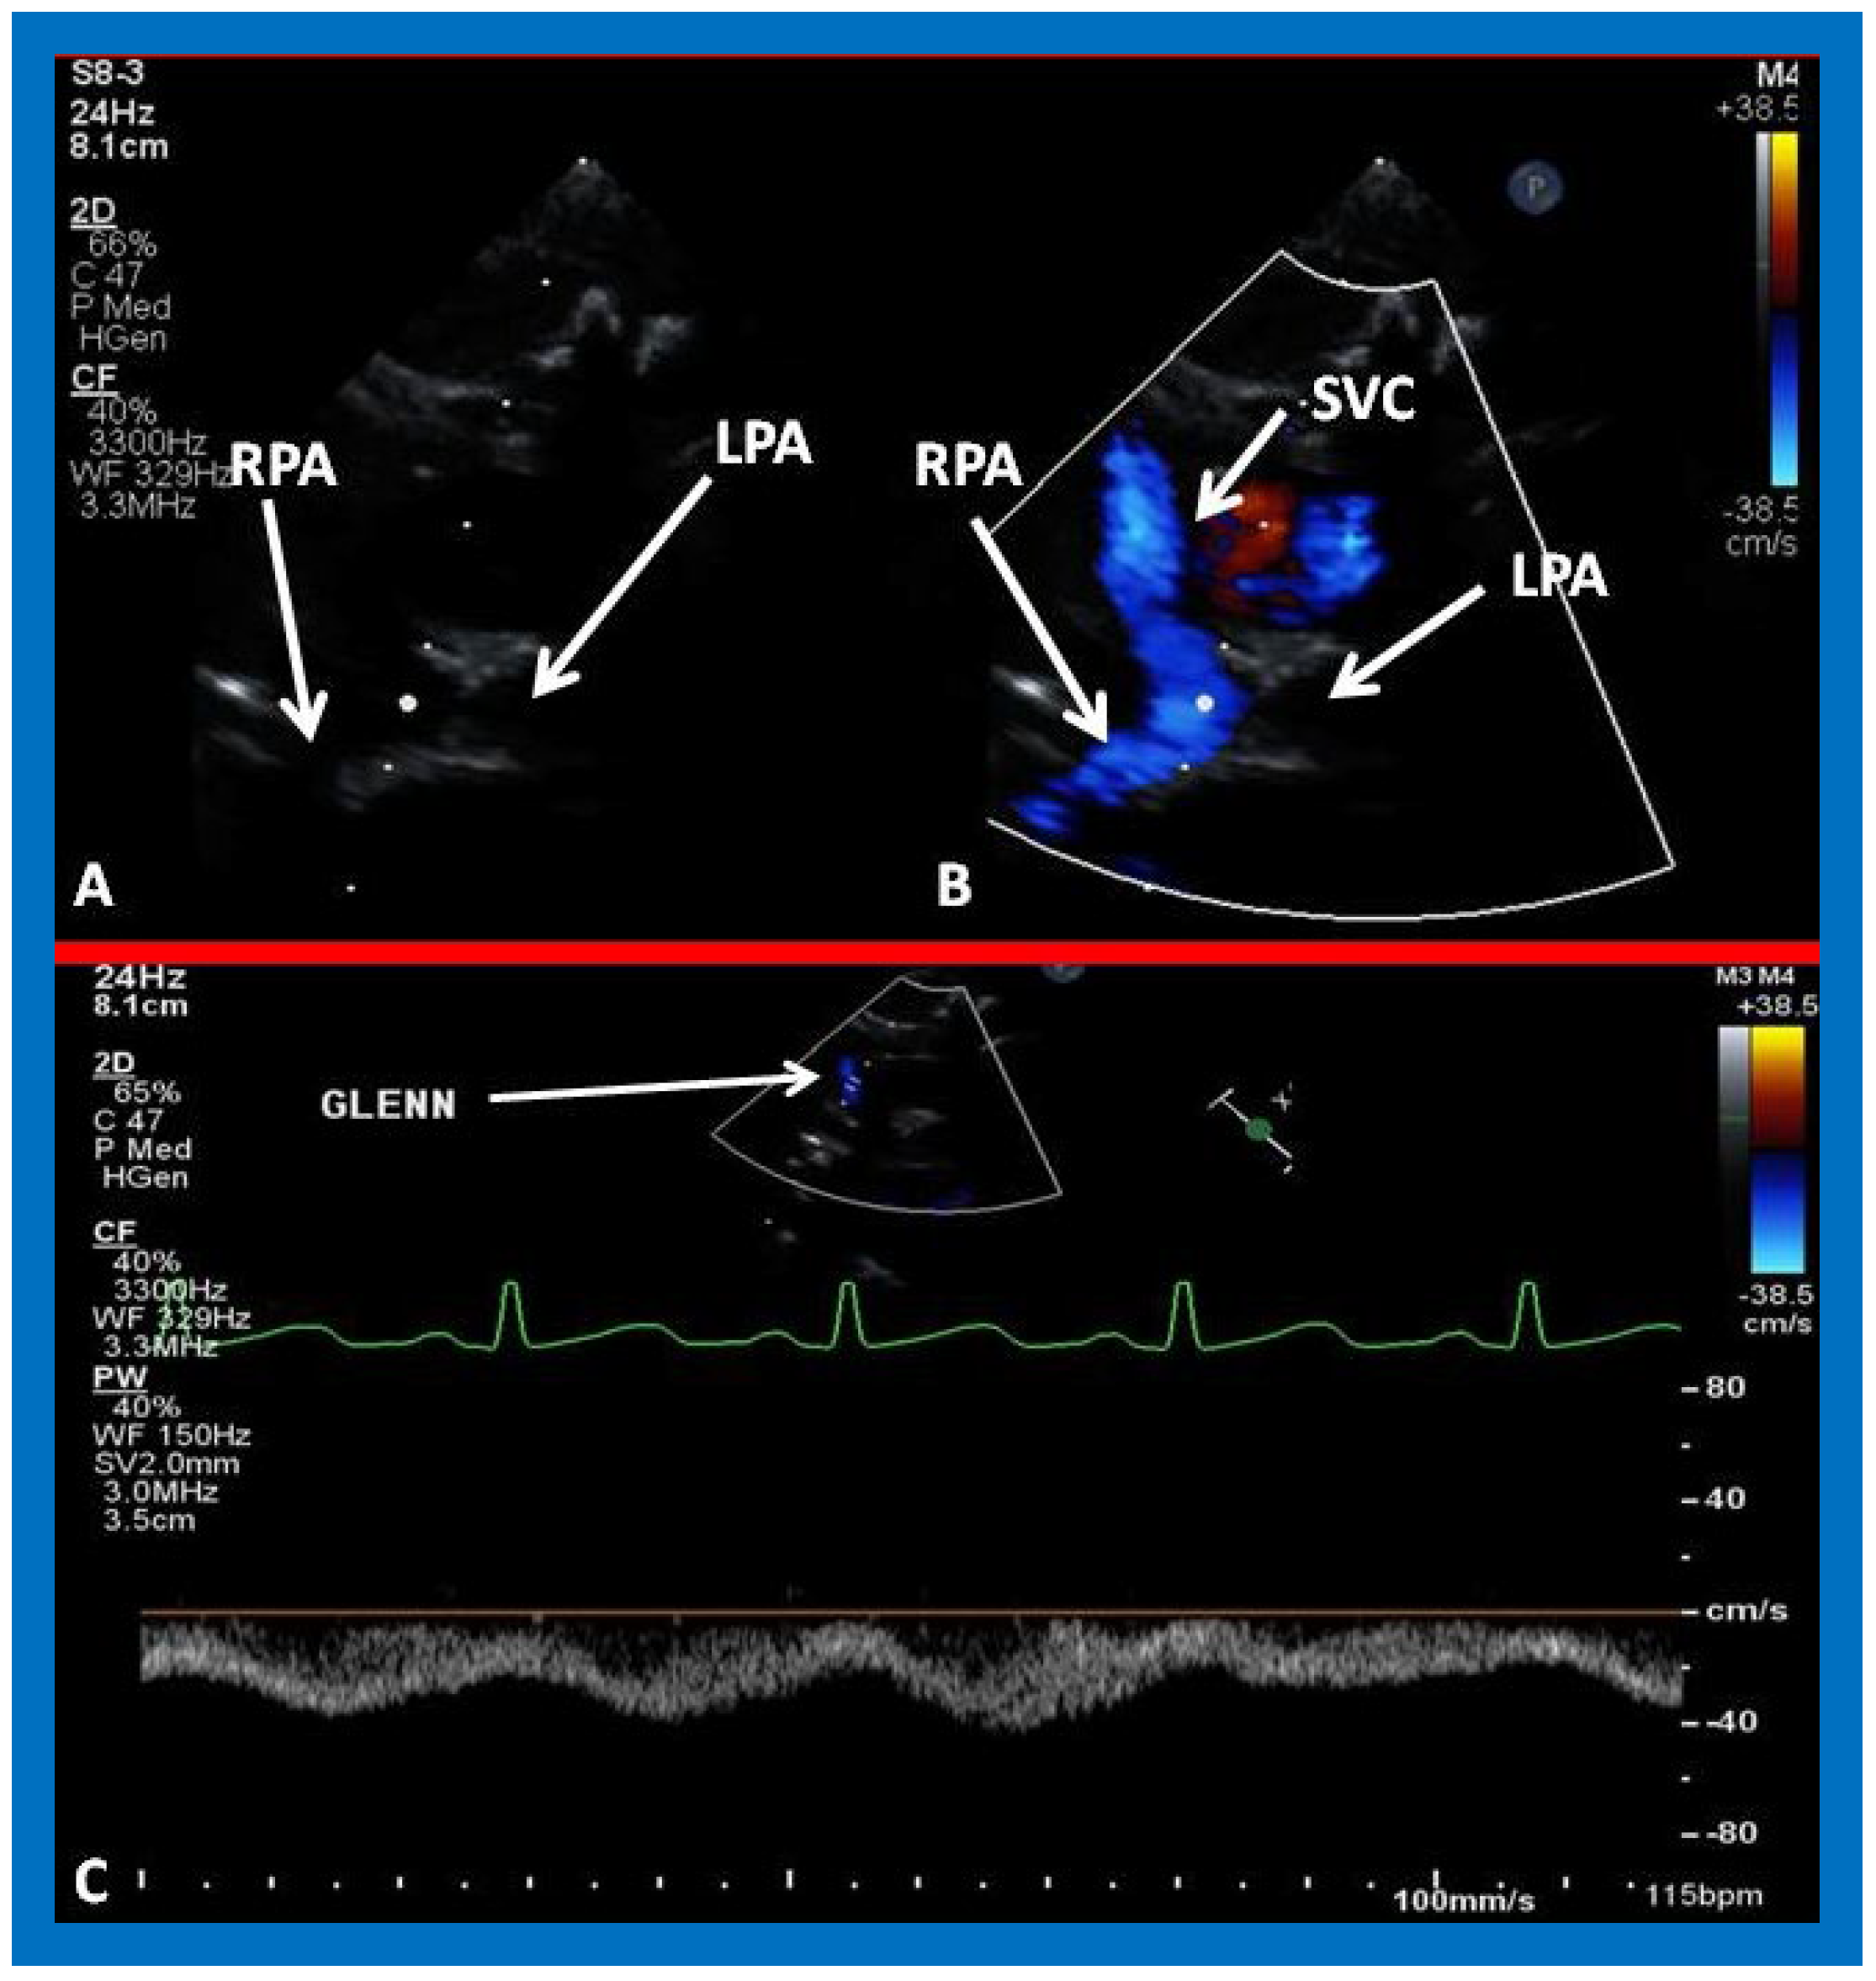
Figure 26.
(A,B) Selected video frames from suprasternal notch view demonstrating bidirectional Glenn shunt. In (A), the right (RPA) and left (LPA) pulmonary arteries are shown by 2D. The superior vena cava (SVC) was not clearly seen. In (B), the SVC is shown emptying into the RPA by color Doppler (B). The LPA did not show color flow because it was in a different plane of imaging than RPA, but is seen by 2D (B). (C) Low Doppler flow velocity across the Glenn shunt indicates unobstructed flow.
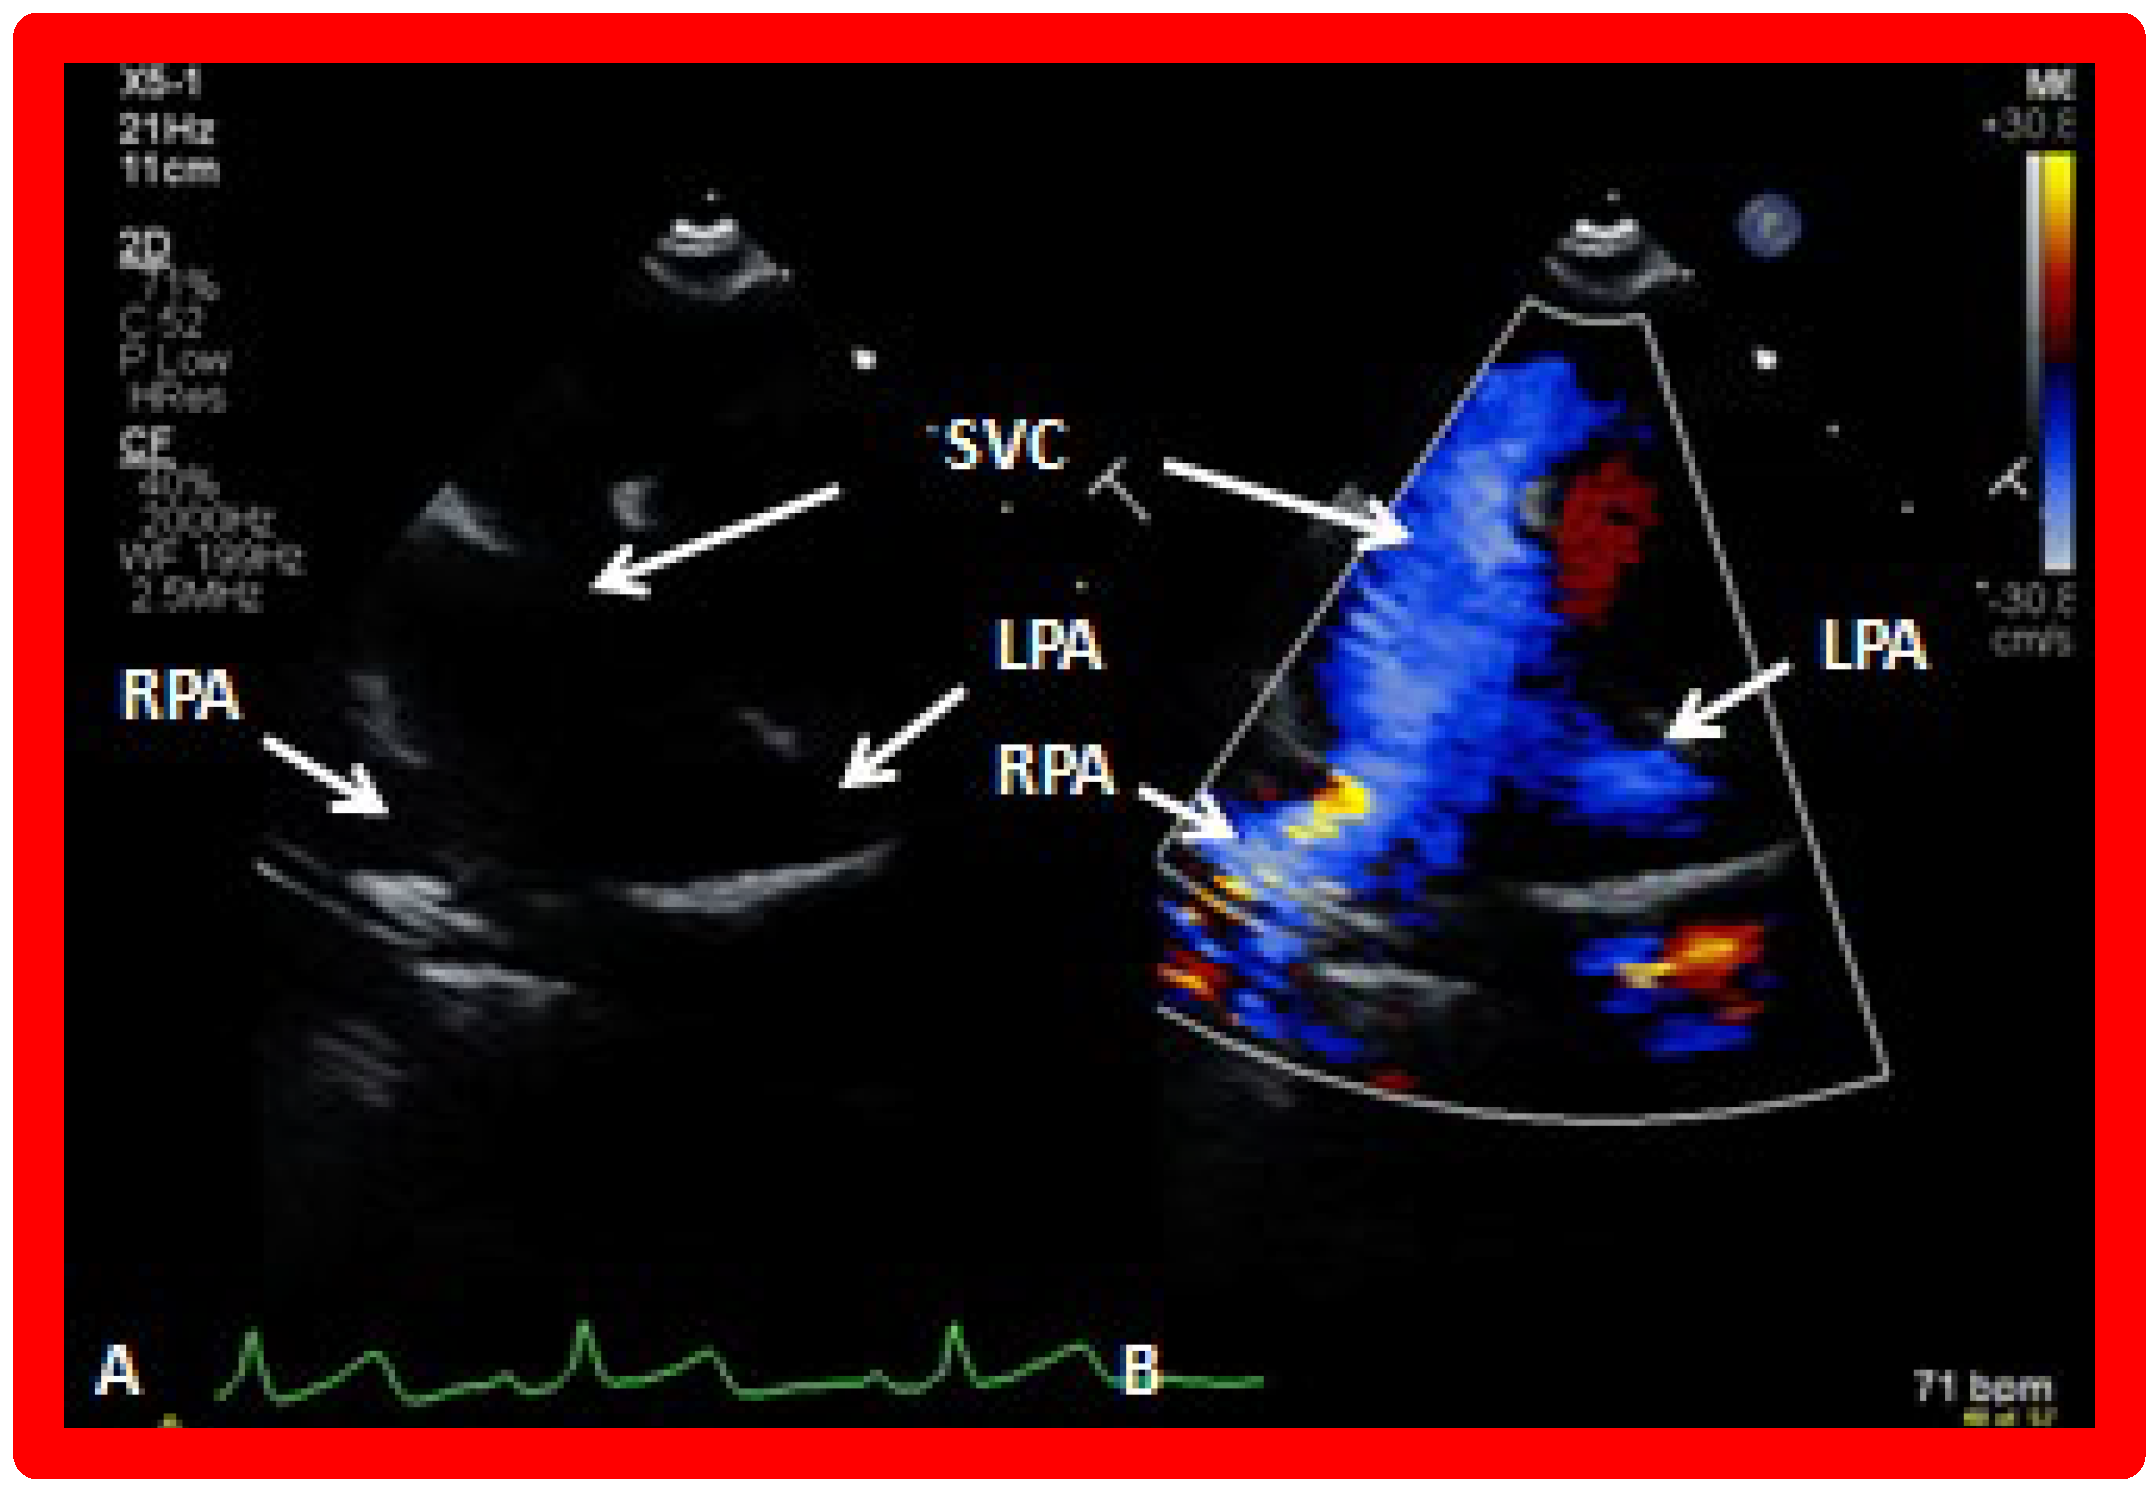
Figure 27.
Selected video frames from suprasternal notch view demonstrating bidirectional Glenn shunt; the superior vena cava (SVC) is shown emptying into the right (RPA) and left (LPA) pulmonary arteries by two dimensional (
A) and color flow imaging (
B). Both RPA and LPA are seen with color in contrast to that seen in
Figure 26, probably related to both pulmonary arteries are in a similar echo plane.
Figure 28.
Selected video frames from suprasternal notch view demonstrating right (RPA) and left (LPA) pulmonary arteries without (A) and with (B) color flow imaging.
Figure 28.
Selected video frames from suprasternal notch view demonstrating right (RPA) and left (LPA) pulmonary arteries without (A) and with (B) color flow imaging.
Figure 29.
Selected cine frames in postero–anterior (
a) and sitting up (
b) views, demonstrating bidirectional Glenn procedure (the superior vena cava [SVC] is anastomosed with the right pulmonary artery [RPA]) in two different patients during Stage II of Fontan procedure. Unobstructed flow from the SVC to the right (RPA) and left (LPA) pulmonary arteries is shown. Reproduced from Rao PS,
Indian J Pediatr 2015; 82:1147–1156 [
36].
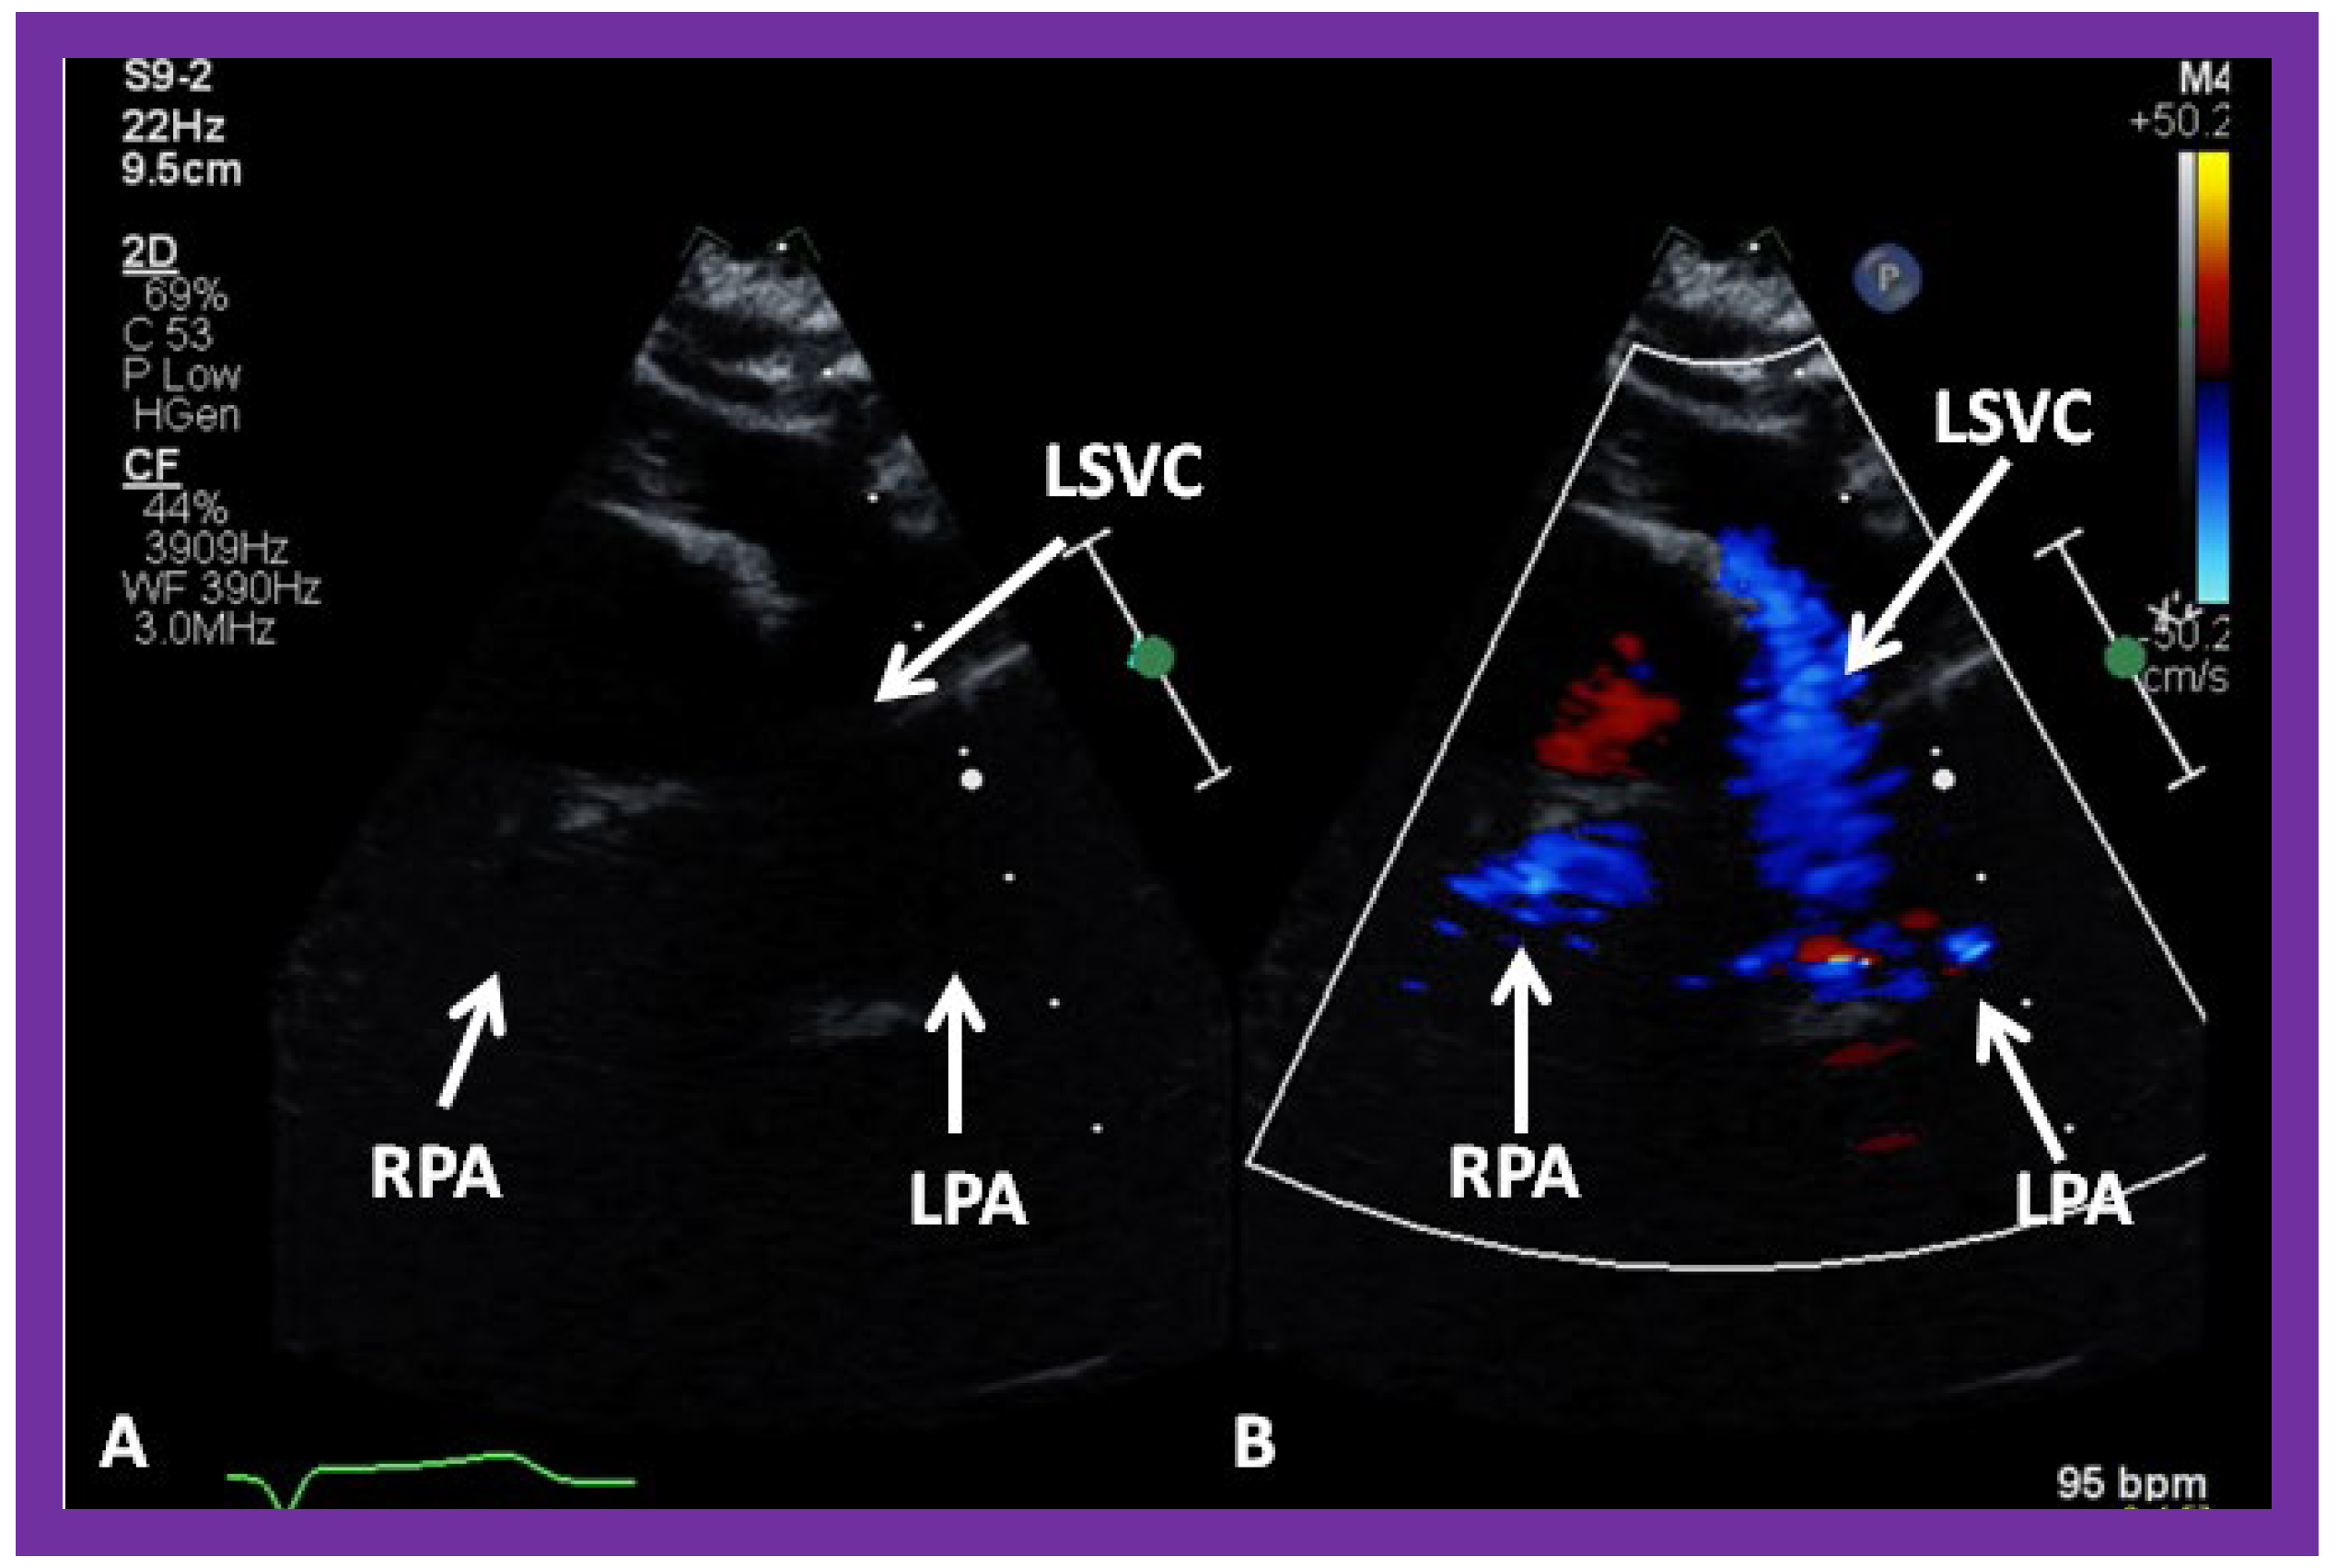
Figure 30.
(A,B) Selected video frames from suprasternal notch view demonstrating left sided bidirectional Glenn shunt. In (A), the right (RPA) and left (LPA) pulmonary arteries are faintly seen by 2D. On color Doppler study, the visualization is slightly better (B). LSVC, left superior vena cava.
Figure 30.
(A,B) Selected video frames from suprasternal notch view demonstrating left sided bidirectional Glenn shunt. In (A), the right (RPA) and left (LPA) pulmonary arteries are faintly seen by 2D. On color Doppler study, the visualization is slightly better (B). LSVC, left superior vena cava.
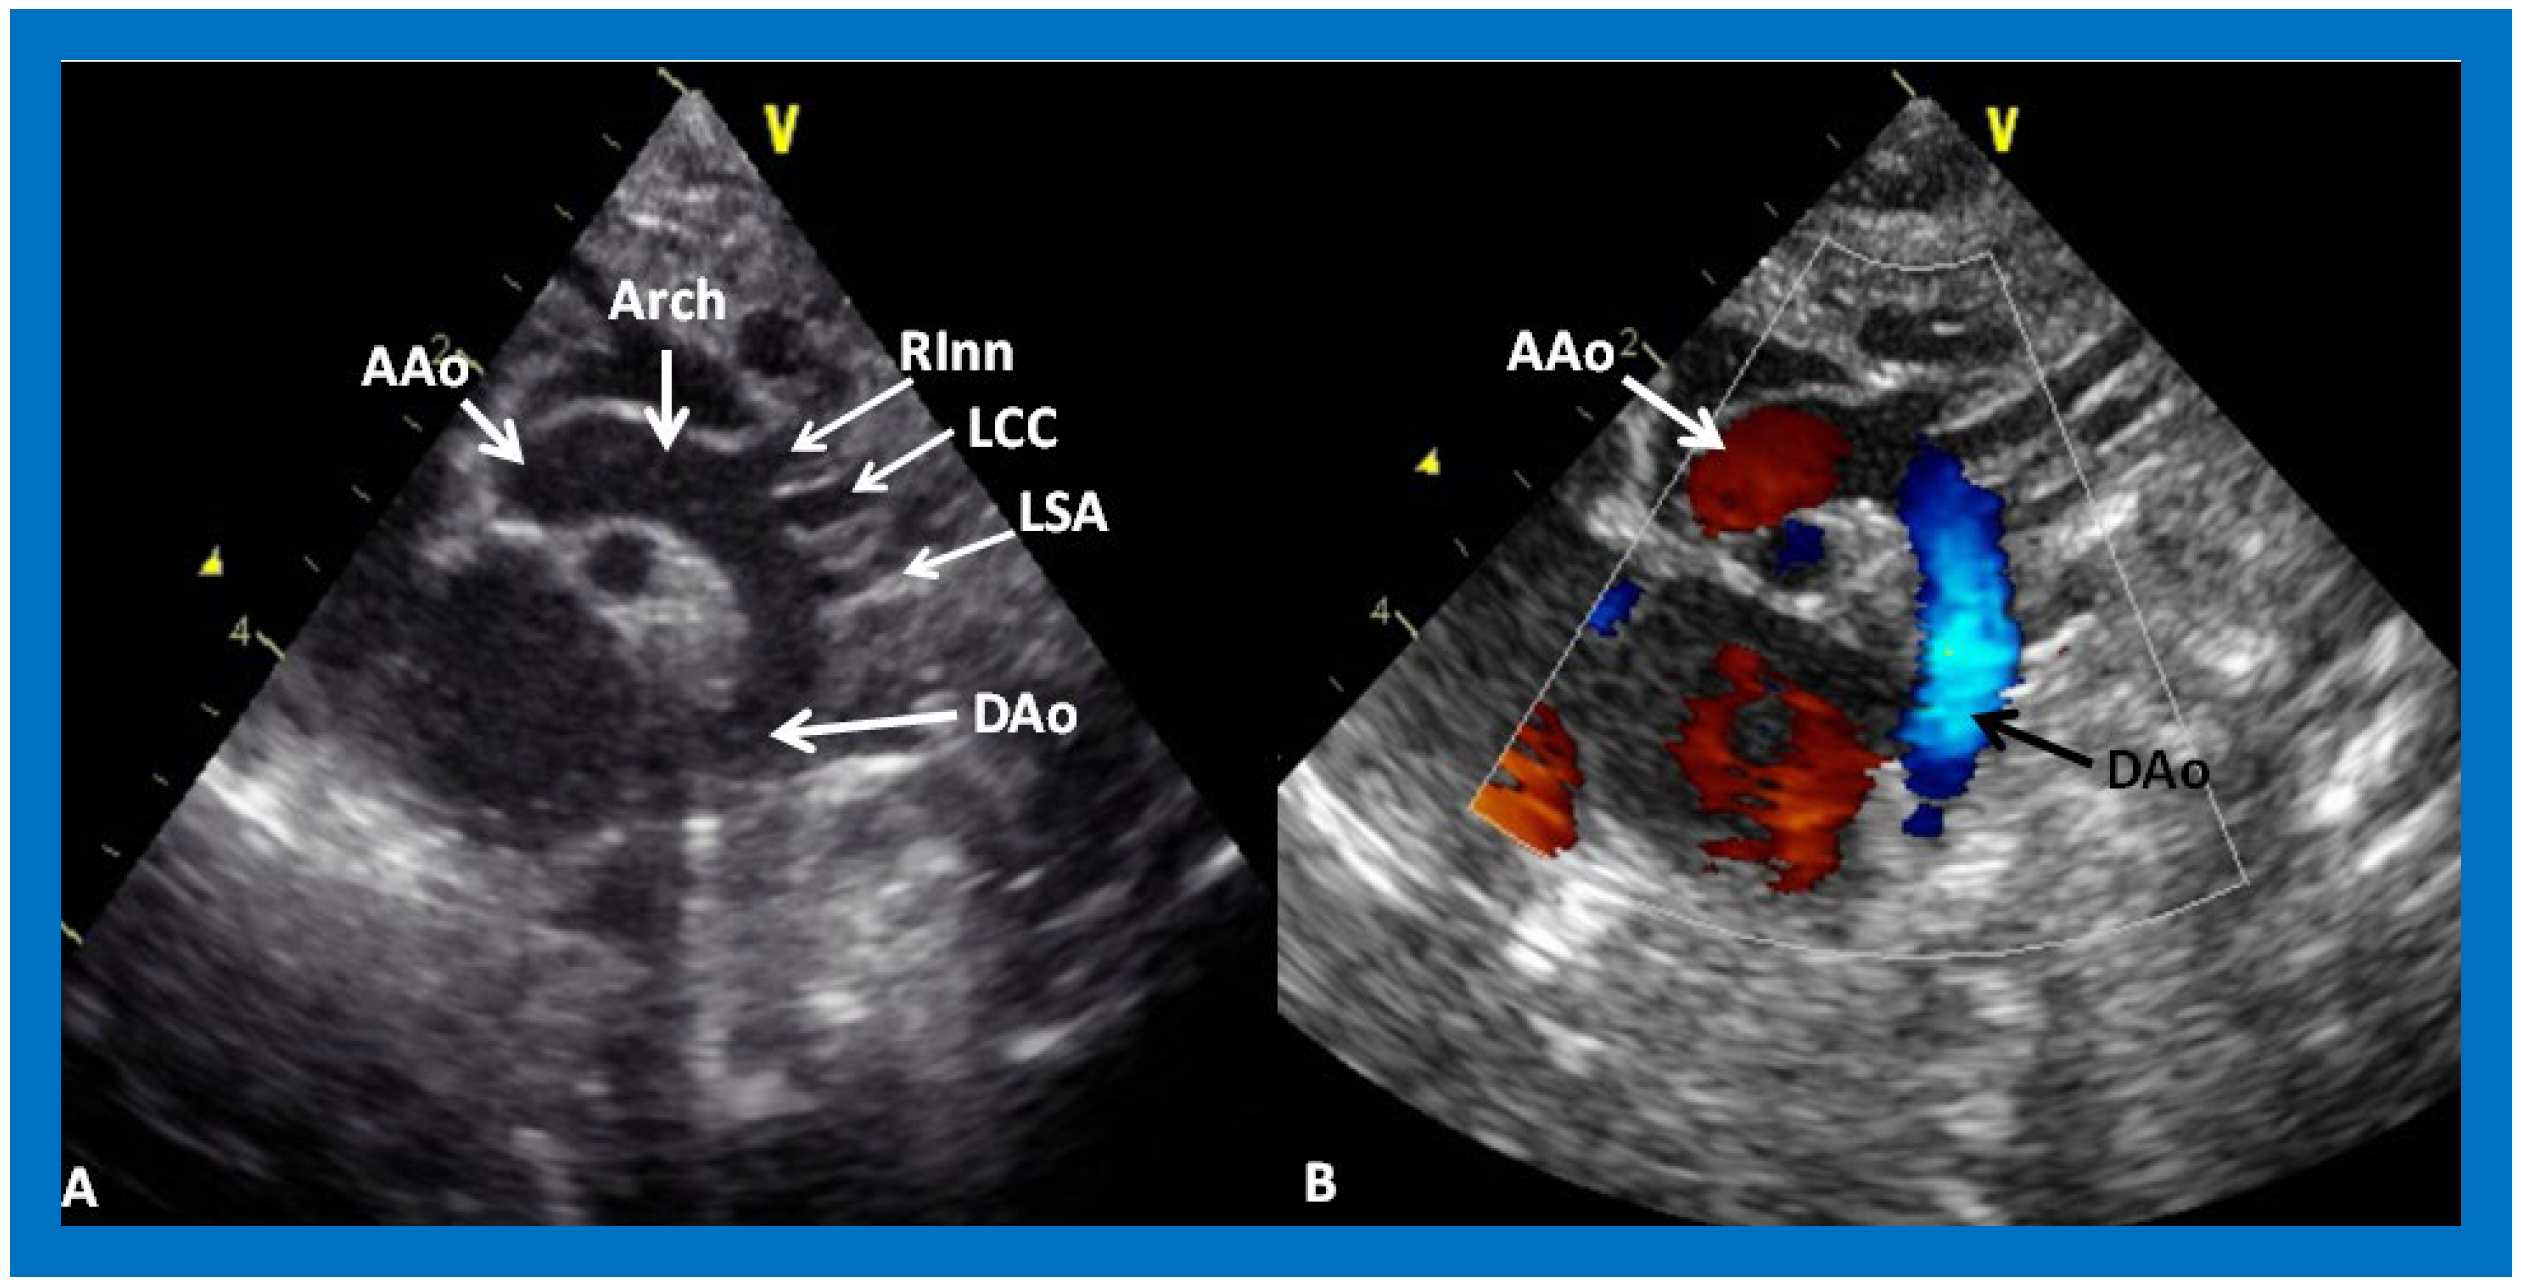
Figure 31.
(
A) Suprasternal notch view of a normal aortic arch (Arch) demonstrating the ascending aorta (AAo), aortic arch (Arch) and descending aorta (DAo). Note the origin of the right innominate (RInn), left common carotid (LCC) and left subclavian (LSA) arteries, arising from the aortic arch. (
B) The same view with color Doppler imaging, showing red flow in the AAo and blue flow in the DAo. Reproduced from Reference [
53].
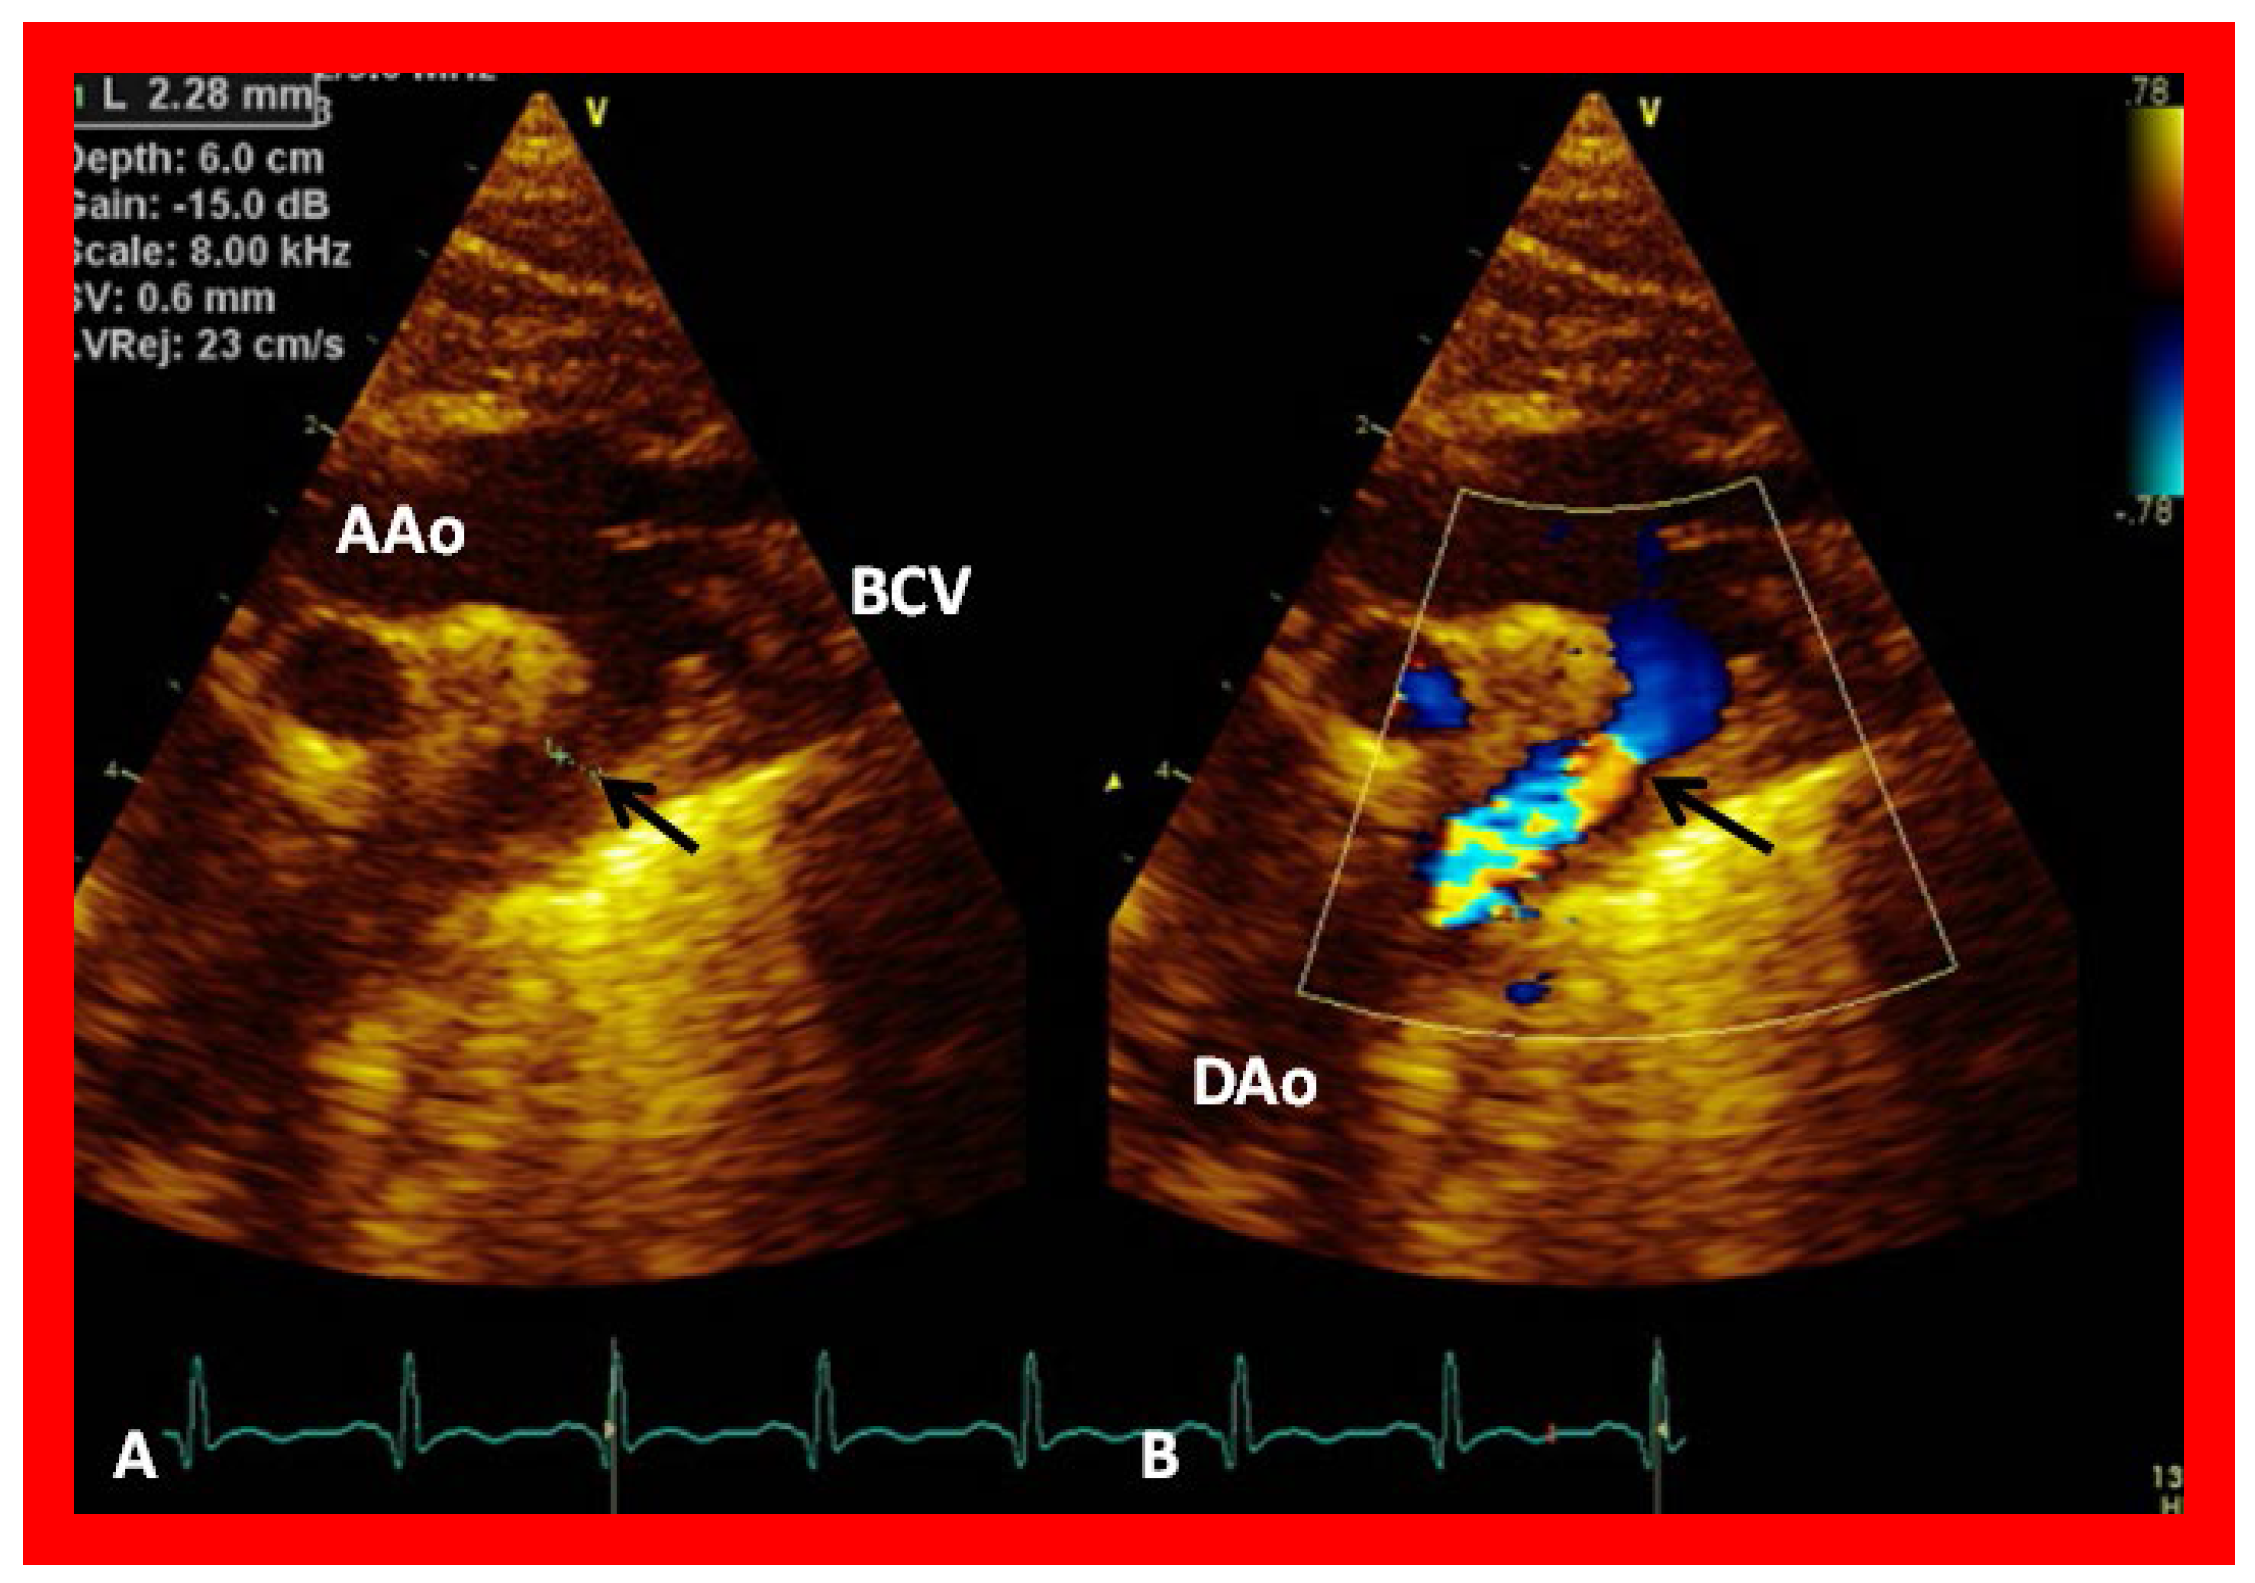
Figure 32.
(
A) Suprasternal notch view of the aortic arch (Arch) in a patient with aortic coarctation (arrow) in 2D (
A) and color flow mapping (
B), demonstrating turbulence at the site of coarctation (arrow). AAo, ascending aorta; BCV, brachiocephalic vessels; DAo, descending aorta. Reproduced from Reference [
53].
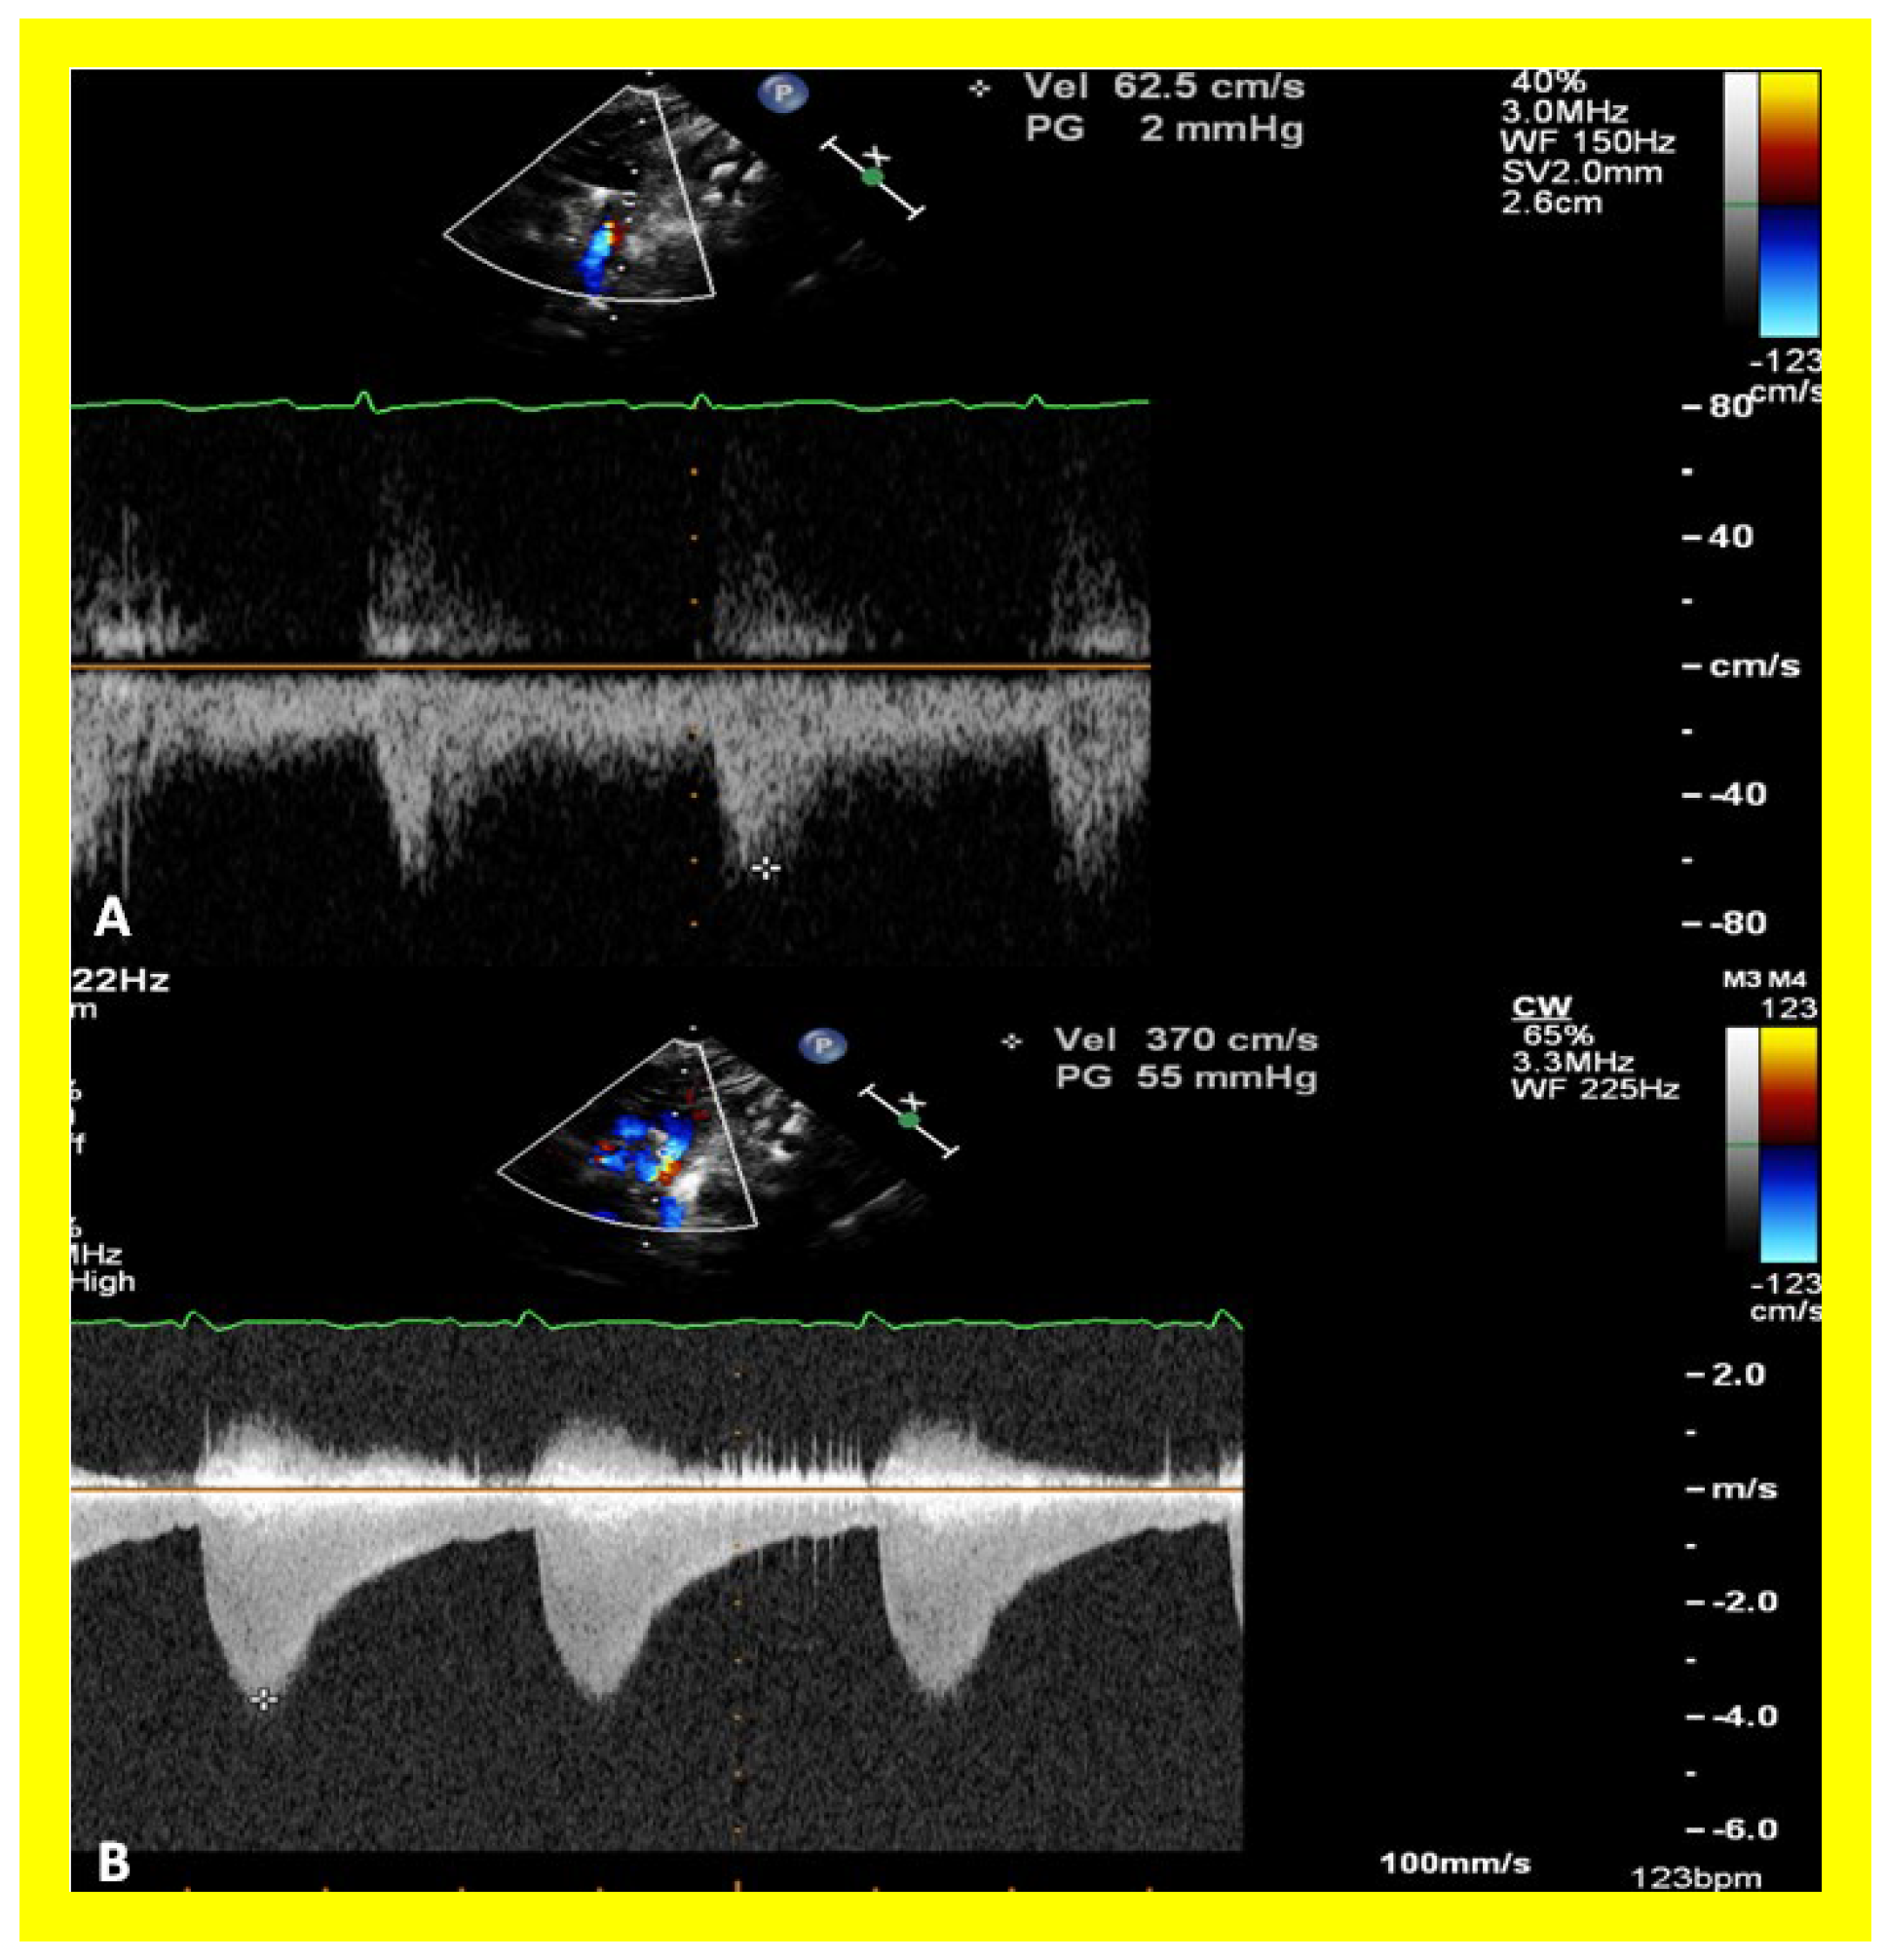
Figure 33.
A Doppler interrogation of the aortic arch reveals a jump in the peak flow velocity from the proximal segment (
A) to the segment distal to the coarctation (
B). Continuous wave Doppler interrogation across the stenotic segment (
B) shows high velocity (~4 m/s) with diastolic extension of the Doppler flow signal, suggesting that the coarctation is severe. Reproduced from Reference [
53].
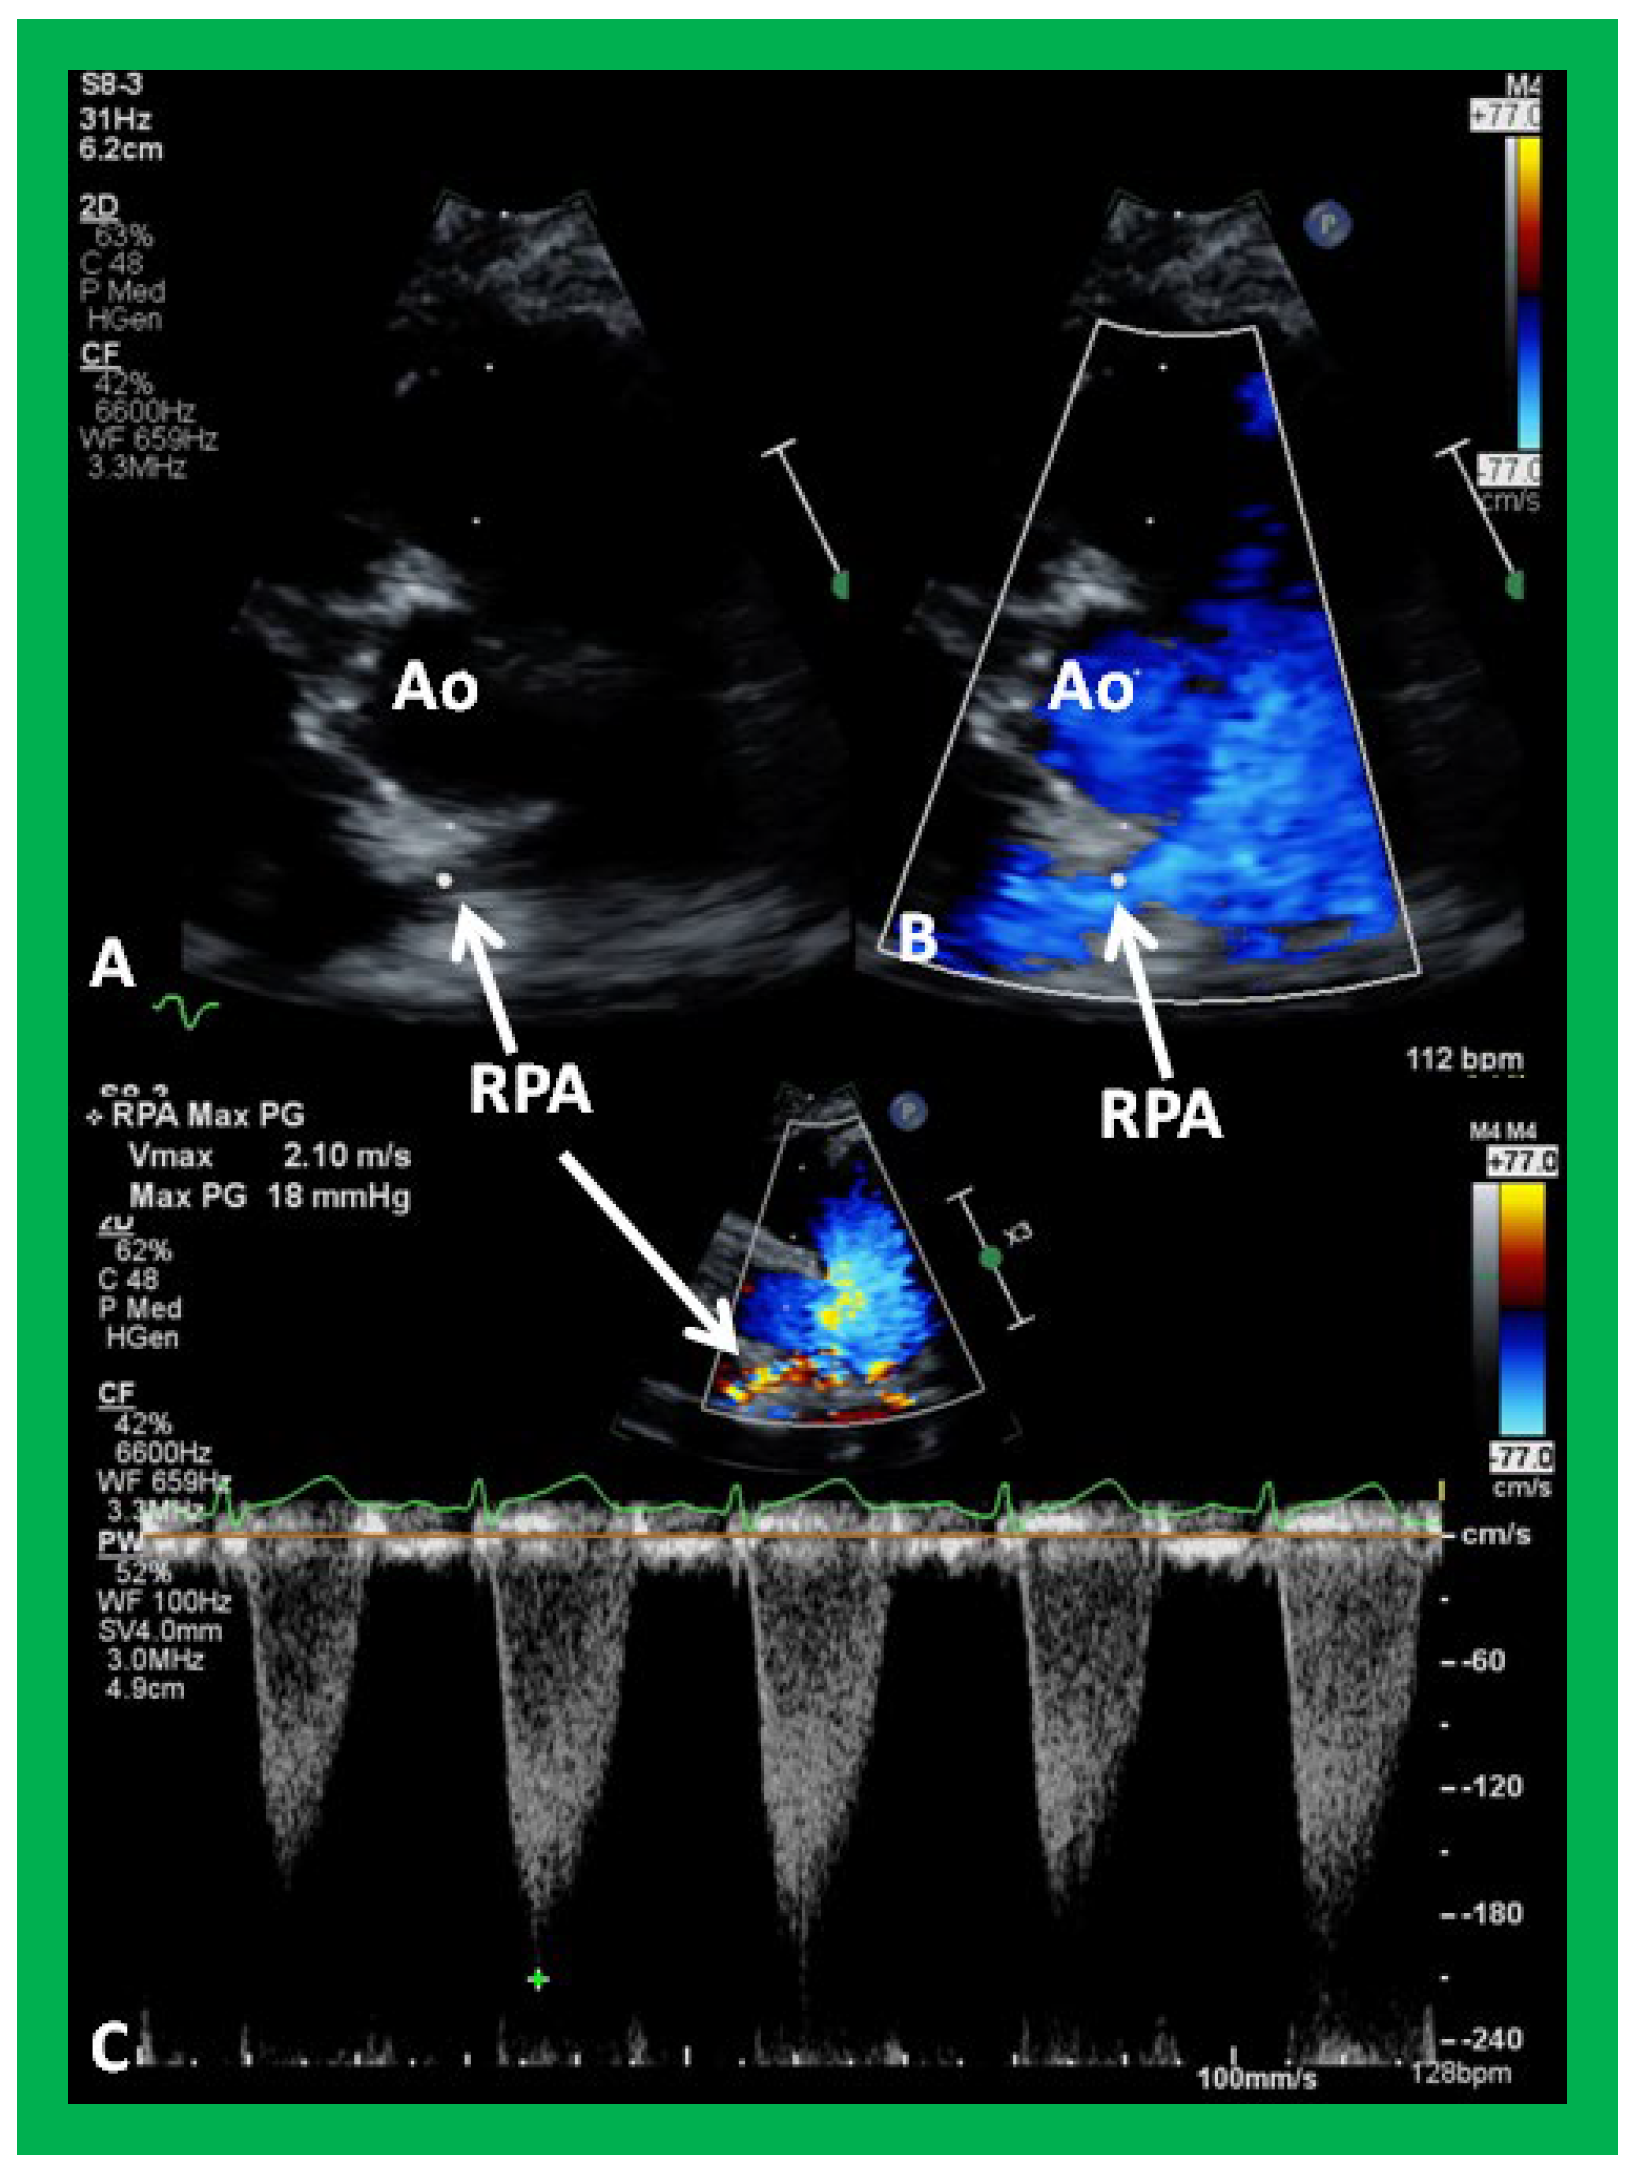
Figure 34.
Selected video frames from parasternal short axis view demonstrating stenosis of the right pulmonary artery (RPA) by two dimensional (A) and color (B) and pulsed (C) Doppler imaging. Doppler calculated gradient was 18 mmHg (C). Ao, aorta.
Figure 34.
Selected video frames from parasternal short axis view demonstrating stenosis of the right pulmonary artery (RPA) by two dimensional (A) and color (B) and pulsed (C) Doppler imaging. Doppler calculated gradient was 18 mmHg (C). Ao, aorta.
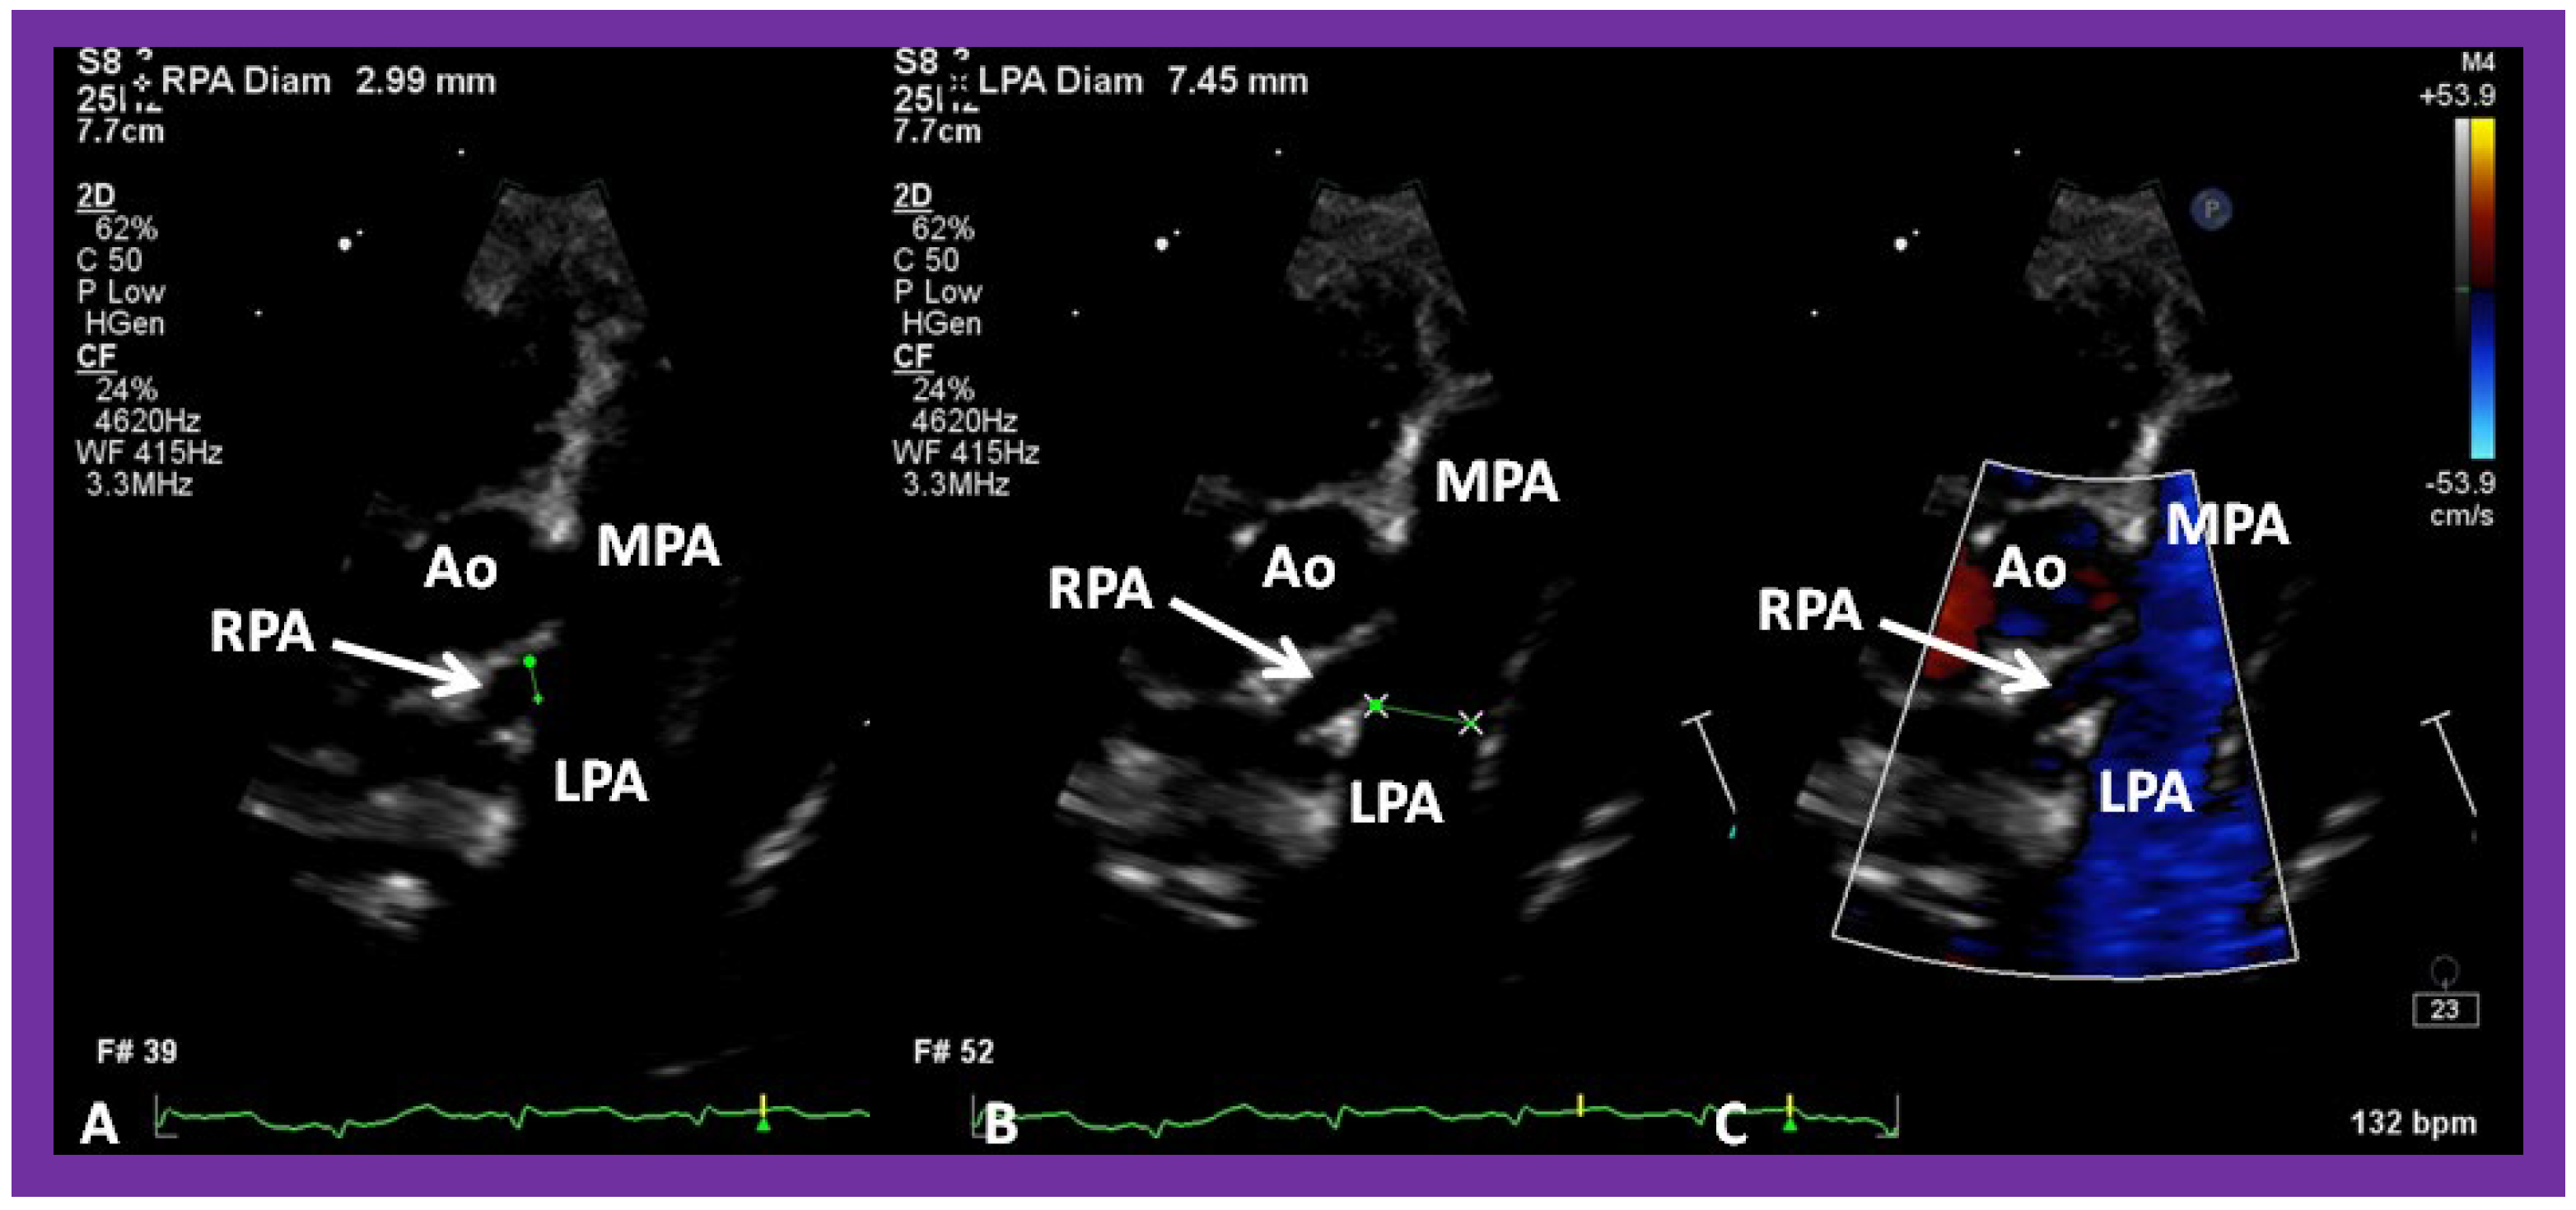
Figure 35.
Selected video frames from parasternal short axis view demonstrating hypoplsia of the right pulmonary artery (RPA) in two dimensional (A,B) and color flow (C) images. The measurements of the RPA (A) and left pulmonary artery (LPA) (B) are shown. Ao, aorta; MPA, main pulmonary artery.
Figure 35.
Selected video frames from parasternal short axis view demonstrating hypoplsia of the right pulmonary artery (RPA) in two dimensional (A,B) and color flow (C) images. The measurements of the RPA (A) and left pulmonary artery (LPA) (B) are shown. Ao, aorta; MPA, main pulmonary artery.
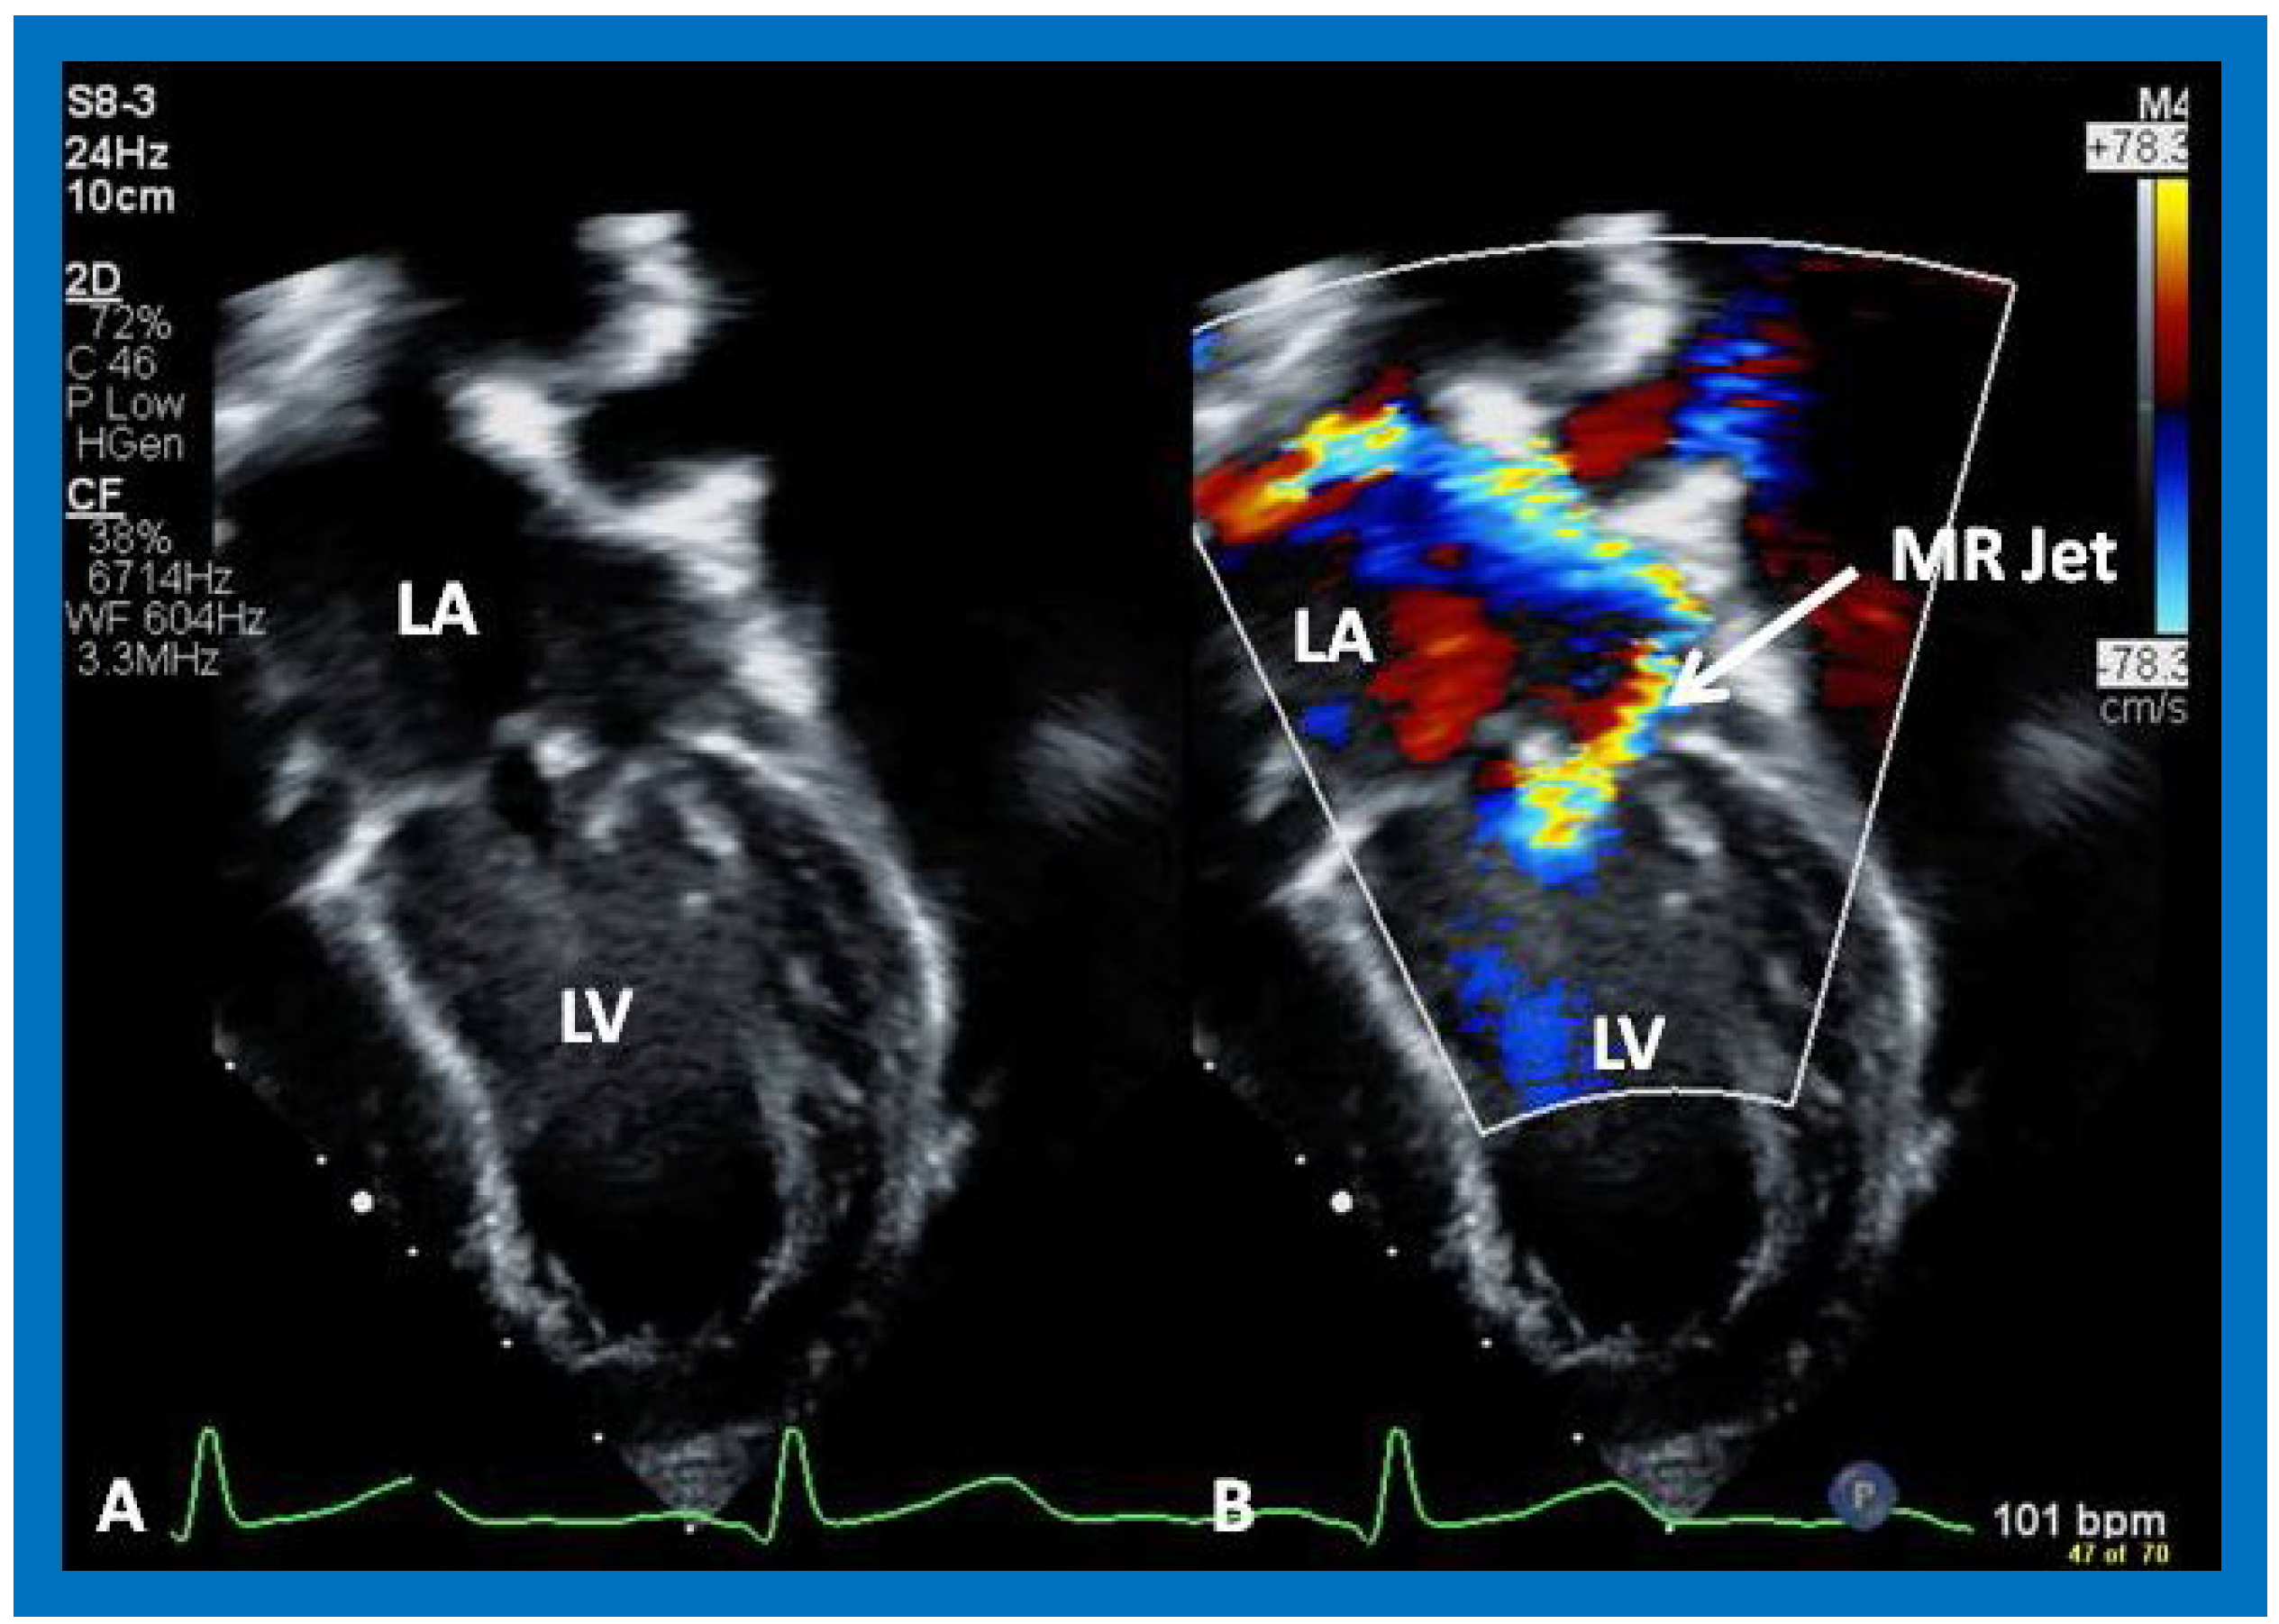
Figure 36.
Selected video frames from apical four chamber view demonstrating dilated left atrium (LA) and left ventricle (LV) (A,B). Note the mitral insufficiency jet (MR Jet) in (B).
Figure 36.
Selected video frames from apical four chamber view demonstrating dilated left atrium (LA) and left ventricle (LV) (A,B). Note the mitral insufficiency jet (MR Jet) in (B).
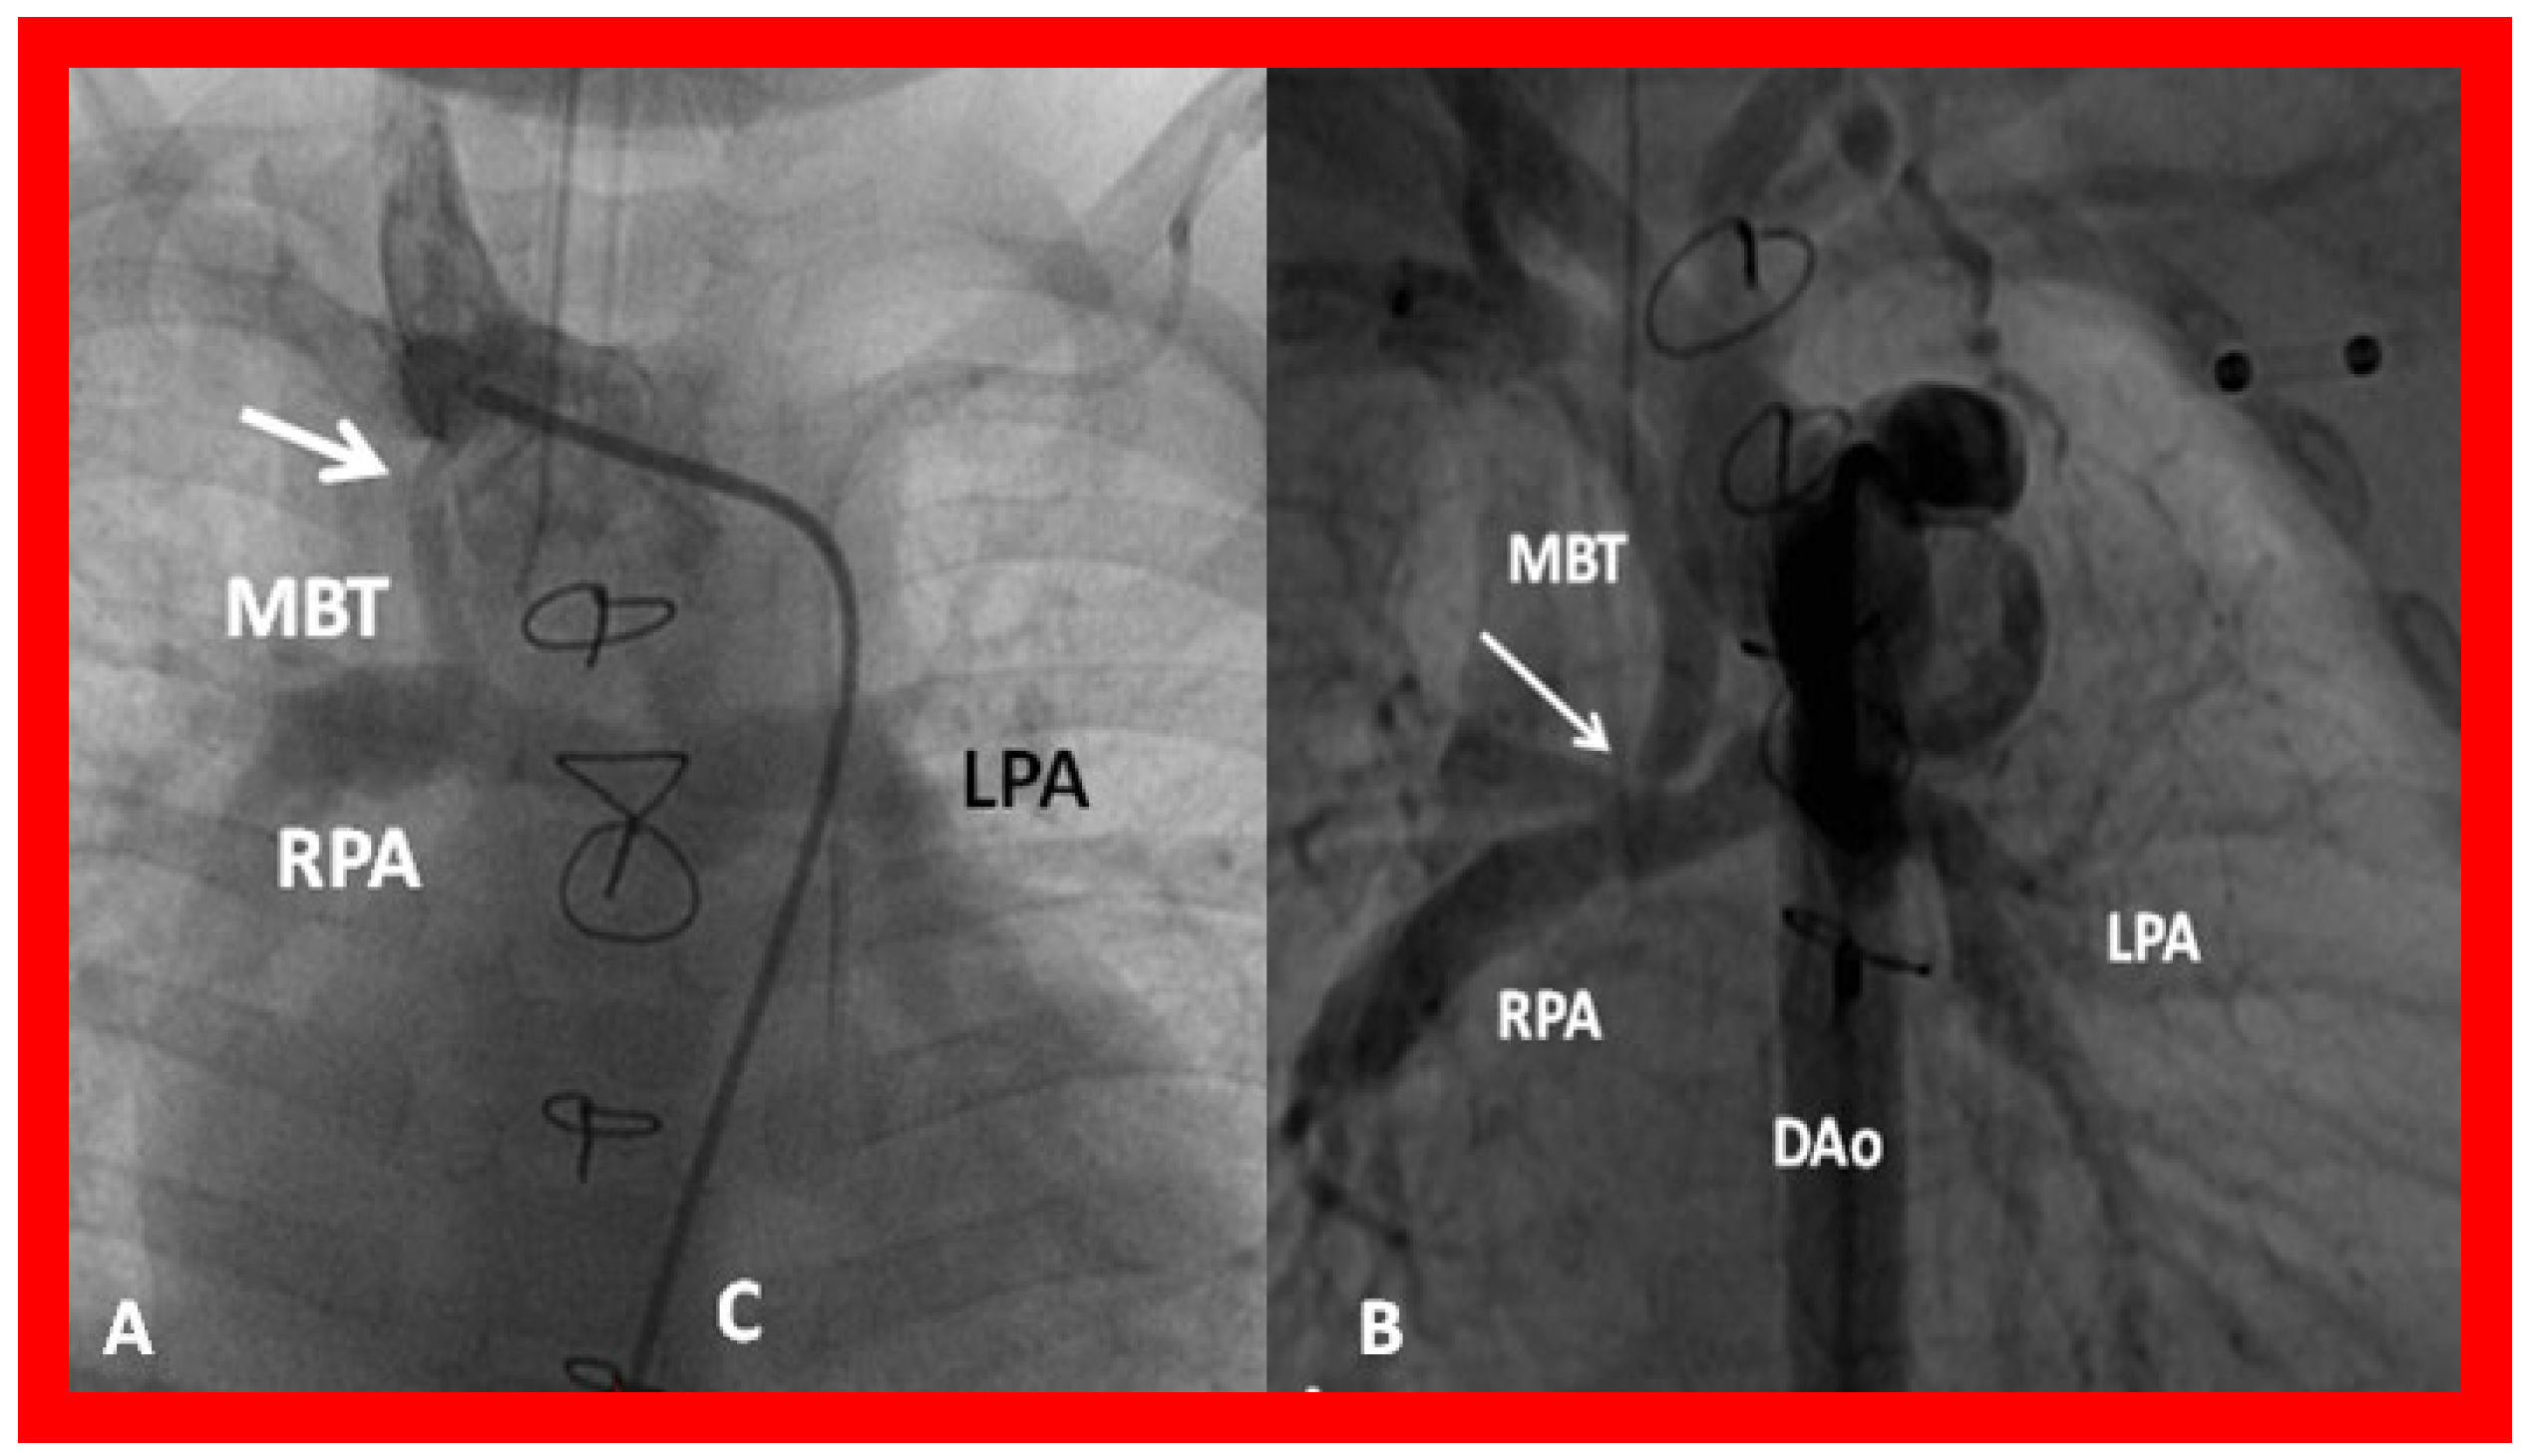
Figure 37.
(A) Selected cine frame in a postero–anterior view demonstrating narrowing (arrow) of a modified Blalock–Taussig (MBT) shunt at its junction with the right innominate artery. (B) Similar angiographic frame from a different patient showing narrowing of the MBT (arrow) at its entry into the right pulmonary artery (RPA). C, catheter; DAo, descending aorta; LPA, left pulmonary artery.
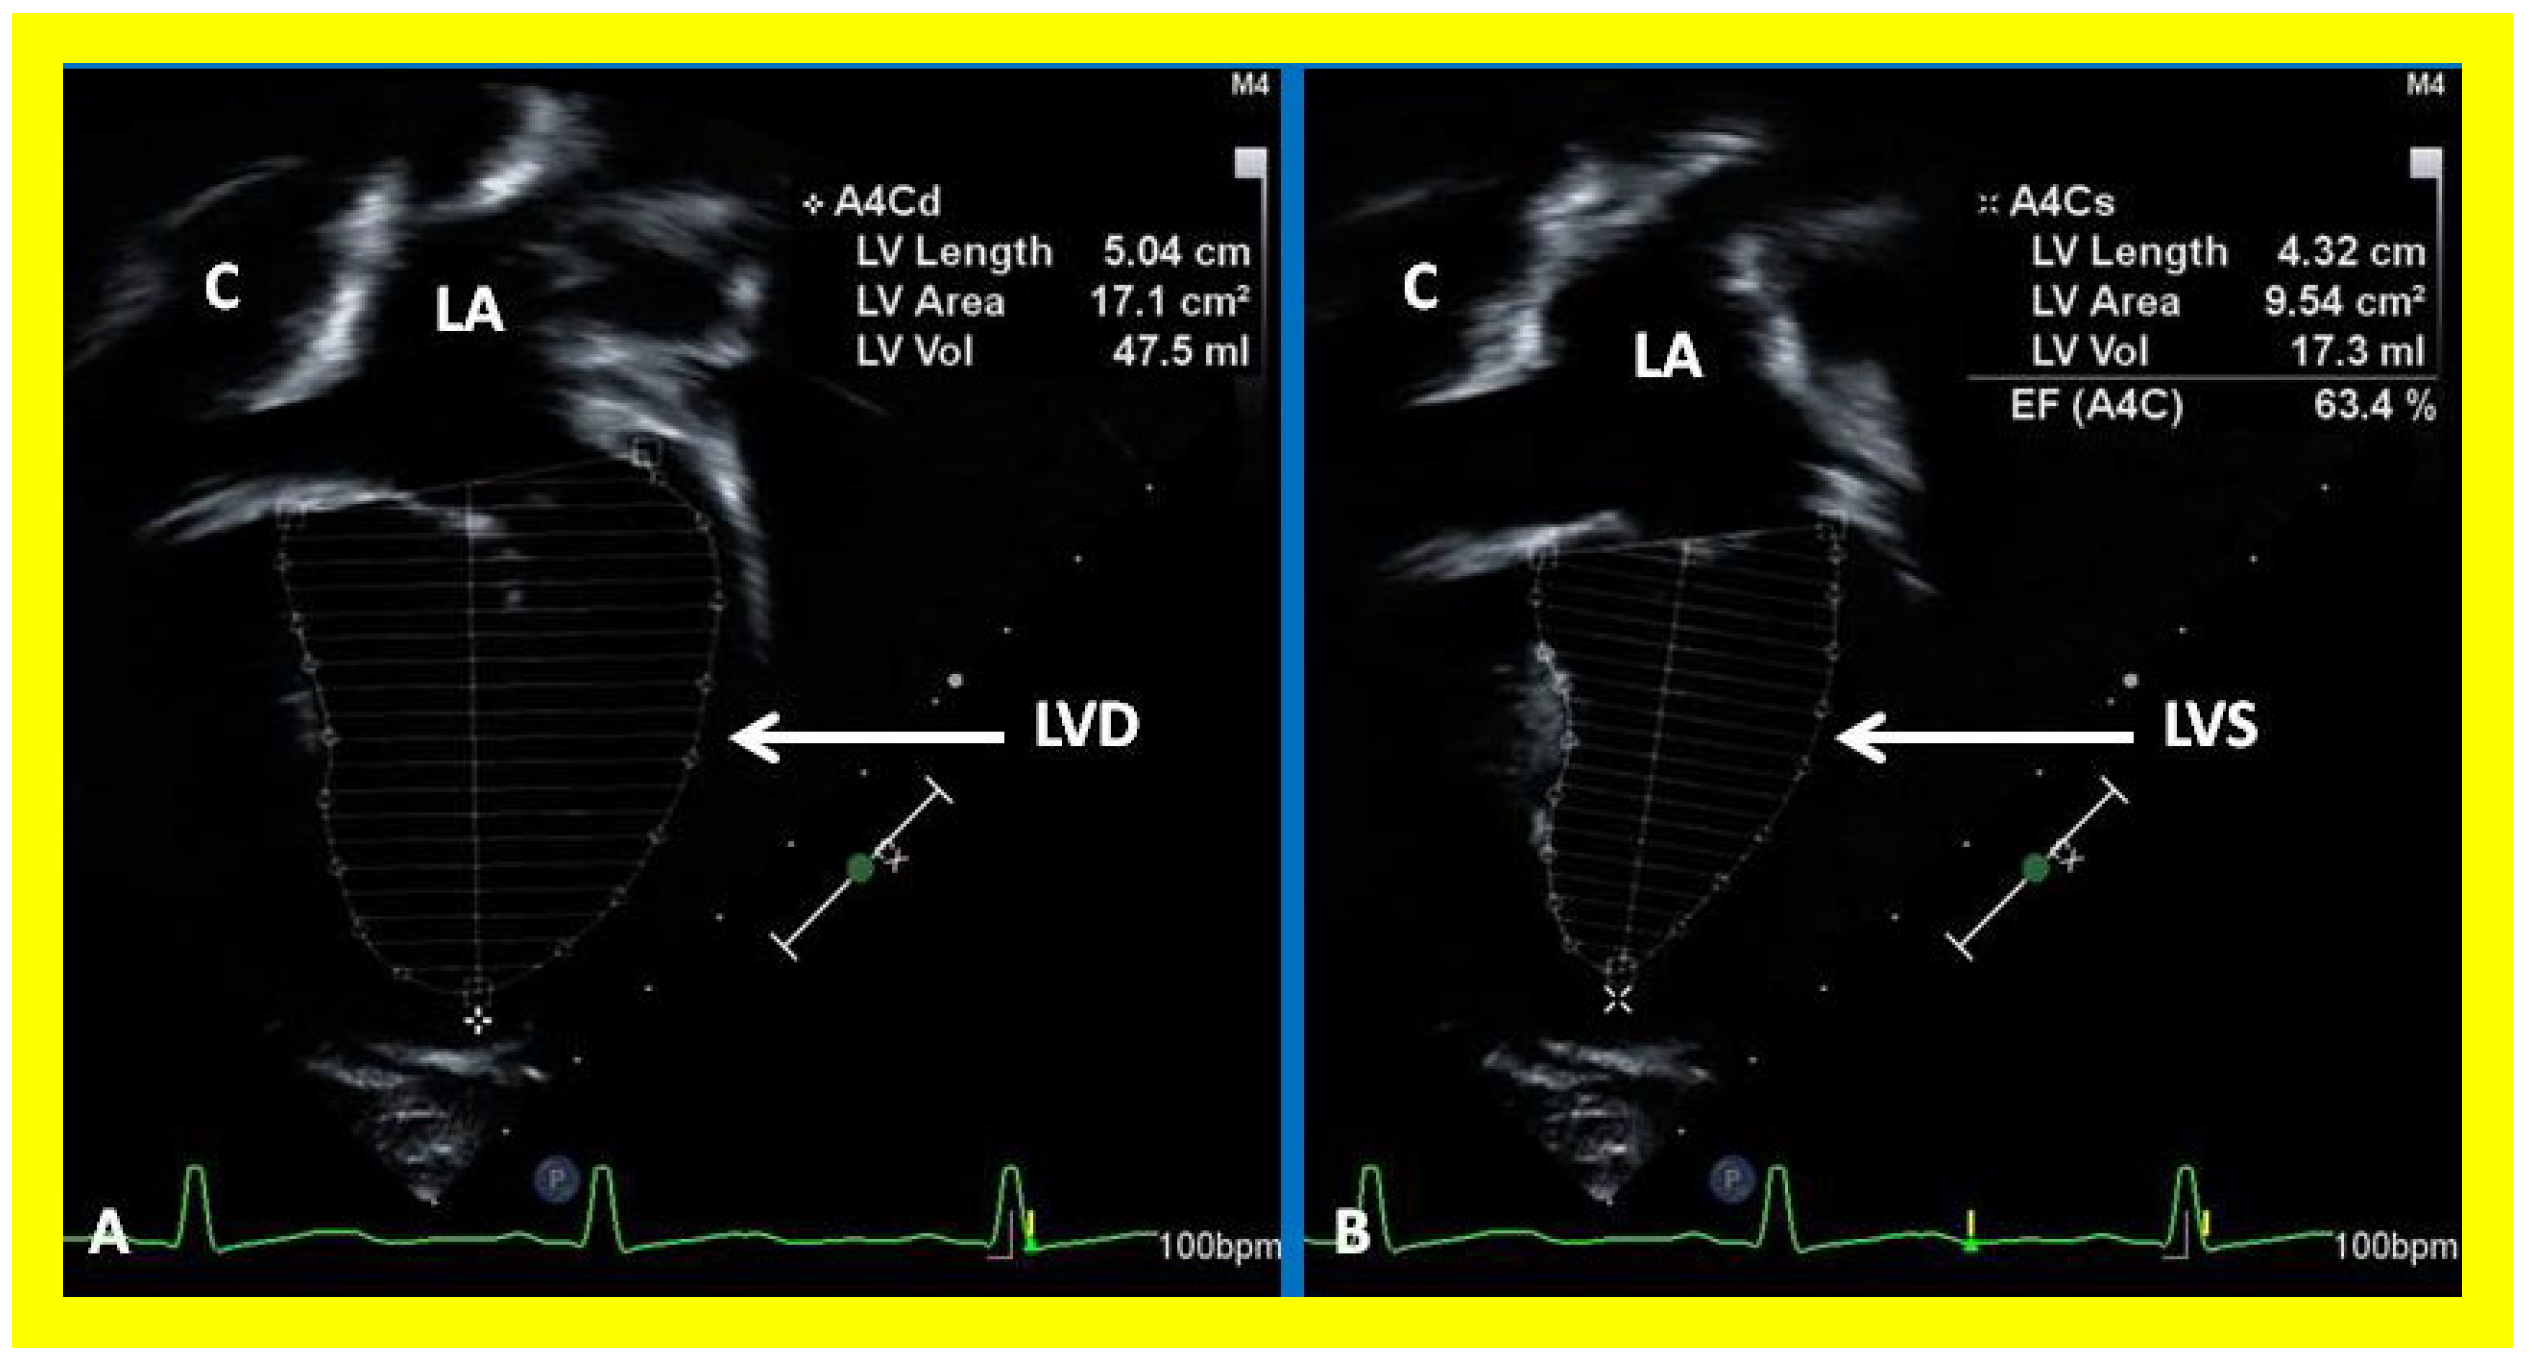
Figure 38.
Selected video frames showing left ventricle (LV) in diastole (LVD) (A) and in systole (LVS) (B) demonstrating normal ejection fraction (EF) of 63.4%. C, conduit; LA, left atrium.
Figure 38.
Selected video frames showing left ventricle (LV) in diastole (LVD) (A) and in systole (LVS) (B) demonstrating normal ejection fraction (EF) of 63.4%. C, conduit; LA, left atrium.
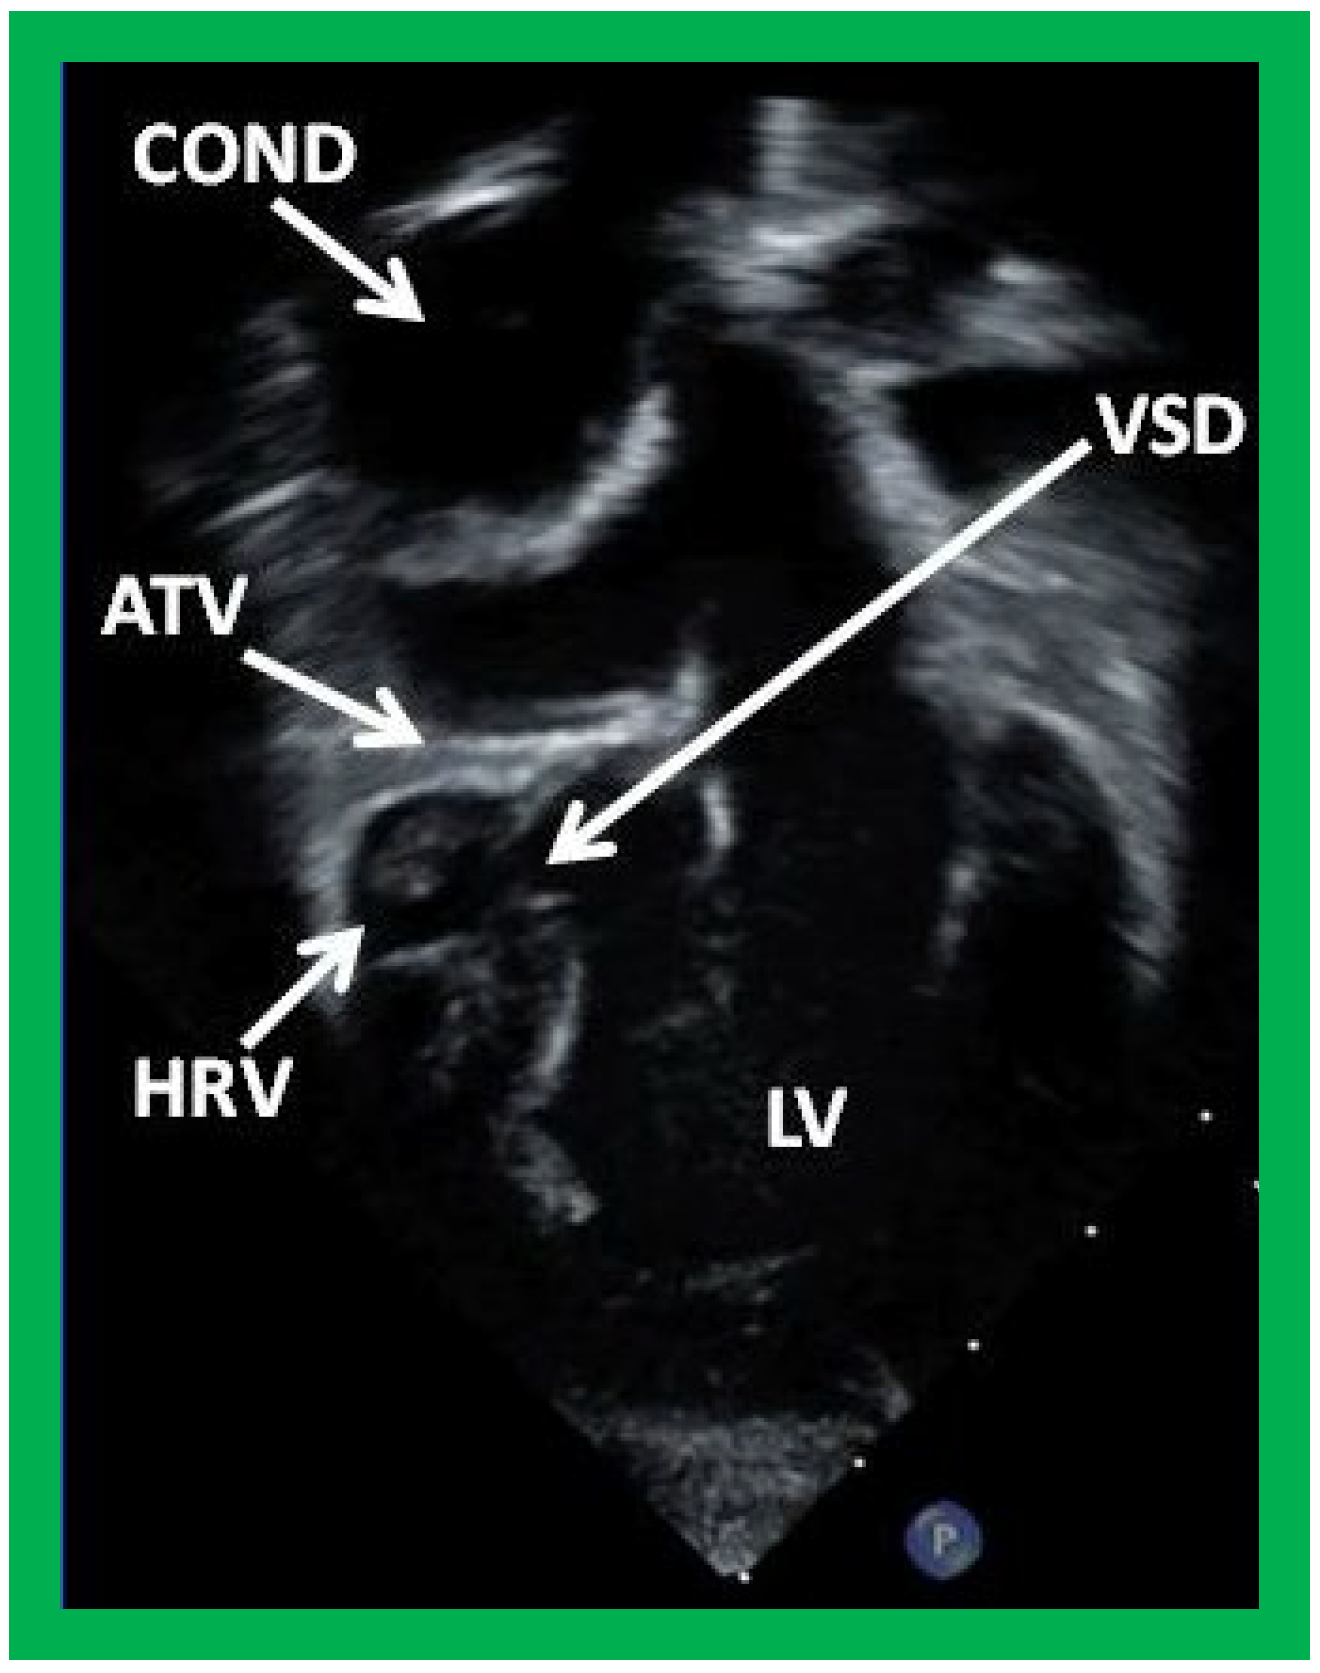
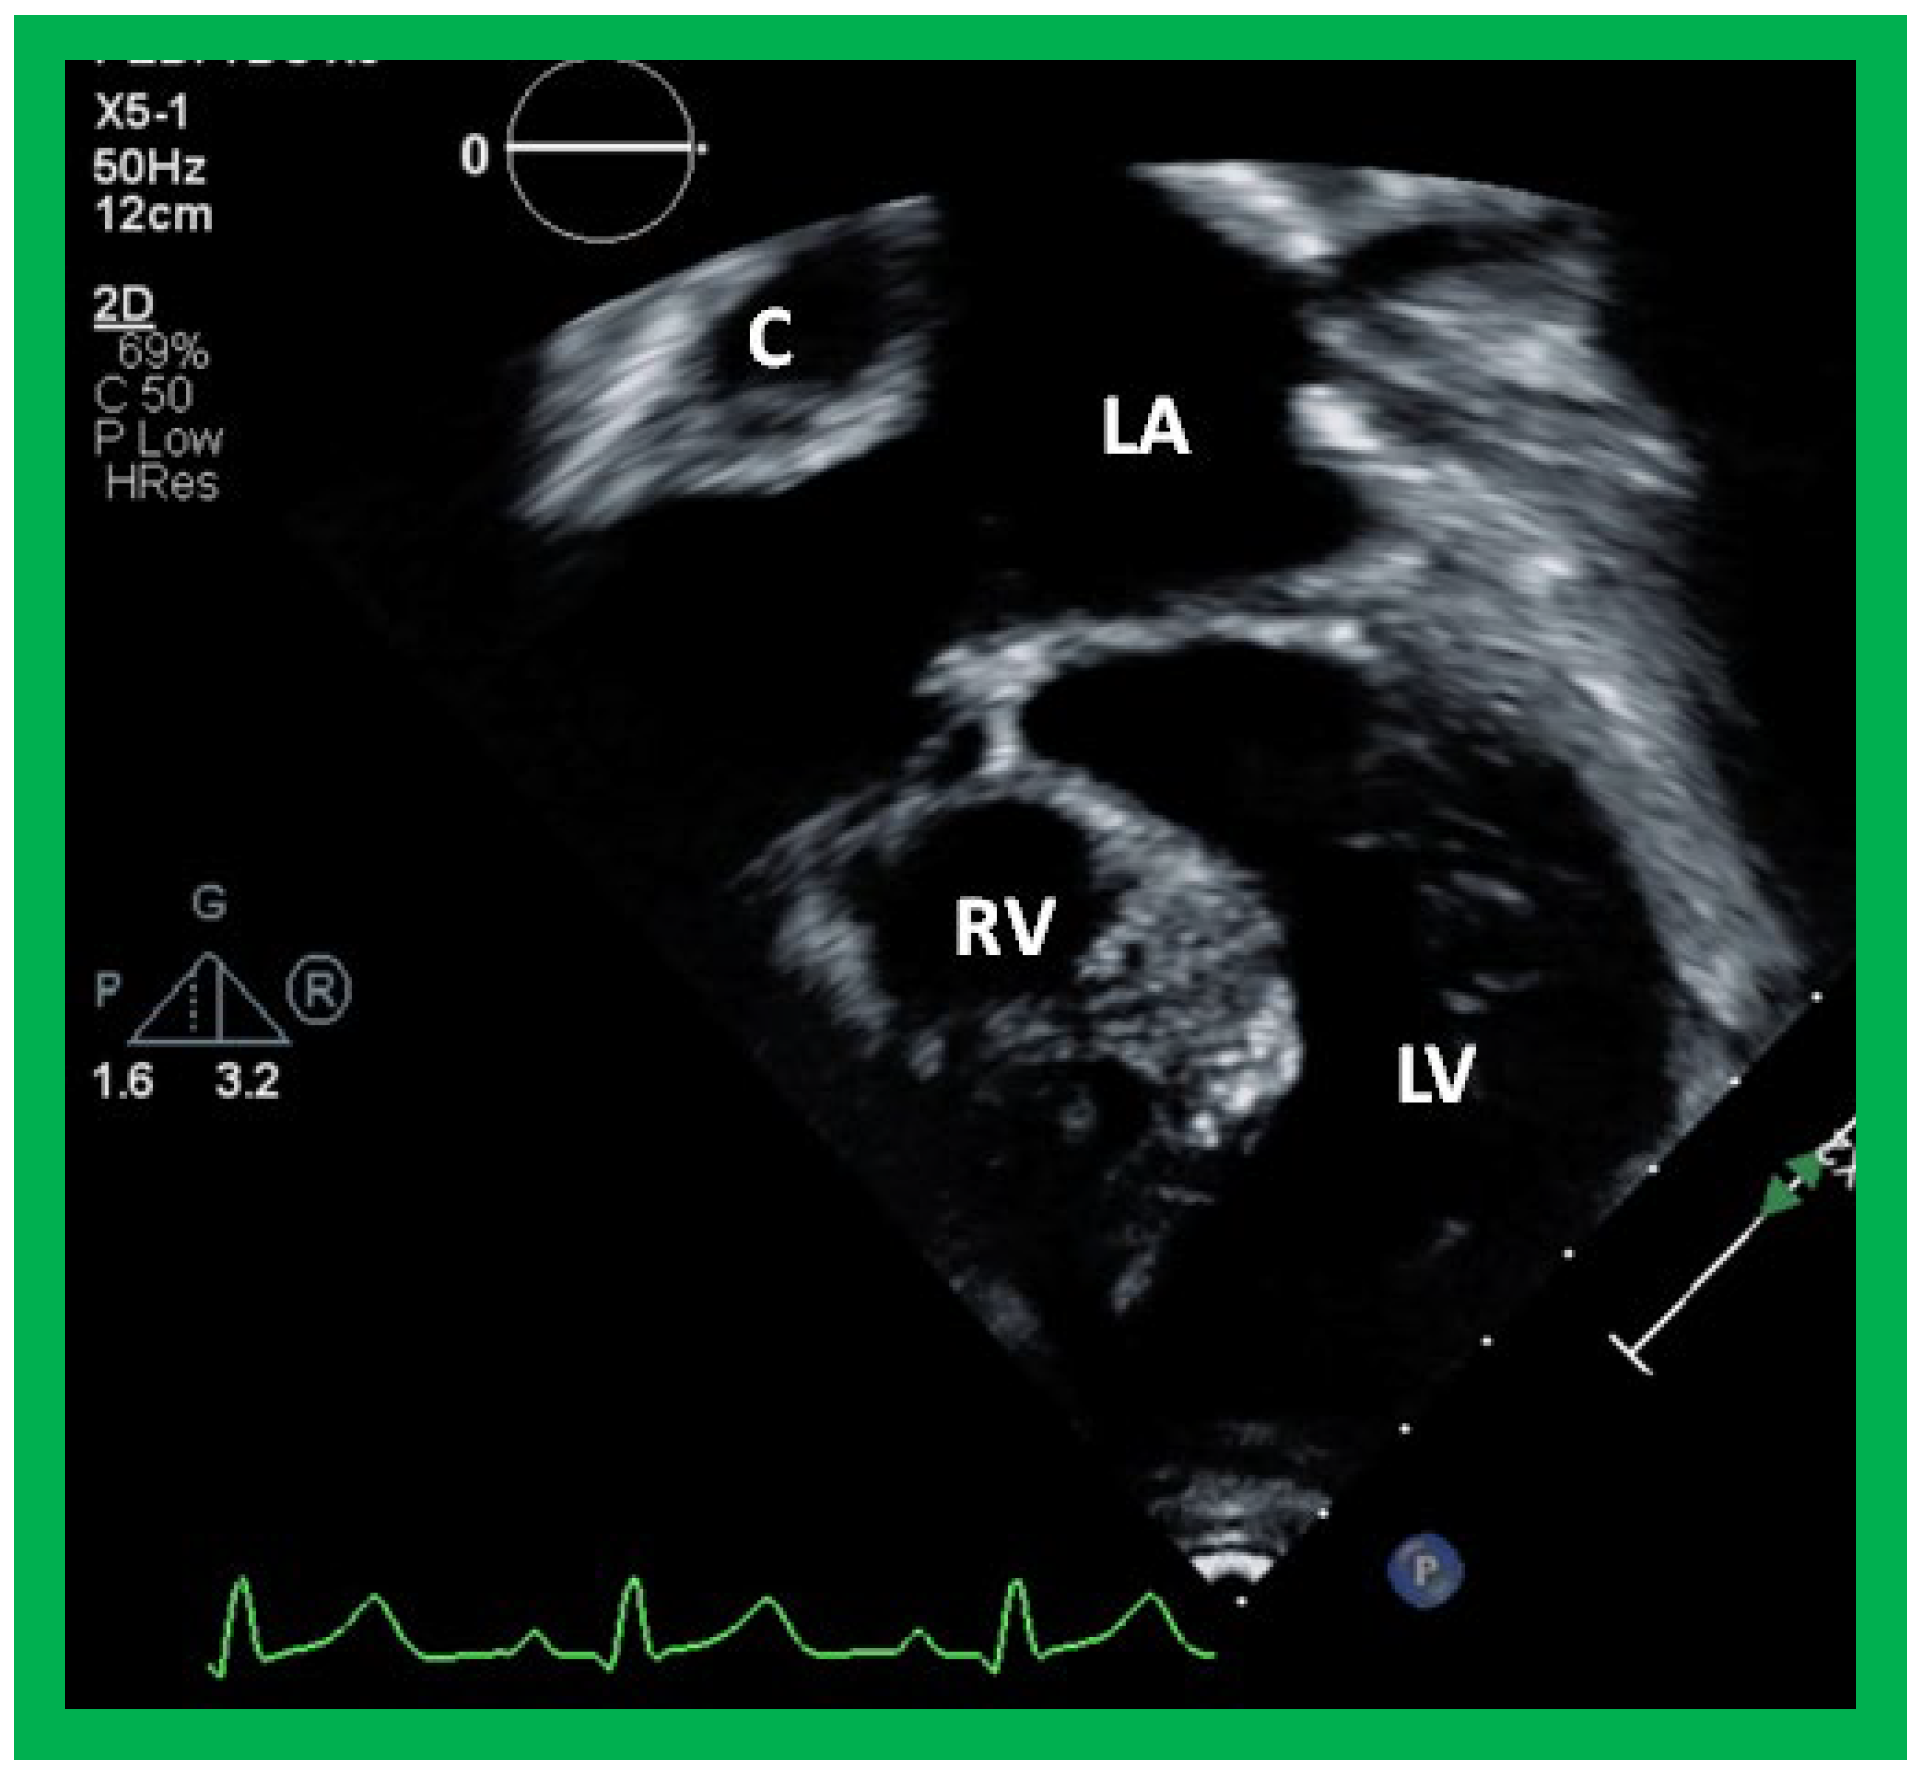
Figure 39.
Selected video frame from an apical four-chamber view demonstrating the left ventricle (LV), hypoplastic right ventricle (HRV) with an atretic tricuspid valve (ATV) in a patient who had Fontan procedure. Cross-sectional view of the conduit (COND) is also shown. Note small ventricular septal defect (VSD) (long arrow).
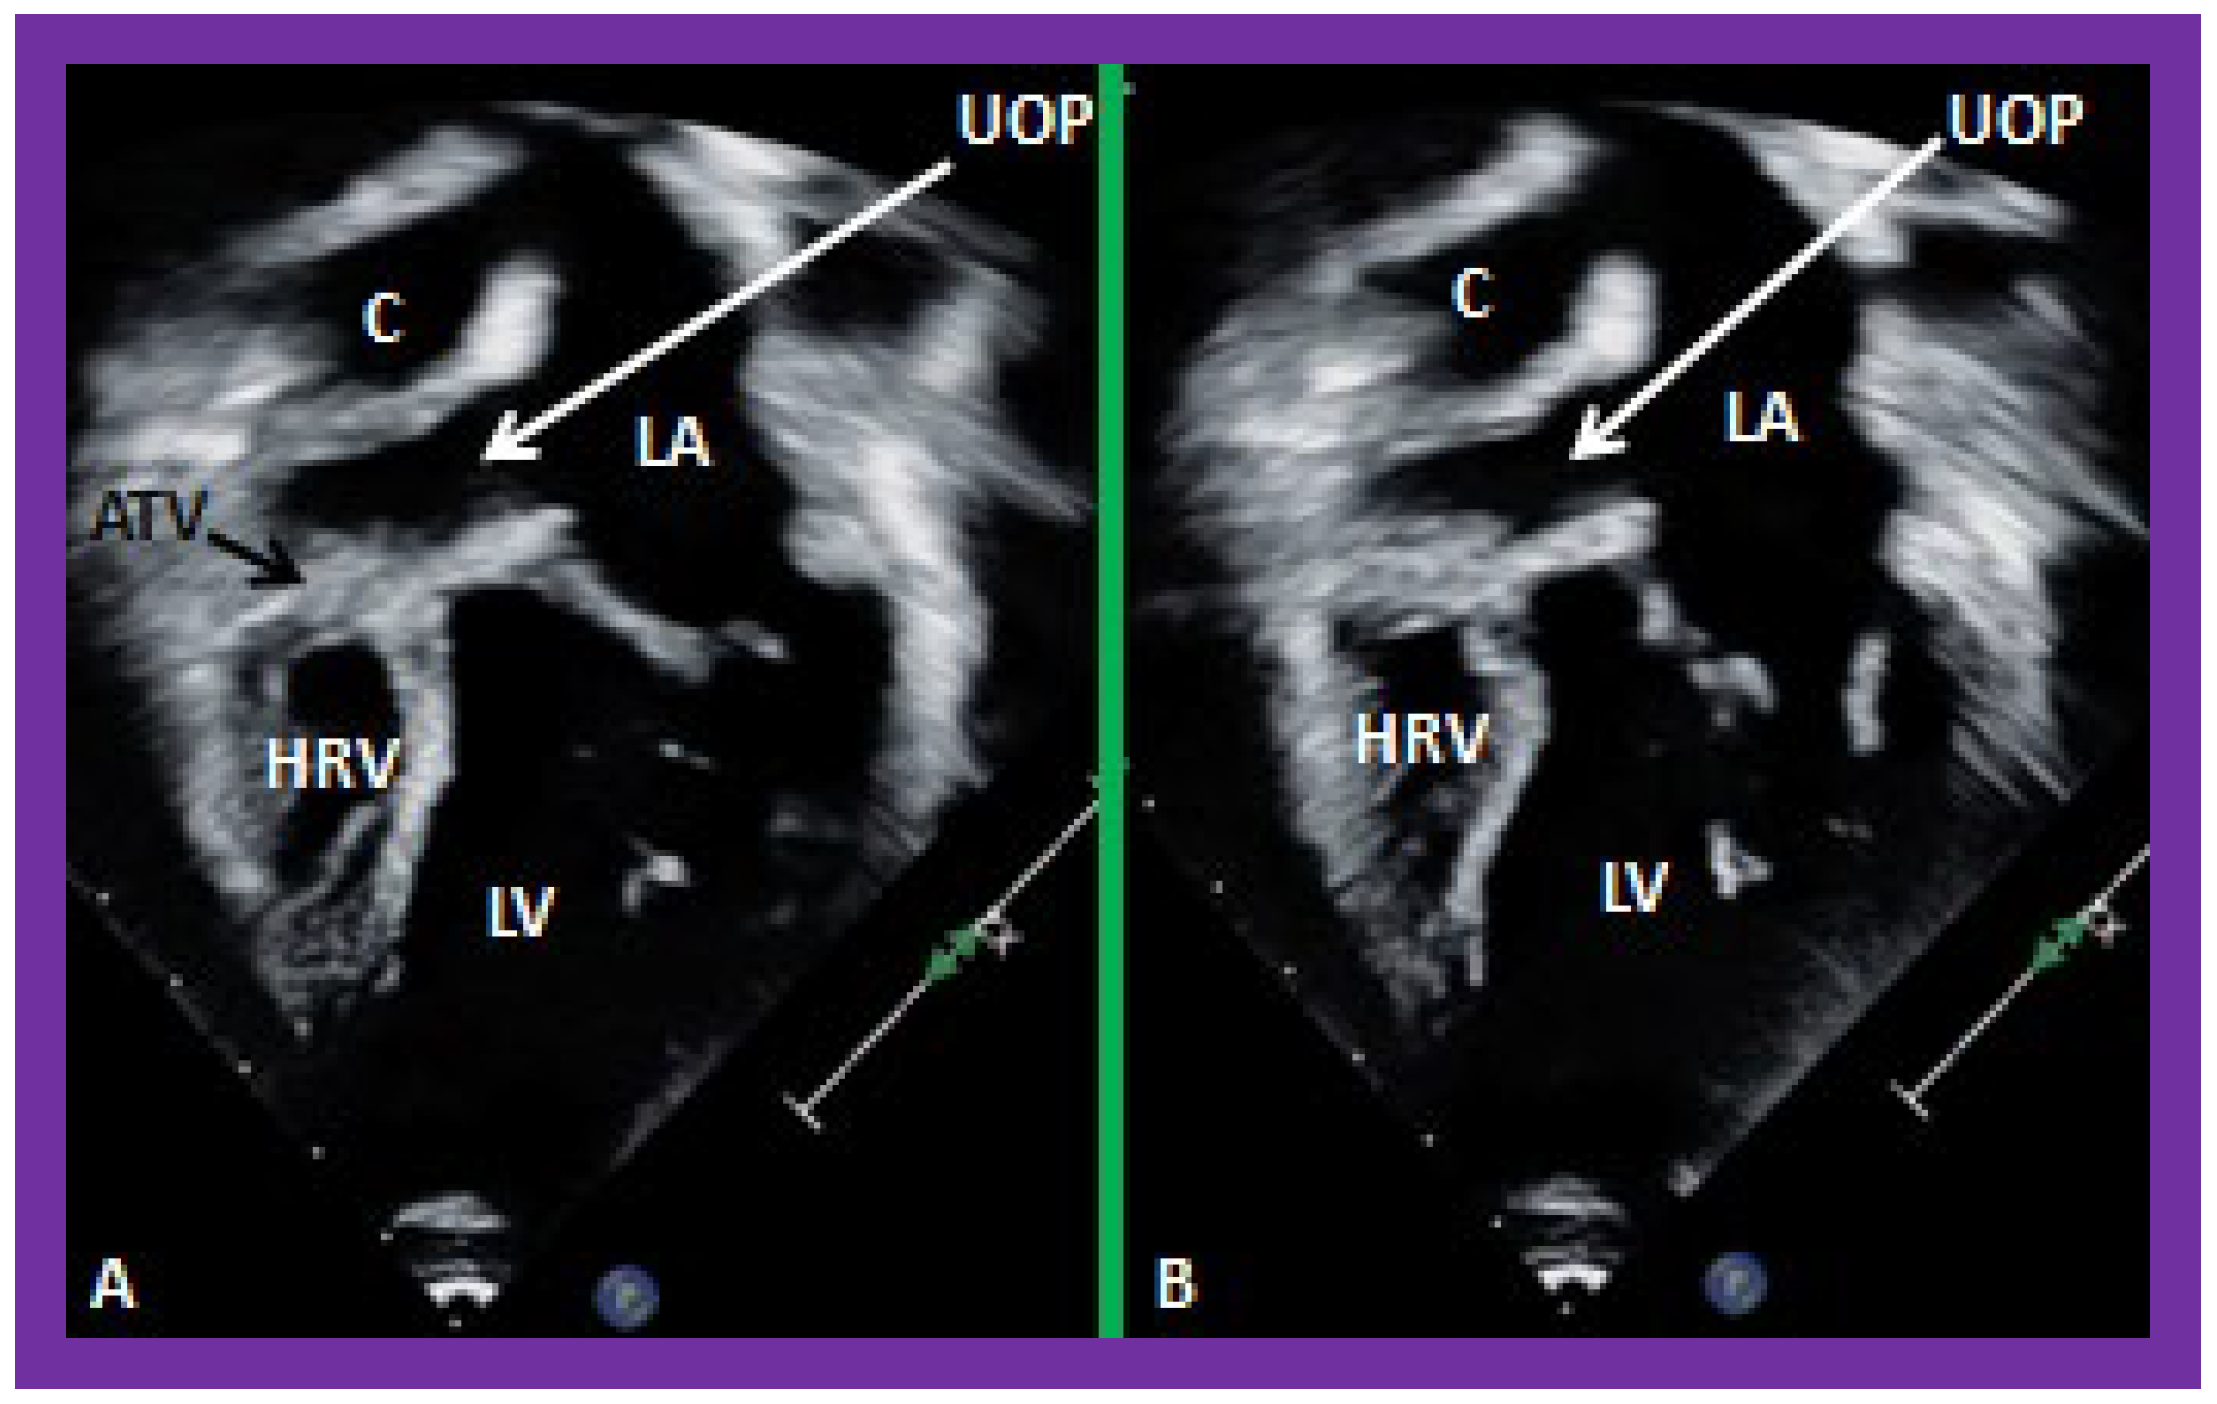
Figure 40.
Selected video frames from apical four-chamber views demonstrating unobstructed pathway (UOP) (long arrow) between the right and left (LA) atria; the mitral valve is closed in (A) while it is open in (B). ATV, atretic tricuspid valve; C, conduit; HRV, hypoplastic right ventricle; LV, left ventricle.
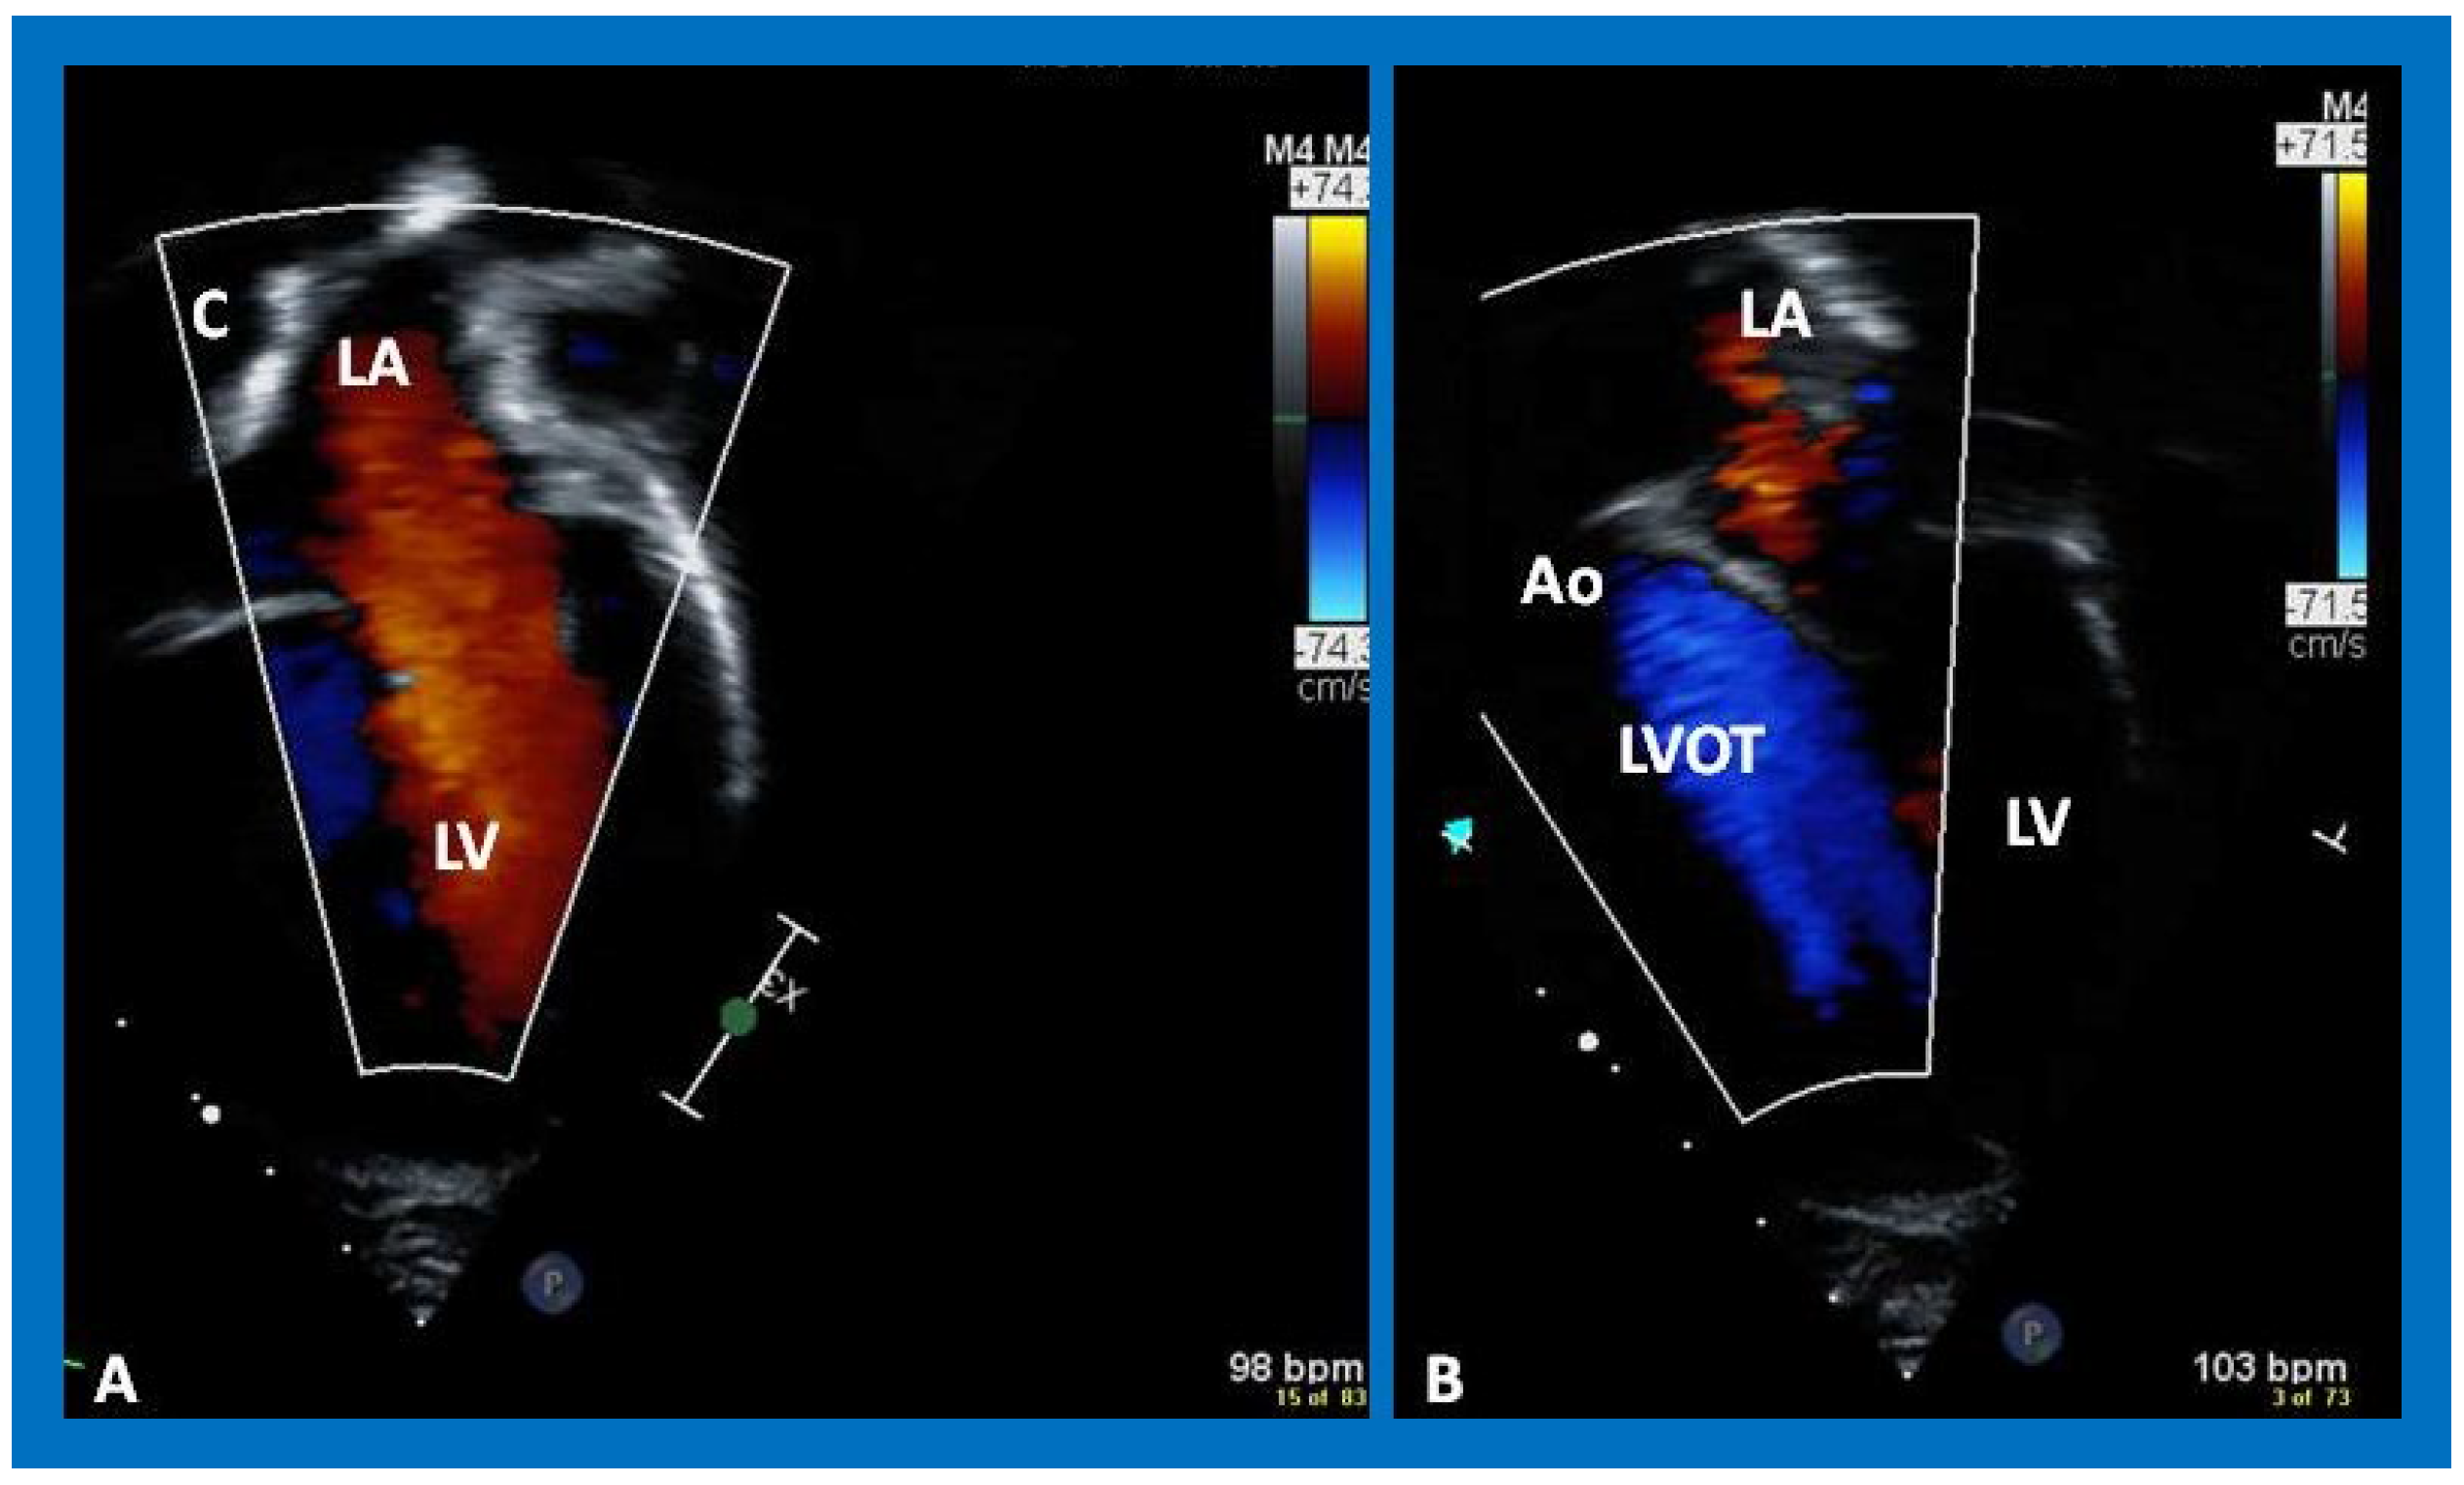
Figure 41.
Selected video frames from an apical views demonstrating laminar flow from the left atrium (LA) to the left ventricle (LV) (A) and from the LV to aorta (Ao) (B). Note laminar flow in the LV outflow tract (LVOT) (B). Medial portion of the conduit (C) is seen in (A).
Figure 41.
Selected video frames from an apical views demonstrating laminar flow from the left atrium (LA) to the left ventricle (LV) (A) and from the LV to aorta (Ao) (B). Note laminar flow in the LV outflow tract (LVOT) (B). Medial portion of the conduit (C) is seen in (A).
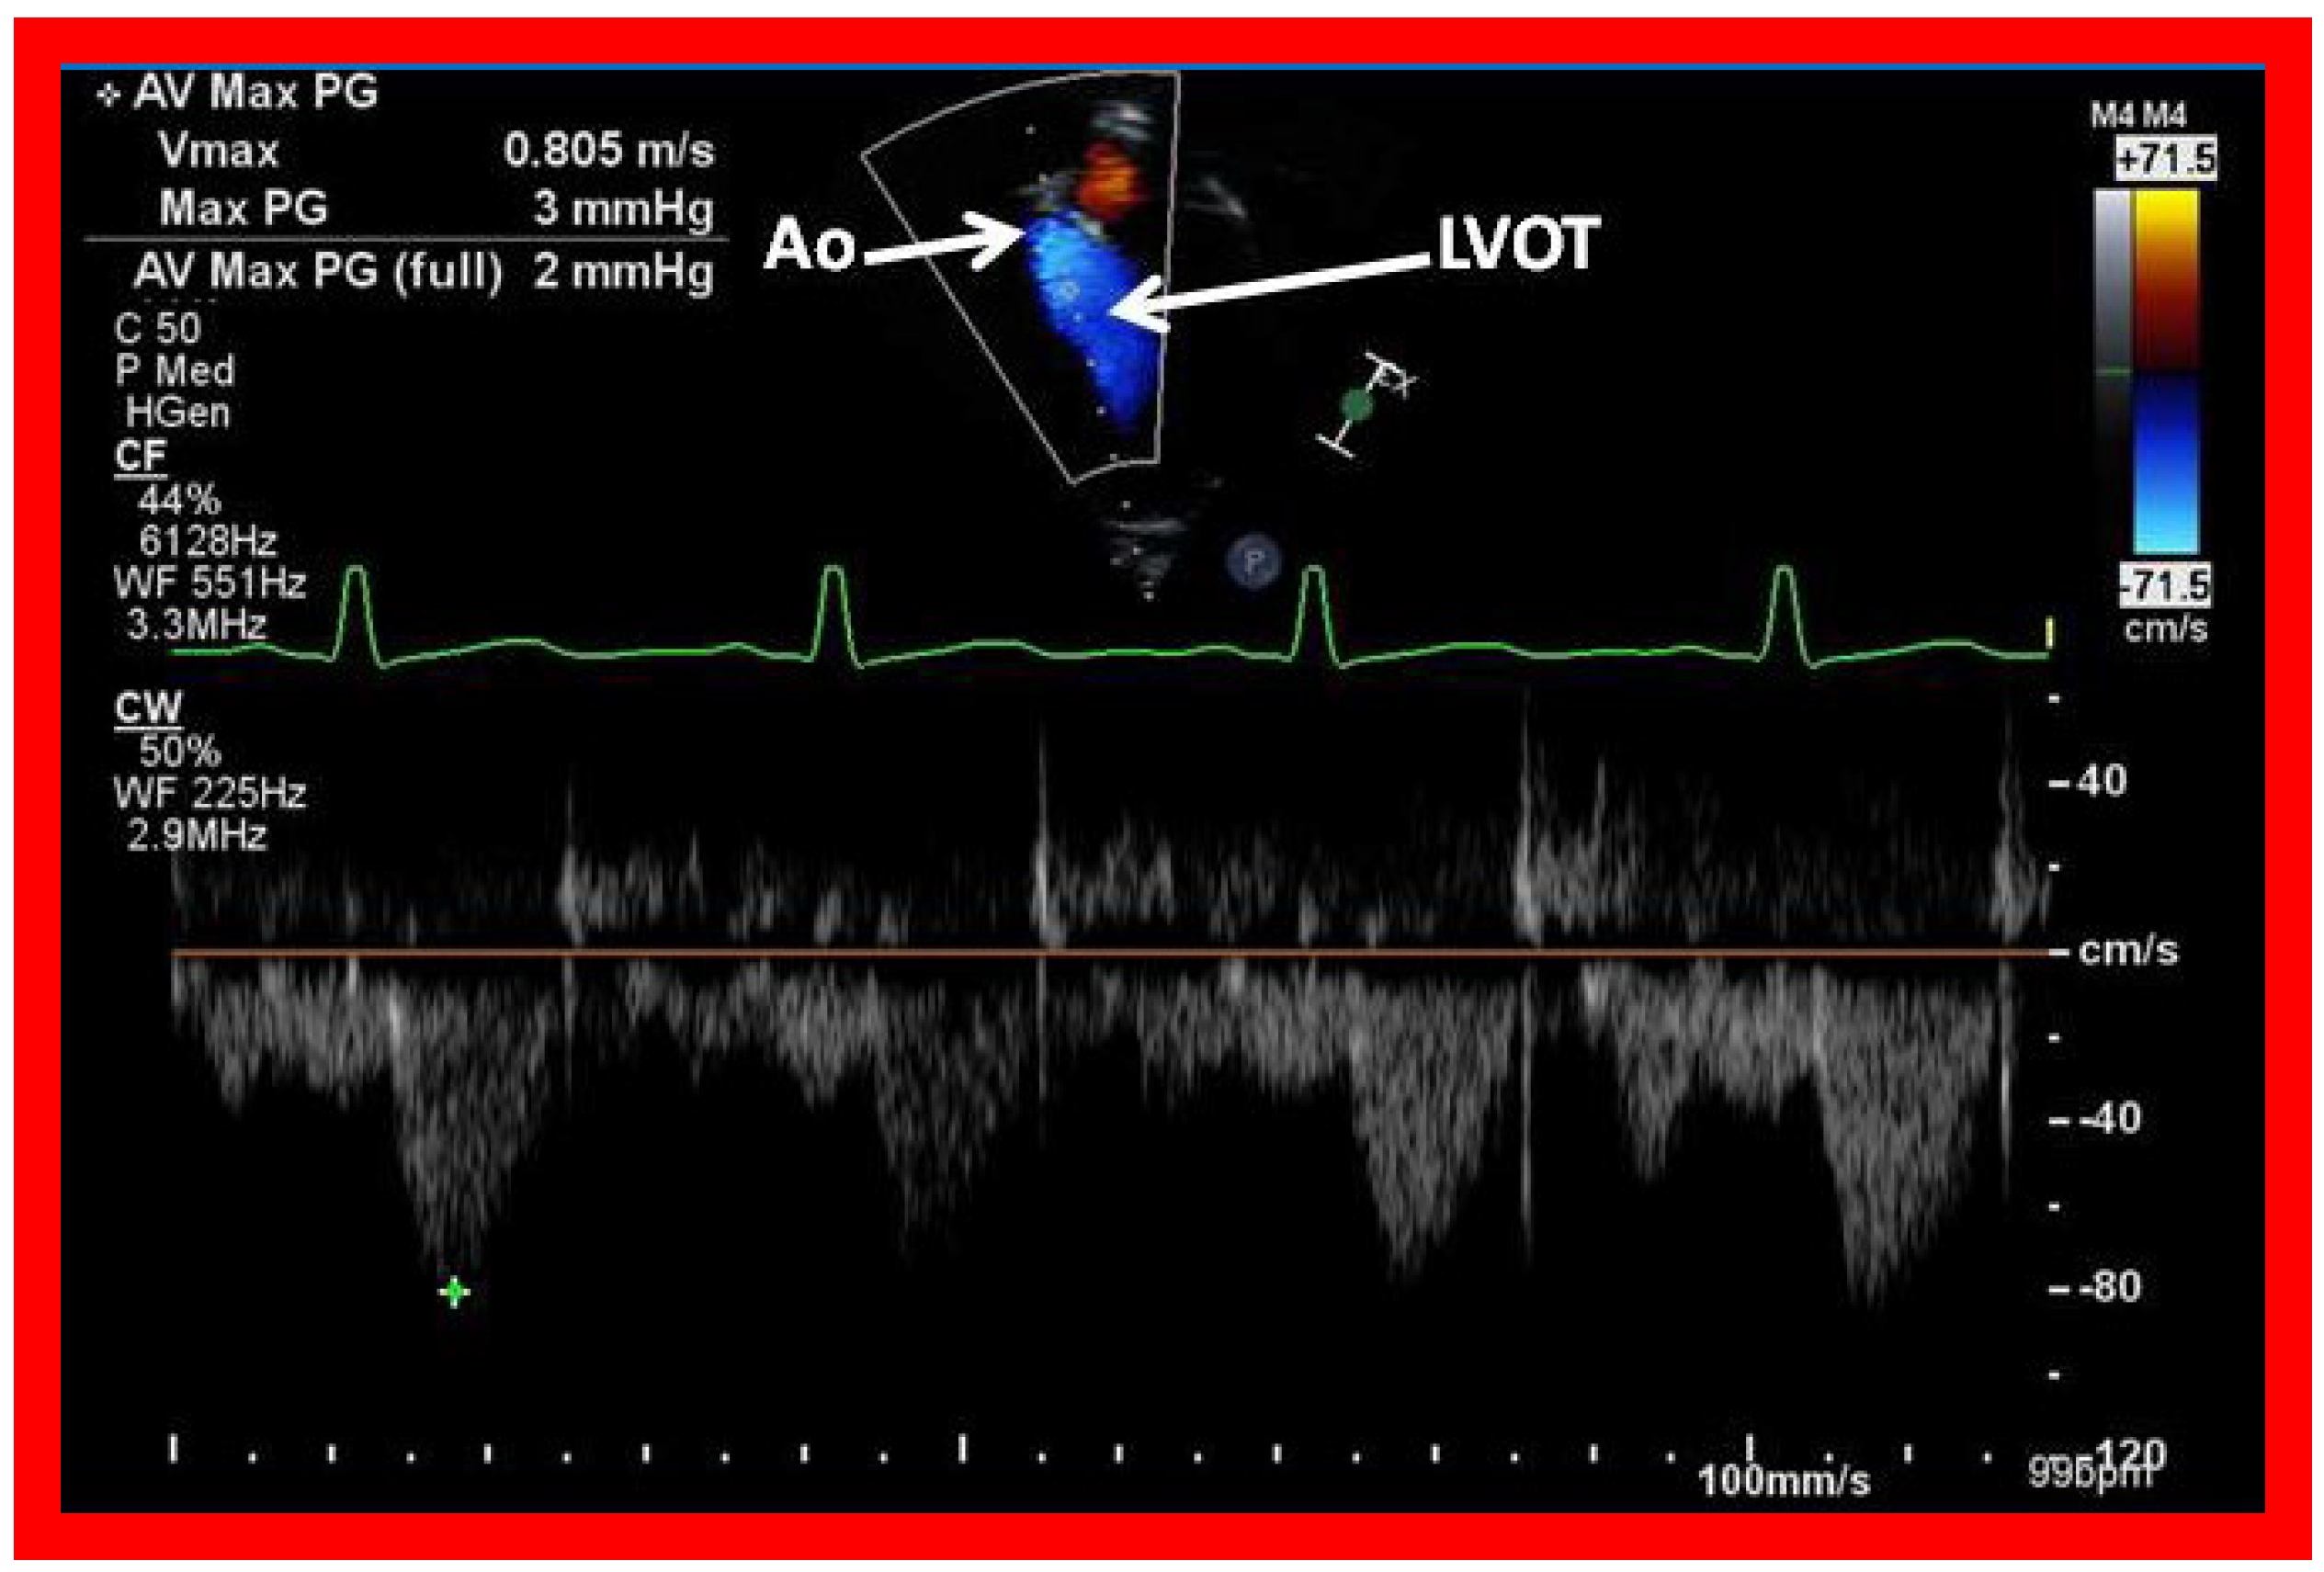
Figure 42.
Selected video frames from an apical view demonstrating laminar flow from the left ventricle into the aorta (Ao). Note laminar flow in the LV outflow tract (LVOT) and low Doppler flow velocity (~0.8 m/s).
Figure 42.
Selected video frames from an apical view demonstrating laminar flow from the left ventricle into the aorta (Ao). Note laminar flow in the LV outflow tract (LVOT) and low Doppler flow velocity (~0.8 m/s).
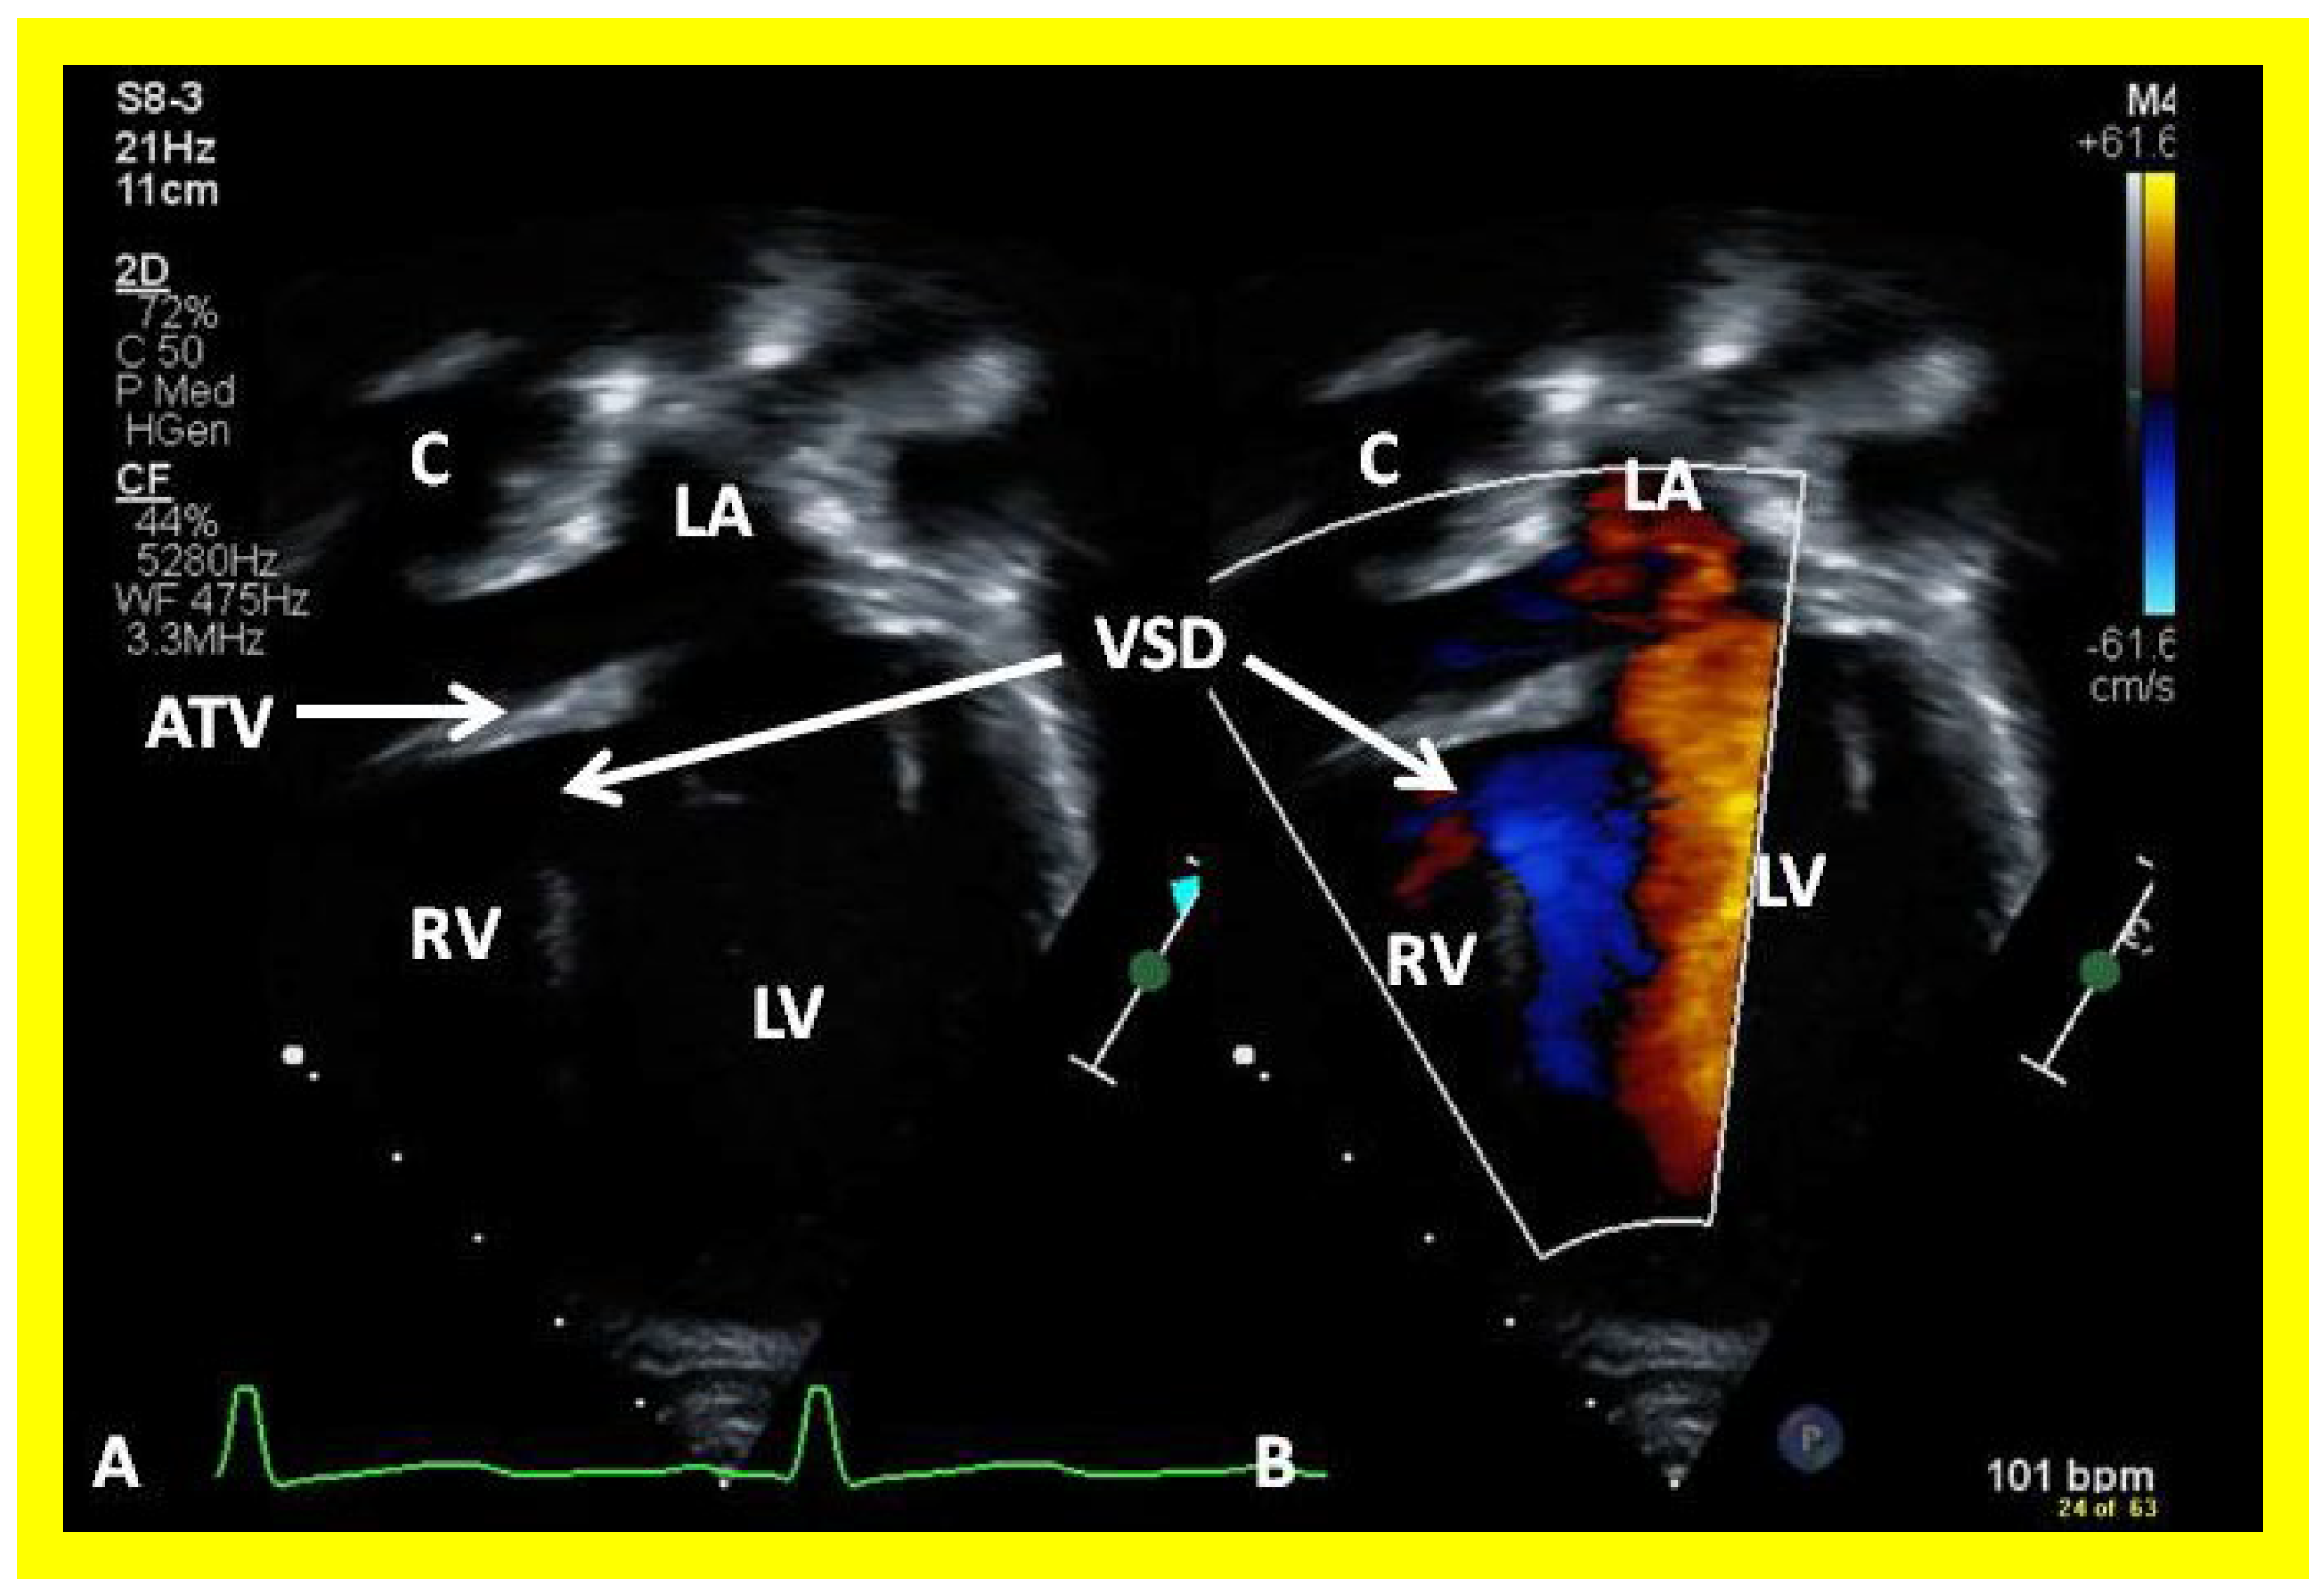
Figure 43.
Selected video frames from apical views in two dimensional (A) and color flow imaging (B) modes demonstrating the right ventricle (RV) forming a cul-de-sac connection via a ventricular septal defect (VSD) with the left ventricle (LV). ATV, atretic tricuspid tricuspid valve, C, conduit, LA, left atrium.
Figure 44.
Selected video frame from an apical four-chamber view demonstrating the left ventricle (LV) and hypoplastic right ventricle (RV) in a patient who had a Fontan procedure. Note that the RV protrudes into the left ventricular (LV) outflow tract. Cross-sectional view of the conduit (C) is also shown. LA, left atrium.
Figure 45.
Selected video frame from an apical four-chamber view demonstrating that there is no evidence for left ventricular outflow tract (LVOT) obstruction in the patient shown in
Figure 43. Note laminar flow across the LVOT in (
A) and low Doppler flow velocities across the LVOT (
B) and aorta (Ao) (
C). LV, left ventricle.
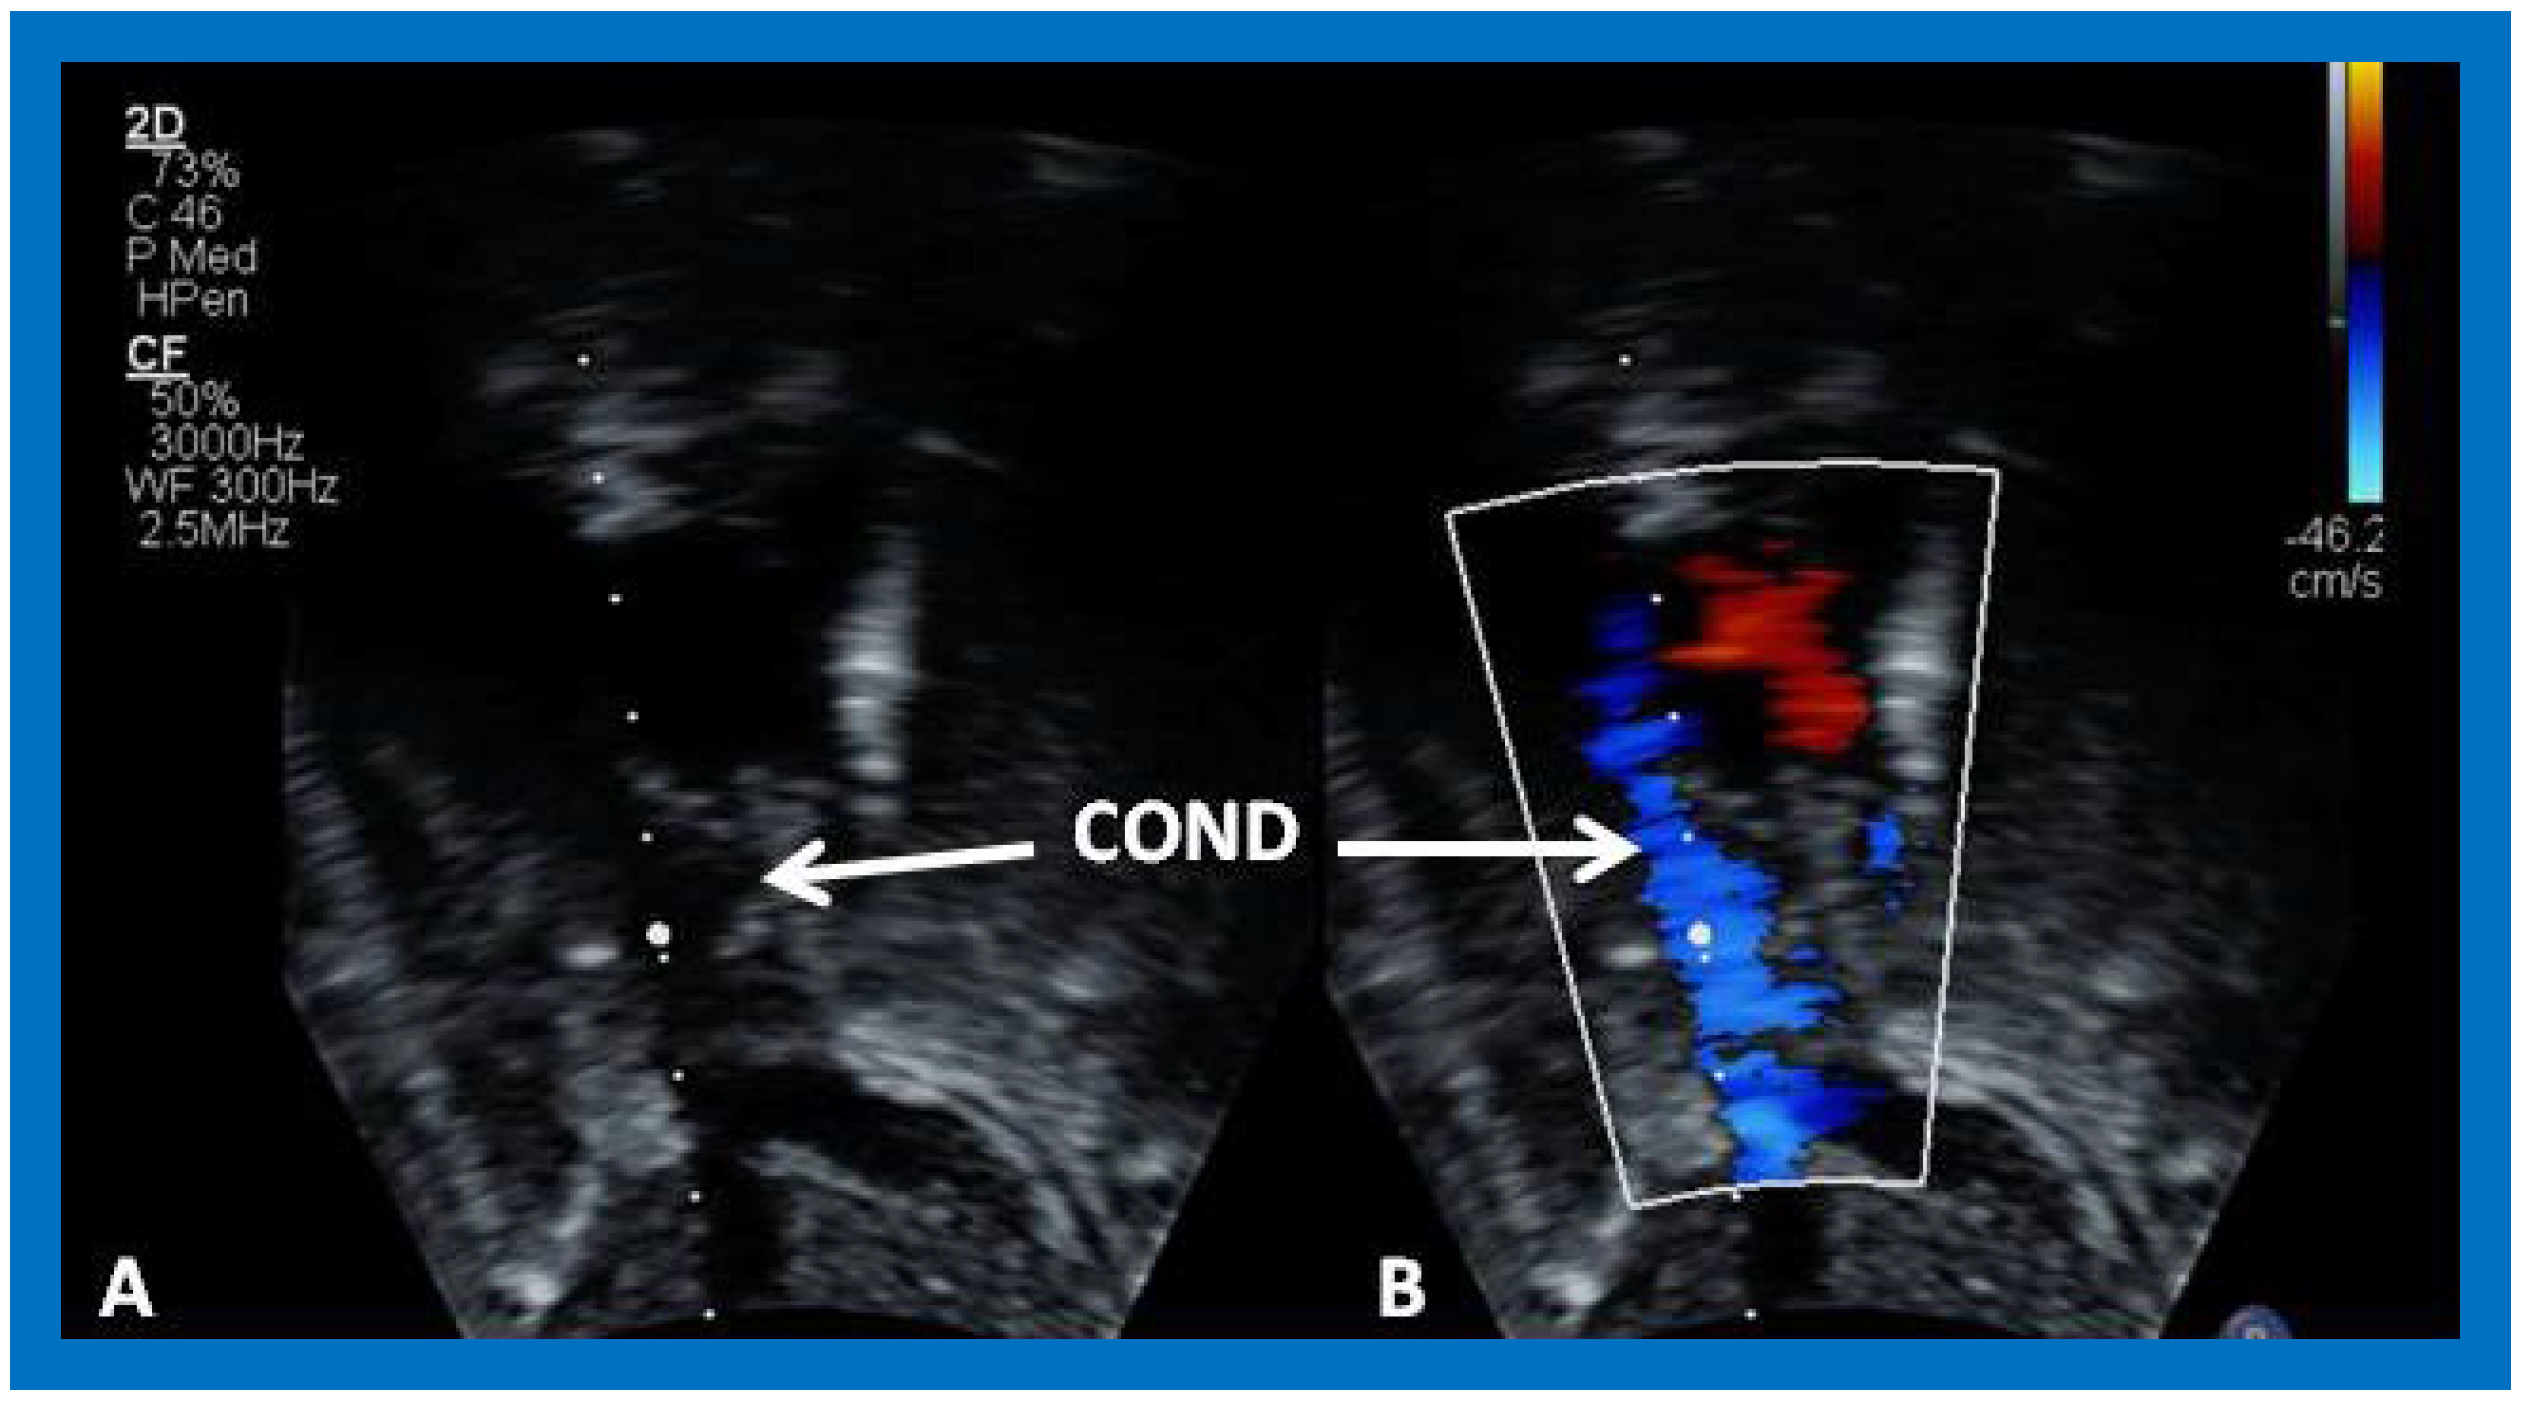
Figure 46.
Selected video frame demonstrating wide open conduit (COND) by 2D (A) and color flow imaging (B). Note laminar flow in (B) indicating no obstruction.
Figure 46.
Selected video frame demonstrating wide open conduit (COND) by 2D (A) and color flow imaging (B). Note laminar flow in (B) indicating no obstruction.
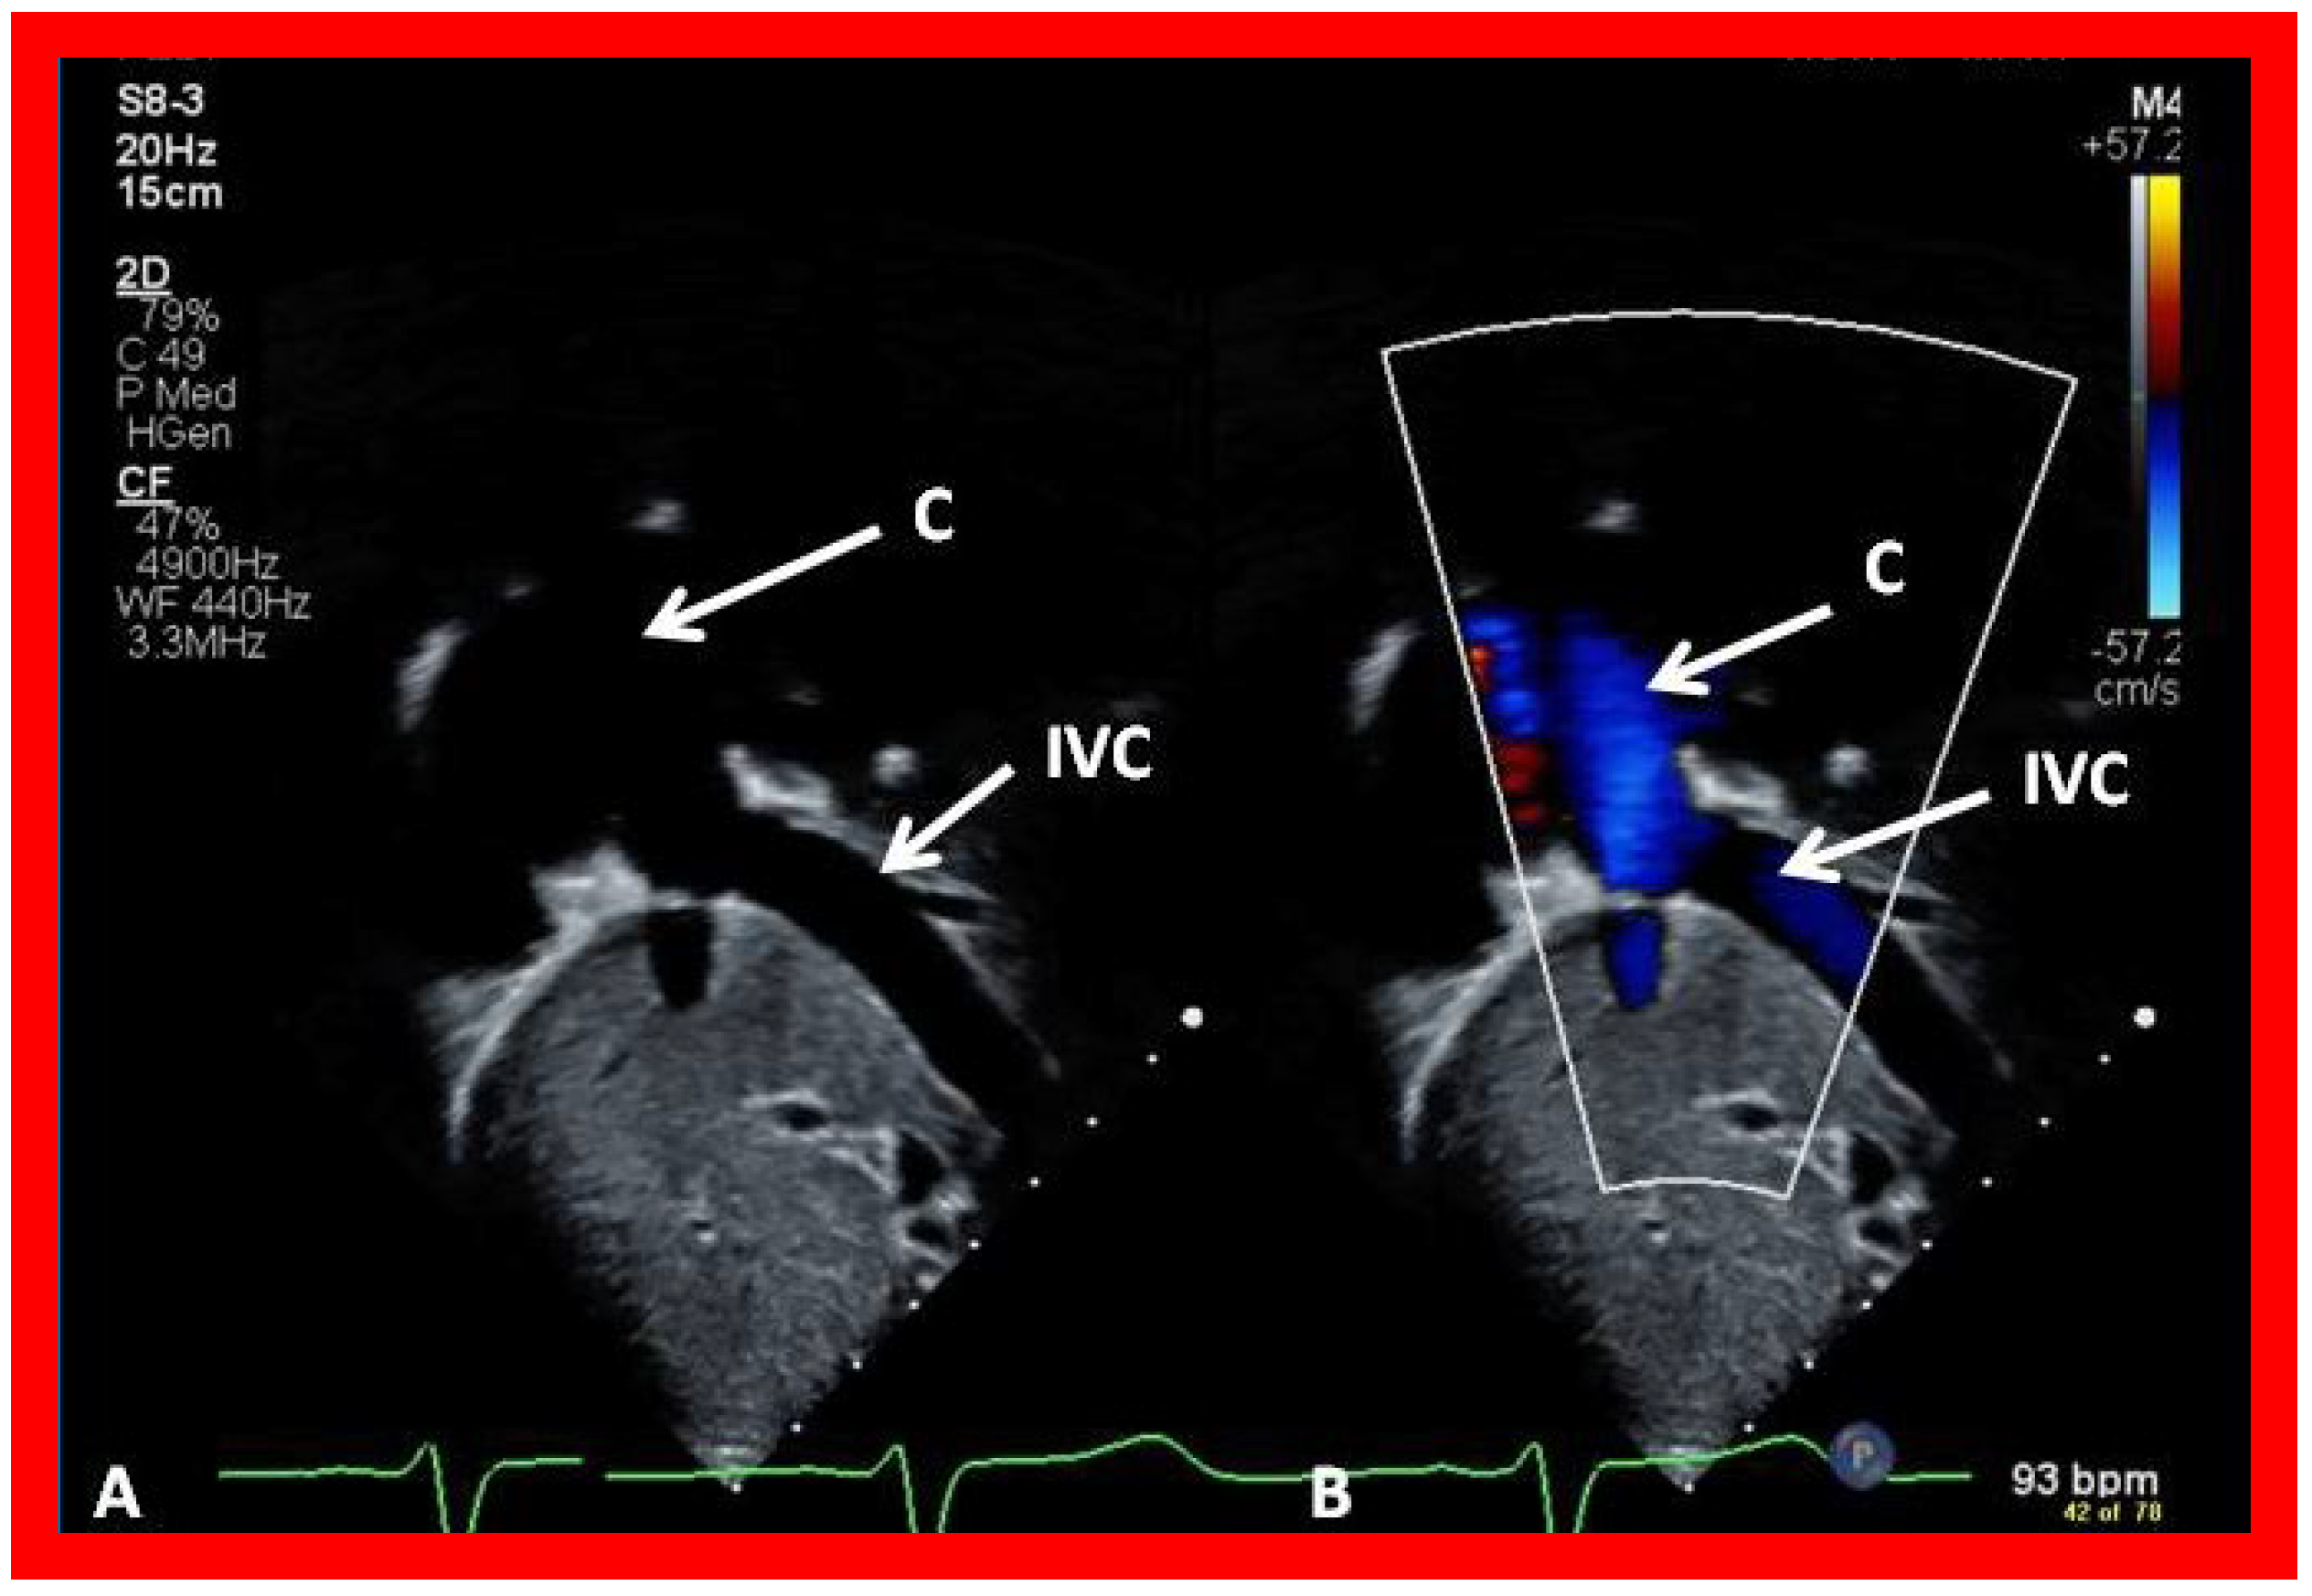
Figure 47.
Selected video frames demonstrating connection between the inferior vena cava (IVC) and the conduit (C) by 2D (A) and color flow imaging (B); note that the IVC–C junction is wide open.
Figure 47.
Selected video frames demonstrating connection between the inferior vena cava (IVC) and the conduit (C) by 2D (A) and color flow imaging (B); note that the IVC–C junction is wide open.
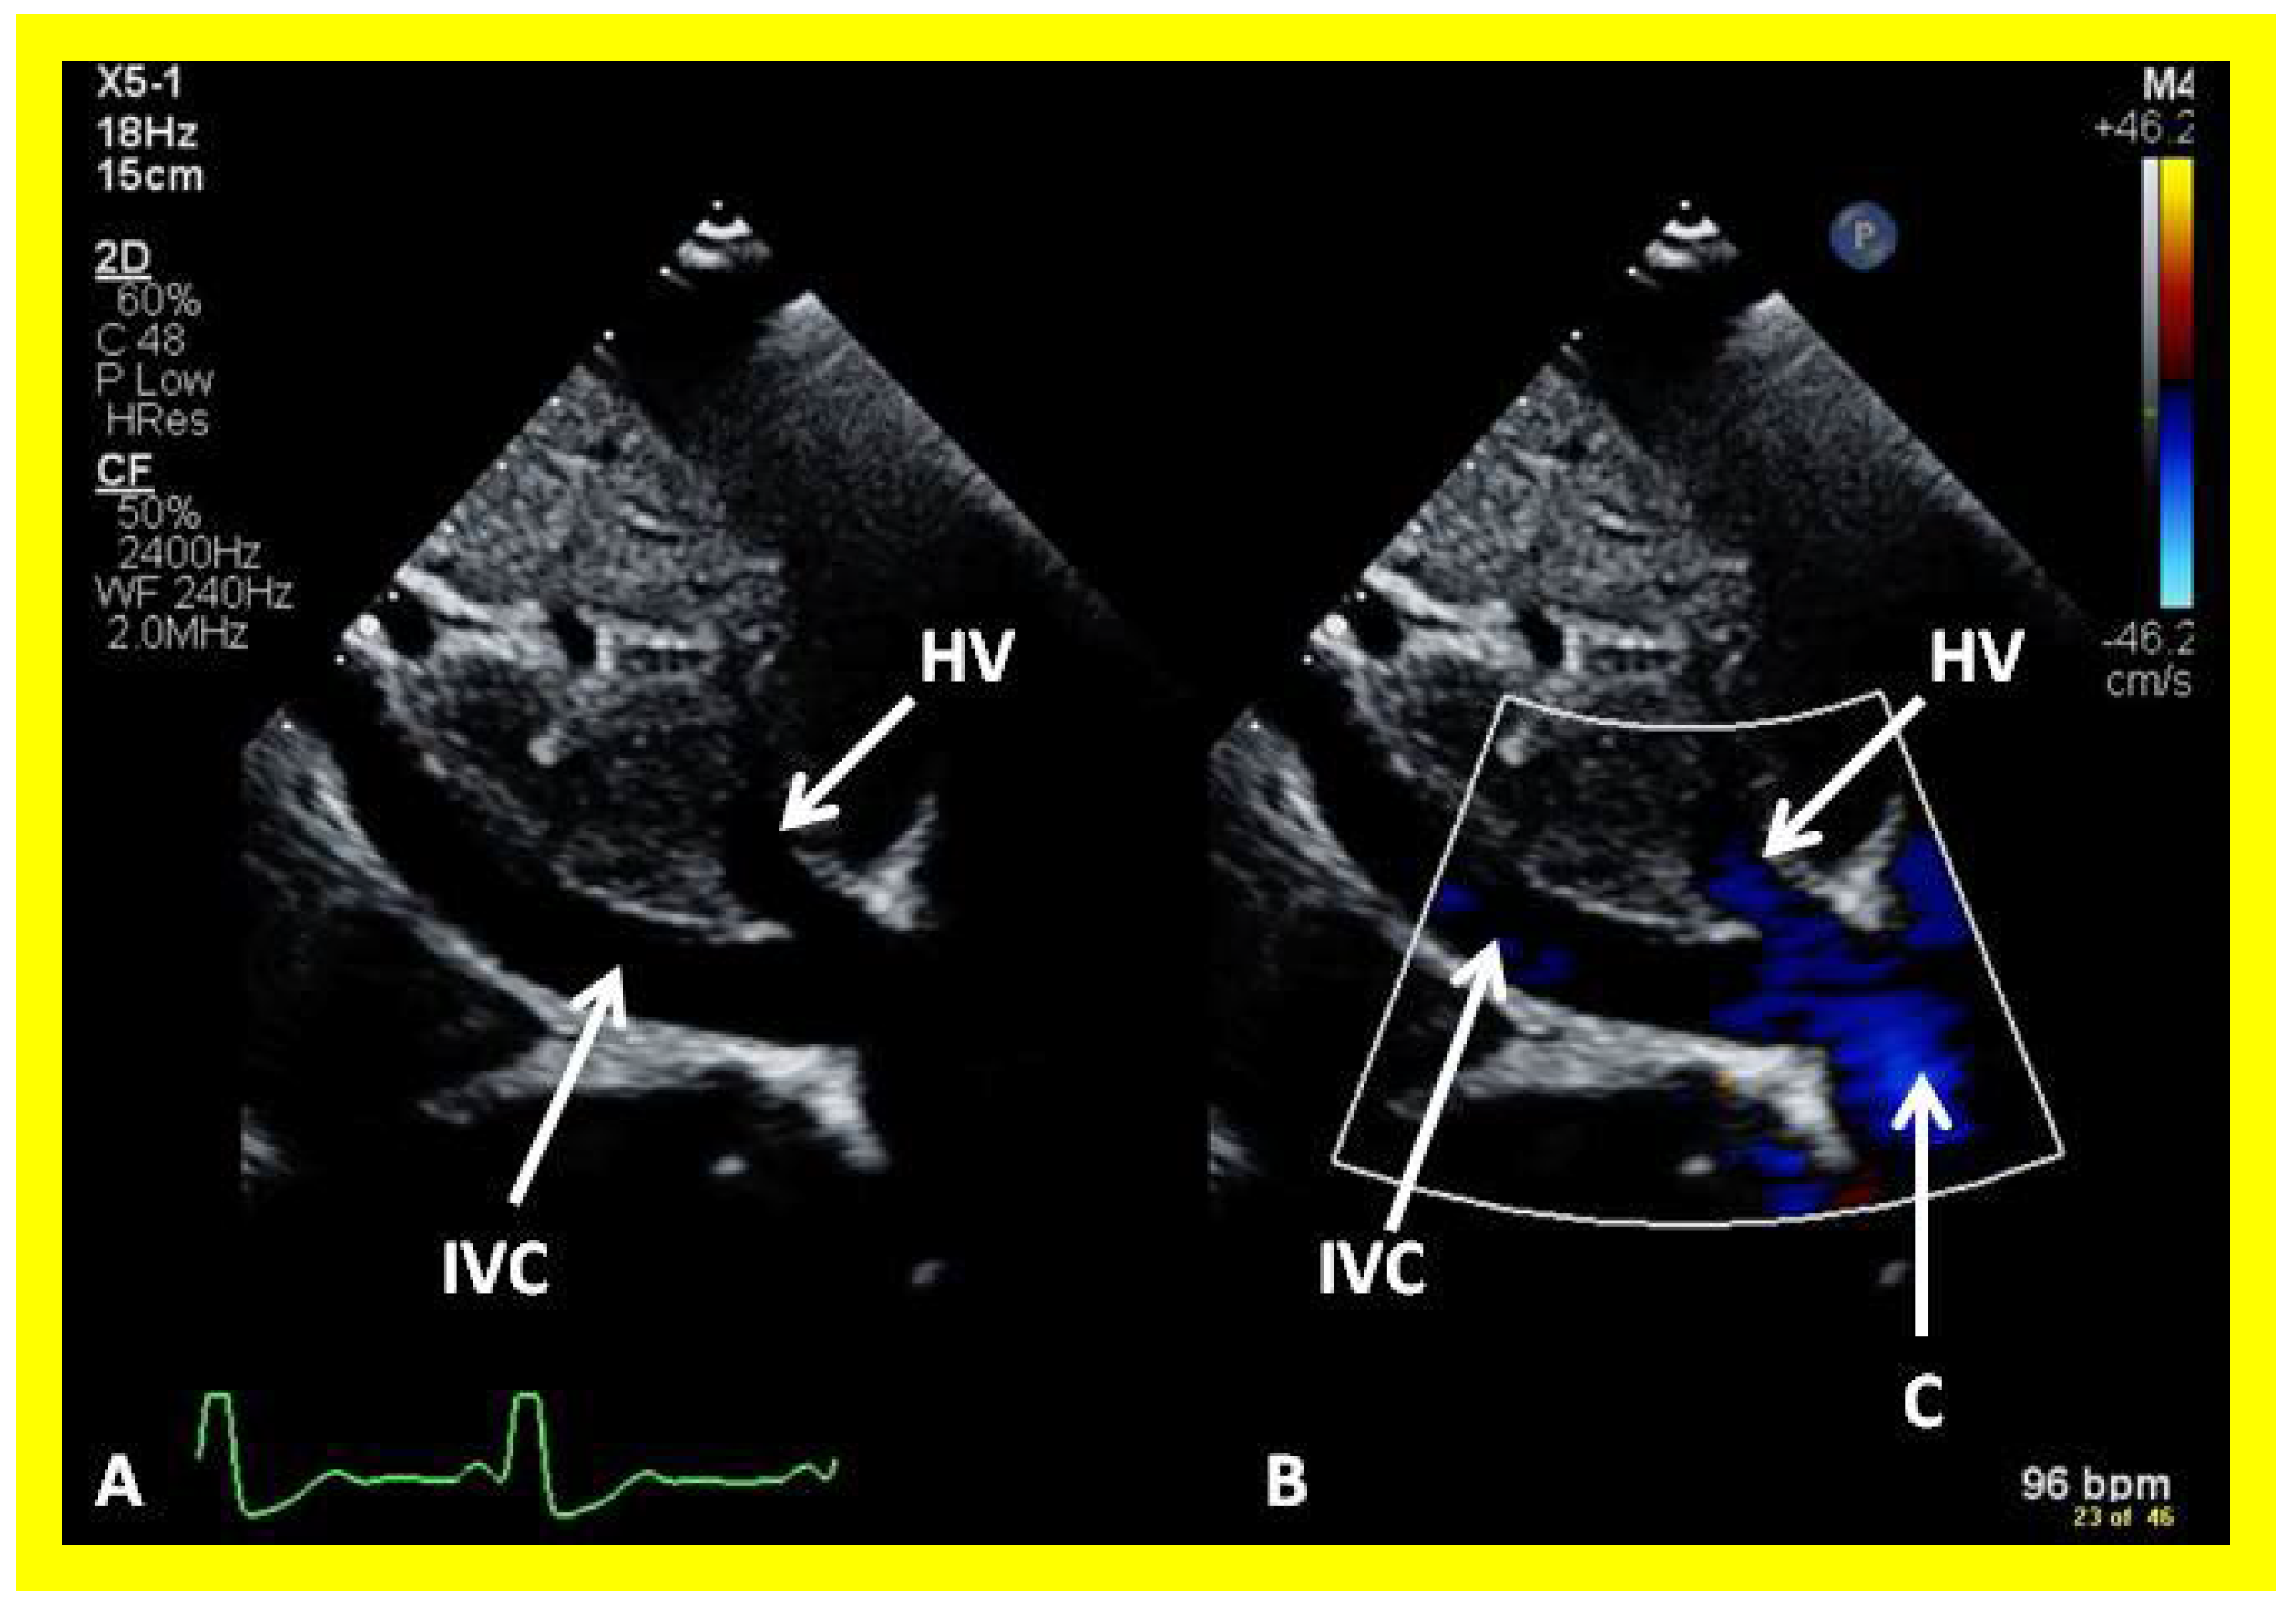
Figure 48.
Selected video frames from subcostal view demonstrating connection between the inferior vena cava (IVC) and the conduit by 2D (A) and color flow imaging (B); note that the IVC to conduit (C) connection is wide open.
Figure 48.
Selected video frames from subcostal view demonstrating connection between the inferior vena cava (IVC) and the conduit by 2D (A) and color flow imaging (B); note that the IVC to conduit (C) connection is wide open.
Figure 49.
Selected video frame demonstrating low velocity flow between the inferior vena cava (IVC) and the conduit (C) shown in
Figure 47, suggesting no evidence for obstruction.
Figure 49.
Selected video frame demonstrating low velocity flow between the inferior vena cava (IVC) and the conduit (C) shown in
Figure 47, suggesting no evidence for obstruction.
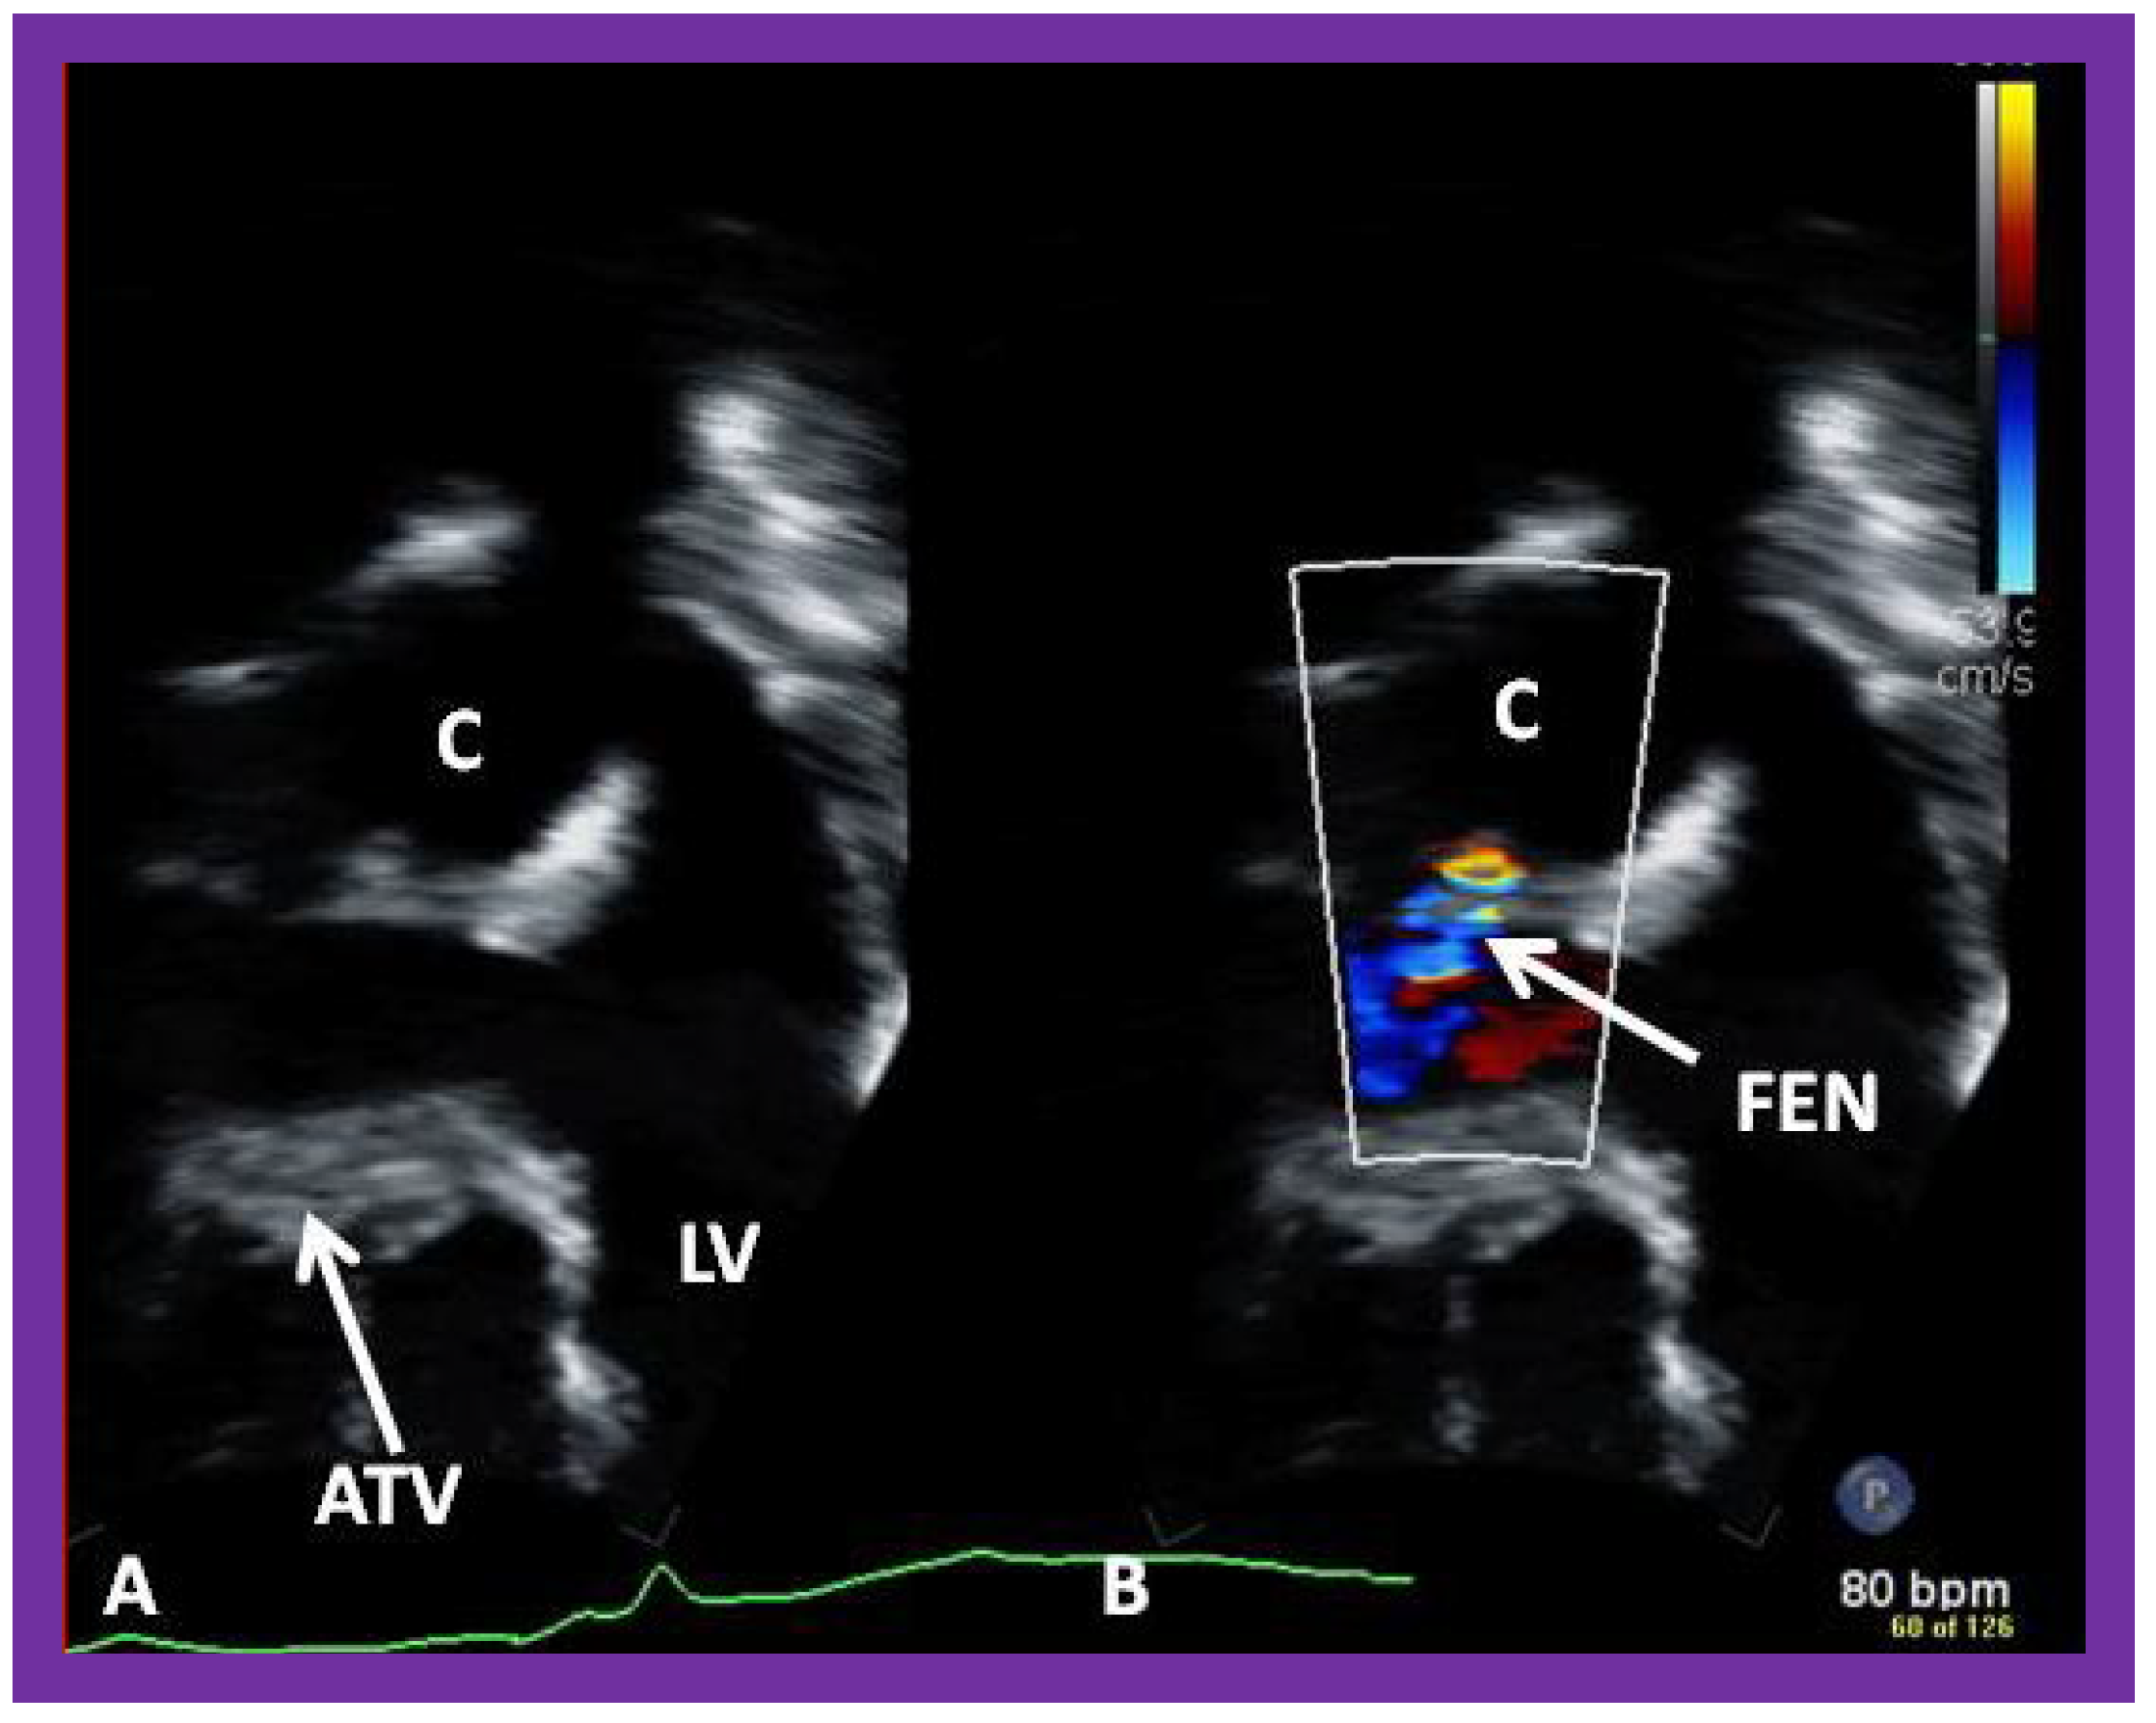
Figure 50.
Selected video frames (
A,
B) from an apical four chamber view, similar to
Figure 39 and
Figure 40, focusing on the conduit (C) (
A) (left) and with color flow imaging (
B) demonstrating fenestration (FEN). ATV, atretic tricuspid valve; LV, left ventricle.
Figure 50.
Selected video frames (
A,
B) from an apical four chamber view, similar to
Figure 39 and
Figure 40, focusing on the conduit (C) (
A) (left) and with color flow imaging (
B) demonstrating fenestration (FEN). ATV, atretic tricuspid valve; LV, left ventricle.
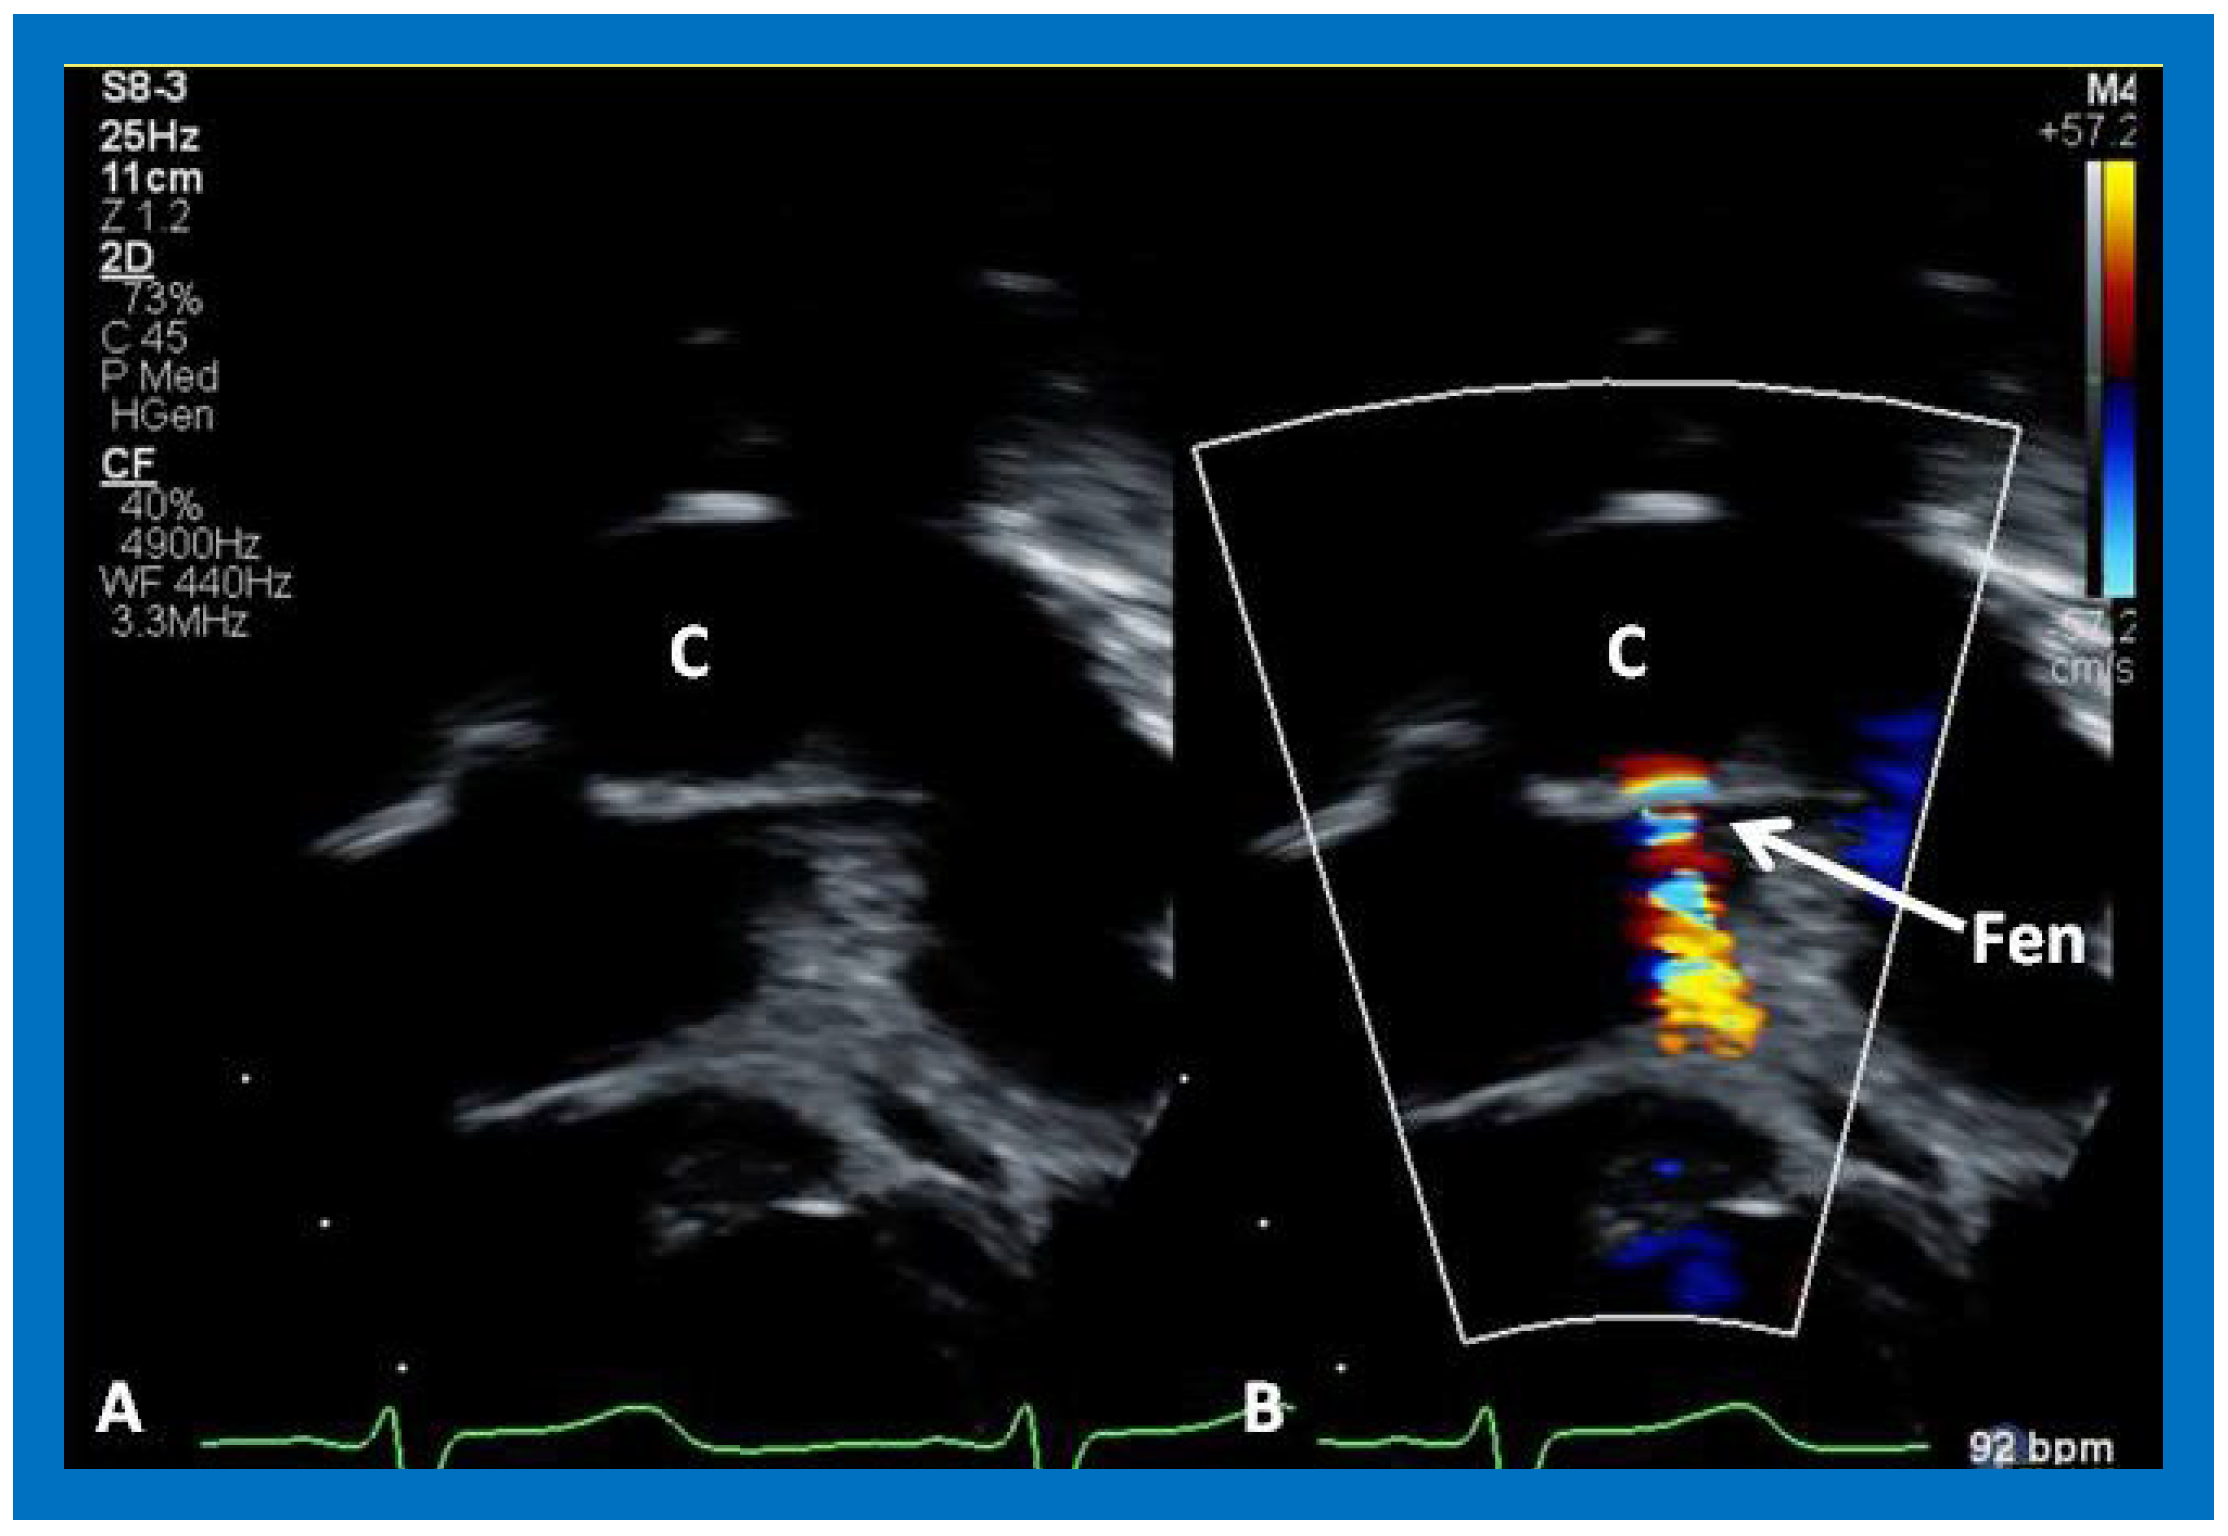
Figure 51.
A magnified view of the fenestration (Fen), similar to
Figure 50. C, conduit.
Figure 51.
A magnified view of the fenestration (Fen), similar to
Figure 50. C, conduit.
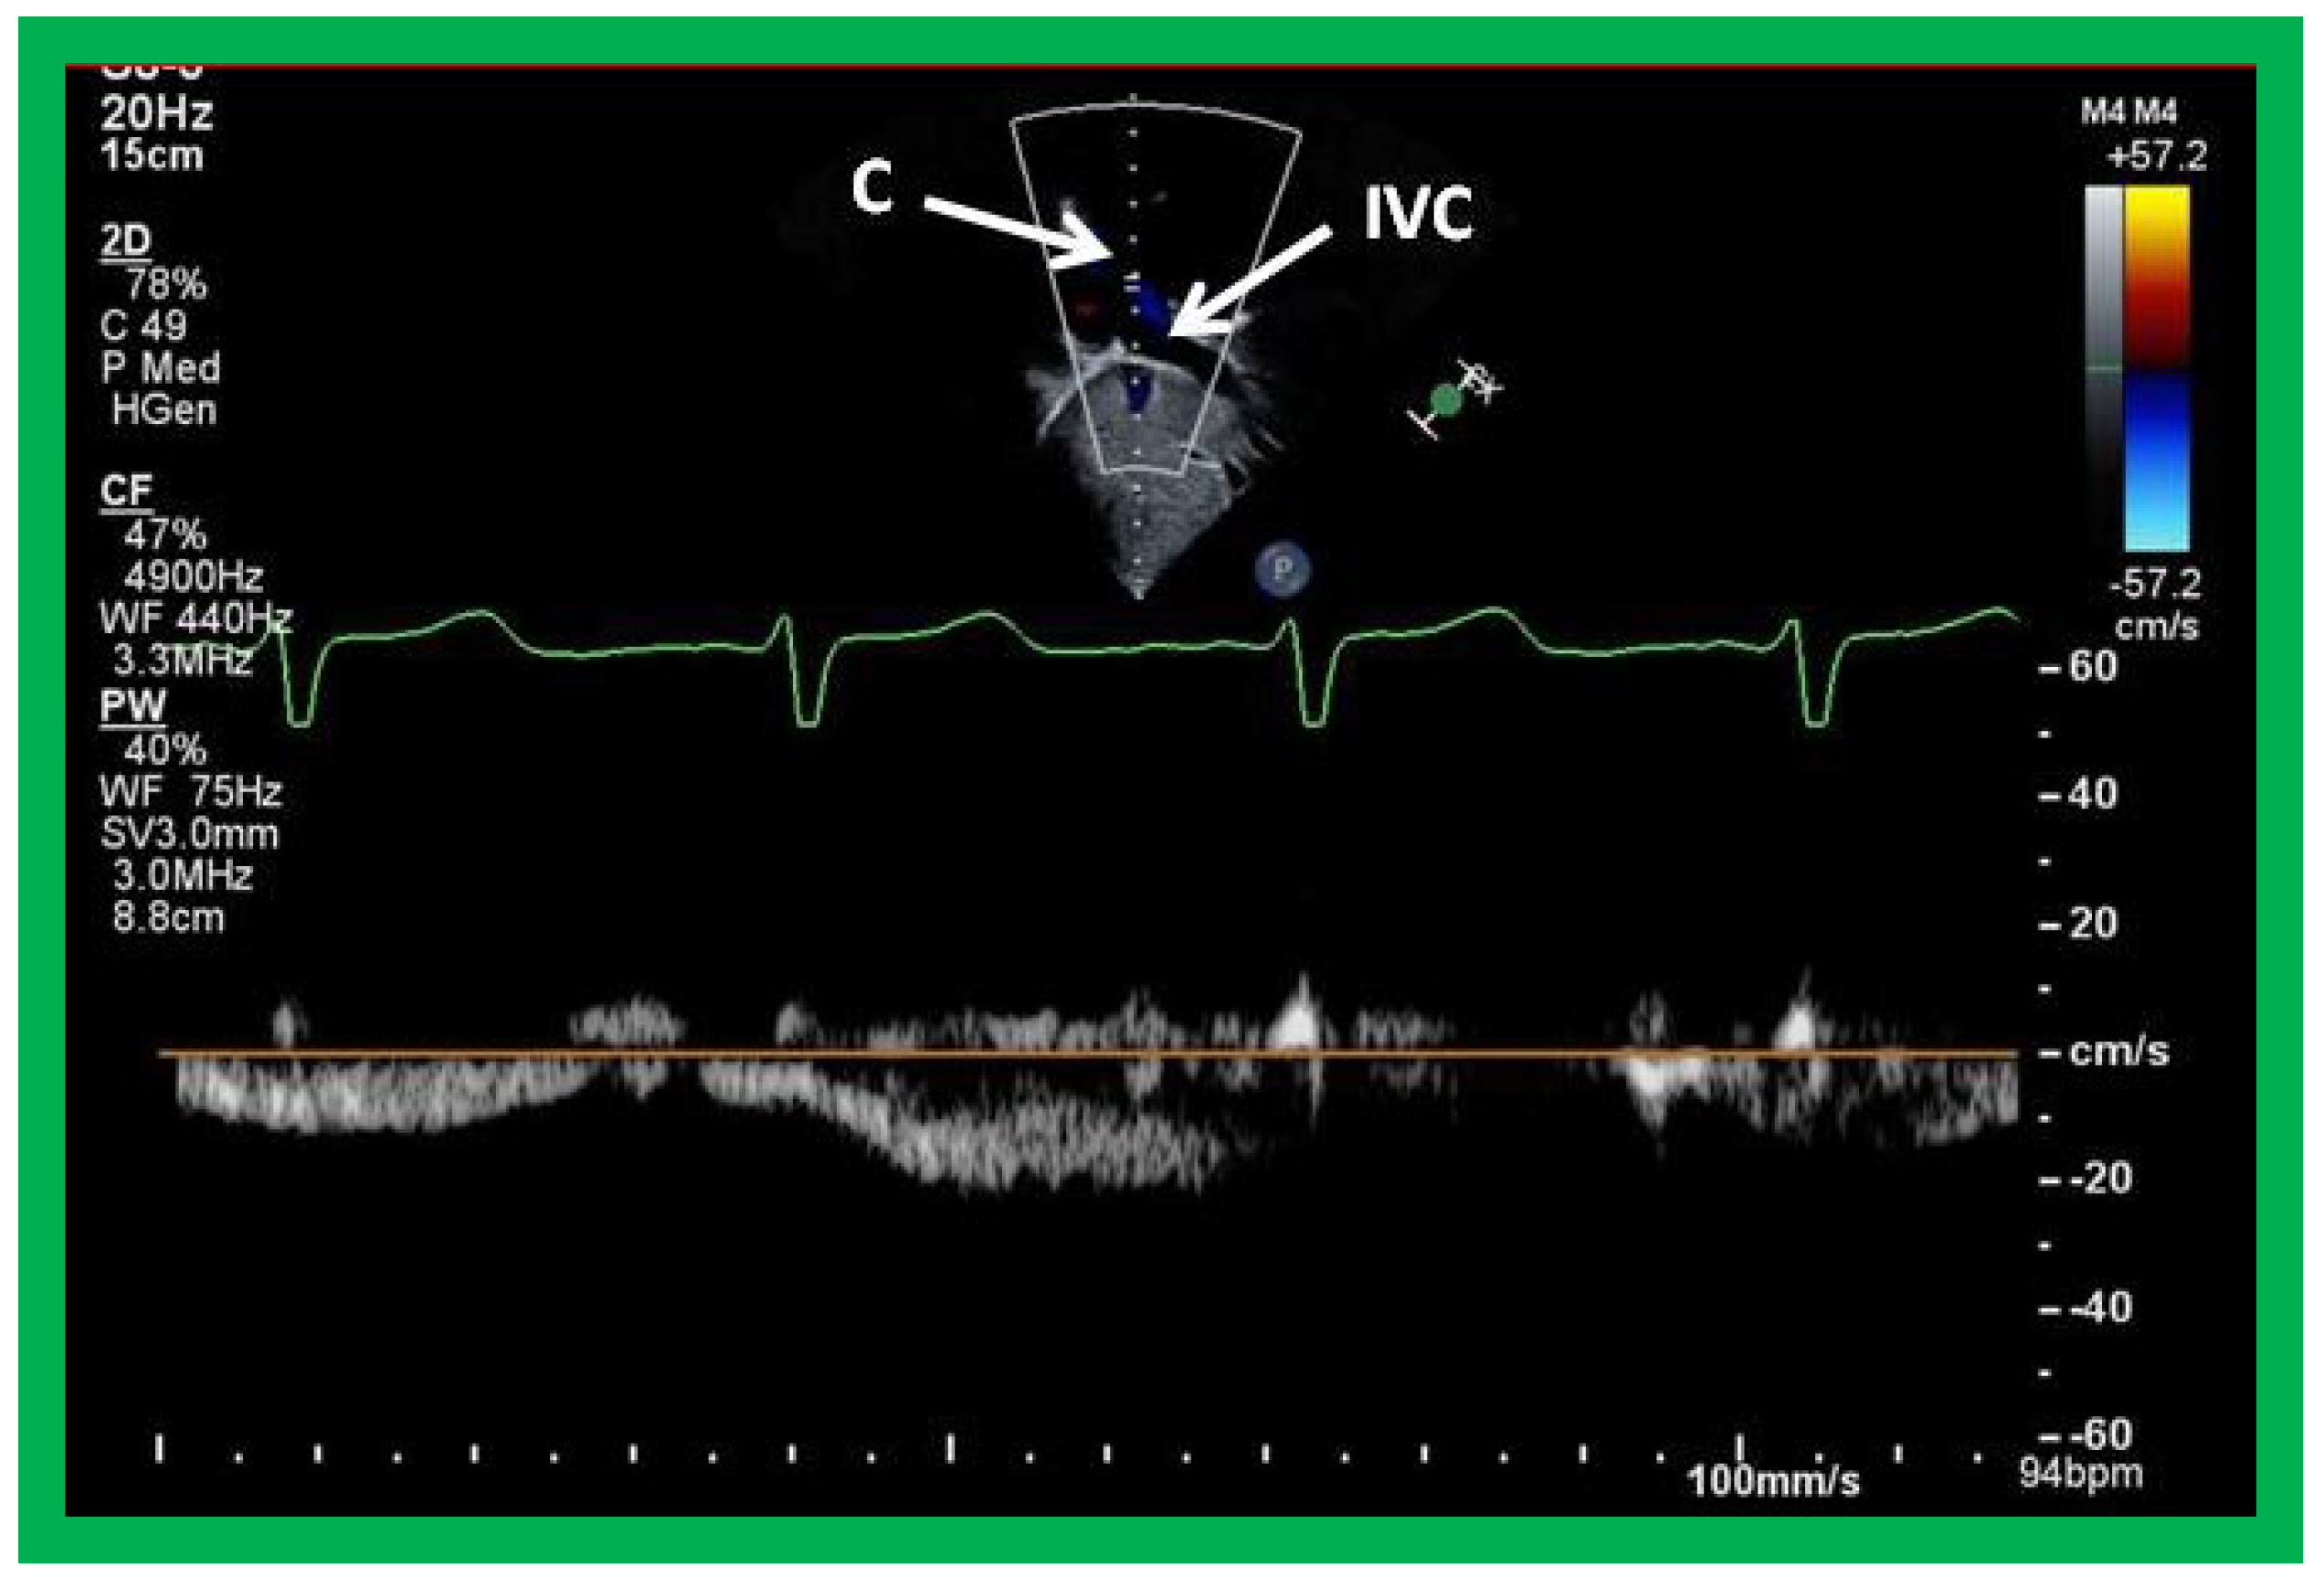
Figure 52.
Selected video frame with Doppler sampling across the fenestration (Fen) demonstrating a mean gradient of 4 mmHg.
Figure 52.
Selected video frame with Doppler sampling across the fenestration (Fen) demonstrating a mean gradient of 4 mmHg.
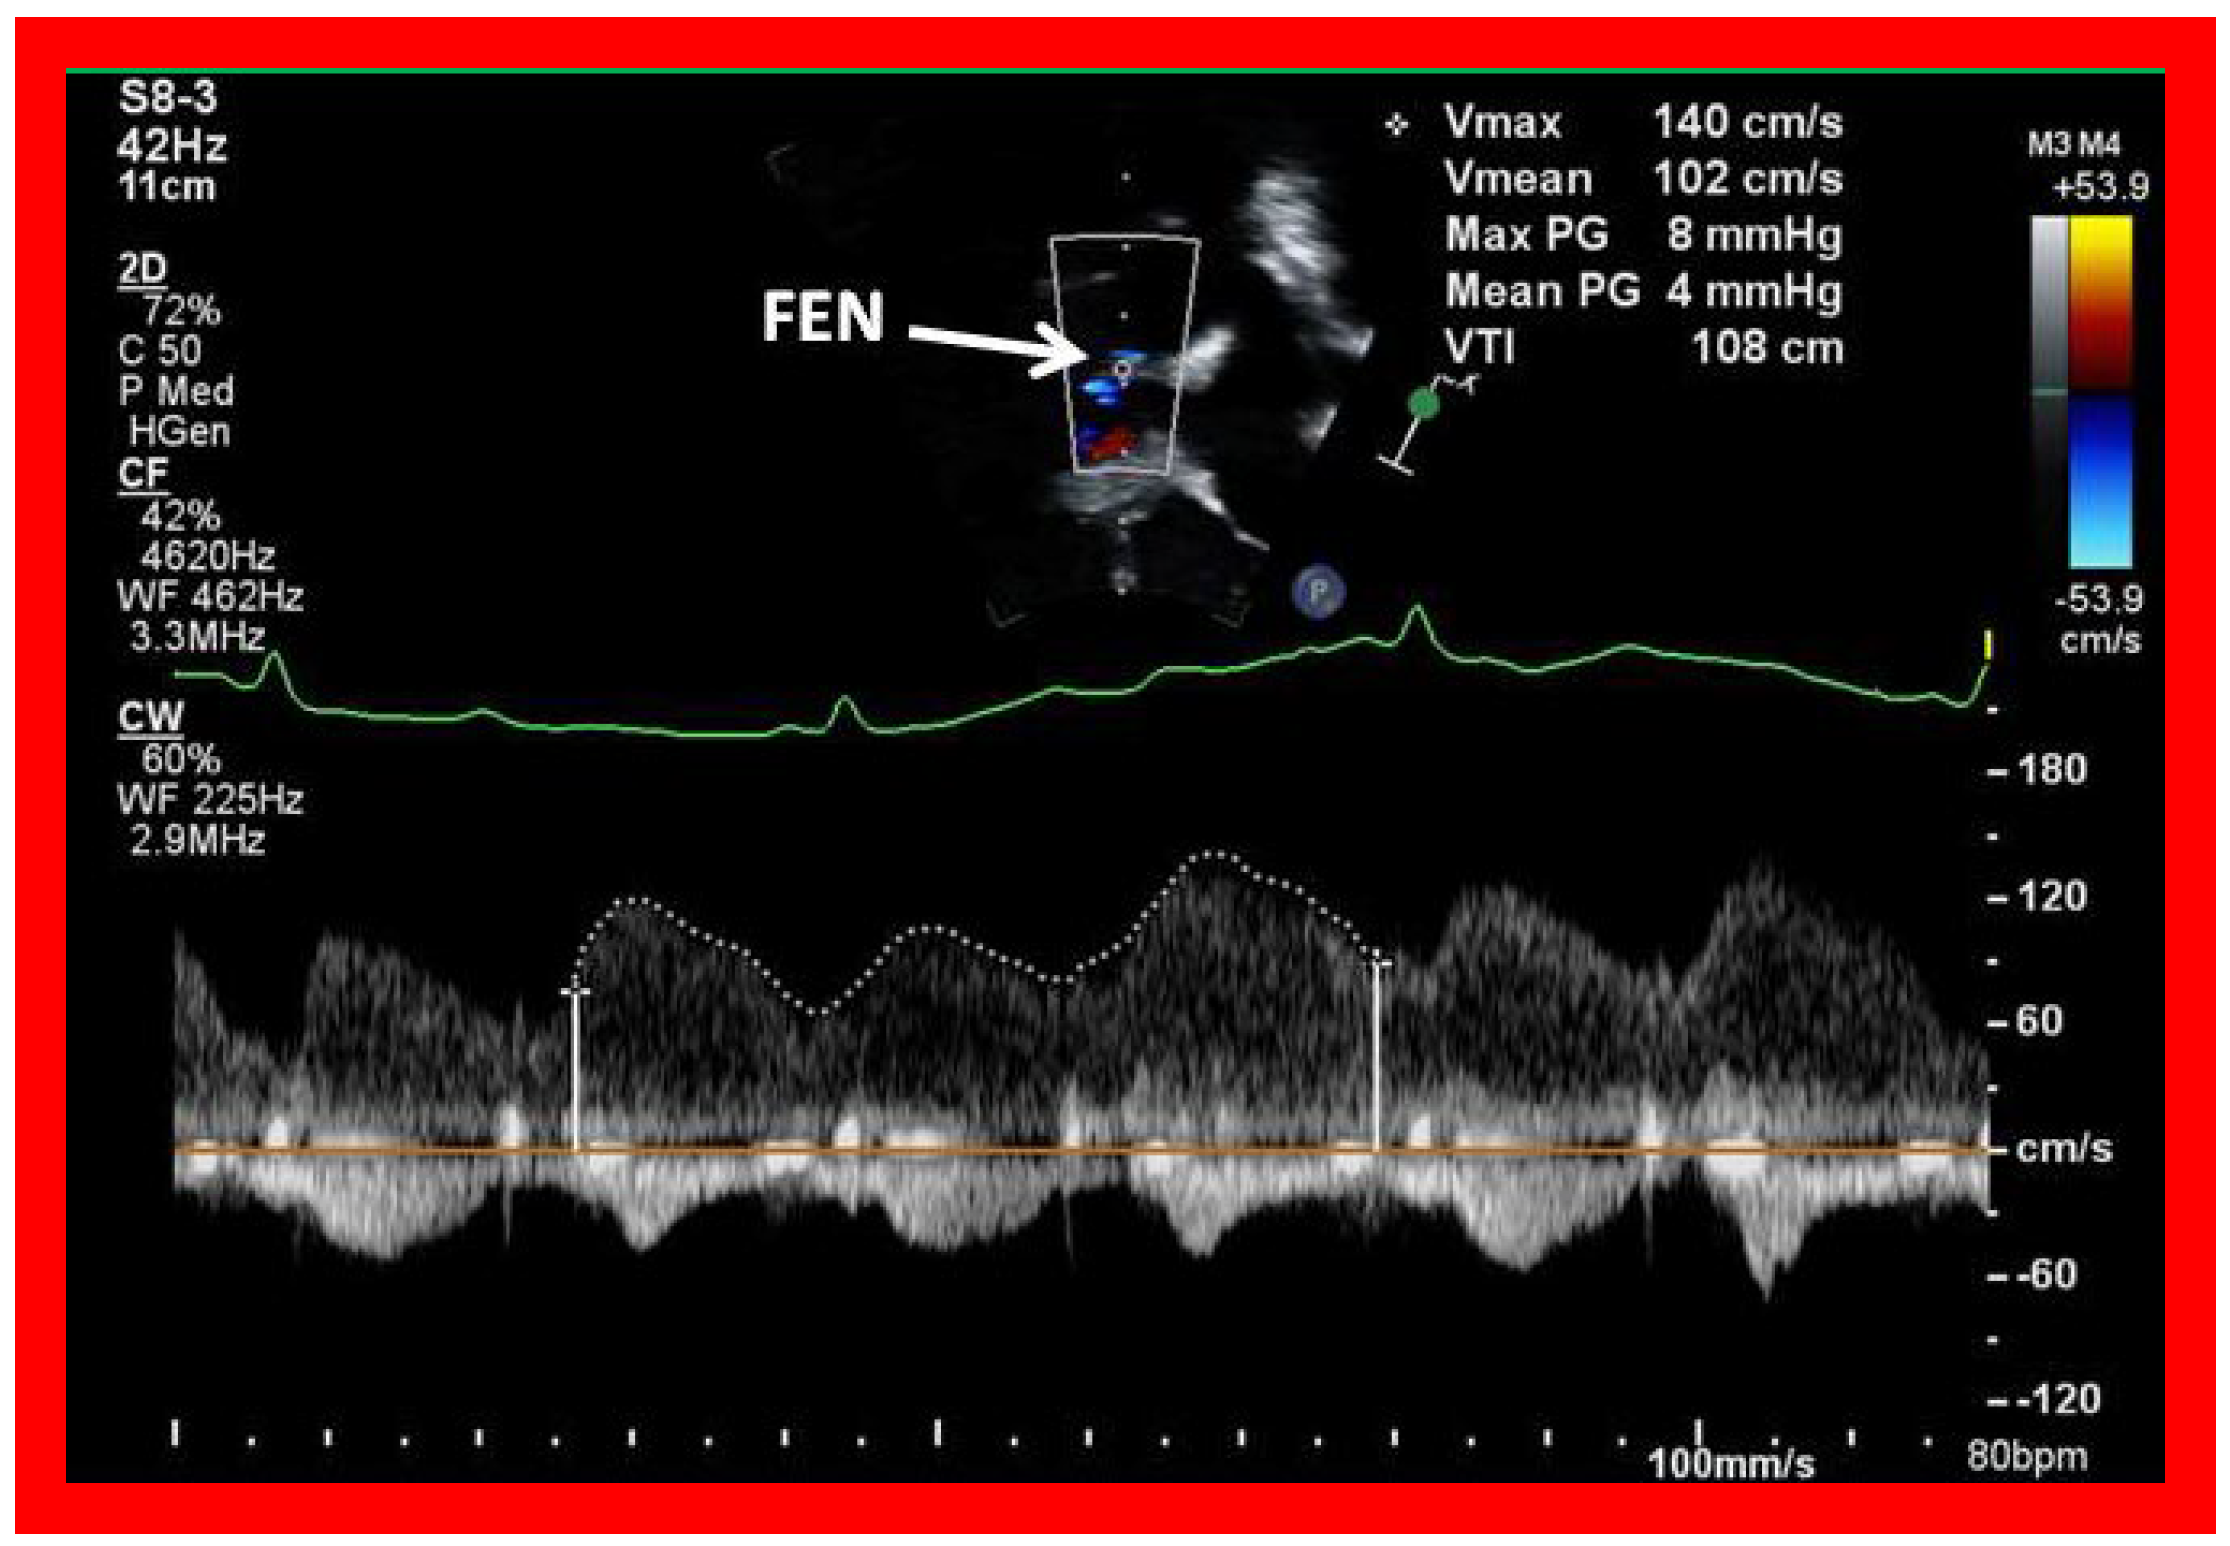
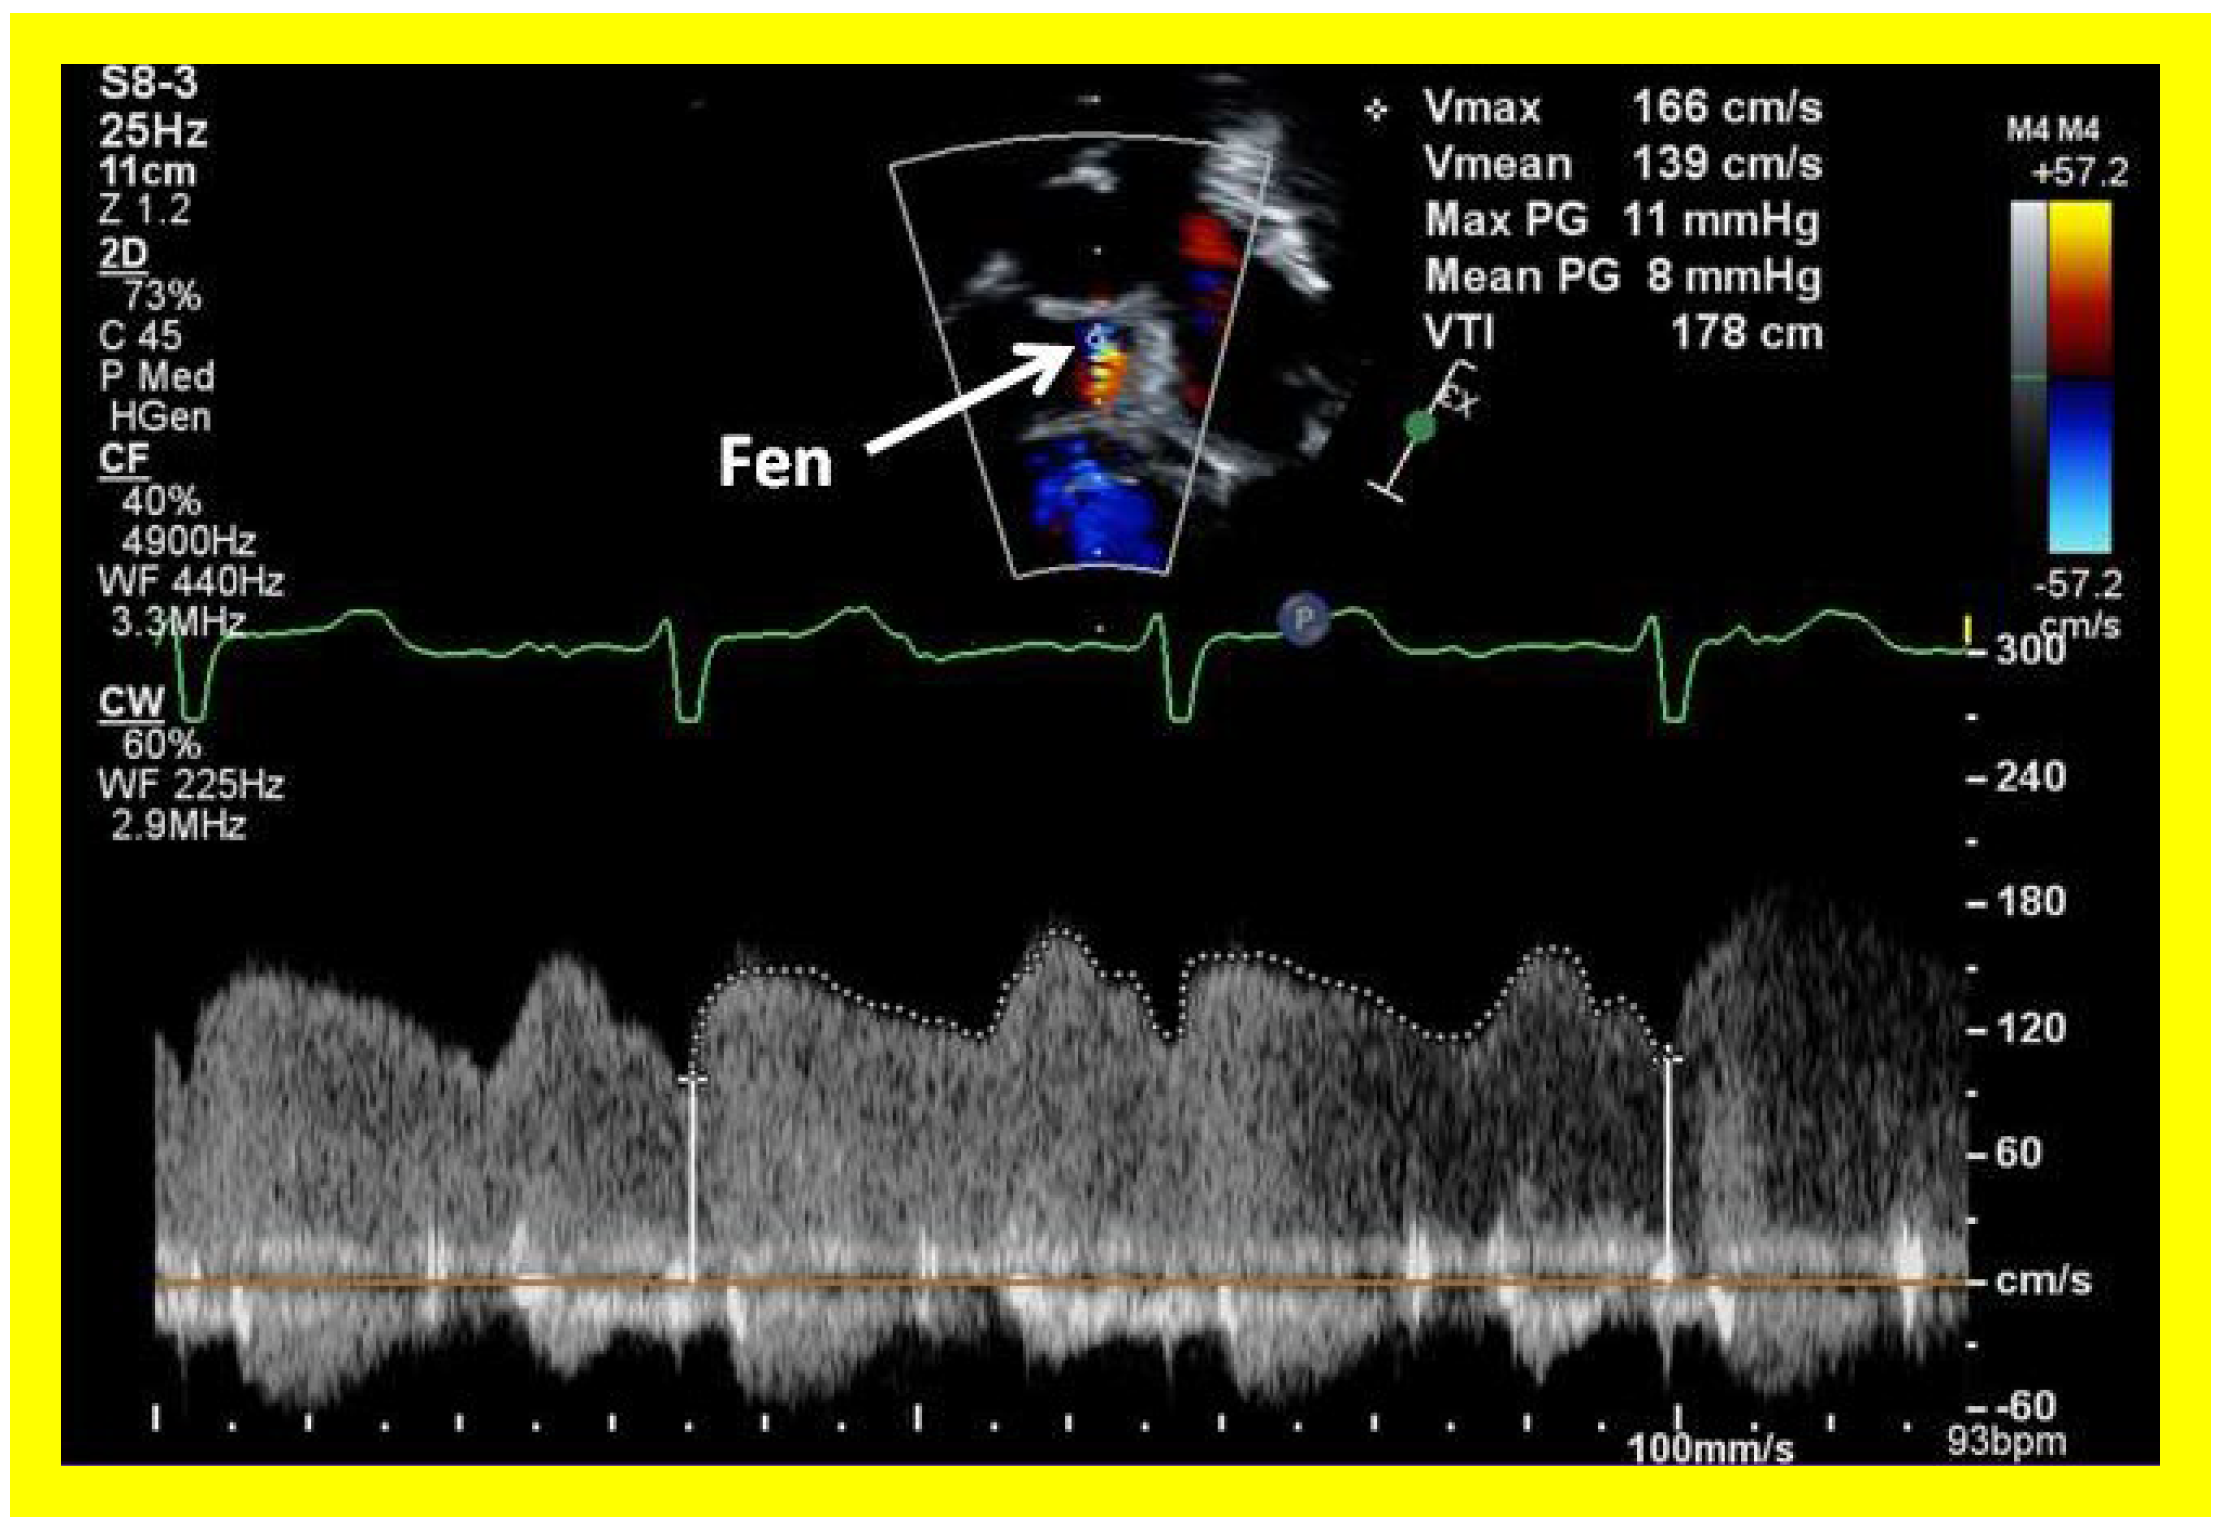
Figure 53.
Selected video frame with Doppler sampling across the fenestration (Fen) demonstrating a mean gradient of 8 mmHg.
Figure 53.
Selected video frame with Doppler sampling across the fenestration (Fen) demonstrating a mean gradient of 8 mmHg.
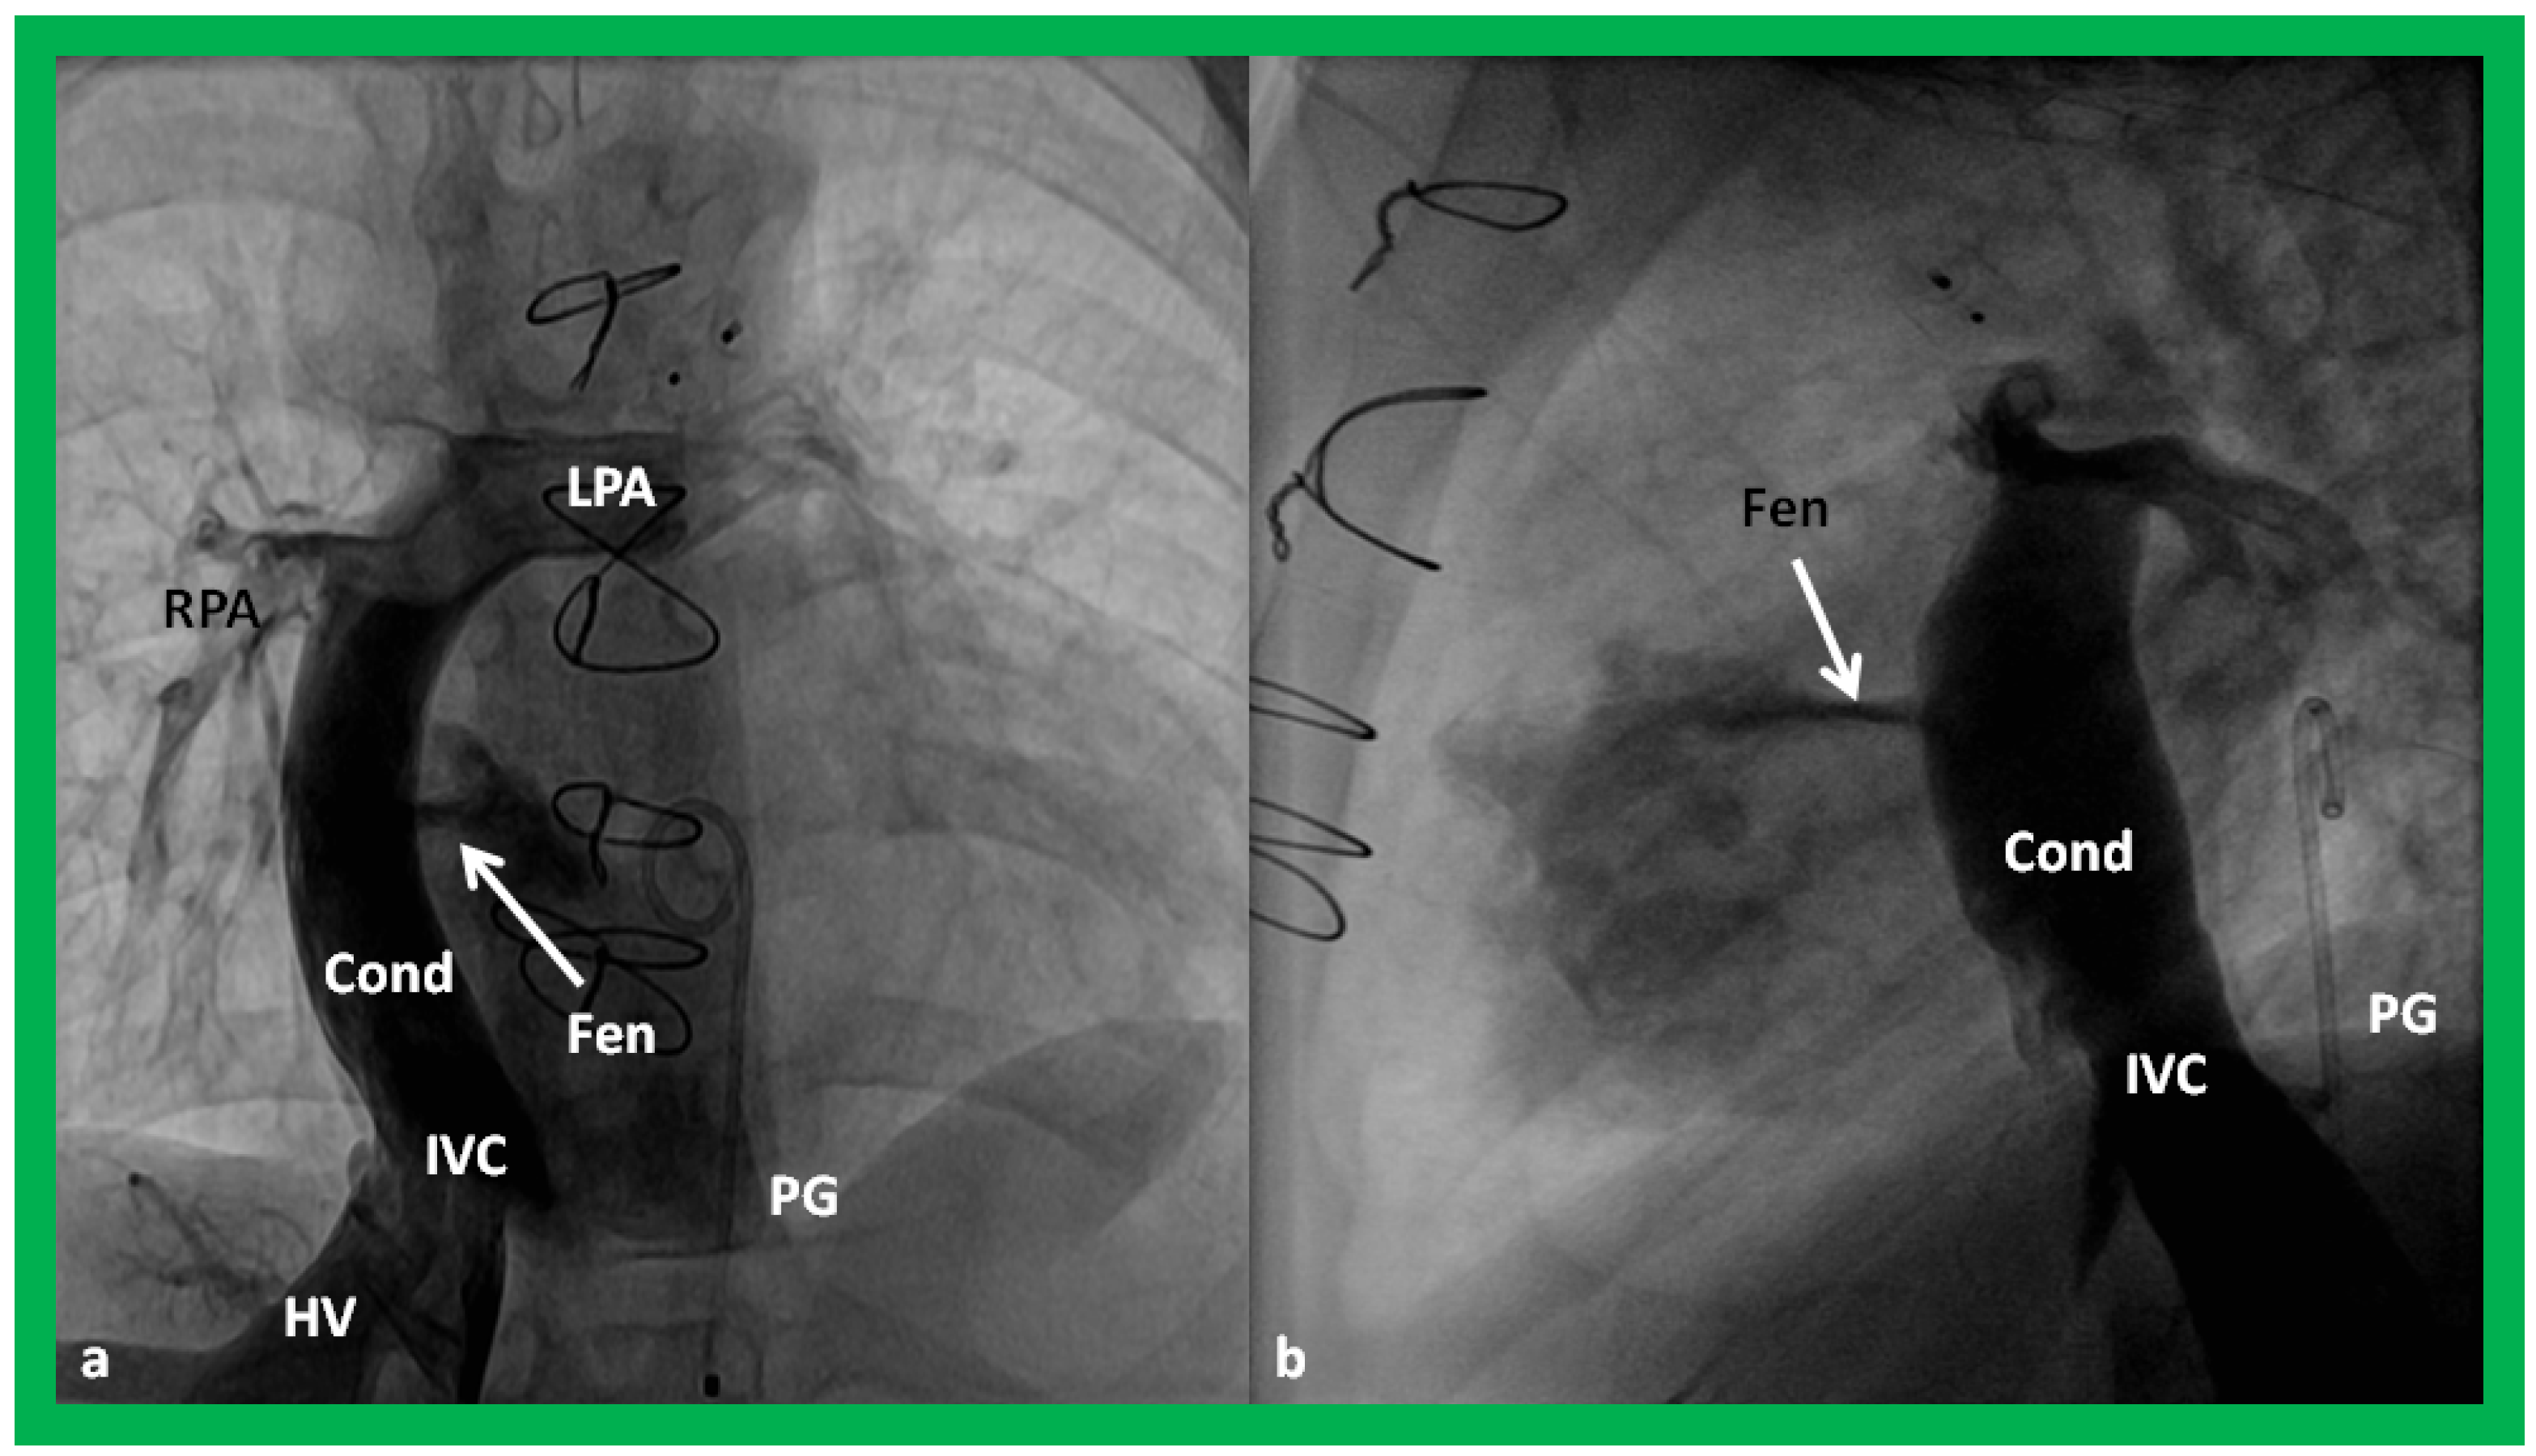
Figure 54.
Selected cine frames in postero–anterior (
a) and lateral (
b) views, demonstrating Stage IIIA Fontan procedure diverting the inferior vena caval (IVC) flow into the pulmonary arteries via a nonvalve conduit (Cond). Flow across the fenestration (Fen) is shown by arrows in (
a,
b). HV, hepatic veins; LPA, left pulmonary artery; PG, pigtail catheter in the descending aorta; RPA, right pulmonary artery. Modified from Rao PS,
Indian J Pediatr, 2015; 82:1147-56 [
36].
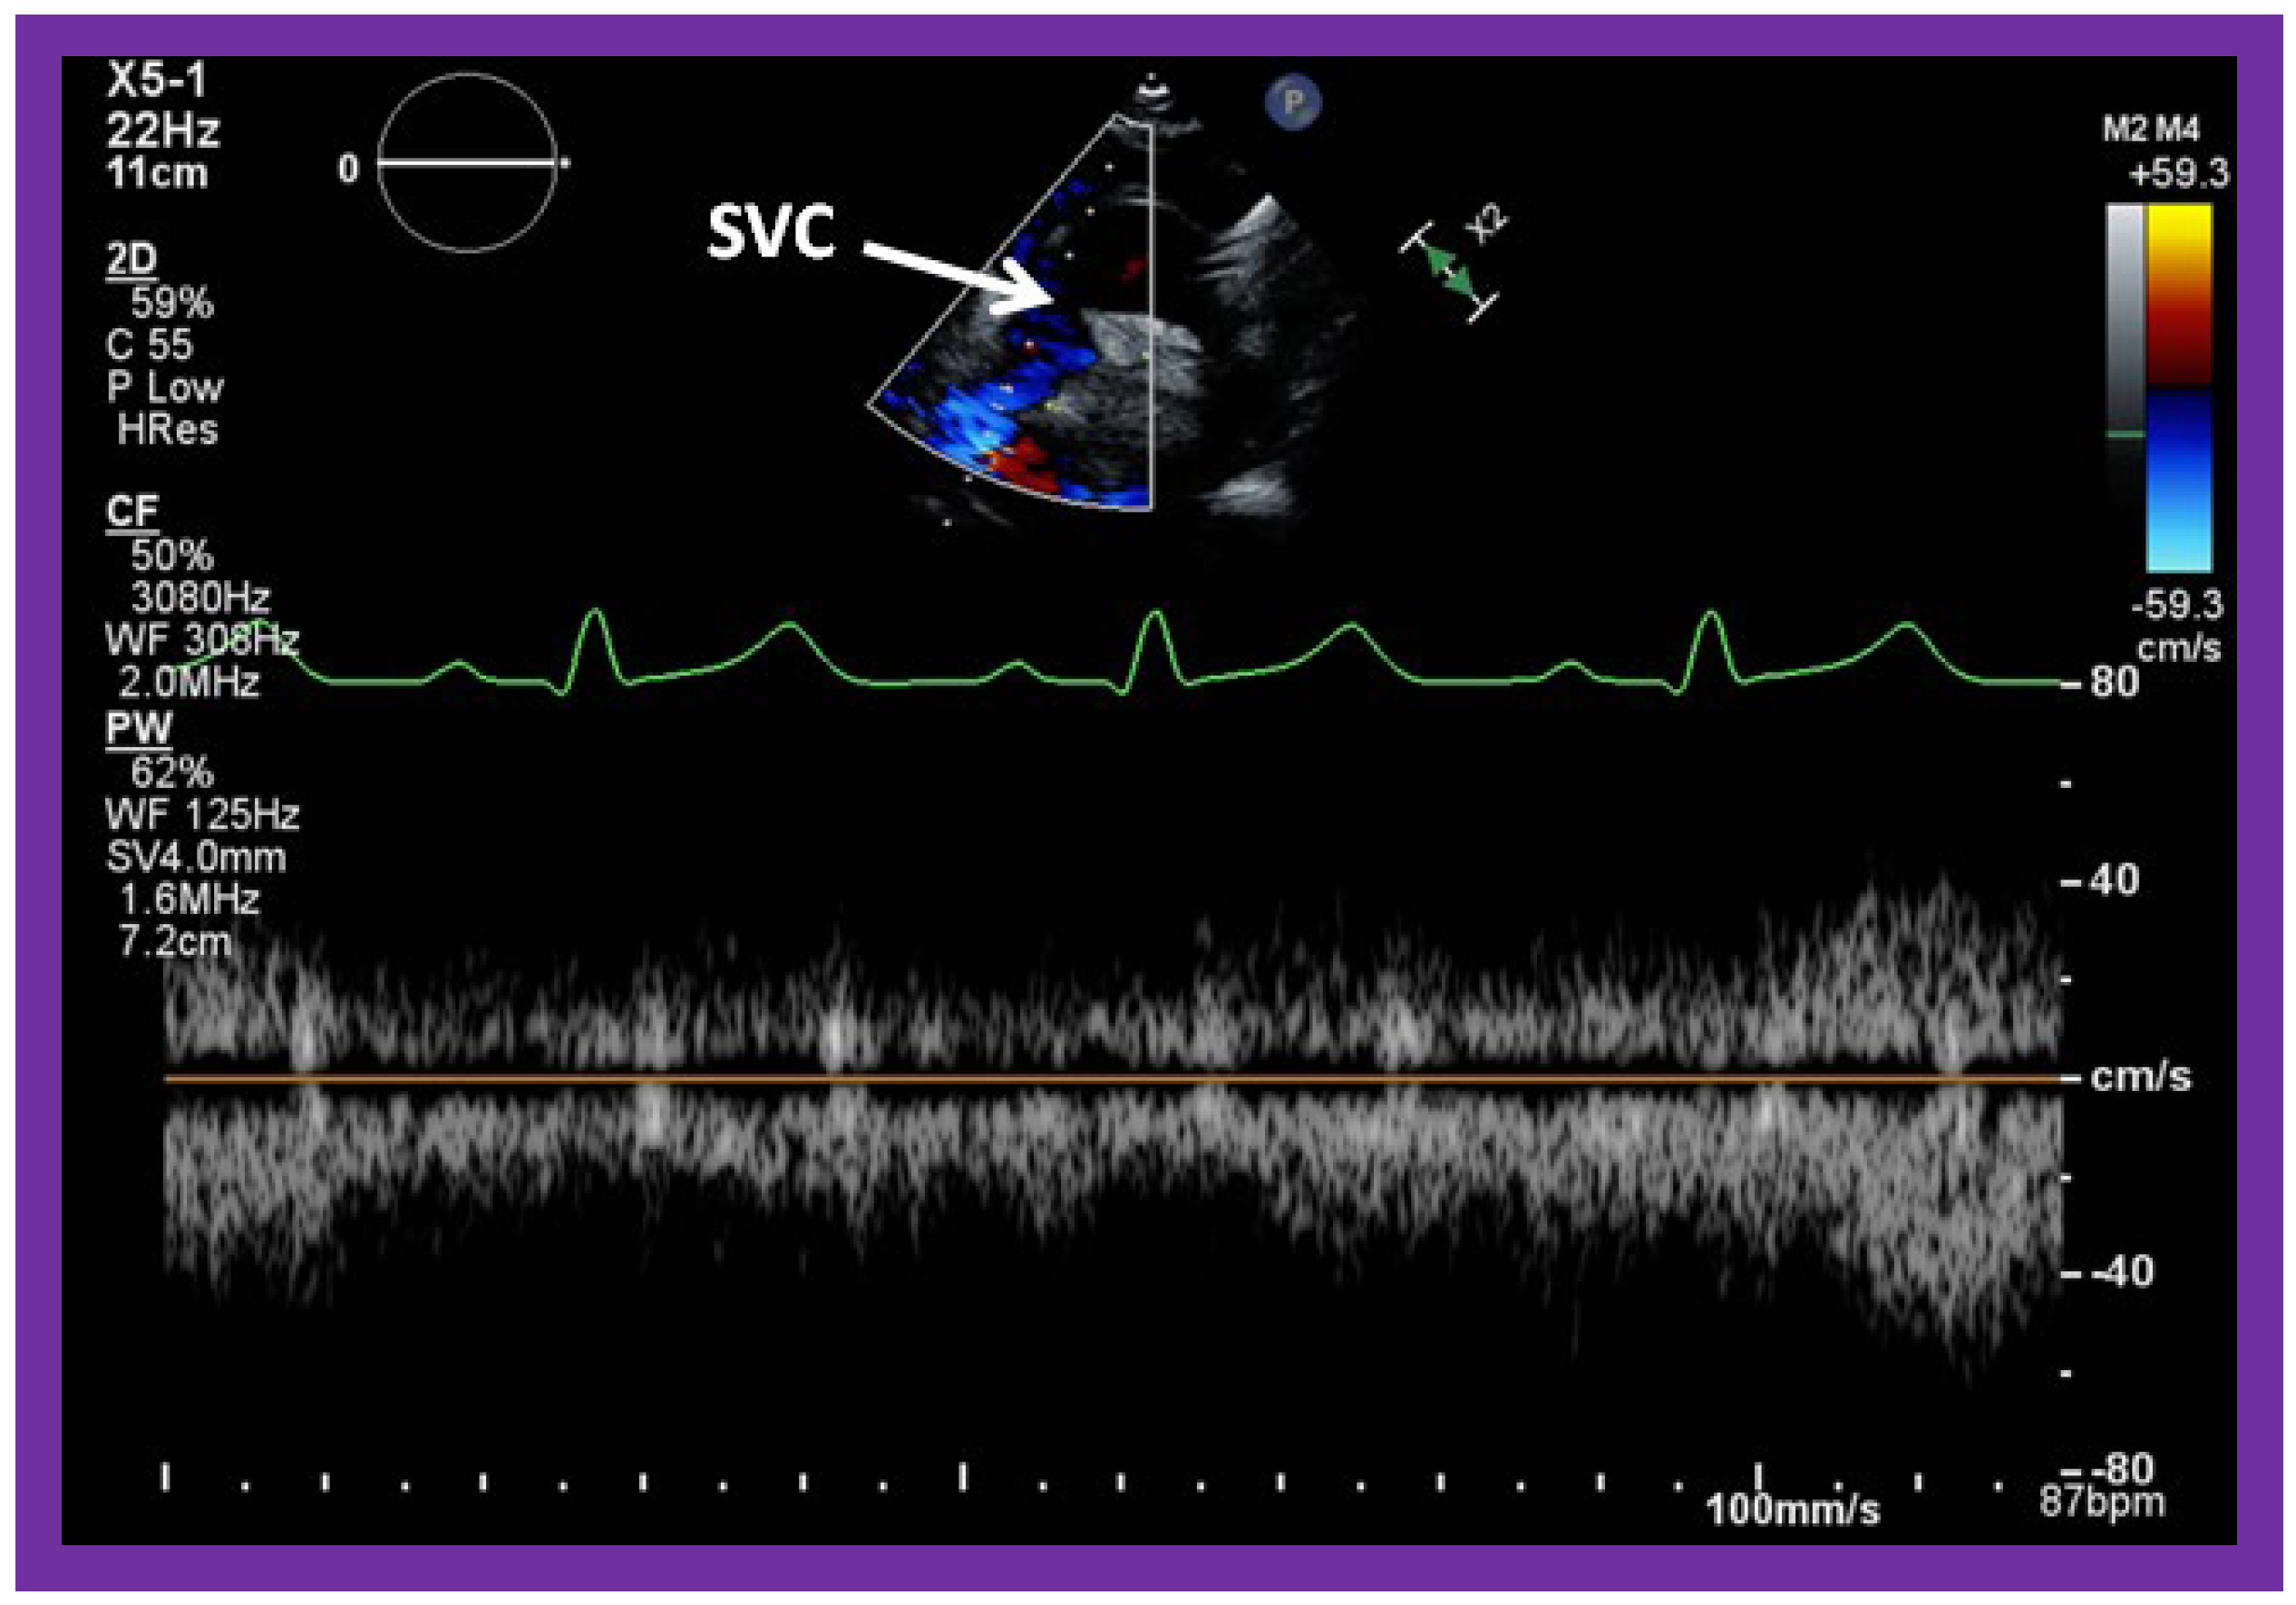
Figure 55.
Selected video frames from suprasternal notch view, demonstrating low Doppler flow velocity across superior vena cava (SVC), bidirectional Glenn shunt and the conduit. Low Doppler flow velocity across the SVC, Glenn and the conduit indicates unobstructed Glenn component of the Fontan.
Figure 55.
Selected video frames from suprasternal notch view, demonstrating low Doppler flow velocity across superior vena cava (SVC), bidirectional Glenn shunt and the conduit. Low Doppler flow velocity across the SVC, Glenn and the conduit indicates unobstructed Glenn component of the Fontan.
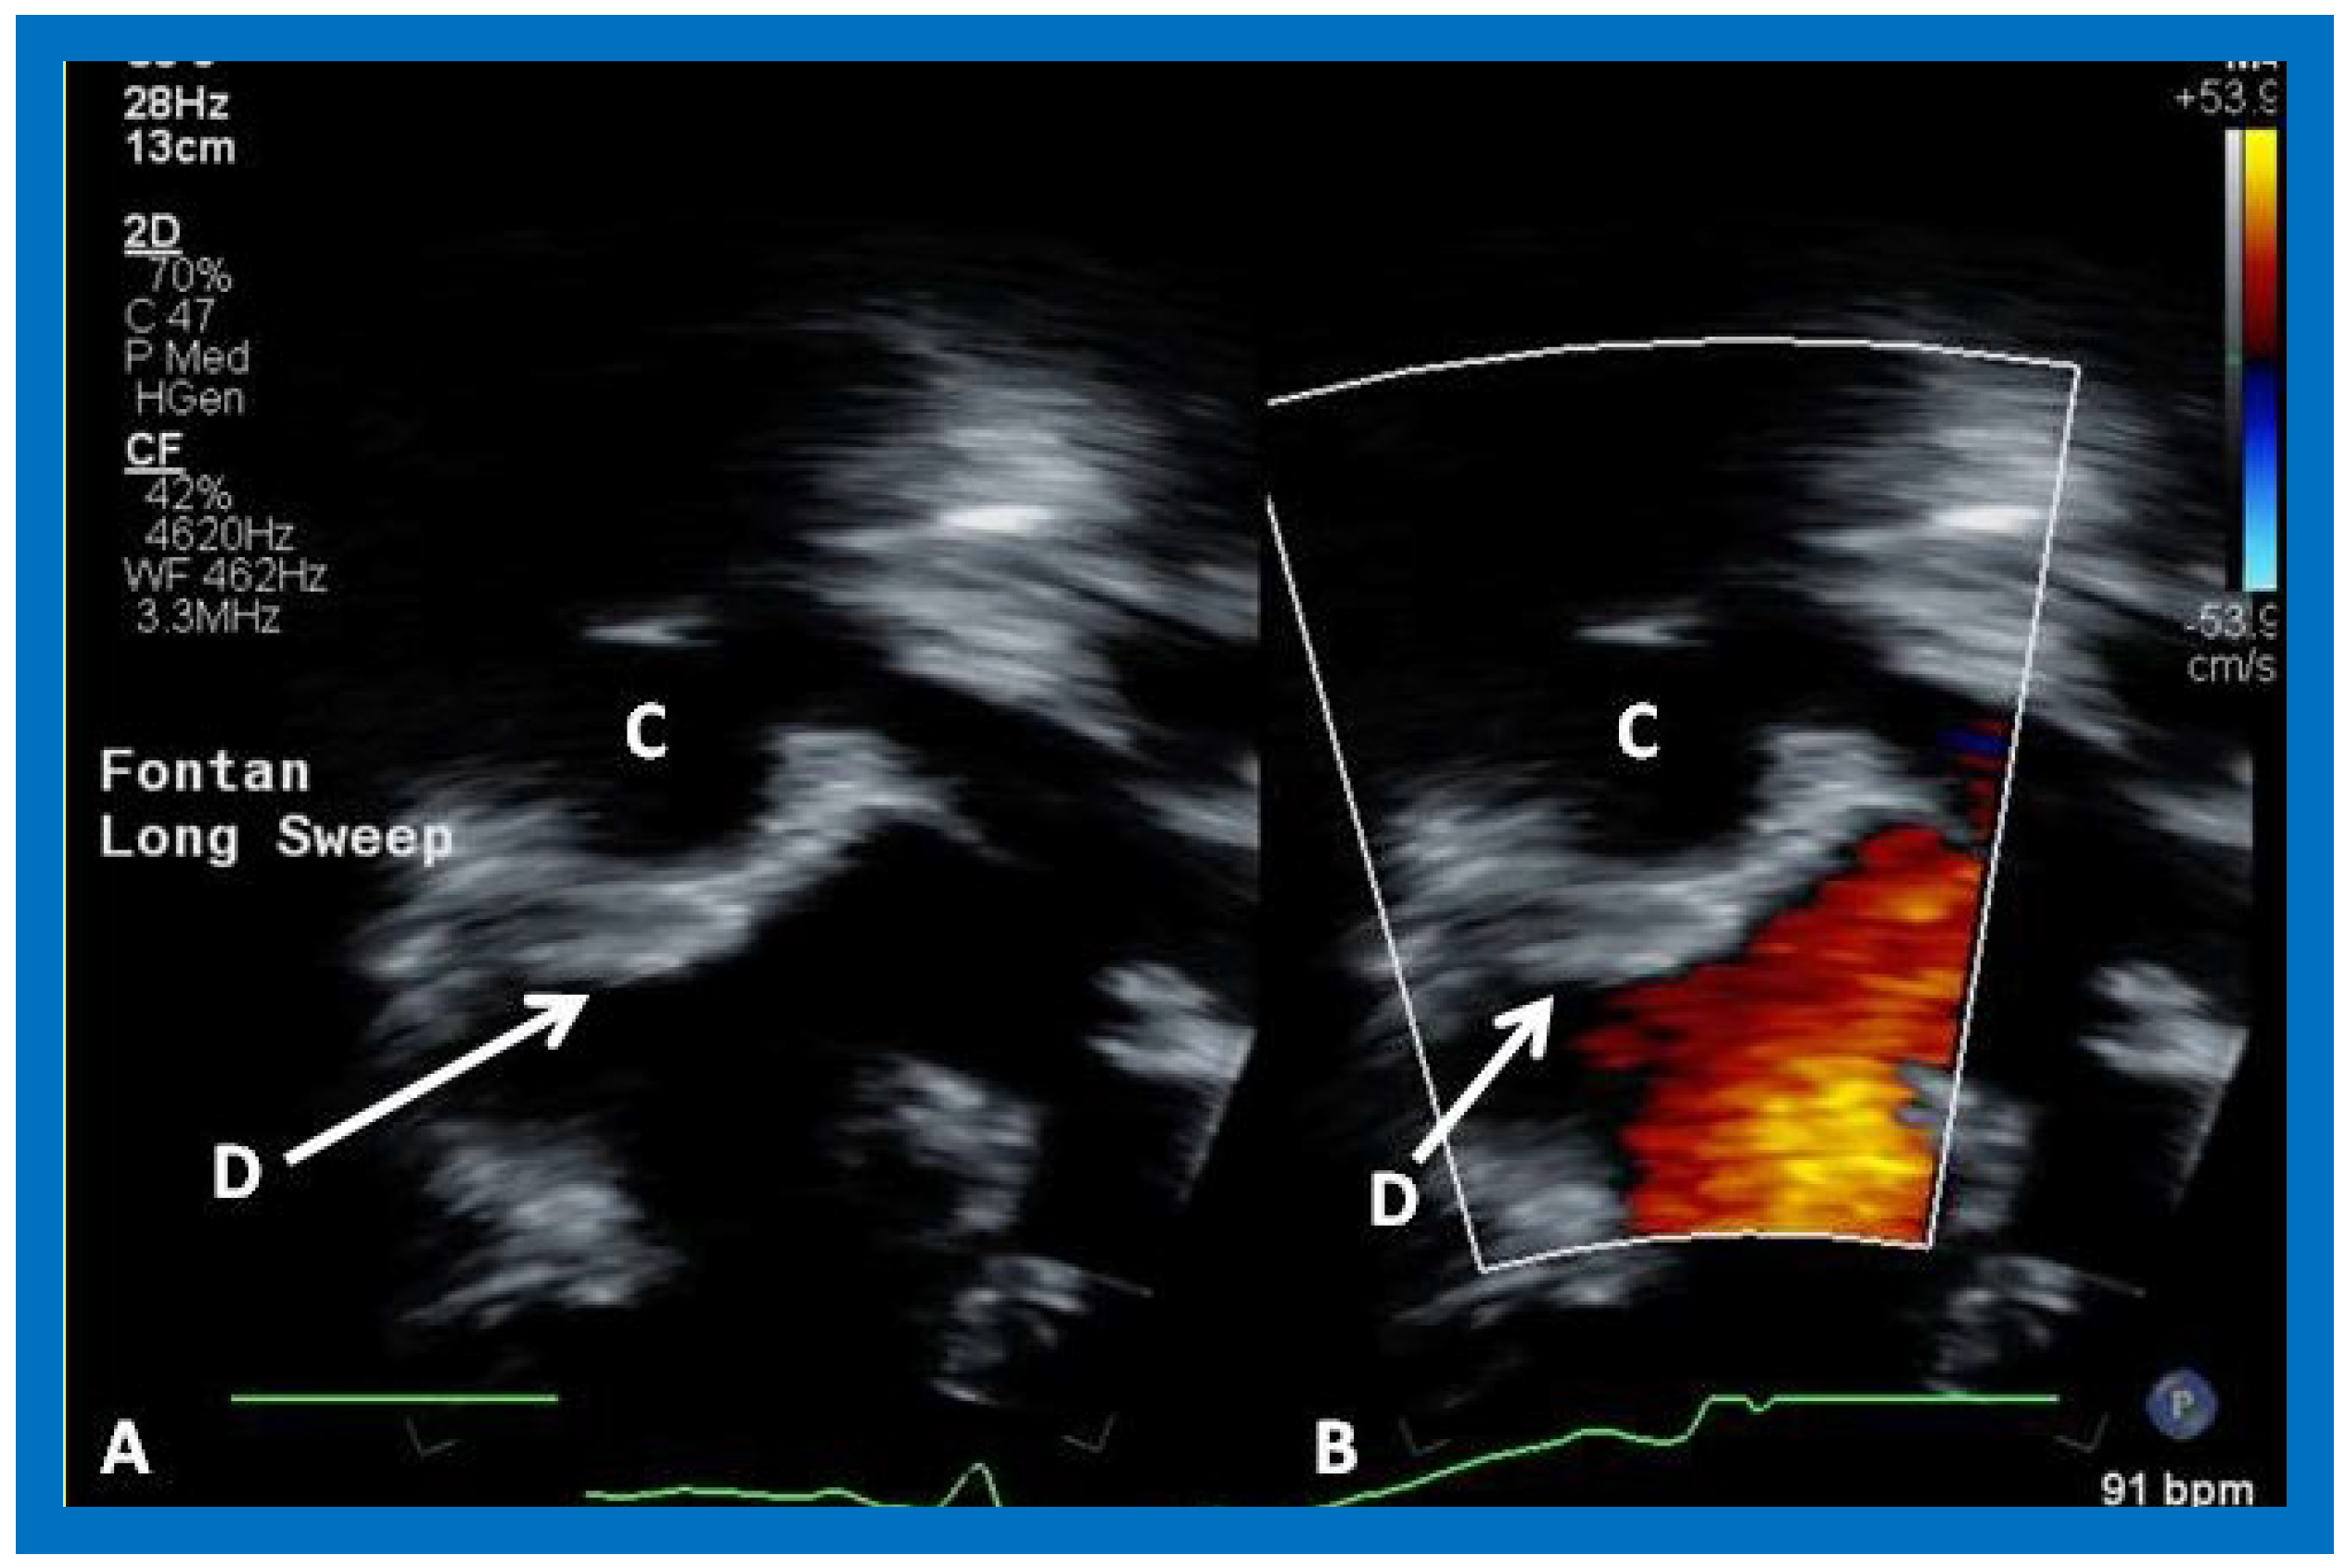
Figure 56.
Selected video frames from apical four chamber view, demonstrating the position of the Amplatzer device (D) (arrows in (
A,
B)). No residual shunt is seen (
B). C, conduit. See
Figure 57 for the angiographic counterpart.
Figure 56.
Selected video frames from apical four chamber view, demonstrating the position of the Amplatzer device (D) (arrows in (
A,
B)). No residual shunt is seen (
B). C, conduit. See
Figure 57 for the angiographic counterpart.
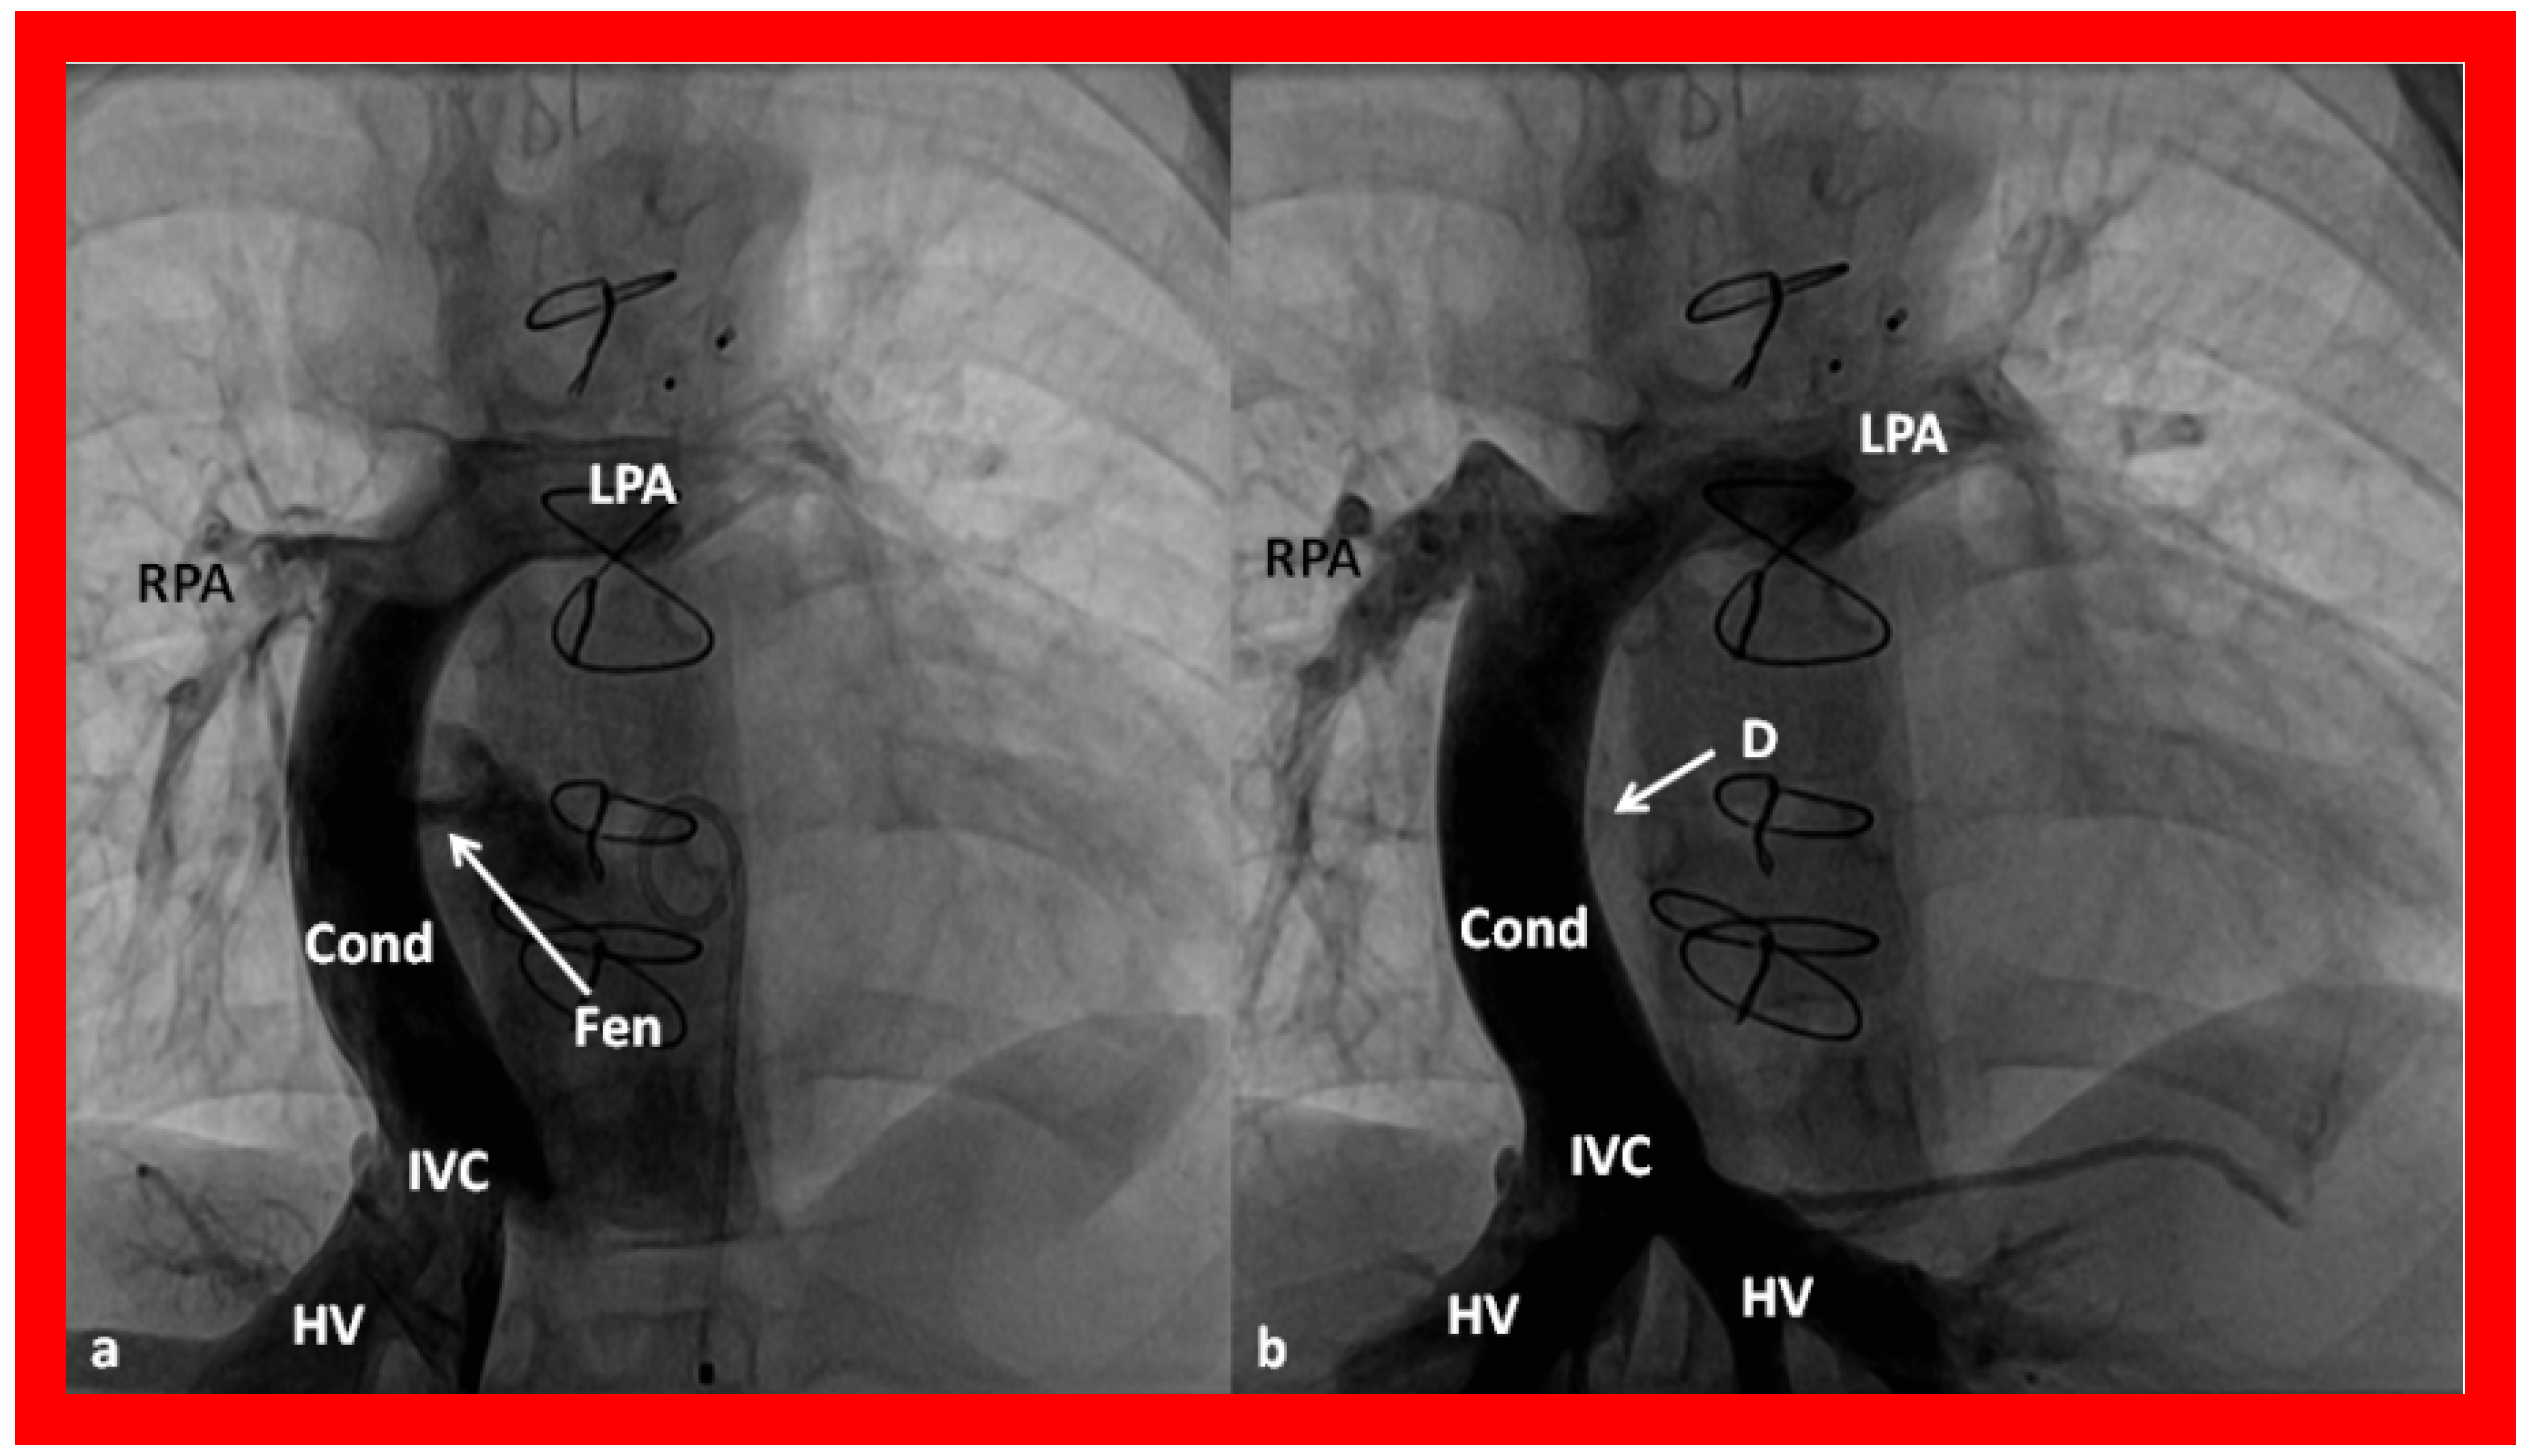
Figure 57.
Selected cineangiographic frames in antero–posterior view, demonstrating Stage IIIA of the Fontan procedure: diverting the inferior vena caval (IVC) flow into the pulmonary arteries via a nonvalve conduit (Cond). Note the fenestration (Fen) shown by the arrow in (
a) The Fen is closed with an Amplatzer device (D), shown by the arrow in (
b) (Stage IIIB). HV, hepatic veins; LPA, left pulmonary artery; RPA, right pulmonary artery. Reproduced from Reference [
36].
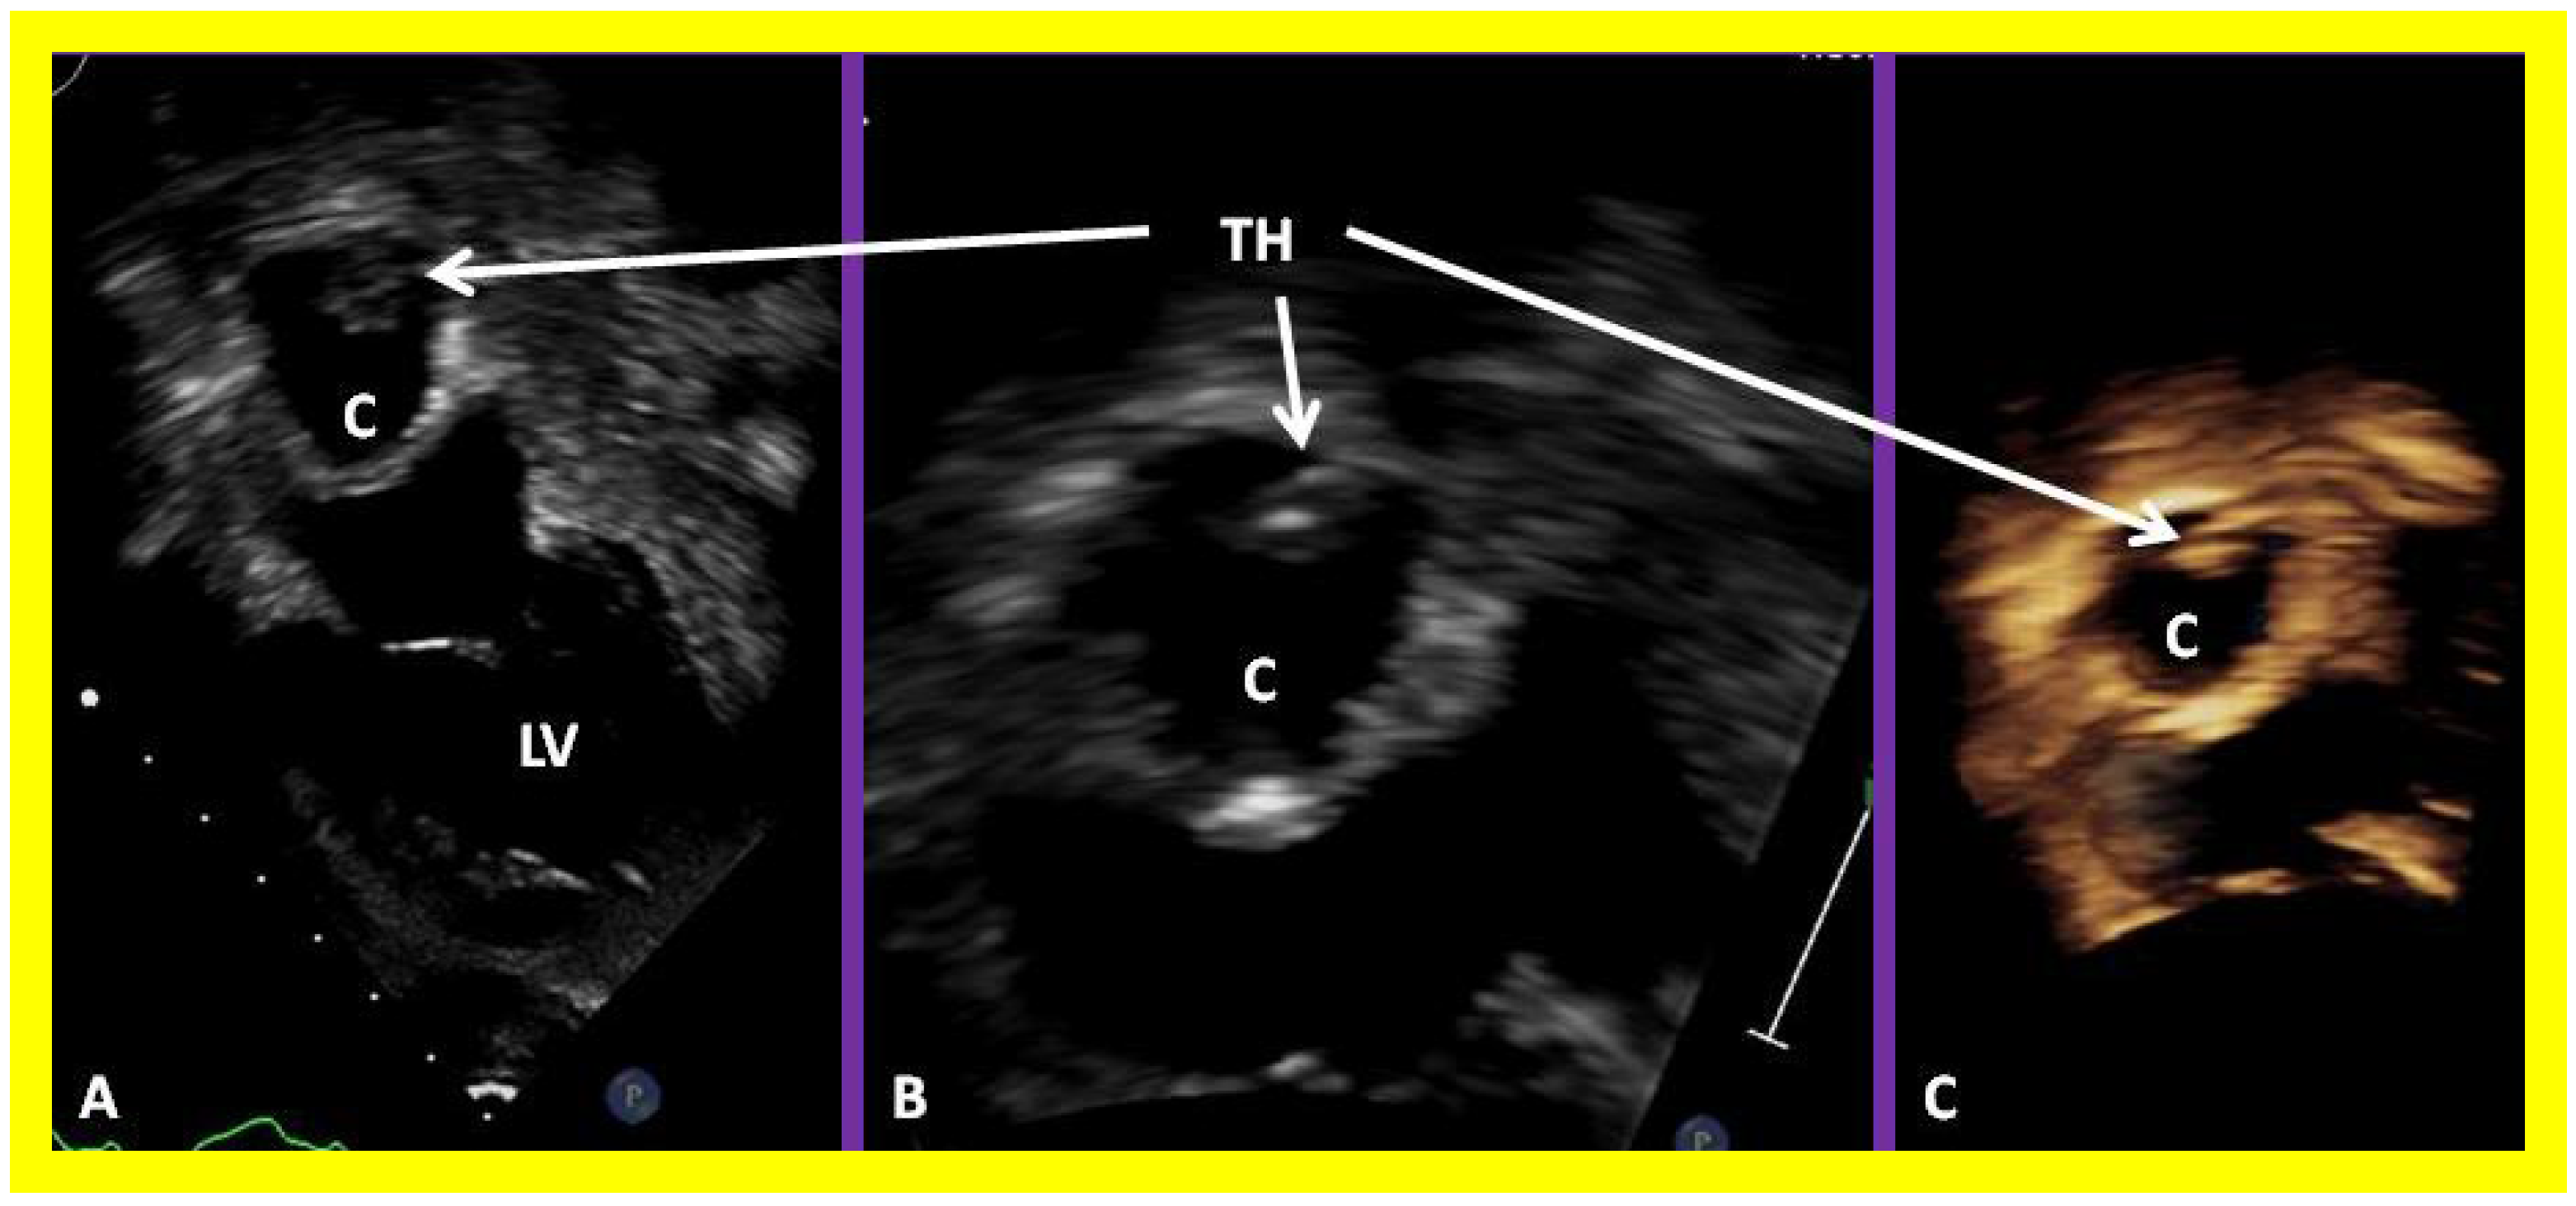
Figure 58.
Selected video frames of 2D echocardiograms demonstrating a thrombus (TH) within the conduit (C) in a four chamber apical view (A) which was magnified in (B). 3D image is shown in (C). LV, left ventricle.
Figure 58.
Selected video frames of 2D echocardiograms demonstrating a thrombus (TH) within the conduit (C) in a four chamber apical view (A) which was magnified in (B). 3D image is shown in (C). LV, left ventricle.
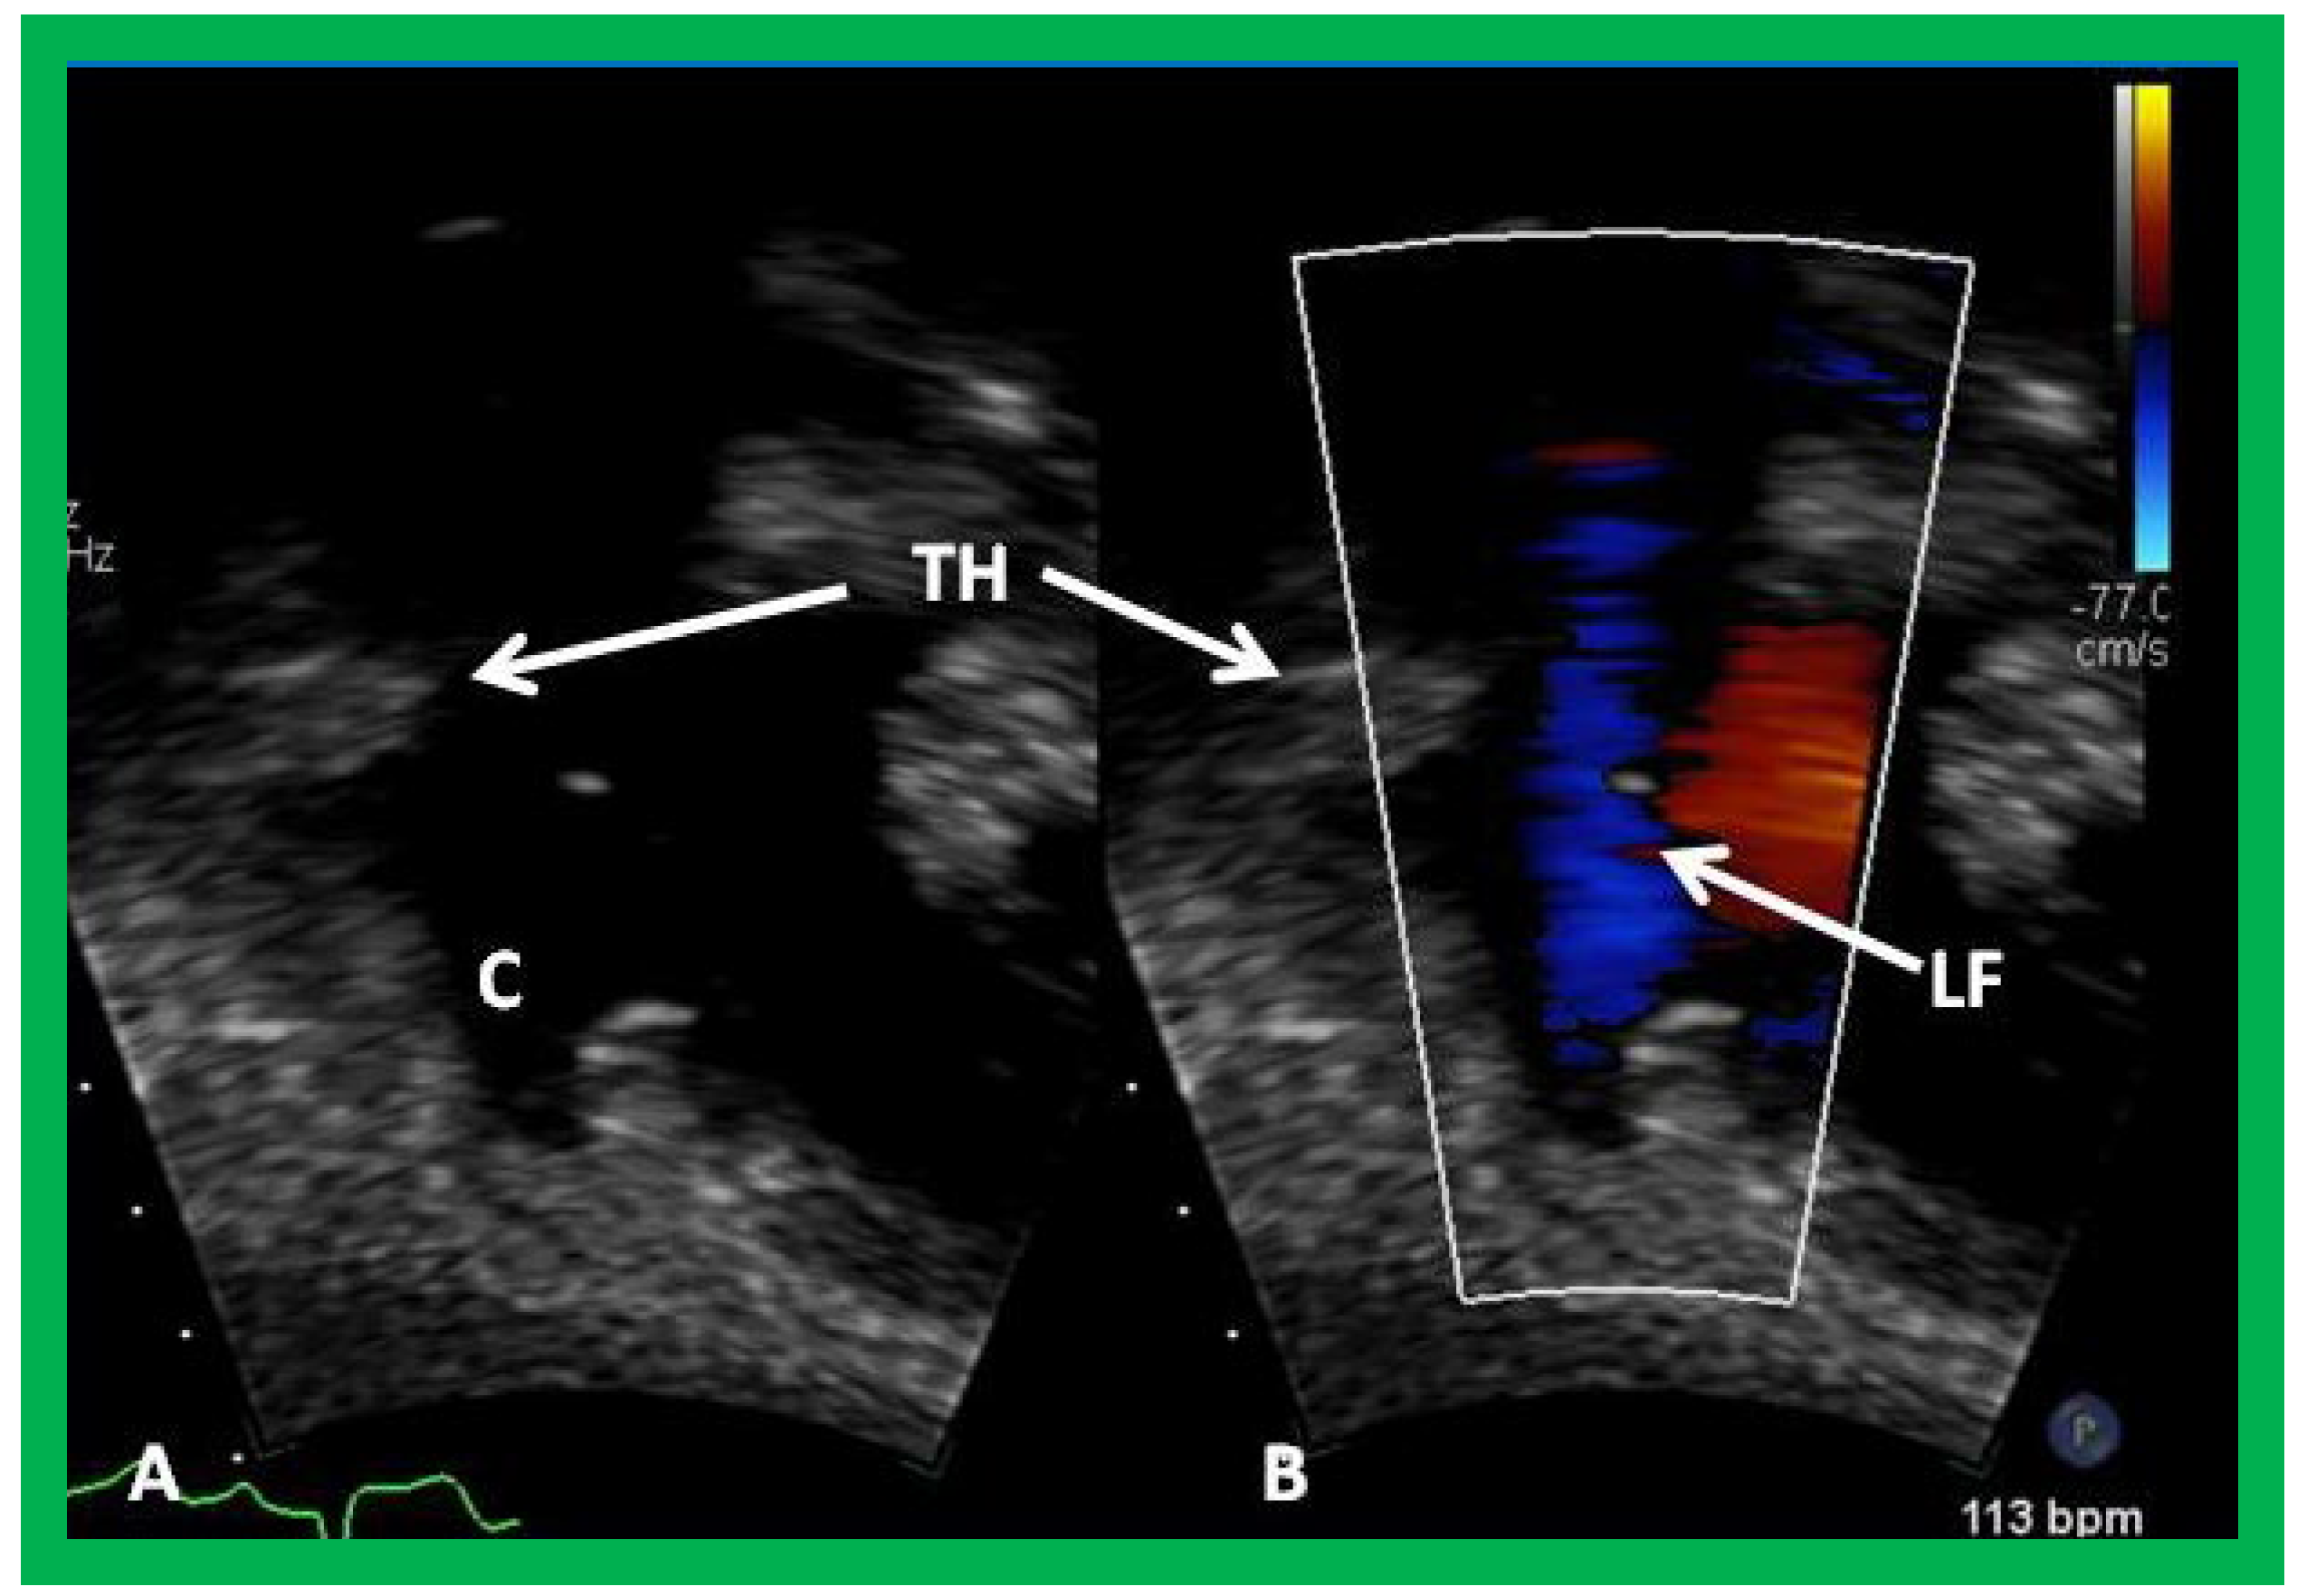
Figure 59.
Selected video frames demonstrating wide open conduit (C) by 2D (A) and color flow imaging (B) despite the thrombus (TH). Laminar flow (LF) and pulsed and continuous wave Doppler interrogation (not shown) do not indicate obstruction.
Figure 59.
Selected video frames demonstrating wide open conduit (C) by 2D (A) and color flow imaging (B) despite the thrombus (TH). Laminar flow (LF) and pulsed and continuous wave Doppler interrogation (not shown) do not indicate obstruction.


