Article

Mechanical and Acoustic Emission (AE) Characteristics of Rocks under Biaxial Confinements

1
School of Resources and Safety Engineering, Central South University, Changsha 410083, Hunan, China
2
Advanced Research Center, Central South University, Changsha 410083, Hunan, China
3
Changchun Gold Research Institute Co. Ltd., Changchun 130012, Jilin, China
*
Author to whom correspondence should be addressed.
Appl. Sci. 2021, 11(2), 769; https://doi.org/10.3390/app11020769
Submission received: 4 December 2020 / Revised: 9 January 2021 / Accepted: 11 January 2021 / Published: 14 January 2021
(This article belongs to the Special Issue Fracture and Fatigue Assessments of Structural Components Ⅱ)

Abstract

:
The surrounding rocks of underground engineering are generally subjected to a biaxial compressive stress condition. The failure properties of rocks under such a stress condition are worthy of being studied to ensure the stability of surrounding rock. This study aims to investigate the mechanical characteristics and acoustic emission (AE) properties of granite, marble, and sandstone in biaxial compression tests. Under biaxial confinements, it is evident that the elastic moduli of the three types of rocks decrease, and the plasticity increases monotonously with the increase of the intermediate principal stress σ2. As σ2 increases, the biaxial compressive strength σbcs of rock increases initially and subsequently decreases. The lateral strain ε2 of rock under biaxial confinement is controlled by both σ1 and σ2, and the restrain degree in the development of microcracks and the constrain extent in the expansion along the direction of σ2 are both enhanced gradually with increase in σ2. The sharp increase points of AE hit and AE count indicate that the failure will occur soon. The AF-RA distribution of AE signals shows that the increase of σ2 causes more tensile cracks in rock. According to the dip failure angle of macro-cracks in rock under biaxial confinement, the failure modes of granite and marble are slabbing, while failure mode of sandstone is shear. In addition, the σ2 has a positive effect on the mass ratio of large size fragments after rock failure. An exponent relationship between the σbcs and σ2 was found, and the inner apices–inscribed Drucker–Prager criterion can be used to predict the σbcs of rock.

1. Introduction

The underground rocks in the vicinity of underground engineering boundaries are subjected to a static biaxial compressive geo-stress state (the minimum principal stress σ3 unloading to 0, and the maximum principal stress σ1 and the intermediate principal stress σ2 reaching a new balanced state) after the excavation operations [1,2,3,4,5,6], as shown in Figure 1a. Thus, the studies of the load-carrying ability and failure behaviors of rocks under biaxial confinements are fundamental for a better understanding of the rock disasters and for effective design and construction of underground engineering [7,8,9].
Many researchers have made great efforts in this field and have achieved many results. The biaxial compression tests were initially carried out using a hollow cylinder and cubes coal specimens by Hobbs [10], but not long after that, the cubic rock specimens became more widely used, and a growing number of research findings in biaxial compression tests have been reported [11]. The cubic sandstone specimens with a side length of 75 mm have been used in biaxial compression tests to determine the biaxial compressive characteristics of rocks. It was found that the biaxial compressive strength σbcs is significantly increased with the increase of lateral confinement. Besides, the failure is generally initiated by rock spalling at the free faces at the early stage of loading, and the ultimate failure occurs in a form of an out-of-plane shear failure [12]. Under a high σ2, the microcracks and fractures in the rocks can only develop in the plane of σ1-σ2, which leads to the anisotropic failure behaviors of rocks [13]. Furthermore, the σ2 has a limited influence on the peak strength of the rock near the excavation boundary [14]. The σ2 in a plastic potential function has a significant impact on the evolution of volumetric plastic strain, thereby exerting an influence on the overall stability of rock mass structures [15]. The specimen’s failure and crack coalescence are at the same time under compression, while crack coalescence occurs first, and then failure occurs in the state of biaxial confinements [16]. More energy would be required for rock failure under equal biaxial compression than under unequal biaxial compression [17]. Under biaxial confinements, structural failure occurred mainly in the specimens when the number of natural cracks in the rock is small, and the specimen appears local failure with the increase of the number of natural cracks, and under the state of low initial stress can accelerate the propagation of a large number of cracks [18,19].
The σbcs-σ2 envelopes of rocks in biaxial compression tests (σ1σ2 ≥ 0, σ3 = 0) from other literature [19,20,21,22] are shown in Figure 1b, and the results are concluded as follows: (1) The uniaxial compressive strengths σucs of limestone and granite are approximately equal to the biaxial compressive strengths σbcs under the biaxial compessions with σ1 = σ2, while the σbcs of red sandstone, sandstone, and salt are much bigger than σucs; (2) The σbcs,peak (the maximum value of σbcs) of limestone, red sandstone, granite, sandstone, and salt is 21%, 53%, 63%, 85%, and 87% higher than their σucs, respectively; (3) When the σ2 is about 0.5σucs, the σbcs of limestone and granite reaches the σbcs,peak, and the σbcs,peak of red sandstone, sandstone, and salt can be obtained under the condition of biaxial compression with σ2 = 0.8σucs, σ2 = σucs, and σ2 = σucs, respectively. Because the testing conditions are different in kinds of literature, so the change regular of the σbcs is not clear for different rocks. It is necessary to carry out in-depth studies on the σbcs of rocks.
The end friction between the loading platen and rock specimen has a great effect on the failure properties of rocks in biaxial compression tests [23]. It is necessary to take anti-friction measures when the biaxial compression tests are conducted. Figure 1c shows two typical groups of biaxial compressive strength of rocks, and there are clear differences between the strength results without anti-friction measures and these with anti-friction measures. In general, brush platen and solid steel platen pasted with molybdenum disulfide (MoS2) powder were the most used measures to reduce end friction in biaxial compression tests and it was observed that the end friction could increase the σbcs, and the use of molybdenum disulfide to eliminate the end friction is more effective than brush platen [24]. It was also found that the 1:1 mixture of stearic acid and vaseline produces the lowest coefficient of friction compared to Teflon, graphite, and MoS2 [22]. In the biaxial compression tests, the failure surfaces of specimens without anti-friction measures are coarse and fine, and most of them are curved, indicating that the friction effect at the end limits the free propagation of cracks, while the failure of most specimens is spalling along the direction of σ1, and the failure surface is large and straight when “1 mm thick PTFE gasket pasted with vaseline” is used to anti-friction [25]. Additionally, the end friction effects markedly weakened with increasing confining pressure under the same anti-friction measures [8,26,27,28].
Acoustic emission (AE) is a nondestructive inspection technique utilizing the transient elastic energy which results mainly from crack propagation events inside a material [29,30,31]. AE has been broadly applied to rock to obtain the information about crack initiation and propagation, failure mode, abrupt failure of the structure, and correspondingly some of the phenomena in time sequence for a detailed and systematic analysis [32,33,34,35]. Aggelis proposed that the distinct signature of the cracking modes is reflected on AE waveform parameters like the amplitude, RA-value (where RA is the ratio of rising time to the amplitude of AE wave), and average frequency, and achieved the conclusion that AE waveform signals generated in shear tests have a greater RA-value and a smaller average frequency than that of AE waveform signals generated in tensile tests [36,37]. Cai investigated the generation time of the initial crack in terms of the information of the AE events generated in the failure process of rock specimens and AE characteristics of rocks in lab experiments and accordingly established the generalized AE initiation and damage thresholds [38]. Lei et al. studied AE activity during a catastrophic fracture of fault in rock and obtained the detailed time-space distribution of AE events from lab tests [39]. Tham et al. discovered that the granite and marble specimens in tensile tests have different fracture surfaces and AE characteristics, and rock lithology played a vital role [40]. AE was applied to investigate the fracture and damage mechanisms of rock induced by the propagation of microcracks under triaxial compression test, and it was found that shear failure was a major microscopic failure mechanism of rock under triaxial compression [41]. Tsuyoshi et al. demonstrated that the precision and sensitivity of AE technology are high for detecting crack propagation in the rock under a direct shear test [42,43]. In engineering fields, AE technique is regarded as a promising and flexible tool, which has been widely used in monitoring and even quantifying dynamic processes within loaded structural elements [44,45].
The aforementioned efforts had provided constructive reference values and information for a better understanding of the relationship between rock fracture processes and AE characteristics. However, most of the previous studies mentioned above concentrated on the AE characteristics of single lithology rock under a certain test condition, and the ranges of intermediate principal stress were limited in most biaxial compression tests. Thus, more investigations of the influences of rock lithologies and the full range of intermediate principal stress on AE characteristics are needed. Therefore, in this study, three kinds of cubic rock specimens, i.e., granite, marble, and sandstone, were prepared, and the value of σ2 was preset from 0 (uniaxial compression) to σ1 = σ2 to analyze the detailed mechanical characteristics and AE properties of rocks under biaxial confinements. The results of this study will improve the theoretical system of damage mechanisms and AE characteristics of rocks in underground engineering, and provide a reference for engineering damage prediction and monitoring.
In this paper, the mechanical characteristics of rocks under biaxial compression, such as stress–strain curves (lateral strain and axial strain) and the variation of biaxial compression strength with σ2, were first analyzed, and then the AE characteristics monitored by the two AE sensors installed on the free-surface of rock specimen, such as AE hit rate, AE count rate, b-value, RA-AF, and peak frequency, were studied. In addition, the failure modes of rocks were investigated, and finally, the D-P strength criterion was also verified.

2. Experimental Methodology

2.1. Rock Specimens

The intact marble, sandstone, and granite were selected as research materials and processed into cubic specimens with a side length of 50 mm for considerations of the end effect and the limited loading capacity of the apparatus in this study, as shown in Figure 2a.
Before the biaxial compression testing, the mineral compositions of the three rocks were achieved by petrographic thin-section tests. The test results are shown in Figure 2b–d. The analysis results showed that the main mineral components of granite are feldspar (50–60%) and quartz (20–30%) (Figure 2b), the main mineral components of marble are magnesite (35~45%), calcite (40~50%), and interstitial material (5~25%) (Figure 2c), whereas the main mineral components of sandstone are quartz (50–70%) and feldspar (10–30%), as well as a little of biotite and muscovite (Figure 2d).

2.2. Stress Paths

Two kinds of stress loading paths in biaxial compression tests were applied in this study. The detailed loading steps of Path I were as follows: Firstly, the maximum principal stress σ1 and the intermediate principal stress σ2 are loaded synchronously to the preset value of σ2 at the same loading rate (0.2 MPa/s). Then, the σ2 remained at the predefined levels, and the σ1 continued to increase until the final failure of the rock specimen (Figure 3a). Path II was applied to check the bearing capacity of rocks under σ1 = σ2. The σ1 and σ2 are loaded synchronously at the same loading speeds (0.2 MPa/s) until rock failure (Figure 3b). The peak values of the σ1 were defined as the biaxial compressive strength σbcs of rocks. The σbcs of rocks under σ2 = 0 was also called the uniaxial compressive strength σucs.
The preset values of σ2 varied for different rocks in Path I, which were 0, 5, 10, 20, 40, and 60 MPa for granite, 0, 5, 10, 20, and 40 MPa for marble, and 0, 5, 10, and 20 MPa for sandstone, as shown in Table 1.

2.3. Anti-Friction Measures

Before testing, some strict anti-friction measures, containing two layers of polythene sheet and two layers of vaseline, were applied in this study to reduce the end friction effect on the test results. The detailed steps were as follows: (1) The vaseline and polythene sheets with a cross-section of 50 × 50 mm were prepared; (2) Cleaning the four loading surfaces of specimens, and then evenly applying the first layer of vaseline, and sticking the first layer of polythene sheet on the first layer of vaseline. (3) Applying the second layer of vaseline evenly on the first layer of polythene sheet, and then sticking the second layer of polythene sheet on the second layer of vaseline (Figure 4).

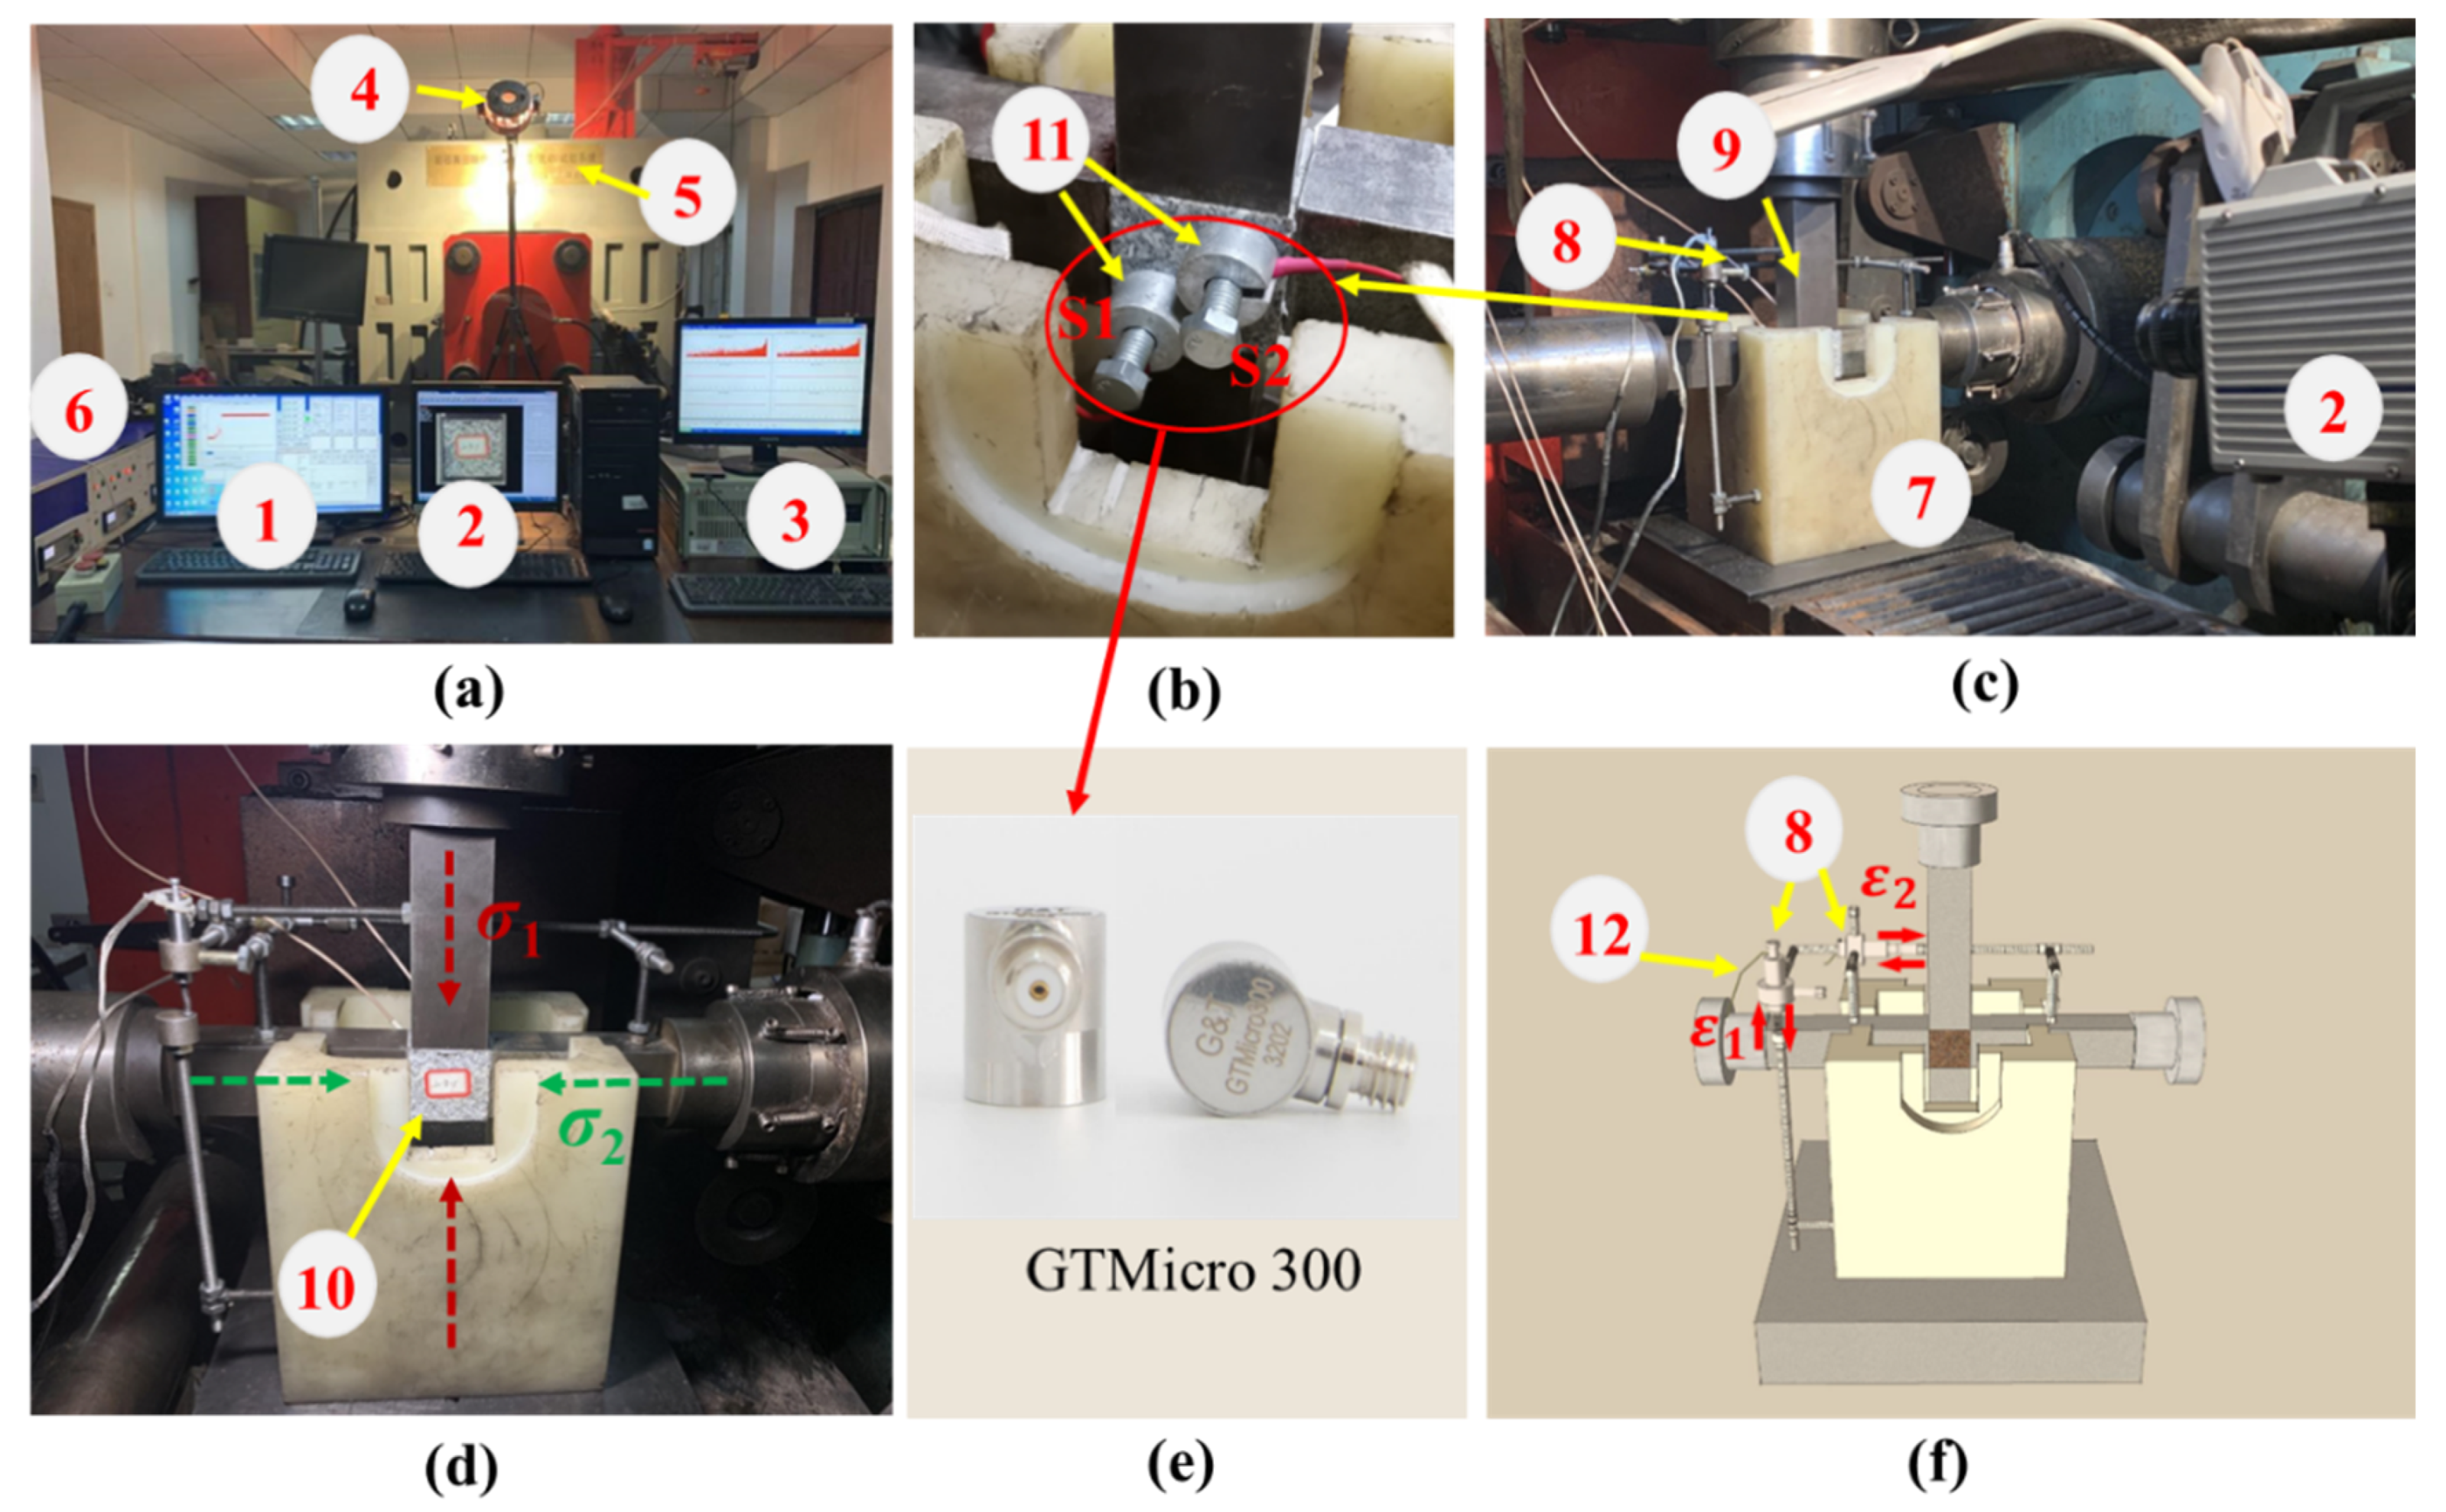
2.4. Testing Apparatus

All tests were conducted using the TRW-3000 true-triaxial testing apparatus at Central South University, China, which can load in three mutually perpendicular directions (σ1, σ2, and σ3), respectively. The loading capacities along the three directions are over 2000 kN, and the loading accuracy is ±1%, as shown in Figure 5a. In this study, the cubic rock specimens were placed in the σ1-σ2 plane, as shown in Figure 5c,d. Before testing, each specimen was stuck with two GTMicro-300 type AE sensors numbered as “S1” and ”S2” on the same free surface to obtain the AE signals. Generally, the AE data from sensor S1 was selected for analysis, and the sensor S2 was just installed for backup and comparative verification, as shown in Figure 5b,e. Besides, two extensometers were applied to test the deformation of the specimens along the direction of σ1 and σ2 (Figure 5f). The AE system and loading apparatus started to record data synchronously until rock failure.

3. Results and Discussion

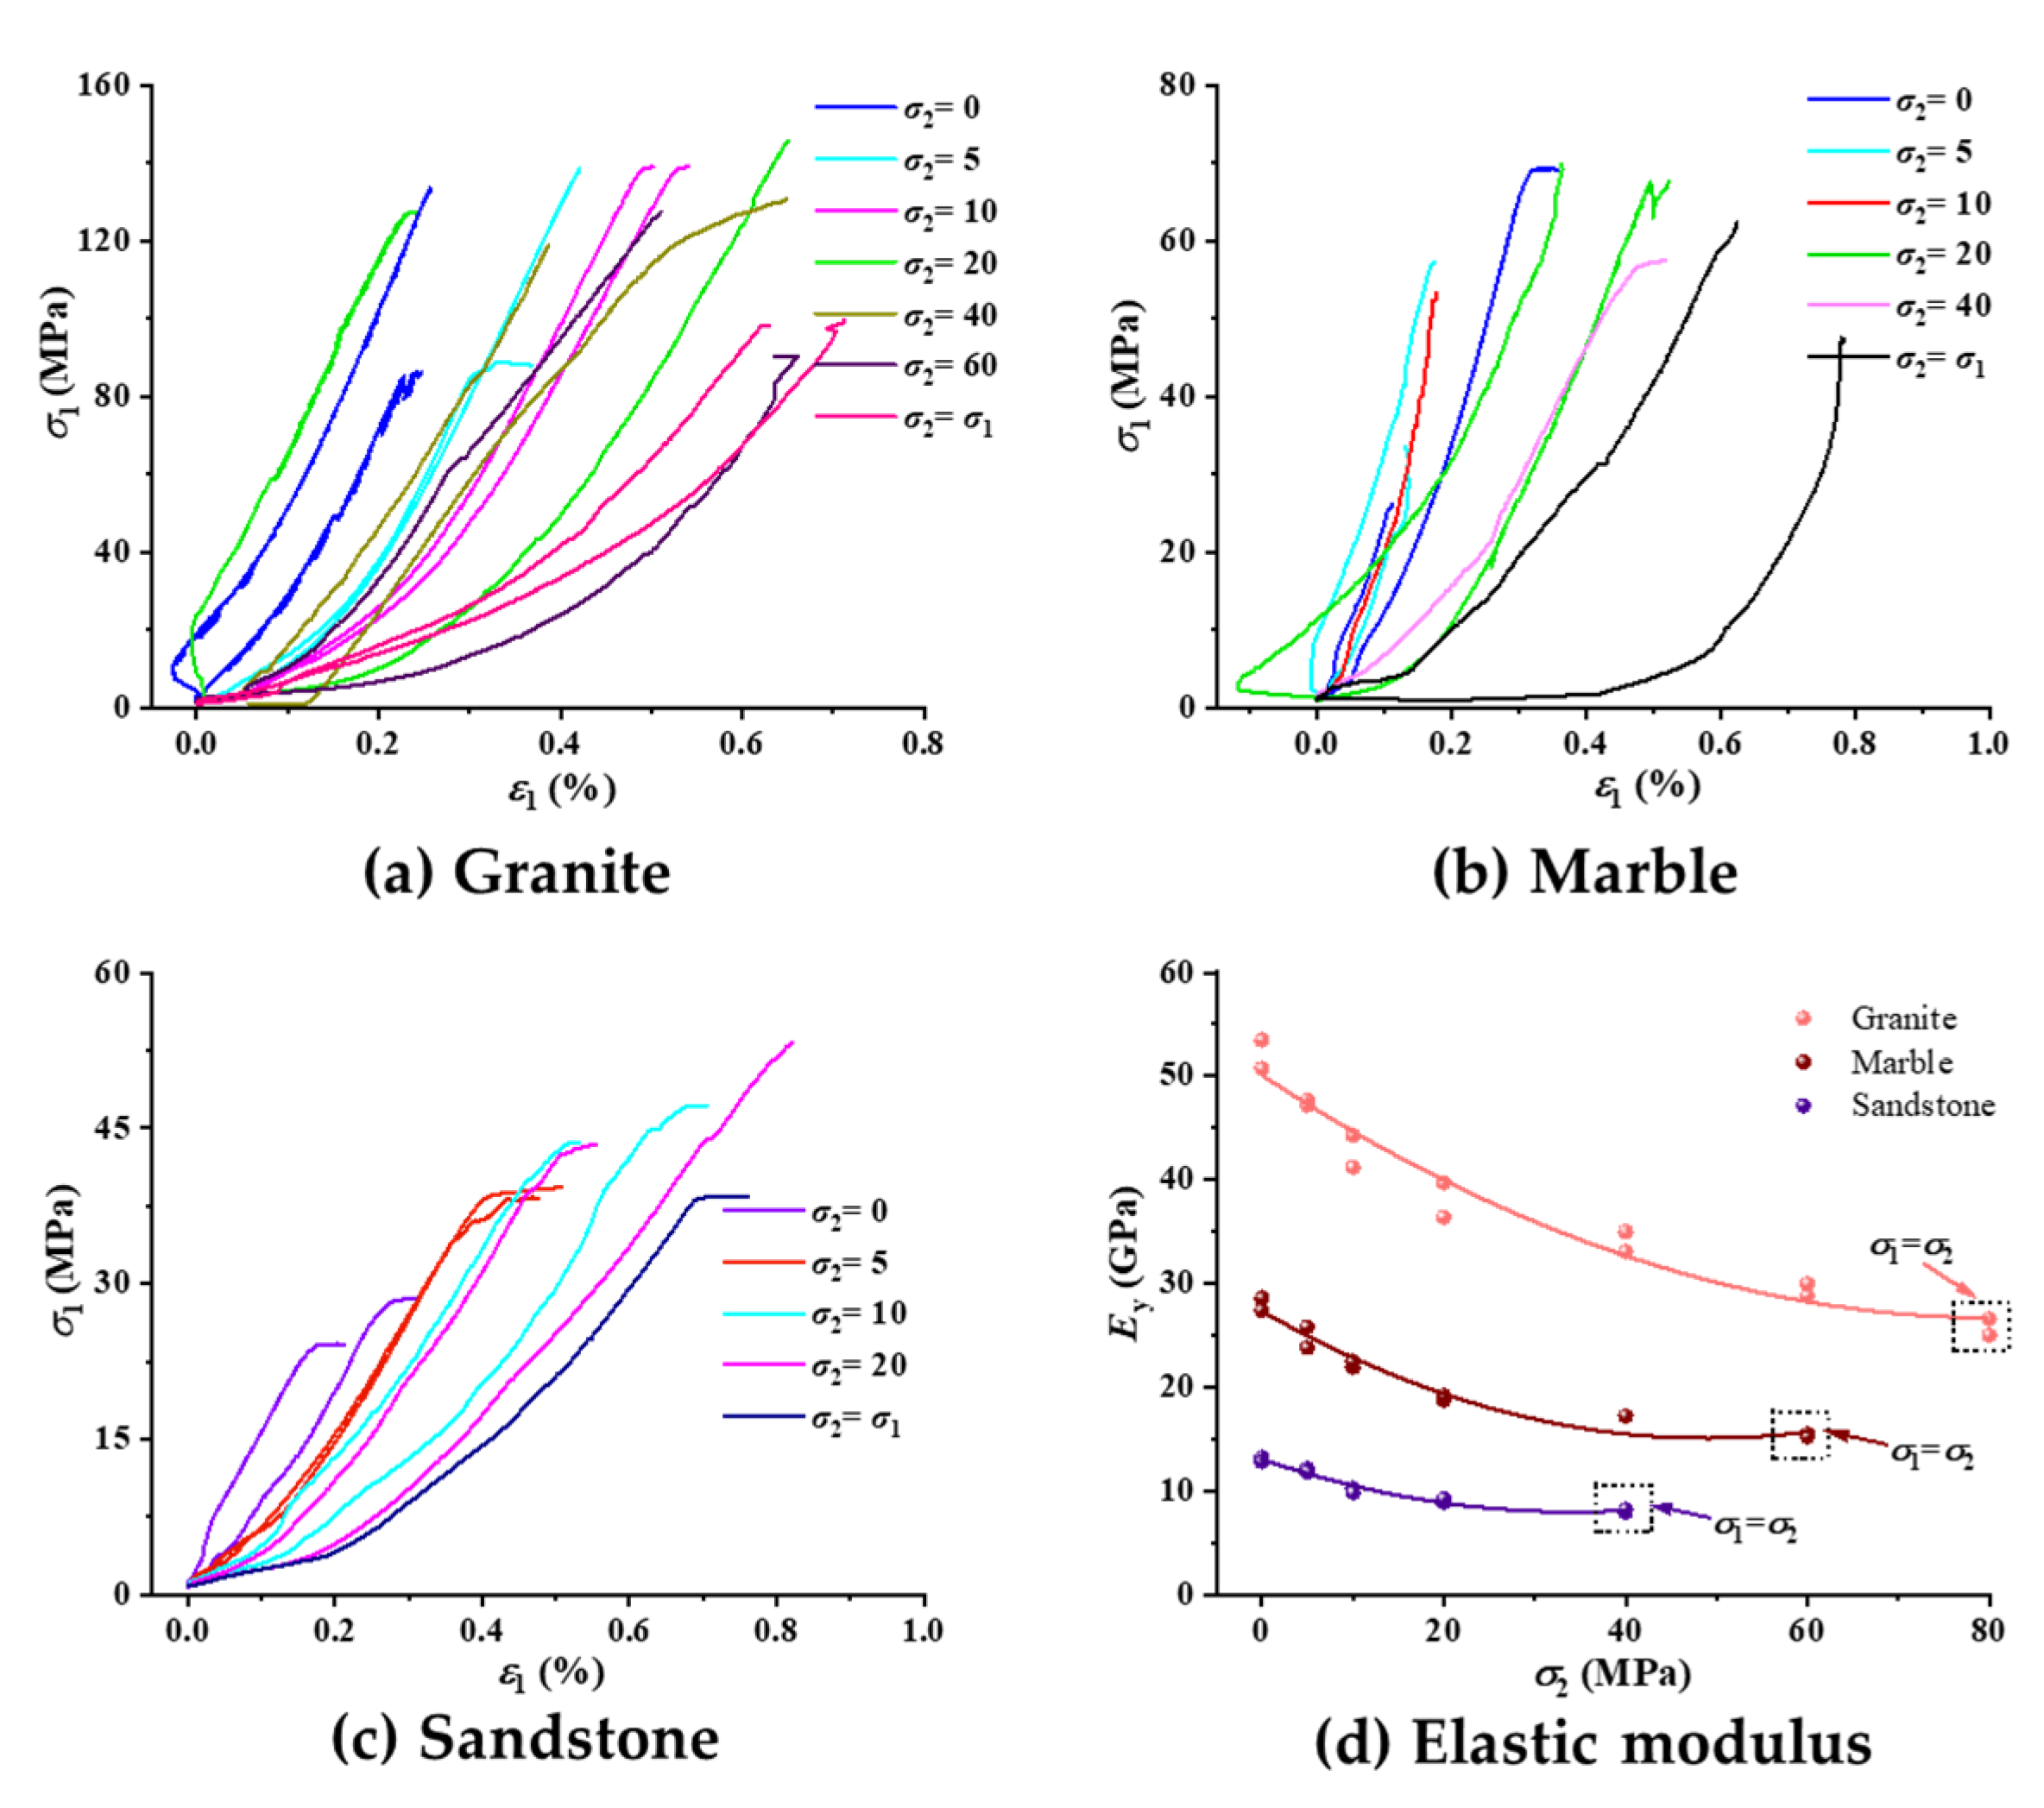
3.1. Basic Mechanical Parameters of Rocks

The uniaxial compression tests using cubic specimens were carried out first to determine the basic mechanical parameters of granite, marble, and sandstone, as shown in Table 2. Granite has the highest uniaxial compressive strength σ ucs and elastic modulus E y , while sandstone has the lowest σ ucs and E y . The Poisson’s ratio μ of granite, marble, and sandstone are 0.25, 0.27, and 0.31, respectively. The P-wave velocities V L of granite, marble, and sandstone measured by an ultrasonic vibration are 4.26, 3.58, and 2.34 km/s, respectively.

3.2. Stress–Strain Properties
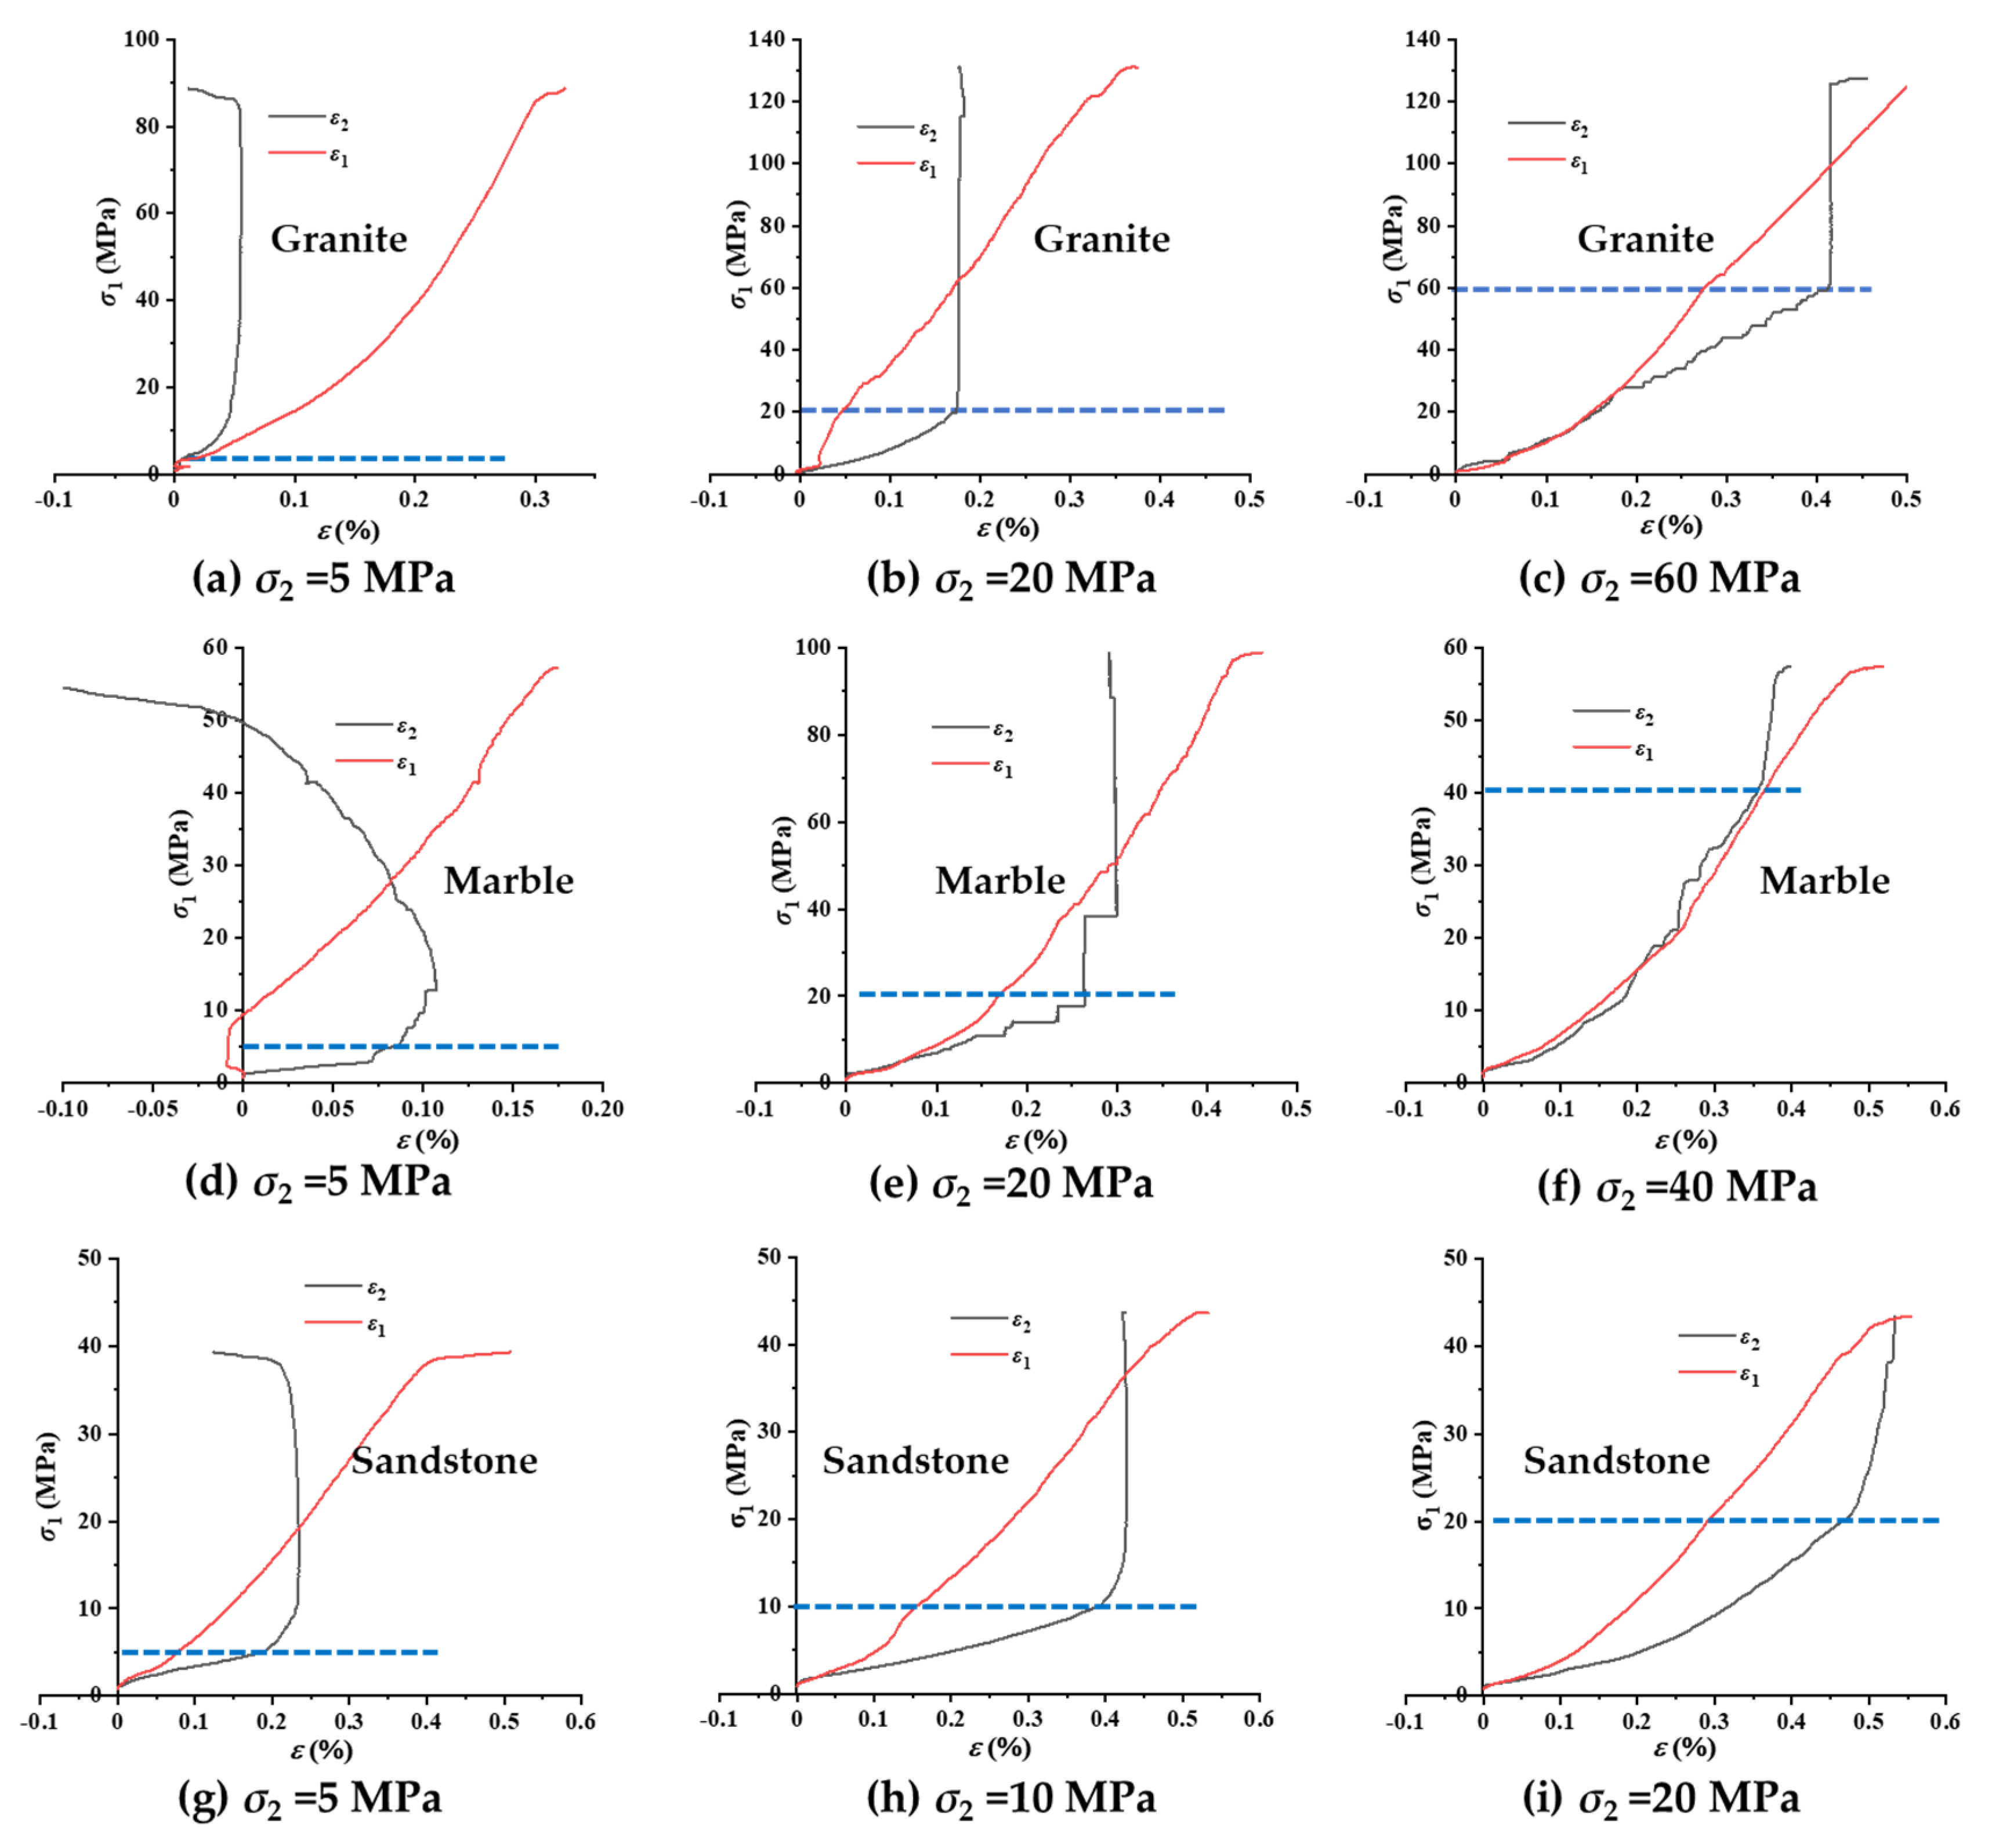
3.2.1. Axial Strain

The σ1-ε1 (ε1 is the strain along the σ1 direction) curves of granite, marble, and sandstone under biaxial compression are shown in Figure 6a–c, and it indicates that the slopes of σ1-ε1 carve, i.e., the elastic modulus, decrease with the increase of σ2. The plastic deformations of rocks increase with the increase of σ2. Moreover, the decrease of elastic modulus of granite and marble is more obvious than that of sandstone, as shown in Figure 6d. It can be concluded that the σ2 plays a positive role in large deformation failures of rocks under biaxial compressions, which shows that the deformation and failure modes of rocks gradually change from the elastic-brittle to the elastic-plastic as the σ2 increases.

3.2.2. Lateral Strain

The σ1-ε2 (ε2 is the strain along the σ2 direction) curves of granite, marble, and sandstone are shown in Figure 7. The ε2 is an important index to study the mechanical properties of rocks under biaxial compression, which can well reflect the changing trend of crack propagation under biaxial confinements. The main conclusions of the ε2 are as follows: (1) During the simultaneously loading process of the σ1 and σ2, the ε1 and ε2 both increase in the positive direction, which indicates that the internal natural microcracks are compressed in both lateral and axial directions; (2) In the process of “keeping σ2 and increasing σ1”, the ε2 and σ1 initially show a positive correlation when σ2 is at a low level (≤10 MPa), whereas ε2 is almost constant with the increase of σ1 when σ2 comes to a high level (>10 MPa), which proves that the higher σ2 can restrict the development of lateral strain; (3) Figure 7a,d,g shows that the ε2 is negatively correlated with σ1 when σ1 is increasing continuously under σ2 of 5 MPa, which proves that a smaller σ2 has a lower influence on lateral constraints, and the specimens expand laterally until it failed. With the increase of σ2, the larger expansion constraint on the lateral direction of rock induces the less obvious increases of ε2 in the negative direction (Figure 7b,c,e,f,h,i).

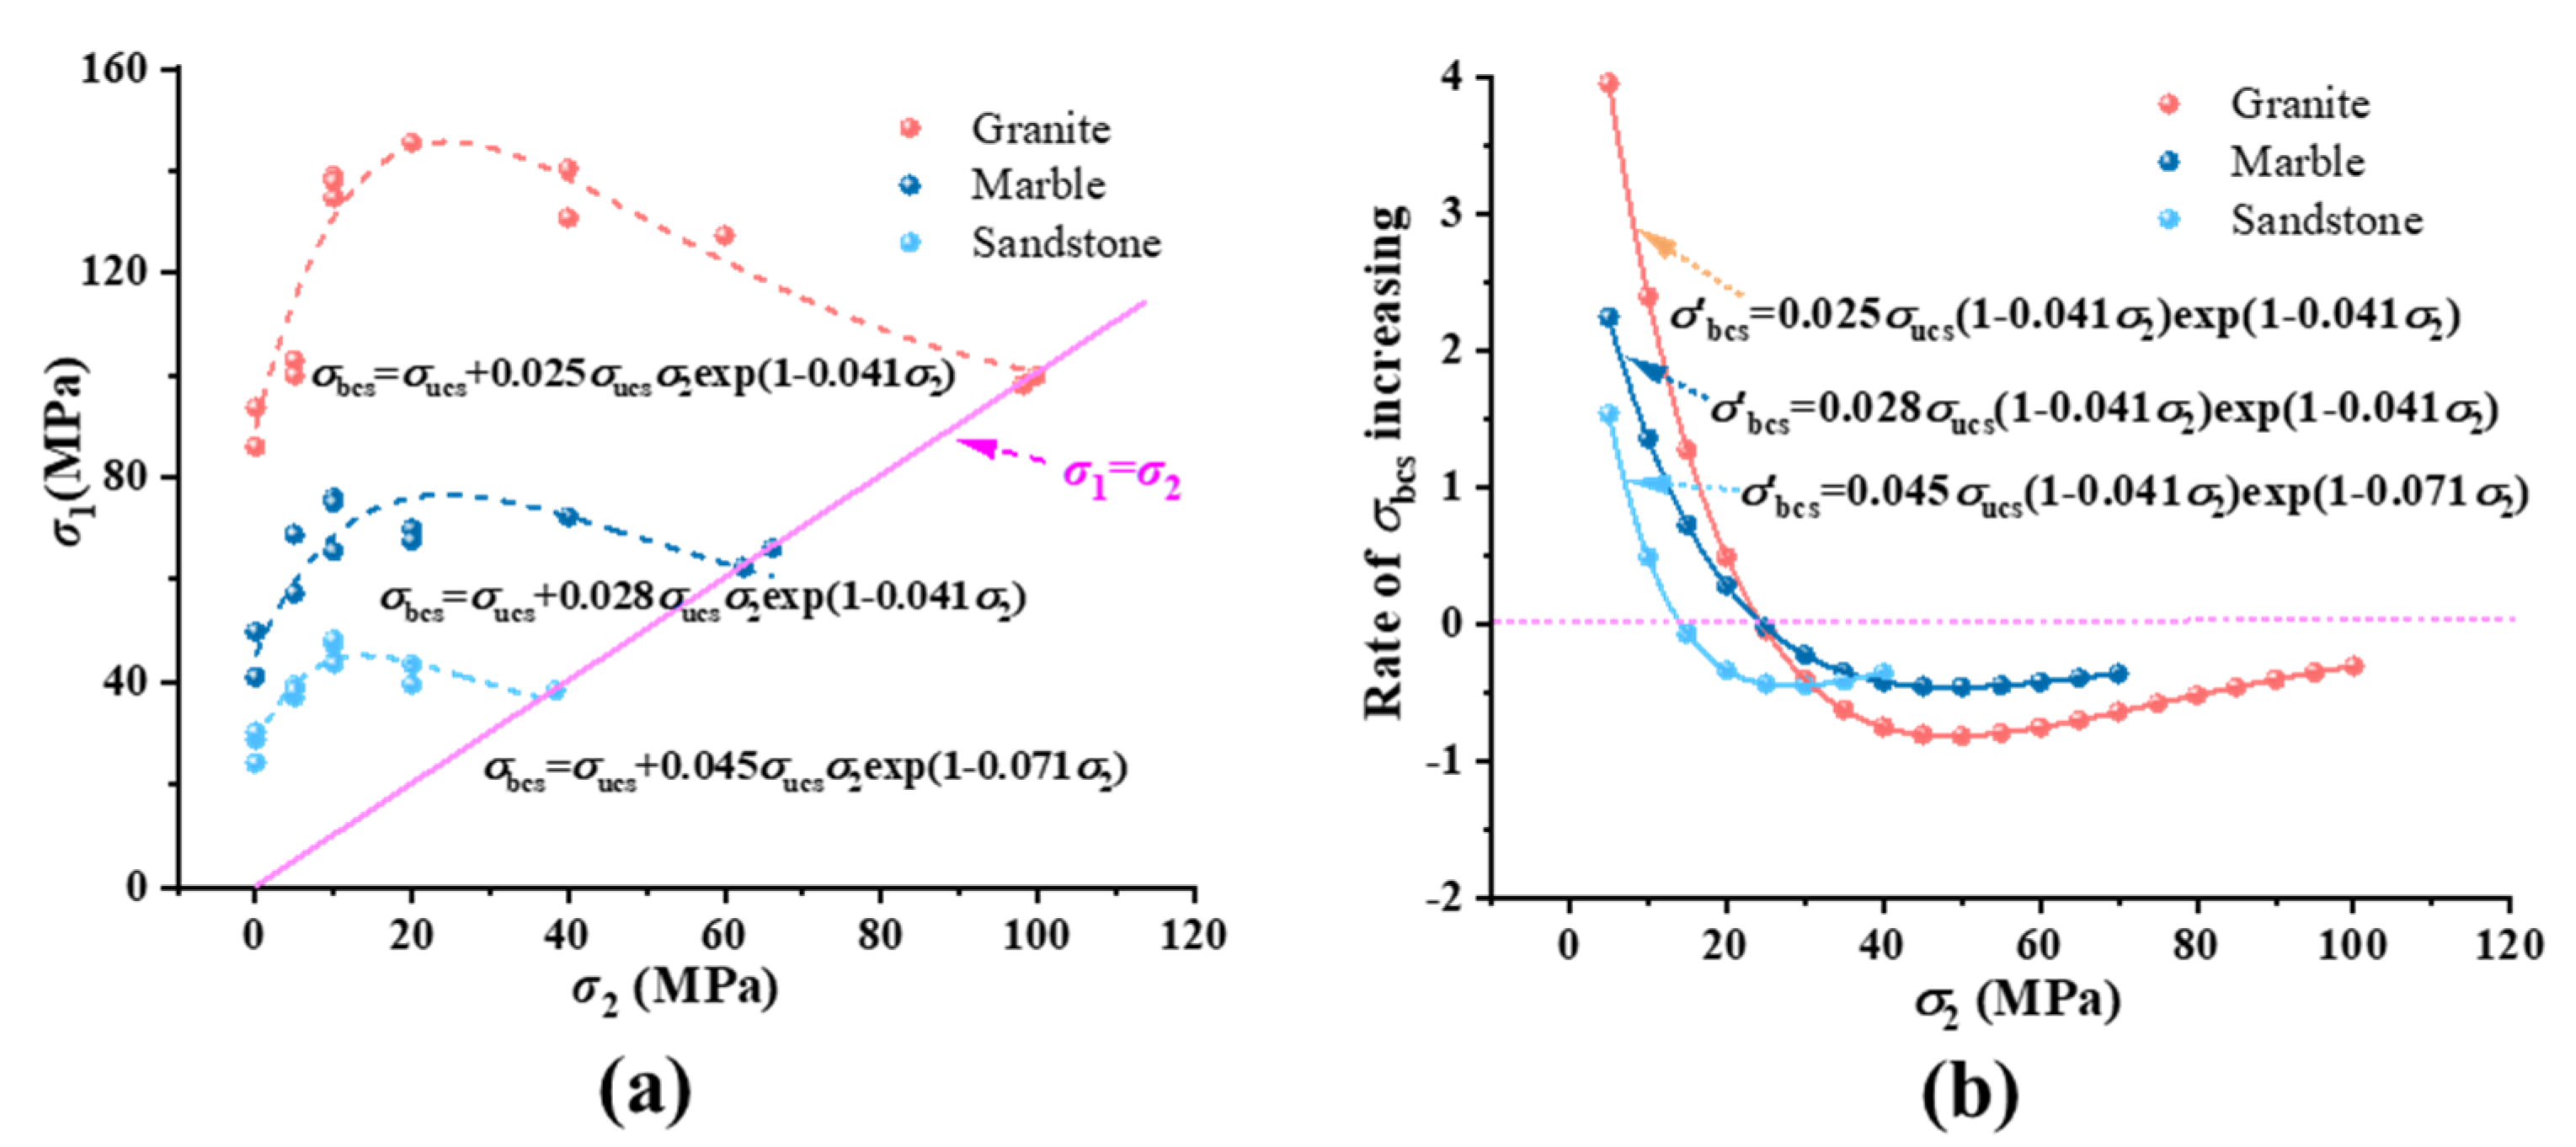
3.3. Biaxial Compressive Strength

The biaxial compressive strength σbcs of granite, marble, and sandstone specimens are listed in Table 3 and shown in Figure 8a. The σbcs of the three rocks increase initially and then decrease with the increase of σ2. There exists a maximum value of the σbcs, named as σbcs,peak, which is the peak value of σbcs in the variation range of σ2. The ratios of the σbcs,peak to the uniaxial compressive strengths of granite, marble, and sandstone are approximately the same as 1.5–1.6. The peak points of σbcs corresponding to σ2 for granite, marble, and sandstone are about 20, 20, and 10 MPa, respectively, which is much smaller than that in the literature [18,19,20,21,22]. The first derivative curves of the fitting function of σbcs of three rocks are drawn as Figure 8b, which show clearly that the increasing rate of σbcs decreases with the increase of σ2. Furthermore, the increasing rate of σbcs for granite is always greater than that of marble and sandstone, and the increasing rate for sandstone is the smallest. The maximum increasing rate σbcs for granite, marble, and sandstone are 4, 2.5, and 1.5, respectively, which indicates that the σ2 has a lower effect on the σbcs of rocks with stronger plasticity.
For all rocks, the increasing rate of σbcs is 0 at the σ2 corresponding to the turning point of σbcs. There is an optimal solution of σ2,peak corresponding to the maximum of σbcs, and the σ2,peak of granite, marble, and sandstone are 25.2, 24.6, and 12.3 MPa, respectively. The σ2,peak is of great significance for disaster prevention and control in the stress adjustment area after underground engineering excavation. At the stage of the increasing rate of σbcs is negative, the curve of each of the rock shows a similar trend with decreasing first and then increasing slowly, and asymptotically approaches to zero, which demonstrates that the σbcs decrease slowly when it increases to a certain extent. The minimum increasing rate σbcs for granite, marble, and sandstone are −1, −0.5, and −0.5, respectively, which indicates that the σ2 has less influence on σbcs for the rock with lower strength under higher σ2.
Based on the results of the biaxial compressive strengths σbcs of the three rocks, a relationship between the σbcs and σ2, i.e., an exponent strength criterion, was proposed as shown in Equation (1), which has a high degree of adaptability to the strength data of the three rocks obtained from the tests, and has a good reference value when evaluating the σbcs of the rocks:
σ bcs = σ ucs + A σ ucs σ 2 exp ( 1 B σ 2 ) ,
where both A and B are material constants.

3.4. AE Characteristics

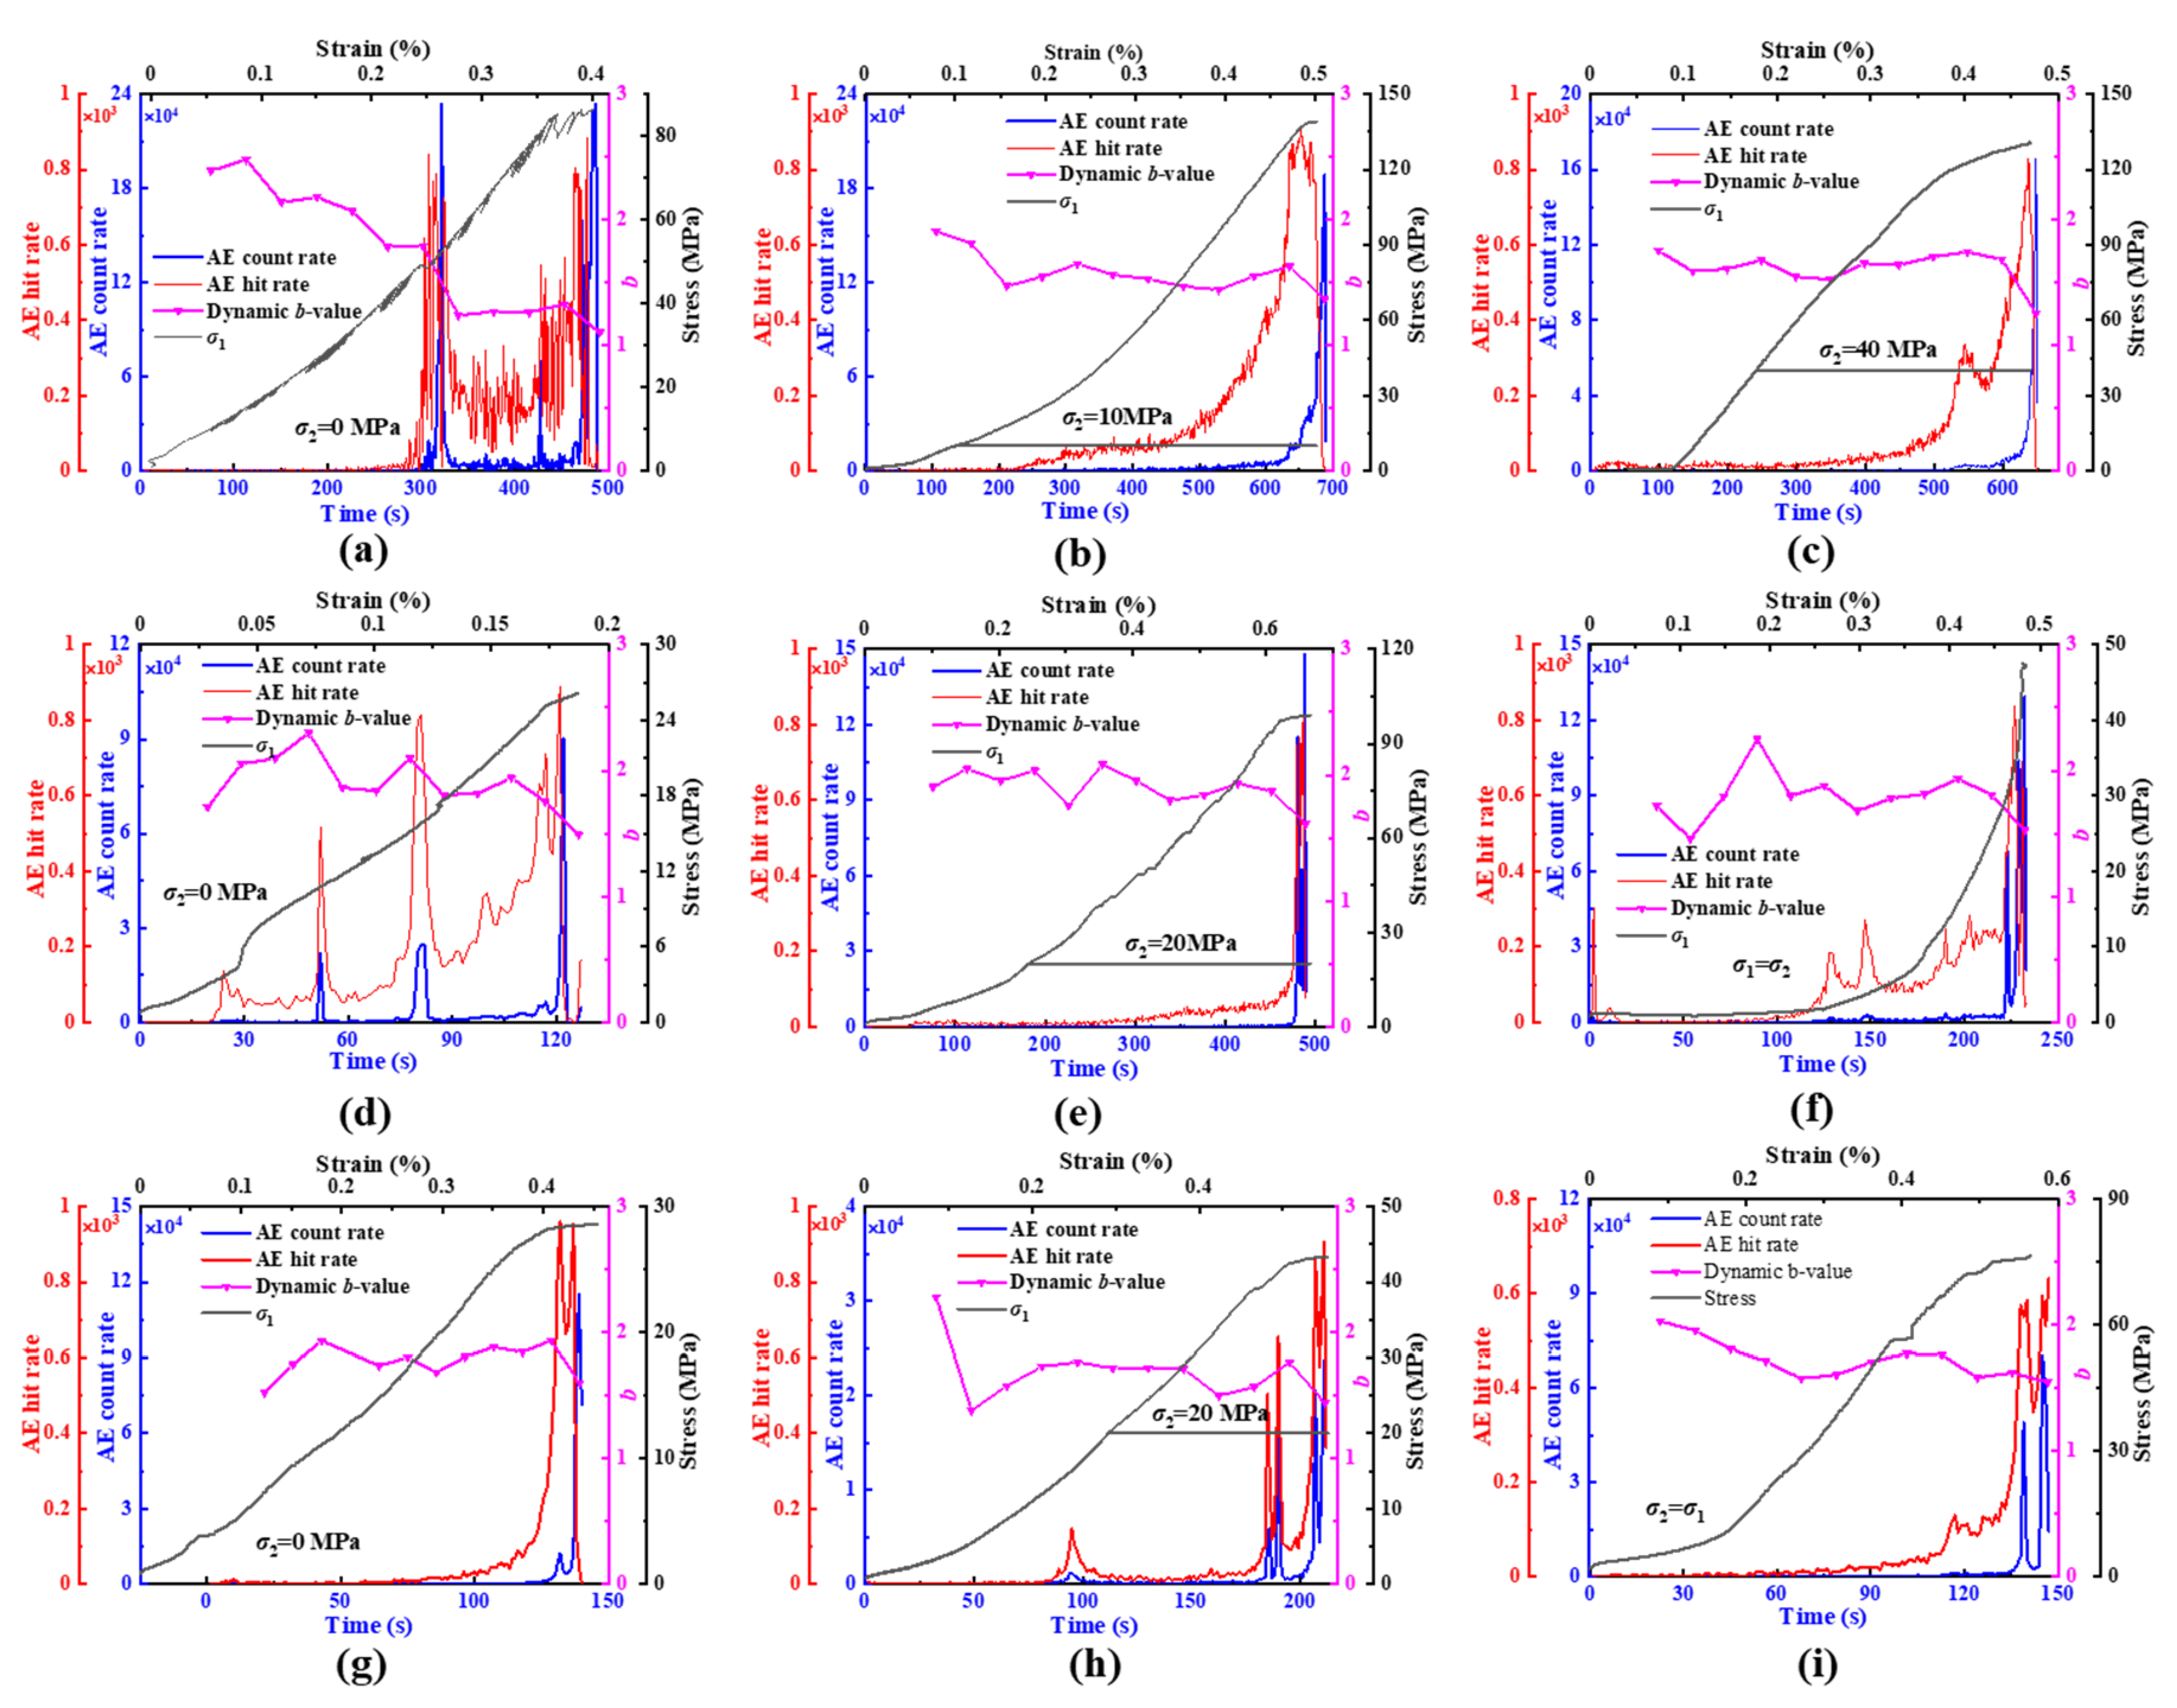
3.4.1. AE Hit Rate, AE Count Rate, and Dynamic b-Value

AE hit rate and AE count rate refers to the cumulative AE hit and AE count of the specimen in one second during the process of rock failure, and they reflect the damage degree of the specimen under loading. The dynamic b-value refers to the ratio of AE hit with low amplitude signal to AE hit with high amplitude signal during loading, and the higher dynamic b-value reflects the greater proportion of AE hit with low amplitude signal [28,46,47,48]. The AE data of the two sensors have a good consistency for most specimens in the biaxial compressive tests. Therefore, the data from “S1” was presented in this paper. According to Gutenberg–Richter (G-R) distribution [49,50], the relation between the number of earthquakes above a given magnitude, N(M), and the magnitude, M, can be drawn as:
lg N ( M ) = a b ( M M 1 ) ; M M 1 ,
where M 1 is a lower threshold, below which magnitudes are not considered; a is a constant and b is referred to as the b-value.
When calculating the AE b-value of rock damage, AE amplitude is generally used to reflect AE signal, and the equivalent earthquake magnitude is obtained by dividing AE amplitude by 20. So, Equation (2) can be modified into Equation (3):
lg [ N ( A / 20 ) ] = a b ( A / 20 ) ,
where A is the amplitude of the AE hit; and N is the cumulative number of AE hits with an amplitude of A.
The AE amplitude data set of each rock specimen was evenly divided into 13 parts (A1, A2, A3,…, A13) according to the overall loading time, and the dynamic b-value of two adjacent parts was calculated successively from A1 to A13 at a pace of 1.
The changes of the AE hit rate, AE count rate, and dynamic b-value with time are shown in Figure 9, and the stress–strain curves of rock specimens are also drawn. In the initial stage of loading, the natural cracks in the rock are mainly closed without significant damage, so there are few AE signals at this stage. With the continuous increase of σ1, the internal cracks in the rocks begin to develop and propagate, and AE signals at this stage gradually increase. Based on the analysis of data of AE hit rate, AE count rate, and dynamic b-value, the main conclusions are summarized as follows:
(1) In the same rock, the AE hit rate and AE count rate have roughly the same change law during loading, while the value of AE count rate is 10 times as much as AE hit rate. Under uniaxial compression, many peaks appear in the AE hit rate and AE count rate curves (Figure 9a,d,g), which indicates that the internal cracks are well developed, and more fracture surfaces are produced, which makes the rock failure more thorough.
(2) The AE hit rate and AE count rate increase rapidly when σ1 approaches σbcs until the failure occurring, which indicates that the failure of the rock specimens is caused by the increase of its internal cumulative damage to a specific threshold value. With the increase of σ2, the peak values of AE hit rate and AE count rate appear later, indicating that σ2 can slow down the growth rate of the damage degree of rock under the increasing load (Figure 9b,c,e,f,h,i).
(3) The dynamic b-value of the three types of rocks are all distributed in the range of 1–3 (mainly in 1–2), which is related to the AE hit rate and AE count rate. The dramatic increase in the AE hit rates is always accompanied by a significant decrease in the dynamic b-value, which is a phenomenon that also occurs before the rock failure where the peaks of AE hit rate and AE count rate appear. This behavior has been observed in brittle materials [51,52,53]. During the whole process of loading, the overall trend of the dynamic b-value is declining, which can be used to predict the failure of rocks (Figure 9).

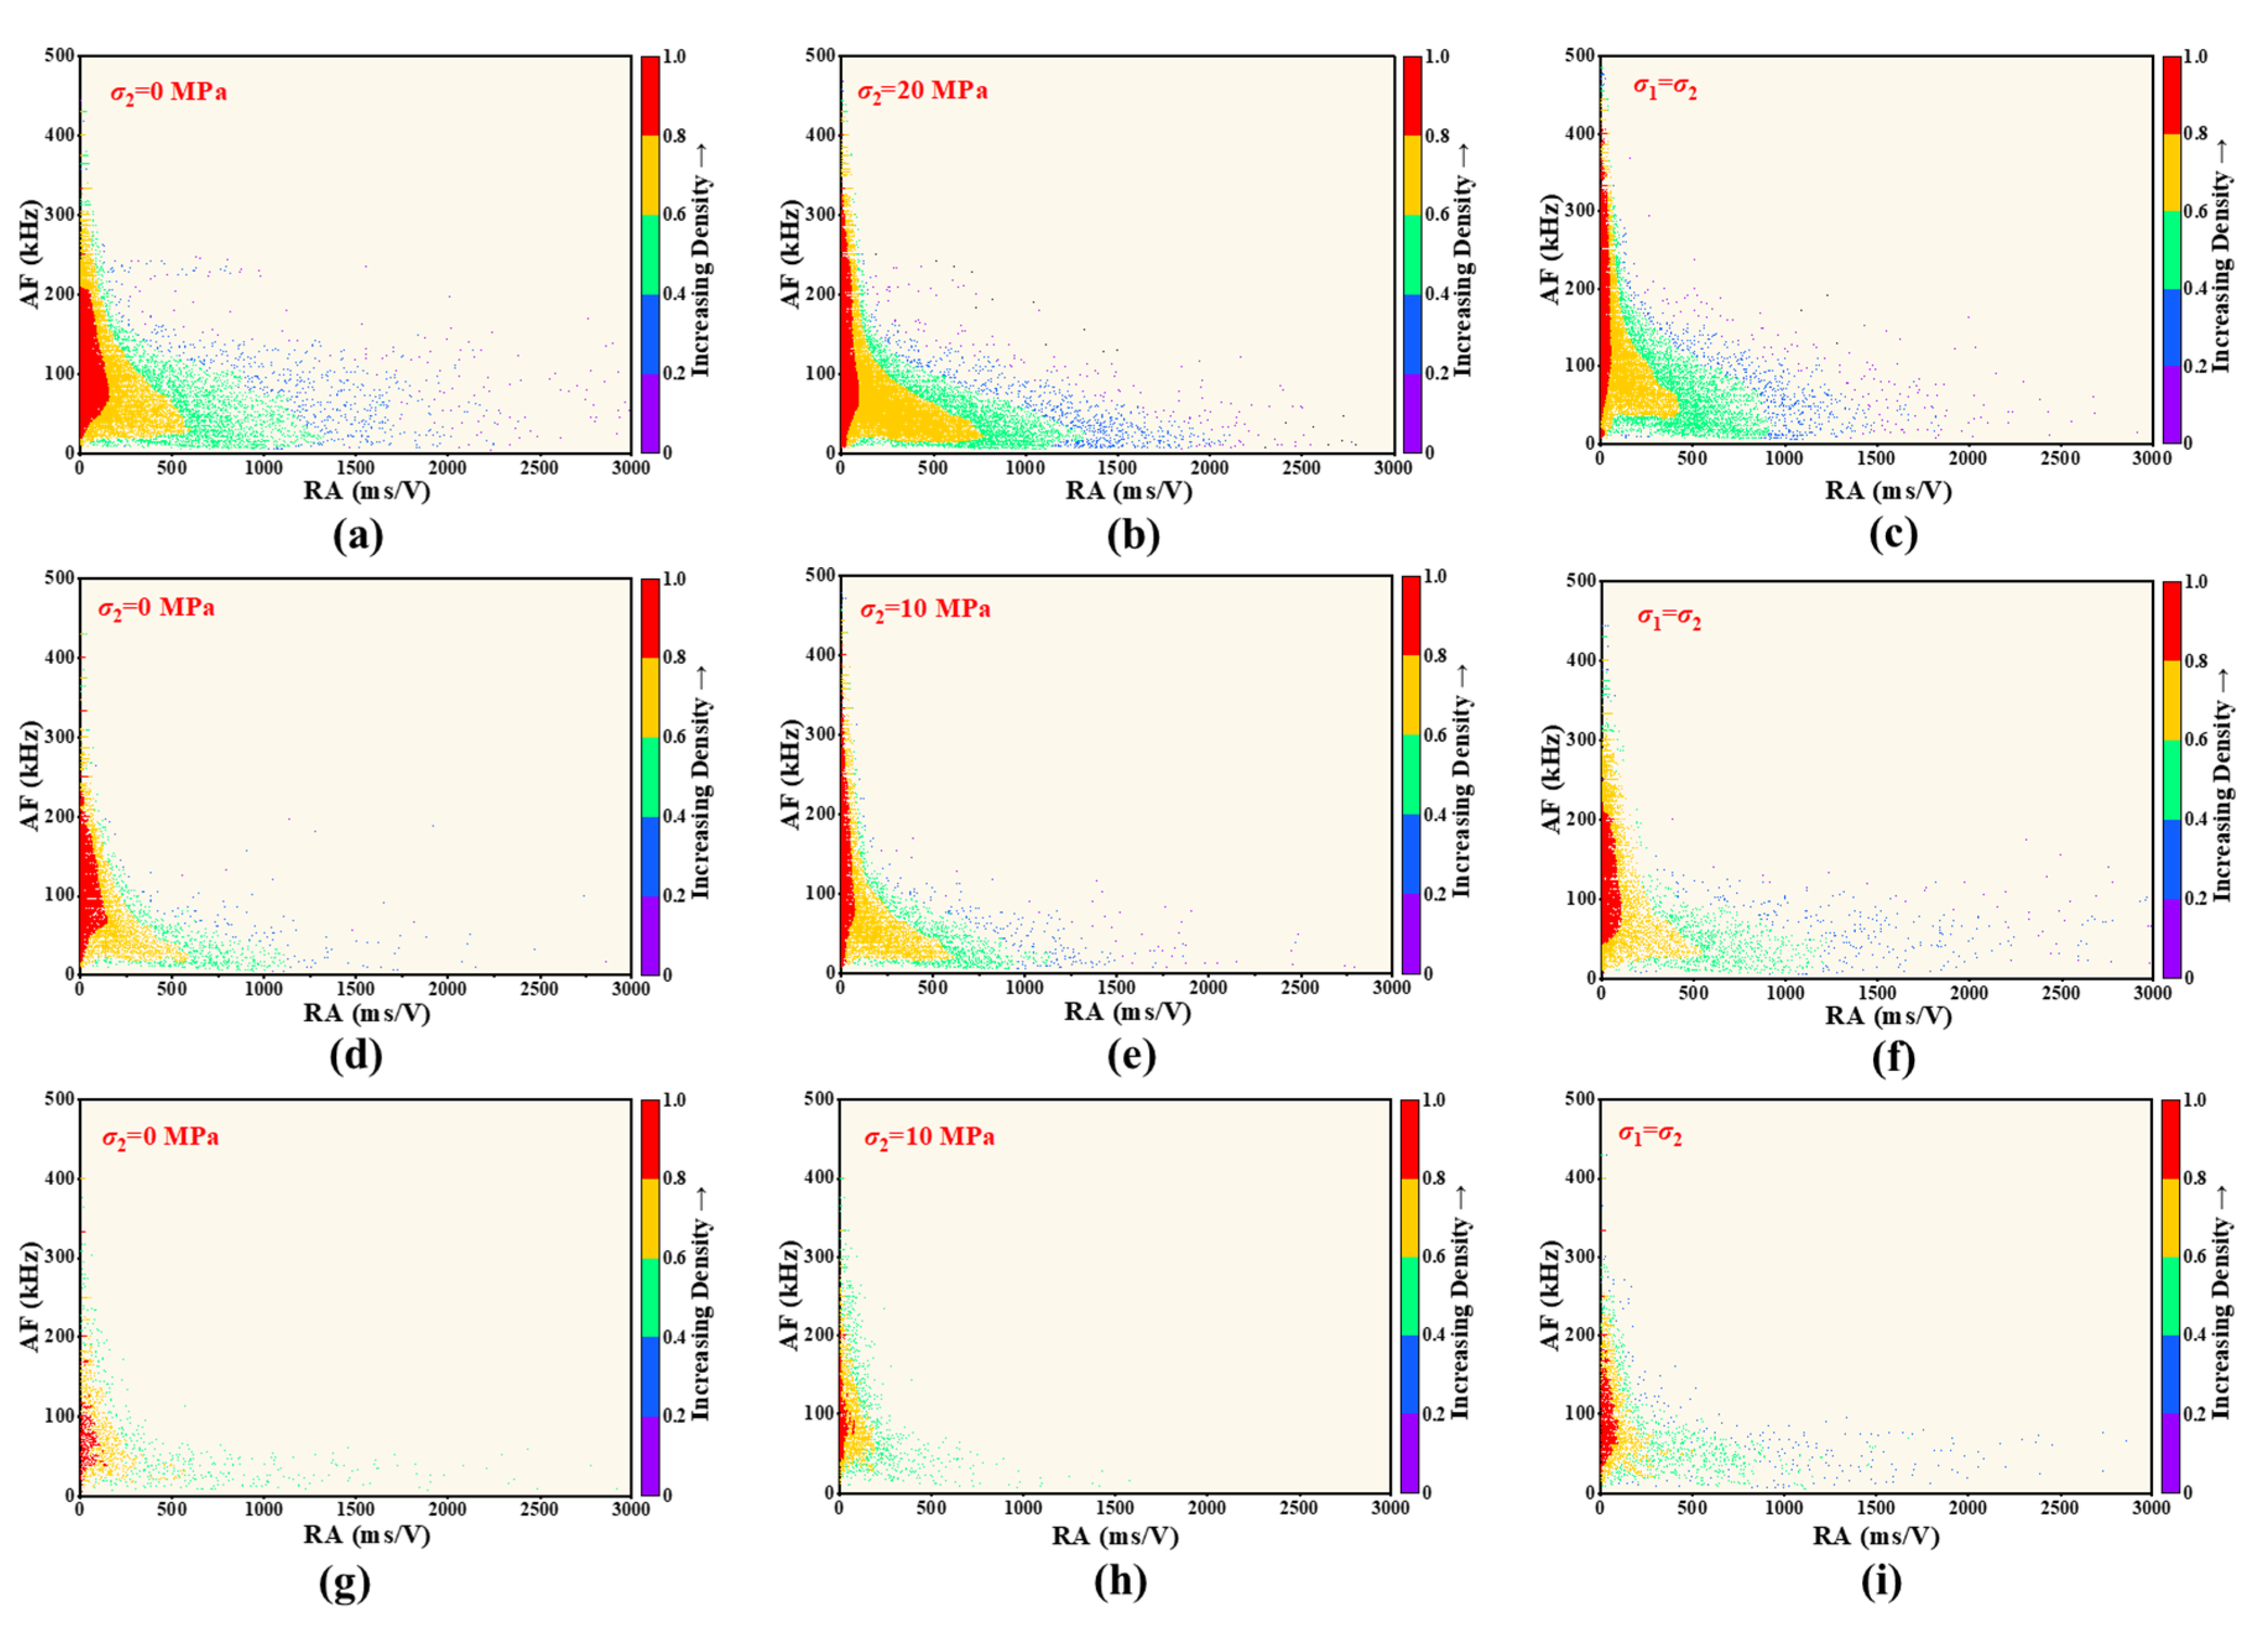
3.4.2. AF-RA Distribution

The AF-RA (where AF is the average frequency of AE waveform) density relationships of granite, marble, and sandstone are shown in Figure 10, in which the red area has higher data density, and the blue or purple area is with lower data density. The data distribution changes from sparse to dense with the color changing from blue-purple to red. It was proved that tension cracks generated during loading with a long side along with AF and a short side along with RA, while shear cracks with a short side along with AF and a long side along with RA [37].
It can be known from the figures that the high-density area gradually converges to the AF axis having low RA value and a large range of AF value with the increase of σ2, which indicates that the greater the σ2 is, the more the tensile cracks generate in rock specimens during biaxial loading condition. The range of AF value in the red area of granite is almost 50 and 100 kHz more than that of marble and sandstone, respectively, which indicates that the tensile failure degree of granite is the highest while that of sandstone is the lowest.
The behavior of two typical AE parameters with time for the different types of rock is depicted in Figure 11. The RA values of granite, marble, and sandstone specimens mainly maintain at a low level of 0–100 ms/V during loading and show a strong increase before specimen failure, which indicates that few shear cracks in the rock are formed before the failure stage, but the number of shear cracks increases obviously during the failure stage. Moreover, the AF is distributed in the whole range of 0–450 KHz and the density gets higher as the loading going on, which demonstrates that the tension cracks in the rock are generated during the entire loading process, but the rate is increasing with the increase of σ1.

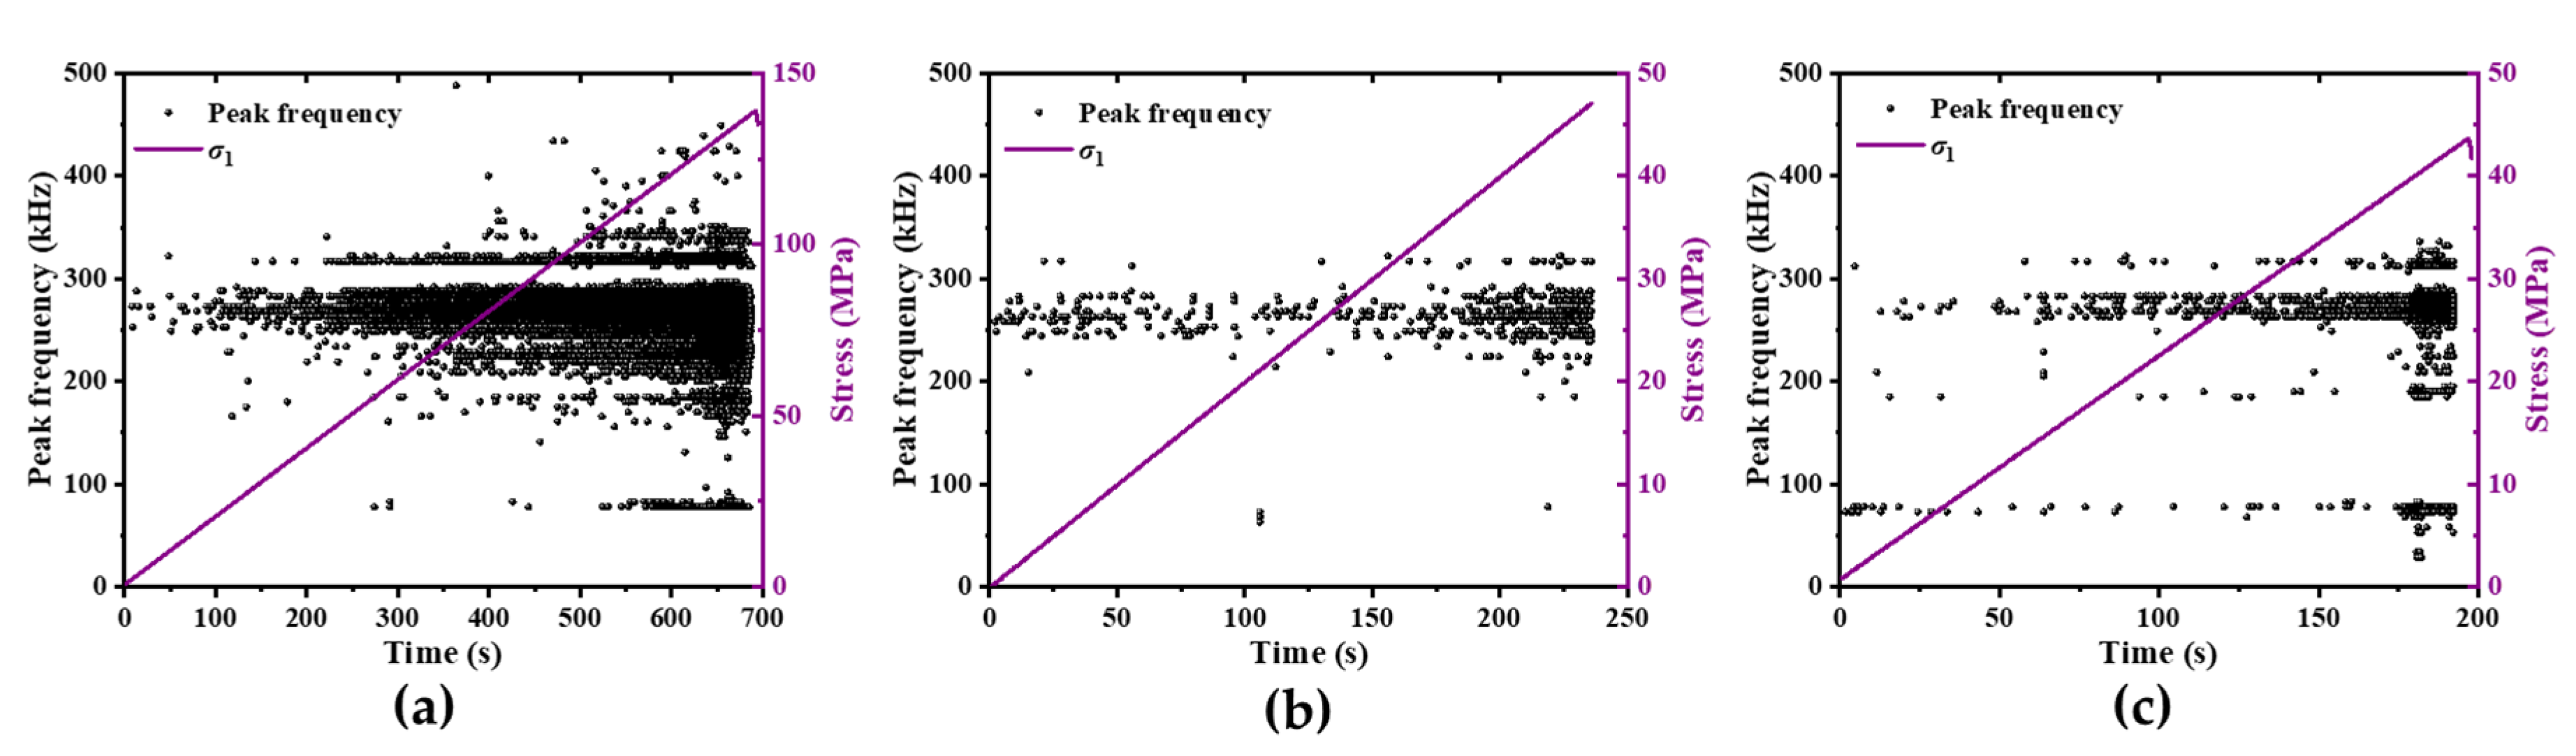
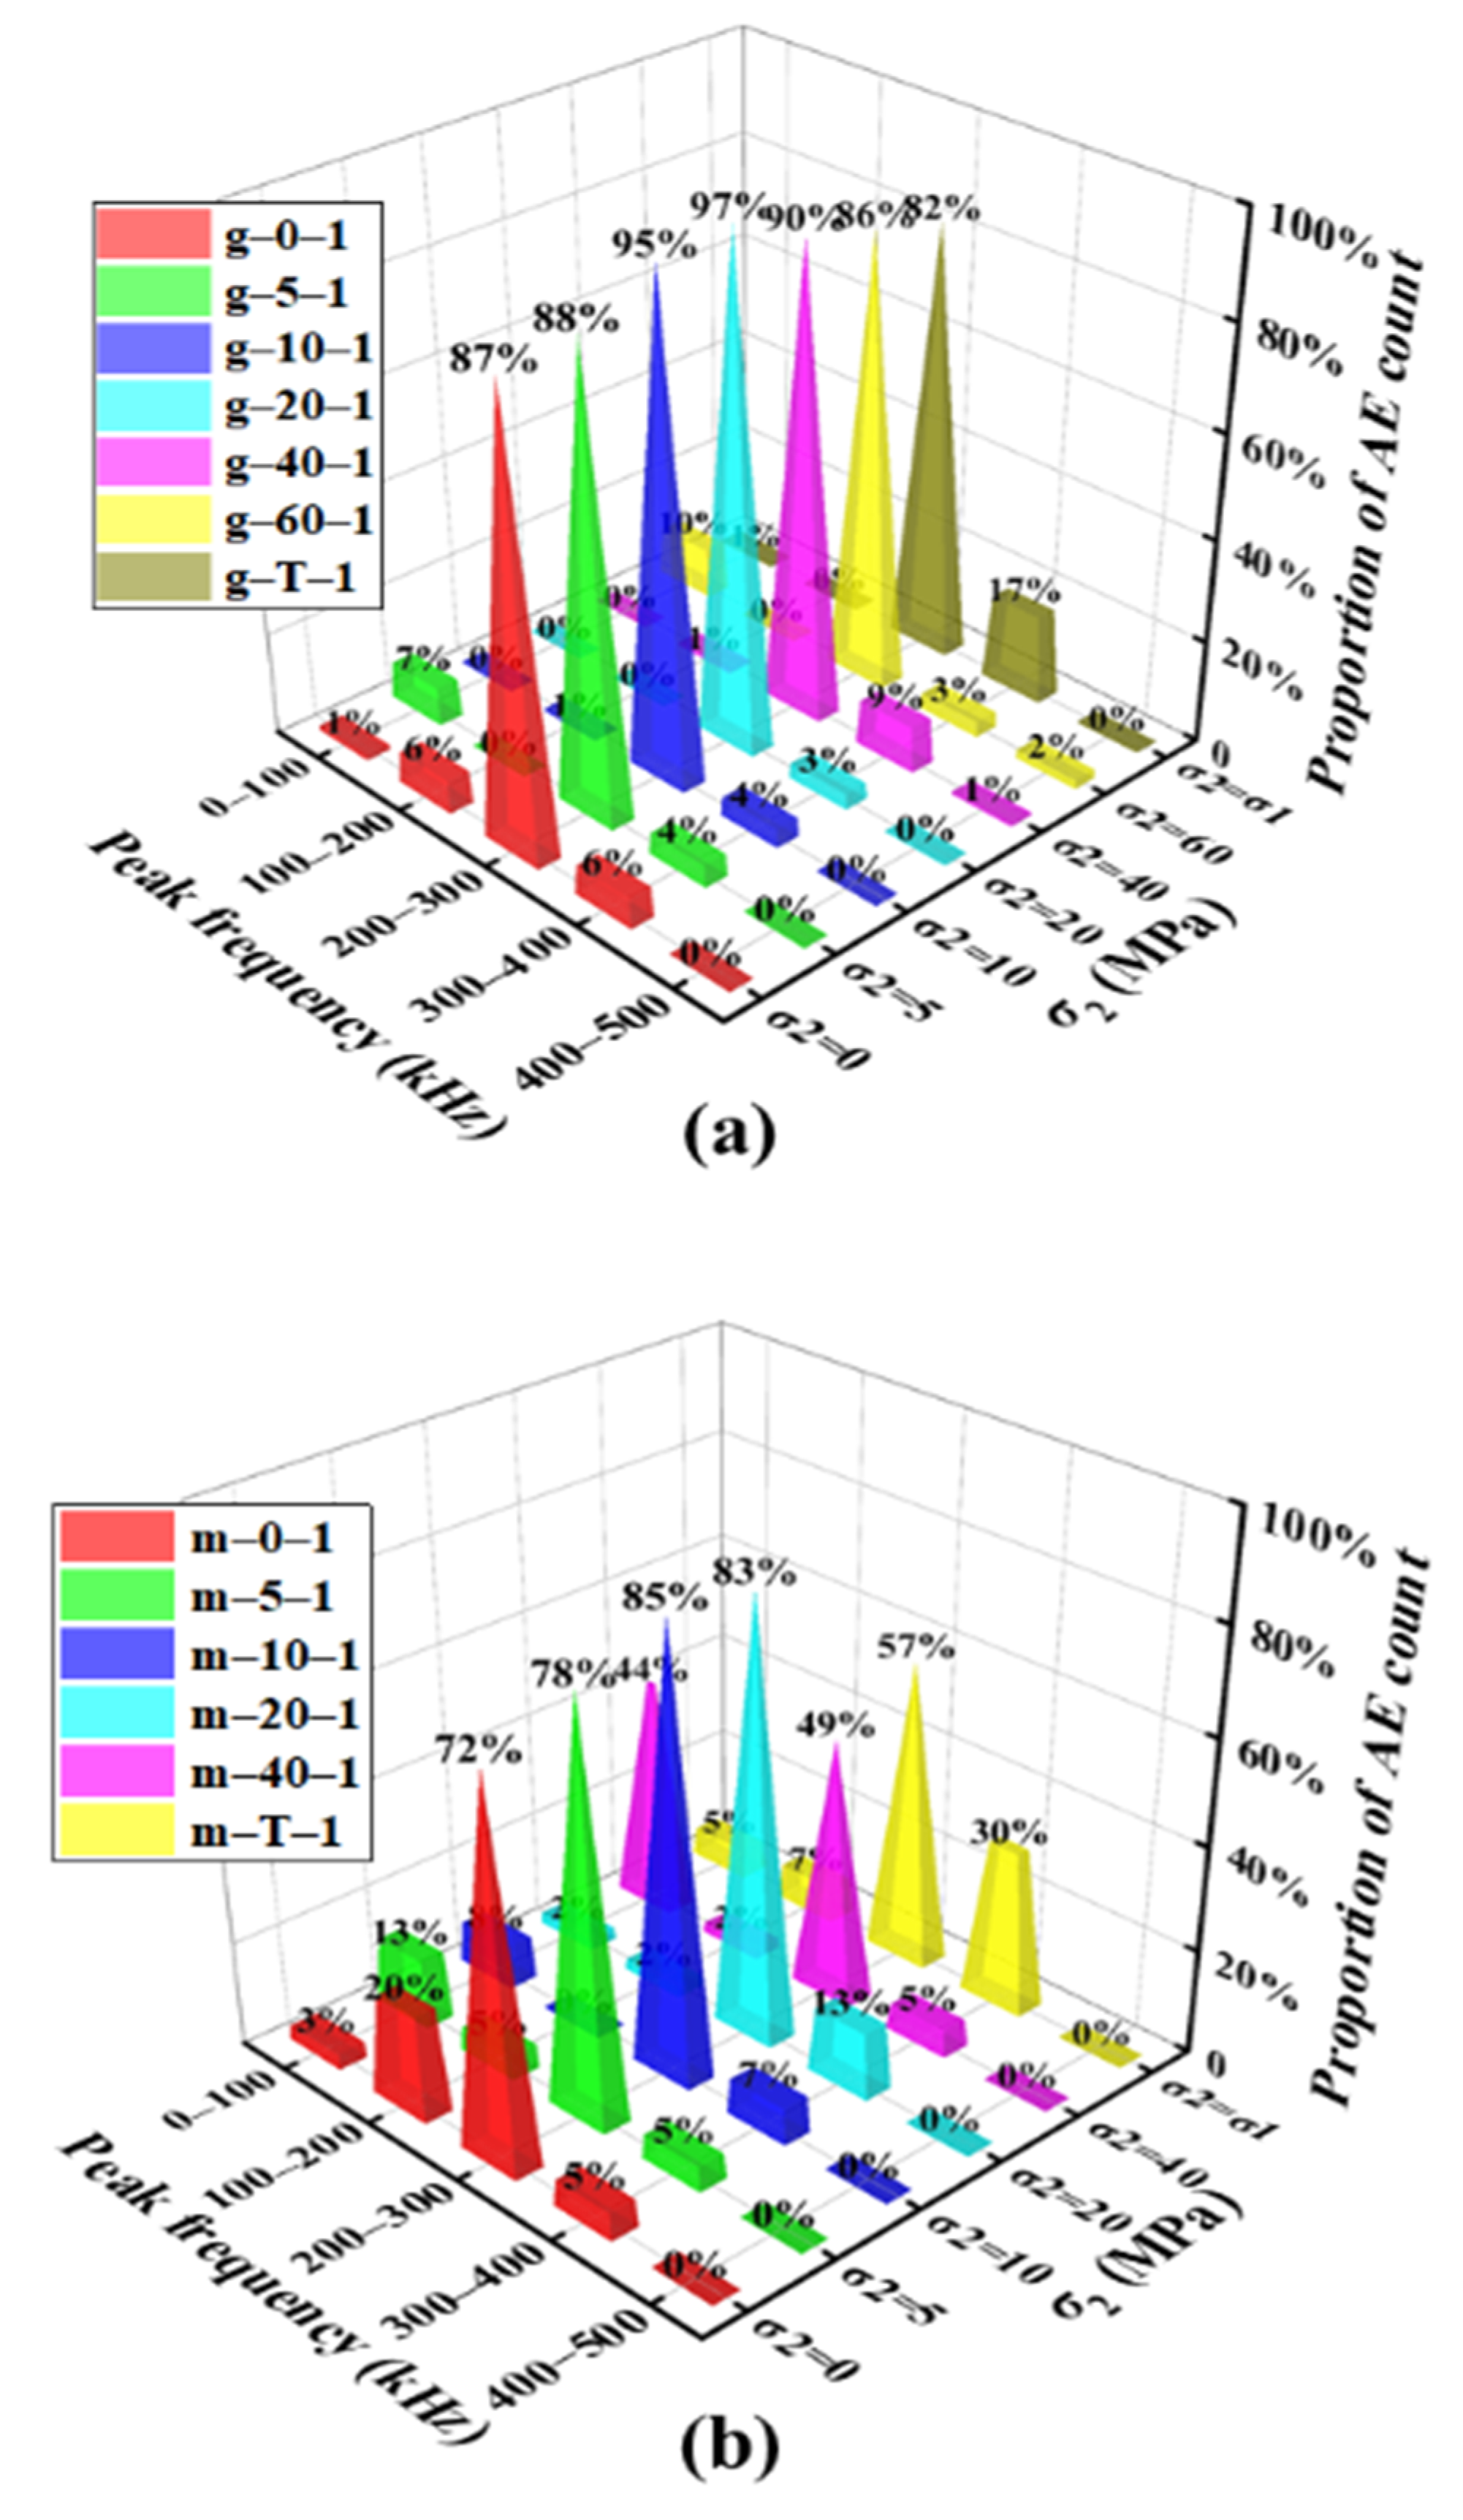
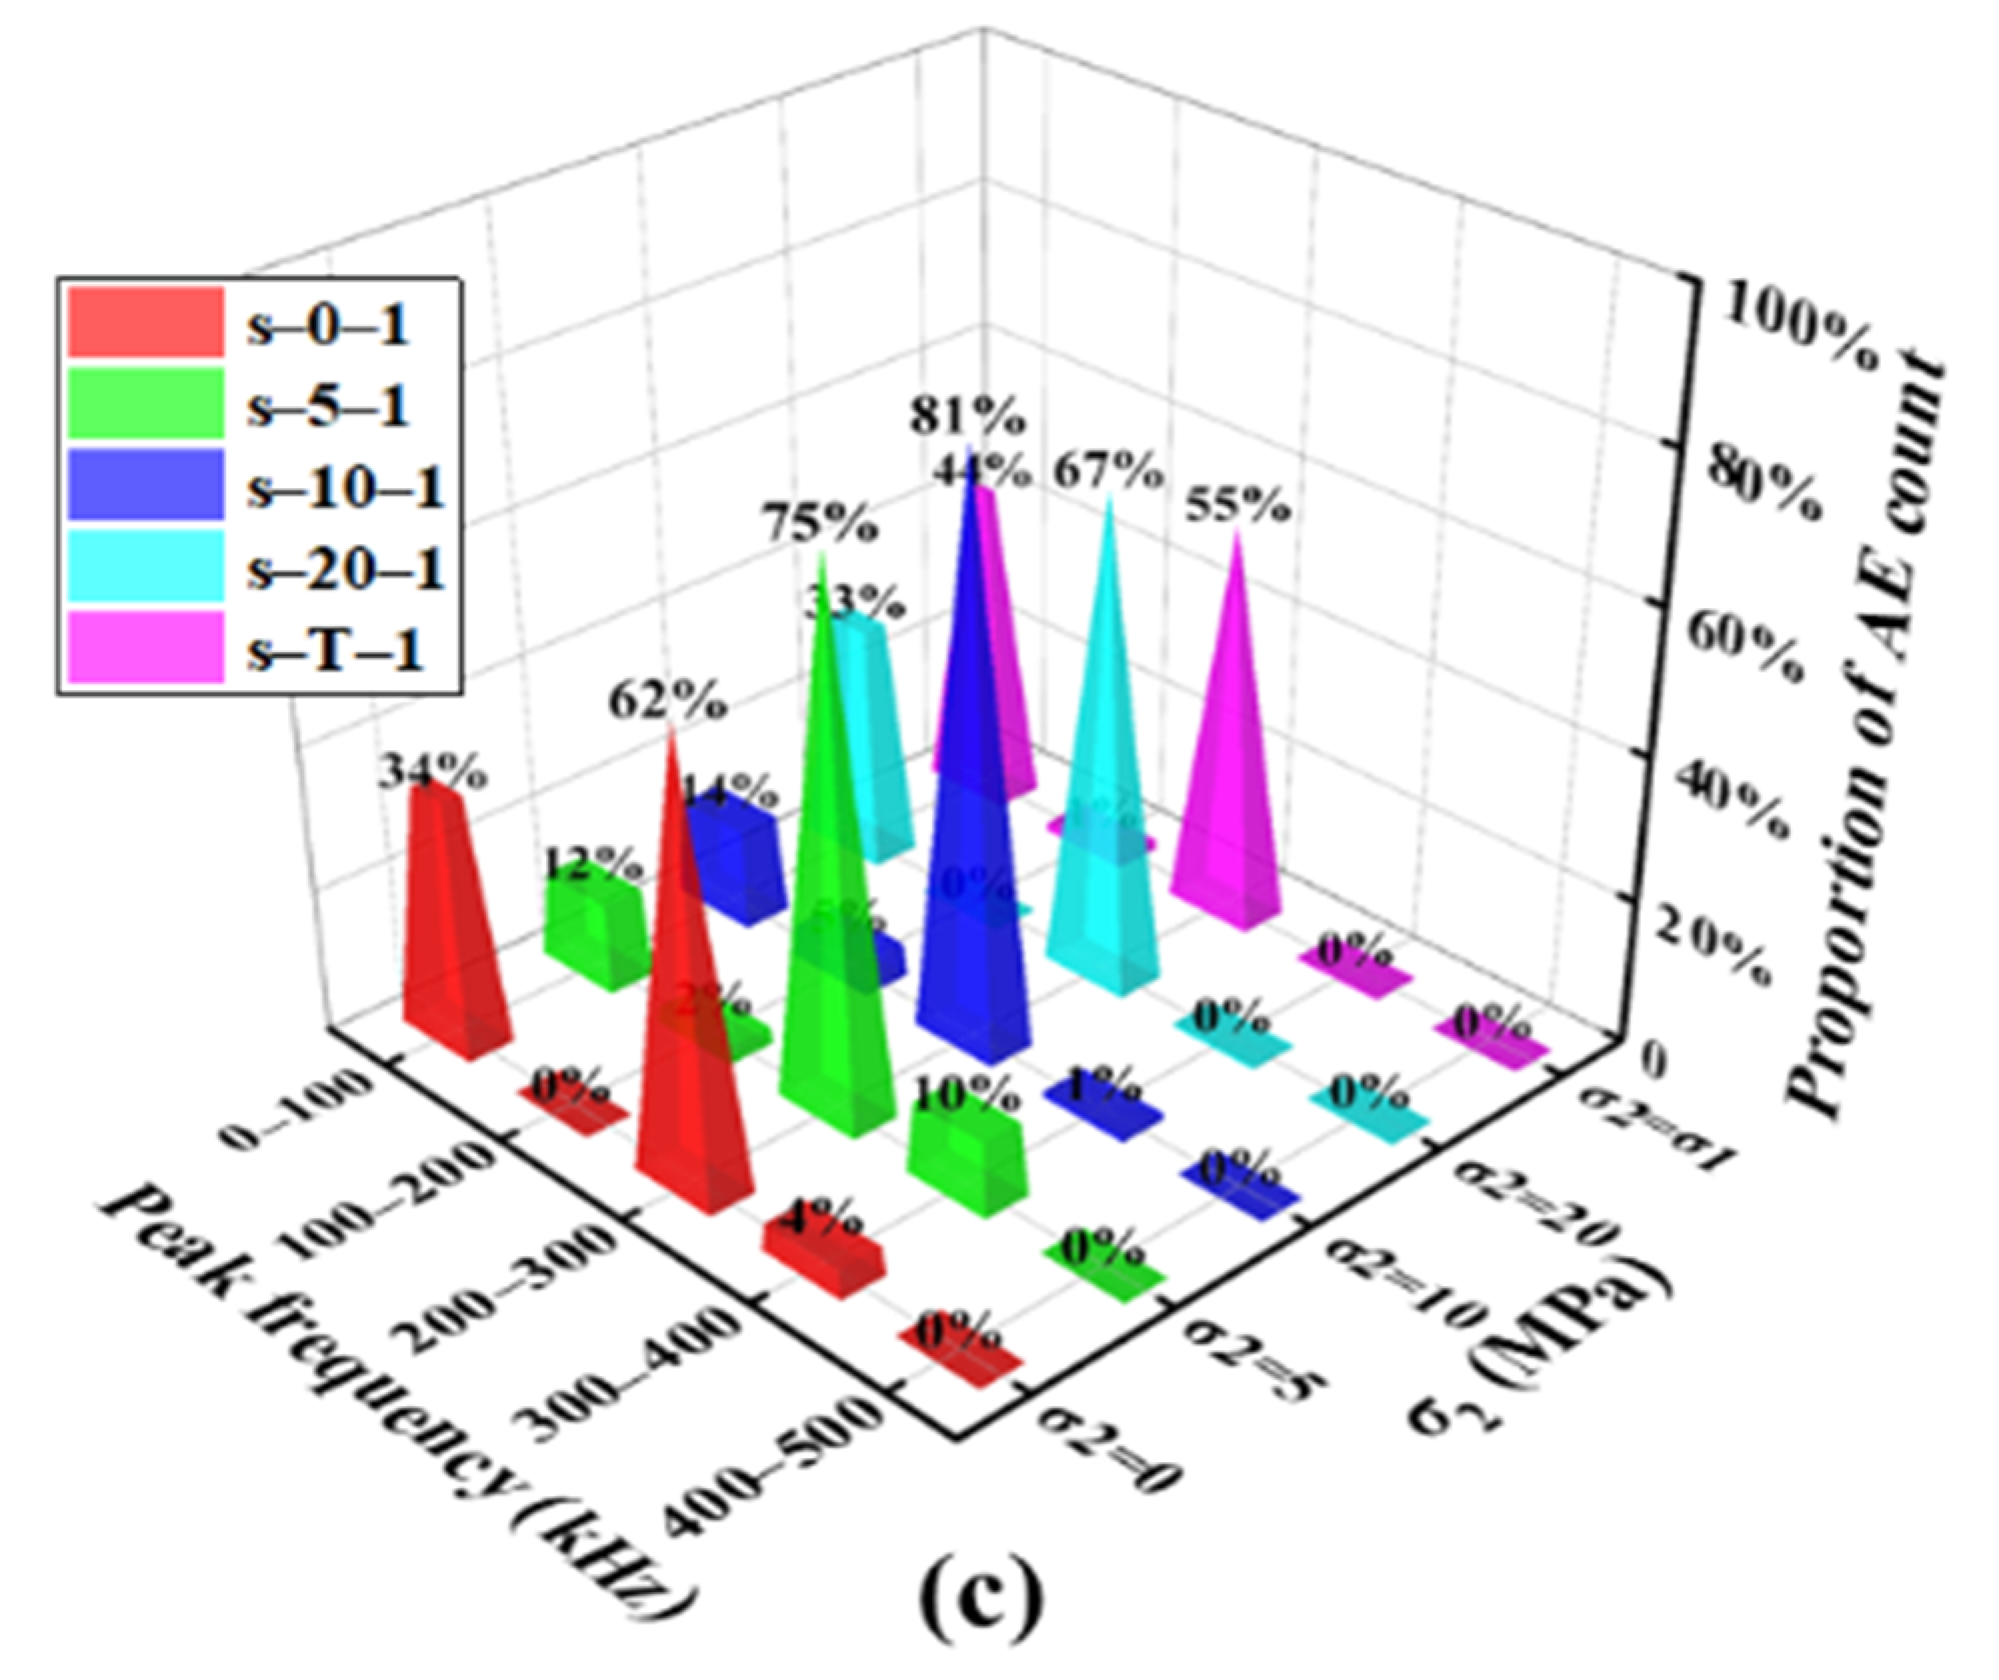
3.4.3. Peak Frequency

The distributions of peak frequencies of granite, marble, and sandstone with time during the axial loading at the σ2 of 10 MPa are shown in Figure 12a–c, respectively. The peak frequencies of these three types of rocks are mostly distributed between 100–300 kHz, and the signals increase obviously with the process of loading. Furthermore, the range of peak frequency signal is extended from 100–300 kHz to 50–350 kHz with the increase of σ1. The reason for the above result is that the cracks and joint surfaces inside the rock specimens are compressed and closed at the beginning stage of loading, resulting in some weak AE signals. Subsequently, AE signals increase and enhance gradually with the abnormal signals caused by the defects inside the rocks to generate new cracks. The macroscopic crack is formed to cause the damaged rock to slide relatively along the failure surface, which is the main reason for more abnormal peak frequencies of AE signals occurring during this period.
The distributions of peak frequencies of AE signals for granite, marble, and sandstone are shown in Figure 13a–c, respectively. The peak frequencies of the three types of rocks are mainly distributed in the range of 200–300 kHz, followed by 0–100 kHz, which has the tendency of increasing and then decreasing with the increase of σ2. In the range of 200–300 kHz of peak frequencies, the peak frequencies of granite, marble, and sandstone have their maximum values at confining stresses of 20, 10, and 10 MPa, respectively. The increase of σ2 leads to more cracks propagating along the direction of σ1 when confining stress is small, while the increasing σ2 will inhibit the propagations of cracks and reduce the peak frequency.

3.5. Failure Mode

The process from the initiation and propagation of micro-cracks in rocks to the formation of macro-cracks is the essence of rock failure and plays an important role in strain energy consumption [18,54]. In the biaxial compression tests, the propagation direction of macro-cracks in rocks with high dip fracture angles are generally perpendicular to the free surface, the main macro-crack surfaces are located at the σ1-σ2 plane, and the axial load can aggravate the propagation of macro cracks [24].
The dip fracture angle and the mass and size of rock fragments after failure under different σ2 are statistically analyzed in this part. The fragments can be divided into 5 groups according to their size: >20 mm (big pieces), 12–20 mm (small pieces), 3–12 mm (coarse grain), 1–3 mm (fine grain), and <1 mm (powder). The fragments and the dip fracture angles of the three types of rocks after failure are shown in Figure 14. The weight contents of the fragments with different size ranges are shown in Figure 15.
Because of σ3 = 0, the propagation directions of the fracture planes of macro-cracks are generally perpendicular to the direction of σ3, as shown in Figure 14. The main micro-cracks of granite and marble obliquely intersect with the direction of σ1 at a small angle, and the angle tends to decrease with the increase of σ2, which indicates that the larger σ2 leads to a greater lateral constraint and the larger influence on the generation and propagation of vertical micro-cracks. The failures of granite and marble are more caused by tension cracks. The main micro-cracks of sandstone are in a shape of “Λ”, and the dip failure angles are smaller than that of granite and marble, which indicates that the failure of sandstone is more caused by shear cracks. With the increase of σ2, the weight of big pieces increases at first and then decreases after the failure of granite, marble, and sandstone, indicating that the σ2 at a higher value can promote the generation and propagation of cracks in rocks. After the failure of marble specimens, the weight proportion of powder and small particles is obviously higher than that of granite and sandstone, indicating that the rock lithology has a great influence on the failure of rocks.

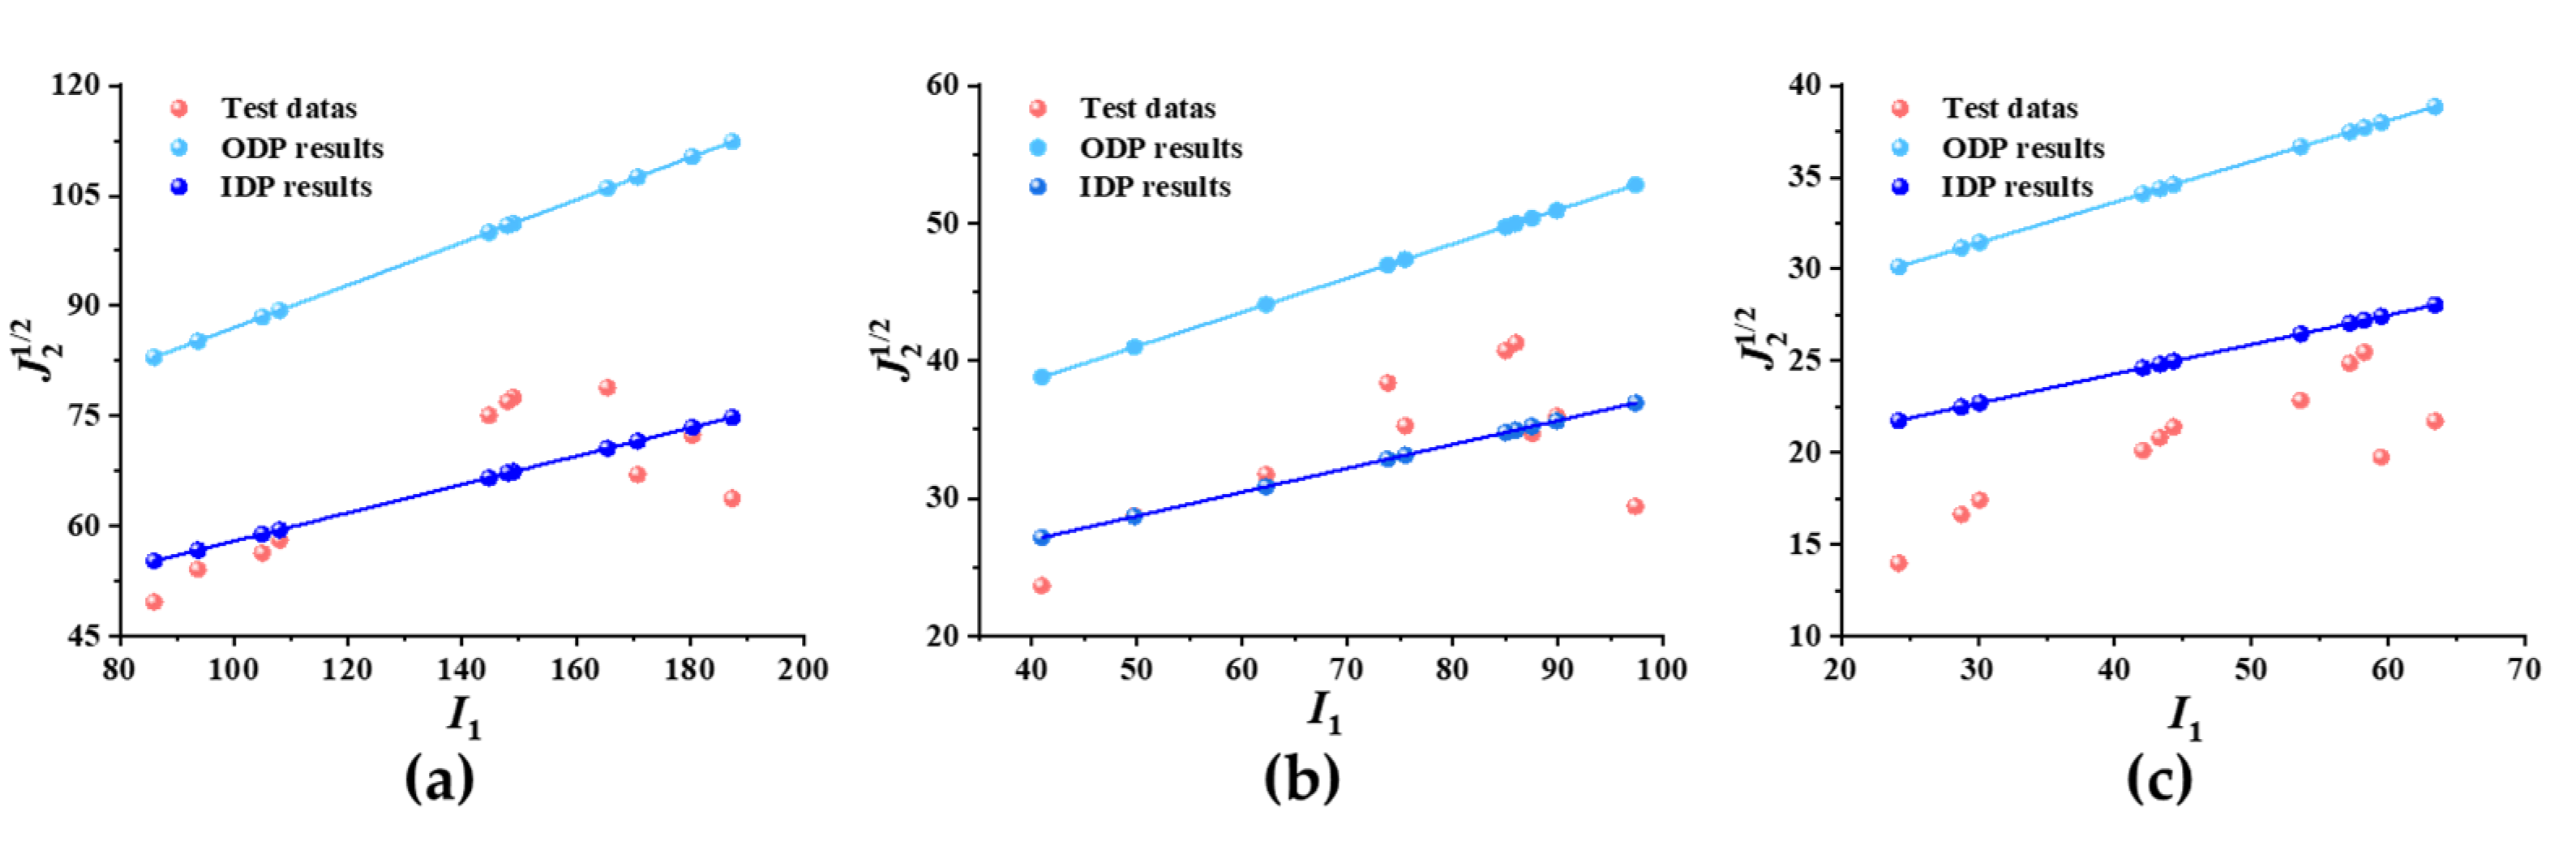
4. Strength Criterion

Drucker–Prager (D-P) criterion [55] is an extension of the Mohr–Coulomb criterion [56], which accounts for the effects of all principal stresses and overcomes the main defect of underestimating the intermediate principal stress of the Mohr–Coulomb criterion. The generalized form is written as:
α I 1 + J 2 1 / 2 = k ,
where I 1 and J 2 are the first and second stress invariants, and α and k are material constants of the rock, respectively.
I 1 = σ 1 + σ 2 + σ 3 ,
J 2 = 1 6 [ ( σ 1 σ 2 ) 2 + ( σ 2 σ 3 ) 2 + ( σ 3 σ 1 ) 2 ] .
For the outer apices–circumscribed D–P criterion (ODP):
α = 2 sin φ 3 ( 3 sin φ ) ,
k = 6 c cos φ 3 ( 3 sin φ ) .
For the inner apices–inscribed D–P criterion (IDP):
α = 2 sin φ 3 ( 3 + sin φ ) ,
k = 6 c cos φ 3 ( 3 + sin φ ) .
Drucker–Prager failure criterion for biaxial confinements condition is achieved by setting σ3 = 0, so the Equation (4) can be written as:
α ( σ 1 + σ 2 ) + σ 1 2 σ 1 σ 2 + σ 2 2 3 = k .
The cohesions c for granite, marble and sandstone were calculated according to triaxial compression data with σ2 = σ3 [57] to be 50.32, 24.1, and 20.54 MPa, respectively. The internal frictional angles φ were 37°, 32°, and 29°, respectively. In Figure 16, failure stress data is plotted against two theoretical solutions (ODP and IDP), indicating that the outer apices–circumscribed Drucker–Prager criterion overestimates the σbcs of the three types of rocks. The inner apices–inscribed Drucker–Prager criterion can accurately predict the σbcs of granite and marble when σ2 is small ( 20 MPa for granite and 10 MPa for marble), whereas it loses accuracy under high σ2 value. As for sandstone, OPD and IPD both overestimate the σbcs, and the gap between the lab data and the theoretical data is larger than that of granite and marble.

5. Conclusions

In this study, the mechanical and AE characteristics of cubic granite, marble, and sandstone specimens were investigated in the biaxial compression tests. The following conclusions can be drawn:
(1) In the biaxial compression tests, the elastic moduli of granite, marble, and sandstone show a decreasing trend with the increase of σ2. The intermediate principal stress σ2 has a significant effect on lateral strain of rock under biaxial confinement. For the three types of rocks in this study, the σ2 over 10 MPa can restrain the development of micro-cracks along the direction of σ2.
(2) The biaxial compressive strengths (σbcs) of granite, marble, and sandstone increased initially and then subsequently decreased with the increase of σ2. The turning-points σ2-t of σ2 corresponding to peak biaxial compressive strengths σbcs,peak for different rocks are different, and the harder rock has a greater σ2-t.
(3) The AE hit rate and AE count rate can reflect the damage degree of rock under biaxial compression. The sharp increases of the AE hit rate and AE count rate indicate the rapid accumulation of internal damage, which is always accompanied by a decrease in b-value. In the loading process, the dynamic b-value fluctuates, and it presents a downward trend on the whole.
(4) From the distribution characteristics of AF-RA, it can be found that few shear cracks in the rock are formed before the failure stage, but the number of shear cracks increases obviously during the failure stage. Tensile cracks in the rock are generated during the entire loading process, but the generation rate of cracks is increasing with the increase of σ1.
(5) More tensile cracks are produced in rock during the loading process with the increase of σ2. The failures of granite and marble are mainly caused by tension cracks, while the failure of sandstone is mainly caused by shear cracks.

Author Contributions

Conceptualization, K.D., M.L. and C.Y.; methodology, K.D. and C.Y.; software, M.L. and C.Y.; validation, K.D., M.L. and S.W.; formal analysis, K.D. and M.L.; investigation, K.D., M.L., C.Y. and S.W.; resources, K.D., F.F. and M.T.; data curation, M.L. and C.Y.; writing—original draft preparation, M.L.; writing—review and editing, K.D., M.T. and S.W.; visualization, M.L.; supervision, K.D.; project administration, K.D. and C.Y.; funding acquisition, K.D. All authors have read and agreed to the published version of the manuscript.

Funding

This research was funded by the National Natural Science Foundation of China (Nos: 51904333 and 51774326), the open fund of Mining Disaster Prevention and Control Ministry Key Laboratory at Shandong University of Science and Technology (No: MDPC201917).

Institutional Review Board Statement

Not applicable.

Informed Consent Statement

Not applicable.

Data Availability Statement

Data sharing not applicable.

Conflicts of Interest

There are no conflict of interest regarding the publication of this paper.

References

  1. Du, K.; Li, X.; Yang, C.; Zhou, J.; Chen, S.; Manoj, K. Experimental investigations on mechanical performance of rocks under fatigue loads and biaxial confinements. J. Cent. South. Univ. 2020, 27, 2985–2998. [Google Scholar]
  2. Du, K.; Li, X.; Tao, M.; Wang, S. Experimental study on acoustic emission (AE) characteristics and crack classification during rock fracture in several basic lab tests. Int. J. Rock. Mech. Min. 2020, 133, 104411. [Google Scholar]
  3. Du, K.; Tao, M.; Li, X.; Zhou, J. Experimental Study of Slabbing and Rockburst Induced by True-Triaxial Unloading and Local Dynamic Disturbance. Rock. Mech. Rock. Eng. 2016, 49, 3437–3453. [Google Scholar]
  4. Wang, S.; Li, X.; Yao, J.; Gong, F.; Li, X.; Du, K.; Tao, M.; Huang, L.; Du, S. Experimental investigation of rock breakage by a conical pick and its application to non-explosive mechanized mining in deep hard rock. Int. J. Rock. Mech. Min. 2019, 122, 104063. [Google Scholar]
  5. Wang, S.; Sun, L.; Li, X.; Wang, S.; Du, K.; Li, X.; Feng, F. Experimental investigation of cuttability improvement for hard rock fragmentation using conical cutter. Int. J. Geomech. 2021, 21, 06020039. [Google Scholar]
  6. Cai, X.; Zhou, Z.; Du, X. Water-induced variations in dynamic behavior and failure characteristics of sandstone subjected to simulated geo-stress. Int. J. Rock. Mech. Min. 2020, 130, 104339. [Google Scholar]
  7. Sagong, M.; Park, D.; Yoo, J.; Lee, J.S. Experimental and numerical analyses of an opening in a jointed rock mass under biaxial compression. Int. J. Rock. Mech. Min. 2011, 48, 1055–1067. [Google Scholar]
  8. Zhu, W.C.; Liu, J.; Tang, C.A.; Zhao, X.D.; Brady, B.H. Simulation of progressive fracturing processes around underground excavations under biaxial compression. Tunn. Undergr. Space Tech. 2004, 20, 231–247. [Google Scholar]
  9. Cai, X.; Zhou, Z.; Zang, H.; Song, Z. Water saturation effects on dynamic behavior and microstructure damage of sandstone: Phenomena and mechanisms. Eng. Geol. 2020, 276, 105760. [Google Scholar]
  10. Mitri, H.S.; Rispoli, A.; Bétournay, M.C. Strength and Behavior of Biaxially Loaded Limestone Rock. In Alaska Rocks 2005, The 40th U.S. Symposium on Rock Mechanics (USRMS): Rock Mechanics for Energy, Mineral and Infrastructure Development in the Northern Regions; OnePetro: Anchorage, AL, USA, 2005. [Google Scholar]
  11. Du, K.; Su, R.; Tao, M.; Yang, C.; Momeni, A.; Wang, S. Specimen shape and cross-section effects on the mechanical properties of rocks under uniaxial compressive stress. Bull. Eng. Geol. Environ. 2019, 78, 6061–6074. [Google Scholar]
  12. Mitri, H.S. Mechanical Behaviour of Biaxially Loaded Coalmine Sandstone; The International Young Scholars’ Symposium on Rock Mechanics: Beijing, China, 2008. [Google Scholar]
  13. Cai, M. Influence of intermediate principal stress on rock fracturing and strength near excavation boundaries—Insight from numerical modeling. Int. J. Rock. Mech. Min. 2007, 45, 763–772. [Google Scholar]
  14. Sainoki, A.; Maina, D.; Schwartzkopff, A.K.; Obara, Y.; Karakus, M. Impact of the intermediate stress component in a plastic potential function on rock mass stability around a sequentially excavated large underground cavity. Int. J. Rock. Mech. Min. 2018, 127, 104233. [Google Scholar]
  15. Bobet, A.; Einstein, H.H. Fracture coalescence in rock-type materials under uniaxial and biaxial compression. Int. J. Rock. Mech. Min. 1998, 35, 863–888. [Google Scholar]
  16. Xie, H.; Li, L.; Ju, Y.; Peng, R.; Yang, Y. Energy analysis for damage and catastrophic failure of rocks. Sci. China. Technol. Sci. 2011, 54, 119–209. [Google Scholar]
  17. Yang, X.; Jing, H.; Chen, K. Numerical simulations of failure behavior around a circular opening in a non-persistently jointed rock mass under biaxial compression. Int. J. Min. Sci. Technol. 2016, 26, 729–738. [Google Scholar]
  18. Zhong, Z.; Deng, R.; Lv, L.; Fu, X.; Yu, J. Fracture mechanism of naturally cracked rock around an inverted U-shaped opening in a biaxial compression test. Int. J. Rock. Mech. Min. 2018, 103, 242–253. [Google Scholar]
  19. Feng, X.; Kong, R.; Zhang, X.; Yang, C. Experimental Study of Failure Differences in Hard Rock under True Triaxial Compression. Rock. Mech. Rock. Eng. 2019, 52, 2109–2122. [Google Scholar]
  20. Chang, C.; Hairnso, B. True triaxial strength and deformability of the German Continental Deep Drilling Program (KTB) deep hole amphibolite. J. Geophys. Res. 2000, 105, 18999–19013. [Google Scholar]
  21. Haimson, B.; Chang, C. A new true triaxial cell for testing mechanical properties of rock, and its use to determine rock strength and deformability of Westerly granite. Int. J. Rock. Mech. Min. 2000, 37, 285–296. [Google Scholar]
  22. Labuz, J.F.; Bridell, J.M. Reducing Frictional Constraint in Compression Testing Through Lubrication. Int. J. Rock. Mech. Min. Geomech. Abstr. 1993, 30, 451–455. [Google Scholar]
  23. Maso, J.; Lerau, J. Mechanical behaviour of Darney sandstone (Vosges, France) in biaxial compression. Int. J. Rock. Mech. Min. Geomech. Abstr. 1980, 17, 109–115. [Google Scholar] [CrossRef]
  24. Yun, X.; Mitri, H.S.; Yang, X.; Wang, Y. Experimental investigation into biaxial compressive strength of granite. Int. J. Rock. Mech. Min. 2010, 47, 334–341. [Google Scholar] [CrossRef]
  25. Fan, P.; Li, Y.; Zhao, Y.; Dong, L.; Ma, L. End friction effect of Mogi type of true-triaxial test apparatus. Chin. J. Rock Mech. Eng. 2017, 36, 2720–2730. [Google Scholar]
  26. Wang, S.; Li, X.; Du, K.; Wang, S.; Tao, M. Experimental study of the triaxial strength properties of hollow cylindrical granite specimens under coupled external and internal confining stresses. Rock. Mech. Rock. Eng. 2018, 51, 2015–2031. [Google Scholar] [CrossRef]
  27. Akai, K.; Mori, H. Study on the Failure Mechanism of a Sand-Stone under Combined Compressive Stresses. Jpn. Soc. Civ. Eng. 1967, 1967, 11–24. [Google Scholar] [CrossRef]
  28. Mogi, K. Effect of the intermediate principal stress on rock failure. J. Geophys. Res. 1967, 72, 5117–5131. [Google Scholar] [CrossRef]
  29. Antonaci, P.; Bocca, P.; Masera, D. Fatigue crack propagation monitoring by Acoustic Emission signal analysis. Eng. Fract. Mech. 2012, 81, 26–32. [Google Scholar] [CrossRef]
  30. Aggelis, D.G.; Mpalaskas, A.C.; Ntalakas, D.; Matikas, T.E. Effect of wave distortion on acoustic emission characterization of cementitious materials. Constr. Build. Mater. 2012, 35, 183–190. [Google Scholar] [CrossRef]
  31. Spies, T.; Eisenblätter, J. Acoustic emission investigation of microcrack generation at geological boundaries. Eng. Geol. 2001, 61, 181–188. [Google Scholar] [CrossRef]
  32. Shiotania, T.; Ohtsub, M.; Ikeda, K. Detection and evaluation of AE waves due to rock deformation. Constr. Build. Mater. 2001, 15, 235–246. [Google Scholar] [CrossRef]
  33. Chen, G.; Sun, X.; Wang, J.; Wang, D.; Zhu, Z. Detection of cracking behaviors in granite with open precut cracks by acoustic emission frequency spectrum analysis. Arab. J. Geosci. 2020, 13, 26–32. [Google Scholar] [CrossRef]
  34. He, M.; Miao, J.; Feng, J. Rock burst process of limestone and its acoustic emission characteristics under true-triaxial unloading conditions. Int. J. Rock. Mech. Min. 2010, 47, 286–298. [Google Scholar] [CrossRef]
  35. Du, K.; Yang, C.; Su, R.; Tao, M.; Wang, S. Failure properties of cubic granite, marble, and sandstone specimens under true triaxial stress. Int. J. Rock. Mech. Min. 2020, 130, 104309. [Google Scholar] [CrossRef]
  36. Aggelis, D.G.; Mpalaskas, A.C.; Matikas, T.E. Investigation of different fracture modes in cement-based materials by acoustic emission. Cement. Concrete. Res. 2013, 48, 1–8. [Google Scholar] [CrossRef]
  37. Aggelis, D.G. Classification of cracking mode in concrete by acoustic emission parameters. Mech. Res. Commun. 2011, 38, 153–157. [Google Scholar] [CrossRef]
  38. Cai, M.; Morioka, H.; Kaiser, P.K.; Tasaka, Y.; Kurose, H.; Minami, M.; Maejim, T. Back-analysis of rock mass strength parameters using AE monitoring data. Int. J. Rock. Mech. Min. 2007, 44, 538–549. [Google Scholar] [CrossRef]
  39. Lei, X.; Masuda, K.; Nishizawa, O.; Jouniaux, L.; Liu, L.; Ma, W.; Satoh, T.; Kusunose, K. Detailed analysis of acoustic emission activity during catastrophic fracture of faults in rock. J. Struct. Geol. 2004, 26, 247–258. [Google Scholar] [CrossRef]
  40. Tham, L.G.; Liu, H.; Tang, C.A.; Lee, P.K.; Tsui, Y. On Tension Failure of 2-D Rock Specimens and Associated Acoustic Emission. Rock Mech. Rock Eng. 2005, 38, 1–19. [Google Scholar] [CrossRef]
  41. Chang, S.H.; Lee, C.I. Estimation of cracking and damage mechanisms in rock under triaxial compression by moment tensor analysis of acoustic emission. Int. J. Rock. Mech. Min. 2004, 41, 1069–1086. [Google Scholar] [CrossRef]
  42. Moradian, Z.A.; Ballivy, G.; Rivard, P.; Gravel, C.; Rousseau, B. Evaluating damage during shear tests of rock joints using acoustic emissions. Int. J. Rock. Mech. Min. 2010, 47, 590–598. [Google Scholar] [CrossRef]
  43. Ishida, T.; Kanagaw, T.; Kanaori, Y. Source distribution of acoustic emissions during an in-situ direct shear test: Implications for an analog model of seismogenic faulting in an inhomogeneous rock mass. Eng. Geol. 2010, 110, 66–76. [Google Scholar] [CrossRef] [Green Version]
  44. Kourkoulis, S.K.; Pasiou, E.D.; Dakanali, I.; Stavrakas, I.; Triantis, D. Notched marble plates under tension: Detecting pre-failure indicators and predicting entrance to the “critical stage”. Fatigue. Fract. Eng. M 2018, 41, 776–786. [Google Scholar] [CrossRef]
  45. Triantis, D.; Kourkoulis, S.K. An Alternative Approach for Representing the Data Provided by the Acoustic Emission Technique. Rock. Mech. Rock. Eng. 2018, 51, 2433–2438. [Google Scholar] [CrossRef]
  46. Mogi, K. Study of Elastic Shocks Caused by the Fracture of Heterogeneous Materials and Its Relations to Earthquake Phenomena. Bull. Earthq. Res. Inst. 1962, 40, 125–173. [Google Scholar]
  47. Scholz, C. The Frequency-Magnitude Relation of Microfracturing in Rock and Its Relation to Earthquakes. Bull. Seismol. Soc. Am. 1968, 58, 399–415. [Google Scholar]
  48. Lei, X.L. How Do Asperities Fracture? An Experimental Study of Unbroken Asperities. Earth Planet. Sci. Lett. 2003, 213, 347–359. [Google Scholar] [CrossRef]
  49. Gutenberg, B.; Richter, C.F. Frequency of earthquakes in California. Bull. Seismol. Soc. Am. 1944, 34, 185–188. [Google Scholar]
  50. Rao, M.V.M.S.; Lakshmi, K.J.P. Analysis of b-value and improved b-value of acoustic emissions accompanying rock fracture. Curr. Sci. India 2005, 89, 1577–1582. [Google Scholar]
  51. Rao, M.V.M.S.; Prasanna Lakshmi, K.J.; Nagaraja Rao, G.M.; Vijayakumar, K.; Udayakumar, S. Precursory icrocracking and brittle failure of Latur basalt and migmatite gneiss under compressive loading. Curr. Sci. India 2011, 101, 1053–1059. [Google Scholar]
  52. Aggelis, D.G.; Soulioti, D.V.; Sapouridis, N.; Barkoula, N.M.; Paipetis, A.S.; Matikas, T.E. Acoustic emission characterization of the fracture process in fibre reinforced concrete. Constr. Build. Mater. 2011, 25, 4126–4131. [Google Scholar] [CrossRef]
  53. Loukidis, A.; Triantis, D.; Stavrakas, I.; Pasiou, E.D.; Kourkoulis, S.K. Comparative Ib-value and F-function analysis of Acoustic Emissions from elementary and structural tests with marble specimens. Mater. Des. Process. Commun. 2020, e176. [Google Scholar] [CrossRef] [Green Version]
  54. Gay, N.C. Fracture growth around openings in large blocks of rock subjected to uniaxial and biaxial compression. Int. J. Rock. Mech. Min. 1976, 13, 231–243. [Google Scholar] [CrossRef]
  55. Drucker, D.C.; Prager, W. Soil mechanics and plastic analysis or limit design. Q. Appl. Math. 1952, 10, 157–165. [Google Scholar] [CrossRef] [Green Version]
  56. Colmenares, L.B.; Zoback, M.D. A statistical evaluation of intact rock failure criteria constrained by poly axial test data for five different rocks. Int. J. Rock Mech. Min. Sci. 2002, 39, 695–729. [Google Scholar] [CrossRef]
  57. Feng, F.; Li, X.; Du, K.; Li, D.; Rostami, J.; Wang, S. Comprehensive Evaluation of Strength Criteria for Granite, Marble, and Sandstone Based on Polyaxial Experimental Tests. Int. J. Geomech. 2020, 20, 04019155. [Google Scholar] [CrossRef]
Figure 1. Stress state and the associated strength characteristics, including (a) biaxial stress state in rock around underground opening, (b) σbcs envelope curves, and (c) difference between rock strengths with anti-friction measures (AFM) and these without AFM.
Applsci 11 00769 g001
Figure 2. Rock specimens used in this study: (a) specimen size, and (bd) mineral components of granite, marble, and sandstone, respectively.
Applsci 11 00769 g002
Figure 3. Stress loading paths, including (a) Path I and (b) Path II.
Applsci 11 00769 g003
Figure 4. Anti-friction measures.
Applsci 11 00769 g004
Figure 5. Testing apparatuses: (a) overall view, (b) acoustic emission (AE) sensors distribution, (c) biaxial compression setup, (d) loading condition, (e) AE sensor, (f) measuring method of strain during biaxial compression loading. Note: The numbers 1–12 represent the TRW-3000 operating system, high-speed camera with an operating system, AE control system, spotlight, TRW-3000, servo-controller system, object stage, extensometer, platen, specimen, AE sensors with screw holders, and data line, respectively.
Applsci 11 00769 g005
Figure 6. Axial stress–strain curves of rock specimens including (a) granite, (b) marble, (c) sandstone, and the (d) elastic modulus.
Applsci 11 00769 g006
Figure 7. Lateral strain curves: (ac) granite; (df) marble; (gi) sandstone.
Applsci 11 00769 g007
Figure 8. Strength characteristics including (a) biaxial compressive strengths and the associated fitting curves, and (b) the increasing rate of σbcs for granite, marble, and sandstone.
Applsci 11 00769 g008
Figure 9. Changes of AE hit rate, AE count rate, and b-value with time and the corresponding stress–strain curves: (ac) granite; (df) marble; (gi) sandstone.
Applsci 11 00769 g009
Figure 10. AF-RA dot density diagrams: (ac) granite; (df) marble; (gi) sandstone.
Applsci 11 00769 g010
Figure 11. Time history of (ac) RA, (df) AF. (a,d) for granite with σ2 = 20 MPa, (b,e) for marble with σ2 = 20 MPa, (c,f) for sandstone with σ2 = 10 MPa.
Applsci 11 00769 g011
Figure 12. Peak frequency and stress variation with time in the biaxial compressive tests with σ2 = 10 Mpa: (a) granite, (b) marble, and (c) sandstone.
Applsci 11 00769 g012
Figure 13. Peak frequency distributions of (a) granite, (b) marble, and (c) sandstone.
Applsci 11 00769 g013aApplsci 11 00769 g013b
Figure 14. Fragments of (a) granite, (b) marble, and (c) sandstone after rock failure.
Applsci 11 00769 g014aApplsci 11 00769 g014b
Figure 15. Weight of fragments with different sizes: (a) granite, (b) marble, and (c) sandstone.
Applsci 11 00769 g015
Figure 16. Failure criterion data and theoretical solutions of Drucker–Prager criterion in J 2 1 / 2 - I 1 space: (a) granite, (b) marble, and (c) sandstone.
Applsci 11 00769 g016
Table 1. Testing parameters in Path I.
Rock Types σ 2 (MPa) σ 3 (MPa)Loading Rate (MPa/s)
Granite0, 5, 10, 20, 40, 6000.2
Marble0, 5, 10, 20, 4000.2
Sandstone0, 5, 10, 2000.2
Table 2. Basic mechanical parameters of granite, marble, and sandstone.
Rock Types σ ucs (MPa) E y (GPa) μ V L ( km · s 1 )
Granite89.8652.250.254.26
Marble45.3927.670.273.58
Sandstone27.7112.070.312.34
Table 3. Biaxial compressive strengths of granite, marble, and sandstone.
Rock TypeSpecimen NO. σ 3 (MPa) σ 2 (MPa) σ 1 (MPa) σ bcs (MPa)
Graniteg-0-10086.1286.12
g-0-20093.6893.68
g-5-105103.00103.00
g-5-20599.9599.95
g-10-1010134.73134.73
g-10-2010138.98138.98
g-10-3010138.00138.00
g-20-1020145.50145.50
g-40-1040130.80130.80
g-40-2040140.40140.40
g-60-1060127.40127.40
g-T-10 σ 1 98.1098.10
g-T-20 σ 1 99.8099.80
Marblem-0-10049.8049.80
m-0-20040.9840.98
m-5-10568.8568.85
m-5-20557.3057.30
m-10-101076.0076.00
m-10-201065.5065.50
m-10-301075.0275.02
m-20-102069.9069.90
m-20-202067.5667.56
m-40-104072.3072.30
m-T-10 σ 1 66.1166.11
m-T-20 σ 1 62.4062.40
Sandstones-0-10028.8028.80
s-0-20024.2024.20
s-0-30030.1430.14
s-5-10537.0637.06
s-5-20539.3039.30
s-5-30538.3038.30
s-10-101047.2047.20
s-10-201043.6043.60
s-10-301048.2448.24
s-20-102039.4939.49
s-20-202043.4043.40
s-T-10 σ 1 38.4038.40
Publisher’s Note: MDPI stays neutral with regard to jurisdictional claims in published maps and institutional affiliations.

