Abstract
This article presents an analysis of the causes of a fatigue crack in the guide bar of a pressing device. The detailed analysis included the analysis of a material’s microstructure and its cyclic properties. Direct measurements of the strains during operation allowed the nominal loading process in the critical cross-section of the press subassembly to be obtained. The notch effect of the inner thread of the guide bar was analyzed using a precision FEM (finite element method) model and was followed by the transformation of the nominal loading into the notch root. A methodological approach was formulated based on the analyses made, which lay in the statistical interpretation of the factors leading to an identification of the cause of an early fracture.
1. Introduction
The reliable operation of industrial presses used for the production of fuel tanks for automotive applications is an important factor for car companies when choosing a supplier for automotive production lines. Fatigue cracking in the operation of such machines threatens the process of production on those production lines because one of their components is missing.
An industrial press is an immense structure forming part of a fully automated assembly line. The fatigue lifetime assessment of production line structures of such types is difficult because there are only a few examples operating in the world. Thus, this structure can be considered more like a prototype stage than mass-produced machines. The unexpected fatigue crack occurred on this type of device after several years of operation on the main frame support. The simplified scheme of the front part of the device for the production of car tanks is displayed in Figure 1.
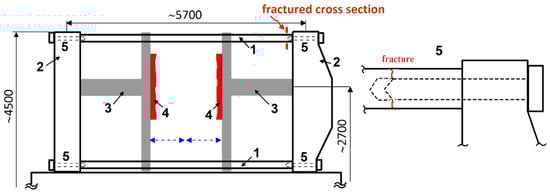
Figure 1.
Scheme of the main frame of the pressing machine for production of car tanks. 1—guide bars, 2—massive stiff vertical frame members, 3—hydro motor, 4—former, 5—M80 bolts (detail), l ≈ 520 mm.
An analysis of fatigue lifetime and the causes of an early fatigue fracture may be carried out by several known methods: using local stress–strain approaches [1,2], statistical approaches [3,4], deterministic fatigue analysis (experimental) [2], spectral fatigue analysis [5,6], time–domain fatigue analysis, fracture-mechanics-based assessment of fatigue damage [1,7], etc. The detailed case study presented in this paper finally led to an employment of the local stress–strain approach using a statistical assessment.
2. Analysis of the Failure
After about 500,000 work cycles, the fracture occurred in the upper guide bar (see Figure 1). The fatigue crack initiation was in the internal thread of the guide bar in the cross-section between the bolt end and the bottom of the threaded rod guide opening. The fracture surface appearance displayed in Figure 2 demonstrates the high rate of fatigue crack propagation across the overall cross-sectional area. The residual fracture of the whole cross-section is only about one-third of total cross-sectional area.
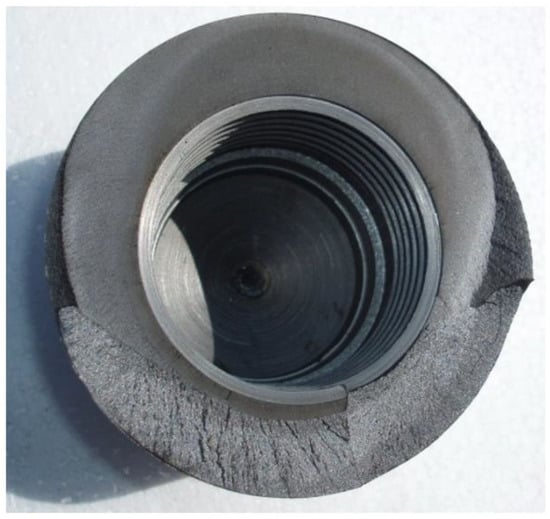
Figure 2.
Fracture surface.
While assessing the causes of premature fracture of the guide bar, it was necessary to analyze the material at the fracture site and the working cycles of the device in terms of stresses acting in the cross-section where the fracture occurred. A sliver of base material directly cut out from the guide bar in the fracture site was selected for metallographic analysis of its microstructure and hardness measurement. By mechanical splitting, subsequent grinding, and fine polishing, the microscopic structure was enhanced after etching (Figure 3).
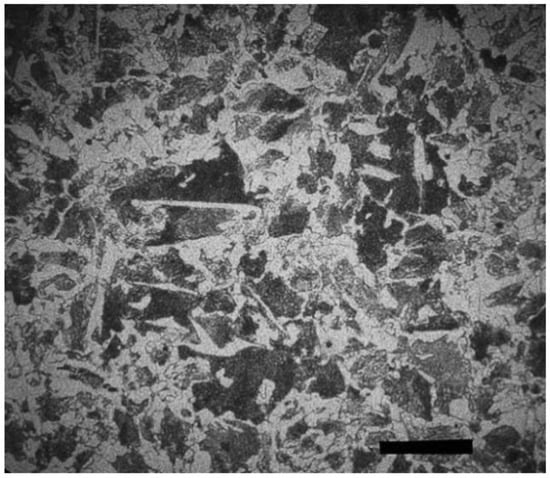
Figure 3.
Metallographic facet of the steel (magnified 250 times, etched in nital).
A number of facts can be ascertained from the microstructural analysis of the steel.
- -
- The material is non-eutectic steel with a ferritic–pearlitic structure which has not been heat-treated.
- -
- Carbon content is 0.45 ÷ 0.48%.
- -
- The possible alloying element is chromium (in the unprocessed state, it practically does not have any impact on the strength and deformation properties of the steel).
- -
- The microstructure of the material is highly homogeneous without structural debris, massive deposits, cracks, burnt oxides, etc.
- -
- In view of the small number of deposits, it can be assumed that the steel has a low sulphur and phosphorus content and was obtained by a two-stage metallurgical treatment.
- -
- The structure of the steel does not contain any structural regions that would serve as local initiators of the origin and growth of the fatigue crack.
The measured hardness values (Figure 4) with minimal scattering are confirmed by the conclusions of the metallographic observation of the structural homogeneity of the steel under consideration and its sufficient plastic properties (ductility). The hardness determined for steel strength is about 495–530 MPa. The fatigue limit of such material can be calculated by methods [8,9] to an approximate value of 220 MPa.
Figure 4.
Hardness measurements at the site of the guide bar crack in both directions.
In order to assess the cause of the fracture, it is necessary to further know the operating loading in the critical cross-section of the guide bar in the form of a stress time course.
Within the available options, the following procedure was selected:
- -
- direct measurement of stresses on the external surface of the critical cross-section of guide bar during operation and
- -
- determine the notch effect of the internal thread analytically and on the model using FEM (finite element method).
Along the critical cross-section of the guide bar, strain gauge sensors were installed at 120° spacing, so that it was possible to differentiate the effect of bending moments and normal force [10,11] (Figure 5). This procedure allowed the point of maximum cross-sectional stress to be determined using equations for the calculation of the stress from normal force and the maximum stress from the bending moment:
where E is Young’s modulus and εi are values of the relative deformations measured by individual sensors.
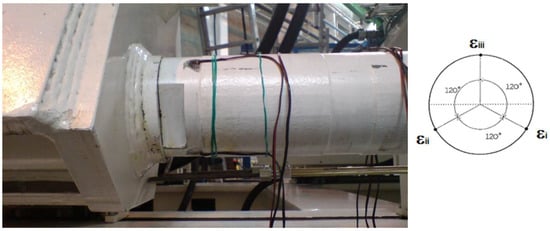
Figure 5.
Deployment of strain gauges along the outer cross-sectional area of the guide bar.
The measured typical stresses in the critical cross-section on the outer surface of the guide bar are displayed in Figure 6.
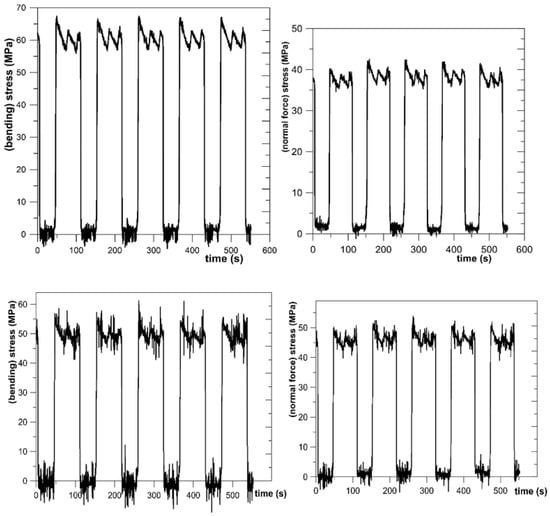
Figure 6.
Diagrams of maximum normal stresses from bending moment and stress from normal force measured for two operational modes (mode 1—top, mode 2—bottom).
The fatigue crack initiation site was at the root of the internal thread (the first engaged thread, see Figure 1). The criticality of this cross-section was predetermined by the change in cross-sectional stiffness at the location between the end of the bolt and the bottom of the threaded hole (Figure 2). In this area, the annular cross-section caused additional bending loading under the tensile loading from the prestressed bolt and the pressing force developed by the hydraulic cylinder. The resulting value of the stress (from the bolt pre-tension, additional bending moment, and pressing force) had to be recalculated (transformed) into the notch root of the thread. The effective method for such transformation, applicable in engineering practice, is Neuber’s method [12,13]. The equation below requires the knowledge of nominal stress/strain value σn/εn, deformation as well as the effective notch coefficient of the thread root in the hole of the guide bar:
The value of nominal stress (as well as the deformation) can be determined as the addition of stresses from the working cycle (see Figure 6) and calculated stress from the pre-tension of the bolt. The magnitude of notch coefficient is given by Neuber’s formula as
where Kσ is the stress concentration factor, ρ is the radius of the notch root, and ρF = ρ + mρ* is the fictitious radius defined by Neuber [13] (material parameter m = 2, structural length ρ* = 0.095 ÷ 0.115 mm, ρ = 0.45 mm)
The value of the stress concentration factor Kσ can be determined in several ways, e.g., by using the approach of equivalent ellipse and applying the expression for an elliptical groove [6] or using the FEM model. Let us note that the usage of modeling with FEM frequently requires a careful choice of mesh, types of elements, and boundary conditions [14] (see Figure 7). When using a sufficiently fine mesh requiring as many as five elements at the thread root, a linear element (Solid 8 Node 185) could be used. At the interface of threads, an 8-node contact element (Conta 174) was employed in combination with a 3D Target 170. The setting-up of the conditions of contact and boundary conditions of the calculation was based on reaching the same stress values on the surface of the guide bar as were obtained by direct measurement. The results of the precision mathematical model of the critical node under the load of tensile force and bending moment corresponding to the measured values of stress according to Figure 6 are in Figure 8. For the value of the nominal stress from the tensile force of 40 MPa and the bending at the thread point of 30 MPa, the value of the stress concentration factor based on FEM simulation is Kσ = 5.43 and using Equation (3) for the notch factor is Kef = 4.4 ÷ 4.53.
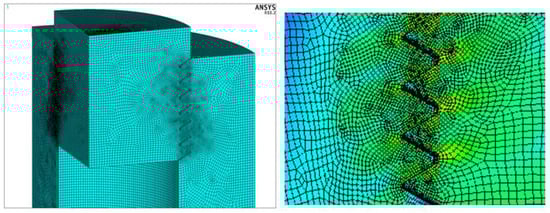
Figure 7.
Finite element mesh at the internal M80 thread location of guide bar.
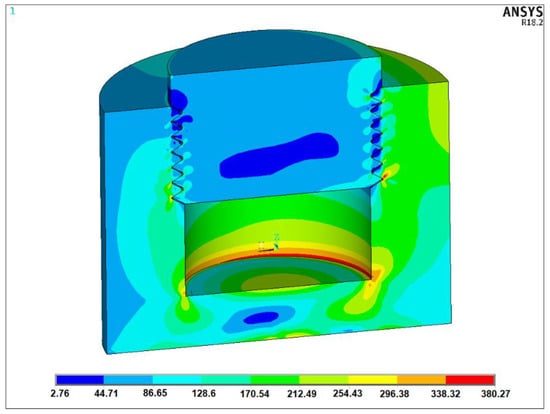
Figure 8.
The resulting stresses obtained by measured values of tensile and bending loading (measured on the outer surface of the guide bar according to Figure 6).
By measuring the exact geometry in the root of the thread using a digital microscope (Figure 9) and using the elliptical groove concept according to Nishida [15,16], it is possible to analytically determine the value of the stress concentration factor, Kσ = 5.95. This value is in good agreement with the results of the FEM model, which we will use in the next analysis.
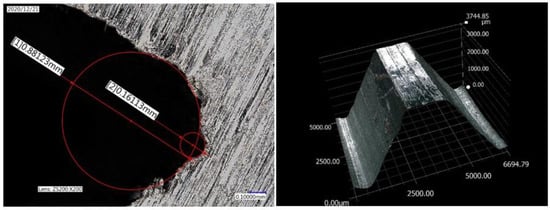
Figure 9.
Exact values of thread geometry obtained using a Keyence VHX 6000 digital microscope.
The value of the stress in the root of the internal thread is obtained by applying the Neuber method (Equation (2)). The nominal stress is based on the measured values of tensile stress (40 MPa) and additional bending stress at the thread point (30 MPa), to which the stress from the bolt pre-tension (74 MPa recalculated according to the manufacturer’s data) is added. Point 1 in Figure 10 represents the stress at the root of the thread for a linear material model, point 2 for the actual tensile curve of the guide bar material.
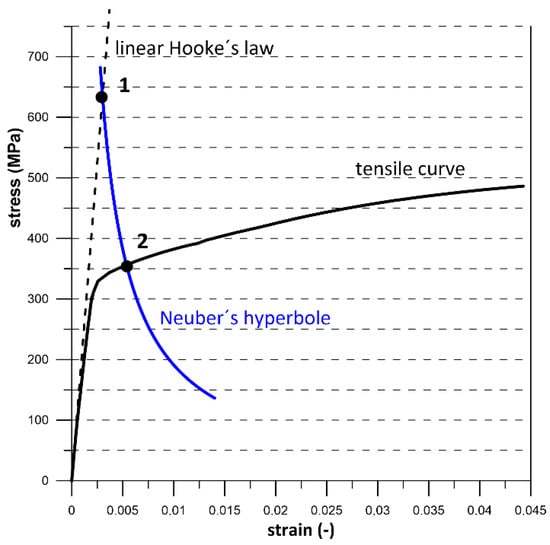
Figure 10.
Application of the Neuber method of transforming the value of the nominal stress of 144 MPa into the root of the thread (1—633 MPa, 2—352 MPa).
Taking the above-mentioned into consideration, it turns out to be crucial to assess the fatigue strength of the critical point of the guide bar’s internal thread. Although the decisive variables are not deterministic values, they could be determined at a certain interval or with a certain probability. Therefore, a more credible approach was taken to assess the risk of premature fatigue fracture in probabilistic form [8]. The methodology of this approach is based on the interaction of two sets of uncertainties:
- a set of stress amplitudes that can be characterized by Gaussian (or Student, etc.) distribution and describing the mean value of stress amplitude and its scatter obtained by the longer-term measurement of stresses in operation and
- a set of fatigue limit values of the guide rod material, which is also characterized by the Gaussian (or Student, etc.) distribution, and will be described by the mean value of fatigue limit and its possible scatter for this type of material.
The relative position of these two statistical sets indicates the probability with which the amplitude of potential stresses in the root of the thread exceeds the fatigue strength of the guide bar material (Figure 11).
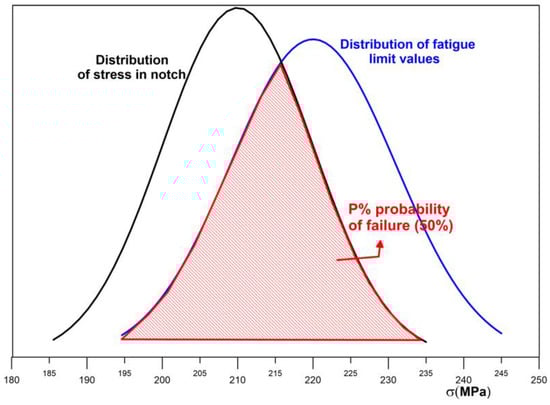
Figure 11.
Statistical interpretation of the risk of early fatigue fracture for a critical location at the point of the internal thread in the guide bar of the press machine.
The value of the penetration of such defined functions depends on the mutual positioning of the sets of variables considered and the widths of probability intervals of their occurrence (i.e., their variability in operation or material). The risk of premature fatigue fracture can also be mathematically described and numerically expressed.
A distribution function of stress in notch (resulting from the uncertainty of designation of notch coefficient and fluctuation of the stress in the individual working cycles in Figure 12, uncertainty of notch factor Kef and mean value of stress cycle taken into account based on Goodman’s [17] or Morrow’s [18] approach) is given by the following parameters of normal distribution: .
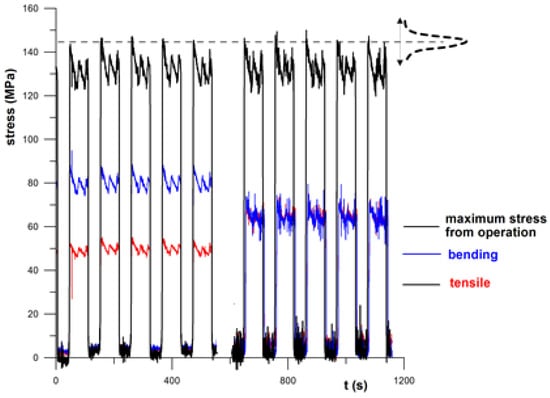
Figure 12.
Variability of nominal stresses (two operational modes).
Mean value: = 210 MPa.
Standard deviation: = 10 MPa.
The corresponding standard deviation is calculated using the following formula
where Δ is the maximal range of the stress amplitude value determined by measurement directly in operation (Figure 6 and Figure 12) and u95% is the normal distribution quantile for a 95% probability of occurrence.
Distribution of fatigue limit values (resulting from the statistical nature variance of cyclic material properties, as documented in Figure 13): .
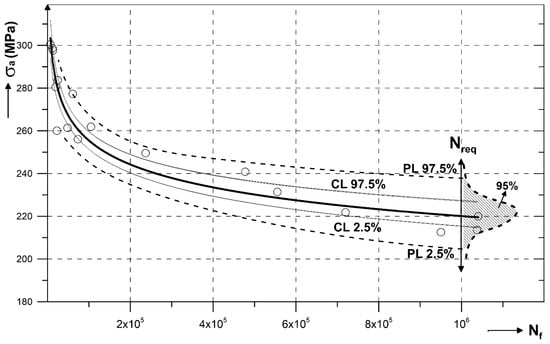
Figure 13.
Scattering of cyclic material properties on the S–N material curve described using the intervals of reliability (confidence limit—CL, prediction limit—PL).
Mean value [9,10]: MPa.
Standard deviation: For most steels, the standard deviations determined by this relationship are in the range of 5% to 7% of the stress amplitude on the regression line [9,10]. In our considered case = 11 MPa.
In terms of early risk of fatigue crack, the relationship of those two sets is characterized by the probability of failure described as a random value F with parameters of normal distribution: .
Mean value: .
Scatter: .
A condition of probability of failure is a probability of occurrence of such a situation that an amplitude of an equivalent cycle of loading exceeds the value of a material’s fatigue limit. For values of the quantity F, this condition is expressed by the following condition:
Probability of failure is, therefore, given by a quantile value of the quantity’s (F) distribution:
This value of quantile corresponding to 50% probability of failure.
The situation for the numeric values specified above is graphically presented in Figure 11.
3. Conclusions and Steps to Reduce the Risk of Failure
The aim of this article was to analyze the causes of fatigue failure in the operation of an industrial pressing machine. Despite the fact that a loading process may be considered quasi-harmonic, the analysis of an early fatigue fracture’s cause presented in our study was rather complex.
It turned out that the assessment of fatigue’s causes of this type can be determined only using a local stress–strain approach with statistical assessment. Providing a normal distribution of a batch of amplitudes in a quasi-harmonic loading process as well as scattering at the point of fatigue limit [19,20]; a relatively simple approach for assessing the risk of an early fatigue fracture is proposed.
In order to prevent the occurrence of such failures in terms of statistical probability, the risk of their occurrence would have to be reduced to an acceptably low probability value. Taking into consideration the operator’s points of view (costs, scope of technical procedures, repair time, etc.), only two solutions seem to be viable in engineering practice:
- decreasing the peak of the stress in the critical volume of material in the root of thread or
- increasing the value of the fatigue limit of material by choosing the stronger material with better cyclic material properties.
Decreasing the peak of stress in the root of the thread can only be achieved by reducing the nominal stress in the critical cross-section by reducing the pre-tension of the bolt or choosing the optimal ratio of the bolt cross-section to the annular cross-section of the guide bar at the site of the joint. The potential of these two changes is in this case a maximum of 15 MPa, which would be reflected by decreasing the mean stress value distribution in a critical place and reducing the risk of failure to 10%. By exchanging the material of the guide bar for a material with a higher fatigue limit (this step has been also done in real terms) of at least 20 MPa it is possible to reduce the risk of premature crack to a value of 5%. Those changes are graphically displayed in Figure 14.
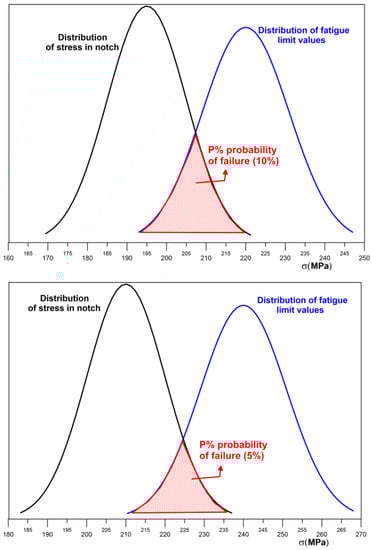
Figure 14.
Graphical expression of possibilities reducing the fatigue fracture risk of press bar.
Author Contributions
Calculations M.G.; conceptualization, methodology V.C.; measurement M.Š.; FEM consulation M.M. All authors have read and agreed to the published version of the manuscript.
Funding
This work was supported by the Slovak Research and Development Agency under the contract No. APVV-17-0666 and by the Research & Development Operational Program funded by the ERDF ITMS: 26240220084 Science, Bratislava.
Data Availability Statement
Data sharing not applicable.
Conflicts of Interest
The authors declare no conflict of interest.
References
- Milne, I.; Ritchie, R.O.; Karihaloo, B. Comprehensive Structural Integrity; Elsevier: Amsterdam, The Netherlands, 2003. [Google Scholar]
- Cui, W. A state-of-the-art review on fatigue life prediction methods for metal structures. J. Mar. Sci. Technol. 2002, 7, 43–56. [Google Scholar] [CrossRef]
- Yunoh, M.F.M.; Abdullah, S.; Saad, M.H.M.; Nopiah, Z.M.; Nuawi, M.Z. Probability Analysis in Determining the Behaviour of Variable Amplitude Strain Signal Based on Extraction Segments. Latin Am. J. Solids Struct. 2017, 14, 2141–2152. [Google Scholar] [CrossRef]
- Kliman, V. Probabilistic approach to operational fatigue-life evaluation. Part II. Calculation of fatigue-life distribution function with respect to inhomogeneity of material properties and random loading. Kov. Mater. Met. Mater. 1999, 37, 18–33. [Google Scholar]
- Wisner, B.; Mazur, K.; Kontsos, A. The use of nondestructive evaluation methods in fatigue: A review. Fatigue. Fract. Eng. Mater. Struct. 2020, 43, 859–878. [Google Scholar] [CrossRef]
- Radaj, D.; Vormwald, M. Advanced Methods of Fatigue Assessment; Springer: Berlin/Heidelberg, Germany, 2012. [Google Scholar] [CrossRef]
- Chryssanthopoulos, M.K.; Righiniotis, T.D. Fatigue reliability of welded steel structures. J. Constr. Steel Res. 2006, 62, 1199–1209. [Google Scholar] [CrossRef]
- Papuga, J. A survey on evaluating the fatigue limit under multiaxial loading. Int. J. Fatigue. 2011, 33, 153–165. [Google Scholar] [CrossRef]
- Kučera, J.; Cesarz, S.; Kufa, T. Relation between ultimate stress and low-cycle fatigue parameters (in Czech). Mech. Eng. 1989, 39, 546–553. [Google Scholar]
- Chmelko, V.; Garan, M. Long-term monitoring of strains in a real operation of structures. In Proceedings of the 14th IMEKO TC10 Workshop on Technical Diagnostics 2016, Milano, Italy, 27–28 June 2016; pp. 333–336. [Google Scholar]
- Chmelko, V.; Garan, M.; Šulko, M. Strain measurement on pipelines for long-term monitoring of structural integrity. Measurement 2020, 163, 107863. [Google Scholar] [CrossRef]
- Neuber, H. Krebspannungslehre, 2nd ed.; Springer: Berlin/Heidelberg, Germany, 1958. [Google Scholar]
- Neuber, H. Theoretical Determination of Fatigue Strength at Stress Concentration; Report AFML-TR-68-20; Air Force Materials Lab. Wright-Patterson Air Force Base Dayton: Montgomery County, OH, USA, 1968. [Google Scholar]
- Radaj, D.; Vormwald, M. Ermüdungsfestigkeit: Grundlagen für Ingenieure; Springer: Berlin/Heidelberg, Germany, 2007. [Google Scholar]
- Pilkey, W.J. Peterson’s Stress Concentration Factors; John Wiley & Sons, Inc.: Hoboken, NJ, USA, 1997. [Google Scholar]
- Nishida, M. Stress Concentration; Mori Kita Press: Tokyo, Japan, 1976. [Google Scholar]
- Goodman, J. Mechanics Applied to Engineering; Longmans, Green and Co.: London, UK, 1919; pp. 631–636. [Google Scholar]
- Morrow, J.D. Fatigue properties of metals, section 3.2. In Fatigue Design Handbook; Pub. No. AE-4; SAE: Warrendale, PA, USA, 1968; p. 21. [Google Scholar]
- Kepka, M.; Kepka, M., Jr.; Chvojan, J.; Václavík, J. Structure service life assessment under combined loading using probability approach. Frat. Integrita Strutt. 2016, 10, 82–91. [Google Scholar] [CrossRef]
- Kliman, V.; Kepka, M.; Václavík, J. Influence of scatter of cyclic properties of material on operational endurance of construction. Kov. Mater. Met. Mater. 2010, 48, 367–378. [Google Scholar] [CrossRef]
Publisher’s Note: MDPI stays neutral with regard to jurisdictional claims in published maps and institutional affiliations. |
© 2021 by the authors. Licensee MDPI, Basel, Switzerland. This article is an open access article distributed under the terms and conditions of the Creative Commons Attribution (CC BY) license (http://creativecommons.org/licenses/by/4.0/).