Article

Effects of Crop Protection Unmanned Aerial System Flight Speed, Height on Effective Spraying Width, Droplet Deposition and Penetration Rate, and Control Effect Analysis on Wheat Aphids, Powdery Mildew, and Head Blight

1
Key Laboratory of Modern Agricultural Equipment and Technology, Ministry of Education, Jiangsu University, Zhenjiang 212013, China
2
Key Laboratory of Plant Protection Engineering, Ministry of Agriculture and Rural Affairs, Zhenjiang 212013, China
3
Nanjing Institutes of Agricultural Mechanization, Ministry of Agriculture and Rural Affairs, Nanjing 210014, China
4
Nanjing University of Aeronautics and Astronautics, Nanjing 210016, China
5
Wuxi Hanhe Aviation Technology Co., Ltd., Wuxi 214135, China
*
Authors to whom correspondence should be addressed.
Appl. Sci. 2021, 11(2), 712; https://doi.org/10.3390/app11020712
Submission received: 20 December 2020 / Revised: 8 January 2021 / Accepted: 10 January 2021 / Published: 13 January 2021

Abstract

:
As a new type of crop protection machinery, the Crop Protection Unmanned Aerial System (CPUAS) has developed rapidly and been widely used in China; currently, how to use the CPUAS scientifically has become a top priority. However, the relationships between the operating parameters of the CPUAS and the effective spraying width (ESW), droplet distribution characteristics, and control effects of insect pests and diseases are not clear yet. Therefore, three levels of flight speed (FS) as 3, 4, and 5 m/s, three levels of flight height (FH) as 1.5, 2.0, and 2.5 m, and spraying volume 2.0 L/min experiments were carried out to investigate the effects of FS and FH on the ESW, droplet deposition uniformity (DDU), and droplet penetration rate (DPR) by using an electric single-rotor CPUAS CE20. Based on the obtained results, combined with the insect pests and diseases occurrence agronomic laws, the optimal operation parameters of the CPUAS were selected to control the wheat aphids, powdery mildew, and head blight. The results showed that the ESW of CE20 was not consistent, the maximum value was 5.78 m, and the minimum one was 2.51 m. The FS had a highly significant impact on ESW (p = 0.0033 < 0.01), while the FH and the interaction between FS and FH had no significant impact on ESW. The coefficients of variation (CV) of the droplet deposition were between 23.3% and 34.4%, which meant good deposition uniformity. The FH (p = 0.0019) and the interaction between FS and FH (p = 0.02) had significant impacts on the DDU. The control effects on aphids were 78.71% (1 day), 84.88% (3 days), and 90.42% (7 days), the control effects on powdery mildew were 77.17% (7 days) and 82.83% (14 days), and the control effect on head blight was 88.32% (20 days). This study proved that by the optimization of parameters and the combination of agronomy, good control effects for insect pests and diseases could be achieved by the CPUAS. The research results would provide some technical supports for CPUAS application.

1. Introduction

Wheat (Triticum aestivum) is one of the four major food crops in China, which is also one of the most important food crops around the world. The high yield of wheat is of great significance for solving the problems of poverty and hunger. The aphid (Aphidoidea) [1,2], powdery mildew (Blumeria graminis) [3,4], and head blight (Fusarium graminearum Schw.) [5] are the major insect pest and diseases threatening the high quality and yield of wheat, which could occur from the turning green stage to the flowering stage. According to the forecast report from the National Agro-Tech Extension and Service Center of China on 13 November 2020, only the head blight would occur in an area of 6 million hectares in China in 2021, and 133.33 million hectares need to be prevented and controlled totally. How to effectively and quickly control insect pests and diseases of wheat, especially aphids, powdery mildew, and head blight is an urgent problem that farmers need to address.
In recent years, the Crop Protection Unmanned Aerial System (CPUAS) has developed rapidly in China [6,7,8], not only the technical level but also the application area have been already the first around the world [9,10]. With the real-time kinematic high-precision positioning technology and flight control technology, almost all the CPUASs have achieved fixed altitude and speed. Furthermore, the application of obstacle avoidance technology and terrain-following technology has improved the safety and accuracy of the CPUASs [7,11,12,13]. The high single pesticide application efficiency of CPUASs with an average of about 0.8–2.8 hectares is its obvious advantage [14]. In addition, the operators could be separated from the pesticide tanks on the CPUASs, which would prevent the pesticide poisonings to the operators.
Researchers have carried out many studies on how to make good use of the CPUASs for improving the pesticide utilization rate and achieving effective control of the crop diseases and insect pests. Al-Heidary et al. [15] studied the influences on the aerial spraying drift from the perspective of the droplets (size, velocity, evaporation, diameter distribution), which provided certain reference significance for this research. Qiu et al. [16] studied the effects of flight height (FH) and flight speed (FS) on the droplet deposition uniformity, and the results showed that the two factors and the interaction between them all affected the deposition and uniformity; the relationship model between deposition uniformity and FH/FS has been established for guiding the actual production application. For a multi-rotor CPUAS, Zhang et al. [17] investigated the effects of FS and FH on the effective spraying width (ESW) and droplet penetration rate (DPR) and reported that the FS had significant impacts on the ESWs, and the impacts of both FS and FH on the DPRs were highly significant. This research involved the effects of operating parameters on the droplet deposition of aerial spraying, which had great reference value for the studies of this article. For different crops, insect pests, and diseases, some scholars had also studied the effects of the aerial application parameters on the droplet deposition characters and control effects. Qin et al. [18] explored the effects of CPUAS spraying height and speed on droplet penetration and deposition uniformity on the rice. Xiao et al. [19] reported that the CPUAS had a poor droplet coverage rate, droplet density, and deposition uniformity, leading to a slightly lower control effect on pepper comparing with the electric air-pressure knapsack sprayers. Lou et al. [20] reported the good control effects of aphids and spider mites of 63.7% and 61.3% when the FH were 1.5 and 2 m above cotton. Chen et al. [21] and Wang et al. [22] reported that when the FS was 5 m/s and the FH was 1.5 m, the maximum deposition volume could be obtained in the lower layer of rice canopy. Wang et al. [23] suggested coarse droplet size and higher spray volume on wheat pests and diseases for better control effects with CPUAS. Chen et al. [24] suggested small particle sizes droplets to improve the control effect of rice plant hoppers for CPUAS.
The above studies focus on the selection of CPUAS application parameters, and the results have proved the feasibility of CPUAS for insect pests and diseases control of crops and promoted the popularization and application of CPUAS [7,16,25]. However, one factor is easy to be overlooked during the CPUAS application. As a kind of agricultural crop protection machinery with the inevitable trend for the intelligent development of green agriculture [26,27], its application should fully combine with the agronomy, so it is critical to analyze and evaluate the application with agronomies for achieving ideal and expected control effects. The occurrence time and the position on the plant of the insect pests and diseases as well as the plant height and density should be considered into the actual pesticide application. As a result of different insect pests and diseases occurrence laws, the pesticide liquid droplet deposition should be targeted to achieve better control effects. Meanwhile, the operation parameters should be changed with different plant physiological characteristics in the field, correspondingly affecting the droplet deposition characteristics. This study aims to investigate the effects of the CPUAS operation parameters on the ESW and droplet deposition characteristics on the wheat canopy. Based on the investigations, the optimized parameters have been chosen to control the aphids, powdery mildew, and head blight combined with the occurrence laws and the wheat plant characteristics. The control effects have been evaluated. The studies would provide some references for the scientific application of the CPUAS.

2. Materials and Methods

2.1. Experimental Site, Wheat Characteristics, and Weather Conditions

The experiment site was located in the wheat field of Sihong agricultural demonstration base (33.3636° N, 118.2599° E) in Suqian City, Jiangsu Province, China. The trials were out carried on 11 March, 14 April, and 16 May 2019, with the crop at the Turning green, Heading, and Blooming stages, respectively, and in correspondence with the local timings for controlling wheat aphids, powdery mildew, and head blight
The wheat variety is Qianmai 33, and it was sowed in the field (60 m × 120 m) with 225 kg/ha seed density. The leaf area index was measured by the canopy analyzer LAI-2200C (LI-COR company, Lincoln, NE, USA). The main characters of the wheat and the weather conditions are shown in Table 1.

2.2. CPUAS and Experimental Materials

The tested CPUAS of CE20 (Wuxi Hanhe Aviation Technology Co., Ltd. Wuxi, China, as shown in Figure 1) is an electric single-rotor CPUAS with real-time kinematic Global Positioning System (RTK-GPS). It is fully autonomous flying with the routes planned by the mobile app, and the FS, FH, and the spraying volume can be also set on the mobile app with the accuracy controlled within 0.30 m, 0.30 m/s, and 0.05 L/min, respectively. The main technical parameters are shown in Table 2.
Water-sensitive paper (WSP) was used to collect the droplets during the experiments. High-concentration insecticide and fungicide were used for aerial spraying to control aphids, powdery mildew, and head blight.

2.3. Experimental Treatments

2.3.1. Experiment Design

According to the actual applications, the FS was set three levels as 3, 4, and 5 m/s, the FH was set three levels as 1.5, 2.0, and 2.5 m, and the spraying volume was set as 2.0 L/min during the experiments. The CE20 flew from the acceleration area to the stop spraying area along the center line of the sampling area with autonomous mode [28]. A total of nine treatments are shown in Table 3 with the treatment parameters.

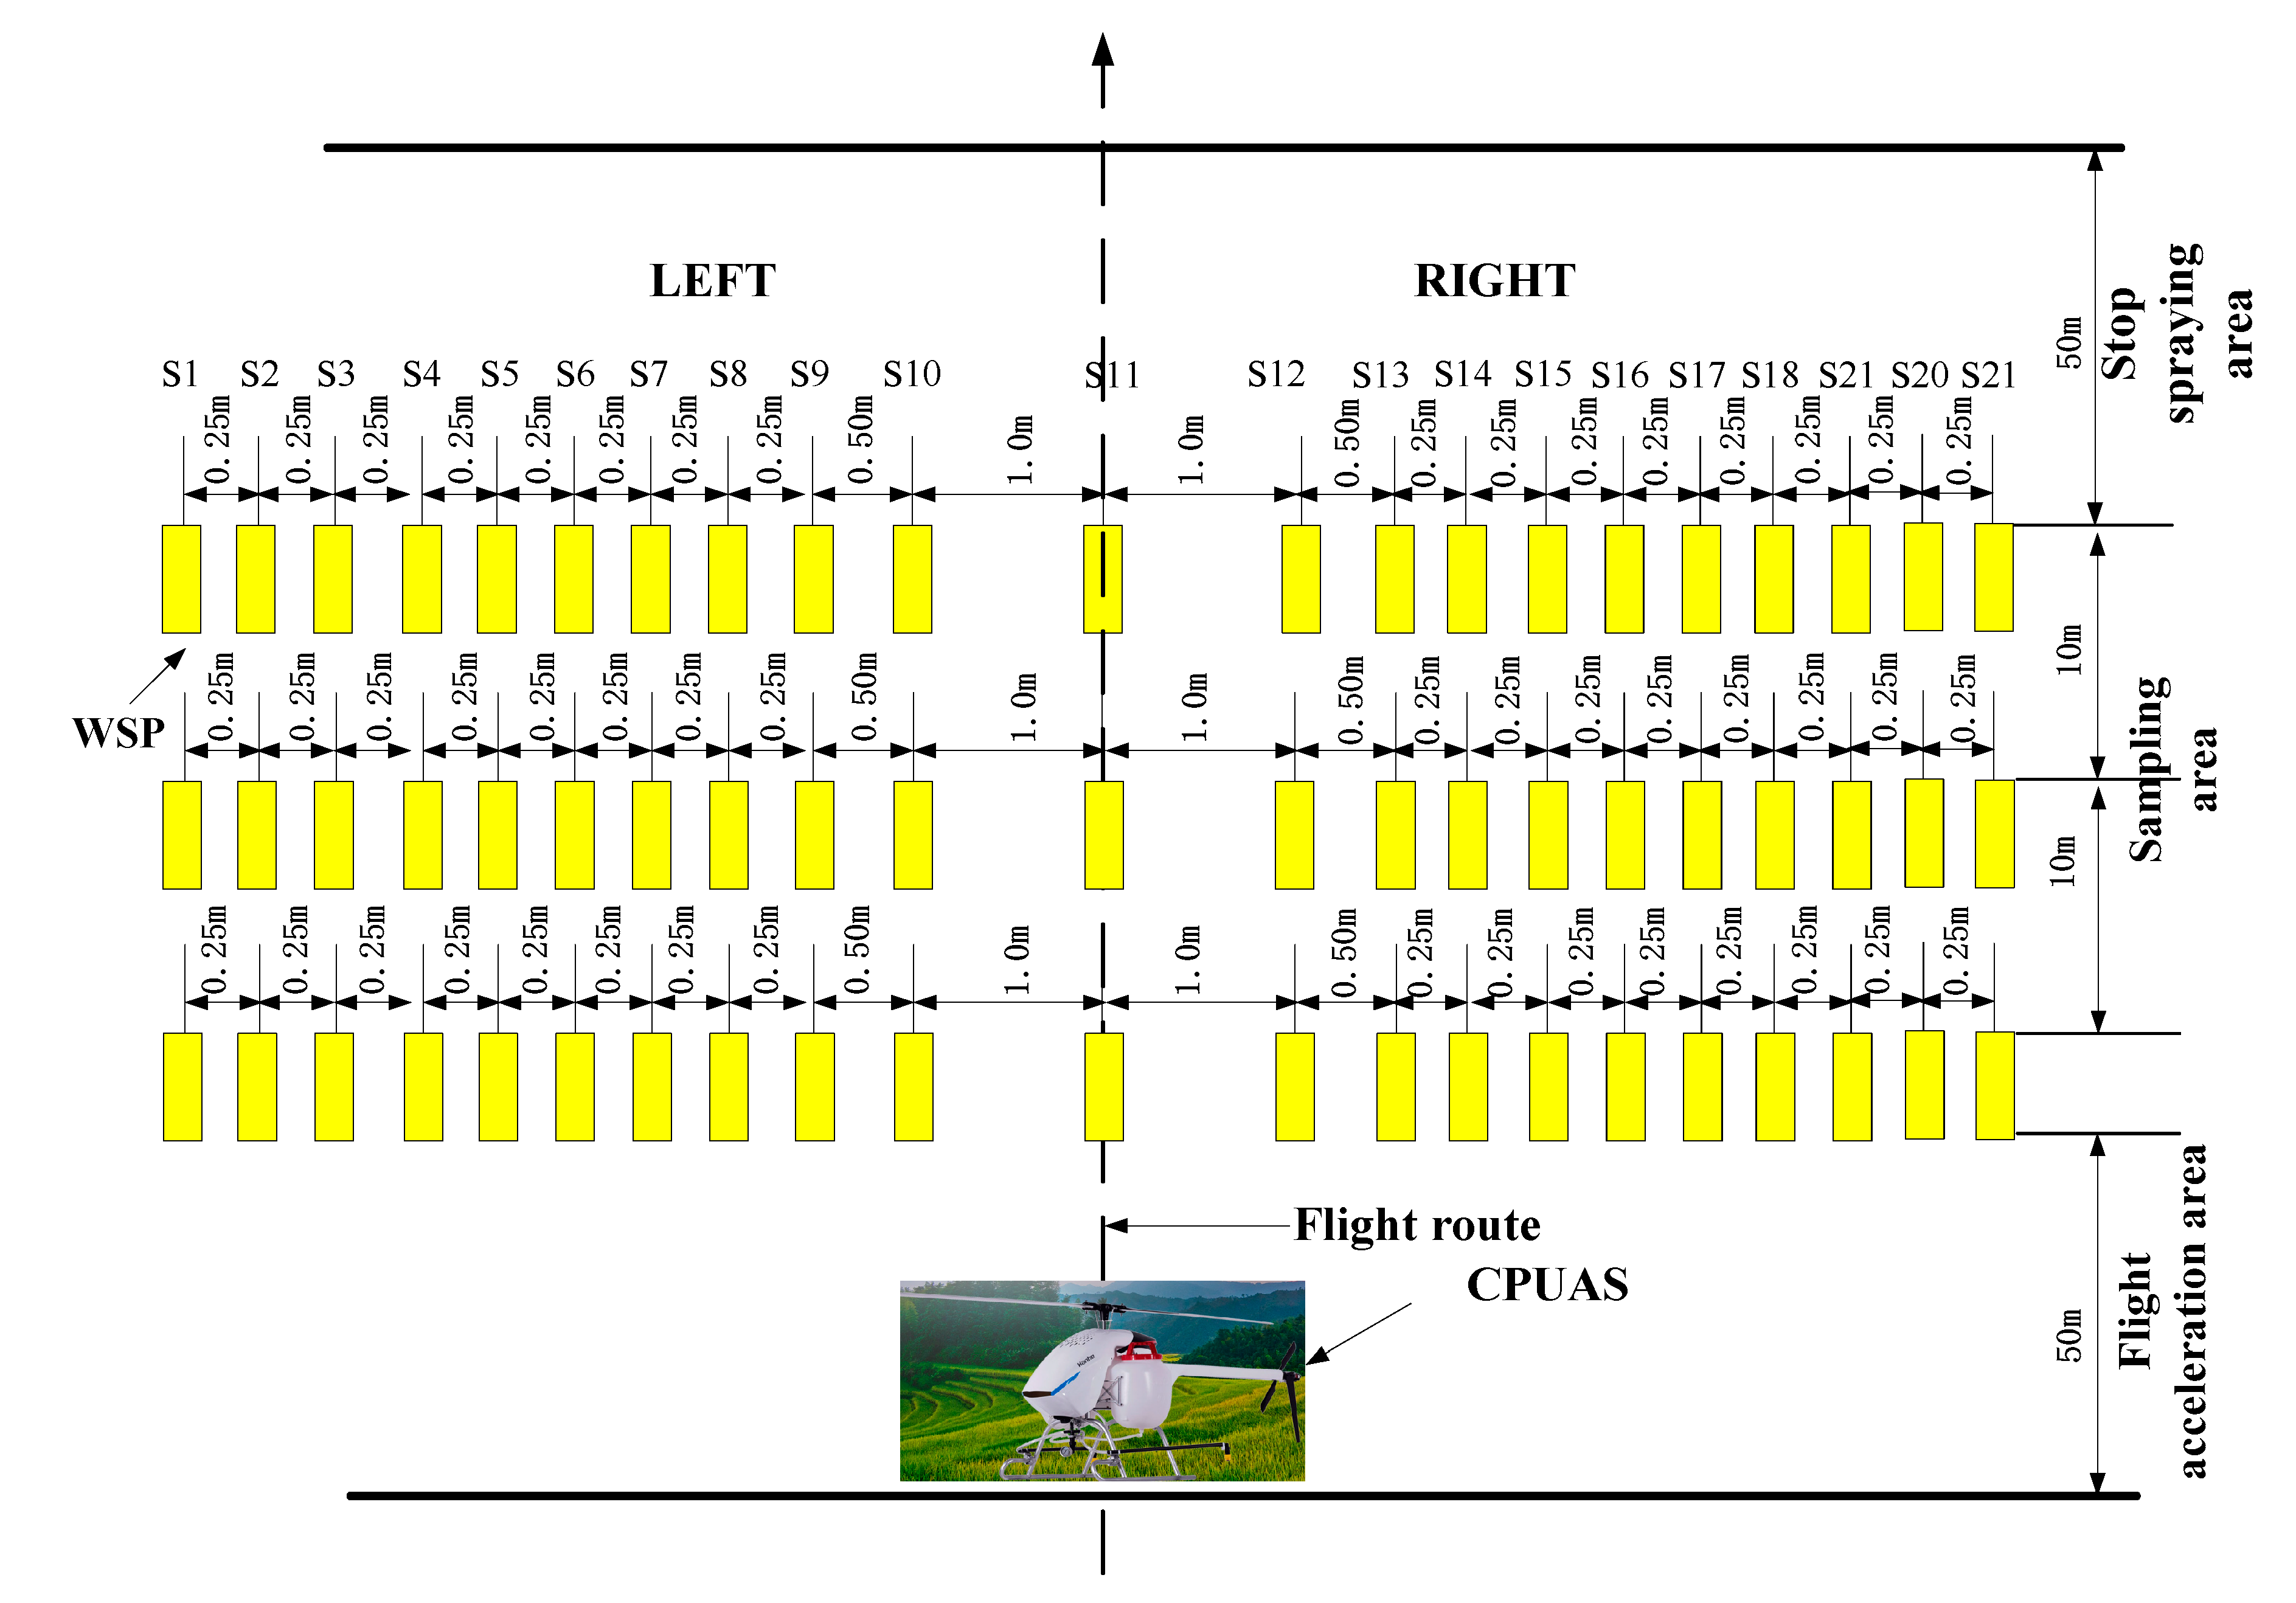
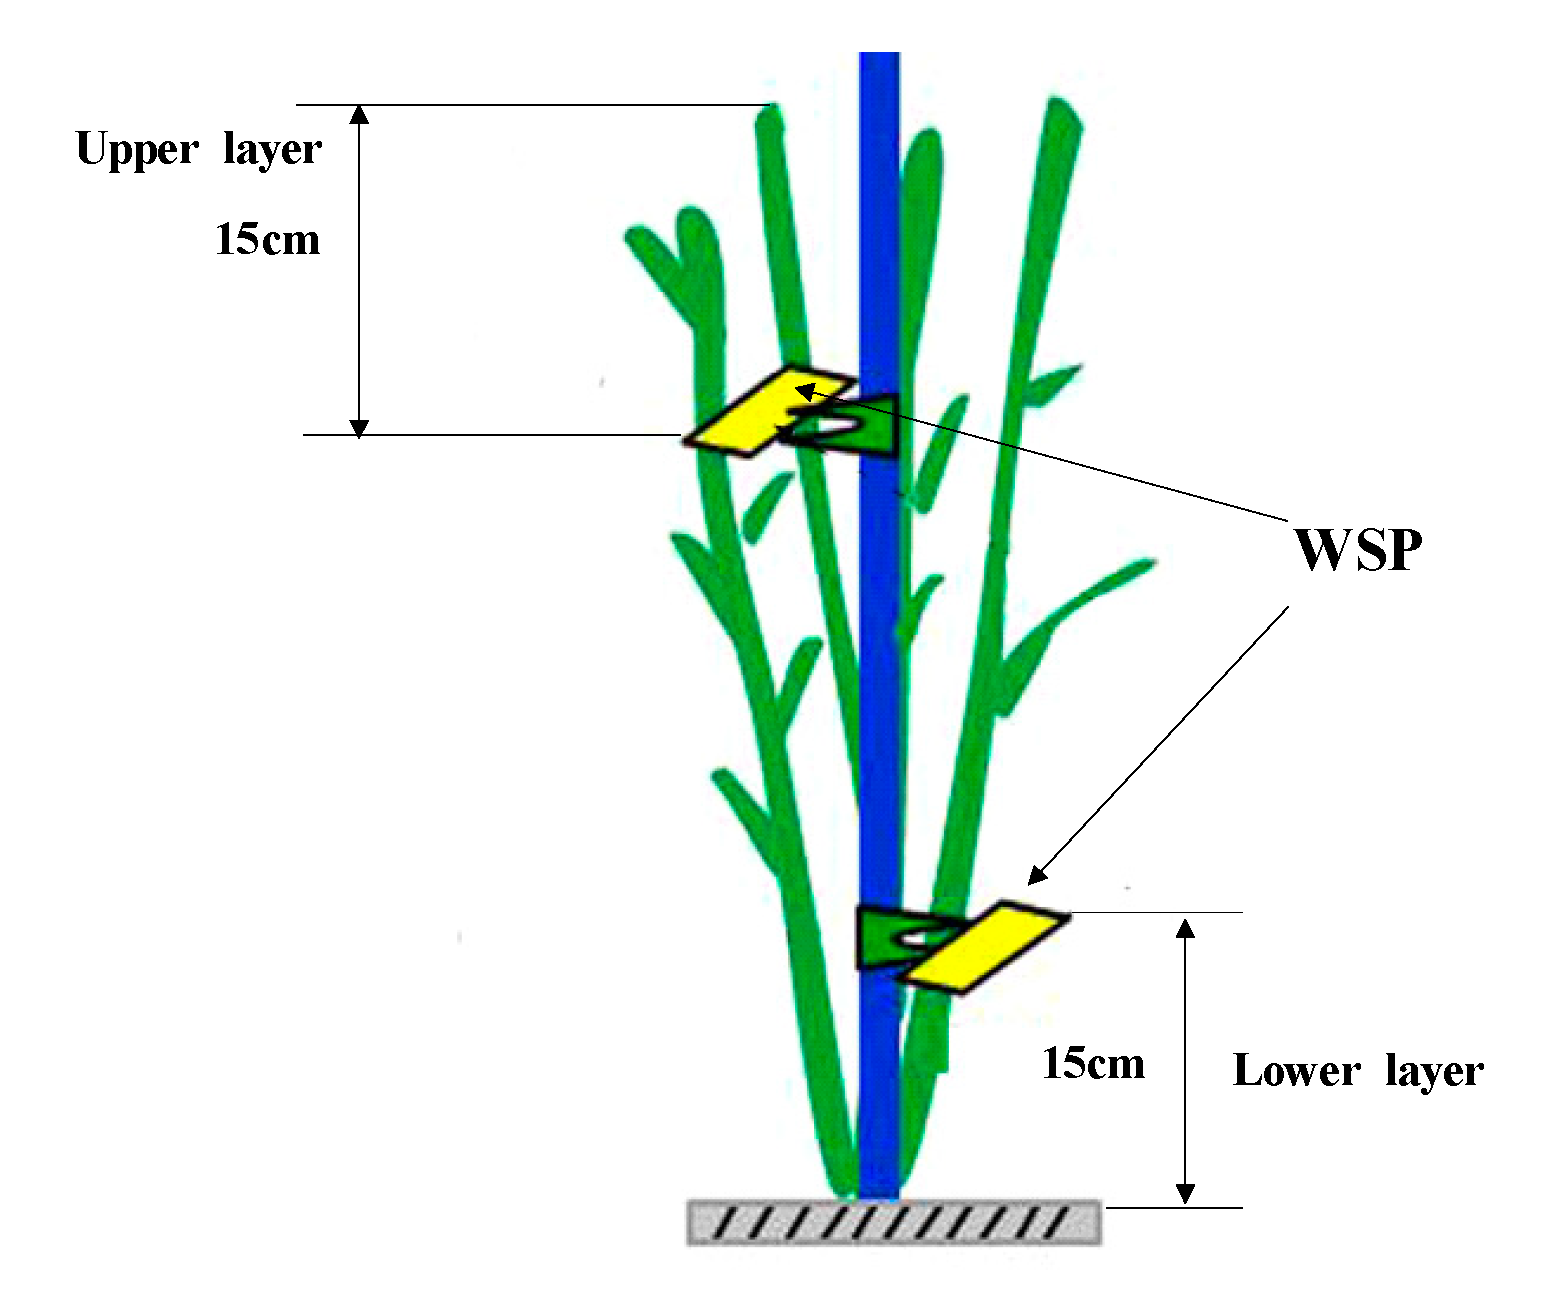
2.3.2. Sampling Point Arrangements

The whole experimental area was divided into flight acceleration area, sampling area, and stop spraying area. The flight acceleration area and the stop spraying area were both 50 m long in order to ensure that the CPUAS could accelerate to a predetermined speed and stop in a timely manner. The sampling points were arranged along the vertical direction of the CPUAS flight route symmetrically with three repetitions with a 10 m interval. Twenty-one sampling points were arranged symmetrically on both sides of the flight route for each repetition line. The sampling points were labeled S1 to S21 from left to right; the central one was S11. The interval distance between sampling points S10 and S11 was 1.0 m, while that between sampling points S9 and S10 was 0.50 m, and that between sampling points S9 and S1 was 0.25 m. The right and left sampling points are distributed symmetrically. The layout of sampling is shown in Figure 2.
The WSPs were fixed horizontally on the upper (the Turning green stage) or on the upper and lower layers (Heading and Blooming stages) at each sampling point without overlapping as Figure 3 shows, and there was a 15 cm vertical distance both to the top canopy of the wheat and to the ground. The bandwidths were measured by collecting droplets from the upper layer WSPs during the Turning stage, and the penetration rates were calculated by the collecting droplets from both the upper and layer WSPs during the Blooming stage.
The control check (CK) area was reserved for checking the control effect of insect pests and diseases.

2.4. Evaluation Method of ESW and Droplet Deposition

The WSPs were scanned to 600 dpi digital JPG images after each test in the lab and analyzed by the DepositScan (DS) [29]. The droplet deposition density, uniformity, and the DPR were analyzed further based on the droplet deposition JPG images.
According to the standard ‘Technical specification of quality evaluation for crop protection UAS’ (NY/T3213-2018) [30], the first sampling point of droplet quantity not less than 15 droplets per square centimeters (cm2) was judged as the boundary of the ESW each line. In this paper, the average bandwidth value analyzed of the three lines was the ESW of each flight for accuracy.
The droplet deposition uniformity was evaluated with the coefficient of variation (CV, %) of coverage rates [31] on the WSPs calculated from the DS within the ESW. The CV calculation Equation [18] is as follows.
C V = S X ¯ × 100 %
S = i = 1 n ( X i X ¯ ) 2 ( n 1 )
where S is the standard deviation, X i is the number of droplets per unit zone in the sampling card, X ¯   is the average number of droplets per unit zone in the sampling card, and n is the total number of sampling cards in reach repetition.
The droplet penetrability into the canopies was expressed by (DPR, %) and calculated by the follow formula.
D P R = y l y u × 100 %
where   y l , y u are the coverage rates of the lower layer and the upper WSP of each sampling point within the ESW range, respectively.
Analysis of variance (ANOVA) was conducted for investigating the significances of FS and FH on the ESW, DPR, and droplet deposition uniformity (DDU), taking the FS and FH as independent variables, and the ESW, DPR, and DDU as dependent variables [8,20].

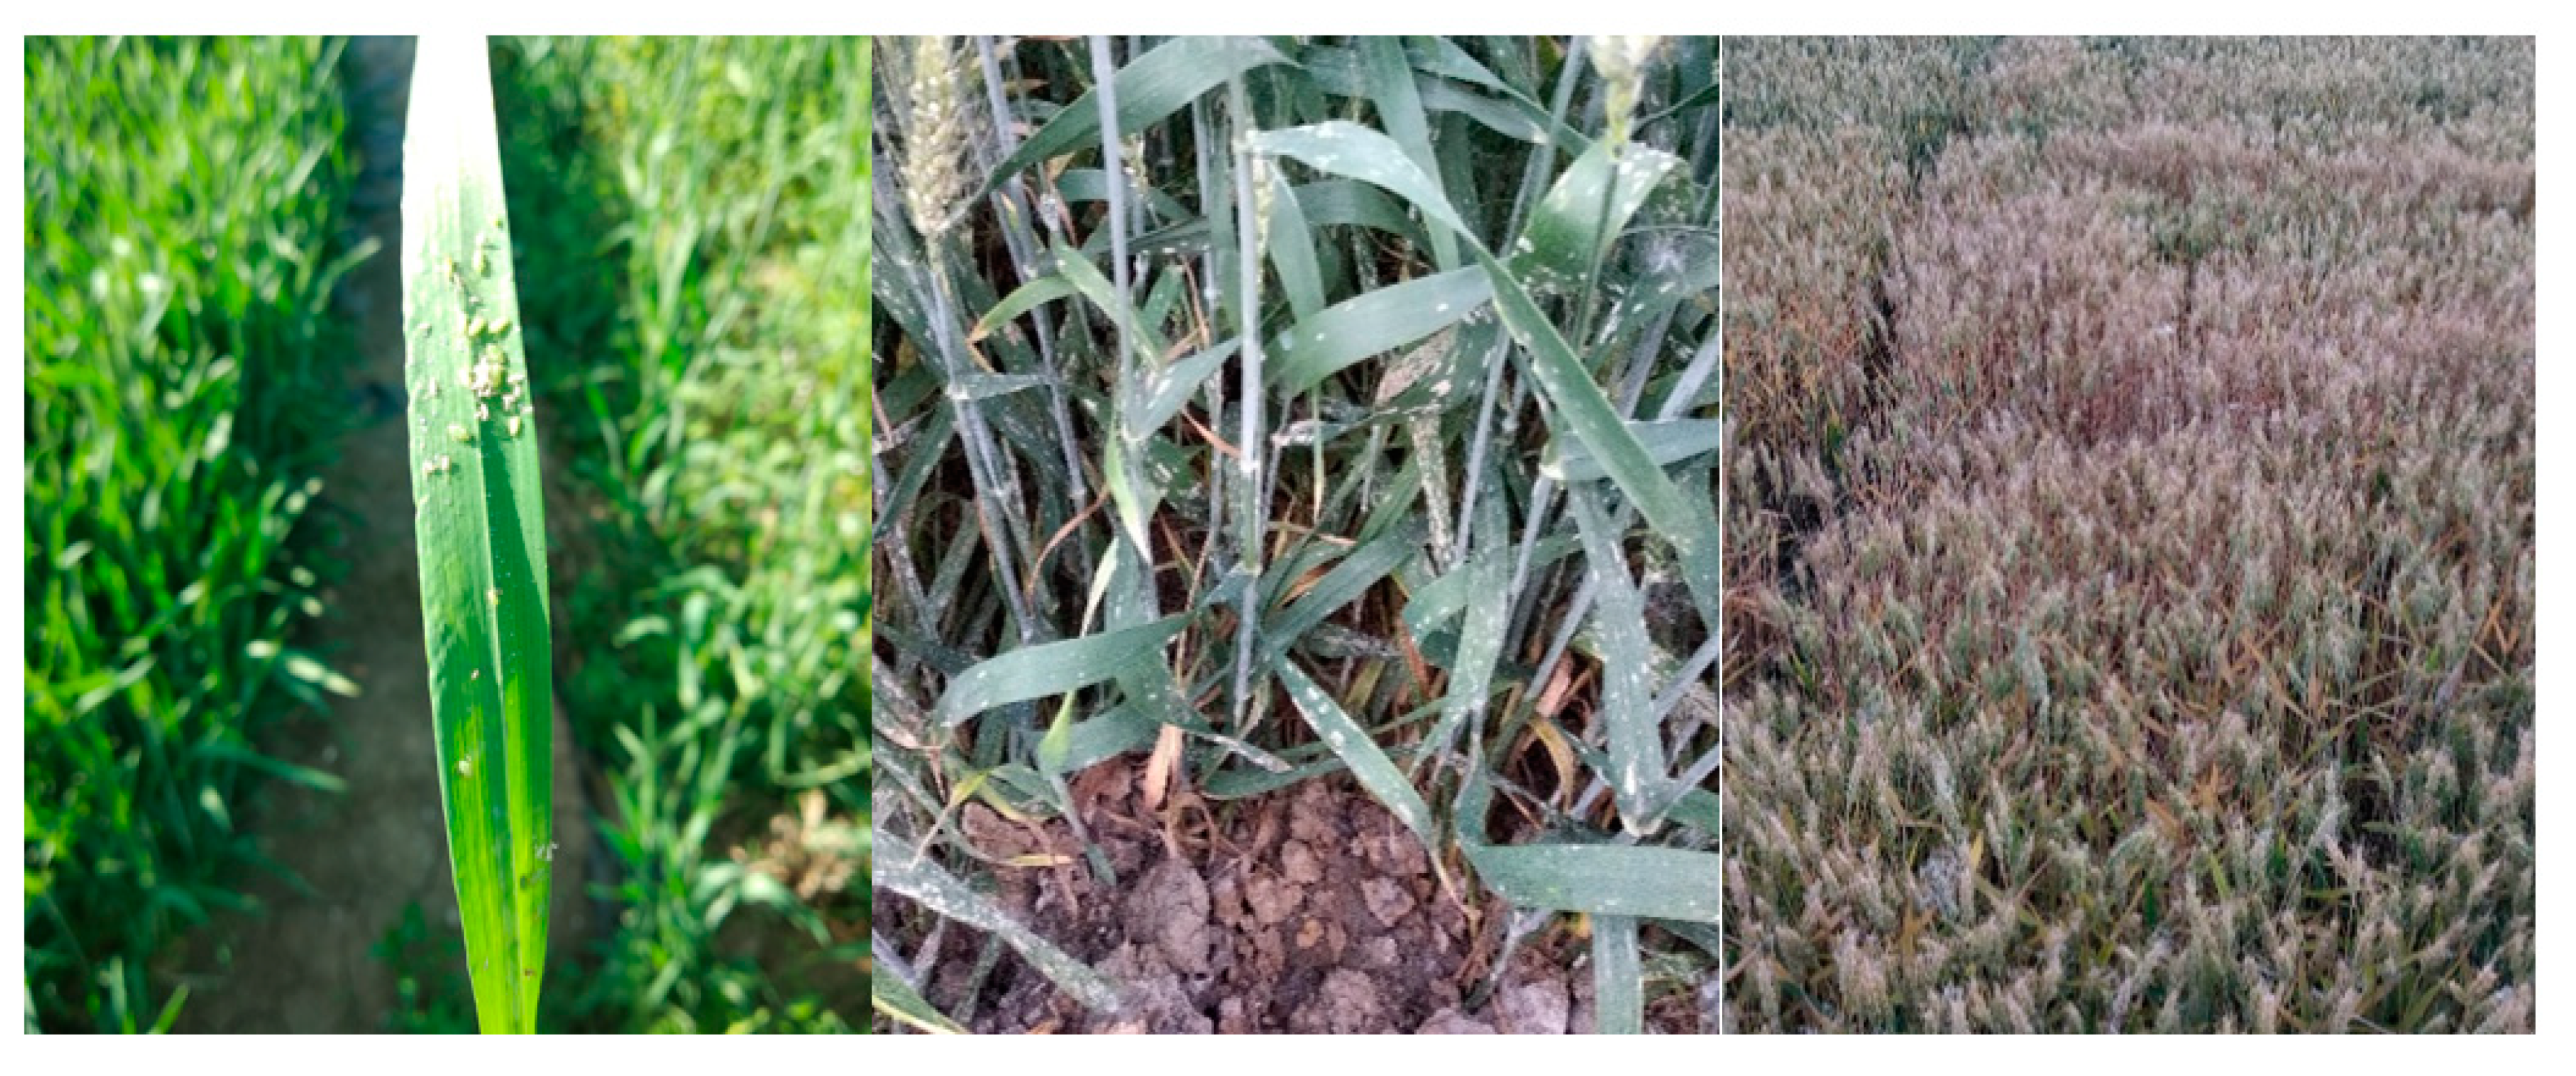
2.5. Control Effect Survey of Aphids, Powdery Mildew, and Head Blight

The pesticides recommended by the local crop protection station were used to control wheat diseases and insect pests. The information of aerial spraying date, major pest and disease, pesticides, and dosage, is shown in Table 4.
The control effect survey of aphids was evaluated by the live aphid quantity before and after application according to the standard ‘Rules for the investigation and forecast of wheat aphids’ [32]. The assessment was made by sampling five locations for wheat aphids. The aphid quantity of 10 plots of wheat per location was investigated before spraying, and the wheat plants were labeled. One day, 3 days, and 7 days after application, the quantity of live aphids in the same location and plant was investigated again [33,34]. The control effect of aphids was calculated according to Equations (4) and (5). The control effect of powdery mildew was evaluated by the disease index (DI) changing according to the standard ‘Rules for the investigation and forecast of wheat powdery mildew’ [35]. The wheat plant DIs of 9 plots were investigated randomly, and the wheat plants were labeled. Seven days and 14 days after application, the DIs of the same plants were investigated again [36]. The control effect of powdery mildew was calculated according to Equations (6) and (7). The control effect of head blight was evaluated by the DI changing according to the standard ‘Rules for monitoring and forecast of the wheat head blight’ [37]. The same as the powdery mildew DIs investigations, the plant DIs of head blight were investigated again [38]. The control effect of head blight was calculated according to Equations (8) and (9). The wheat plants of the CK area were used as the reference during the evaluations.
η d = n b n a n b × 100 %
C E y = η d T η d C K 1 η d C K × 100 %
D I w = F × ( d i × l i ) L × 100
C E w = D I w C K D I w T D I w C K × 100 %
D I c = ( h i × i ) H × 4 × 100
C E c = D I c C K D I c T D I c C K × 100 %
where η d is the aphid dropping rate, n b is the quantity of live aphids per hundred plants of wheat before spraying application, n a is the quantity of live aphids per hundred plants of wheat after spraying application,   C E y   is the aphid control effect, η dT   is the aphid dropping rate in the treatment area, η d C K is the aphid dropping rate in the CK area; D I w is the disease index of powdery mildew, F is the diseased leaf rate of powdery mildew, d i is the powdery mildew severity levels, l i is the number of each diseased leaves of powdery mildew, L is the total number of diseased leaves in the powdery mildew survey, C E w is the powdery mildew control effect, D I w C K is the disease index of the powdery mildew in the CK area, D I w T is the disease index of powdery mildew in the treated area; D I c is the disease index of head blight, h i is the number of each diseased ear of head blight, i is the head blight severity levels, H is the total number of diseased ears in the head blight survey, C E c is the head blight control effect, D I c C K   is the disease index of the head blight in the CK area, D I c T is the disease index of the head blight in the treated area.

3. Results

3.1. Test Data Statistics

The average bandwidth of each treatment was as the ESW. The DDUs (coefficient of variation (CV), %) were calculated according to Equation (1). The test result data are shown in the Table 5.
From Table 5, it could be seen that the ESW of CE20 was not consistent and decreased as the FS increased overall, the ESW were among 2.51 to 5.78 m, and the maximum value was 5.78 m (T2). The CV represents the DDU, which means the smaller the CV, the more uniform the distribution of the droplet deposition. The CVs were all not exceeding 35%, of which the minimum one was 23.30% (T1 and T4) and the maximum one was 34.40% (T6), which meant good deposition uniformity within the ESWs.

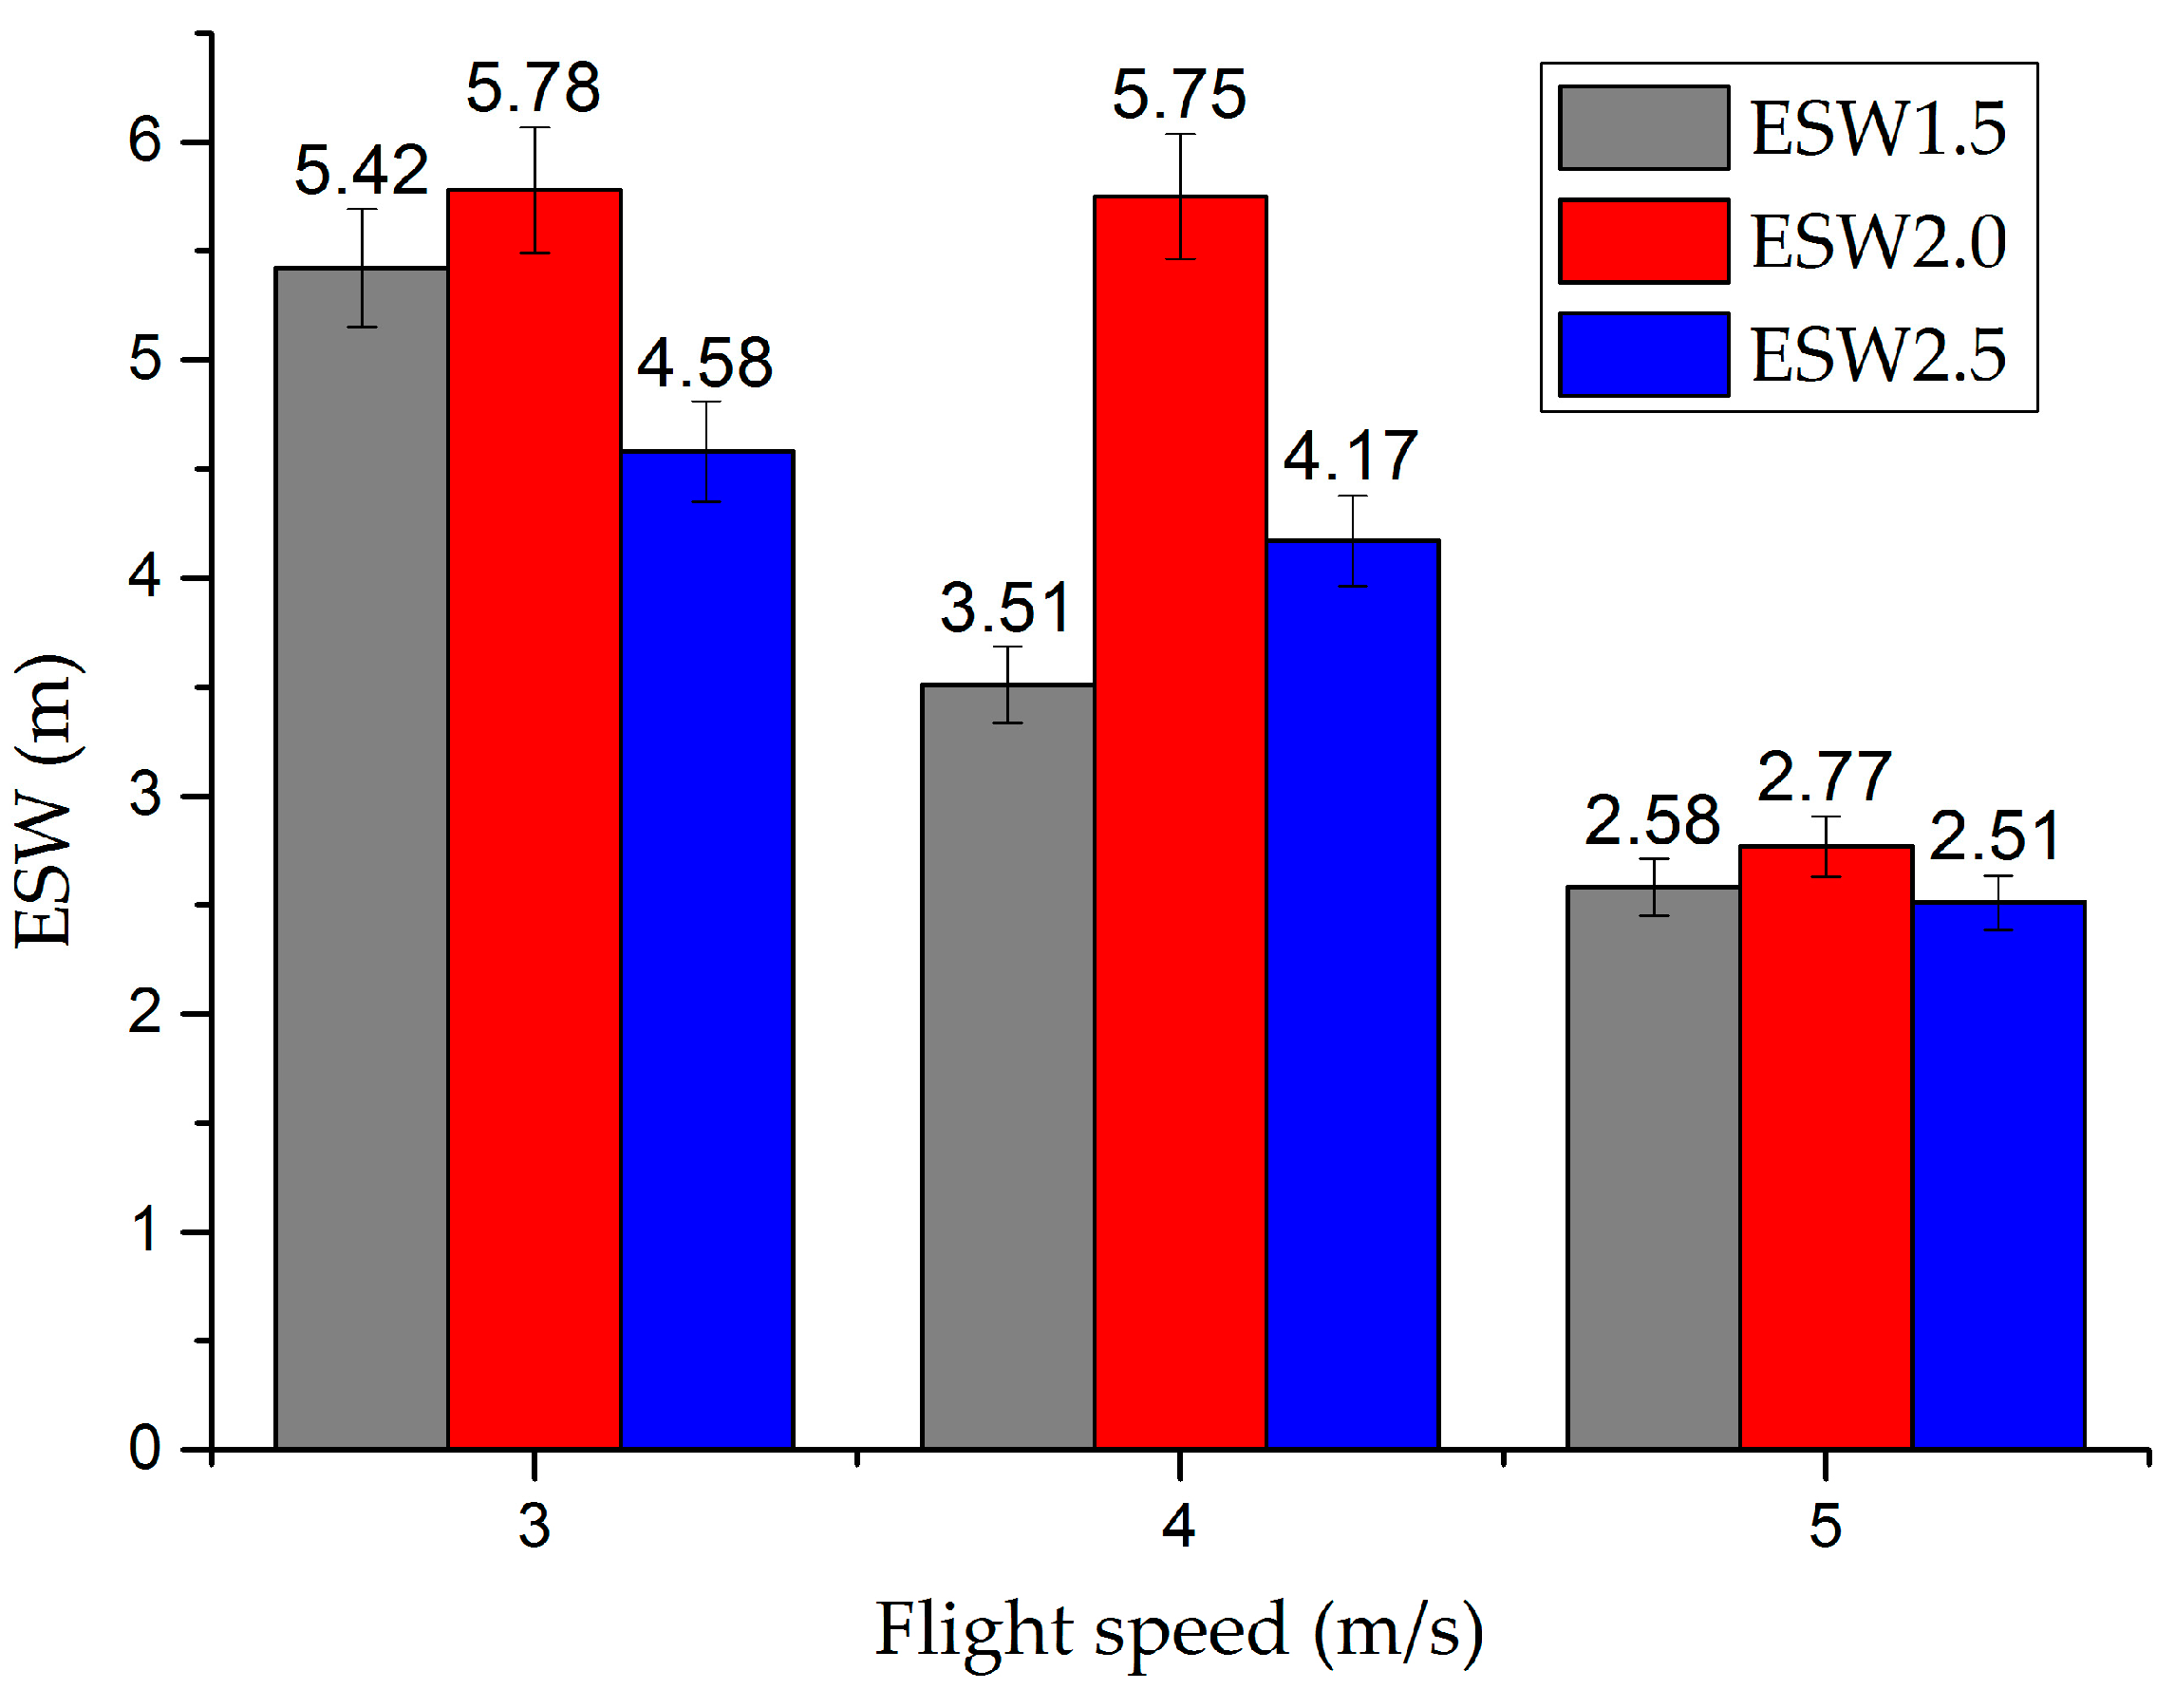
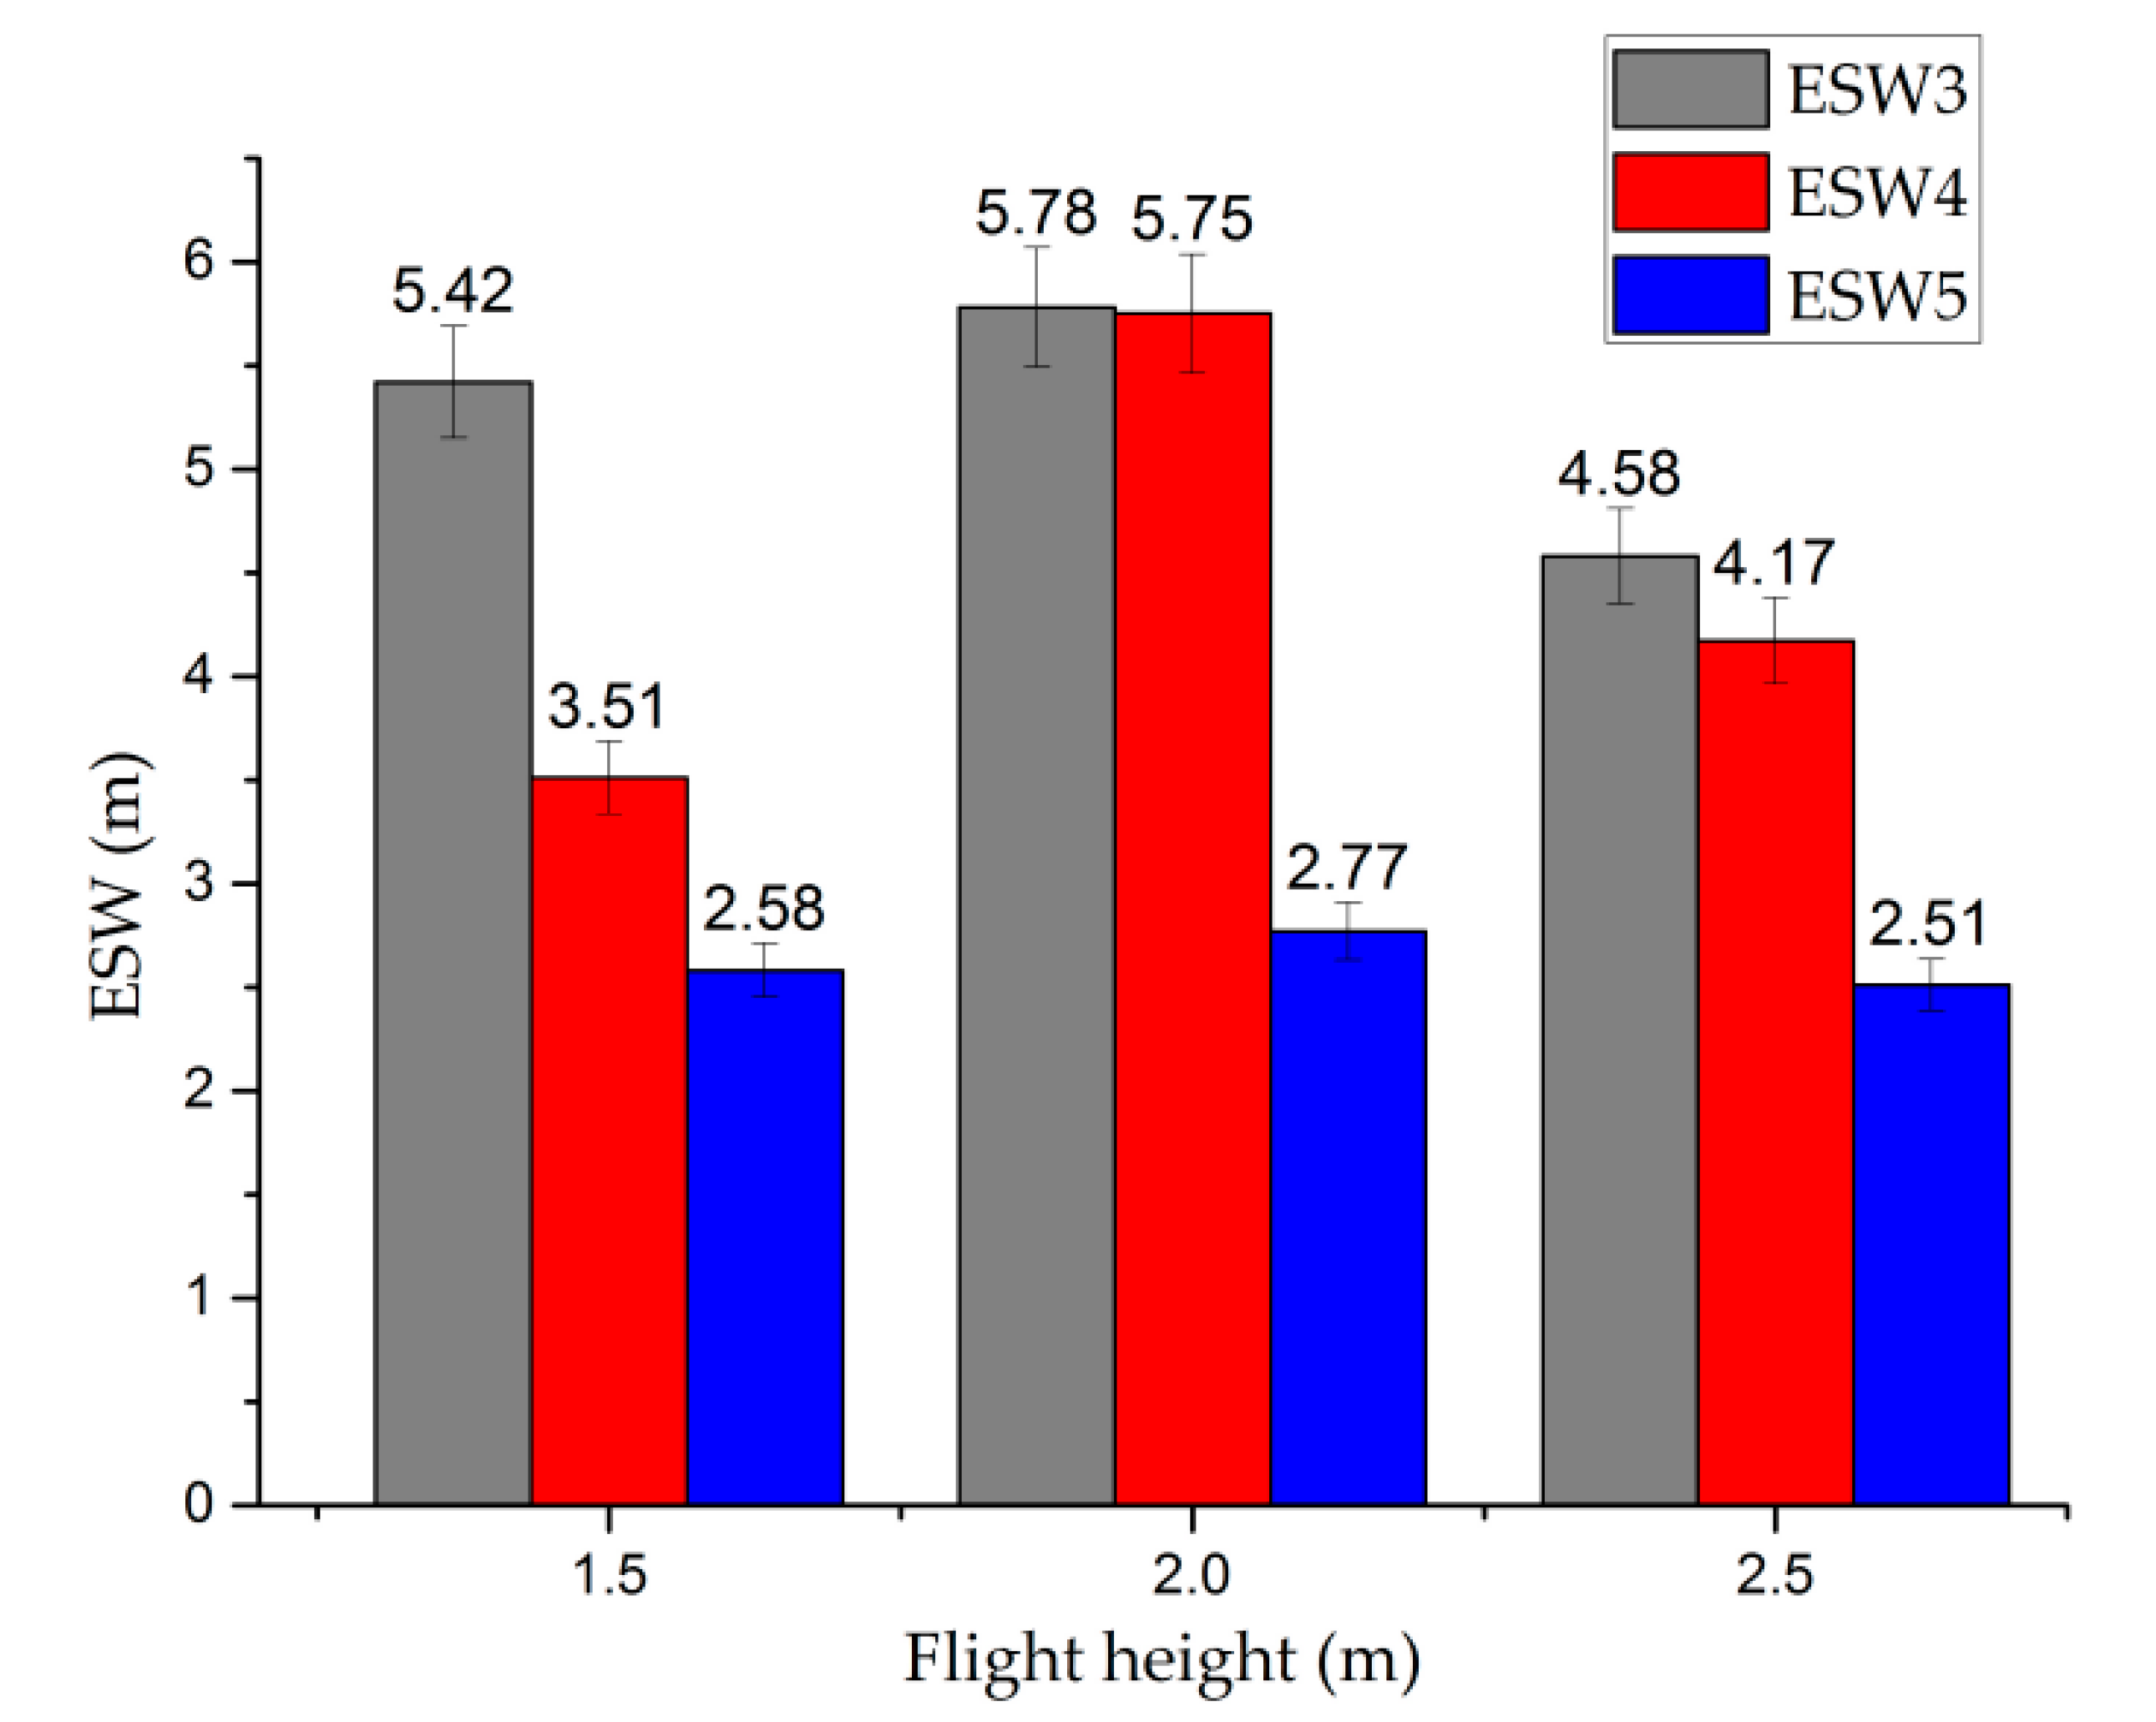
3.2. The ESW Analyses

The ESW increased first and then decreased with the same FS under the FH of 3, 4, and 5 m, respectively (Figure 4). This change trend was most significant at the FS of 4.0 m/s, the ESW increase rate was 63.82% comparing T4 (ESW = 3.51 m) with T5 (ESW = 5.75 m), and the ESW decrease rate was 27.48% comparing T5 (ESW = 5.75 m) with T6 (ESW = 4.17 m). From Figure 4, the ESWs under an FS of 3.0 m/s were larger than those of same FH at 4.0 or 5.0 m/s. The ESW showed a monotonous downward trend with the same FH (Figure 5) obviously under the FS of 1.5, 2.0, and 2.5 m/s, respectively. This trend was obvious at the FH of 1.5 and 2.5 m, and the ESW maximum decrease rate was 52.40% comparing T1 (ESW = 5.42 m) with T7 (ESW = 2.58 m). From Figure 5, the ESWs under an FH of 2.0 m were larger than those of the same FS at 1.5 or 2.5 m. Therefore, it could be considered that the FS and the FH affected the ESWs. Comparing Figure 4 with Figure 5, it could be seen that FS had a larger effect on EWS than FH.
The two-way ANOVA was conducted to verify the significance effect of FS and FH on ESW at the p-value = 0.05 level, and the results are shown in Table 6. The FS has a highly significant impact on ESW (p = 0.0033 < 0.01), the FH has no significant impact on the ESW (p = 0.136 > 0.05), and the interaction between FS and FH also has no significant impact on ESW (p = 0.906 > 0.05).

3.3. The Deposition Uniformity Analyses

The two-way ANOVA results (Table 7) indicated that the FH as well as the interaction between FS and FH have significant impacts on the DDU. This law is also shown in Figure 6. The CV of droplet deposition tended to became larger with the increase of FH, which meant that the DDU becomes worse.
The droplet deposition uniformity was an important indicator to evaluate the aerial spraying quality. The average CV of the droplet deposition was 27.35% for the nine treatments, the maximum one was 34.4% (T6), and the minimum one was 23.3% (T1, T4). Figure 6 showed the droplet deposition uniformity of each treatment by CVs.

3.4. The DPR Analyses

The results showed that the DPRs of the nine treatments had no obvious correlation with the changes of the FS or FH. The larger the ESW, the higher the spraying efficiency, so in this study, the DPRs under several treatments (T1, T2, T5) with larger ESW were calculated according to Equation (3), which were 60.1%, 54.6%, and 52.7%, respectively.

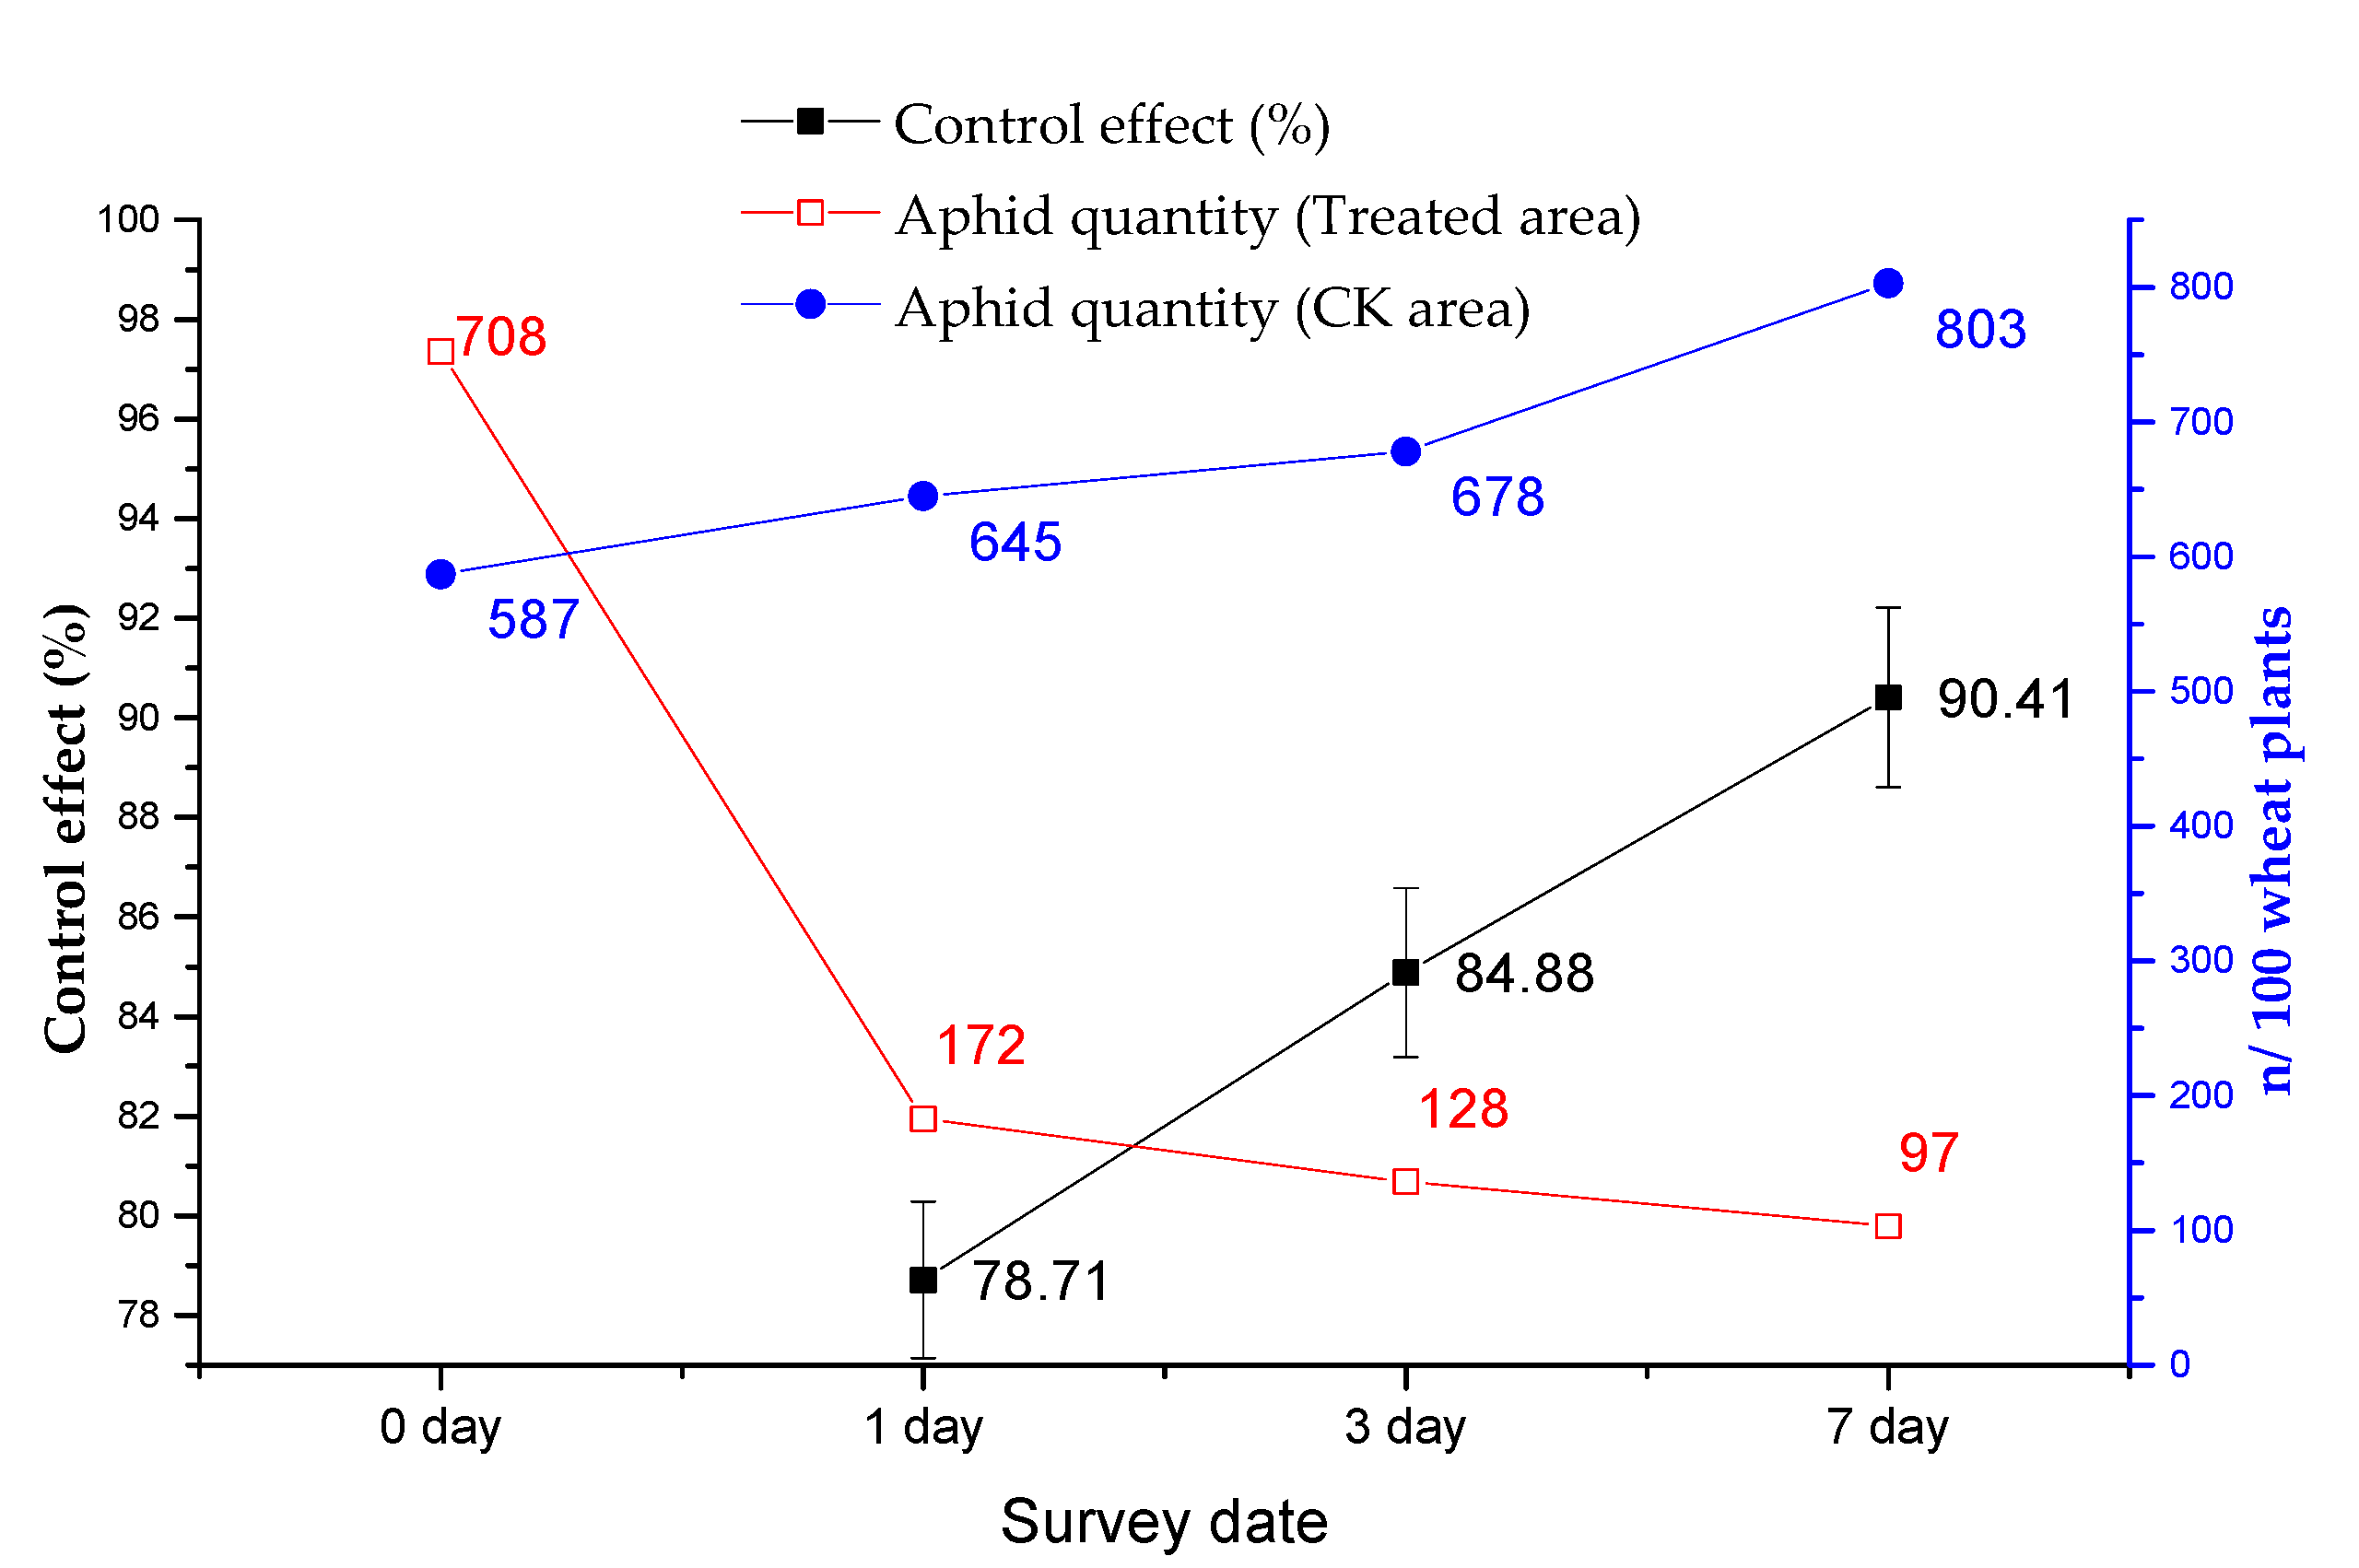
3.5. The Control Effect Analysis

The aerial spraying efficiency was given priority with T5 operation parameters to control the aphids, the T1 operation parameters were selected to control the powdery mildew and head blight with larger ESW and good DPR. The wheat plants infected aphids, powdery mildew and head blight were shown in Figure 7.
The control effect of aphids is shown in Figure 8. The quantity of aphids per hundred plants of wheat declined to 172 on the first day, 128 on the third day, and 97 on the seventh day in the treated area after application; the decline rate was obvious, while the quantity rose to 645, 678, and 803 from 587 on the corresponding dates in the CK area. The aphid control effect was 78.71% on the first day, 84.88% on the third day, and 90.41% on the seventh day, respectively.
The control effects of powdery mildew and head blight are shown in Table 8. For the powdery mildew, the control effect was 77.17 ± 1.15% on the seventh day and 82.83 ± 2.98% on the fourteenth day after application, and for the head blight, the control effect was 88.32 ± 1.50% on the twentieth day after application.

4. Discussion

As a new type of crop protection machinery, some details of the CPUAS application need to be clarified. The ESW, DDU, and DPR are the most important indicators for evaluating qualities of the spraying by CPUAS, and the operation parameters FH and FS, which can be controlled manually, affected ESW, DDU, and DPR. In this article, the results showed that the ESW of CE20 was not consistent and changed as the FS and FH changed, which were consistent with the existing findings [16,17]. The FS had a highly significant impact (p = 0.0033 < 0.01) on the ESW, while the FH had no significant impact (p = 0.136 > 0.05) on it, and the ESW value was negatively correlated as the FS varies, which is consistent with the conclusions of Zhang et al. [17]. Through comparison from the treatments, it could be seen that the spraying DDU of CE20 was very good with CVs among 23.3% to 34.4%. The two-way ANOVA results showed that the FH (p = 0.019 < 0.05) and the interaction between FS and FH (p = 0.032 < 0.05) both had significant impacts on the DDU, and the DDU could be improved by appropriately reducing FH and FS. This conclusion was slightly different with some existing conclusions. According to Qiu et al. [16], both the FS and FH had highly significant impacts on the DDU, and the interaction between FS and FH had significant impacts on the DDU. The reason may be the different type of CPUAS and the spraying volume, which needed further research. For the DPR, although results showed that it had no obvious correlation with the changes of the FS or FH, the slower the FS, the lower the FH, and the larger the spraying volume, the more droplets deposited in the lower layer of the crop canopy according to Chen et al. [21] and Wang et al. [22], so a larger spraying volume was suggested if permitted. Based on the test results, optimized parameters of T5 and T1 were selected for aerial spraying operations to control wheat aphids, powdery mildew, and head blight. The control effects could satisfy the actual application. The existing research [23] showed that better control of wheat diseases and insect pests was achieved when using a coarse droplet size and higher spray volume. The control effect of powdery mildew was lower than that of head blight, although the height and canopy density of the wheat during the Heading stage were both lower than those during the Blooming stage (see Table 1); the reason may be related to disease characteristics. The powdery mildew mainly occurs in the middle and lower layers of the wheat plants, while the head blight occurs mainly in the upper layers (ears), so the pesticide droplets would be more likely to contact the leaves infected with head blight.

5. Conclusions

The research results in this study show that the ESW, DDU, DPR, and even the spraying efficiency are closely related to the operation parameters. The above results reflected that with the aerial spraying parameters optimized, the obtained control effects of aphids, powdery mildew, and head blight could meet the actual requirements in general. Therefore, it is considered that the combined operation parameters used in actual application is inappropriate. It should be combined with the agronomic requirements to select the appropriate parameters based on the crop types, the growth period, the pests and diseases characteristics, and even the environmental conditions to achieve good prevention and control effects.
For wheat, stripe rust, powdery mildew, and head blight are the major diseases that are harmful to the wheat yield [3,4,5,39,40], and different requirements are required in chemical crop protection applications, respectively. The stripe rust would occur from the wheat Tillering stage to the Filling stage [40], the powdery mildew mainly occurs between the Heading stage and the Milky stage of wheat [40], and the head blight mainly occurs from the Heading stage to the Filling stage [41]. For the disease occurrence parts, the stripe rust occurs in the middle and lower parts of the wheat, the powdery mildew occurs and develops from the bottom to the top layer, and the head blight is concentrated on the upper layer (ears) of wheat. According to the results of this study, when controlling the head blight, priority should be given to increase the ESW, and the FS is appropriately reduced, taking into account the aerial spraying efficiency. When controlling the powdery mildew, the penetration of droplets is an effective consideration, and the FH should be reduced possibly. When controlling the stripe rust, the ESW and the penetration should be both considered for the parameter optimization combined with the growth period of wheat.
In this study, the CPUAS of CE20 was tested, and the conclusions above were only applicable to it. Different type CPUASs may have different spraying and droplet deposition characteristics, such as single-rotor and multi-rotor CPUAS; thus, systematic experiments should be carried out to determine the optimal parameter combinations before application. Future research should be focused on the relationship among the parameters [8,16,17], the canopy structure [42], and the wind field [43,44] on the droplet deposition effect, and establish the correlation of them to achieve the best management practice and control effect.

Author Contributions

S.Z., B.Q., and X.X. conceived the idea of the experiments. S.Z., T.S., W.G., F.Z., and X.S. performed the experiments and analyzed the data. S.Z., B.Q., and X.X. wrote and revised the paper. All authors have read and agreed to the published version of the manuscript.

Funding

This research was funded by the National Key Research and Development Program of China (Grant No. 2017YFD0701000), the National Natural Science Foundation of China (Grant No.31701327), the earmarked fund for China Agriculture Research System (CARS-12), the Agricultural Science and Technology Innovation Project of the Chinese Academy of Agricultural Sciences, Crop Protection Machinery Team (Grant No. CAAS-ASTIP-CPMT), the Science and Technology Development Plan of Suzhou, Jiangsu Province (Grant No. SNG2020042), the Jiangsu Science and Technology Development Plan (BE2019305).

Institutional Review Board Statement

Not applicable.

Informed Consent Statement

Not applicable.

Data Availability Statement

The data used to support the findings of this study are available from the first author or the corresponding author upon request.

Acknowledgments

The authors are very grateful to Sihong agricultural demonstration base for proving the test field and the pesticides, and to the help of Sijun Yang and Jilin Du during the tests.

Conflicts of Interest

The authors declare no conflict of interest.

References

  1. Li, Q.; Fan, J.; Sun, J.; Zhang, Y.; Chen, J. Anti-plant defense response strategies mediated by the secondary symbiont hamiltonella defensa in the wheat aphid sitobion miscanthi. Front. Microbiol. 2019, 10, 2419. [Google Scholar] [CrossRef] [Green Version]
  2. Li, Y.; Li, Z.; Zhao, L.; Hu, Z.; Zhao, H. Development of a wheat aphid population dynamics model based on cusp catastrophe theory. Int. J. Biomath. 2020, 2050078. [Google Scholar] [CrossRef]
  3. Li, T. Research progress of wheat powdery mildew forecasting method. Meteor. Environ. Sci. 2013, 36, 44–48. (In Chinese) [Google Scholar]
  4. Zou, Y.; Qiao, H.; Cao, X.; Liu, W.; Fan, J.; Song, Y. Regionalization of wheat powdery mildew oversummering in China based on digital elevation. J. Integr. Agric. 2018, 17, 901–910. [Google Scholar] [CrossRef] [Green Version]
  5. Huang, C.; Jiang, Y.; Wu, J.; Qiu, K.; Yang, J. Occurrence and characteristics and reason analysis of wheat head blight in 2018 in China. Plant Prot. 2019, 4, 160–163. (In Chinese) [Google Scholar]
  6. Lan, Y.; Wang, G. Development situation and prospects of China’s crop protection UAV industry. Agric. Eng. Technol. 2018, 38, 17–27. (In Chinese) [Google Scholar]
  7. Lan, Y.; Chen, S. Current status and trends of plant protection UAV and its spraying technology in China. Int. J. Precis. Agric. Aviat. 2018, 1, 1–9. [Google Scholar] [CrossRef]
  8. Zhang, S.; Xue, X.; Sun, T.; Gu, W.; Zhang, C.; Peng, B.; Sun, X. Evaluation and comparison of two typical kinds UAAS based on the first industry standard of China. Int. Agric. Eng. J. 2020, 29, 331–340. [Google Scholar]
  9. He, X.; Bonds, J.; Herbst, A.; Langenakens, J. Recent development of unmanned aerial vehicle for plant protection in East Asia. Int. J. Agric. Biol. Eng. 2017, 10, 18–30. [Google Scholar]
  10. Yang, F.; Xue, X.; Cai, C.; Sun, Z.; Zhou, Q. Numerical simulation and analysis on spray drift movement of multirotor plant protection unmanned aerial vehicle. Energies 2018, 11, 2399. [Google Scholar] [CrossRef] [Green Version]
  11. Wang, L.; Lan, Y.; Zhang, Y.; Zhang, H.; Tahir, M.; Ou, S.; Liu, X.; Chen, P. Applications and prospects of agricultural Unmanned aerial vehicle obstacle avoidance technology in China. Sensors 2019, 19, 642. [Google Scholar] [CrossRef] [PubMed] [Green Version]
  12. Lan, Y.; Chen, S.; Fritz, B.K. Current status and future trends of precision agricultural aviation technologies. Int. J. Agric. Biol. Eng. 2017, 10, 1–17. [Google Scholar]
  13. Cao, G.; Li, Y.; Nan, F.; Liu, D.; Chen, C.; Zhang, J. Development and analysis of plant protection control system and route planning research. Chin. Soc. Agric. Mach. 2020, 8, 1–16. (In Chinese) [Google Scholar]
  14. Wang, G.; Han, Y.; Li, X.; Andaloro, J.; Chen, P.; Hoffmann, W.; Han, X.; Chen, S.; Lan, Y. Field evaluation of spray drift and environmental impact using an agricultural unmanned aerial vehicle (UAV) sprayer. Sci. Total Environ. 2020, 737, 139793. [Google Scholar] [CrossRef]
  15. Al-Heidary, M.; Douzals, J.; Sinfort, C.; Vallet, A. Influence of spray characteristics on potential spray drift of field crop sprayers: A literature review. Crop Prot. 2014, 63, 120–130. [Google Scholar] [CrossRef]
  16. Qiu, B.; Wang, L.; Cai, D.; Wu, J.; Ding, G.; Guan, X. Effects of flight altitude and speed of unmanned helicopter on spray deposition uniform. Chin. Soc. Agric. Eng. 2013, 29, 25–32. (In Chinese) [Google Scholar]
  17. Zhang, S.; Qiu, B.; Xue, X.; Sun, T.; Peng, B. Parameters optimization of crop protection UAS based on the first industry standard of China. Int. J. Agric. Biol. Eng. 2020, 13, 29–35. [Google Scholar] [CrossRef]
  18. Qin, W.; Qiu, B.; Xue, X.; Chen, C.; Xu, Z.; Zhou, Q. Droplet deposition and control effect of insecticides sprayed with an unmanned aerial vehicle against plant hoppers. Crop Prot. 2016, 85, 79–88. [Google Scholar] [CrossRef]
  19. Xiao, Q.; Du, R.; Yang, L.; Han, X.; Lan, Y. Comparison of droplet deposition control efficacy on phytophthora capsica and aphids in the processing pepper field of the unmanned aerial vehicle and knapsack sprayer. Agronomy 2020, 10, 215. [Google Scholar] [CrossRef] [Green Version]
  20. Lou, Z.; Xin, F.; Han, X.; Lan, Y.; Fu, W. Effect of unmanned aerial vehicle flight height on droplet distribution, drift and control of cotton aphids and spider mites. Agronomy 2018, 8, 187. [Google Scholar] [CrossRef] [Green Version]
  21. Chen, S.; Lan, Y.; Li, J.; Zhou, Z.; Jin, J.; Liu, A. Effect of spray parameters of small unmanned helicopter on distribution regularity of droplet deposition in hybrid rice canopy. Trans. Chin. Soc. Agric. Eng. 2016, 32, 40–46. (In Chinese) [Google Scholar]
  22. Wang, C.; Song, J.; He, X.; Wang, Z.; Wang, S.; Meng, Y. Effect of flight parameters on distribution characteristics of pesticide spraying droplets deposition of plant-protection unmanned aerial vehicle. Trans. Chin. Soc. Agric. Eng. 2017, 33, 109–116. (In Chinese) [Google Scholar]
  23. Wang, G.; Lan, Y.; Qi, H.; Chen, P.; Hewitt, A.; Han, Y. Field evaluation of an unmanned aerial vehicle (UAV) sprayer: Effect of spray volume on deposition and the control of pests and disease in wheat. Pest Manag. Sci. 2019, 75, 1546–1555. [Google Scholar] [CrossRef] [PubMed]
  24. Chen, P.; Lan, Y.; Huang, X.; Qi, H.; Wang, G.; Wang, J.; Wang, L.; Xiao, H. Droplet deposition and control of planthoppers of different nozzles in two-stage rice with a quadrotor unmanned aerial vehicle. Agronomy 2020, 10, 303. [Google Scholar] [CrossRef] [Green Version]
  25. Zhu, H.; Li, H.; Zhang, C.; Li, J.; Zhang, H. Performance Characterization of the UAV Chemical Application Based on CFD Simulation. Agronomy 2019, 9, 308. [Google Scholar] [CrossRef] [Green Version]
  26. Meng, Y.; Zhou, G.; Wu, C. Discussion on application and promotion of agricultural plant protection unmanned aerial vehicle in China. China Plant Prot. 2014, 34, 33–39. [Google Scholar]
  27. Shang, C.Y.; Cai, J.F.; Huang, S.J.; Pan, H.L.; Zhong, F.L. Applications status and prospect analysis of agricultural UAVs in China. J. Anhui Agric. Sci. 2017, 45, 193–195. [Google Scholar]
  28. Xue, X.; Lan, Y.; Sun, Z.; Chang, C.; Hoffmann, W. Develop an unmanned aerial vehicle based automatic aerial spraying system. Comput. Electron. Agric. 2016, 128, 58–66. [Google Scholar] [CrossRef]
  29. Zhu, H.; Salyani, M.; Fox, R. A portable scanning system for evaluation of spray deposit distribution. Comput. Electron. Agric. 2011, 76, 38–43. [Google Scholar] [CrossRef]
  30. NY/T 3213-2018. Chinese Standard: Technical Specification of Quality Evaluation for Crop Protection UAS; The Ministry of Agriculture and Rural Affairs of the People’s Republic of China: Beijing, China, 2018. (In Chinese)
  31. Smith, D. Uniformity and recovery of broadcast spray using fan nozzles. Trans. ASAE 1992, 35, 39–44. [Google Scholar] [CrossRef]
  32. NY/T 612-2002. Rules for Investigation and Forecast of Wheat Aphides; The Ministry of Agriculture and Rural Affairs of the People’s Republic of China: Beijing, China, 2002. (In Chinese)
  33. Yuan, W.; Xu, B.; Ran, G.C.; Chen, H.P.; Zhao, P.Y.; Huang, Q.L. Application of imidacloprid controlled-release granules to enhance the utilization rate and control wheat aphid on winter wheat. J. Integr. Agric. 2020, 19, 3045–3053. [Google Scholar] [CrossRef]
  34. Wang, G.; Lan, Y.; Yuan, H.; Qi, H.; Chen, P.; Ouyang, F.; Han, Y. Comparison of spray deposition, control efficacy on wheat aphids and working efficiency in the wheat field of the unmanned aerial vehicle with boom sprayer and two conventional knapsack sprayers. Appl. Sci. 2019, 9, 218. [Google Scholar] [CrossRef] [Green Version]
  35. NY/T 613-2002. Rules for Investigation and Forecast of Wheat Powdery Mildew [Blumeria Graminis (DC.) Speer]; The Ministry of Agriculture and Rual Affairs of the People’s Republic of China: Beijing, China, 2002. (In Chinese)
  36. Qin, W.; Xue, X.; Zhang, S.; Gu, W.; Wang, B. Droplet deposition and efficiency of fungicides sprayed with small uav against wheat powdery mildew. Int. J. Agric. Biol. Eng. 2018, 11, 27–32. [Google Scholar] [CrossRef] [Green Version]
  37. GB/T 15796-2011. Rules for Monitoring and Forecast of the Wheat Head Blight (Fusarium Graminearum Schw./Gibberella Zeae(Schw.) Petch); General Administration of Quality Supervision, Inspection and Quarantine of the People’s Republic of China, National Standardization Administration of China: Beijing, China, 2011. (In Chinese)
  38. Yobo, K.; Mngadi, Z.; Laing, M. Efficacy of two potassium silicate formulations and two trichoderma strains on fusarium head blight of wheat. Proc. Natl. Acad. Sci. India. B 2019, 89, 185–190. [Google Scholar] [CrossRef]
  39. Ma, Z. Researches and control of wheat stripe rust in China. J. Plant. Protect. 2018, 45, 1–6. (In Chinese) [Google Scholar]
  40. Cao, S.; Luo, H.; Jin, M.; Jin, S.; Duan, X.; Zhou, Y. Intercropping influenced the occurrence of stripe rust and powdery mildew in wheat. Crop Prot. 2015, 70, 40–46. [Google Scholar] [CrossRef]
  41. Dweba, C.; Figlan, S.; Shimelis, H.; Motaung, T.; Sydenham, S.; Mwadzingeni, L. Fusarium head blight of wheat: Pathogenesis and control strategies. Crop Prot. 2017, 91, 114–122. [Google Scholar] [CrossRef]
  42. Meng, Y.; Su, J.; Song, J.; Chen, W.; Lan, Y. Experimental evaluation of uav spraying for peach trees of different shapes: Effects of operational parameters on droplet distribution. Comput. Electron. Agric. 2020, 170, 105282. [Google Scholar] [CrossRef]
  43. Chen, S.; Lan, Y.; Li, J.; Zhou, Z.; Liu, A.; Mao, Y. Effect of wind field below unmanned helicopter on droplet deposition distribution of aerial spraying. Int. J. Agric. Biol. Eng. 2017, 10, 67–77. [Google Scholar]
  44. Li, J.; Shi, Y.; Lan, Y.; Guo, S. Vertical distribution and vortex structure of rotor wind field under the influence of rice canopy. Comput. Electron. Agric. 2019, 159, 140–146. [Google Scholar] [CrossRef]
Figure 1. The Crop Protection Unmanned Aerial System (CPUAS) CE20.
Applsci 11 00712 g001
Figure 2. The field sampling layout (top view).
Applsci 11 00712 g002
Figure 3. Upper and lower layers of water-sensitive papers (WSPs) on the sampling point.
Applsci 11 00712 g003
Figure 4. Effective spraying width (ESW) changes under different speeds. Note: ESW1.5, ESW2.0, ESW2.5 represent the ESW when the flight height (FH) was 1.5, 2.0, and 2.5 m, respectively.
Applsci 11 00712 g004
Figure 5. ESW changes under different heights. Note: ESW3, ESW4, and ESW5 represent the ESW when the flight speeds (FS) were 3.0, 4.0 m/s, and 5.0 m/s, respectively.
Applsci 11 00712 g005
Figure 6. Droplet deposition uniformity of each treatment by coefficients of variation (CVs).
Applsci 11 00712 g006
Figure 7. Wheat aphids, powdery mildew, and head blight occurrence in the test field.
Applsci 11 00712 g007
Figure 8. Wheat aphids control effect.
Applsci 11 00712 g008
Table 1. The wheat characteristics and weather conditions.
Test TimeGrowth PeriodMean HeightMean Leaf Area IndexMean Wind SpeedMean TemperatureMean Relative Humidity
11 March 2019Turning green stage13.5 cm1.051.2 ± 0.20 m/s12.6 ± 0.30 °C65.2 ± 1.55%
14 April 2019Heading stage51.4 cm4.350.8 ± 0.15 m/s22.3 ± 0.40 °C45.6 ± 0.15%
16 May 2019Blooming stage68.7 cm5.471.4 ± 0.25 m/s28.6 ± 0.20 °C52.8 ± 0.76%
Table 2. The main technical parameters of CE20.
ItemsParameters
UAAS size 1880 mm × 618 mm × 758 mm
Rotor diameter2388 mm
Battery capacity28,000 mAh × 2
Boom length1442 mm
Maximum load 20 L
Number of nozzles2
Type of nozzlesHydraulic
Arrangement of nozzles800 mm on both sides of the fuselage
Spraying volume2.0 L/min
Spraying width3–5 m
Table 3. The experiment treatment designs.
TreatmentsFSFHSpraying Volume
T13.0 m/s1.5 m2.0 L/min
T23.0 m/s2.0 m2.0 L/min
T33.0 m/s2.5 m2.0 L/min
T44.0 m/s1.5 m2.0 L/min
T54.0 m/s2.0 m2.0 L/min
T64.0 m/s2.5 m2.0 L/min
T75.0 m/s1.5 m2.0 L/min
T85.0 m/s2.0 m2.0 L/min
T95.0 m/s2.5 m2.0 L/min
Table 4. The major wheat pests, diseases, and pesticide applications.
Spraying DatePest and DiseasePesticides and Dosage
12 March 2019AphidsAbamectin cypermethrin, Emulsion, 4.50 g a.i./ha
15 April 2019Powdery mildewPhenamacril, Suspension concentrate, 375 g a.i./ha
Epoxiconazole, Suspension concentrate (SC), 15.75 g a.i./ha
17 May 2019Head blightTebuconazole and Prochloraz, Emulsion in Water (EW), 202.5 g a.i./ha
Phenamacril, Suspension concentrate (SC), 375 g a.i./ha
Table 5. Test result data of bandwidths, droplet deposition uniformities, and penetration rates.
Treatment NumberESW CV
T15.42 m23.30%
T25.78 m24.80%
T34.58 m26.20%
T43.51 m23.30%
T55.75 m26.20%
T64.17 m34.40%
T72.58 m27.20%
T82.77 m28.15%
T92.51 m32.65%
Table 6. Two-way analysis of variance for ESWs.
Source of VariancedfFp-ValueSignificance
FS22.230.0033** 1
FH212.930.136NS 2
FS × FH40.910.906NS
1,2: p means the significance level of the factor affecting the result, p < 0.01 (** represents factors that are highly significant on the test result), p < 0.05 (* represents factors that have a significant impact on the test result), NS (NS represents factors that have no significant impact on the test result).
Table 7. Two-way analysis of variance for droplet deposition uniformity (DDUs).
Source of VariancedfFp-ValueSignificance
FS22.230.827NS 1
FH212.930.019* 2
FS × FH40.910.032*
1,2: p means the significance level of the factor affecting the result, p < 0.01 (** represents factors that have a highly significant impact on the test result), p < 0.05 (* represents factors that have a significant impact on the test result), NS (NS represents factors that have no significant impact on the test result).
Table 8. Control effects of powdery mildew and head blight.
DiseasePeriodDateControl Effect
Powdery mildewHeading stage7 d77.17 ± 1.15%
14 d82.83 ± 2.98%
Head blightBlooming stage20 d88.32 ± 1.50%
Publisher’s Note: MDPI stays neutral with regard to jurisdictional claims in published maps and institutional affiliations.

