Article

Carbon from Bagasse Activated with Water Vapor and Its Adsorption Performance for Methylene Blue

by
Fitria Rahmawati
1,*,
Arikasuci Fitonna Ridassepri
1,
Chairunnisa
2,3,
Agung Tri Wijayanta
4,
Koji Nakabayashi
2,5,
Jin Miyawaki
2,5 and
Takahiko Miyazaki
2,3
1
Research Group of Solid State Chemistry and Catalysis, Chemistry Department, Faculty of Mathematics and Natural Sciences, Sebelas Maret University, Jl. Ir. Sutami 36A Kentingan, Surakarta 57126, Indonesia
2
Interdisciplinary Graduate School of Engineering Sciences, Kyushu University, Kasuga-koen 6-1, Kasuga-shi, Fukuoka 816-8580, Japan
3
International Institute for Carbon-Neutral Energy Research (WPI-I2CNER), Kyushu University, 744 Motooka, Nishi-ku, Fukuoka 819-0395, Japan
4
Research Group of Sustainable Thermofluids, Mechanical Engineering Department, Faculty of Engineering, Sebelas Maret University, Jl. Ir. Sutami 36A Kentingan, Surakarta 57126, Indonesia
5
Institute for Materials Chemistry and Engineering, Kyushu University, Kasuga-koen 6-1, Kasuga-shi, Fukuoka 816-8580, Japan
*
Author to whom correspondence should be addressed.
Appl. Sci. 2021, 11(2), 678; https://doi.org/10.3390/app11020678
Submission received: 21 December 2020 / Revised: 5 January 2021 / Accepted: 5 January 2021 / Published: 12 January 2021
(This article belongs to the Special Issue Sciences and Innovations in Heat Pump/Refrigeration: Volume II)

Abstract

:

Featured Application

The activated-carbon derived from bagasse, a solid waste of sugar factories, can be used for many applications such as for humidity adsorption and wastewater treatment, including dye wastewater from textile industries.

Abstract

This research work reports on the potential of bagasse, a solid waste from sugar factories, to produce activated-carbon (AC) as an adsorbent. The activation was conducted under 500, 600, and 700 °C using steam as the activation agent to produce AC500, AC600, and AC700, respectively. The prepared-materials were characterized to understand their elemental content, surface morphology, thermal properties, functional groups identification, surface area, and pore size. AC700 provided the highest surface area of 592.36 m2/g and indicated the contribution of mesopores distributes along 1.5–8.0 nm of pore size. Therefore, an adsorption test was conducted with AC700 as adsorbent. The results show that methylene blue (MB) adsorption reached equilibrium after 30 min of adsorption time. The adsorption isotherm applied to a monolayer Langmuir isotherm was fitted by linearization, resulting in a constant R2 of 0.999. The MB adsorption to AC700 favorably occurred, as proven by the Freundlich parameter 1/n of 0.881, which is less than 1. The Dubinin-Radushkevich isotherm confirmed that the adsorption proceeded through physical interaction with adsorption energy of 3.536 kJ/mol.

1. Introduction

Adsorption systems are prevalent in many fields, and various efforts have been made, such as for air conditioning systems [1,2] and heat pumps [3,4,5], to improve efficiency. Activated-carbon (AC) is a highly porous material that has generated popularity of adsorption refrigeration systems due to its strong adsorption of several refrigerants as adsorption pairs. ACs are mostly prepared from carbon resources, such as coal [6], peat [7], wood [8], shells [9,10], and various agricultural wastes [11,12].
Bagasse is a solid waste released by sugarcane factories during the production stage. Bagasse contains short fibers and a small amount of soluble solids [13]. Bagasse has a high content of cellulose (up to 50%), hemicellulose (25%), and lignin (25%) [13,14]. The high content of cellulose is a strong reason for choosing bagasse for activated-carbon production [15,16]. Much research on carbon and its allotrope production has been conducted due to the multi-functional properties of the carbonaceous materials, including for adsorption [17], photocatalysis [18,19], electronic materials [20], etc. Research on the production of activated-carbon from bagasse for Cr (VI) adsorbent was conducted in which the carbon was chemically activated by ZnCl2 at 600 °C under N2 atmosphere. The surface area for the produced activated-carbon was 916.134 m2/g [21]. The carbon activated by NaOH and H2SO4 was reported further, and the adsorption efficiency for methylene orange dye from aqueous solution was investigated [22]. Another analysis was also carried-out the chemical activation of carbon from bagasse by applying KOH solution with a KOH to biomass ratio of 1:3 under heat treatment of 800 °C for 30 min. The activated-carbon showed an adsorption capacity (51.3 mg/g) to Pb+ [23]. The activated-carbon from bagasse, which is activated by a mixture of H3PO4 and ZnCl2, also shows good adsorption performance to remove chromophore from raw cane juice in sugar production [24]. Moreover, microwave-assisted heat treatment to sugarcane carbon produces activated-carbon powder with a maximum monolayer adsorption capacity for ammoniacal nitrogen (NH3–N–) adsorption of 138.46 mg/g and 12.81 mg/g for orthophosphate adsorption capacity. The kinetics of adsorption follows a second-order-kinetics model, indicating the potential of activated-carbon prepared from sugarcane bagasse for the adsorptive treatment of semi-aerobic landfill leachate [17].
In the above-mentioned published reports, many research works performed chemical activation by applying alkali hydroxide or acid solution along with a heat treatment. The results showed good adsorption ability of the activated-carbon. However, the chemicals chosen for activation are not environmentally-friendly. Liquid waste after activation increases environmental impacts and it requires handling for treatment. In the framework of the effective utilization of bagasse waste from the sugar factory, the effort has been made through steam activation to create activated carbon. The carbonized bagasse, activated by steam, reached an optimum condition of 800 °C for 1 h [25]. The steam at 110 °C, necessary for activation, was conducted for the carbonized residual biomass sources [26]. At an activation temperature of 900 °C for 45 min under steam atmosphere, activated carbon extracted from olive bagasse was prepared, and the surface area increased up to 1106 m2/g [27] compared with N2 activation [21] and the activation under other chemical atmospheres [22,23,24]. At 700 °C for 1 h steam activation, the optimum surface area obtained by bagasse fly ash was only 656 m2/g, but the activation using KOH as the chemical agent at 700 °C increased the surface area up to 2571 m2/g [28]. By increasing the steam activation time, an increase in surface area followed by an increase in aromatic surface groups and a decrease in polar/nonpolar surface groups was recently reported [29]; however, the interaction mechanism was not developed.
In this research work, carbonized bagasse was activated by flowing water vapor as an activation agent under various temperatures. The aim of this research work was to explore the possibility, through steam activation, of preparing activated carbon from bagasse—a solid waste of sugar factories. The resulting activated-carbons were characterized by several techniques. Furthermore, the activated-carbon with the highest surface area was tested for methylene blue adsorption to understand its adsorption capability. The interaction mechanism between the carbonaceous surface and methylene blue was also proposed here.

2. Materials and Methods

2.1. Materials

The bagasse was taken from a sugarcane factory in Kudus, Indonesia. Methylene blue (C16H18ClN3.2H2O) was purchased from Pudak Scientific. All solutions were prepared using distilled water.

2.2. Activated-Carbon Preparation

The bagasse was chopped into small pieces and soaked in distilled water for 24 h. The water was then removed, and the cleaned bagasse was dried at 120 °C for 24 h in the oven. The dried bagasse was then burned in an installed-tube furnace at 600 °C for 30 min in N2 atmosphere. The result was a black char or carbonized bagasse. A 460 ± 5.6 mg quantity of the carbonized bagasse was then activated by water vapor or steam. The activation was done by heating the char at 500 °C, 600 °C, and 700 °C for 1 h under steam flow of 0.23 ± 0.001 kg/h. The heating rate of both the carbonization and activation process was 18 °C.min−1. After 1 h, the temperature of the furnace was decreased to 30 °C, and then the activated-carbon was pulled out from the furnace and dried in the oven for 30 min under 110 °C. The activation products were denoted by AC500, AC600, and AC700. Carbonization yield (%) was calculated by dividing mass of carbonized bagasse with the initial mass of bagasse for carbonation, which was 2.29 ± 0.02 g. Moreover, the activation yield (%) was calculated by dividing the dry mass of the activation result with the mass of carbonized bagasse.
The dried bagasse was characterized by thermo gravimetric analysis (TGA, STA Linseis PT-1600) and scanning electron microscopy/energy dispersive X-ray (SEM/EDX, JEOL JSM 6510 LA) to investigate its surface morphology. The TGA analysis was conducted at 0–1000 °C with an increasing rate of 5 °C/min to study its thermal properties. The flask was vacuumed before heating. PXRD analysis was conducted (Rigaku Miniflex) using Cu/Kα radiation ranging from 0 to 80° to identify the characteristic peaks, phase content, and crystallinity of dried bagasse by comparison with standard diffraction of carbonaceous material. Fourier transform infrared (FTIR) analysis (Shimadzu IR Prestige-2) was done to analyze the presence of some specific functional groups. The surface area and porosity of the char and the prepared activated-carbon were analyzed using a surface area analyzer (Quantachrome Instruments, type Nova 1200e) through the measurements of adsorption and desorption of N2 at 77K at a relative pressure.
The carbon content was determined by taking 0.2 g of the carbonized bagasse and then dissolved it in 200 mL of 1M NaOH solution, by heating at 70 °C under continuous stirring for 30 min. The mixture was then stored overnight, followed by filtration. The residue was washed with 0.1 M HCl solution and followed by water leaching until the pH was 7. The neutralized-carbon was then dried at 80 °C for 12 h and then was gravimetrically weighted.
Moreover, acidity of the activated-carbon was determined by ammonia adsorption. The ammonia adsorption test was conducted by placing a definite amount of the activated-carbon in a flacon that was kept in a desiccator along with 100 mL of ammonia solution. The desiccator was vacuumed and then cured for 24 h. The weight of the activated-carbon before and after ammonia adsorption was analyzed to calculate mg of NH3 being adsorbed by a gram of the activated-carbon to determine the acidity value (mg/g).

2.3. Adsorption Test

The adsorption test was conducted with the highest surface area found from the prepared activated-carbon. Before being used in the adsorption test, the activated-carbon powder was crushed in an alumina mortar and then sieved by a 50-mesh sieve. Then 5 mg of the prepared carbon powder was poured into 10 mL of methylene blue (MB) solution. The initial concentration of the MB solution was 15 ppm. The suspension was stirred for 0, 10, 20, 30, 40, 50, 60, and 70 min. After stirring under the specified times, 4 mL of solution was taken with a syringe for UV–Vis absorbance analysis (UV–Vis spectrometer Hitachi Double-Beam Spectrophotometer UH5300; optical system: Czerny–Turner mount, double beam monochromator; wave length range 190 to 1100 nm; photometric range absorbance of 0–3.3; and %T of 0 to 300) under the maximum wavelength absorbance of MB, χmax, which is 664 nm. Moreover, a standard curve of MB concentration was plotted by measuring the absorbance of 0–15 ppm of MB solution under 664 nm of light wavelength. The standard curve was used to correlate the absorbance, A, with the MB concentration, C, through a linear equation plotted from the absorbance data.
A Langmuir isotherm was applied to examine the relation between the equilibrium adsorbed molecules, qe (mg/g adsorbent), and the equilibrium concentration of solute in the fluid phase, Ce (mg/L), determined using Equation (1) [30].
q e = a b C e 1 + b C e
in which a, mg/g adsorbent, denotes the maximum loading of MB molecules on adsorbent corresponding to the complete monolayer coverage of all available adsorption sites; and b represents a constant of the Langmuir isotherm in L/mg adsorbent [30]. The maximum loading was calculated based on the surface area of the adsorbent, in m2/g adsorbent, divided by the area of the MB molecule to cover, i.e., 102–108 Å2 [31].
For the Freundlich isotherm application, Equation (2) was used to understand the favorability of the MB adsorption on the produced activated-carbon, in which if the adsorption is favorable, n > 1, and if adsorption is unfavorable, n < 1 [32].
q e = K F C e 1 / n
in which KF and n are the characteristic constants of the particular adsorption system based on Freundlich isotherm, qe represents the adsorbed MB on the adsorbent surface, in mg/g, and Ce denotes the MB concentration in the fluid phase, in mg/L. The Dubinin–Radushkevich (D–R) isotherm was also examined to understand the energy of adsorption, as described in Equation (3) [33].
q e = X m exp B ϵ 2
in which qe represents the amount of adsorbed MB (mg/g), and Xm denotes the maximum capacity of adsorption (mg/g). B is the D–R constant (mol2/kJ2), and a constant of the mean free energy (E) of adsorption was determined by Equation (4).
E = 1 2 B
The Polanyi potential ∈ can be calculated with Equation (5).
= R T l n 1 +   1 C e
where R is the gas constant (J/mol), T denotes the temperature (K), and Ce represents the equilibrium concentration of MB (ppm).
Kinetics of adsorption was studied by applying first-order and a second-order reaction kinetics. The kinetics study was only conducted on the initial adsorption, or the adsorption before reaching equilibrium, because after equilibrium the adsorption would be similar to the desorption rate, resulting a flat line curve.
Moreover, the intra-particle diffusion resistance was investigated using the Weber–Morris model described in Equation (6).
q t = k i t 1 / 2 + C
in which qt denotes the adsorbed molecules at time t (min), and ki is the intra-particle diffusion rate constant (mg/g min1/2) [34]. Data analysis and a graphic plot were conducted with Origin 6.0 Patch 4 (a trial version, OriginLab Corporation, Northampton, MA, USA). Moreover, the molecular interaction was drawn carefully using Chem Draw Ultra12.0 (a free trial version, CambridgeSoft, Billerica, MA, USA).

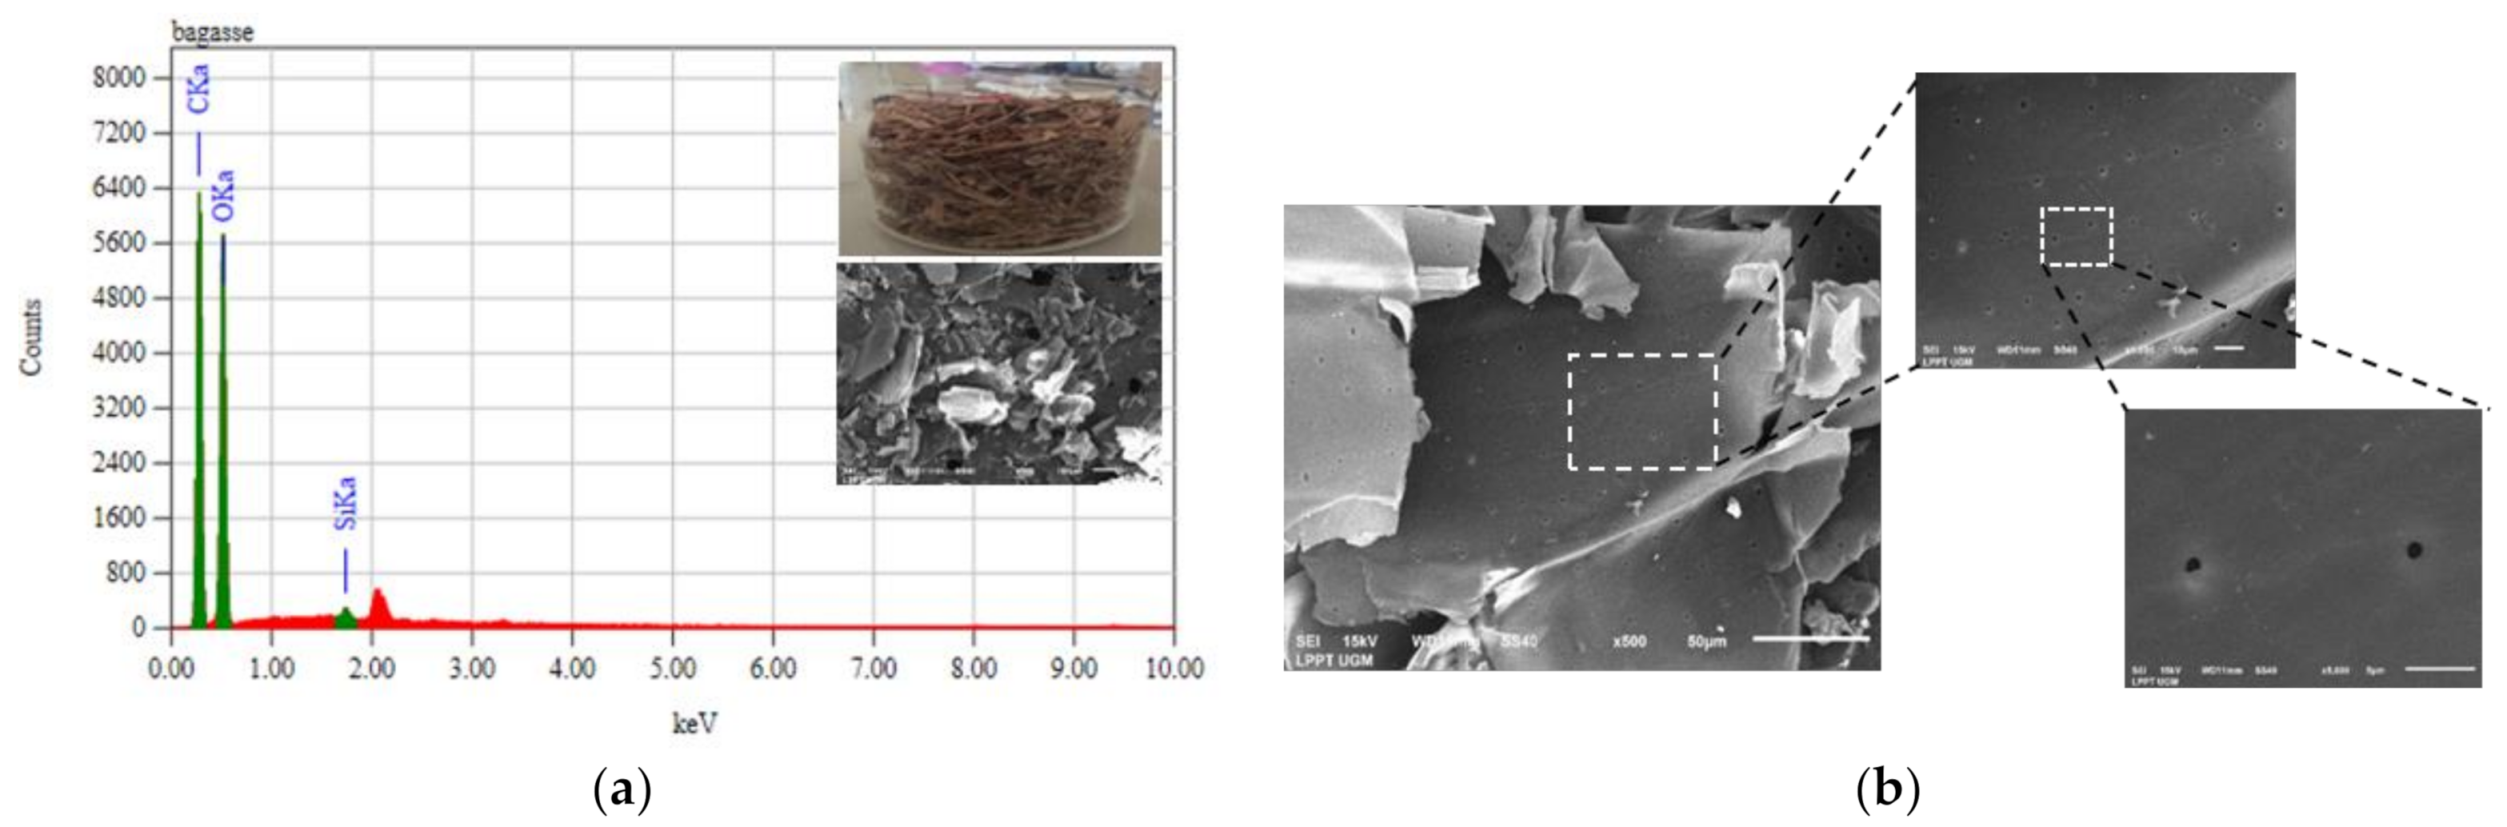
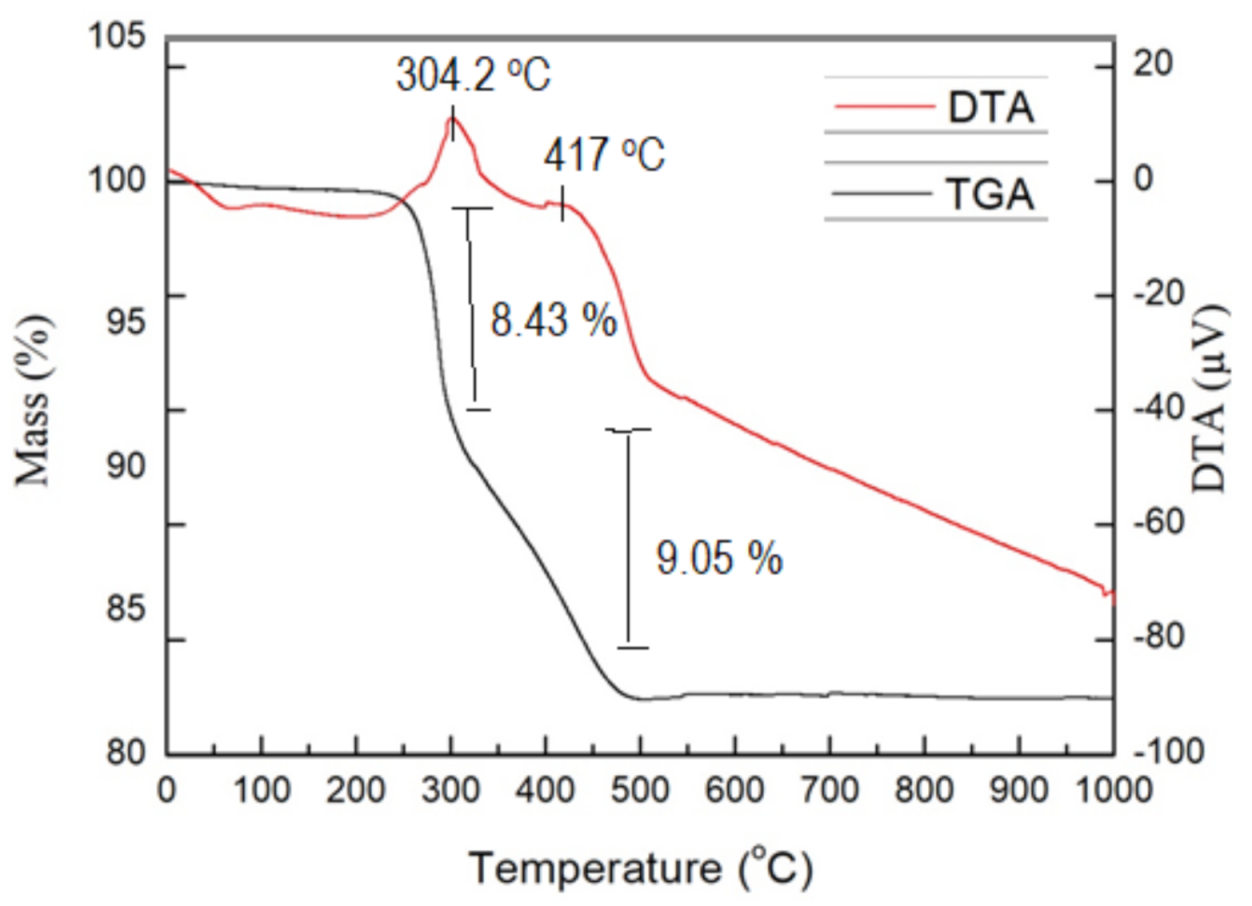
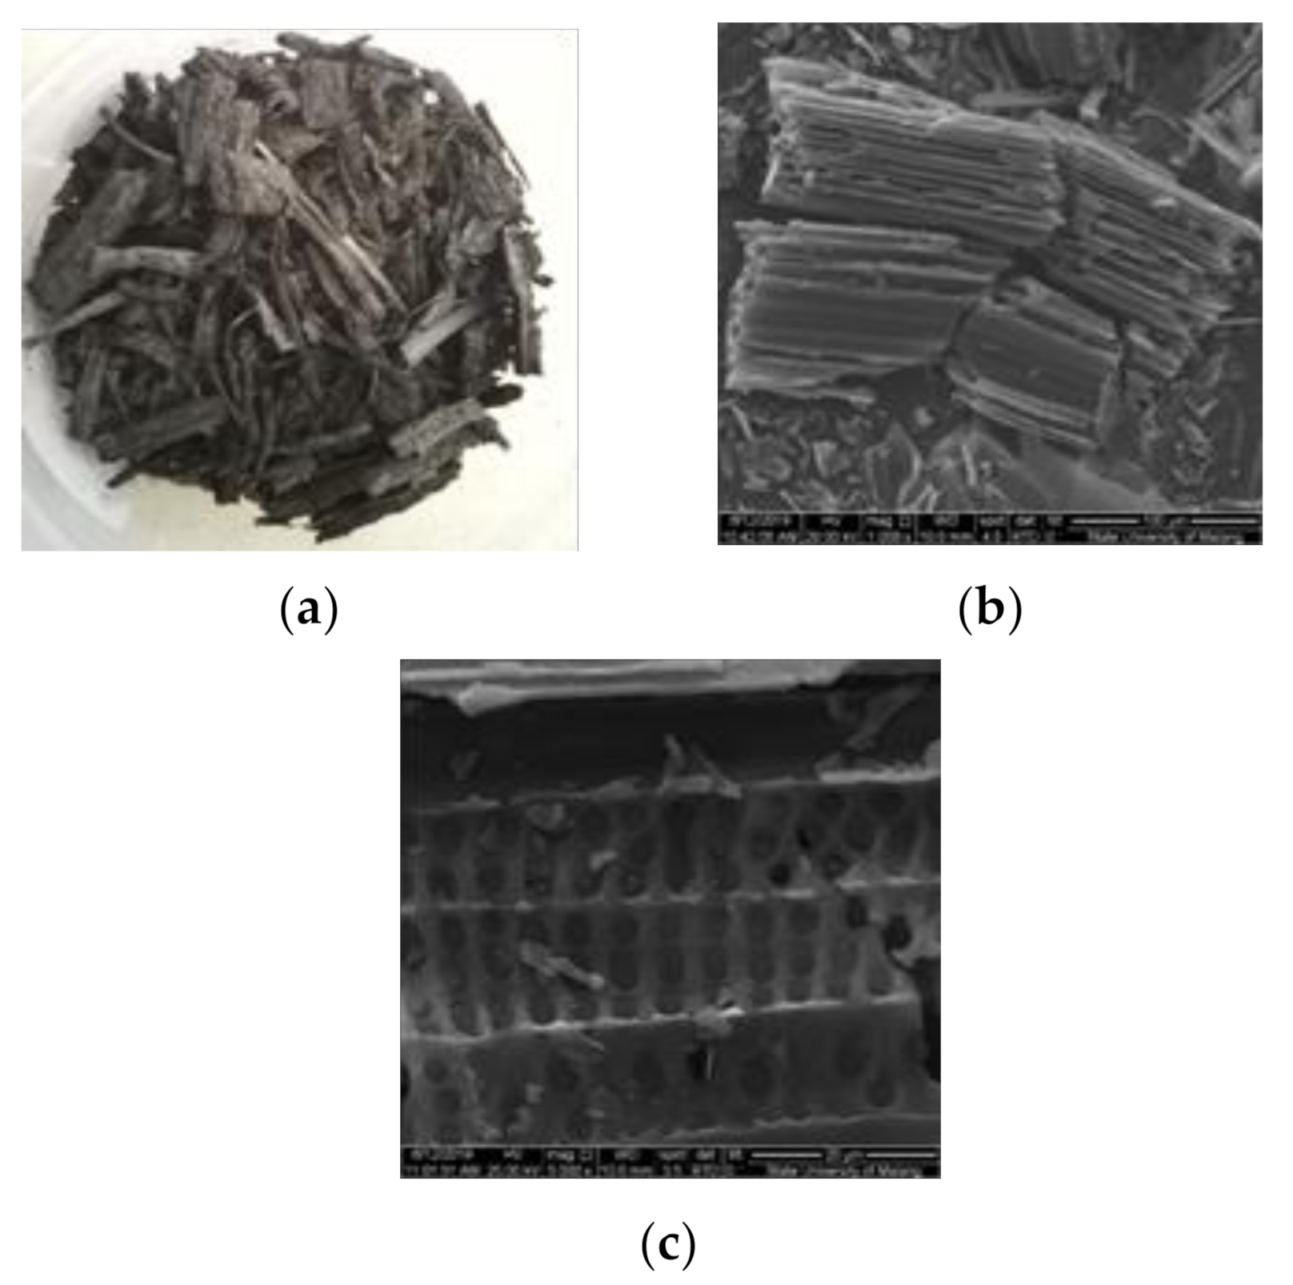
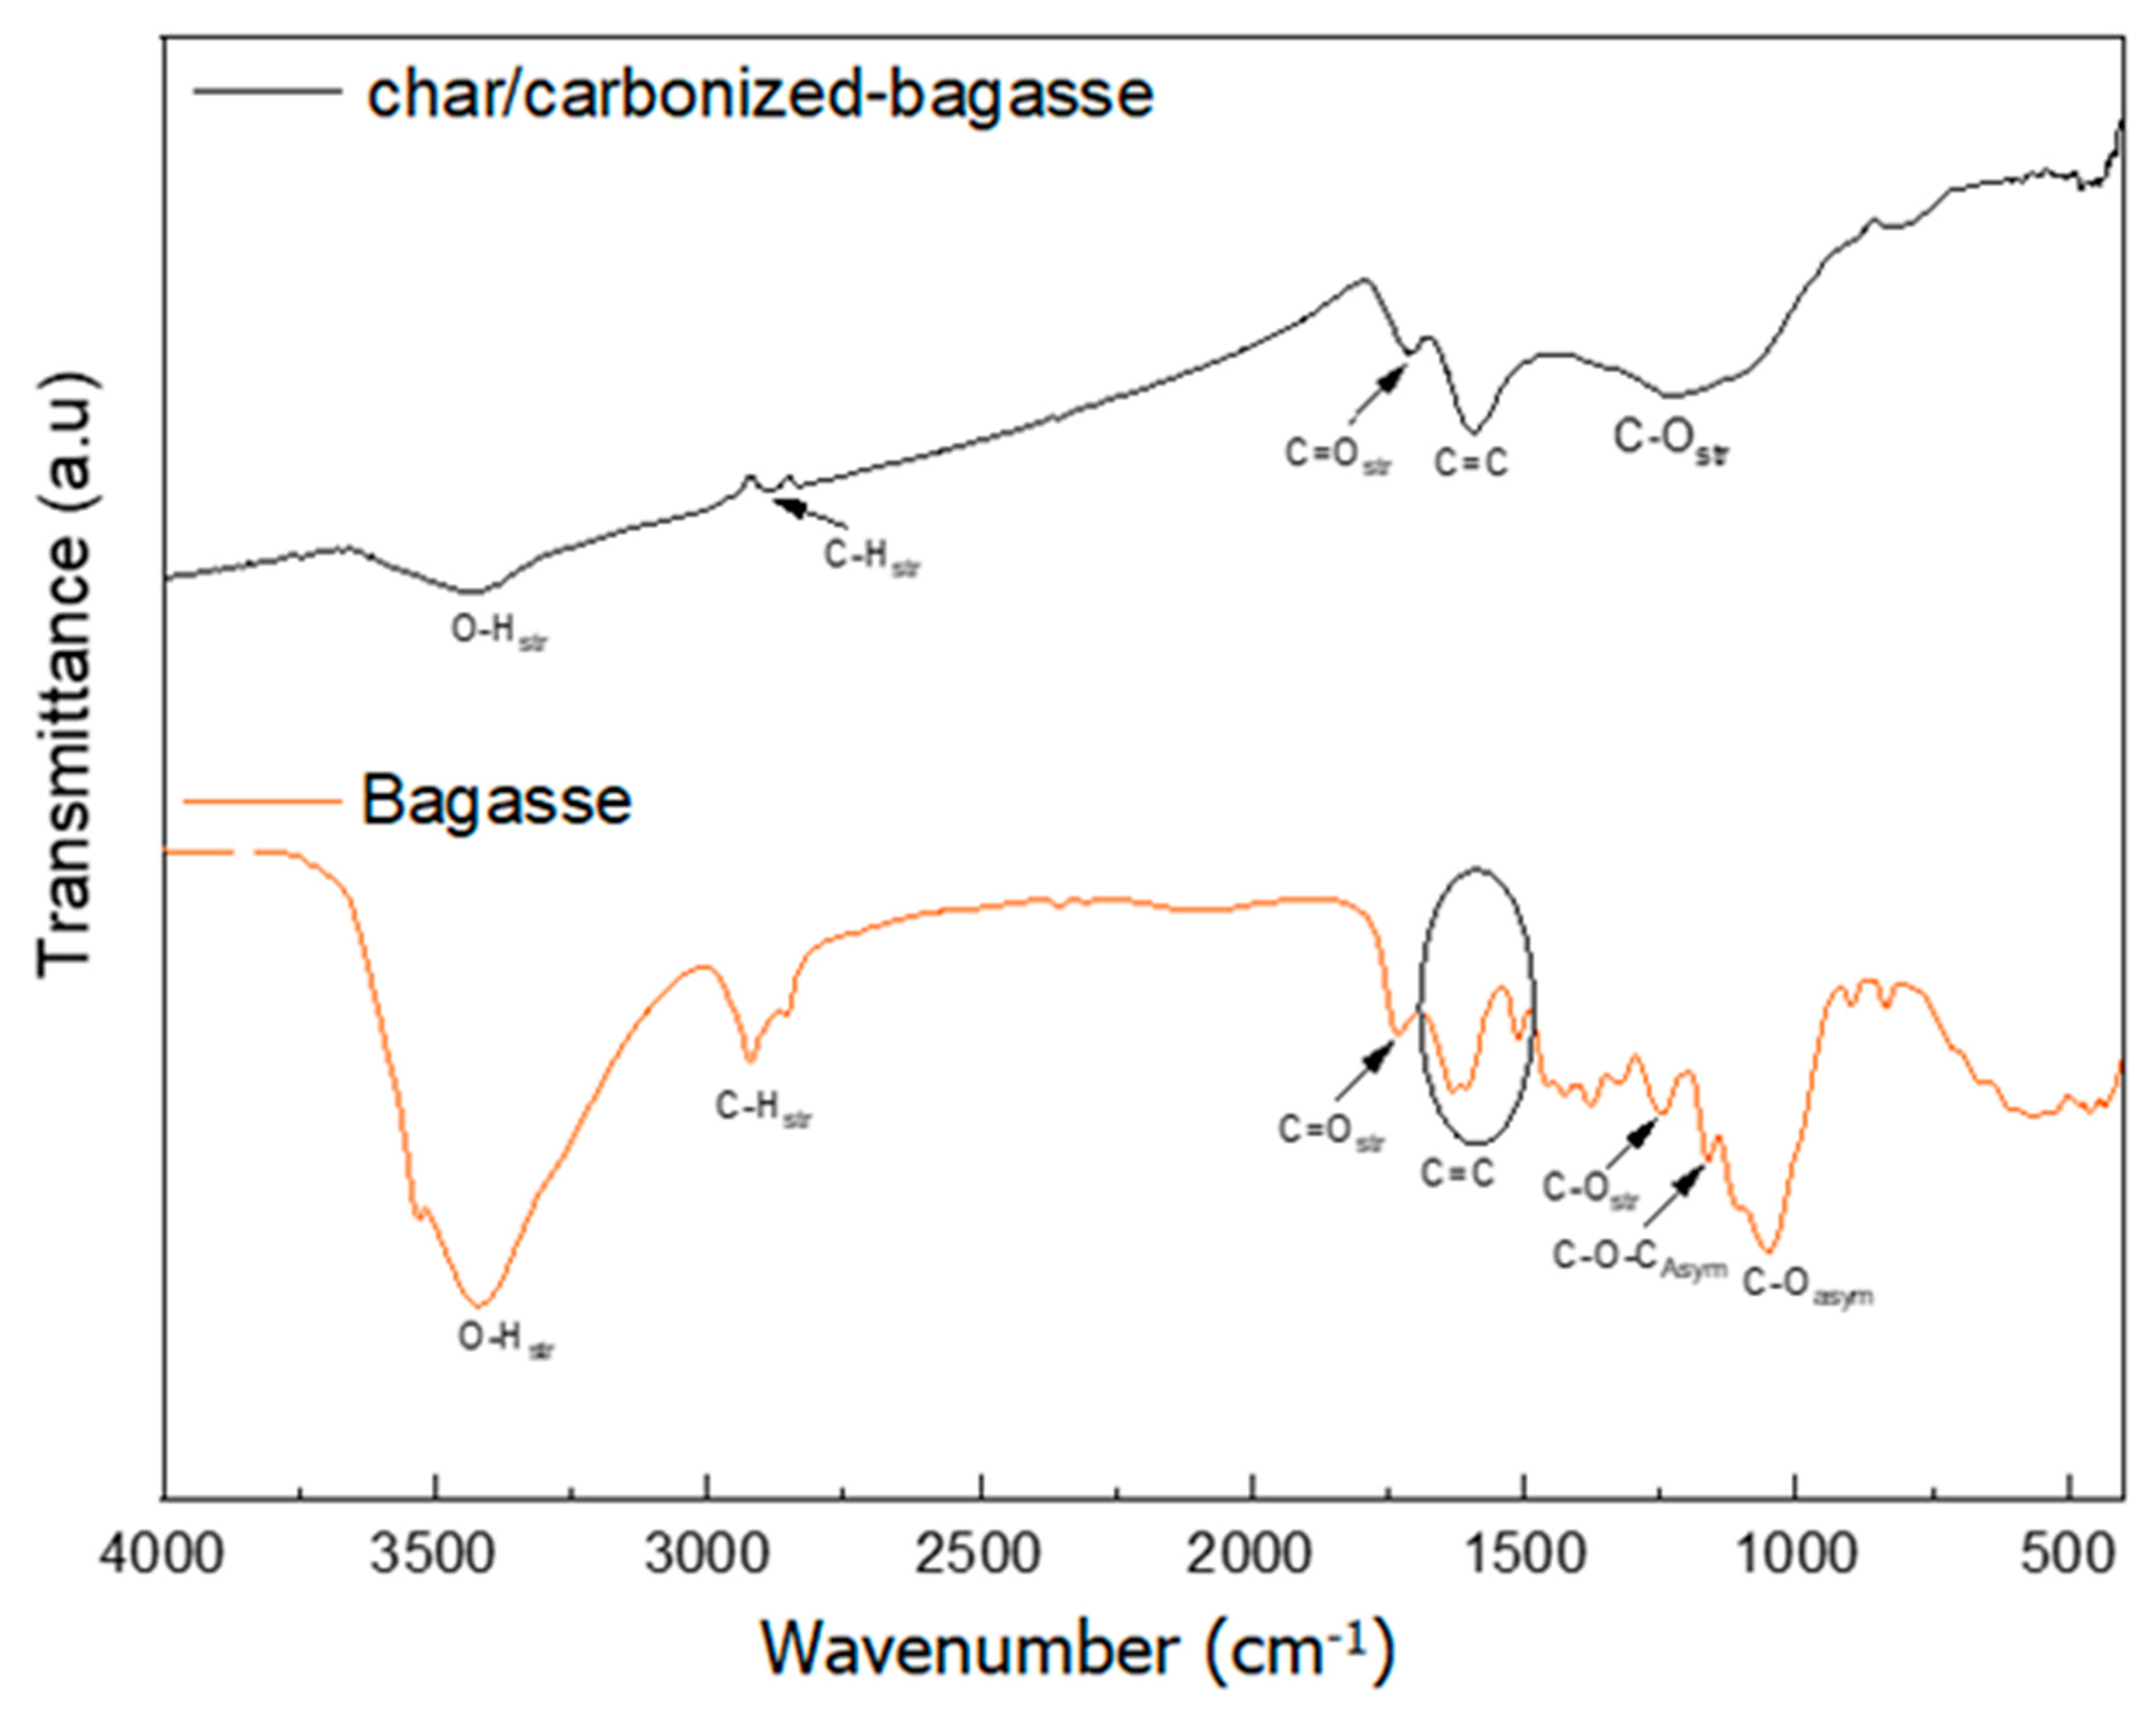
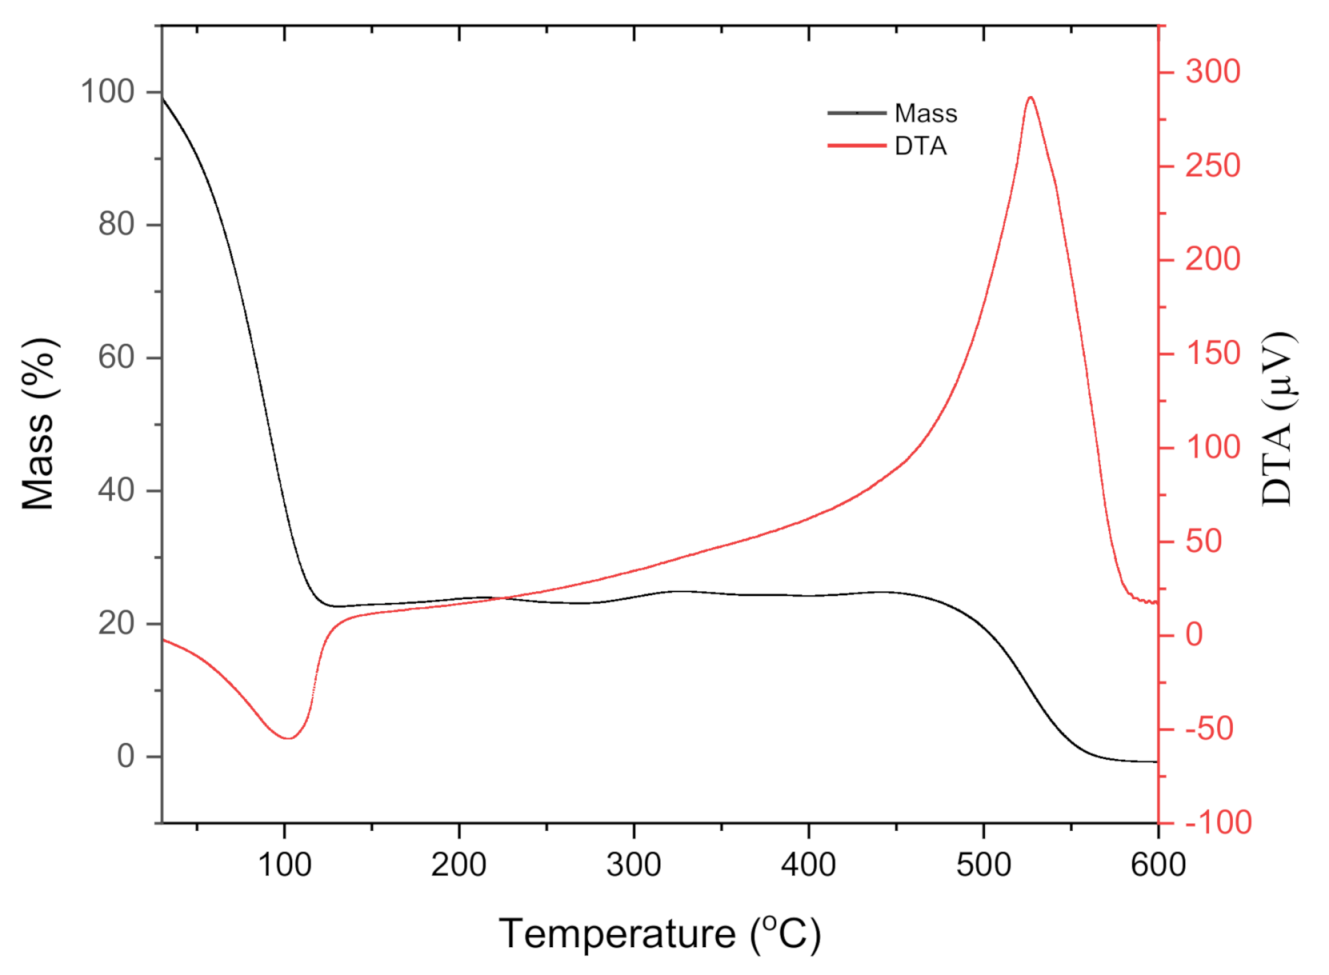
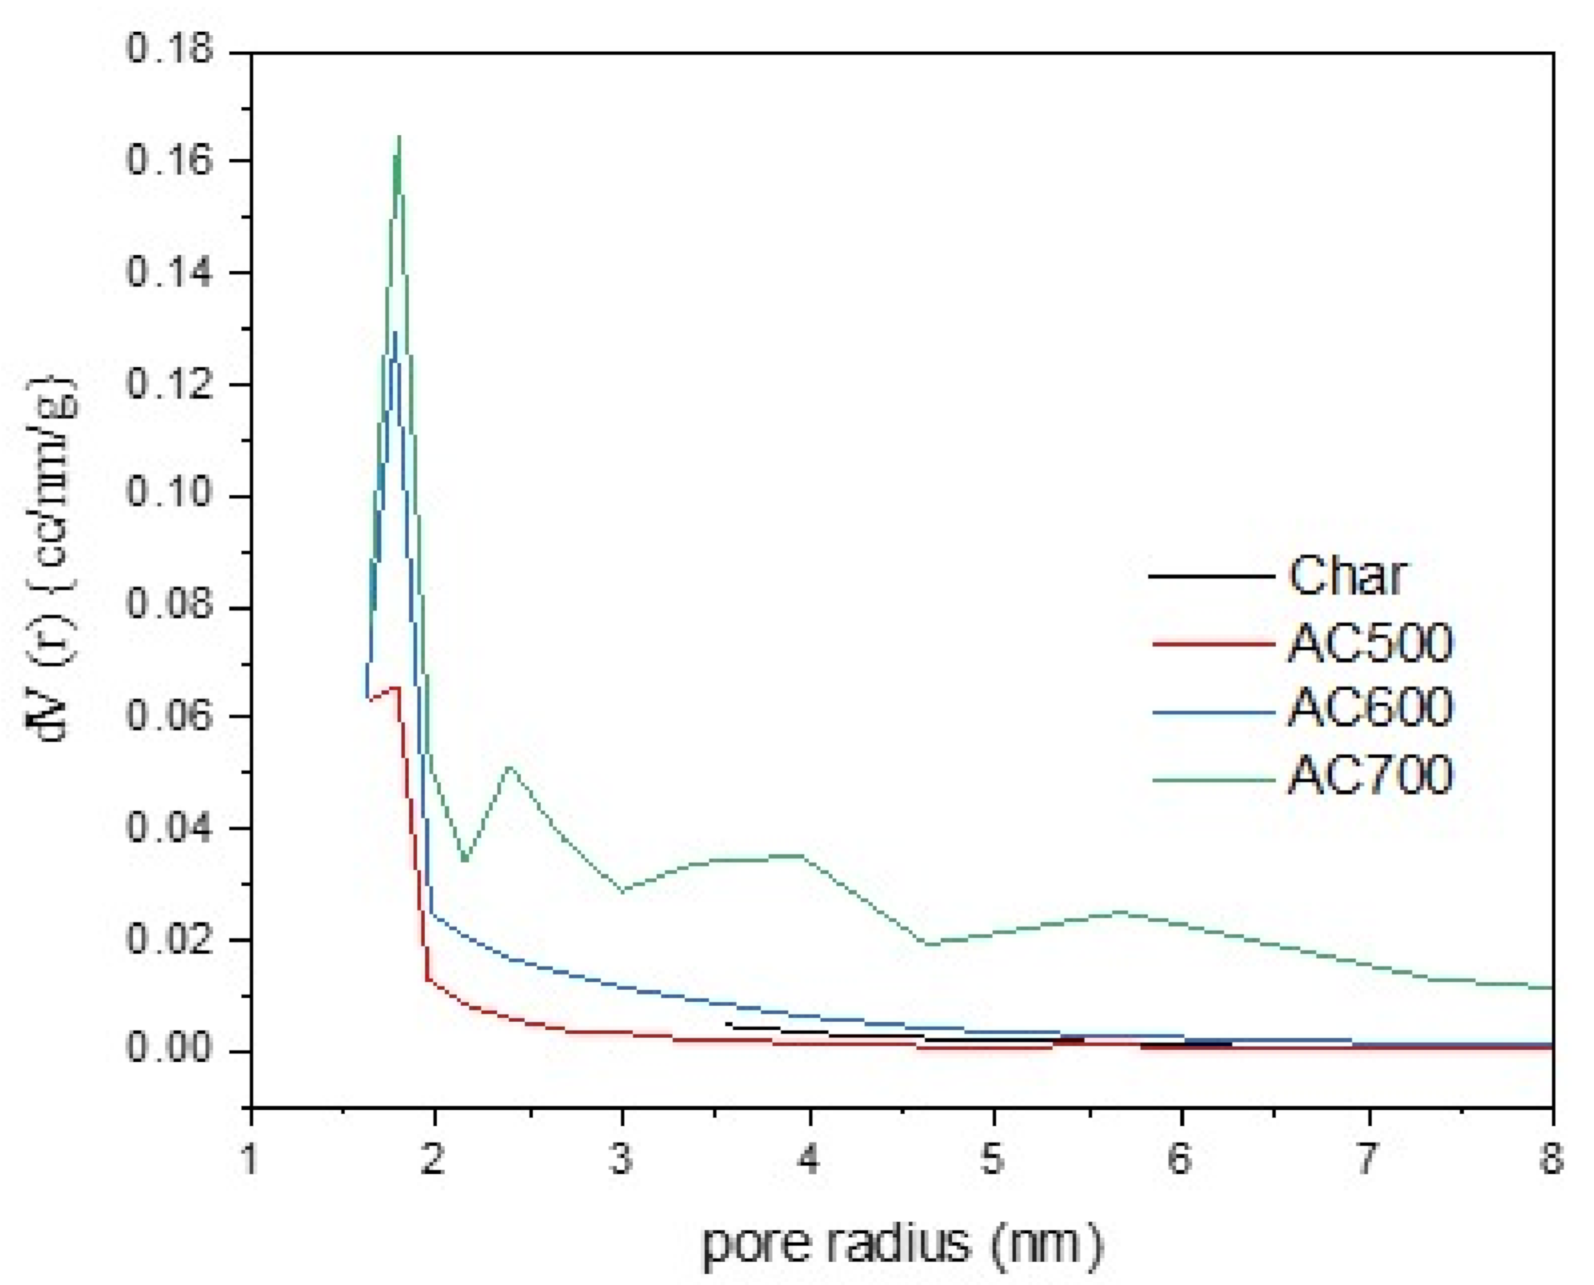
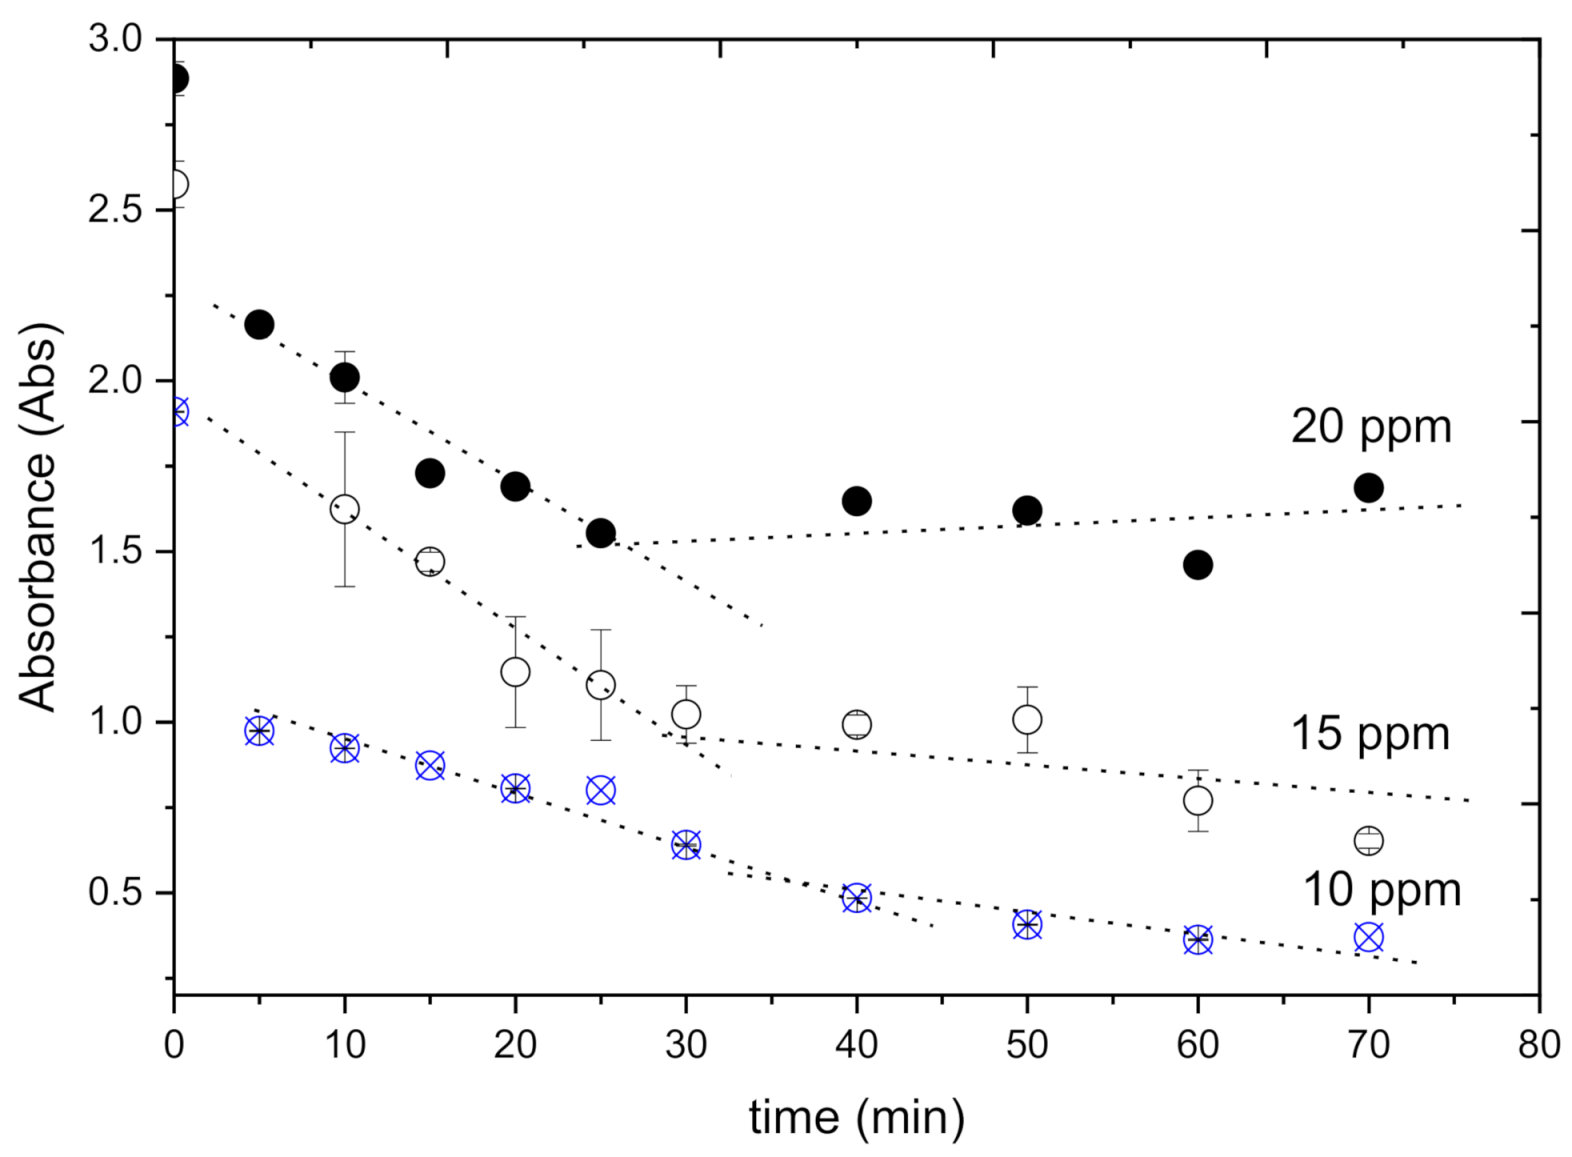
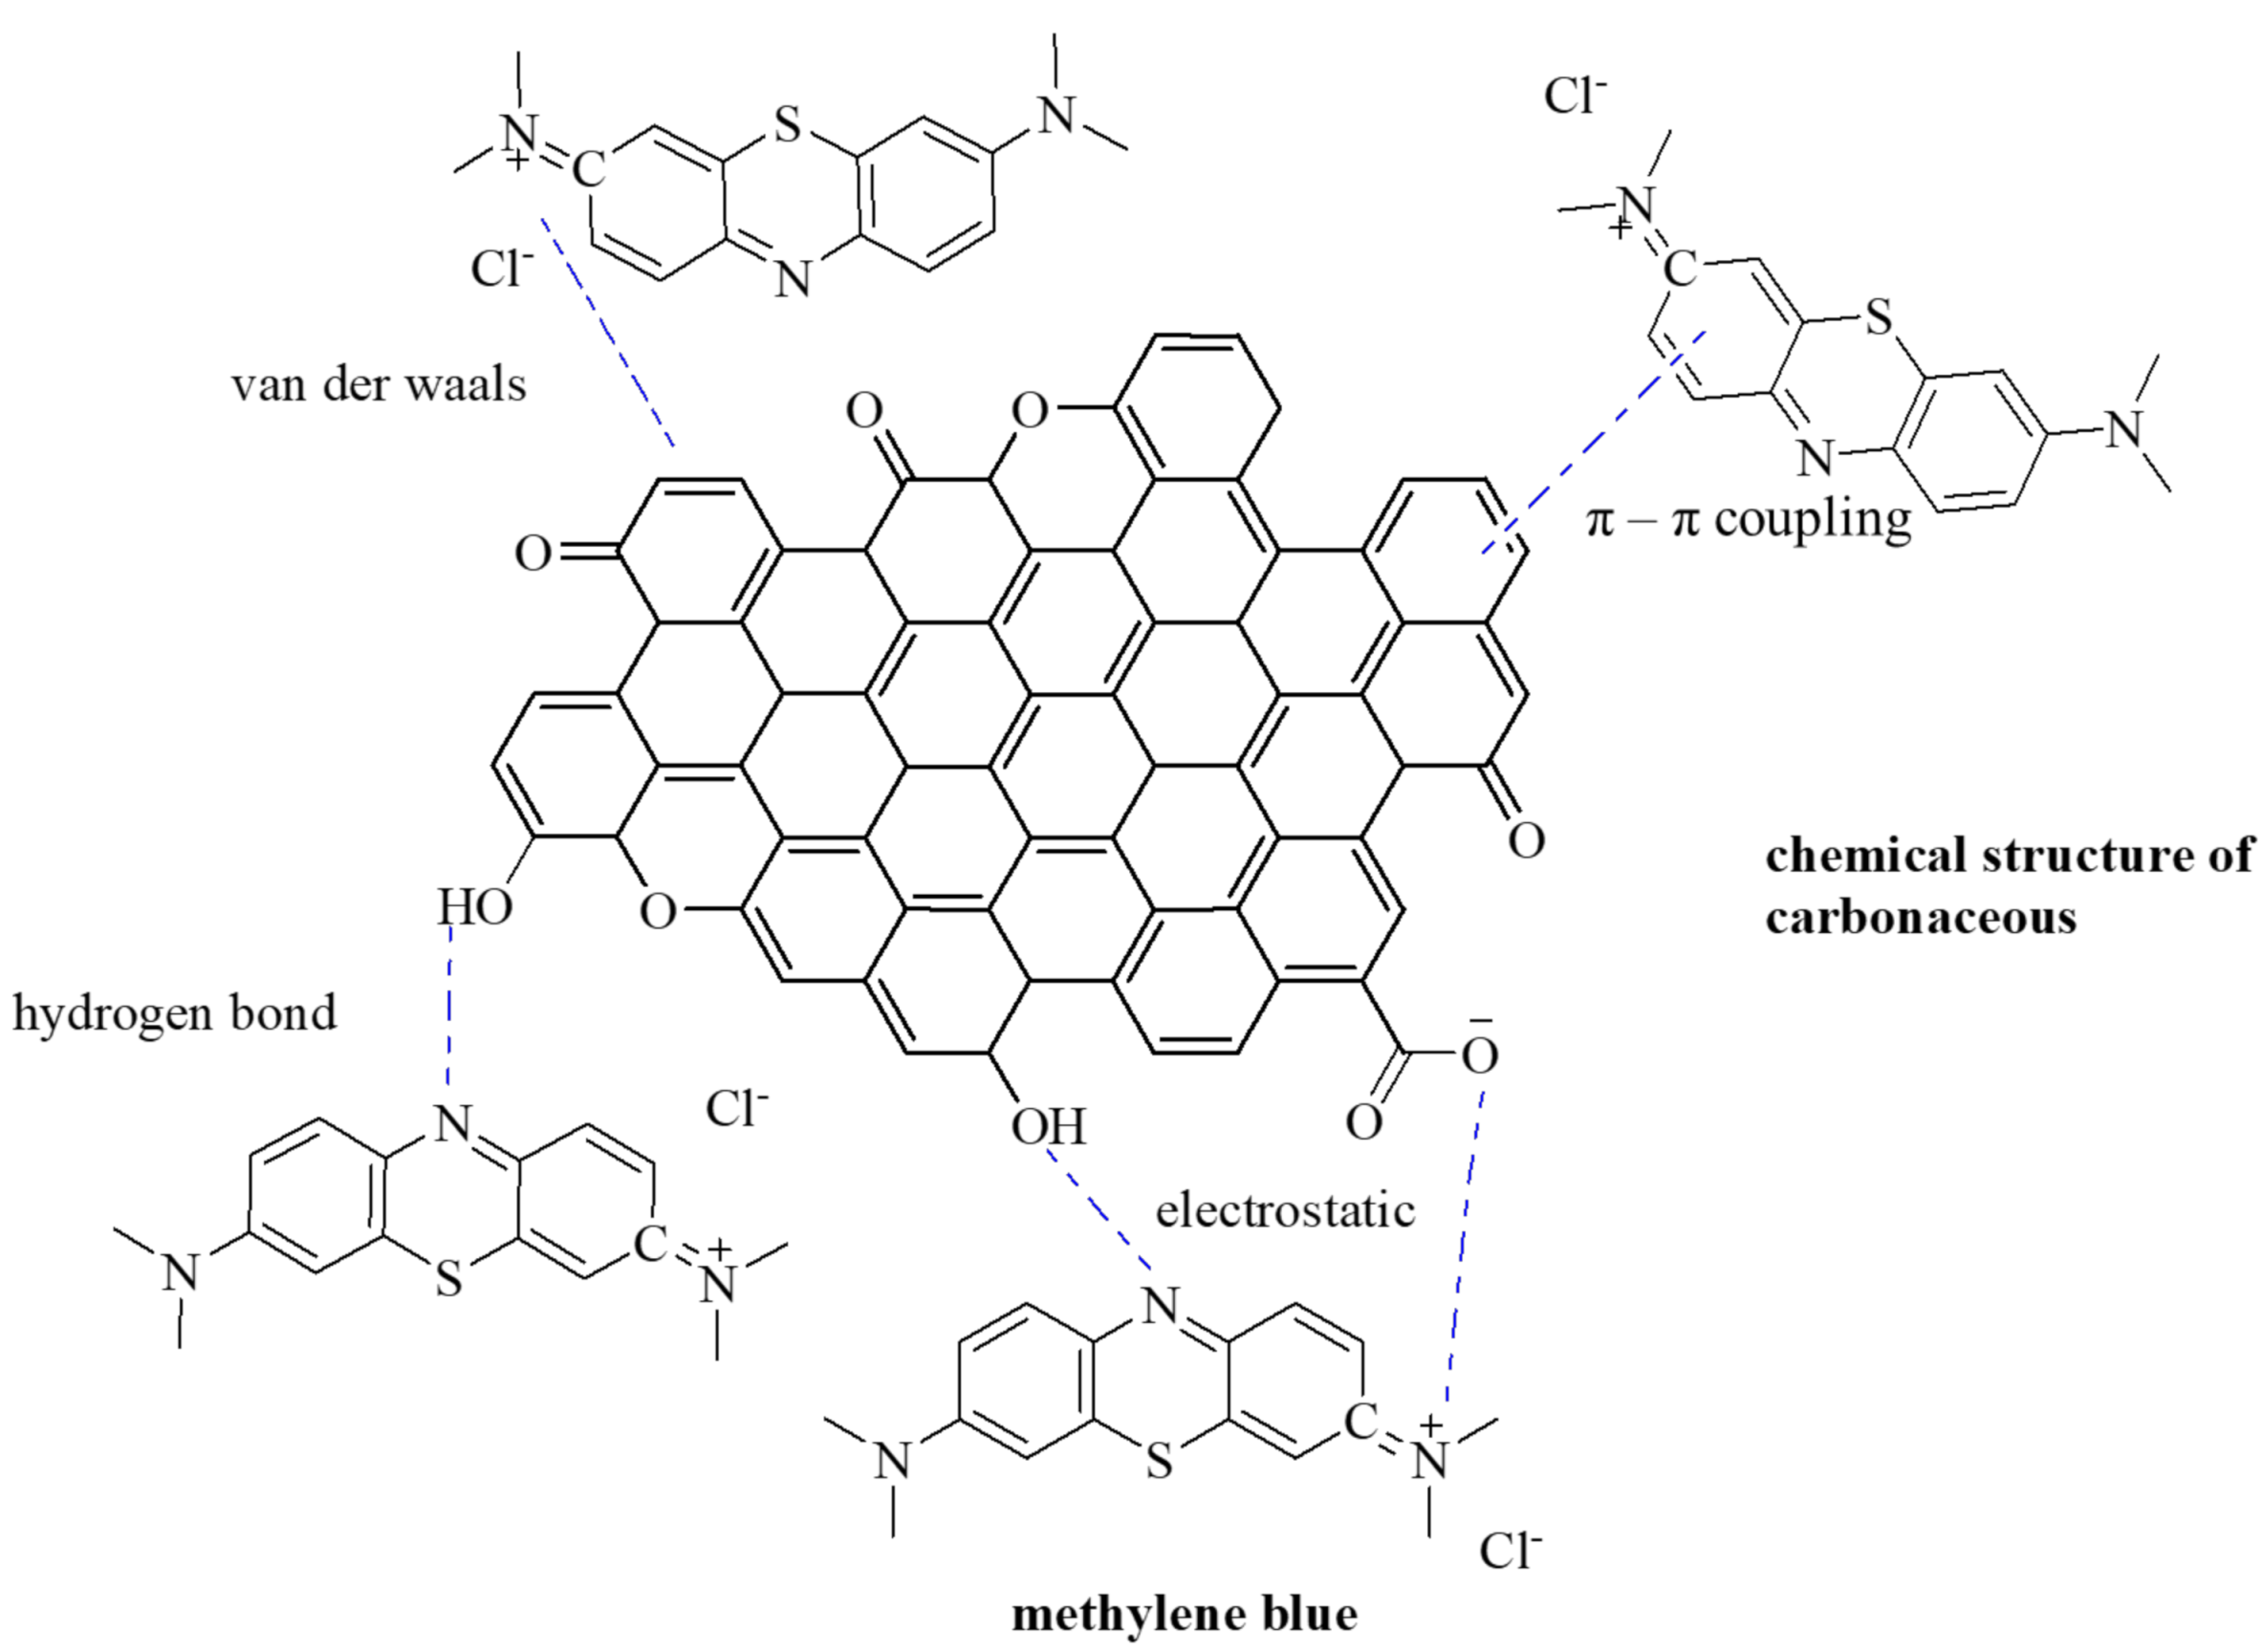
3. Results and Discussion

The bagasse was taken from a sugarcane factory located in Kudus, Central Java, Indonesia, during production time. EDX analysis found that the bagasse contained C, O, and Si with a composition of 43.47%, 56.08%, and 0.45%, respectively. The EDX spectra along with the optical and SEM images are depicted in Figure 1a, and the higher magnification SEM images are described in Figure 1b. SEM image shows cell wall flakes with some pits rarely spread on the wall.
Thermal analysis of the bagasse provided the DTA–TGA curve as described in Figure 2. An exothermic peak revealed on the DTA curve at 304.2 °C was attributed to the decomposition of cellulose and hemicellulose in bagasse [35] in the range of 243.6–309.5 °C, providing 8.43% of mass loss. Another exothermic peak revealed at 417 °C indicated decomposition of lignin in bagasse, which hovered along 309.5–495 °C, caused, 9.05% mass loss, and remained carbon at above 495 °C. Considering the thermal analysis results, carbonization or the burning step to produce char was conducted at 600 °C.
Carbonization at 600 °C under N2 flow produced a black char, as described in the optical image (Figure 3a). The carbonization yield was 26.43% of the initial weight of bagasse, which was different than the TGA curve, as shown in Figure 2, in which only 17.48% content was released during heat treatment, leaving carbon at around 80%. The TG analysis was operated using a sample flask under vacuum; therefore, the sample was heated without any interactions with gas molecules in order to maintain carbon at rest. Moreover, during carbonization at 600 °C, most of the volatile components were released as pyrolysis gases [36], which was carried out by nitrogen flows. The pyrolysis gases were the breakdown products of cellulose, hemicellulose, and lignin [37], in which the C–O and C–C functional groups from the cellulose, hemicellulose, and lignin were thermally broken down to form tar, H2O, CO, and CO2 and flushed out by nitrogen flows.
During activation with steam, the char was in contact with H2O molecules. A thermal analysis of the wet activated-carbon found an exothermic peak centered at 528 °C, indicates the release of the carbon skeleton and CO2 release [38,39], which indicates the interaction between water molecules with C, and the release of products, which causes weight reduction. Moreover, precipitation with NaOH followed by acid and water leaching found ash content of 5.17 ± 0.29%, and the carbon content of carbonized-char was 94.83 ± 0.29%.
The SEM image of the carbonized-product in Figure 3b shows many channels formed in which the channels consisted of pores (Figure 3c) that regularly formed after the degradation of volatile components, cellulose, and lignin during carbonization.
FTIR analysis found that after carbonization, some vibrations of the functional groups revealed, i.e., at 3422–3445 cm−1, belonged to stretching vibrations of hydroxyl O–H and phenol hydroxyl groups [40,41]. The intensity reduction of the O–H vibration peak confirmed the release of water molecules after the carbonization step. A small peak at 2883–2884 cm−1 referred to C–H aliphatic stretching [42,43]. A peak at 1712 cm−1 referred to C=O stretching belonging to aldehydes, carboxylic acids, and ketones of cellulose or hemicellulose [44,45]. A bond stretching of C=C aromatic was revealed at 1592–1570 cm−1. Additionally, a C–O vibration and para substitution of benzene occurred at 1092–1223 cm−1 [40,46]. The intensity reduction of peak intensity of C=C aromatic, C=O stretching, and the C–O vibration confirmed the breakdown of cellulose and lignin during carbonization. The FTIR spectra of carbonized bagasse compare to the raw bagasse is depicted in Figure 4. Detailed comparison of each peak is listed in Table 1 along with the possible source of the functional groups based on some related references. Ash precipitation to carbonized bagasse indicated ash content of 5.17 ± 0.29%, or total carbon content in the carbonized bagasse of 94.83 ± 0.29%. Moreover, the elemental CHN analysis to AC700 found C:H:N:others of 58.65:0.45:0.20:40.70 (%), respectively [47]. The results appeared to be consistent with the TG–DT analysis for the wet activated-carbon that was conducted to understand the interaction between steam or water molecules with the carbon that occurred under activation temperature, which was proven by an exothermic peak centered at 526.88 °C (see Figure 5). This indicated that the decomposition of the carbon skeleton to form CO2 [38,39] caused weight reduction up to 22.62%, as presented in the TG–DTA curve, shown in Figure 6, for the wet activated-carbon at the furnace. Activation at 700 °C produced a carbon yield of 96.54 ± 4.83% from the carbonized bagasse, or 22.84 ± 2.51% of the initial bagasse.
Surface morphology analysis, as shown in Figure 6, found that the activation opened the channels within char blocks and spread over into small pieces, allowing the increase of surface area, as recorded in Table 2.
N2 adsorption analysis found that the carbonized bagasse had only 24.8 m2/g of surface area with a very low total pore volume of 4.0 × 10⁻³ cc/g (Table 2), which indicates that the pores of the carbonized bagasse were wide, with an average diameter of 3.2 nm; however, the channel was short. Activation seemed to clean out the pores, as they became deeper, and the total pore volume was increased, which resulted in a higher surface area, as can be seen in Table 2, in which the AC700 provided the highest total pore volume and surface area. The N2 adsorption isotherm shows that the adsorption isotherm of carbonized bagasse and AC700 followed type IV, indicating mesopores that contributed to the adsorption with pore sizes of 2–50 nm [43,50]. The meso-size pore was suitable for a macromolecule like methylene blue (MB). Even though the carbonized bagasse had the highest pore size of 3.2 nm, the very low surface area, however, caused low adsorption performance. AC700 showed a high surface area of 592.4 ± 0.2 m2/g, even though the surface area was smaller than the carbon from bagasse, which was chemically activated by potassium hydroxide solution, i.e., 1620.69 m2/g [17], as well as with the carbon from bagasse, which was activated with ZnCl2, i.e., 916.134 m2/g [21]. However, the activation with steam was preferable with regards to environmental issues. The MB adsorption on AC700 followed a type IV isotherm, indicating the high contribution of the large pore size. The pore size distribution curve (see Figure 7) showed that the AC700 provided the pore distribution at a larger size over 2 nm. Due to its highest surface area and meso-pores available within the AC700, therefore for adsorption tests with such macromolecule as methylene blue (MB), AC700 was chosen. Another previous adsorption study was conducted for water vapor or as a dehumidifier [47].
The MB adsorption on AC700 for various initial concentrations reaches equilibrium after 30 min (Figure 8). Table 3 lists the equilibrium concentration, Ce, and the mass adsorbed at equilibrium, qe, for each initial concentration, along with the isotherm parameters. The theoretical maximum adsorption capacity of the AC700 adsorbent is 303 mg/g adsorbent, based the surface area of AC700 and the covered area of MB molecules [31]. However, the Langmuir isotherm found a maximum loading of MB molecules on the AC700, a, of 21.008 mg/g.
The large difference between theoretical loading and Langmuir loading, as shown in Table 3, i.e., 21.008 mg/g, confirmed weak interactions between the adsorbate–adsorbent surface. Methylene blue is a macromolecule with a chemical structure as described in Figure 9 [51], and the proposed adsorption mechanism is explained through the interaction between carbon and methylene blue molecules [52]. D–R model application found adsorption energy, E, of 3.536 kJ/mol, confirming physical adsorption because the energy was less than 8 kJ/mol [33]. The interaction of MB molecules with the AC surface is described in Figure 9 considering the high electron density within the π orbital, the electrostatic potential force of N+, and the potential hydrogen bond formation. Those possible interactions were also predicted by other previous publications [52,53,54]. The presence of Cl as counter ion would minimize the interaction between the MB–MB molecules, with the only remaining possibility being hydrogen bonding, because the π–π coupling interaction would also be difficult to form due to the steric effect caused by the surface functional groups of C=N chromophores.
The interaction between the organic compound with carbon can be π → π electron-donor acceptor, hydrophobic interaction, hydrogen bonding, electrostatic and covalent interaction, and Van der Waals forces, which may work individually or simultaneously [55]. The hydrophobic side of carbon provides a high π electron of sp2 carbons, in which MB molecules interact through π–π electron coupling. Moreover, the acidity of the AC surface increases the possibility of electrostatic interactions and the formation of hydrogen bonding between the AC surface and the MB molecules. The AC700 has an acidity value of 40.3060 ± 8.2850 mg NH3/g AC, which is higher than the activated-carbon prepared from fiber (ACF) produced by oxy fluorination, i.e., 31.29 mg NH3/g ACF [56]. The contribution of the surface functional group is supported by the FTIR spectrum before and after MB adsorption (Figure 10). The FTIR spectra of AC700 after MB adsorption shows a new peak at the wavenumber of 1376 cm−1, which is related to the N=O functional group. Additionally, the peaks at 1093, 1570, 2884, and 3446 cm−1 are decreased in terms of peak intensity and shifted to 1117, 1580, 2894, and 3421 cm−1. These results are consistent with previous reports [32,57]. The differences in IR spectra before and after MB adsorption could be connected to the possible interaction of MB functional groups on the activated-carbon surface during the adsorption process [58]. The interaction between organic compound with carbon can be π → π electron-donor acceptor, hydrophobic interaction, hydrogen bonding, electrostatic and covalent interaction, and Van der Waals forces, which could work individually or simultaneously [55]. The hydrophobic side of carbon provides a high π electron of sp2 carbons, in which MB molecules interact through π–π electron coupling. The π–π interaction is specifically in between π systems of carbonaceous material with the C=C or benzene ring of the MB [52]. Concurrently here, MB is a cationic dye that would bear a positive charge within an aqueous solution by releasing Cl ions. The positive part would interact easily with the high electron-rich π orbital [53] or negatively charged surface of carbon using an electrostatic interaction [54]. The π–π interaction is specifically within π systems of carbonaceous material with the C=C or benzene ring of the MB [52]. At the same time, MB is a cationic dye that would bear a positive charge within an aqueous solution by releasing Cl ions. The positive part would interact easily with the high electron-rich π orbital [53] or negatively charged surface of carbon [54], as described in Figure 9.
A kinetic study was applied to the initial adsorption, the adsorption before it reached equilibrium, which was 30 min for this research. After reaching the equilibrium, the adsorption rate is similar to the desorption rate. The kinetics data are listed in Table 4. The linear fitting of the second-order reaction showed a higher adj. R2 indicates that the initial rate of adsorption followed a second-order reaction. The result were similar to the rate of removal of MB onto hydroxyapatite nanoparticles [33]. The adsorption thermodynamic showed negative values of ΔG, confirming a spontaneous and thermodynamically favorable adsorption. It is generally accepted that physisorption occurs between −20 and 0 kJ/mol, while chemisorption is in between −80 and −400 kJ/mol [59]. Moreover, the positive value of the enthalpy changes, 1.48 × 10⁻⁴ kJ/mol indicated endothermic adsorption, and the entropy change of 0.0408 kJ/mol.K confirmed a small increase of irregularity. Table 5 summarizes the literature data on the MB adsorption parameters obtained for different carbon materials.
The diffusion rate was studied by applying a Weber–Morris plot, as shown by Figure 11. The diffusion constant C was not zero. C ≠ 0 indicates the complexity of the adsorption process. The two-linearity on the plots indicates either intra-particle diffusion or external diffusion, the diffusion in between the boundary layer of adsorbent–adsorbate, which controls the process of adsorption [60]. The first step of adsorption was assigned to the transport of MB molecules to the external surface of the AC700, and then the second step was the transport into the micro/mesoporous structure of the adsorbent, followed by the adsorption at the surface of adsorbent or AC700 [61].

4. Conclusions

Carbon powder can be produced from bagasse through carbonization at 600 °C under N2 atmosphere. Activation under 500, 600, and 700 °C by flowing steam provided the increase of surface area from 24.8 ± 0.0 m2/g to 592.4 ± 0.2 m2/g for AC700. The activated-carbon could adsorb methylene blue from aqueous solution with an adsorption capacity of 21.008 mg/g, following a pseudo-second-order adsorption with a rate constant of 0.0201 ± 0.169 min−1. The adsorption is a monolayer following a Langmuir isotherm, with the adsorption energy of 3.536 kJ/mol, which is categorized as a weak physical interaction. It is supported also by a low enthalpy of adsorption, namely 1.48 × 10⁻⁴ kJ/mol. The physical adsorption occurred spontaneously as shown by its negative Gibbs free energy changes. These findings and the proposed chemical mechanism will contribute to provide better understanding of interactions between carbonaceous surfaces and methylene blue.

Author Contributions

Conceptualization, F.R. and T.M.; methodology, F.R.; validation, F.R., A.T.W., and T.M.; formal analysis, A.F.R. and C.; investigation, F.R., C., and A.F.R.; resources, F.R. and A.F.R.; data curation, K.N. and J.M.; writing—original draft preparation, F.R.; writing—review and editing, F.R., A.T.W., J.M., K.N., and T.M.; visualization, F.R. and A.F.R.; supervision, F.R., A.T.W., and T.M.; project administration, T.M. and A.T.W.; funding acquisition, T.M. and A.T.W. All authors have read and agreed to the published version of the manuscript.

Funding

The research is supported by grants from the Bilateral Exchange Program JSPS/DG-RSTHE Joint Research Project 2020 from Japan Society for the Promotion of Science (JSPS) and Directorate General of Resources for Science Technology and Higher Education (DG-RSTHE) of the Indonesian Government.

Institutional Review Board Statement

Not applicable.

Informed Consent Statement

Not applicable.

Data Availability Statement

Data sharing not applicable.

Conflicts of Interest

The authors declare no conflict of interest.

References

  1. Sultan, M.; Miyazaki, T.; Koyama, S. Optimization of Adsorption Isotherm Types for Desiccant Air-Conditioning Applications. Renew. Energy 2018, 121, 441–450. [Google Scholar] [CrossRef]
  2. Yaningsih, I.; Wijayanta, A.T.; Thu, K.; Miyazaki, T. Influence of Phase Change Phenomena on the Performance of a Desiccant Dehumidification System. Appl. Sci. 2020, 10, 868. [Google Scholar] [CrossRef] [Green Version]
  3. Oktariani, E.; Tahara, K.; Nakashima, K.; Noda, A.; Xue, B.; Wijayanta, A.T.; Nakaso, K.; Fukai, J. Experimental Investigation on the Adsorption Process for Steam Generation Using a Zeolite-Water System. J. Chem. Eng. Jpn. 2012, 45, 355–362. [Google Scholar] [CrossRef]
  4. Xue, B.; Tahara, K.; Nakashima, K.; Noda, A.; Oktariani, E.; Wijayanta, A.T.; Nakaso, K.; Fukai, J. Numerical Simulation for Steam Generation Process in a Novel Zeolite-Water Adsorption Heat Pump. J. Chem. Eng. Jpn. 2012, 45, 408–416. [Google Scholar] [CrossRef]
  5. Fukai, J.; Wijayanta, A.T. Potential Ability of Zeolite to Generate High-Temperature Vapor Using Waste Heat. AIP Conf. Proc. 2018, 1931, 020001. [Google Scholar] [CrossRef]
  6. Xu, Y.; Chai, X. Characterization of Coal Gasification Slag-Based Activated Carbon and Its Potential Application in Lead Removal. Environ. Technol. 2018, 39, 382–391. [Google Scholar] [CrossRef]
  7. Uraki, Y.; Tamai, Y.; Ogawa, M.; Gaman, S.; Tokurad, S. Preparation of Activated Carbon from Peat. BioResources 2009, 4, 205–213. [Google Scholar] [CrossRef]
  8. Yorgun, S.; Yildiz, D. Preparation and Characterization of Activated Carbons from Paulownia Wood by Chemical Activation with H3PO4. J. Taiwan Inst. Chem. Eng. 2015, 53, 122–131. [Google Scholar] [CrossRef]
  9. Laine, J.; Simoni, S.; Calles, R. Preparation of Activated Carbon from Coconut Shell in a Small Scale Cocurrent Flow Rotary Kiln. Chem. Eng. Commun. 1999, 99, 15–23. [Google Scholar] [CrossRef]
  10. Chairunnisa Mikšík, F.; Miyazaki, T.; Thu, K.; Miyawaki, J.; Nakabayashi, K.; Wijayanta, A.T.; Rahmawati, F. Enhancing Water Adsorption Capacity of Acorn Nutshell Based Activated Carbon for Adsorption Thermal Energy Storage Application. Energy Rep. 2020. [Google Scholar] [CrossRef]
  11. Zhao, W.; Luo, L.; Wang, H.; Fan, M. Synthesis of Bamboo-Based Activated Carbons with Super-High Specific Surface Area for Hydrogen Storage. BioResources 2017, 12, 1246–1262. [Google Scholar] [CrossRef] [Green Version]
  12. Rosson, E.; Garbo, F.; Marangoni, G.; Bertani, R.; Lavagnolo, M.C.; Moretti, E.; Talon, A.; Mozzon, M.; Sgarbossa, P. Activated Carbon from Spent Coffee Grounds: A Good Competitor of Commercial Carbons for Water Decontamination. Appl. Sci. 2020, 10, 5598. [Google Scholar] [CrossRef]
  13. Hajiha, H.; Sain, M. The Use of Sugarcane Bagasse Fibres as Reinforcements in Composites. Biofiber Reinf. Compos. Mater. 2014, 525–549. [Google Scholar] [CrossRef]
  14. Huang, Z.; Wang, N.; Zhang, Y.; Hu, H.; Luo, Y. Composites: Part A Effect of Mechanical Activation Pretreatment on the Properties of Sugarcane Bagasse/Poly (Vinyl Chloride) Composites. Compos. Part A 2012, 43, 114–120. [Google Scholar] [CrossRef]
  15. Azmi, N.B.; Bashir, M.J.K.; Sethupathi, S.; Aun, C.N.; Lam, G.C. Optimization of Preparation Conditions of Sugarcane Bagasse Activated Carbon via Microwave-Induced KOH Activation for Stabilized Landfill Leachate Remediation. Environ. Earth Sci. 2016, 75, 902. [Google Scholar] [CrossRef]
  16. Wirawan, R.; Sapuan, S.M. Sugarcane Bagasse-Filled Poly (Vinyl Chloride) Composites; Elsevier Ltd.: Amsterdam, The Netherlands, 2018. [Google Scholar] [CrossRef]
  17. Foo, K.Y.; Lee, L.K.; Hameed, B.H. Bioresource Technology Preparation of Activated Carbon from Sugarcane Bagasse by Microwave Assisted Activation for the Remediation of Semi-Aerobic Landfill Leachate. Bioresour. Technol. 2013, 134, 166–172. [Google Scholar] [CrossRef]
  18. Rahmawati, F.; Wahyuningsih, S.; Irianti, D. The Photocatalytic Activity of SiO2-TiO2/Graphite and Its Composite with Silver and Silver Oxide. Bull. Chem. React. Eng. Catal. 2014, 9, 45–52. [Google Scholar] [CrossRef]
  19. Rahmawati, F.; Yuliati, L.; Alaih, I.S.; Putri, F.R.; Rahmawati, F. Carbon Rod of Zinc-Carbon Primary Battery Waste as a Substrate for CdS and TiO2 Photocatalyst Layer for Visible Light Driven Photocatalytic Hydrogen Production. Biochem. Pharmacol. 2017. [Google Scholar] [CrossRef]
  20. Carey, J.; Silva, S.R. Carbon Based Electronic Materials: Applications in Electron Field Emission. J. Mater. Sci. Mater. Electron. 2006, 17, 405–412. [Google Scholar] [CrossRef] [Green Version]
  21. Luo, X.; Cai, Y.; Zeng, J. Cr (VI) Adsorption Performance and Mechanism of an Effective Activated Carbon Prepared from Bagasse with a One-Step Pyrolysis and ZnCl 2 Activation Method. Cellulose 2019, 26, 4921–4934. [Google Scholar] [CrossRef]
  22. Chaiwon, T.; Channei, D. Study of Adsorption Behavior of Methyl Orange Dye on Activated Carbon Prepared from Sugarcane Bagasse via Chemical Activation. Carbon Sci. Technol. 2017, 9, 32–38. [Google Scholar]
  23. Tao, H.; Zhang, H.; Li, J.; Ding, W. Biomass Based Activated Carbon Obtained from Sludge and Sugarcane Bagasse for Removing Lead Ion from Wastewater. Bioresour. Technol. 2015, 192, 611–617. [Google Scholar] [CrossRef] [PubMed]
  24. Solís-fuentes, J.A.; Galán-méndez, F.; Hernández-medel, M.R.; García-gómez, R.S.; Bernal-gonzález, M.; Mendoza-pérez, S.; Durán-domínguez-de-bazúa, C. Food Bioscience Effectiveness of Bagasse Activated Carbon in Raw Cane Juice Clarification. Food Biosci. 2019, 32, 100437. [Google Scholar] [CrossRef]
  25. Xia, J.; Noda, K.; Kagawa, S.; Wakao, N. Production of Activated Carbon from Bagasse (Waste) of Sugarcane Grown in Brazil. J. Chem. Eng. Jpn. 1998, 31, 987–990. [Google Scholar] [CrossRef]
  26. Jaguaribe, E.F.; Medeiros, L.L.; Barreto, M.C.S.; Araujo, L.P. The Performance of Activated Carbons from Sugarcane Bagasse, Babassu, and Coconut Shells in Removing Residual Chlorine. Braz. J. Chem. Eng. 2005, 22, 41–47. [Google Scholar] [CrossRef]
  27. Demiral, H.; Demiral, I.; Tümsek, F. Chemical Engineering Research and Design Production of Activated Carbon from Olive Bagasse by ˙ Lknur Demiral, Belgin Karabacako Glu. Chem. Eng. Res. Des. 2010, 9, 206–213. [Google Scholar] [CrossRef]
  28. Purnomo, C.W.; Salim, C.; Hinode, H. Effect of the Activation Method on the Properties and Adsorption Behavior of Bagasse Fly Ash-Based Activated Carbon. Fuel Process. Technol. 2012, 102, 132–139. [Google Scholar] [CrossRef]
  29. Muthmann, J.; Bläker, C.; Pasel, C.; Luckas, M.; Schledorn, C.; Bathen, D. Characterization of Structural and Chemical Modifications during the Steam Activation of Activated Carbons. Microporous Mesoporous Mater. 2020, 309. [Google Scholar] [CrossRef]
  30. Khayyun, T.S.; Ayad, H.M. Comparison of the Experimental Results with the Langmuir and Freundlich Models for Copper Removal on Limestone Adsorbent. Appl. Water Sci. 2019, 9, 1–8. [Google Scholar] [CrossRef] [Green Version]
  31. Kipling, J.J.; Wilson, R.B. Adsorption of Methylene Blue in the Determination of Surface Areas. J. Appl. Chem. 1960, 10, 109–113. [Google Scholar]
  32. Pathania, D.; Sharma, S.; Singh, P. Removal of Methylene Blue by Adsorption onto Activated Carbon Developed from Ficus Carica Bast. Arab. J. Chem. 2017, 10, S1445–S1451. [Google Scholar] [CrossRef] [Green Version]
  33. Wei, W.; Yang, L.; Zhong, W.H.; Li, S.Y.; Cui, J.; Wei, Z.G. Fast Removal of Methylene Blue from Aqueous Solution by Adsorption onto Poorly Crystalline Hydroxyapatite Nanoparticles. Dig. J. Nanomater. Biostruct. 2015, 10, 1343–1363. [Google Scholar]
  34. De Oliveira Brito, S.M.; Adrade, H.M.C.; Soares, L.F.; de Azevedo, R.P. Brazil Nut Shells as a New Biosorbent to Remove Methylene Blue and Indigo Carmine from Aqueous Solutions. J. Hazard. Mater. 2010, 174, 84–92. [Google Scholar] [CrossRef] [PubMed]
  35. Varma, A.K.; Mondal, P. Physicochemical Characterization and Pyrolysis Kinetic Study of Sugarcane Bagasse Using Thermogravimetric Analysis. J. Energy Resour. Technol. Trans. ASME 2016, 138, 1–11. [Google Scholar] [CrossRef]
  36. Bergna, D.; Varila, T.; Romar, H.; Lassi, U. Comparison of the Properties of Activated Carbons Produced in One-Stage and Two-Stage Processes. C J. Carbon Res. 2018, 4, 41. [Google Scholar] [CrossRef] [Green Version]
  37. Antal, M.; Gronly, M. The Art, Science, and Technology of Charcoal Production. Ind. Eng. Chem. Res. 2003, 42, 1619–1640. [Google Scholar] [CrossRef]
  38. De Oliveira, G.F.; De Andrade, R.C.; Trindade, M.A.G.; Andrade, H.M.C.; De Carvalho, C.T. Thermogravimetric and Spectroscopic Study (Tg-DTA/FT-IR) of Activated Carbon from the Renewable Biomass Source Babassu. Quim. Nova 2017, 40, 284–292. [Google Scholar] [CrossRef]
  39. De Andrade, R.C.; Menezes, R.S.G.; Fiuza, R.A., Jr.; Andrade, H.M.C. Activated Carbon Microspheres Derived from Hydrothermally Treated Mango Seed Shells for Acetone Vapor Removal. Carbon Lett. 2020, 1–15. [Google Scholar] [CrossRef]
  40. Sun, S.; Yu, Q.; Li, M.; Zhao, H.; Wu, C. Preparation of Coffee-Shell Activated Carbon and Its Application for Water Vapor Adsorption. Renew. Energy 2019, 142, 11–19. [Google Scholar] [CrossRef]
  41. Guo, F.; Jiang, X.; Jia, X.; Liang, S.; Qian, L.; Rao, Z. Synthesis of Biomass Carbon Electrode Materials by Bimetallic Activation for the Application in Supercapacitors. J. Electroanal. Chem. 2019, 844, 105–115. [Google Scholar] [CrossRef]
  42. Puziy, A.M.; Poddubnaya, O.I.; Martínez-Alonso, A.; Suárez-García, F.; Tascón, J.M.D. Synthetic Carbons Activated with Phosphoric-Acid I. Surface Chemistry and Ion Binding Properties. Carbon N. Y. 2002, 40, 1493–1505. [Google Scholar] [CrossRef]
  43. Zhang, L.; Tu, L.Y.; Liang, Y.; Chen, Q.; Li, Z.S.; Li, C.H.; Wang, Z.H.; Li, W. Coconut-Based Activated Carbon Fibers for Efficient Adsorption of Various Organic Dyes. RSC Adv. 2018, 8, 42280–42291. [Google Scholar] [CrossRef] [Green Version]
  44. Ahmed Baloch, H.; Nizamuddin, S.; Siddiqui, M.T.H.; Mubarak, N.M.; Dumbre, D.K.; Srinivasan, M.P.; Griffin, G.J. Sub-Supercritical Liquefaction of Sugarcane Bagasse for Production of Bio-Oil and Char: Effect of Two Solvents. J. Environ. Chem. Eng. 2018, 6, 6589–6601. [Google Scholar] [CrossRef]
  45. Shamsuddin, M.S.; Yusoff, N.R.N.; Sulaiman, M.A. Synthesis and Characterization of Activated Carbon Produced from Kenaf Core Fiber Using H3PO4 Activation. Procedia Chem. 2016, 19, 558–565. [Google Scholar] [CrossRef] [Green Version]
  46. Wu, J.; Xia, H.; Zhang, L.; Xia, Y.; Peng, J.; Wang, S.; Zheng, Z.; Zhang, S. Effect of Microwave Heating Conditions on the Preparation of High Surface Area Activated Carbon from Waste Bamboo. High Temp. Mater. Process. 2015, 34, 667–674. [Google Scholar] [CrossRef]
  47. Ridassepri, A.F.; Rahmawati, F.; Heliani, K.R.; Miyawaki, J.; Wijayanta, A.T. Activated Carbon from Bagasse and Its Application for Water Vapor Adsorption. Evergr. Jt. J. Nov. Carbon Resour. Green Asia Strateg. 2020, 7, 409–416. [Google Scholar] [CrossRef]
  48. Plermjai, K.; Boonyarattanakalin, K.; Mekprasart, W.; Pavasupree, S.; Phoohinkong, W.; Pecharapa, W. Extraction and Characterization of Nanocellulose from Sugarcane Bagasse by Ball-Milling-Assisted Acid Hydrolysis. AIP Conf. Proc. 2018, 2010. [Google Scholar] [CrossRef]
  49. Kumar, A.; Negi, Y.S.; Choudhary, V.; Bhardwaj, N.K. Characterization of Cellulose Nanocrystals Produced by Acid-Hydrolysis from Sugarcane Bagasse as Agro-Waste. J. Mater. Phys. Chem. 2014, 2, 1–8. [Google Scholar] [CrossRef]
  50. Thommes, M.; Kaneko, K.; Neimark, A.V.; Olivier, J.P.; Rodriguez-Reinoso, F.; Rouquerol, J.; Sing, K.S.W. Physisorption of Gases, with Special Reference to the Evaluation of Surface Area and Pore Size Distribution (IUPAC Technical Report). Pure Appl. Chem. 2015, 87, 1051–1069. [Google Scholar] [CrossRef] [Green Version]
  51. Ahmad, T.; Danish, M.; Rafatullah, M.; Ghazali, A.; Sulaiman, O.; Hashim, R.; Nasir, M.; Ibrahim, M. The Use of Date Palm as a Potential Adsorbent for Wastewater Treatment: A Review. Environ. Sci. Pollut. Res. 2012, 19, 1464–1484. [Google Scholar] [CrossRef]
  52. Ghaffar, A.; Younis, M.N. Interaction and Thermodynamics of Methylene Blue Adsorption on Oxidized Multi-Walled Carbon Nanotubes. Green Process. Synth. 2015, 4, 209–217. [Google Scholar] [CrossRef]
  53. Wu, T.; Cai, X.; Tan, S.; Li, H.; Liu, J.; Yang, W. Adsorption Characteristics of Acrylonitrile, p-Toluenesulfonic Acid, 1-Naphthalenesulfonic Acid and Methyl Blue on Graphene in Aqueous Solutions. Chem. Eng. J. 2011, 173, 144–149. [Google Scholar] [CrossRef]
  54. Kuang, Y.; Zhang, X.; Zhou, S. Adsorption of Methylene Blue in Water onto Activated Carbon by Surfactant Modification. Water 2020, 12, 587. [Google Scholar] [CrossRef] [Green Version]
  55. Yang, K.; Xing, B. Adsorption of Organic Compounds by Carbon Nanomaterials in Aqueous Phase: Polanyi Theory and Its Application. Chem. Rev. 2010, 110, 5989–6008. [Google Scholar] [CrossRef] [PubMed]
  56. Park, S.J.; Kim, B.J. Ammonia Removal of Activated Carbon Fibers Produced by Oxyfluorination. J. Colloid Interface Sci. 2005, 291, 597–599. [Google Scholar] [CrossRef]
  57. Üner, O.; Geçgel, Ü.; Bayrak, Y. Adsorption of Methylene Blue by an Efficient Activated Carbon Prepared from Citrullus Lanatus Rind: Kinetic, Isotherm, Thermodynamic, and Mechanism Analysis. Water Air Soil Pollut. 2016. [Google Scholar] [CrossRef]
  58. Bulgariu, L.; Escudero, L.B.; Bello, O.S.; Iqbal, M.; Nisar, J.; Adegoke, K.A.; Alakhras, F.; Kornaros, M.; Anastopoulos, I. The Utilization of Leaf-Based Adsorbents for Dyes Removal: A Review. J. Mol. Liq. 2019, 276, 728–747. [Google Scholar] [CrossRef] [Green Version]
  59. Chen, H.; Zhao, J. Silkworm Exuviae—A New Non-Conventional and Low-Cost Adsorbent for Removal of Methylene Blue from Aqueous Solutions. J. Hazard. Mater. 2011, 186, 1320–1327. [Google Scholar] [CrossRef]
  60. Cheung, W.H.; Szeto, Y.S.; McKay, G. Intraparticle Diffusion Processes during Acid Dye Adsorption onto Chitosan. Bioresour. Technol. 2007, 98, 2897–2904. [Google Scholar] [CrossRef]
  61. Mohan, D.; Gupta, V.K.; Srivastava, S.K.; Chander, S. Kinetics of Mercury Adsorption from Wastewater Using Activated Carbon Derived from Fertilizer Waste. Colloids Surf. A Physicochem. Eng. Asp. 2001, 177, 169–181. [Google Scholar] [CrossRef]
  62. Liu, Q.X.; Zhou, Y.R.; Wang, M.; Zhang, Q.; Ji, T.; Chen, T.Y.; Yu, D.C. Adsorption of Methylene Blue from Aqueous Solution onto Viscose-Based Activated Carbon Fiber Felts: Kinetics and Equilibrium Studies. Adsorpt. Sci. Technol. 2019, 37, 312–332. [Google Scholar] [CrossRef] [Green Version]
  63. Gao, J.J.; Qin, Y.B.; Zhou, T.; Cao, D.D.; Xu, P.; Hochstetter, D.; Wang, Y.F. Adsorption of Methylene Blue onto Activated Carbon Produced from Tea (Camellia Sinensis L.) Seed Shells: Kinetics, Equilibrium, and Thermodynamics Studies. J. Zhejiang Univ. Sci. B 2013, 14, 650–658. [Google Scholar] [CrossRef] [PubMed] [Green Version]
  64. Bello, M.O.; Abdus-Salam, N.; Adekola, F.A.; Pal, U. Isotherm and Kinetic Studies of Adsorption of Methylene Blue Using Activated Carbon from Ackee Apple Pods. Chem. Data Collect. 2020, 31, 100607. [Google Scholar] [CrossRef]
  65. Yener, J.; Kopac, T.; Dogu, G.; Dogu, T. Dynamic Analysis of Sorption of Methylene Blue Dye on Granular and Powdered Activated Carbon. Chem. Eng. J. 2008, 144, 400–406. [Google Scholar] [CrossRef]
Figure 1. (a) EDX result of bagasse along with its optical and SEM images and (b) the higher magnification of SEM images.
Applsci 11 00678 g001
Figure 2. DTA–TGA curve of bagasse.
Applsci 11 00678 g002
Figure 3. The optical image of carbonized bagasse (a), and SEM images of carbonized bagasse at different magnification: (b) 1000× and (c) 5000×.
Applsci 11 00678 g003
Figure 4. FTIR of the bagasse and the carbonized bagasse.
Applsci 11 00678 g004
Figure 5. TG–DTA curve of the wet activated-carbon shows two steps of mass loss.
Applsci 11 00678 g005
Figure 6. SEM images of the carbonized-carbon and the activated-carbon at 500 °C (AC500), 600 °C (AC600), 700 °C (AC700).
Applsci 11 00678 g006
Figure 7. The pore distribution curve of the activated-carbon compared with the carbonized bagasse.
Applsci 11 00678 g007
Figure 8. The adsorption curves at various time and three conditions of initial MB concentration.
Applsci 11 00678 g008
Figure 9. Scheme of the proposed-interaction between carbonaceous surface and methylene blue.
Applsci 11 00678 g009
Figure 10. FTIR spectrum of AC700: before and after MB adsorption.
Applsci 11 00678 g010
Figure 11. Weber–Morris plots for adsorption at various temperatures.
Applsci 11 00678 g011
Table 1. Peaks of vibration detected by FTIR analysis to the carbonized bagasse.
Functional GroupWavenumber (cm−1)SourceReferences
BagasseChar
C–O asymmetric stretching1053-cellulose/hemicellulose[48]
C–O–C asymmetric stretching1162-cellulose/hemicellulose[13,48]
C–O stretching12471223lignin[48,49]
C=C aromatic1512, 1608, 16321592lignin[49]
C=O stretching from vibration17331712cellulose, hemicellulose, and lignin[44,45]
C–H stretching2856, 29212884polysaccharides[13]
O–H stretching34213422polysaccharides/cellulose[13,49]
Table 2. Surface area (m2/g), total pore volume (cc/g), and the average pore size (nm) of the prepared samples.
The Prepared MaterialsSurface Area
Multi Point BET (m2/g)
Total Pore Volume
(×10−1 cc/g)
Average Pore Size (nm)
Carbonized bagasse24.8 ± 0.00.43.2
AC500366.7 ± 0.12.11.1
AC600465.6 ± 0.12.91.2
AC700592.4 ± 0.24.71.6
Table 3. The isotherm parameters.
IsothermParametersValue
Langmuira (mg/g)21.008 ± 0.021
b (L/mg)0.685 ± 0.001
R20.999
FreundlichKF1.076 ± 0.327
1/n0.881 ± 0.268
R20.696
D–RB (J/mol)−2(−4 ± 0.220) × 10−8
E (kJ/mol)3.536 ± 0.194
R20.945
Table 4. The kinetics of adsorption and thermodynamics of adsorption.
Kinetics of Adsorption
OrderRate Constant (min−1)R2Sum of Square (χ2)
1st0.031 ± 0.0030.9470.031
2nd0.020 ± 0.0020.9690.006
Thermodynamics of Adsorption
T (K)ΔG (kJ/mol.K)ΔH (kJ/mol)ΔS (kJ/mol.K)
298−1.1051.48 × 10−40.041
313−1.750
318−1.543
323−2.660
Table 5. The summarized literature data on MB adsorption onto carbon materials.
PrecursorsActivating AgentIsothermKinetic of AdsorptionThermodynamics of AdsorptionRef.
Langmuir
qmax (mg/g)
Freundlich
1/n
ΔH
(kJ/mol)
ΔG
(kJ/mol)
ΔS
(kJ/mol)
Citrullus lanatus rind ZnCl2 231.480 0.136Pseudo-second-order 23.83 −3.07 90.23 [57]
Viscose fibers Water vapor pretreated by diammonium phosphate 256.13 0.0669 Pseudo-second-order---[62]
Tea seed shells ZnCl2 324.7 0.1010 Pseudo-second-order−26.80−1.720−84.64[63]
Ficus caricaH2SO447.620.398Pseudo-second-order21.550−1.5576.24[32]
Ackee apple pods ZnCl246.950.2624Pseudo-second-order---[64]
Nuchar WWH (commercial) - 21.50 0.370----[65]
BagasseWater vapor21.008 ± 0.0210.881 ± 0.268Pseudo-second-order(−4 ± 0.220) × 10−8−1.1050.0408Present work
Publisher’s Note: MDPI stays neutral with regard to jurisdictional claims in published maps and institutional affiliations.

