Article

The Effect of Freeze-Drying on the Properties of Polish Vegetable Soups

by
Ewa Jakubczyk
* and
Aleksandra Jaskulska
Department of Food Engineering and Process Management, Institute of Food Sciences, Warsaw University of Life Sciences (WULS_SGGW), 02-787 Warsaw, Poland
*
Author to whom correspondence should be addressed.
Appl. Sci. 2021, 11(2), 654; https://doi.org/10.3390/app11020654
Submission received: 7 December 2020 / Revised: 7 January 2021 / Accepted: 8 January 2021 / Published: 11 January 2021
(This article belongs to the Special Issue Drying Technologies in Food Processing)

Abstract

:
The aim of this study was to investigate selected physical and biochemical properties of four vegetable freeze-dried soups. The water content, water activity, pH, color parameters, antioxidant activity (EC50), total polyphenolic content of fresh tomato, pumpkin, beetroot, and cucumber, and freeze-dried soups were measured. Sensory analysis was applied to compare sensory attributes of fresh and rehydrated soups. The sorption isotherms of freeze-dried soups were obtained with the application of the static and dynamic vapor sorption (DVS) method. The application of the freeze-drying method enabled the obtaining of dry soups with a low water content of 2–3%. The drying caused a significant change of color of all soups. The redness of soups decreased after drying for the beetroot soups from +39.64 to +21.91. The lower chroma value of 25.98 and the highest total color change ΔE*ab = 36.74 were noted for freeze-dried beetroot soup. The antioxidation activity and total polyphenolic content were reduced after drying, especially for the cucumber and tomato soups. The Peleg model was selected to describe the sorption isotherms of dried soups. The sorption isotherm of freeze-dried cucumber and beetroot soups had a sigmoidal shape of type II. The shape of the moisture sorption isotherm for freeze-dried tomato and pumpkin soups corresponded more with type III isotherms. The DVS method can be used to characterize the moisture sorption isotherms of freeze-dried products.

1. Introduction

Soups are made by combining different ingredients such as vegetables, poultry, meat, or seafood. The selected compounds are boiled in water until the flavors are extracted. Food manufacturers supply a wide range of these products on the market: smooth and particulate soups, clear soups (broth, bouillons), as well as soups thickened with milk, cream, and vegetable purees [1].
The food industry offers soups in the form of powder, liquid, or canned [2]. Powder soups can be prepared by mixing different dry powdered ingredients, such as ground dried vegetables, spices, flavors, and yeast extracts with oil and fat powder [3]. Dried soup powder can be stored for a long time (6–12 months) at room temperature because enzymatic and oxidative spoilage is restricted [4]. Powder soup also has advantages such as being available throughout the year and readiness for rehydration [5]. However, this technology includes the soaking (e.g., lentil, chickpea), blanching, cooking, and drying of different vegetables separately. Then dried vegetables are milled, sieved, and blended to formulate dry soup mixtures [5,6]. Drying methods and grinding conditions greatly influence the quality of vegetable ingredients [7]. Dehydration methods of vegetables include convective [8,9,10], vacuum [11,12], microwave [13,14], desiccant [15,16], ultrasonic [17,18,19], infrared [20,21], freeze-drying [22,23], as well as osmotic dehydration [24,25] and hybrid (or combination) [10,26,27] drying. Mondal et al. [28] obtained different instant soups composed of corn flour, milk powder, and leafy vegetable powders. Three leafy vegetables namely Kolmou, Jatilao, and Pui were dried separately using the air-drying technique at temperature 50–70 °C, and then milled. The same drying method was also used to prepare the soup mixtures, which contained green pea, chickpea, lentil, potatoes, tomatoes, carrot. After drying, all vegetables were milled into powdered form and mixed with seasonings [6]. Soy–mushroom–moringa soup powder was prepared by mixing of soy flour mushroom and moringa leaf powder. The mushroom and soybean were dried in a convective-dryer but moringa leaves were dried with the application of a solar-dryer [5]. Spray-drying technique was selected to produce the mushroom (paste)-whey soup powder [29] and powdered product from soup, which consisted of an extract from ham byproducts [30]. The mixtures of instant soup powders were also prepared by mixing the grounded ingredients (particles of chickpea, mushroom, parsley, dill, celery freeze-dried individually) with olive oil and corn starch [22].
The dried soups with the pieces of vegetable can be obtained by preparation of a soup with the vegetable ingredients and drying of the product. Recent studies show that these kinds of soups have been dried by freeze-drying or with application of hybrid drying methods [31,32,33,34]. Wang et al. [31,35] applied the microwave-freeze-dried technology to obtain the instant vegetable soups. The vegetable soup mix contained cabbage, tomato, carrot, spinach and mushroom, water, salt, sugar, and sodium glutamate, and was cooked, cooled, and frozen. The soups were freeze-dried (at a pressure of 100 Pa) with the microwave heating system at frequency 2450 MHz. Liu et al. [34] explored the hybrid strategy for preparation of dried soups. The frozen soups with pieces of mushroom and bacon were dehydrated by freeze-drying (at a shelf temperature of 30, 50 and 70 °C) and using microwave drying. The freeze-drying method was applied to obtain different instant vegetable and meat soups [32,33]. Freeze-dried soups with chopped vegetables exhibited significantly higher rehydration ratios than products with pieces of vegetables, meat, or fish [32].
Presently, consumers expect high-quality meals, which can be prepared in a short time. Instant soup obtained with the application of the freeze-drying process can be a product that meets these requirements [31]. Freeze-drying is a gentle dehydration method, which consists of major steps, such as freezing of the material, sublimation of frozen water during primary drying under vacuum, and desorption of remaining water at secondary drying [36,37]. The freeze-drying of vegetables is a technique providing products with a quality greater than offered by any other drying method [7]. This drying method enables maintenance of the color, flavor, and nutrients (antioxidants, vitamins) of freshly prepared soup [31]. Freeze-dried products are characterized by high porosity and low density, while shrinkage and structure collapse are negligible [37]. However, freeze-drying of vegetables with β-carotene, lycopene, vitamin E, unsaturated oils may lead to the deterioration of the quality of these biocompounds due to the acceleration of oxidative reactions at a low water activity of freeze-dried material. The main disadvantage of freeze-drying is the high cost of equipment and maintenance. Freeze-drying also known as lyophilization is an expensive preservation method due to high energy consumption at vacuum conditions and the long drying time. However, this drying method enables the obtaining of products with a low water content and the best protection of nutritional value [36]. Additionally, the freeze-dried product can be more competently reconstituted to the original state by the addition of water in comparison to samples dried by other methods [7]. The porous structure of freeze-dried material is a main factor that influence the reconstitution properties. Ratti [38] noted a rehydration ratio up to 4–6 higher for freeze-dried than air-dried materials. Moreover, the minimal color deterioration and the highest lightness were observed for freeze-dried vegetables [10,39]. Freeze-drying technique by low operating temperature is the best choice to dehydrate vegetables to retain the biocompounds content in the products [36]. Freeze-drying is a suitable method for dehydration of liquid or semi-liquid products with pieces of biological materials. Even though the production of freeze-dried soups may come at a high cost, these products have great potential as outdoor food for consumers practicing sailing, camping, trekking, backpacking. Due to the specificity of outdoor food, freeze-dried soups can be situated in places at different humidity conditions, which may affect the products’ properties and their stability.
The moisture sorption isotherms describe the sorption behavior of material stored in an environment of varying humidity. The moisture isotherms represent the relation between the equilibrium water content and the water activity of the product. The different mathematical models are applied to describe the moisture sorption isotherms; these include kinetics models based on monolayer sorption (Brunauer–Emmett–Teller-BET model), models referring to multilayer sorption, and condensed film (Guggenheim–Anderson–de Boer-GAB model, Lewicki model), semi-empirical (Peleg model, Hasley model), and empirical models (Oswin model) [40]. The methods that describe the moisture sorption isotherms can be divided into static and dynamic techniques. The static gravimetric method uses the desiccators for setting the relative humidities. The dynamic vapor sorption system (DVS) automatically generates the different humidity levels for measuring the sorption isotherms. The DVS devise records the change of mass over time (dm/dt) and when dm/dt is close to 0 the next humidity level is automatically selected [41]. The determination of moisture sorption isotherms is crucial for designing and optimizing the drying process and selecting appropriate packaging materials, especially for foods with low moisture content [42,43,44].
Numerous studies on the moisture sorption behavior of different freeze-dried foods described by many mathematical models can be found in the literature [40,45,46,47,48,49]. However, studies on the moisture sorption properties of freeze-dried soups are very limited. In addition, there is little experimental data on the influence of the type of soup on their properties.
The research aimed to study the moisture sorption properties and some selected physical and biochemical as well as sensory features of freeze-dried soups.

2. Materials and Methods

2.1. Materials and Technological Methods

2.1.1. Materials

The thermally preserved soups were provided by a local manufacturer (Firma Bracia Urbanek, Łowicz, Poland). The main composition of four vegetable (cucumber, pumpkin, tomato, red beetroot) soups declared by the manufacturer was presented in Table 1. The blended tomato and pumpkin soups had a creamy texture, whereas the beetroot and cucumber soups contained small pieces of vegetables (including carrots, chickpeas, onions, parsley, leek, celery roots, potatoes). Seasonings such pepper, sugar, garlic, bay leaf, basil (tomato soup) and ginger (pumpkin soup) were also added to soups.

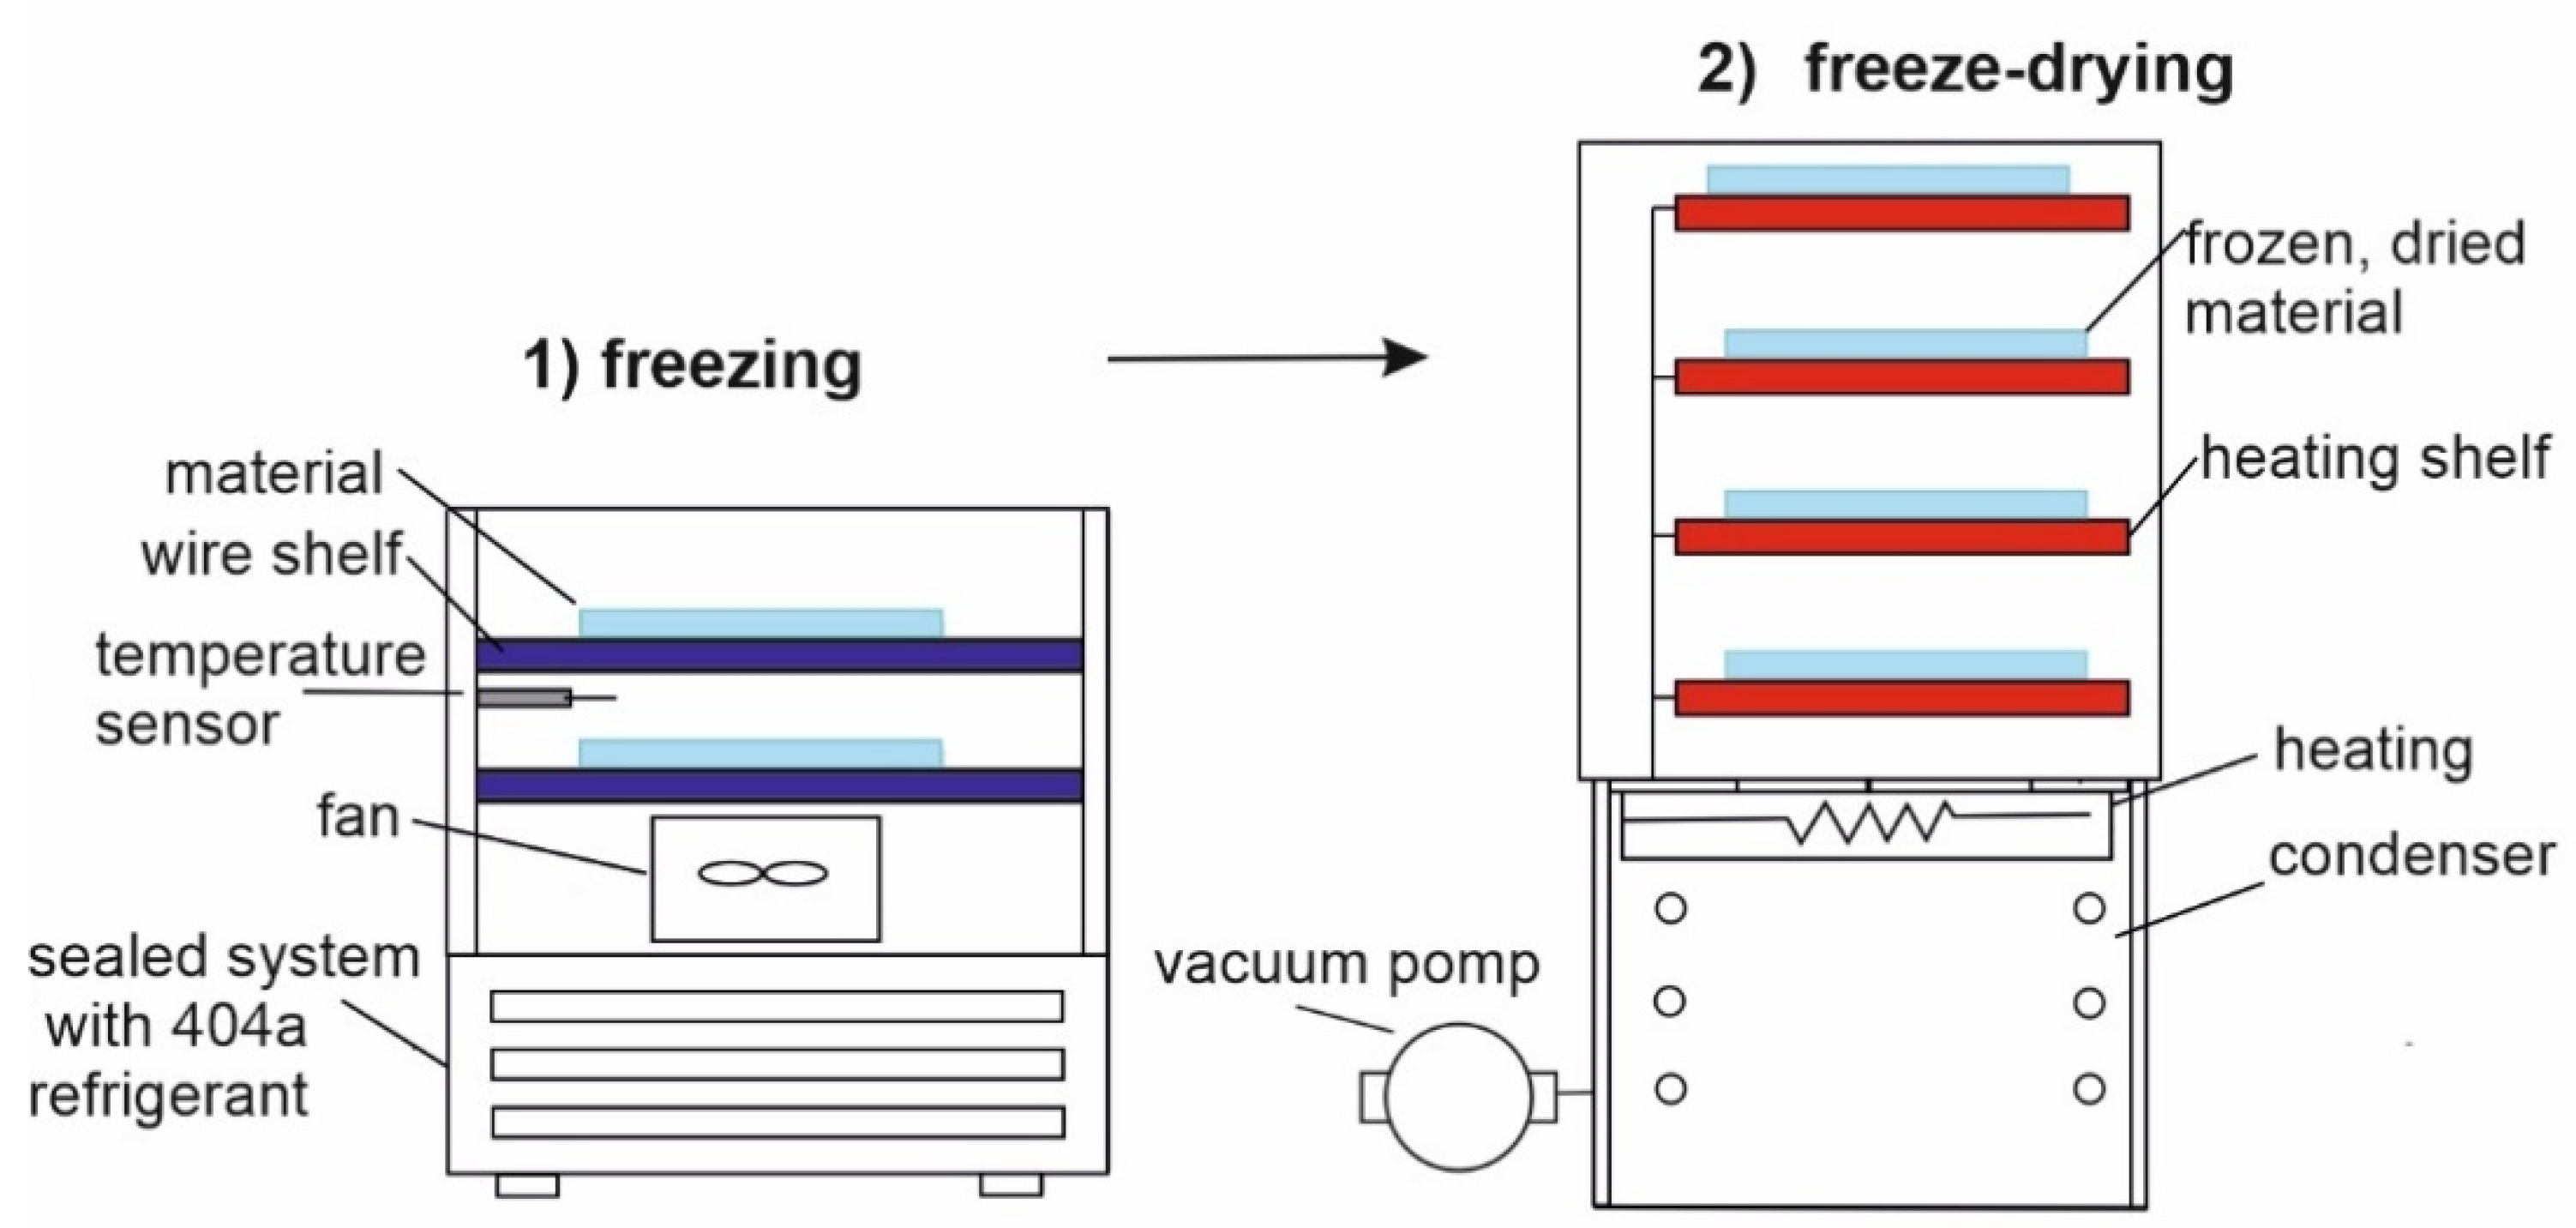
2.1.2. Freeze-Drying

The serving size (0.4 kg) of each type of soup was poured into an aluminum cylindrical container (with a diameter of 20 cm and a height of 2 cm). A schematic representation of the freeze-drying system is shown in Figure 1. The soup samples were frozen at a temperature of −40 °C for 4 h in the shock freezer Multifresh MF 25.1 (Irinox, Corbanese, Italy). Then, the frozen soups were freeze-dried with the application of Gamma 1-16LSC laboratory freeze-dryer with heatable shelves (Martin Christ Gefriertrocknungsanlagen GmbH, Osterode am Harz, Germany) at a shelf temperature of 20 °C, ice condenser temperature of −55 °C and pressure of 63 Pa for 24 h. The dried soups were packed in aluminum barrier bags and stored (maximum of 1 week and 3 months) at room temperature and relative humidity of 40% to perform further analysis.

2.2. Methodology for the Determination of the Selected Properties of Soups

2.2.1. Water Content and Water Activity

The water content of fresh soups (before drying) was determined using the oven-drying method (a laboratory batch dryer with shelfs SUP 65 W/G, Wamed, Warsaw, Poland). This directly heated dryer (an oven with shelf) was presented by Pakowski and Mujumdar [50] for small batches of material.
The soup samples were mixed with anhydrous sea sand in weighing bottles and dried at a temperature of 105 °C for 3 h. The measurement of moisture content of freeze-dried soups was carried out with the application of the vacuum drying method (vacuum drying oven VO200, Memmert GmbH, Büchenbach Germany [51]) at selected conditions (temperature of 70 °C, a pressure of 1 kPa for 24 h. The Hygrolab C laboratory analyzer (Rotronic, Bassersdorf, Switzerland) presented by Brito and Gonçalves [52] was used to measure the water activity of fresh and dried soup samples with a measurement accuracy of ±0.001. The moisture content and water activity were also determined for freeze-dried soups after storage in polyethylene bags (3 months, room conditions).

2.2.2. Color

The color of fresh and dried samples was determined in terms of CIE L*a*b* values using a CR-200 colorimeter (Minolta, Osaka, Japan) with illuminant D65 and 10° observer. The characteristic of CR colorimeter and the technical aspect of measurement system were showed by Fullerton et al. [53]. The values of L* (lightness), a* (+a* redness/−a*greenness), b* (+b* yellowness/−b* blueness) were used to calculate the chroma C* (color intensity) (1), hue h° (2) and total color change ΔE*ab (3) between fresh and dried samples. The increase of ΔE*ab indicates the greater difference of color between fresh and dried material. The ΔE*ab values were also calculated for fresh soups and freeze-dried samples stored for 3 months.
C * = ( a * )   2 + ( b * )   2  
h o = arctan b * a *
Δ E ab * = ( L * L 0 * )   2 + ( a * a 0 * )   2 + ( b * b 0 * )   2  
where: L 0 * , a 0 * , b 0 * —color attributes of fresh soups; L*, a*, b*—color attributes of freeze-dried soups.

2.2.3. pH

The pH (fresh, dried and stored soups) was determined using a digital pH meter (SevenCompact S210, Mettler-Toledo GmbH, Greifensee, Switzerland) at room temperature.

2.2.4. Antioxidant Capacity and the Content of Polyphenolic Compounds

The content of polyphenols and antioxidant capacity were analyzed in extract produced from the soups. The sample of the material was homogenized with an aqueous solution of ethanol (80%) and boiled for 3 min. Afterwards, the extract was filtered [54]. Three extraction experiments were carried out and the mean value was taken for the data analysis. The antioxidant capacity was measured spectrophotometrically based on the degree of scavenging of 2,2-diphenyl-1-picrylhydrazyl (DPPH•; Sigma Aldrich, St. Louis, MI, USA) radical by antioxidants present in fresh and dried soups extracts within the 30-min time period. The method was described by Brand-Williams et al. [55] and modified by Nowacka et al. [54]. The base solution of DPPH was prepared by solute of DDPH in a 99% solution of methanol. The DPPH solution was diluted with an 80% aqueous solution of ethanol. The antioxidant capacity was determined by mixing the extract with the 80% solution of ethanol and the DPPH solution. The tubes with the solutions were mixed and stored in darkness for 30 min. The changes of DPPH radicals’ concertation were assayed based on the absorbance measurement at 515 nm against the sample black (80% aqueous ethanol solutions) (Heλios Gamma spectrophotometer; Thermo Spectronic, Cambridge, UK). The EC50 coefficient was used to characterize the extract concertation required for a 50% reduction of DPPH radicals. It was expressed as mg of dry matter per 100 mL of the extract [56].
The content of polyphenolic compounds in fresh, dried, and stored soups was determined by the Folin–Ciocalteu method, using gallic acid as reference. The distilled water, extract, and Folin reagent were transferred to flasks, mixed, and after 3 min the sodium carbonate solution was added. After mixing, the solution was left in the dark for 1 h. The absorbance was measured in a Heλios Gamma spectrophotometer (Thermo Spectronic, Cambridge, UK) at a wavelength of 750 nm. The reverence sample without the extract was applied as a control. The polyphenol content was determined based on the calibration curve, which shows the relation between the absorbance and the concentration of gallic acid. The total phenolic content (TPC) was expressed in mg of gallic acid equivalents (GAE) per 100 g of dry matter.

2.2.5. Sensory Analysis

Sensory analysis was carried out by a trained panel of 10 Polish panelists. The sensory quality of soups was determined with the quantitative descriptive analysis [57]. Prior to testing, three training sessions were held to familiarize the panelists with the product and with the selected attributes. A 10-point category scale was used to measure the intensity of each sensory attribute (color, consistency, aroma, taste, overall quality) for the different soups. Table 2 presents a list of sensory attributes and their definitions.
The panelists tested the fresh and freeze-dried soups after rehydration. The rehydration was performed using hot water (the amount of water added to dried soups was calculated based on the determination of the water content in fresh and dried soups). The samples of soups (fresh and rehydrated) were heated up to 60 °C and monadically served to experts in plastic containers with a lid which contained 50 g of soup. The containers with soups were coded and presented in random order to each panelist.
The change of the values of sensory attributes after rehydration of samples in comparison to fresh soups was calculated as (4):
Δ A = A f A r A f 100 %
where: ΔA—the change of the value of sensory attribute after rehydration of dried soup in comparison to fresh soup, Af—value of the sensory attribute for fresh soup, Ar—value of the sensory attribute after rehydration of dried material.

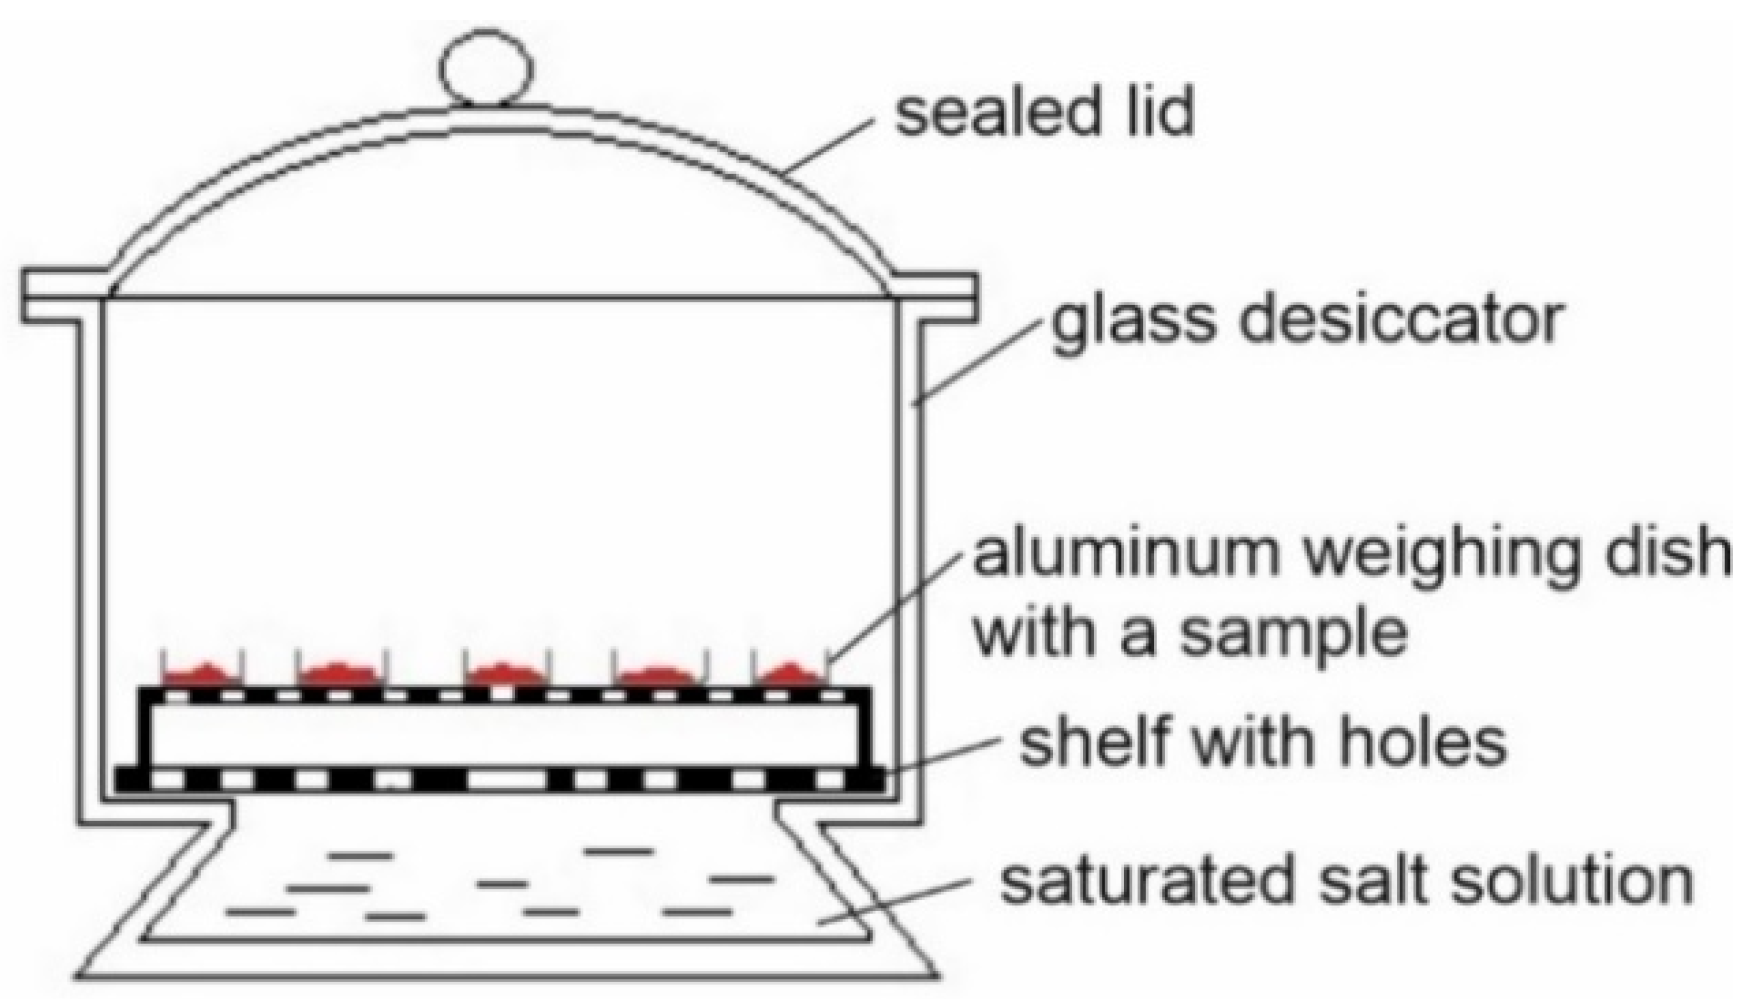
2.2.6. Sorption Isotherms—Static Method

Experimental Determination of Moisture Sorption Isotherms

The freeze-dried soup samples were brought in equilibrium after storage in a desiccator with anhydrous calcium chloride. Then, the selected salts were mixed with distilled water until a solution with excess crystals was formed. The salt solutions were poured in the glass desiccator to a depth of 3 cm. Afterward, dry samples (1.5 g) in aluminum weighing boats were placed in 9 desiccators containing anhydrous CaCl2, and saturated solutions of selected salts: LiCl, CH3COOK, MgCl2, K2CO3, Mg(NO3)2, NaNO2, NaCl, (NH4)2SO4), which generated an environment with different water activity of 0, 0.113, 0.225, 0.329, 0.438, 0.529, 0.648, 0.753, 0.810 (Figure 2). The desiccators with water activity higher than 0.529 contained a dish with thymol to prevent mold growth. The experiment was terminated when the mass of samples did not differ in three sequential measurements. The mass of samples was controlled every month. The triplicate samples of the same type of dried soup were stored for 3 months at a constant temperature of 25 °C. The moisture content of samples after storage was determined using the vacuum drying method in selected conditions (temperature of 70 °C, a pressure of 1 kPa for 24 h). The equilibrium water content was calculated from dry matter of samples.

Modelling of Moisture Sorption Isotherms

The non-linear regression analysis with the application of Table Curve 2D program (Systat Software Inc., San Jose, CA, USA) was performed to select the best equation for modelling the sorption isotherms. The following Equations (5)–(9) were used to describe the moisture sorption isotherms:
GAB model [58]:
u =   u m Cka w ( 1   ka w ) [ 1 + ( C 1 ) ka w ]
BET model [58]:
u =   u m ca w ( 1   a w ) [ 1 + ( c 1 ) a w ]
Lewicki model [59]:
u = F ( 1 a w ) G F 1 +   a w H
Peleg model [60]:
u = Aa w D +   Ba w E
Halsey model [28]:
a w = exp ( g u n )
where: um—monolayer moisture content (g water/100 g d.m.); aw—water activity; C, k—constants of GAB model; c—constant of BET model; A, B, D, E—constants of Peleg model; F, G, H—constants of Lewicki model; g, n—constants of Halsey model.
The goodness of fit for each model to experimental data was judged by the determination coefficient (R2), the root mean square (RMS) (10) and the mean relative percentage deviation modulus P (11).
RMS = i = 1 N ( u e   u p u e ) 2 N   100 %
P = i = 1 N | u e   u p u e | N   100 %
where: ue—experimental water content, up—predicted water content, N—number of experimental data.
The procedure proposed by Blahovec and Yanniotis [61] was applied to check the type of sorption isotherms. The aw/w against aw plot was obtained, and the following formula (12) was applied to describe this relation:
a w w = X 1 + ( X 2 X 2 X 4 ) a w ( X 3 + X 2 X 4 X 2 X 4 2 ) a w 1 + X 4 a w
where: X1, X2, X3, X4 are the constants of equations, aw—water activity, w—equilibrium water content.
The first derivative of this function at water activity aw = 0 is given as D10. The ratio of the first derivate of the aw/w−aw plot at the final value to the first derivative at the initial value (aw = 0) is denoted as Rfi. The extremum of function was noted as awm. The derivatives and extremum of the function (Equation (12)) were obtained using Table Curve 2D program (Systat Software Inc., San Jose, CA, USA).

2.2.7. Sorption Isotherms—Dynamic Vapor Sorption-Method (DVS)

The sorption isotherms were also obtained using Aquadyne DVS analyzer (Quantachrome, Boynton Beach, FL, USA), which automatically generates the relative humidity and records the change of mass over time [41]. The samples of freeze-dried soups (about 20 mg) were analyzed at a temperature of 25 °C measuring the moisture sorption in the range of relative humidity (RH) from 1.5 to 85% with a different RH step size. The measurement was preceded by the purging step at a temperature of 40 °C at 0% RH for 600 min. The relative humidity changed from one level to next when the change of sample mass was smaller than 0.001%/min but no earlier than 180 min from the beginning of the step.

2.2.8. Water Sorption Kinetics

The water sorption kinetics was measured according to the protocol applied for freeze-dried fruit pulps [45]. The freeze-dried soups were stored in a glass jar, which contained the NaCl solution (aw = 0.753). The samples were automatically weighed every minute for 50 h and the water uptake during storage was expressed as g of adsorbed water per g of dry matter of the sample.

2.3. Statistical Analysis

All experiments described in Section 2.2. were repeated three times to verify the obtained results. The one-way analysis of variance (ANOVA) test was used to analyze the significance of differences among the investigated samples (before and after drying) at the 95% significance level. All the data followed a Gaussian distribution. Significant pairwise differences were further tested using paired Tukey’s honest significant difference method. The data were presented as the mean value ± standard deviation. The non-linear regression was applied to calculate the obtained parameters of Equation (11). The analyses were performed using STATISTICA software v. 12.5 (StatSoft Inc., Tulsa, OK, USA) and Table Curve 2D program (Systat Software Inc., San Jose, CA, USA).

3. Results and Discussion

3.1. Characteristic of Physical, Biochemical, and Sensory Properties of Soups before and after Freeze-Drying

The application of the freeze-drying method for selected vegetable soups enabled the obtaining of a product with an attractive appearance (Figure 3). Also, the shrinkage of the dried soups layer was slightly noticeable.
The concentration of the main compounds of soups was also changed. Based on the initial composition of soups and the measured water content in fresh soups and after drying, the concentration of sugars, fiber, and salt was calculated. The dried soup contained sugars form 13.9 (cucumber) to 44.6 (pumpkin) g/100 g (Table 3). The concentration of salt in dried cucumber soup increased to 15.41 g/100 g. According to the Polish Standard [62], the concentration of salts in fresh soup should be lower than 1.8%. The fresh soups did not exceed this limit and the concentration was lower than 1% of salts. The salt and sugar content in dried soups was very high but the final product should be served after rehydration.
The fresh soups were characterized by water content in the range from 89.5 (tomato soup) to 93.7% (cucumber soup) and water activity ranged from 0.973 to 0.980 (Table 4). A similar level of moisture content (90%) was noted for fresh mushroom cream soup prepared with starch, butter, cream, button mushroom and bacon [34]. Water content after freeze-drying of the investigated soups was reduced to a level of 2–3%. A broader range of moisture content from 2.83 to 5.46% was observed by Farzana et al. [5] for dried-powdered vegetable soups. The difference in water content was caused by the addition of different ingredients. Also, the method of production of instant soup was different because the ingredients were dried, ground into powder, and mixed with other components [5].
The reduced water content and water activity promote the maintenance of the physical and chemical properties of dried products during storage [63]. The freeze-dried soups were stored in room conditions, and after 3 months, the freeze-dried soups’ water content increased to around 4% and the water activity increased from 0.197–0.221 to 0.268–0.286 (Table 4). The highest increase of water content after storage of dried samples was observed for pumpkin and tomato soup (about 70–80%). However, the results showed that storage of dried cucumber soups led to an increase in the water content by 28%. Dried cucumber soup contained a significantly lower amount of carbohydrates than other soups (Table 3). The presence of low molecular weight sugars in dried materials may affect their physical properties such as solubility, viscosity, and hygroscopicity. Fructose is very hygroscopic whereas other sugars such as sucrose and xylitol absorb water only at the higher water activity [64]. The dried samples with a higher sugar content are more susceptible to the moisture uptake during the storage. However, the water activity and water content of stored dried soups remained at a level which ensures the microbiological stability of dried products.
The color of the product after drying can be an important indicator of its quality. Undesired changes or loss of color may negatively affect the evaluation of the final product by the consumer [65]. The lightness L* for all investigated soups increased after drying, which can be related to the degradation of pigments in vegetables used to prepare the soups. The highest difference of lightness between fresh and dried samples was observed for beetroot soup; the L* increased from 23.05 to 55.07. The dried samples became slightly brighter after storage except for beetroot soup, of which L* value did not change significantly in comparison to the dried sample (Table 5).
The intensity of color depends on the values of a* and b*. The a* value (redness) decreased from +39.64 to +21.91 after drying of the beetroot soup. The decrease of redness of the soup can be linked with the degradation of betalains pigments. Antigo et al. [66] noted a positive and strong correlation between the betanins content (the betacyanins mainly present in beetroot) and the color parameter a* of freeze-dried red beet extract. The degradation of betanins led to the discoloration of the product and reduction of the a* parameter. The storage did not affect the a* of beetroot soup, but for pumpkin and tomato soups, the redness decreased. The yellowness b* decreased after drying and storage of tomato, pumpkin, and cucumber soup. The increase of water content in dried samples after storage may affect the changes of color attributes. It can be assumed that the shrinkage and porosity of samples were changed due to the increase of water content after storage of products. Structure and opacity of fresh, dried, and stored material may significantly affect the optical refection capacity.
Table 5 shows that chroma values decreased after freeze-drying of tomato, beetroot, and pumpkin soups. A significant difference between the chroma values was obtained for fresh (41.06) and dried (25.98) beetroot soup. Kerr and Varner [67] noted for the freeze-dried beetroot puree the high chroma value (33.39–35.97), indicating the most saturated color.
The hue angle describes the relative amount of redness (h° = 0°) and yellowness (h° = 90°). The lowest value of hue h° was observed for the fresh beetroot soup, which indicated a redder product. The beetroot contains the natural red-violet food colorant (betanin) with biological activity [68]. Betanins are unstable in the presentence of light and oxygen and can be degraded when subjected to heating [66]. The drying process resulted in the increase of hue value of beetroot soup. Antigo et al. [66] observed that the betanin content in the microcapsules with red beet extracts obtained by freeze-drying were negatively correlated with the hue angle. Also, degradation the color of samples occurred from opaque red to clearer yellow after freeze-drying and spray-drying. Samples of dried beetroot soup after storage showed the lower values of hue h° than dried product. The L*, a*, C* vales of dried beetroot soup remained constant after storage but the b* parameter as well as hue h° decreased that may be attributed to browning reactions such as non-enzymatic browning. It may also lead to a reinforcement of the sample color [69]. Tomato soups dried and stored also showed the reduction of the hue angle values which can be also related to browning processes. The pumpkin soups showed after drying and storage an increase of hue and a slight decrease of chroma value. The drying process resulted in the brighter sample with lower color saturation which can linked with lycopene and β-carotene degradation. Also, Guiné and Barroca [70] observed that the freeze-during process made the samples more dully than fresh pumpkin. However, the storage of dried pumpkin soups caused a further decrease of color saturation (degradation of pigments). The similar trend was observed for cucumber soup after drying and storage.
The total color difference between fresh and dried beetroot soups was several-fold higher than that observed for other soups (Table 5). However, the ΔE*ab obtained for other soups also showed high values. The total color change was also compared between fresh soup and dried samples after storage. The highest total color change after storage of samples were obtained for the beetroot soup. The results of ΔE*ab showed that freeze-drying of beetroot soup caused the significant changes of color but the storage of the dried sample did not affect this parameter. The total changes of color due to drying process of other soups were smaller. The value of ΔE*ab considerably increased for tomato and pumpkin dried soup after storage. During storage, the degradation of pigments and bioactive compound probably occurred.
The pH of fresh soups ranged from 3.89 to 5.59 for cucumber and pumpkin soups, respectively (Table 6). After freeze-drying and storage of dried samples, the pH of soups was similar to that obtained for most fresh soups. Valdenegro et al. [71] observed that after drying, pH of goldenberry was maintained. However, the pH of banana leaves after drying increased slightly after drying due to the degradation of acid compounds in that material [72]. Dried cucumber soup also showed a higher pH value than fresh soup but after storage the pH of dried soup did not differ.
The scavenging activity against DPPH• radical was described by the EC50 coefficient. The lower values of EC50 relate to a higher antioxidant activity [56]. The freeze-drying of soups caused a slight increase of EC50 for the tomato, pumpkin, and cucumber soups (Table 6). The drying process did not statistically alter the scavenging activity in the case of the beetroot soup. The content of polyphenolic compounds (TPC) also did not change after drying and storage of the beetroot soup. Red beetroots contain several phenolic acids (both hydroxycinnamic and hydroxybenzoic acids) and flavonoids [73], which affect their bioactivity. The beetroot soups before and after drying had a lower value of the EC50 than cucumber and tomato soups, which means that beetroot soups represented higher antioxidant activity than cucumber soup, which might contain less bioactive compounds. Seremet al. [74] observed the increase in the total phenol produced by the heat-treated beetroot puree and the heat caused an increase in the amount antioxidants. However, color of samples was significantly reduced by heat. The hydrolysis of C-glycosides in the flavonoid composition caused the formation of monomers that increase the antioxidant capacity. The TPC and antioxidant activity after drying of beetroot and pumpkin soups did not change but the significant changes of color were observed (Table 5 and Table 6). Nistor et al. [75] stated that the degradation of betacyanins leaded to other phenolic compounds which stimulated the increase of antioxidant activity of dried beetroot. The content of polyphenolic compounds (TPC) after drying decreased significantly from 763 to 543 mg GAE/100 g d.m. for tomato soup and from 569 to 367 mg GAE/100 g d.m. for cucumber soups. It can be noticed that in the case of these soups, also the antioxidant capacity was the lowest. The significant decrease of TPC after storage was only observed for freeze-dried tomato soup.
The investigation of freeze-dried soups showed that these products were characterized by good sensory attributes based on overall acceptability [33] but the food ingredients could significantly affect the sensory quality of instant soups [31]. The fresh soups and rehydrated soups were subjected to sensory analysis (Table 7). The investigated fresh commercial soups varied in the scores of sensory attributes. Thus, the change of these attributes of fresh soup and after rehydration of dried sample was analyzed. Sensory analysis showed the scores of color after rehydration of freeze-dried tomato, pumpkin, and cucumber soups were lower by about 31–36% regarding fresh soups. The rehydrated beetroot soup showed the highest change of color in comparison to fresh soups. Sensory analysis confirmed the results obtained by the instrumental measurement of color attributes. The beetroot soups showed the highest change of color after drying. These changes negatively affected the color of the reconstituted soup evaluated by the panelists. The drying process did not affect the consistency of the pumpkin and beetroot soups after rehydration. The scores of taste and aroma, as well as overall quality, decreased the most for rehydrated tomato soup. The reconstituted freeze-dried soups were positively evaluated regarding taste, consistency, aroma, and overall quality, but the color of the soup significantly deviates from the color of fresh soups.

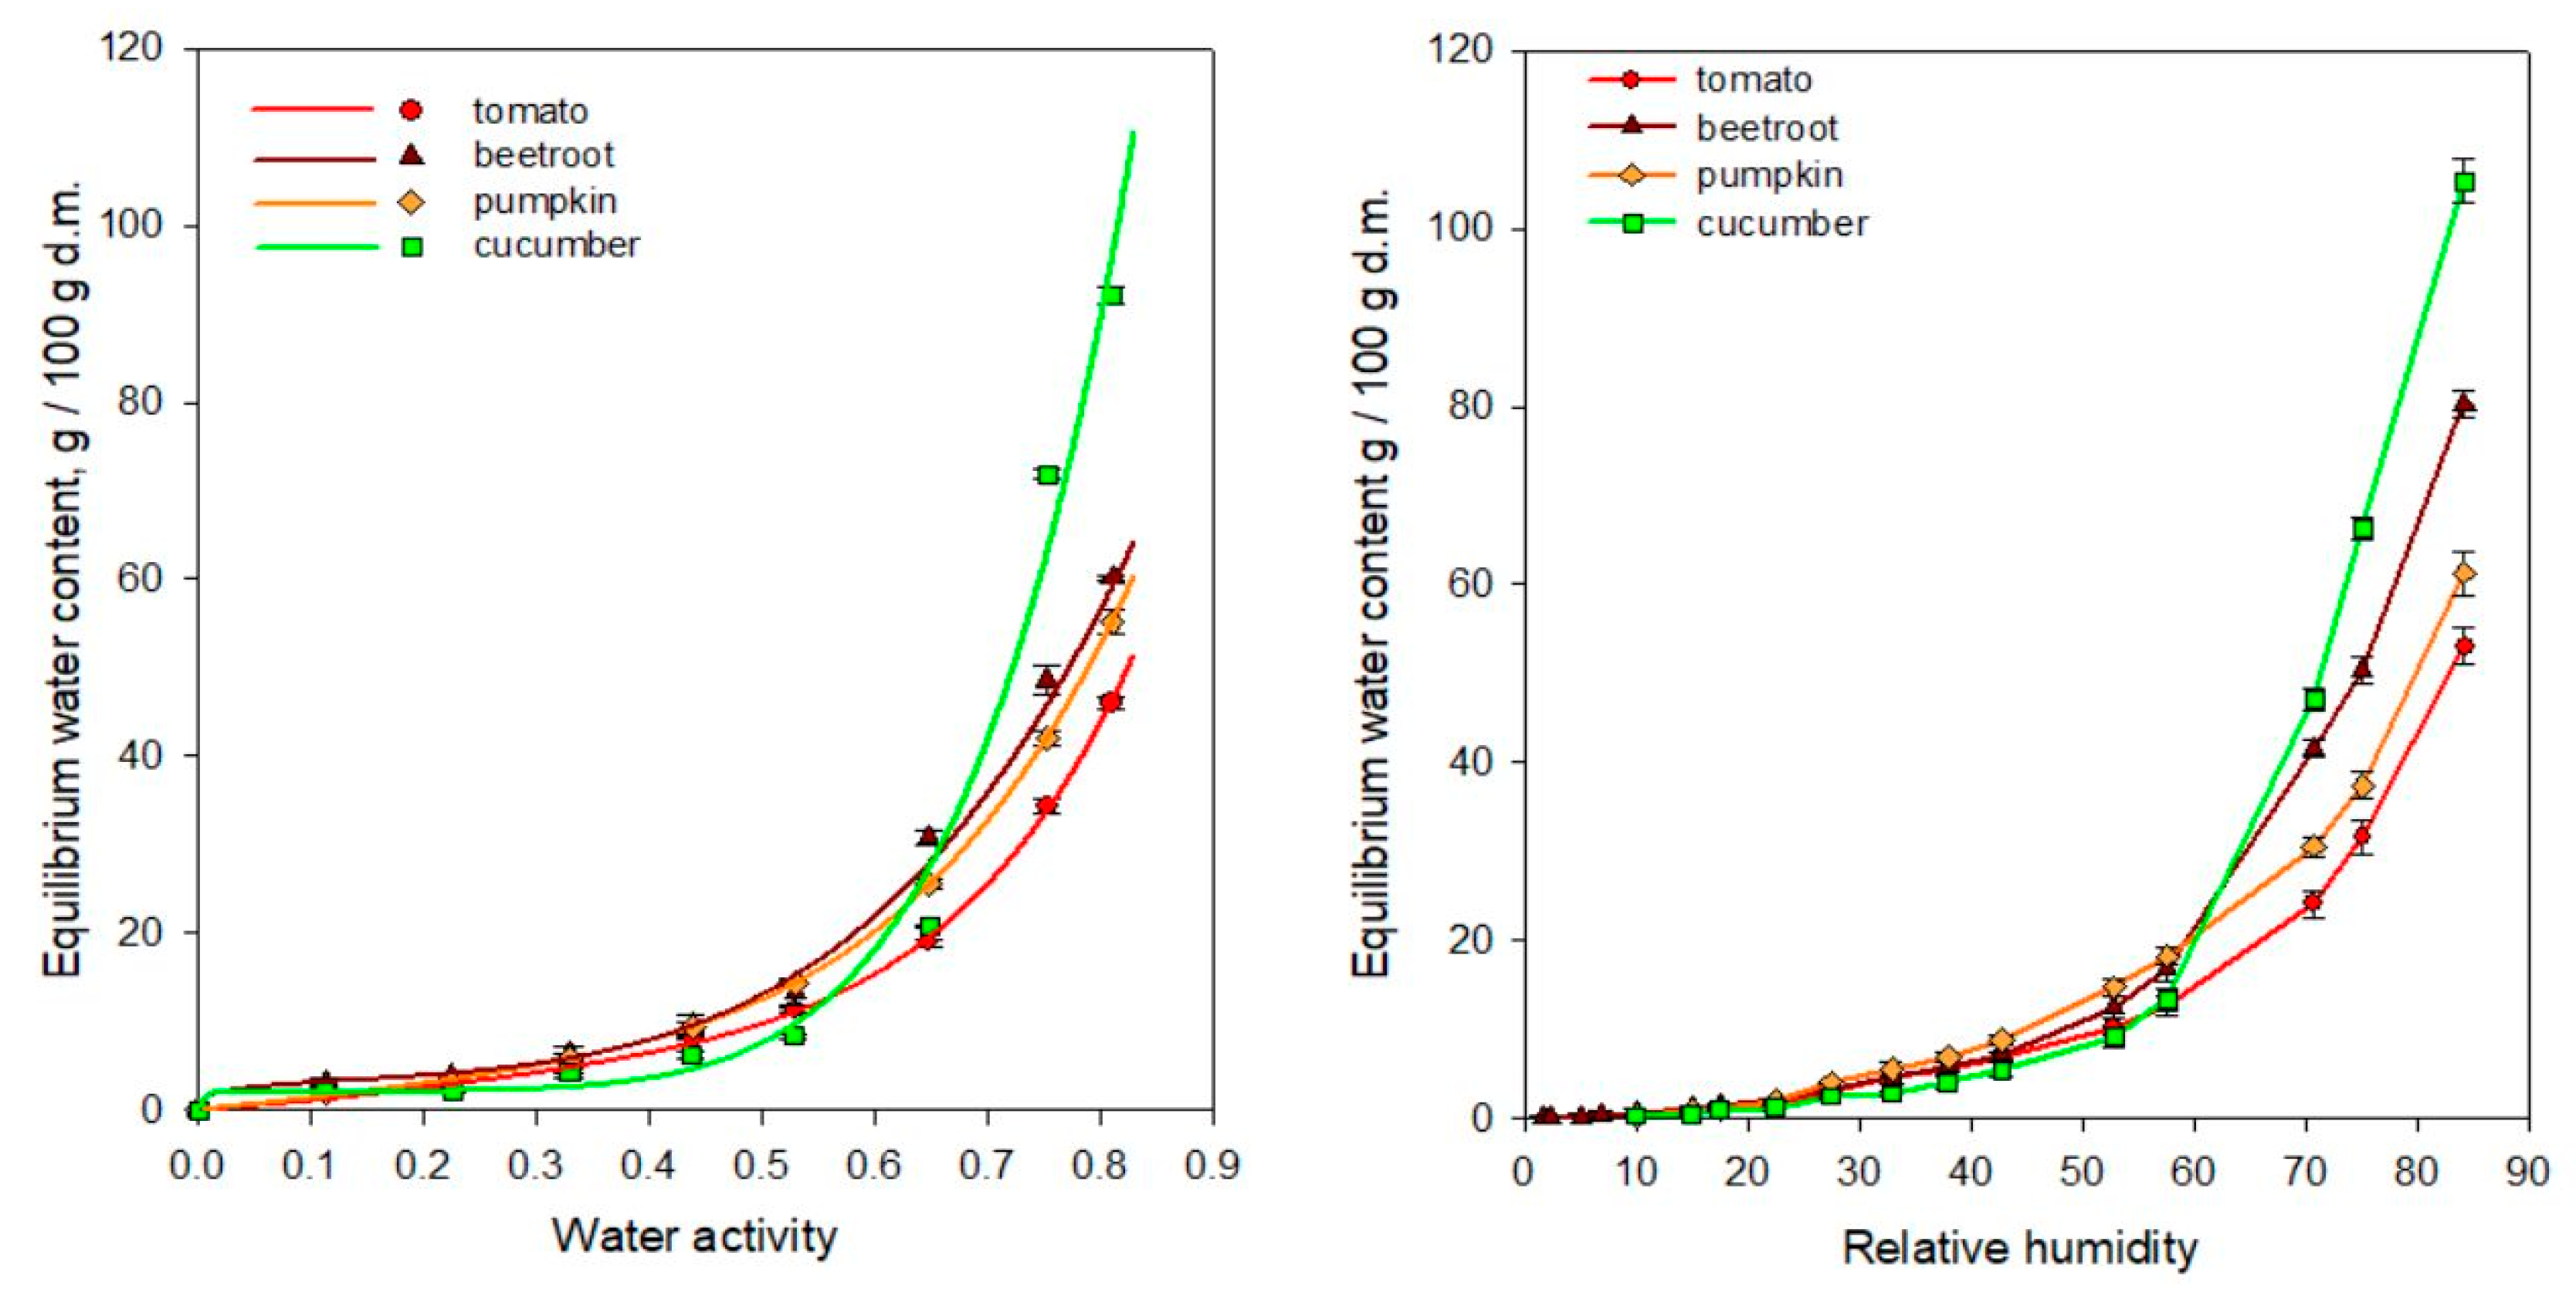
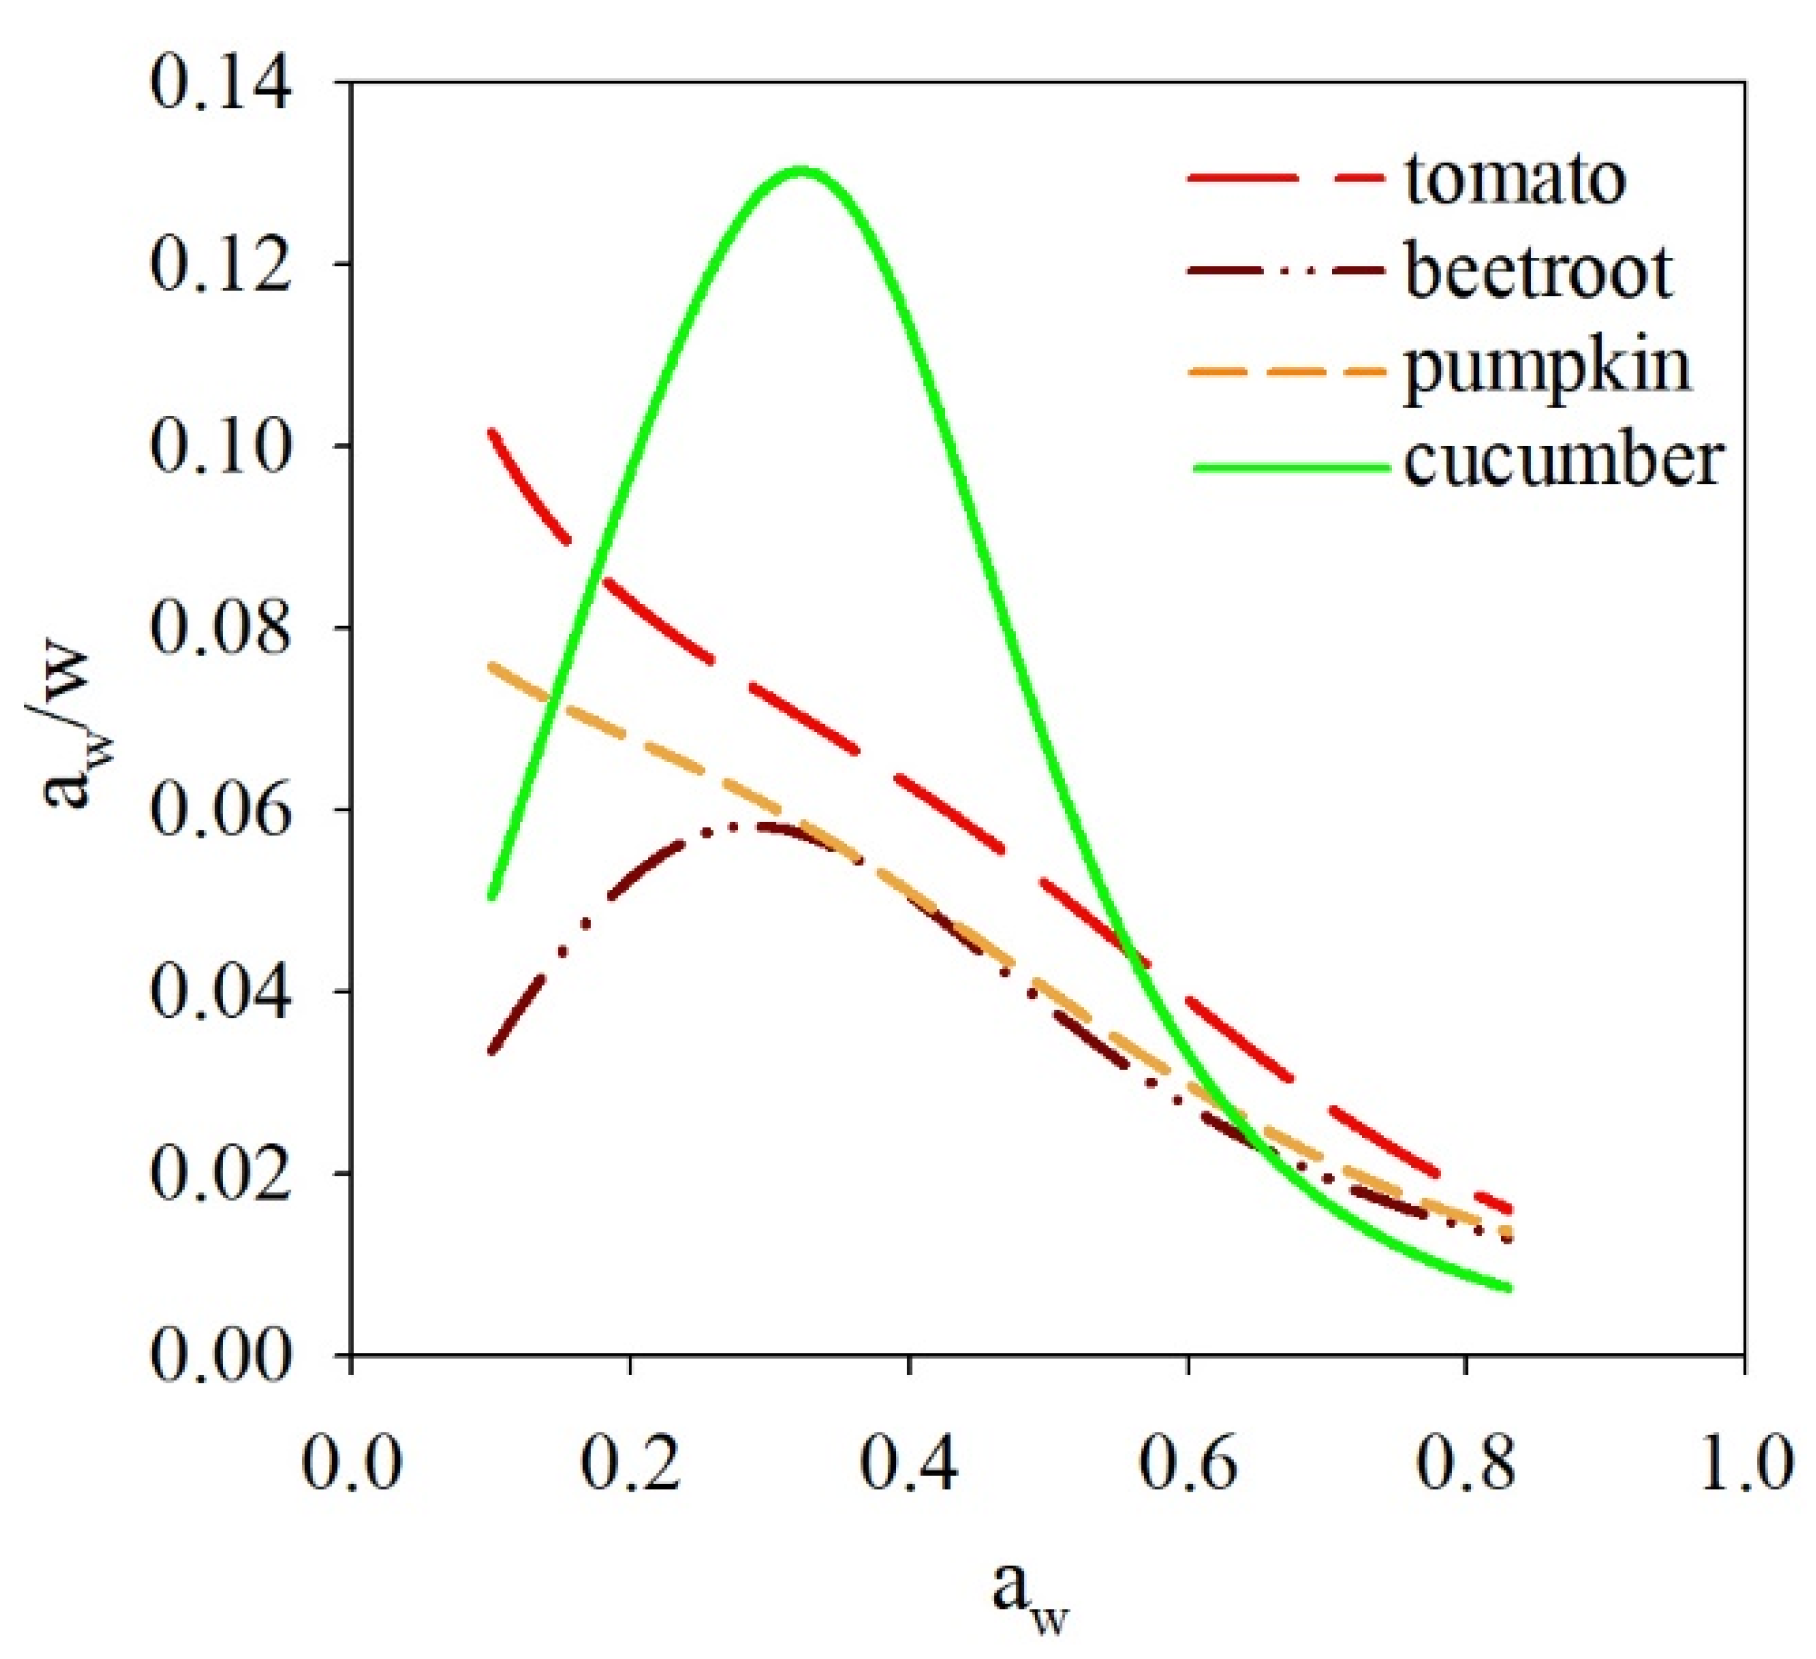
3.2. The Sorption Properties of Freeze-Dried Soups

The sorption isotherms describe the relationship between the water content and the water activity of the material. The selection of the best model of sorption behavior can be difficult due to the complex chemical composition and structure of food products [76]. Table 8 presents the estimated parameters of GAB, BET, Lewicki, Peleg, Hasley models. The model that best fit the observed data was conducted by the comparison of coefficients RMS, R2, and P. The best model should be described by the highest coefficient of determination (R2) and the lowest values of root mean square (RMS) and P (mean relative deviation modulus) [77]. The parameter P has been used in several sorption experiments, and the sorption model was acceptable and good when P < 10% [42,78]. A mathematical comparison of experimental and predicted results for freeze-dried soups gave P values ranging from 6.44 (Peleg model) to 56.34% (BET model). The values of RMS were very high for cucumber freeze-dried soup and varied from 21.31 (for Peleg model) to 80.49 (BET model). The Peleg model showed the lower values of RMS (11.89–21.31%) and P modulus (lower than 16.5%) than other models for the investigated freeze-dried soups. The values of determination coefficient R2 (for Peleg model) ranged from 0.976 to 0.999, which was can be considered to be satisfying. By contrast, the GAB model has been frequently used to describe sorption isotherms of many food products because parameters of this model have a physical meaning. Also, the GAB model was reported as a very versatile sorption model that can be applied for a wide range of water activity [79]. However, Table 8 shows the GAB parameters obtained in this study did not fulfil the requirements of the GAB model because constant C should be in the range of 5.67 ≤ C ≤ ∞ [80]. Thus, the Peleg model was selected as an adequate model to characterize the sorption isotherms of all freeze-fried soups.
The experimental and predicted values calculated based on the Peleg model were presented in Figure 4a. The sigmoid shape of isotherm sorption was observed for freeze-dried beetroot and cucumber soup. The equilibrium moisture content of freeze-dried cucumber soup attained lower values than that observed for other dried soups in the water activity range of 0–0.53. Above the aw value, a rapid increase of equilibrium water was noted with the increase of water activity for dried cucumber soup. A similar behavior was reported for freeze-dried avocado when the water activity was higher than 0.5 [81]. The authors stated that this behavior could be related with the high concentration of hydrophobic fat in the dried avocado. The sigmoid shape of the sorption curve was also observed for dried tomato products. At low and intermediate water activities, the moisture content increased linearly with the water activity, but at high water aw, the water content rapidly increased with the water activity, which was linked with capillary condensation [40]. The cucumber soup contained a high amount of water, and after drying, the layer of dried soup was more fragile and porous in comparison to other soups (visual observations). It can be concluded that at the higher water activity, the pores of the dried material were filled with absorbed water and a further increase of water activity could lead to a rapid increase of the moisture content in the sample. The material was not able to bind the water due to the limited amount of solid matrix in freeze-dried cucumber soup.
The sorption isotherms of many vegetable and vegetable powders followed type II according to Brunauer’s classification [40,82,83]. The procedure and Equation (12) described by Blahovec and Yanniotis [61] was applied to classify the isotherm sorption of freeze-dried soups. The non-linear regression enabled the obtaining of classification parameters for beetroot and cucumber freeze-dried soups (Table 9). The predicted values for freeze-dried pumpkin and tomato soups were outside the interval of experimental data and the determination coefficients were lower than 0.85. In this case, regression did not lead to obtaining the equation parameters, which can be interpreted physically.
The sorption isotherms with parameter X4 higher than 0.1, negative value of Rfi, positive value of D10 and awm from the range of 0–1, can be classified as type IIc, which is closer to the solution-like isotherms at higher aw. This type of isotherms was observed in the case of fruit and vegetables [61,84]. The values obtained for beetroot and cucumber freeze-dried soups showed that their isotherms can be classified as type IIc (Table 9).
The classification of isotherms can be also performed by plotting aw/w (ratio of water content and water content) against water activity. The shape and course of the curve may indicate the type of isotherms [61]. The curves with extremum obtained for freeze-dried beetroot cucumber soups are characteristic for type II of isotherms (Figure 5). The course of curves obtained for the freeze-dried tomato and pumpkin soup was ambiguous. The decreasing trend of water content with the increase of water activity is typical for isotherm type III, but the shape of the curve slightly deviates from isotherm type III in the range of low water activities.
The sorption of isotherms was also obtained using the DVS technique. The main advantage of this method is the short time of the measurement (about 48 h for the freeze-dried soups) in comparison to the static method (3 months) (Figure 4b). The values of water content obtained for samples at the water activities in the investigated range and with the application of these two methods were different. However, some isotherms of freeze-dried soups (cucumber and tomato) had a similar course and values. Some investigators examined different methods of testing the sorption isotherms. The experiments showed that due to the short time of the experiment, not all pores were saturated by water [85]. Garbalinska et al. [41] concluded that the traditional method and the DVS showed good compatibility in the range of RH between 0 and 75–85% for the aerated concrete. At higher relative humidity, the equilibrium moisture content was higher for the traditional method than that recorded by the DVS method. On the contrary, the water content registered with the application of the DVS method was higher for freeze-dried beetroot soups at the selected water activity. However, the DVS method can be a useful tool for the fast evaluation of the sorption behavior of materials.
Additionally, the kinetics of water sorption at a water activity of 0.75 was recorded (Figure 6). The measurements confirmed different sorption properties of freeze-dried cucumber soups because the sample absorbed more water at a higher rate. The freeze-dried tomato soup was a less hygroscopic material at aw = 0.753.

4. Conclusions

The freeze-drying method can be used to preserve vegetable soups. The final water content (2–3%) and water activity (0.2) of samples after drying were sufficiently low to obtain a stable product during storage. The undesired changes in the color of vegetable soups were noticed after drying, and storage of products which could be related to the disintegration of natural pigments and the browning processes. Also, the antioxidant activity of most freeze-dried soups was reduced due to the degradation of bioactive compounds during the long drying time of the process. The Peleg model was applied to describe the isotherms of freeze-dried soups. The moisture isotherms obtained for cucumber and beetroot was classified as type II of the isotherm. The shape of the isotherms observed for freeze-dried tomato was similar to isotherm type III. The composition of soups and their form (homogenized and with pieces of vegetables) may have affected the porosity and sorption properties of freeze-dried soups. A sharp increase in water content was observed for samples stored at water activity higher than 0.5. Thus, the freeze-dried soups should be stored in barrier bags in an environment with lower humidity. The reconstituted freeze-dried soups were positively evaluated regarding taste, consistency, aroma, and overall quality but negatively in terms of their color. The significant decrease of bioactive activity and the lower scores of sensory attributes obtained for the tomato soups indicated that soups with a high concentration of tomato were not suitable for freeze-drying.

Author Contributions

Conceptualization, E.J.; Methodology, E.J.; Investigation, E.J. and A.J.; Formal analysis, E.J.; Writing—original draft preparation, E.J.; Writing—review and editing, E.J. All authors have read and agreed to the published version of the manuscript.

Funding

This research received no external funding.

Institutional Review Board Statement

Not applicable.

Informed Consent Statement

Not applicable.

Data Availability Statement

Some data used during the study are available from the corresponding author by request.

Acknowledgments

The research equipment purchased as part of the “Food and Nutrition Centre–modernization of the WULS campus to create a Food and Nutrition Research and Development Centre (CŻiŻ)” was co-financed by the European Union from the European Regional Development Fund under the Regional Operational Programme of the Mazowieckie Voivodeship for 2014–2020 (Project No. RPMA.01.01.00-14-8276/17).

Conflicts of Interest

The authors declare no conflict of interest.

References

  1. de Ancos, B.; Sánchez-Moreno, C. Soups. In Innovative Technologies in Beverage Processing, 1st ed.; Aguiló-Aguayo, L., Plaza, L., Eds.; John Wiley & Sons Ltd.: Chichester, UK, 2017; pp. 249–273. [Google Scholar]
  2. Erkekoglu, P.; Sipahi, H.; Baydar, T. Evaluation of Nitrite in Ready-Made Soups. Food Anal. Methods 2009, 2, 61–65. [Google Scholar] [CrossRef]
  3. Raitio, R.; Orlien, V.; Skibsted, L.H. Storage stability of cauliflower soup powder: The effect of lipid oxidation and protein degradation reactions. Food Chem. 2011, 128, 371–379. [Google Scholar] [CrossRef]
  4. Rekha, M.N.; Yadav, A.R.; Dharmesh, S.; Chauhan, A.; Ramteke, R.S. Evaluation of antioxidant properties of dry soup mix extracts containing dill (Anethum sowa L.) leaf. Food Bioprocess Technol. 2008, 3, 441–449. [Google Scholar] [CrossRef]
  5. Farzana, T.; Mohajan, S.; Saha, T.; Hossain, N.; Haque, Z. Formulation and nutritional evaluation of a healthy vegetable soup powder supplemented with soy flour, mushroom, and moringa leaf. Food Sci. Nutr. 2017, 5, 911–920. [Google Scholar] [CrossRef]
  6. Abdel-Haleem, A.M.H.; Omran, A.A. Preparation of dried vegetarian soup supplemented with some legumes. Food Nutr. Sci. 2014, 5, 2274–2285. [Google Scholar] [CrossRef] [Green Version]
  7. Karam, M.C.; Petit, J.; Zimmer, D.; Djantou, E.B.; Scher, J. Effects of drying and grinding in production of fruit and vegetable powders: A review. J. Food Eng. 2016, 188, 32–49. [Google Scholar] [CrossRef]
  8. Vega-Gálvez, A.; Di Scala, K.; Rodríguez, K.; Lemus-Mondaca, R.; Miranda, M.; López, J.; Perez-Won, M. Effect of air-drying temperature on physico-chemical properties, antioxidant capacity, colour and total phenolic content of red pepper (Capsicum annuum L. var. Hungarian). Food Chem. 2009, 117, 647–653. [Google Scholar] [CrossRef]
  9. Kerdpiboon, S.; Devahastin, S.; Kerr, W.L. Comparative fractal characterization of physical changes of different food products during drying. J. Food Eng. 2007, 83, 570–580. [Google Scholar] [CrossRef]
  10. Argyropoulos, D.; Heindl, A.; Müller, J. Assessment of convection, hot-air combined with microwave-vacuum and freeze-drying methods for mushrooms with regard to product quality. Int. J. Food Sci. Technol. 2011, 46, 333–342. [Google Scholar] [CrossRef]
  11. Liu, C.; Pirozzi, A.; Ferrari, G.; Vorobiev, E.; Grimi, N. Impact of pulsed electric fields on vacuum drying kinetics and physicochemical properties of carrot. Food Res. Int. 2020, 137, 109658. [Google Scholar] [CrossRef]
  12. Yaghmaee, P.; Durance, T.D. Efficacy of vacuum microwave drying in microbial decontamination of dried vegetables. Dry. Technol. 2007, 25, 1099–1104. [Google Scholar] [CrossRef]
  13. Lech, K.; Figiel, A.; Wojdyło, A.; Korzeniowska, M.; Serowik, M.; Szarycz, M. Drying kinetics and bioactivity of beetroot slices pretreated in concentrated chokeberry juice and dried with vacuum microwaves. Dry. Technol. 2015, 33, 1644–1653. [Google Scholar] [CrossRef]
  14. Bouraoui, M.; Richard, P.; Durance, T. Microwave and convective drying of potato slices. J. Food Process. Eng. 1994, 17, 353–363. [Google Scholar] [CrossRef]
  15. Seyhan, F.G.; Evranuz, Ö. Low Temperature mushroom (A. bisporus) drying with desiccant dehumidifiers. Dry. Technol. 2000, 18, 433–445. [Google Scholar] [CrossRef]
  16. Nagaya, K.; Li, Y.; Jin, Z.; Fukumuro, M.; Ando, Y.; Akaishi, A. Low-temperature desiccant-based food drying system with airflow and temperature control. J. Food Eng. 2006, 75, 71–77. [Google Scholar] [CrossRef]
  17. Garcia-Perez, J.; Cárcel, J.A.; Riera, E.; Mulet, A. Influence of the applied acoustic energy on the drying of carrots and lemon peel. Dry. Technol. 2009, 27, 281–287. [Google Scholar] [CrossRef]
  18. Garcia-Perez, J.; Cárcel, J.A.; De La Fuente-Blanco, S.; De Sarabia, E.R.-F. Ultrasonic drying of foodstuff in a fluidized bed: Parametric study. Ultrasonics 2006, 44, e539–e543. [Google Scholar] [CrossRef]
  19. Jambrak, A.R.; Mason, T.J.; Paniwnyk, L.; Lelas, V. Accelerated drying of button mushrooms, Brussels sprouts and cauliflower by applying power ultrasound and its rehydration properties. J. Food Eng. 2007, 81, 88–97. [Google Scholar] [CrossRef]
  20. Guo, Y.; Wu, B.; Guo, X.; Ding, F.; Pan, Z.; Ma, H. Effects of power ultrasound enhancement on infrared drying of carrot slices: Moisture migration and quality characterizations. LWT 2020, 126, 109312. [Google Scholar] [CrossRef]
  21. Xu, C.; Li, Y.; Yu, H. Effect of far-infrared drying on the water state and glass transition temperature in carrots. J. Food Eng. 2014, 136, 42–47. [Google Scholar] [CrossRef]
  22. Mohamed, R.S.; Abozed, S.S.; El-Damhougy, S.; Salama, M.F.; Hussein, M.M. Efficiency of newly formulated functional instant soup mixtures as dietary supplements for elderly. Heliyon 2020, 6, e03197. [Google Scholar] [CrossRef] [PubMed] [Green Version]
  23. George, J.P.; Datta, A. Development and validation of heat and mass transfer models for freeze-drying of vegetable slices. J. Food Eng. 2002, 52, 89–93. [Google Scholar] [CrossRef]
  24. Torringa, E.; Esveld, E.; Scheewe, I.; Berg, R.V.D.; Bartels, P. Osmotic dehydration as a pre-treatment before combined microwave-hot-air drying of mushrooms. J. Food Eng. 2001, 49, 185–191. [Google Scholar] [CrossRef]
  25. Shi, J.; Le Maguer, M.; Kakuda, Y.; Liptay, A.; Niekamp, F. Lycopene degradation and isomerization in tomato dehydration. Food Res. Int. 1999, 32, 15–21. [Google Scholar] [CrossRef]
  26. Cui, Z.-W.; Xu, S.-Y.; Sun, D.-W.; Chen, W. Temperature Changes during microwave-vacuum drying of sliced carrots. Dry. Technol. 2005, 23, 1057–1074. [Google Scholar] [CrossRef]
  27. Roratto, T.B.; Monteiro, R.L.; Carciofi, B.A.; Laurindo, J.B. An innovative hybrid-solar-vacuum dryer to produce high-quality dried fruits and vegetables. LWT 2021, 140, 110777. [Google Scholar] [CrossRef]
  28. Mondal, I.H.; Rangan, L.; Uppaluri, R.V. A robust and novel methodology for the optimal targeting of leafy vegetable mix soup formulations. LWT 2020, 134, 110152. [Google Scholar] [CrossRef]
  29. Singh, S.; Ghosh, S.; Patil, G.R. Development of a mushroom-whey soup powder. Int. J. Food Sci. Technol. 2003, 38, 217–224. [Google Scholar] [CrossRef]
  30. Fernández-Pérez, V.; Tapiador, J.; Martín, A.; De Castro, M.L. Optimization of the drying step for preparing a new commercial powdered soup. Innov. Food Sci. Emerg. Technol. 2004, 5, 361–368. [Google Scholar] [CrossRef]
  31. Wang, R.; Zhang, M.; Mujumdar, A.S. Effect of food ingredient on microwave freeze drying of instant vegetable soup. LWT 2010, 43, 1144–1150. [Google Scholar] [CrossRef]
  32. Raji, A.O.; Akinoso, R.; Aruna, T.E.; Raji, M.O. Reconstitution potentials and moisture sorption isotherms of selected freeze dried Nigerian soups. J. Food Process. Eng. 2016, 40, e12516. [Google Scholar] [CrossRef]
  33. Raji, A.O.; Rahman, A.; Maimuna, S.; Oyewale, R.M. Sensory properties and stability of selected freeze-dried nigerian soups stored at ambient condition. In Proceedings of the 4th Regional Food Science and Technology Summit (Refosts) Akure, Ondo State, Nigeria, 6–7 June 2018; pp. 323–330. [Google Scholar]
  34. Liu, W.; Zhang, M.; Devahastin, S.; Wang, W. Establishment of a hybrid drying strategy for instant cream mushroom soup based on starch retrogradation behavior. Int. J. Biol. Macromol. 2020, 147, 463–472. [Google Scholar] [CrossRef] [PubMed]
  35. Wang, R.; Zhang, M.; Mujumdar, A.S.; Sun, J.-C. Microwave freeze–drying characteristics and sensory quality of instant vegetable soup. Dry. Technol. 2009, 27, 962–968. [Google Scholar] [CrossRef]
  36. Bhatta, S.; Stevanovic, T.; Ratti, C. Freeze-drying of plant-based foods. Foods 2020, 9, 87. [Google Scholar] [CrossRef] [PubMed] [Green Version]
  37. Nowak, D.; Jakubczyk, E. The freeze-drying of foods—The characteristic of the process course and the effect of its parameters on the physical properties of food materials. Foods 2020, 9, 1488. [Google Scholar] [CrossRef]
  38. Ratti, C. Hot air and freeze-drying of high-value foods: A review. J. Food Eng. 2001, 49, 311–319. [Google Scholar] [CrossRef]
  39. Nindo, C.; Sun, T.; Wang, S.; Tang, J.; Powers, J. Evaluation of drying technologies for retention of physical quality and antioxidants in asparagus (Asparagus officinalis L.). LWT 2003, 36, 507–516. [Google Scholar] [CrossRef]
  40. Goula, A.M.; Karapantsios, T.D.; Achilias, D.S.; Adamopoulos, K.G. Water sorption isotherms and glass transition temperature of spray dried tomato pulp. J. Food Eng. 2008, 85, 73–83. [Google Scholar] [CrossRef]
  41. Garbalińska, H.; Bochenek, M.; Malorny, W.; Von Werder, J. Comparative analysis of the dynamic vapor sorption (DVS) technique and the traditional method for sorption isotherms determination—Exemplified at autoclaved aerated concrete samples of four density classes. Cem. Concr. Res. 2017, 91, 97–105. [Google Scholar] [CrossRef]
  42. Lee, J.H.; Lee, M.J. Effect of drying method on the moisture sorption isotherms for Inonotus obliquus mushroom. LWT 2008, 41, 1478–1484. [Google Scholar] [CrossRef]
  43. Witczak, T.; Socha, R.; Stępień, A.; Grzesik, M. Candied orange peel produced in solutions with various sugar compositions: Sugar composition and sorption properties of the product. J. Food Process. Eng. 2016, 40, 12. [Google Scholar] [CrossRef]
  44. Ostrowska-Ligęza, E.; Jakubczyk, E.; Górska, A.; Wirkowska-Wojdyła, M.; Bryś, J. The use of moisture sorption isotherms and glass transition temperature to assess the stability of powdered baby formulas. J. Therm. Anal. Calorim. 2014, 118, 911–918. [Google Scholar] [CrossRef] [Green Version]
  45. Jakubczyk, E.; Ostrowska-Ligęza, E.; Gondek, E. Moisture sorption characteristics and glass transition temperature of apple puree powder. Int. J. Food Sci. Technol. 2010, 45, 2515–2523. [Google Scholar] [CrossRef]
  46. Amaral, I.C.; Silva, M.T.S.; Pereira, D.F.; Silva, E.K.; Resende, J.V.; Júnior, R.A.B. Effect of carrier agents on the physical and thermal stability of freeze-dried passion fruit (Passiflora edulis f. flavicarpa) pulp. Dry. Technol. 2016, 34, 713–722. [Google Scholar] [CrossRef]
  47. Shi, Q.; Wang, X.; Zhao, Y.; Fang, Z. Glass transition and state diagram for freeze-dried Agaricus bisporus. J. Food Eng. 2012, 111, 667–674. [Google Scholar] [CrossRef]
  48. Moraga, G.; Talens, P.; Moraga, M.; Martínez-Navarrete, N. Implication of water activity and glass transition on the mechanical and optical properties of freeze-dried apple and banana slices. J. Food Eng. 2011, 106, 212–219. [Google Scholar] [CrossRef]
  49. Pavan, M.A.; Schmidt, S.J.; Feng, H. Water sorption behavior and thermal analysis of freeze-dried, refractance window-dried and hot-air dried açaí (Euterpe oleracea Martius) juice. LWT 2012, 48, 75–81. [Google Scholar] [CrossRef]
  50. Pakowski, Z.; Mujumdar, A.S. Drying of pharmaceutical products. In Handbook of Industrial Drying; Mujumdar, A.S., Ed.; CRC Press: Boca Raton, FL, USA, 2007; Volume 2, pp. 689–712. [Google Scholar]
  51. Operating Instructions: Vaccum Drying Oven VO 200. Available online: https://www.memmert.com/index.php?eID=dumpFile&t=f&f=4699&token=480573c96b64ba6a645bdb0ca725e95a0c7e5be3 (accessed on 3 November 2020).
  52. Brito, V.; Gonçalves, T.D. Drying kinetics of porous stones in the presence of NaCl and NaNO3: Experimental assessment of the factors affecting liquid and vapour transport. Transp. Porous Media 2013, 100, 193–210. [Google Scholar] [CrossRef]
  53. Fullerton, A.; Fischer, T.; Lahti, A.; Wilhelm, K.-P.; Takiwaki, H.; Serup, J. Guidelines for measurement skin colour and erythema: A report from the Standardization Group of the European Society of Contact Dermatitis. Contact Dermat. 1996, 35, 1–10. [Google Scholar] [CrossRef]
  54. Nowacka, M.; Śledź, M.; Wiktor, A.; Witrowa-Rajchert, D. Changes of radical scavenging activity and polyphenols content during storage of dried apples. Int. J. Food Prop. 2014, 17, 1317–1331. [Google Scholar] [CrossRef]
  55. Brand-Williams, W.; Cuvelier, M.; Berset, C. Use of a free radical method to evaluate antioxidant activity. LWT 1995, 28, 25–30. [Google Scholar] [CrossRef]
  56. Dadan, M.; Rybak, K.; Wiktor, A.; Nowacka, M.; Żubernik, J.; Witrowa-Rajchert, D. Selected chemical composition changes in microwave-convective dried parsley leaves affected by ultrasound and steaming pre-treatments—An optimization approach. Food Chem. 2018, 239, 242–251. [Google Scholar] [CrossRef] [PubMed]
  57. International Standard ISO 13299: Sensory Analysis-Methodology-General Guidance for Establishing a Sensory Profile; International Organization for Standardization (ISO): Geneva, Switzerland, 2016.
  58. Basu, S.; Shivhare, U.S.; Mujumdar, A.S. Models for sorption isotherms for foods: A review. Dry. Technol. 2006, 24, 917–930. [Google Scholar] [CrossRef]
  59. Lewicki, P.P. A Three Parameter Equation For Food Moisture Sorption Isotherms. J. Food Process. Eng. 1998, 21, 127–144. [Google Scholar] [CrossRef]
  60. Peleg, M. Assessment of a semi-empirical four parameter general model for sigmoid moisture sorption isotherms. J. Food Process. Eng. 1993, 16, 21–37. [Google Scholar] [CrossRef]
  61. Blahovec, J.; Yanniotis, S. Modified classification of sorption isotherms. J. Food Eng. 2009, 91, 72–77. [Google Scholar] [CrossRef]
  62. Polish Standard. Soups; PN-V-74015:2001; Polish Committee for Standardization: Warsaw, Poland, 2001; Available online: https://sklep.pkn.pl/pn-v-74015-2001p.html (accessed on 3 November 2020).
  63. Mayor, L.; Sereno, A. Modelling shrinkage during convective drying of food materials: A review. J. Food Eng. 2004, 61, 373–386. [Google Scholar] [CrossRef]
  64. Davis, E.A. Functionality of sugars: Physicochemical interactions in foods. Am. J. Clin. Nutr. 1995, 62, 170S–177S. [Google Scholar] [CrossRef]
  65. Therdthai, N.; Zhou, W. Characterization of microwave vacuum drying and hot air drying of mint leaves (Mentha cordifolia Opiz ex Fresen). J. Food Eng. 2009, 91, 482–489. [Google Scholar] [CrossRef]
  66. Antigo, J.L.D.; Bergamasco, R.D.C.; Madrona, G.S. Effect of ph on the stability of red beet extract (Beta vulgaris L.) microcapsules produced by spray drying or freeze drying. Food Sci. Technol. 2017, 38, 72–77. [Google Scholar] [CrossRef] [Green Version]
  67. Kerr, W.L.; Varner, A. Chemical and physical properties of vacuum-dried red beetroot (Beta vulgaris) powders compared to other drying methods. Dry. Technol. 2020, 38, 1165–1174. [Google Scholar] [CrossRef]
  68. Esatbeyoglu, T.; Wagner, A.E.; Schini-Kerth, V.B.; Rimbach, G. Betanin—A food colorant with biological activity. Mol. Nutr. Food Res. 2015, 59, 36–47. [Google Scholar] [CrossRef] [PubMed]
  69. Silva-Espinoza, M.A.; Ayed, C.; Foster, T.J.; Camacho, M.D.M.; Martínez-Navarrete, N. The impact of freeze-drying conditions on the physico-chemical properties and bioactive compounds of a freeze-dried orange puree. Foods 2019, 9, 32. [Google Scholar] [CrossRef] [PubMed] [Green Version]
  70. Guiné, R.P.; Barroca, M.J. Effect of drying treatments on texture and color of vegetables (pumpkin and green pepper). Food Bioprod. Process. 2012, 90, 58–63. [Google Scholar] [CrossRef]
  71. Valdenegro, M.; Almonacid, S.; Henríquez, C.; Lutz, M.; Fuentes, L.; Simpson, R. The effects of drying processes on organoleptic characteristics and the health quality of food ingredients obtained from goldenberry fruits (Physalis peruviana). Open Access Sci. Rep. 2013, 2, 1–7. [Google Scholar]
  72. Sagrin, M.S.; Chong, G. Effects of drying temperature on the chemical and physical properties of Musa acuminata Colla (AAA Group) leaves. Ind. Crop. Prod. 2013, 45, 430–434. [Google Scholar] [CrossRef]
  73. Carrillo, C.; Wilches-Pérez, D.; Hallmann, E.; Kazimierczak, R.; Rembiałkowska, E. Organic versus conventional beetroot. Bioactive compounds and antioxidant properties. LWT 2019, 116, 108552. [Google Scholar] [CrossRef]
  74. Seremet, L.; Nistor, O.V.; Andronoiu, D.G.; Mocanu, G.D.; Barbu, V.V.; Maidan, A.; Rudi, L.; Botez, E. Development of several hybrid drying methods used to obtain red beetroot powder. Food Chem. 2020, 310, 125637. [Google Scholar] [CrossRef]
  75. Șeremet, L.; Nistor, O.V.; Andronoiu, D.G.; Rudi, L.; Botez, E. Influence of different drying methods on the physicochemical properties of red beetroot (Beta vulgaris L. var. Cylindra). Food Chem. 2017, 236, 59–67. [Google Scholar] [CrossRef]
  76. Raharitsifa, N.; Ratti, C. Foam-mat freeze-drying of apple juice part 2: Stability of dry products during storage. J. Food Process. Eng. 2010, 33, 341–364. [Google Scholar] [CrossRef]
  77. Getahun, E.; Gabbiye, N.; Delele, M.A.; Fanta, S.W.; Gebrehiwot, M.G.; Vanierschot, M. Effect of maturity on the moisture sorption isotherm of chili pepper (Mareko Fana variety). Heliyon 2020, 6, e04608. [Google Scholar] [CrossRef] [PubMed]
  78. Filho, J.L.; Romanelli, P.; Barboza, S.; Gabas, A.; Romero, J.T. Sorption isotherms of alligator’s meat (Caiman crocodilus yacare). J. Food Eng. 2002, 52, 201–206. [Google Scholar] [CrossRef]
  79. Rohvein, C.; Santalla, E.; Gely, M.C. Note: Estimation of sorption isotherm and the heat of sorption of quinoa (Chenopodium quinoa Willd.) seeds. Food Sci. Technol. Int. 2004, 10, 409–413. [Google Scholar] [CrossRef]
  80. Lewicki, P. The applicability of the GAB model to food water sorption isotherms. Int. J. Food Sci. Technol. 1997, 32, 553–557. [Google Scholar] [CrossRef]
  81. Stępień, A.; Witczak, M.; Witczak, T. Moisture sorption characteristics of food powders containing freeze dried avocado, maltodextrin and inulin. Int. J. Biol. Macromol. 2020, 149, 256–261. [Google Scholar] [CrossRef]
  82. Giovanelli, G.; Zanoni, B.; Lavelli, V.; Nani, R. Water sorption, drying and antioxidant properties of dried tomato products. J. Food Eng. 2002, 52, 135–141. [Google Scholar] [CrossRef]
  83. Kiranoudis, C.; Maroulis, Z.; Tsami, E.; Marinos-Kouris, D. Equilibrium moisture content and heat of desorption of some vegetables. J. Food Eng. 1993, 20, 55–74. [Google Scholar] [CrossRef]
  84. Yanniotis, S.; Blahovec, J. Model analysis of sorption isotherms. LWT 2009, 42, 1688–1695. [Google Scholar] [CrossRef]
  85. Gruyaert, E.; Dieleman, C.; De Belie, N. Influence of sample preparation and the addition of BFS on water vapour sorption isotherms. In Proceedings of the International Conference on Durability of Building Materials and Components, Porto, Portugal, 12–15 April 2011; pp. 1–8. [Google Scholar]
Figure 1. Scheme of lyophilization equipment.
Applsci 11 00654 g001
Figure 2. Sorption isotherms—the experimental set up of static method.
Applsci 11 00654 g002
Figure 3. The pumpkin (A), cucumber (B), tomato (C), and beetroot (D) of fresh (a) and freeze-dried (b) soups.
Applsci 11 00654 g003
Figure 4. Sorption isotherms of different freeze-dried soups obtained using: (a) a static method (lines—Peleg model); (b) a dynamic vapor sorption method (DVS) method.
Applsci 11 00654 g004
Figure 5. aw/w plotted against water activity (aw) obtained during the adsorption of freeze-dried soups.
Applsci 11 00654 g005
Figure 6. Kinetics of water sorption of freeze-dried soups at aw = 0.75.
Applsci 11 00654 g006
Table 1. Main ingredients and composition of selected commercial vegetable soups.
-Tomato Soup (Cream)Beetroot SoupPumpkin Soup (Cream)Cucumber Soup
Main ingredients:----
-Tomato pulp, tomato paste and diced tomato (64%) water, a mixture of chopped vegetables, rapeseed oilWater,
red beetroot (31%),
string and red beans, a mixture of chopped vegetables, rapeseed oil
Water,
pumpkin (35%),
a mixture of chopped vegetables, rapeseed oil
Water,
pickled cucumbers (21%),
a mixture of chopped vegetables, rapeseed oil
Concentration of solid constituents (g/100 g):
Carbohydrates3.77.83.72.3
-including sugars3.64.33.10.9
Fiber1.61.2<0.50.9
Protein1.10.70.70.5
Fat1.9<0.51.5<0.5
Salt0.630.890.611
Table 2. Sensory attributes and their definitions.
AttributesDefinitionScale-Boundary Conditions
ColorColor typical for the main vegetable ingredient of a selected soup: tomato (red), pumpkin (yellow), beetroot (red-violet), pickled cucumber (green)1-very bright color
10-dark, deep color
ConsistencyConsistency from thin, watery, to thick1-thin
10-thick
TasteTaste typical for the main ingredient of the soup1-no perceptible flavor
10-intensive perceptible flavor
AromaAroma typical of the main vegetable ingredient of the soup 1-no perceptible aroma
10-Intensive perceptible aroma
Overall qualityOverall evaluation1-low
10-high
Table 3. Concentration of the main solid compounds of different freeze-dried soups.
Concentration of Main Solid Compounds g/100 gTomato SoupBeetroot SoupPumpkin SoupCucumber Soup
Sugars33.6 ± 3.340.6 ± 1.544.5 ± 1.913.9 ± 0.5
Salt5.7 ± 0.68.4 ± 0.38.8 ± 0.415.4 ± 0.6
Fiber8.4 ± 0.88.5 ± 0.3-13.9 ± 0.5
Table 4. Water content and water activity of different fresh freeze-dried and stored soups.
Kind of SoupProductWater Content (%)Water Activity
Tomato soupfresh89.5 ± 0.4 a*0.976 ± 0.001 a
dried2.0 ± 0.2 c0.206 ± 0.006 c
stored3.6 ± 0.2 b0.268 ± 0.051 b
Beetroot soupfresh89.7 ± 0.2 a0.980 ± 0.002 a
dried2.6± 0.1 c0.221 ± 0.002 c
stored4.1± 0.4 b0.286 ± 0.011 b
Pumpkin soupfresh93.2 ± 0.1 a0.980 ± 0.001 a
dried2.3± 0.1 c0.197 ± 0.001 c
stored3.9 ± 0.3 b0.279 ± 0.009 b
Cucumber soupfresh93.7 ± 0.1 a 0.973 ± 0.004 a
dried2.9 ± 0.1 c 0.199 ± 0.011 c
stored3.7 ± 0.3 b0.271 ± 0.021 b
* the different letter in the columns (for the same kind of soup) indicates the significant difference between the obtained values for fresh, dried and stored samples p ≤ 0.05.
Table 5. Color of different fresh, freeze-dried, and stored soups.
ProductL*+a*+b*Chroma
C*
Hue
Total
Color Change
ΔE*ab
Tomato soup
fresh44.67 ± 0.08 c*33.98 ± 0.40 a59.84 ± 0.24 a68.81 ± 0.40 a 60.41 ± 0.20 a-
dried52.09 ± 0.05 b32.46 ± 0.20 b54.40 ± 0.12 b63.35 ± 0.20 b 59.17 ± 0.10 b9.32 ± 0.08 b
stored 60.05 ± 0.95 a28.74 ± 0.91 c45.64 ± 0.93 c53.93 ± 1.27 c57.90 ± 0.32 c21.64 ± 0.35 a
Beetroot soup
fresh23.05 ± 0.04 b39.64 ± 0.60 a10.72 ± 0.40 b41.06 ± 0.63 a15.25 ± 0.35 c-
dried55.07 ± 0.02 a21.91 ± 0.30 b13.97 ± 0.30 a25.98 ± 0.41 b 32.65 ± 0.30 a36.74 ± 0.11 a
stored54.79 ± 0.75 a21.05 ± 0.82 b10.05 ± 2.83 b22.42 ± 2.11 b 25.55 ± 5.45 b33.34 ± 1.40 a
Pumpkin soup
fresh56.13 ± 0.03 c11.13 ± 0.20 a64.66 ± 0.11 a65.61 ± 0.16 a80.29 ± 0.20 c-
dried62.53 ± 0.03 b6.92 ± 0.05 b60.05 ± 0.70 b60.45 ± 0.70 b83.50 ± 0.09 b8.94 ± 0.23 b
stored68.04 ± 0.61 a 4.04 ± 0.08 c45.21 ± 0.25 c45.39 ± 0.25 c84.92 ± 0.10 a23.88 ± 0.10 a
Cucumber soup
fresh56.38 ± 0.07 c6.01 ± 0.02 a44.53 ± 0.70 b44.94 ± 0.63 b82.50 ± 0.10 c-
dried66.03 ± 0.03 b2.66 ± 0.04 b49.05 ± 0.12 a49.12 ± 0.12 a86.90 ± 0.07 b11.18 ± 0.39 b
stored72.08 ± 0.82 a1.01 ± 0.11c35.04 ± 0.81 c35.05 ± 0.81 c88.45± 0.20 a19.01 ± 0.54 a
* the different letter in the columns (for the same kind of soup) indicates the significant difference between the obtained values for fresh, dried and stored samples p ≤ 0.05.
Table 6. Selected biochemical properties of different fresh, freeze-dried, and stored soups.
ProductpHContent of Polyphenolic Compounds (TPC)
(mg GAE/100 g d.m.)
EC 50
DPPH•
(mg/mL)
Tomato soup
fresh3.95 ± 0.14 a*763 ± 15 a2.08 ± 0.14 b
dried4.17 ± 0.08 a543 ± 22 b2.38 ± 0.09 a
stored4.05 ± 0.11 a401 ± 29 c-
Beetroot soup
fresh4.74 ± 0.08 a595 ± 49 a 1.26± 0.08 a
dried4.85 ± 0.10 a537 ± 57 a1.24 ± 0.09 a
stored4.80 ± 0.12 a521 ± 47 a-
Pumpkin soup
fresh5.59 ± 0.09 a556± 42 a1.15 ± 0.03 b
dried5.65 ± 0.07 a501 ± 47 ab1.26 ± 0.04 a
stored5.61 ± 0.09 a451 ± 47 b-
Cucumber soup
fresh3.89 ± 0.03 b569± 50 a2.26 ± 0.09 b
dried4.20 ± 0.07 a367 ± 55 b3.19 ± 0.04 a
stored4.02 ± 0.11 ab311 ± 41b-
* the different letter in the columns (for the same kind of soup) indicates the significant difference between the obtained values for fresh, dried and stored samples p ≤ 0.05.
Table 7. Changes of sensory attributes (%) after rehydration of freeze-dried soups in comparison to freshly prepared soups.
ProductColorConsistencyTasteAromaOverall Quality
Tomato soup36 ± 35 ± 118 ± 224 ± 226 ± 3
Beetroot soup42 ± 50 ± 09 ± 111 ± 116 ± 2
Pumpkin soup31 ± 20 ± 011 ± 121 ± 220 ± 1
Cucumber35 ± 34 ± 11 ± 017 ± 118 ± 2
Table 8. Parameters of isotherm sorption models obtained for different freeze-dried soups.
Model ParameterTomatoBeetrootPumpkinCucumber
GAB 1um24.6665.4269.11107.09
C0.330.20.170.06
k0.920.840.830.97
R20.9980.9780.9980.97
RMS14.1120.0515.2447.35
P8.5214.579.7737.65
BET 2um11.128.8818.0268.37
c0.82.030.530.06
R20.9960.960.9920.972
RMS15.2216.5914.7880.49
P9.7711.788.4956.34
Lewicki 1F3.1316.7313.295.23
G 1.590.890.961.78
H−35.594.193.976.21
R20.9660.9890.9980.966
RMS48.0818.8514.0135.21
P29.912.967.625.7
Peleg 1A108.81120.44109.87325.43
B19.125.3917.862.16
D5.873.824.675.91
E1.290.261.130.04
R20.9990.9760.9990.989
RMS13.1613.1411.8921.31
P7.639.166.4416.5
Hasley 1g4.125.95.483
h0.770.810.810.58
R20.9950.9690.9910.962
RMS25.5123.3242.6835.69
P15.2117.9223.7829.28
1 in the water activity range of 0–0.85, 2 in the water activity range of 0–0.53.
Table 9. Parameters of classification of sorption isotherms.
ParameterBeetroot SoupCucumber Soup
X45.21 (X4 > 0.1)3.61 (X4 > 0.1)
D100.75 (positive)1.47 (positive)
Rfi−0.16 (negative)−0.27 (negative)
awm0.28 (0.1)0.30 (0.1)
Publisher’s Note: MDPI stays neutral with regard to jurisdictional claims in published maps and institutional affiliations.

