Article

Impact of Bimodal Particle Size Distribution Ratio of Functional Calcium Carbonate Filler on Thermal and Flowability Properties of Polyamide 12

1
Research and Development Department, Omya International AG, 4665 Oftringen, Switzerland
2
Department of Printing and Media, Hochschule der Medien, 70569 Stuttgart, Germany
3
College of Engineering, Swansea University, Swansea SA2 8PP, UK
4
School of Chemical Engineering, Department of Bioproducts and Biosystems, Aalto University, Aalto, 00076 Helsinki, Finland
*
Author to whom correspondence should be addressed.
Appl. Sci. 2021, 11(2), 641; https://doi.org/10.3390/app11020641
Submission received: 13 December 2020 / Revised: 30 December 2020 / Accepted: 6 January 2021 / Published: 11 January 2021

Abstract

:
In previous investigations, it was shown that the melting, as well as crystallization behavior of polyamide 12, could be manipulated by adjusting the particle size distribution of calcium carbonate as a functional filler. It was demonstrated that the melt properties of this compound show a significant dependency on the filler volume-based particle size. As finer and narrower the calcium carbonate particles in the polymer matrix become, the less influence the filler has on the melting properties, influencing the melt flow less significantly than the same surface amount of broad size distribution coarse calcium carbonate filler particles. However, due to increased nucleation, the crystallization behavior on cooling showed a markedly more rapid onset in the case of fine sub-micrometer filler particle size. To control further and optimize the thermal response properties of a filling compound for improved properties in additive manufacturing processing through selective laser sintering, the possibility to combine precisely defined particle size distributions has been studied, thereby combining the benefits of each particle size range within the chosen material size distribution contributes to the matrix. The melt flow at 190 °C, the melting speed, melting and crystallization point as well as crystallization time at 170 °C were analyzed. The thermal and flow properties of a polyamide 12 matrix can potentially be optimized with a combination of a precise amount of coarse and fine calcium carbonate filler. The improvements were exemplified using a twin-screw extruder for compounding, indicating the potential for optimizing functionally filled polymer in additive manufacturing.

1. Introduction

Previous investigations demonstrated the potential optimization of a functionally filled polymer for additive manufacturing, by adjusting the particle size distribution of calcium carbonate as a mineral filler [1]. Additive manufacturing (AM) continues to develop rapidly, with a particular focus on three-dimensional layer-by-layer processing, in which each layer is bonded/fused together by one of the various different techniques, such as sintering, melting, chemical reaction, curing, etc. [2]. The technique has shown its suitability for constructing complex geometries; in some cases, impossible to achieve using subtractive techniques [3]. Applications have also grown, ranging from automotive and aerospace to biomedicine and art design [3,4,5,6]. Current materials commonly used in AM are frequently plastic or metal-based [7,8].
A major sector of AM employs selective laser sintering (SLS), which readily interfaces with computer-aided design (CAD) as the print template formed from a powder bed by fusing the layers of powder together adopting a laser beam of material-selective absorbing wavelength. Engineering thermoplastics and metals are used [4]. Polyamides/nylons, typically polyamide 12, are among the commonly used thermoplastics [5].
Prior work has identified the process limitations, which can prevent successful processing in selective laser sintering [5,6,7,8,9,10,11]. The most important factors are the crucial need for consistent, optimized thermal properties and the physical flow and layering properties defined by the particle size of the polymer/composite powder [12]. Guo et al. described how it is possible to reduce manufacturing and material costs, including increasing energy efficiency, by adding an environmentally friendly filler material, such as calcium carbonate, into the polymer matrix [13]. Following this adoption of filler, our own previous work [1,14], among others, addressed the potential for further reduction of the current high energy consumption involved in selective laser sintering [15,16,17]. This is achieved by introducing filler with controlled thermal capacity and conductivity. By increasing the thermal conductivity above that of PA12 alone, the laser power needed to sinter the polymer is reduced. In parallel, the increase in thermal capacity offered by the filler opens the possibility of employing greater total energy density without subsequent material bulk distortion during re-crystallization [1]. In addition, if a filler can be used that enhances laser radiative absorption, further energy utilization could be supported. Calcium carbonate, in the form of limestone, can be employed as a functional filler in that its properties can be adjusted to enhance both the melting and crystallization behavior [1]. Calcium carbonate was chosen in this work to represent a commonly used high brightness filler in polymer applications. Advantages of using natural ground calcium carbonate include the lower resistance to flow offered by isometric granular particles of crystalline calcite, as opposed to anisometric platelets or needle-like structures of high aspect ratio typical of kaolin, talc or mica and precipitated scalenohedral or aragonitic calcium carbonate, respectively. The relatively low hygroscopy of calcium carbonate—in comparison with, say, gypsum (calcium sulfate), which exists with thermally unstable crystal water (hemihydrate versus dihydrate), with the anhydrous form being particularly problematic due to its desiccant behavior—is a suitably optimal choice when among the various calcium salts in respect to maintaining consistent humidity and surface energy as a function of temperature in application with a lipophilic polymer, such as polyamide 12. A further high brightness filler candidate is barium sulfate, not within the scope of study here, but which has the frequently cited disadvantage of having a much higher density than calcium carbonate, 4.49 gcm−3 versus 2.71 gcm−3, respectively, especially critical in lighter weight applications as typically targeted for polymer use.
This study sets out to illustrate the ability to manipulate the thermal properties beneficially by blending two discrete designed calcium carbonate particle size distributions in an optimized ratio. The compounding benefits are exemplified with respect to the improved final properties derived in a twin-screw extruded compound. The results reported here are expected to be transferrable for use in an additive manufacturing process.

2. Materials and Methods

The layer melting process and subsequent crystallization process can be, respectively optimized and accelerated by controlling the thermally related flow properties of polyamide 12 [1]. Applying these principles, the potential for improving laser sintering was highlighted. We set out to extend the understanding in this respect of the role of filler particle size distribution. The work focuses on the case of calcium carbonate compounded with polyamide 12 and the impact of generating a discretely bimodal particle size distribution on the resulting thermal properties.
To be able to compare the new results from compounded polyamide 12 containing bimodal filler size distributions with those from the previous monomodal sized filler investigations, both the compression molding process and the analytical procedures were maintained identical. For completeness, these methods are outlined briefly in the following sections.

2.1. Materials

Ground calcium carbonate (GCC) is used as the mineral filler material, “Omyacarb® 10-AV”, a marble-derived product provided by Omya International AG (Baslerstrasse 42, 4665 Oftringen, Switzerland). SLS-approved polyamide 12 (polyamide PA2200) powder was sourced from EOS e-Manufacturing Solutions (Electro Optical Systems, Robert-Stirling-Ring 1, 82,152 Krailling, Germany). The principal material specifications are summarized in Table 1.

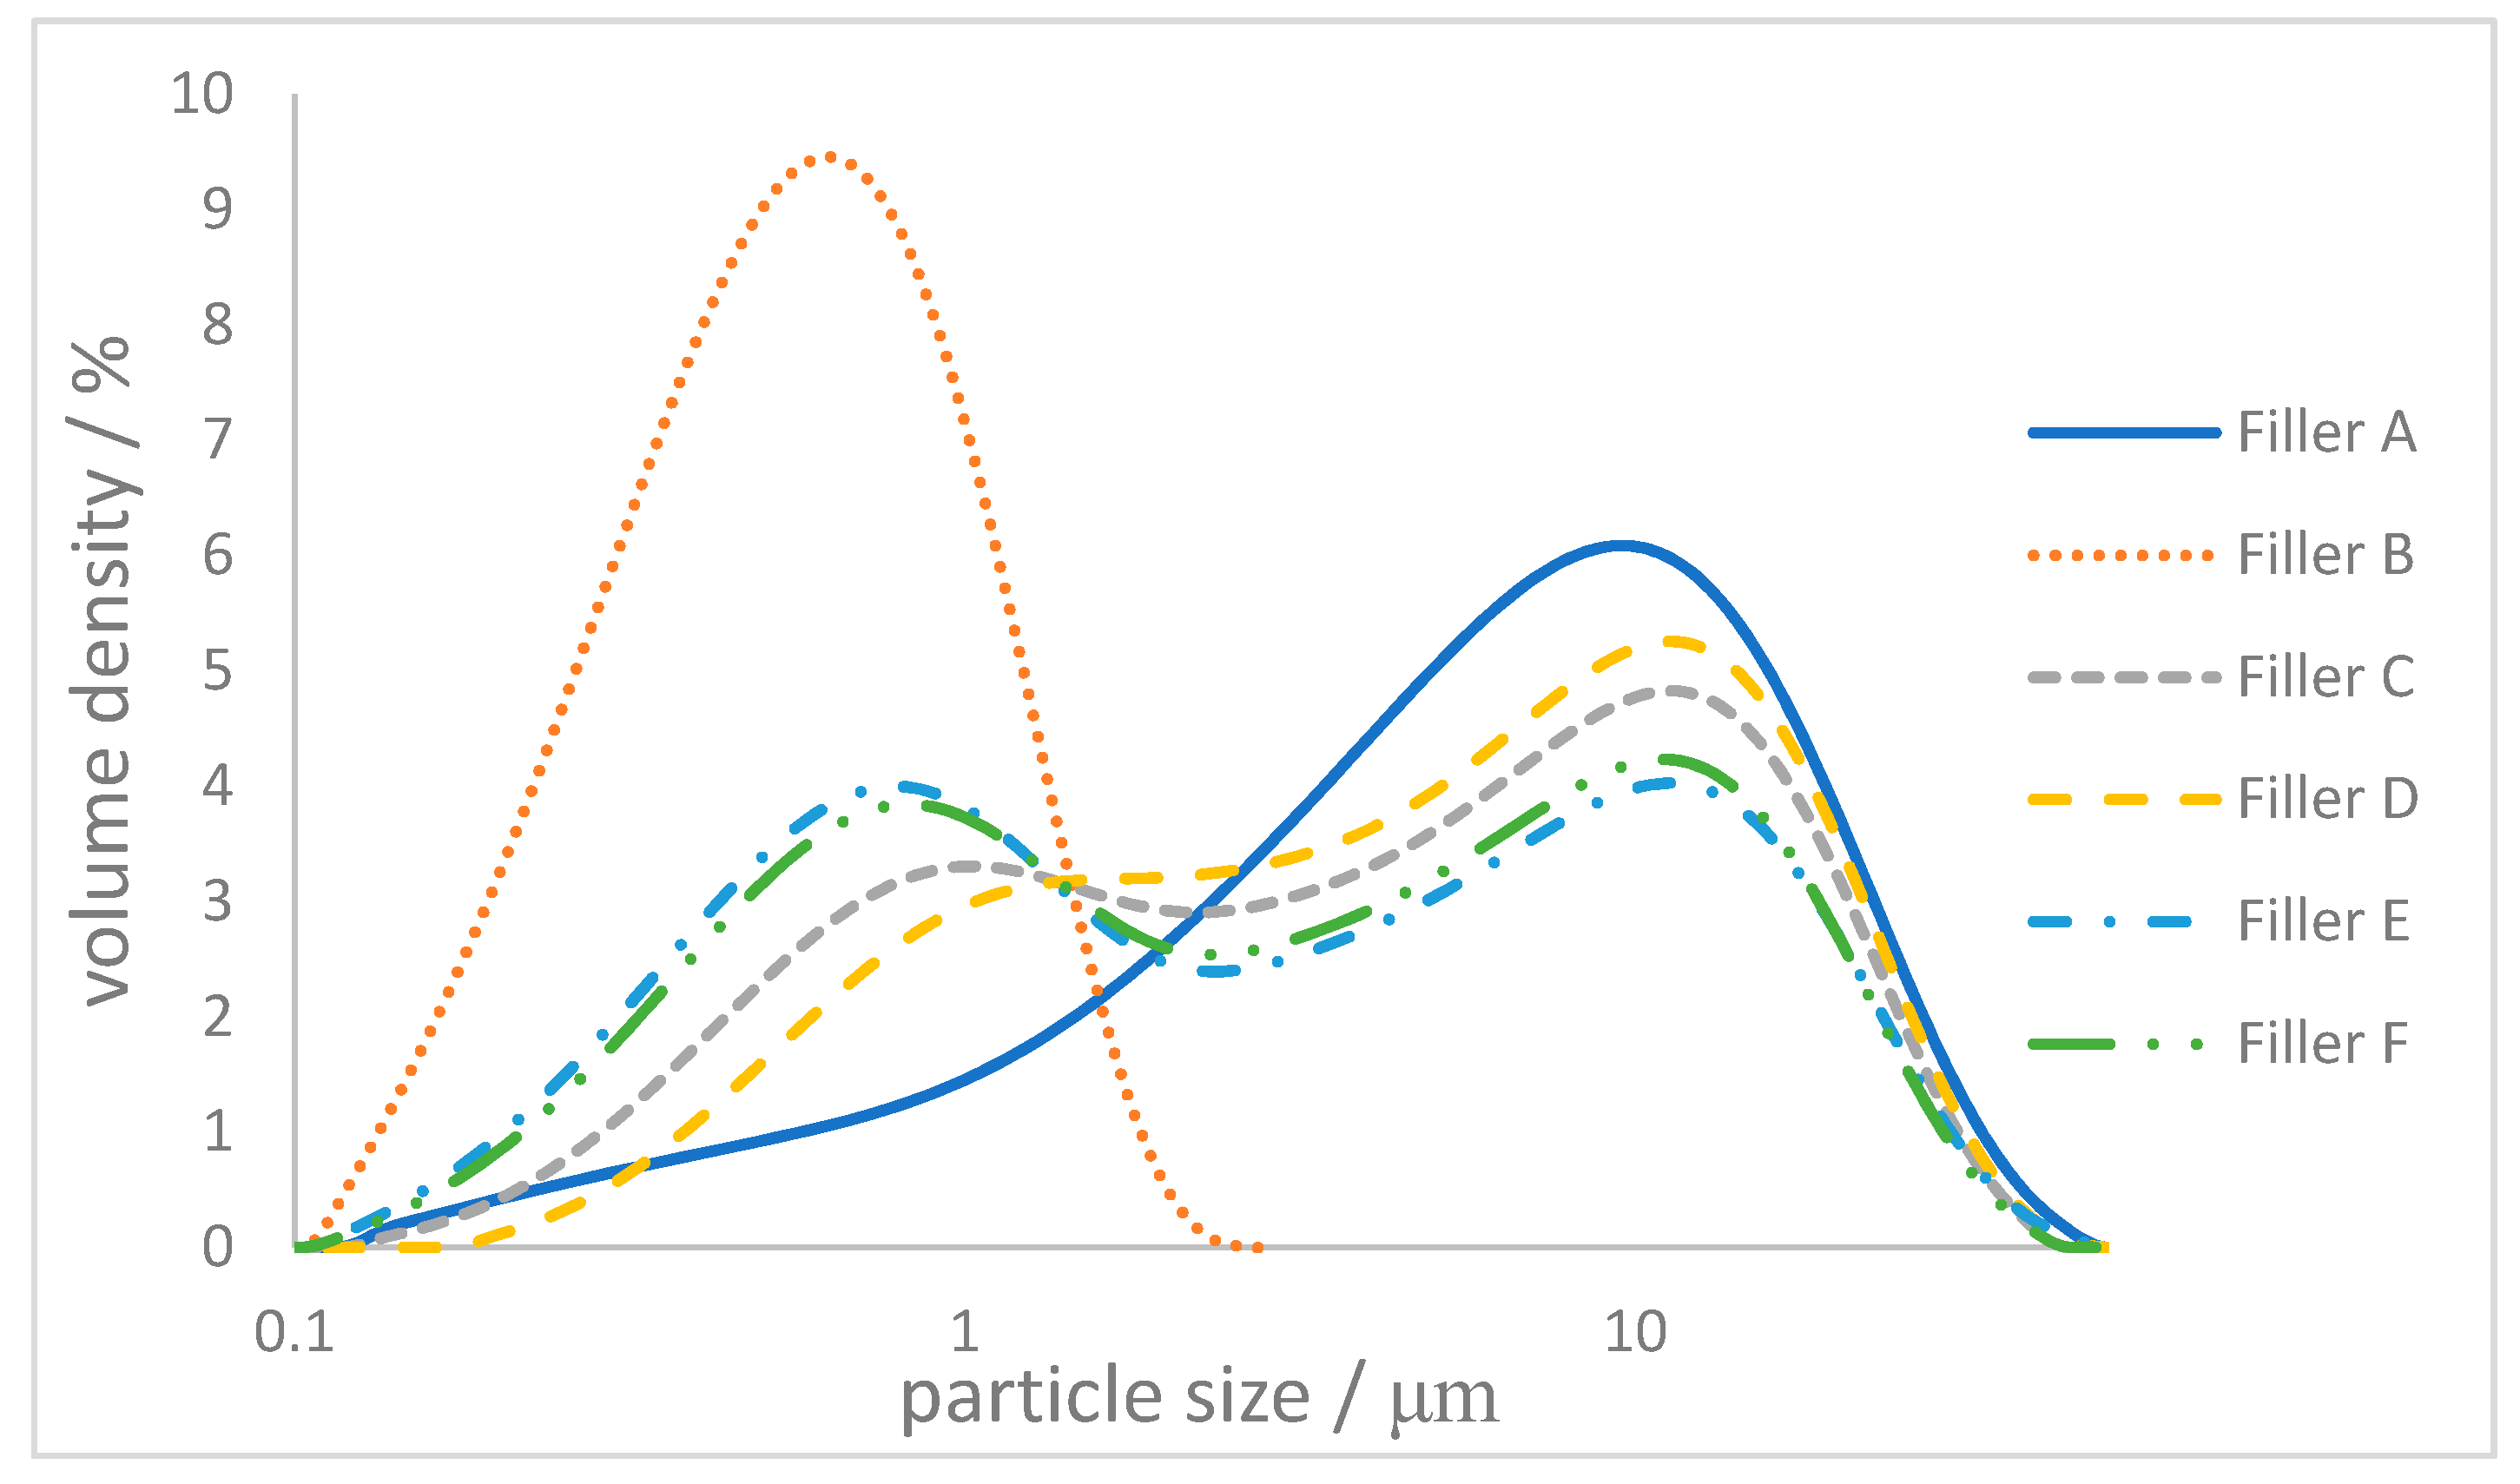
2.2. Controlling the Particle Size Distribution

Filler particle size was controlled using a wet grinding process by dispersing the calcium carbonate feed in demineralized water at a solids content of 25 w/w%. Chemical-free grinding was applied using an agitator ball mill (Dyno®-Mill KDL-Pilot from Willy A. Bachofen AG Maschinenfabrik, 4132 Muttenz, Switzerland) adopting zirconium dioxide grinding beads of 0.7–1.4 mm diameter. Grinding was pursued to different levels of particle fineness. The ground suspensions were subsequently spray-dried in a “GEA Niro MOBILE MINORTM” nozzle spray dryer (GEA Group, Peter-Müller-Strasse 12, 40,468 Düsseldorf, Germany) exposed to an atomization temperature of 200 °C at 3 bar, and expelled eventually at 90 °C.
Specific surface area (SSA) was determined using the gas adsorption BET-Method recording the adsorption cycle of nitrogen as a function of applied partial pressure (ASAP 2460 Surface Area and Porosity Analyzer, Micromeritics®, 4356 Communications Drive, Norcross, GA 30093-2901, USA) [13].
The particle size distribution of the derived filler was determined in suspension using time-average laser light scattering (Malvern Instruments Mastersizer 3000, Malvern Panalytical Ltd., Enigma Business Park, Grovewood Road, Malvern WR14 1XZ, United Kingdom) recording the particulate scattering volume adopting the Fraunhofer particle scattering model. To provide the necessary colloidal stability, and hence the required particle–particle separation, the suspension was further diluted with demineralized water and the addition of approximately 500 ppm of polyacrylate dispersing agent. The dispersant was used only for particle size determination, and that filler used in the polyamide 12 composite samples was maintained dispersant-free.
To be able to combine the beneficial effect of both the marked increase in the melting rate, caused by the coarse fraction, i.e., thermal conductivity and capacity-related, as well as the stabilizing of the melt flow by the sub-micrometer fraction, two functional fillers were produced. Table 2 shows an overview of the resulting volume-based 50 v/v% less than (median) particle size dv50 and specific surface area properties of the processed functional filler particle after the drying step.
As suggested in the previous publication [1], the greatest influence on the melting properties of a final compound was achieved by an implementation of approx. 10 to 20 m2 per 100 g polyamide 12 of a coarse filler fraction of approximately 5 μm in dv50. An increased amount of sub-micrometer filler particles should result in an increased tendency for nucleation without having a significant influence on the melt flow. The two functional fillers of different particle sizes were combined in specific ratios to optimize the precise thermal response parameters.
Table 3 gives an overview of all tested ratios, as well as the resulting carbonate surface. Figure 1 shows the individual particle size distribution of each of the final combined functional fillers. The precise mixture of the two monomodal mineral filler results in a controlled bimodal particle size distribution, as desired for the investigation.
In the context of the study reported here, it is enlightening to consider the particle size distributions, Figure 1, in a little more detail. Taking note of the logarithmic size scale, the fine component, Filler B, displays a close to perfect Gaussian (bell-shaped) curve, which indicates a log-normal distribution, and the volume median dv50 size equals the mode, or most commonly present particle volume size. The nature of calcium carbonate when ground in water leads to a dynamic dissolution and re-precipitation of ultrafine particles, and, in addition, the grinding process itself creates fines from the desired larger particles in Filler A. This leads to a distinctive skew of the distribution, such that not only the desired coarse material is obtained, but also at least 10 v/v% of the sample consists of particles that cover the range of the distribution for the fine Filler B. For the purposes laid out here, the overlap in fines is advantageous since the process requires a number of properties that benefit from a broad size distribution, such as filler particle powder flowability, sufficient surface area even of the coarse fraction to provide composite homogeneity and to support controlled polymer crystallization nucleation. The presence of fines in the coarse fraction also supports a mid-range particle size continuity in the bimodal mix of coarse and fine materials, which supports the uniformity of compounding and acts against settling and/or demixing. Furthermore, the volume median dv50 lies away from the mode volume size for the coarse fraction, such that the volume capacity, and, therefore, heat capacity is represented by particles considerably larger than the median. Conversely, the majority of the surface area of the coarse fraction, Filler A, is contributed by the fines it contains.

2.3. Formulating Filler and Polyamide 12

Polyamide 12 powder was premixed with the specific weight-defined amount of the functional filler. To achieve homogeneity of the mix, batch processing (MP-LB mixer from Somakon Verfahrenstechnik UG, 44,536 Lünen, Germany) was used, adopting a mixing time of 10 min under vigorous stirring at 500 min−1 (rpm).
The interaction between the filler and the polymer occurs at the interfacial surfaces. Therefore, the surface area is used to describe the functional loading effect of the filler. Thus, the surface area introduced by a given amount of filler is shown per 100 g polymer (Table 4).

2.4. Incorporating the Fillers into the Polyamide 12 by Compounding

The filler–polymer powder mix resulted in a homogeneously mixed powder blend, for use directly in twin-screw extrusion (Extruder ZE 12 from Three-Tec GmbH, 5703 Seon, Switzerland). The extruder barrel-length was 25 cm, housing the twin-screws, each of diameter 12 mm having a flank pitch of 12 mm. The barrel temperature profile was split into three sections along its length: inlet temperature of 160 °C, compounding zone 200 °C and outlet 170 °C. The twin-screw rotation speed was maintained at a constant 90 min⁻1 (rpm) throughout, resulting in a compounding residence time ~30 s. The extrudate was formed through a filament nozzle, diameter 2 mm, and subsequent granulation generated cylindrical pellets of length ~1 mm.
The compounded samples were stored under constant environmental conditions (50% RH at 22 °C) for at least 24 h before analysis.

2.5. Analytical Thermal Methods Applied to Composites

2.5.1. Thermogravimetric Analysis

The degradation temperature of the compounds was analyzed by thermogravimetric analysis (TGA) (Im Hackacker 15, 8902 Urdorf, Switzerland). The technique enables changes in the physical and chemical properties of materials to be determined as a function of increasing temperature. It is regularly used in this context to measure thermal degradation occurring in filled organic materials. In addition, it is possible in turn to determine approximate values of sample humidity, the content of low-molecular auxiliary agents and the total organic material content each revealed as temperature rises. Depending on the measuring method, the thermal degradation of all likely components can be determined up to 1000 °C as a summation (cumulative loss of mass).
TGA curves were generated using a Mettler-Toledo TGA/DSC 1-LF apparatus, applying a continuous flow of nitrogen gas (50 cm3 min−1). The samples (~150 mg) were initially heated to 100 °C, kept at this constant temperature for 2 min and then heated up to 700 °C at a rate of 10 °C min−1. The onset temperature of the main gravimetric weight loss of the compound during temperature increase from 100 °C to 600 °C was determined.
Successful laser sintering depends on the material heat conductivity, thermal capacity and melt flow properties. Therefore, the phase change behavior in response to thermal energy input revealed by TGA provides a crucial assessment of suitability for SLS [18].

2.5.2. Melt Flow Index

The melt flow index (MFI) is defined as the mass flow through a standard die under a given pressure. The units are reported as grams throughput in 10 min, in response to a constant piston pressure at a temperature at/above the melting temperature of the polymer or compound. For a pure polymer, the MFI is an assessment of average molecular mass and is an inverse measure of the melt flow viscosity at the conditions of the test [18]. It must be kept in mind that the resulted viscosity value for a measured material is only valid on the applied force and temperature. The MFI is particularly used here while it is commonly applied in the polymer industry to provide a process-related index of particular relevance to extrusion, where throughput flowability is a criterion for efficiency and processability under a given pressure. It is, therefore, more easily related to practice than a rheometrically determined dynamic viscosity, which refers specifically to an equilibrium shear condition rather than an industrially relevant response to a given pressure driving the response rate of passage through processing die.
The MFI was determined with the use of a CEAST Melt Flow Index Tester Model 702,700 (Schenck Technologie- und Industriepark, Landwehrstrasse 65, 64,293 Darmstadt, Germany), according to the DIN EN ISO 1133 guidelines.
The compound was preheated in the cylindrical instrument barrel for 5 min without pressure load at 190 °C. Afterward, a constant piston pressure, arising from the loading of 2.16 kg, was applied to the material and pressed through a die with a diameter of 2.095 mm. The measuring length, which the material travels in the barrel, was kept constant at 20.00 mm.

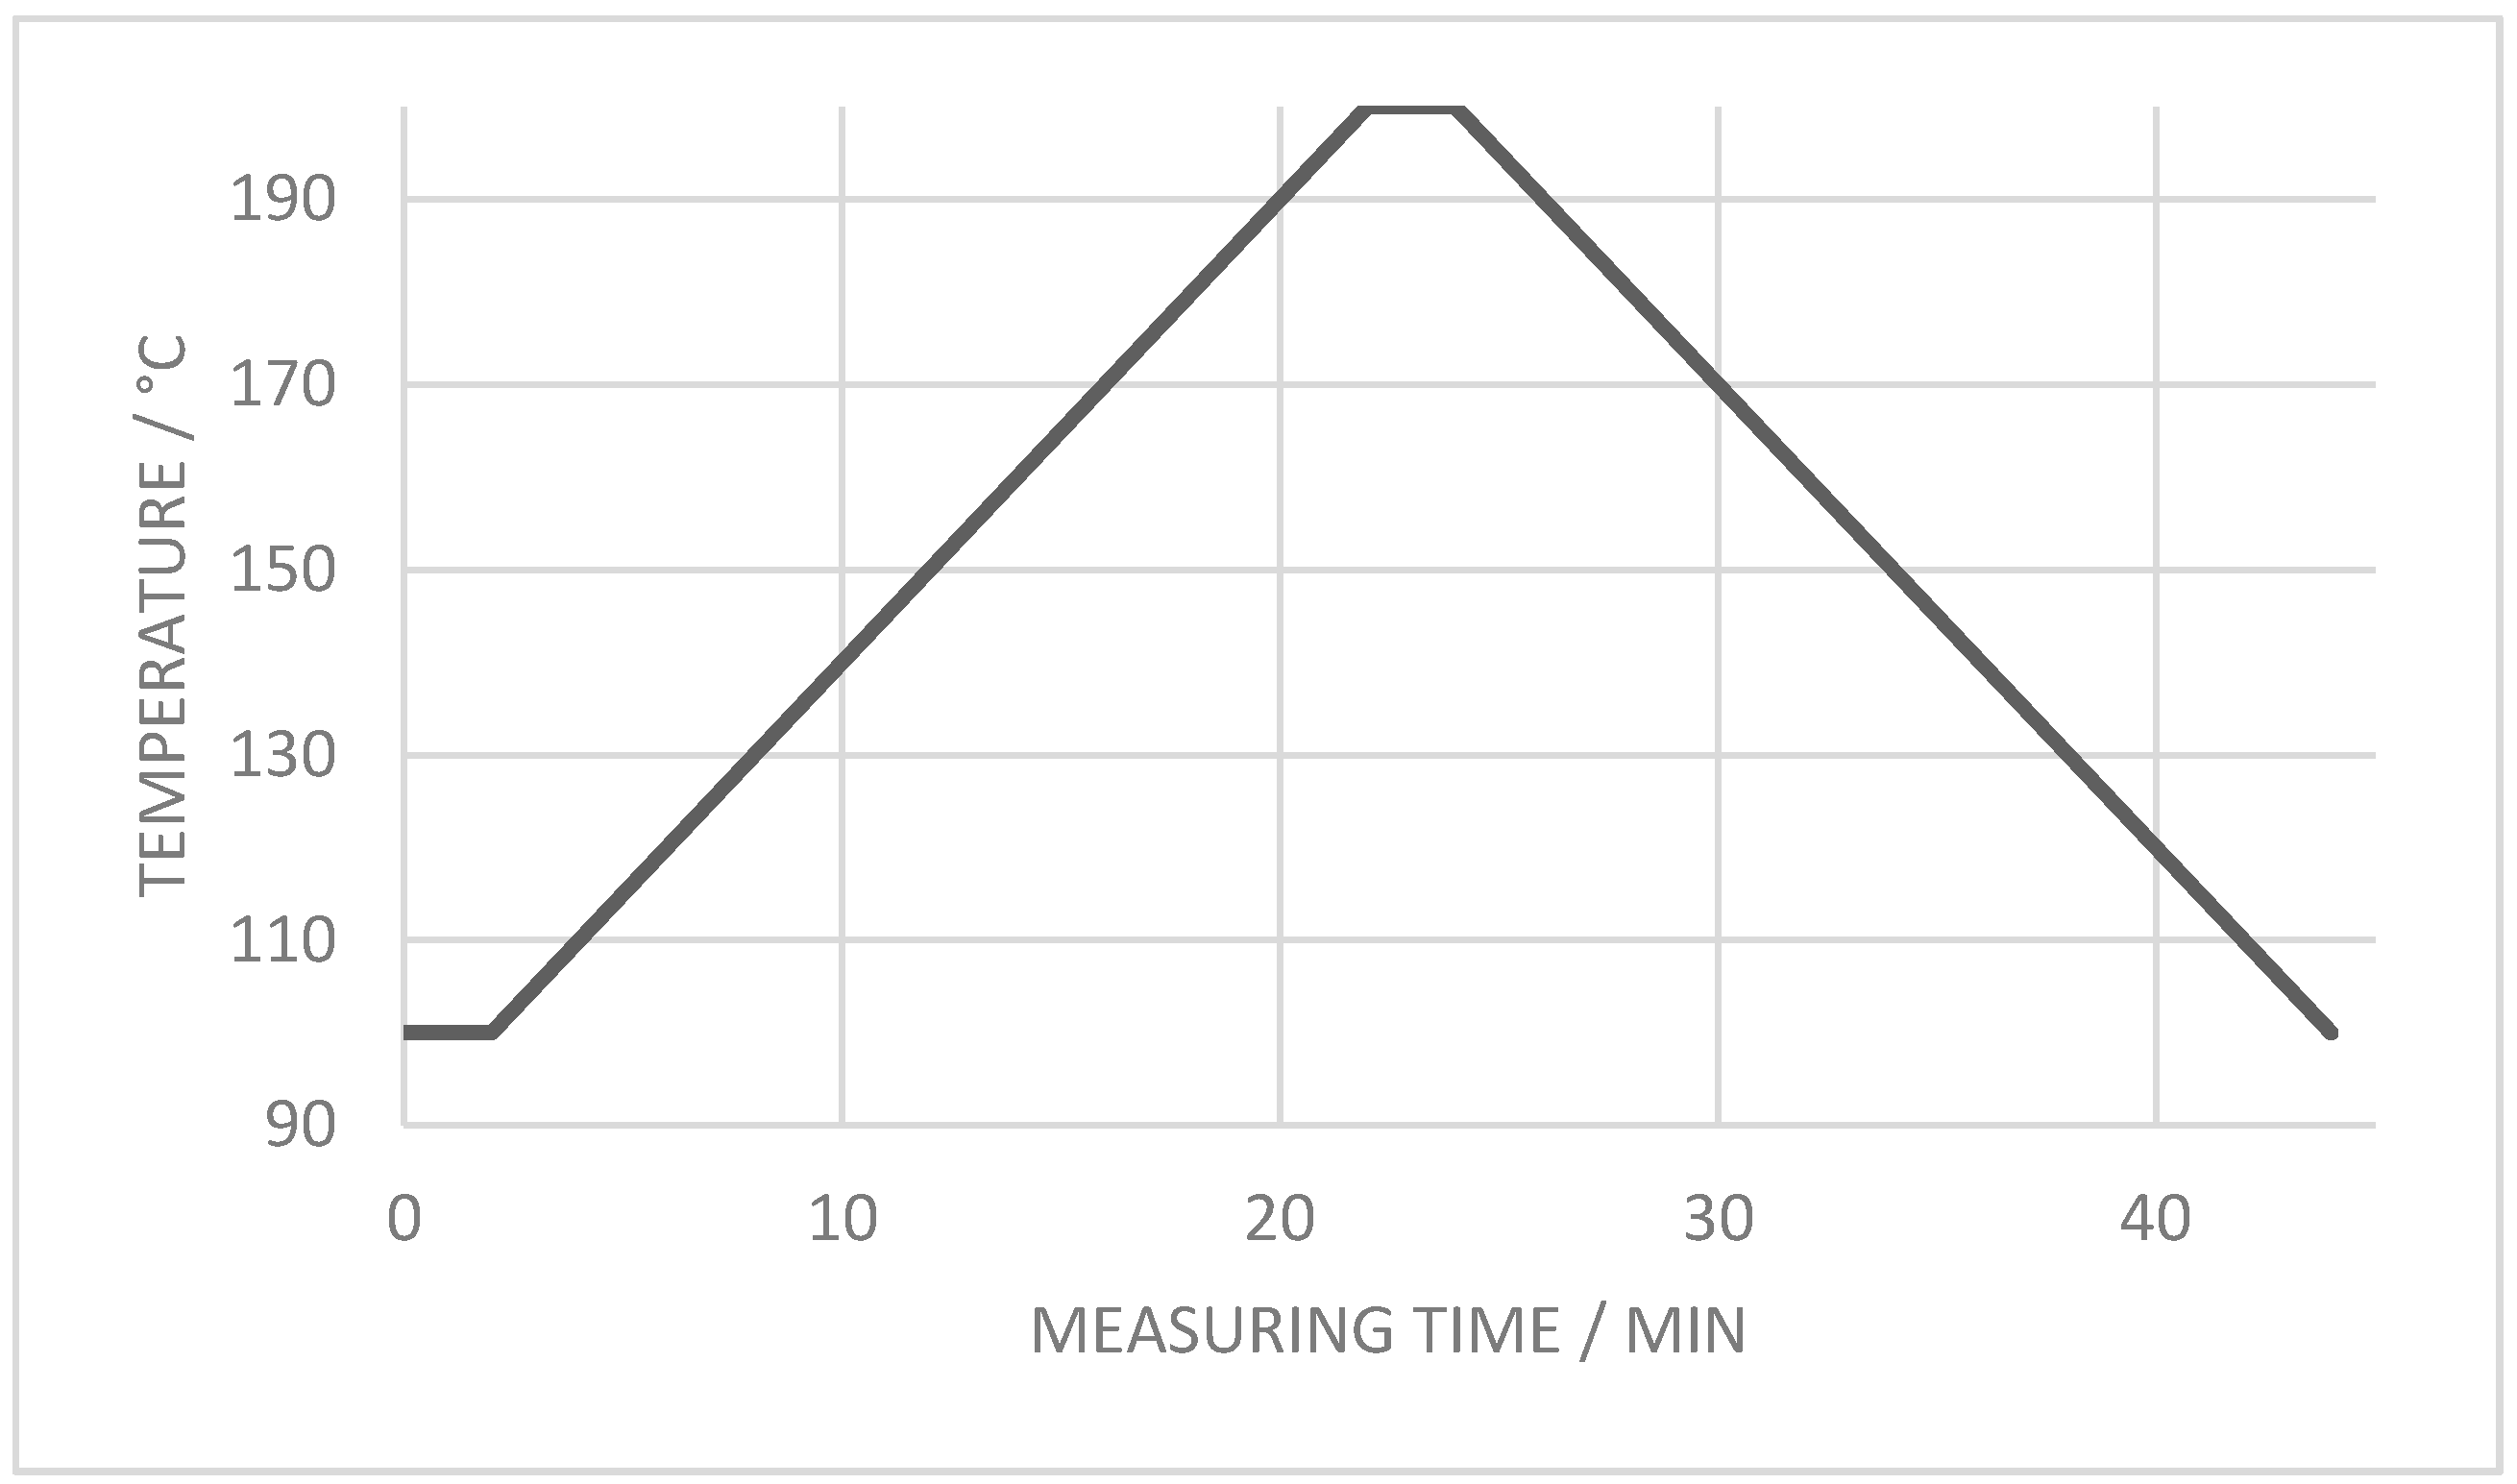
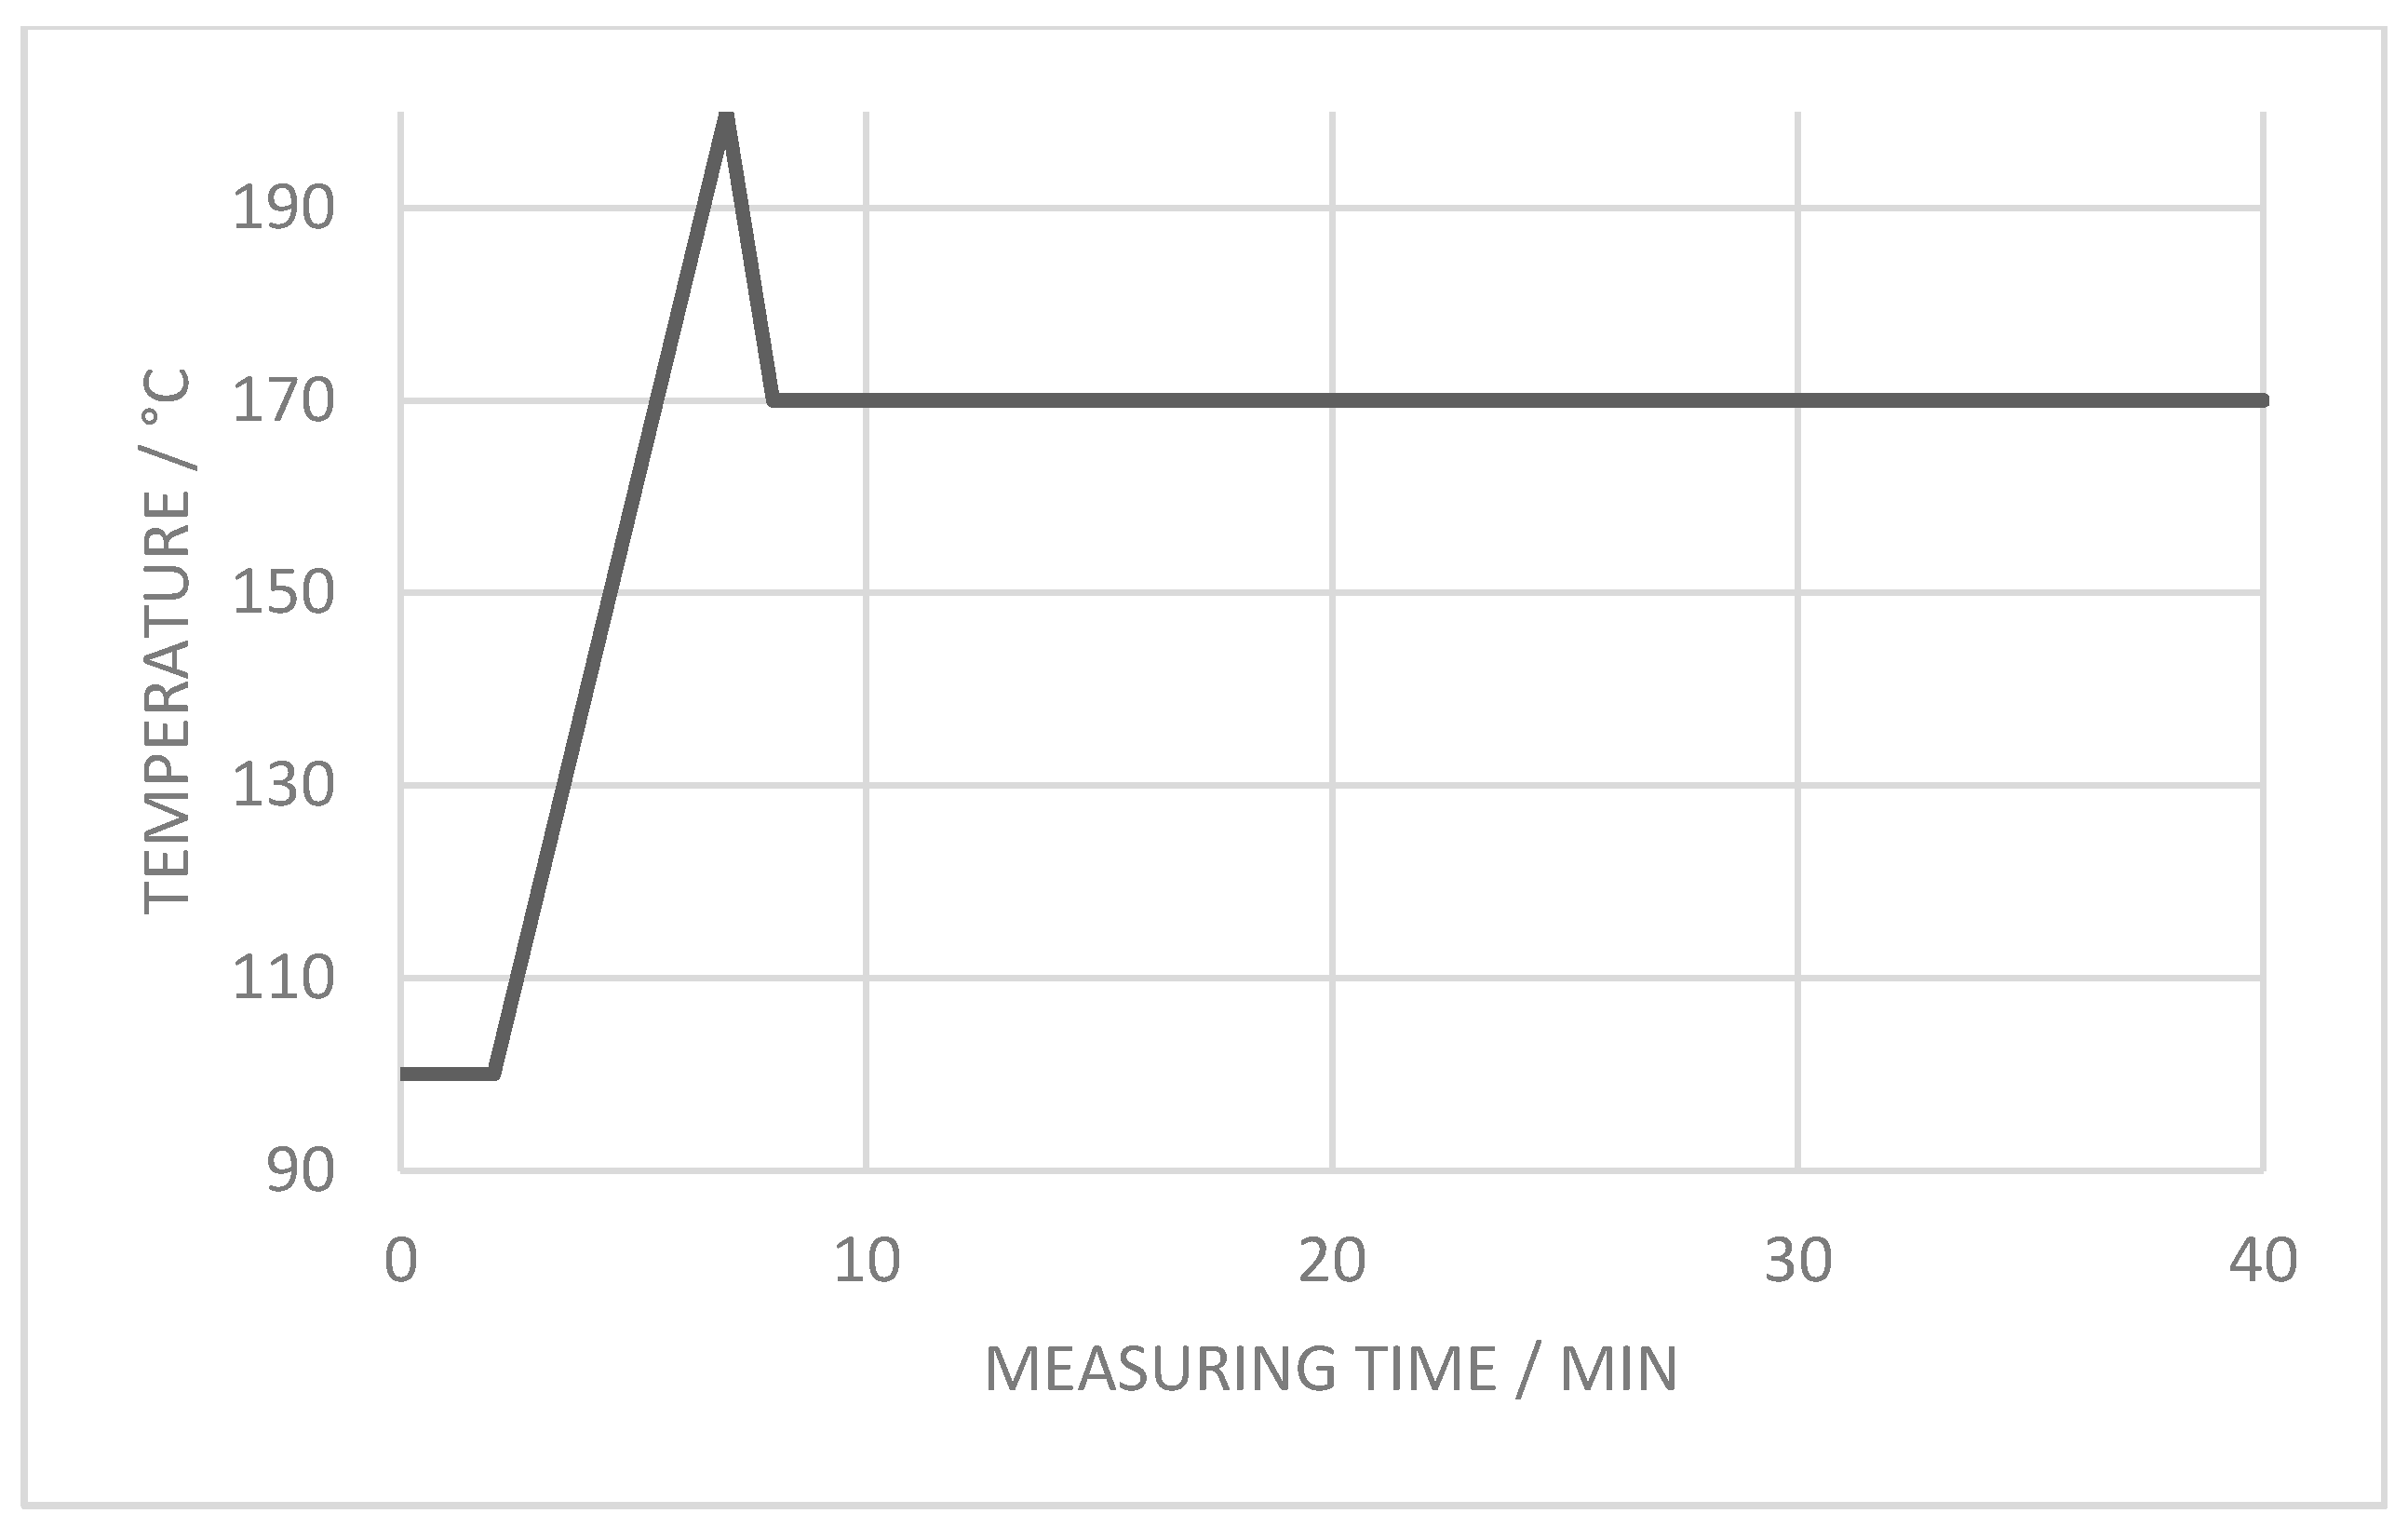
2.5.3. Differential Scanning Calorimetry

Temperature-related material transitions and melting range of polymers and compounds can be readily observed by recording the difference in thermal energy response of a sample in relation to the given reference material. The differential scanning calorimetric (DSC) technique records such a comparison in terms of the heat capacity difference as a function of temperature/time. The reference and the sample are both heated at the same defined heating rate above the melting temperature of the sample and subsequently cooled at a specific cooling rate to below the crystallization point. The differential heat capacity of the sample is thus determined according to whether more or less heat is required to maintain both it and the reference at the same temperature [19].
During the melting process, due to latent heat absorption (endothermic phase transition), more energy is required to increase the sample temperature to maintain the same rate of rising as the reference. As the sample subsequently crystallizes under cooling, less heat is required to keep the temperature at the reference level due to the reverse exothermic phase transition from liquid to solid.
By observing the difference in heat flow between the sample and reference in the differential scanning calorimeter, as described above, a measure of these amounts of heat absorption and emission during such transitions can be made [20]. DSC curves were recorded using a Mettler-Toledo DSC 823, with the sample kept, as for TGA, under inert conditions using a continuous flow of nitrogen gas (50 cm3 min1). The samples (~7 mg) were initially heated to 100 °C, maintained at this constant temperature for 2 min, then subsequently heated up to 200 °C at a rate of 5 °C min1 and finally kept at this temperature for an additional 2 min to measure the endothermic melting transition. The cycle was completed by cooling the meltdown to 100 °C at a rate of -5 °C min1 to analyze the exothermic phase transition. Figure 2 shows the schematic temperature program used for revealing the melting and crystallization temperature transitions.
To generate additional knowledge of the detailed crystallization kinetics, the crystallization time was recorded over a range of different constant temperatures to provide a record of the material’s isothermal response [21]. The samples (once again ~7 mg) were heated to 100 °C, kept at this constant temperature for 2 min, then heated up to 200 °C at a rate of 20 °C min1, followed by cooling down with a cooling rate of −40 °C min1 and finally kept at the chosen measuring temperature of 170 °C to analyze the crystallization time. Figure 3 shows the schematic temperature program used for determining the crystallization time.

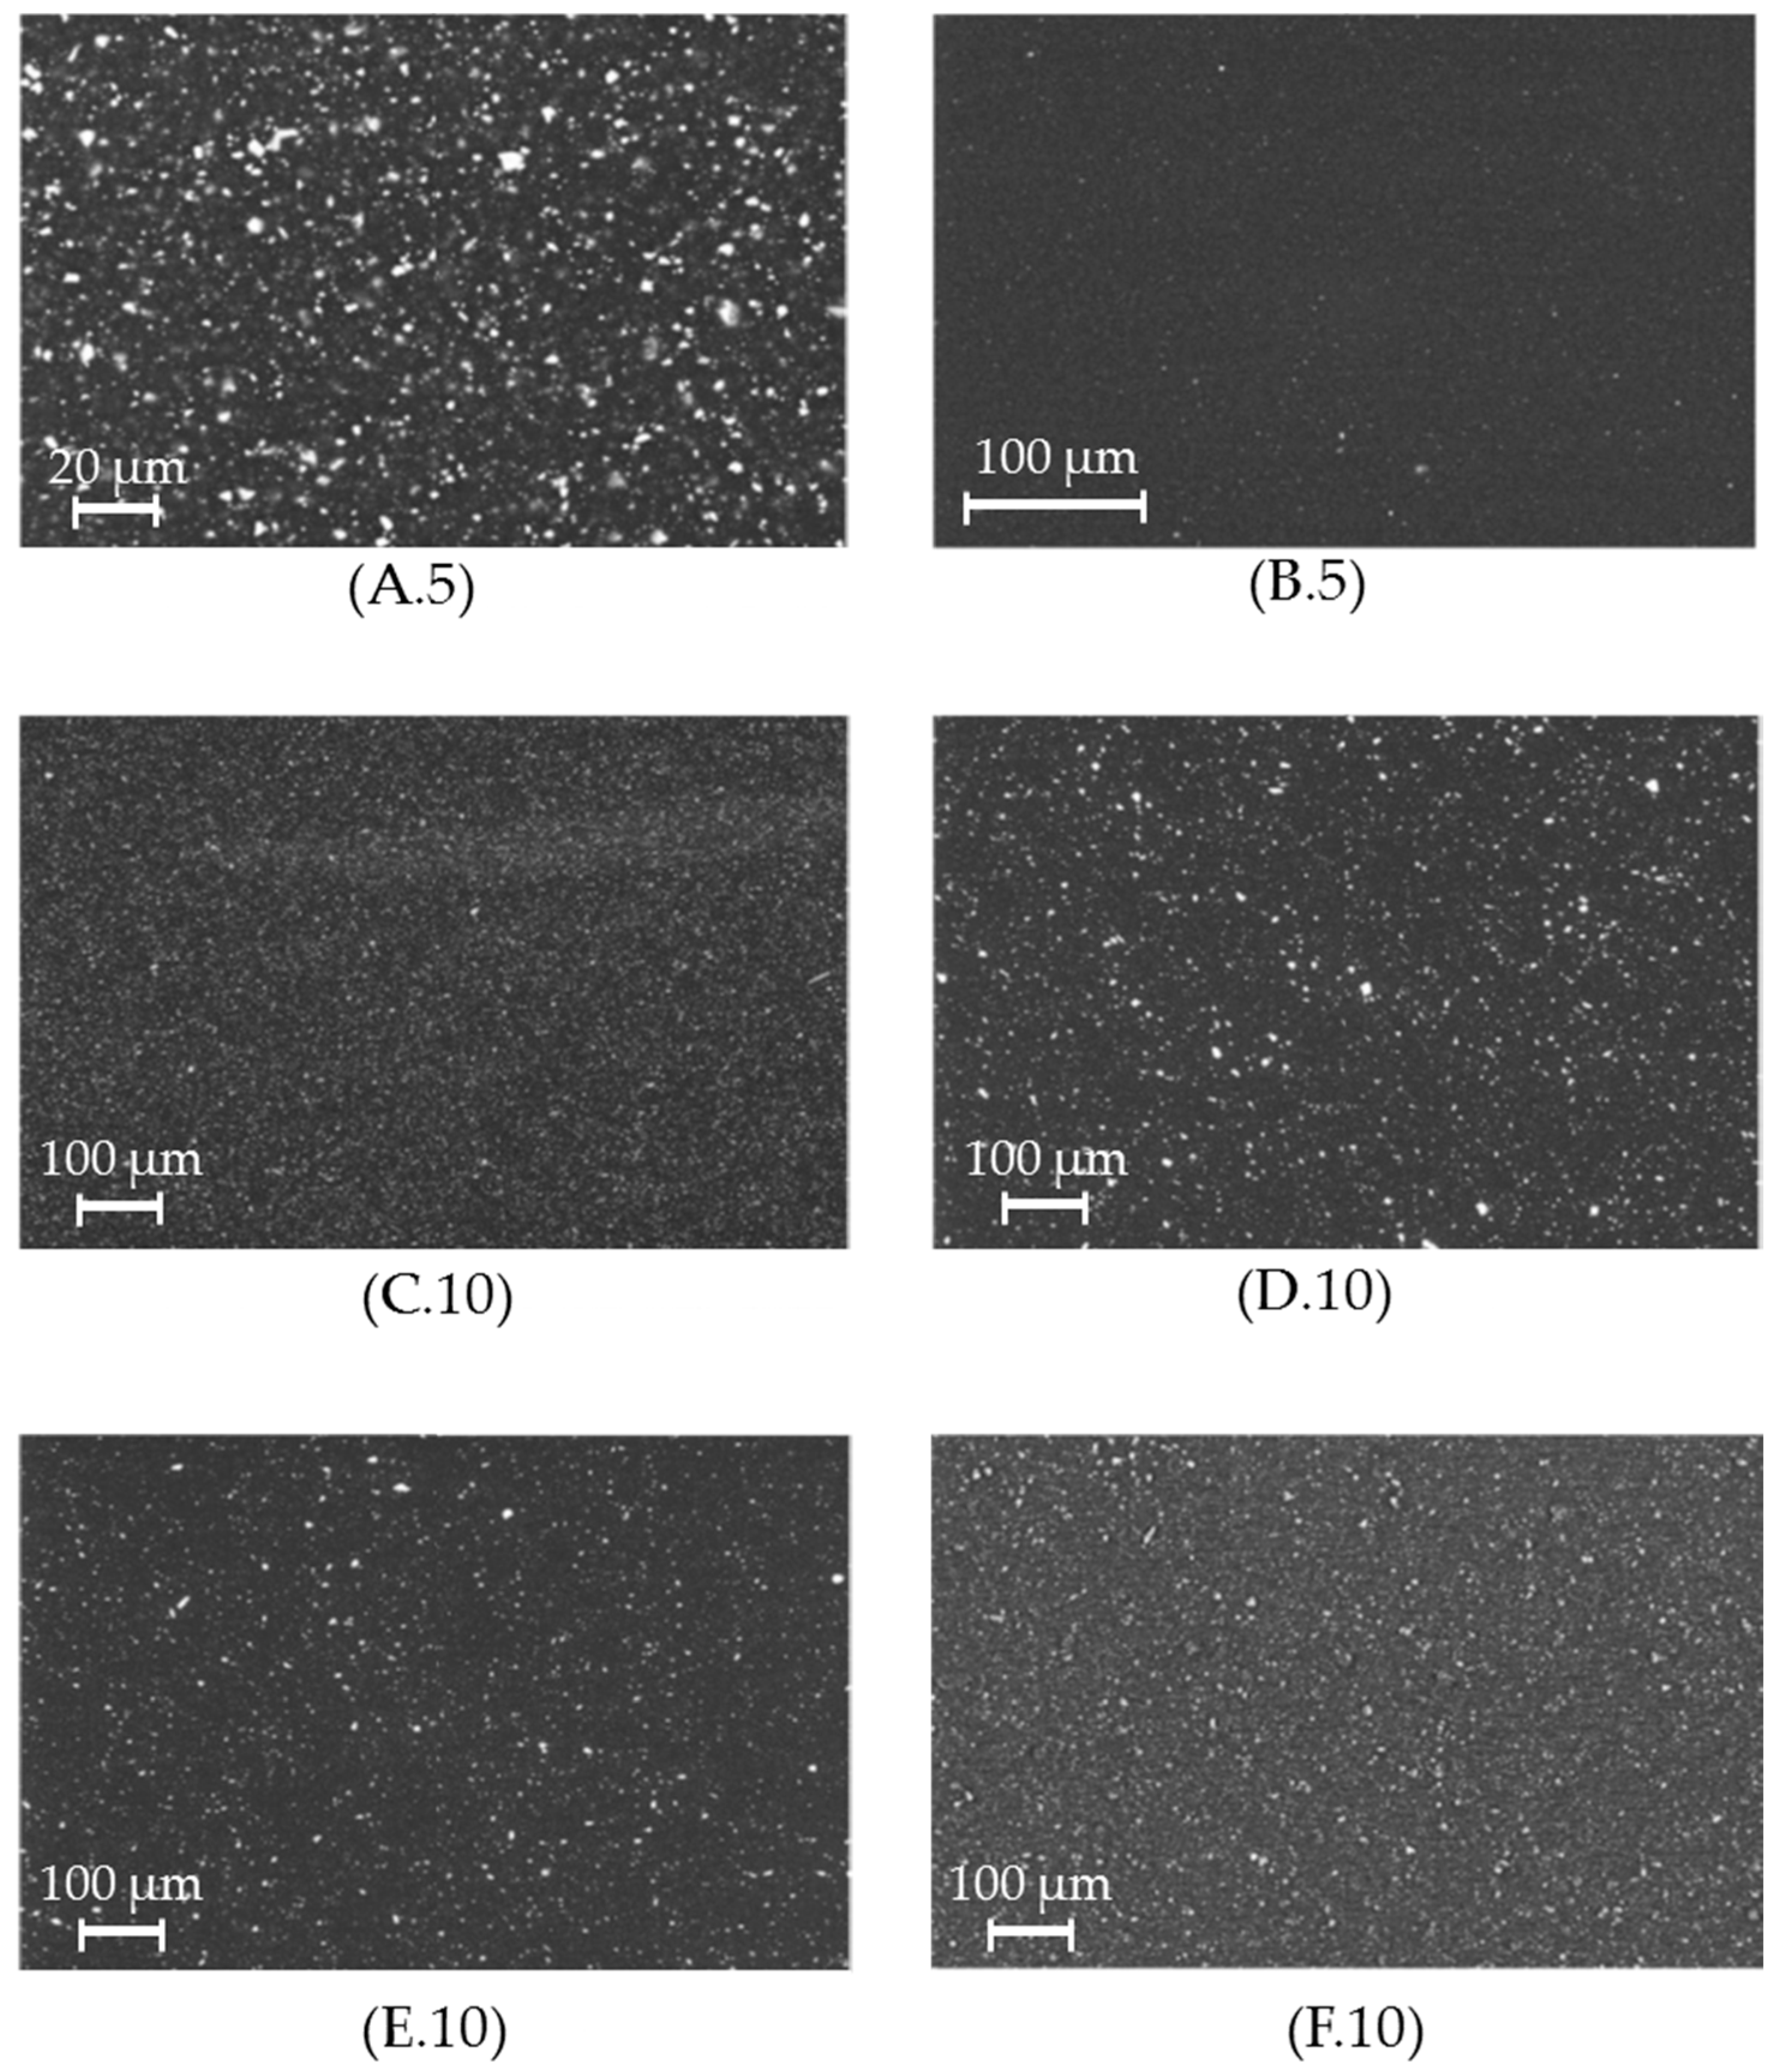
2.5.4. Scanning Electron Microscopy

Scanning electron microscopy (SEM) was used to evaluate the degree of homogeneity of the filler distribution throughout the polymer/filler matrix, a. The compounded granules were pressed above the melting point at a temperature of 210 °C onto a steel metal plate with a thickness of ≈2 mm and subsequently embedded in epoxy resin. The resulting SEM specimens were prepared by diamond knife cutting (20 μm and 15 μm), followed by a corundum polishing step at 0.05 μm. All samples were studied with a backscatter detector at controlled pressure (50 Pa), using 20 kW power with a 60 μm cover.

3. Results and Discussion

3.1. Filler Distribution Homogeneity

Figure 4 represents the elemental contrast within each compounded sample used in this study. Due to the use of backscatter detection, the higher amount of reflected electrons by the filler materials appear brighter (white spots on the image) than the polymer matrix, which creates the black (electron-absorbing) background. The difference between the coarser and finer filler components are readily identifiable. In addition, the filler material is homogeneously distributed throughout the polymer matrix (Figure 4), and the resulting findings in this study are based on an essentially agglomeration-free filler distribution.

3.2. Thermal Properties

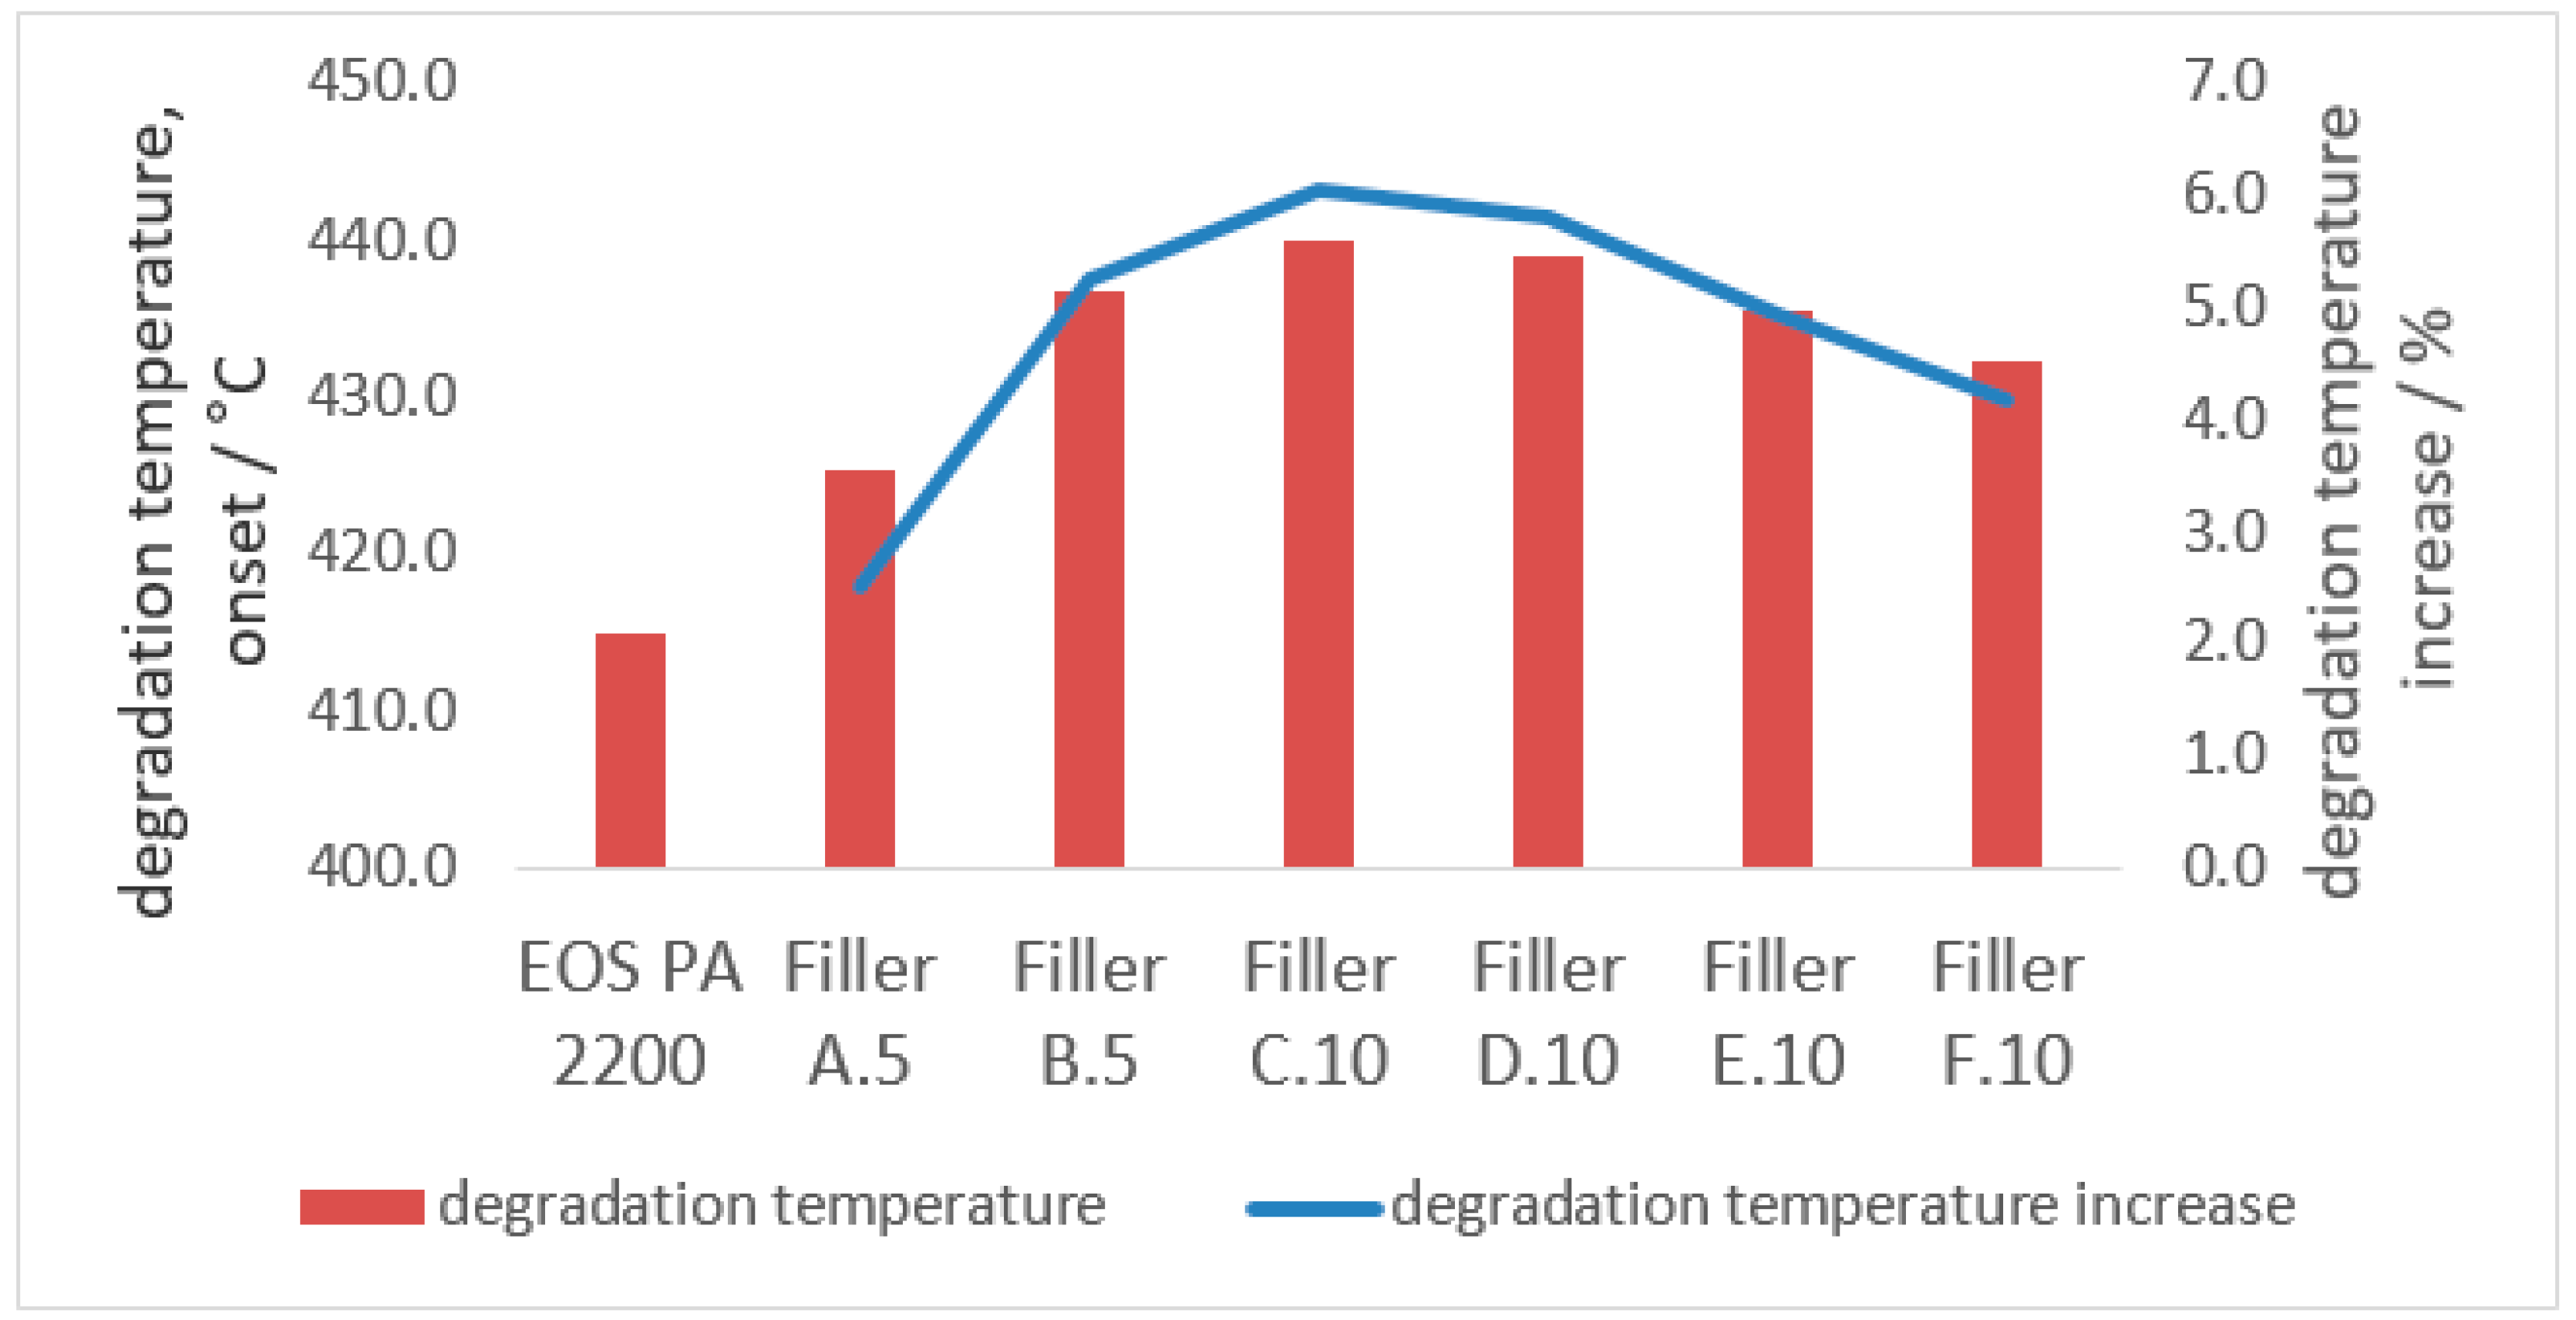
3.2.1. Degradation Temperature

The degradation temperature of the compound can be increased by adjusting the introduction of mineral filler (Figure 5). The overall degradation temperature can be increased up to 6% with the correct amount of coarse particles, with a higher single-particle volume, and fine filler particles. If the coarse filler fraction is reduced or the fine filler fraction increased significantly, the effect on the degradation temperature is reduced. An explanation for this increase in the degradation temperature can be the higher thermal conductivity of calcium carbonate. The surrounding energy input is taken up quicker by the filler particles, but less is stored due to their lower thermal capacity than the polyamide 12.

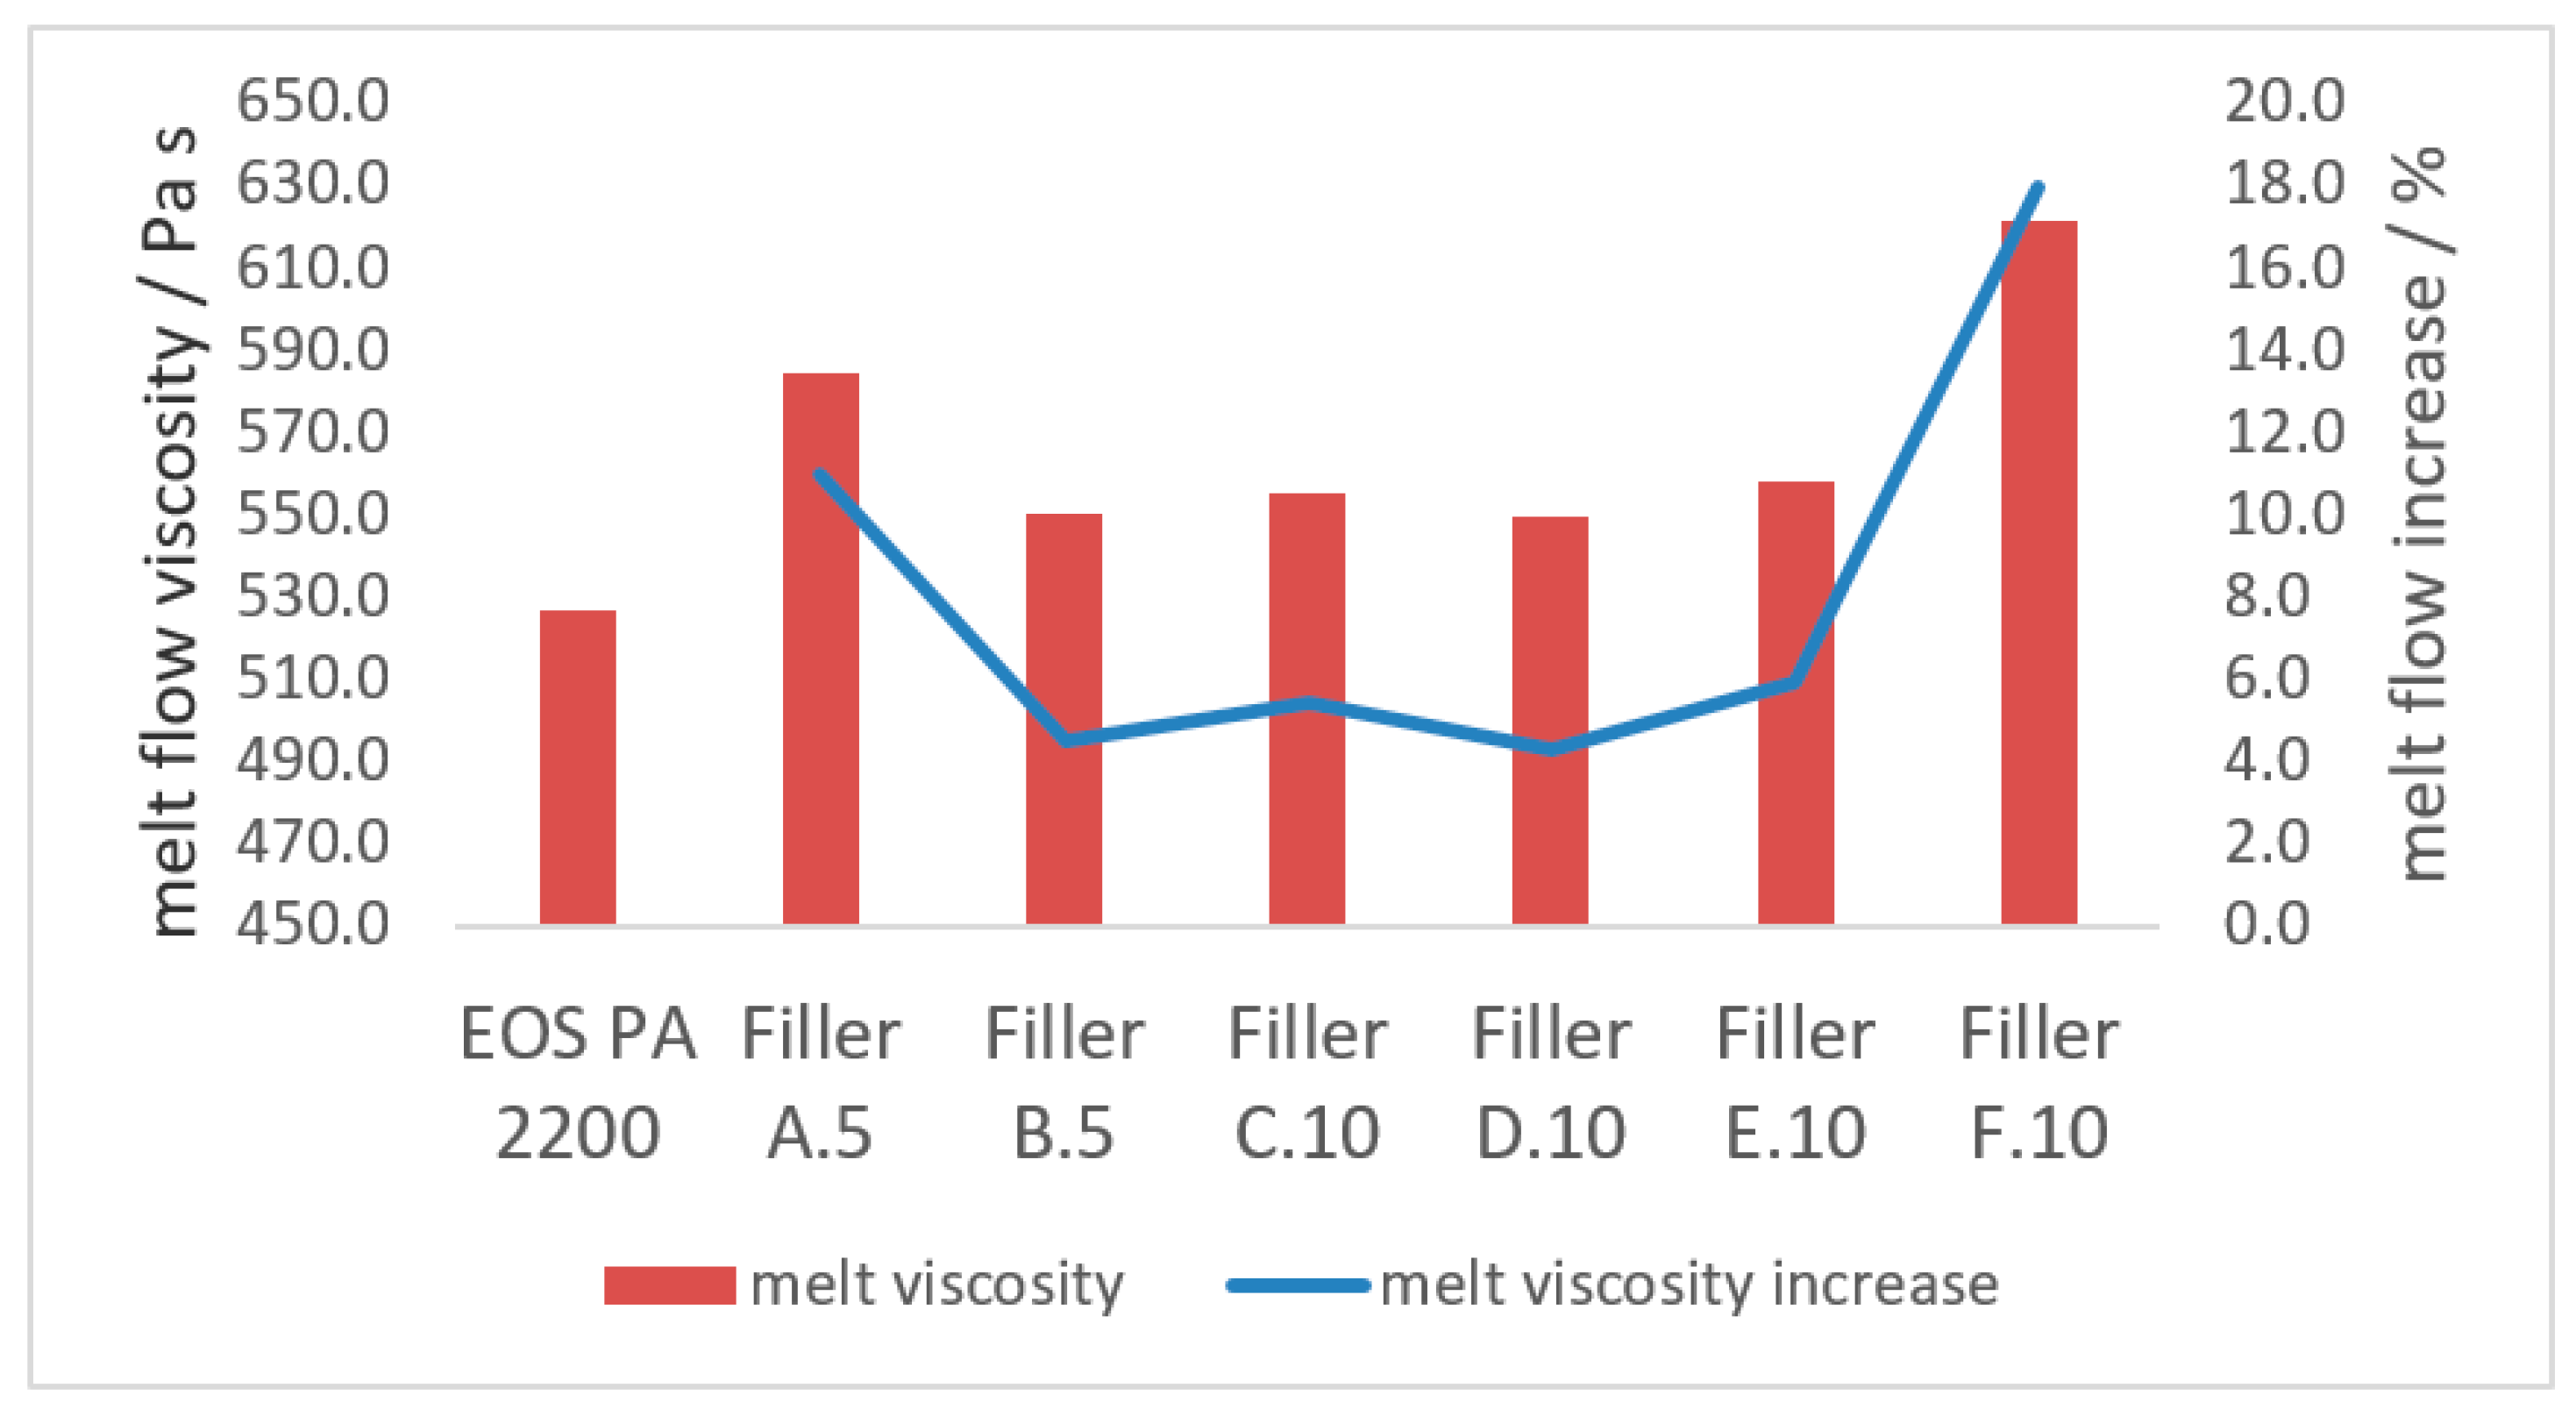
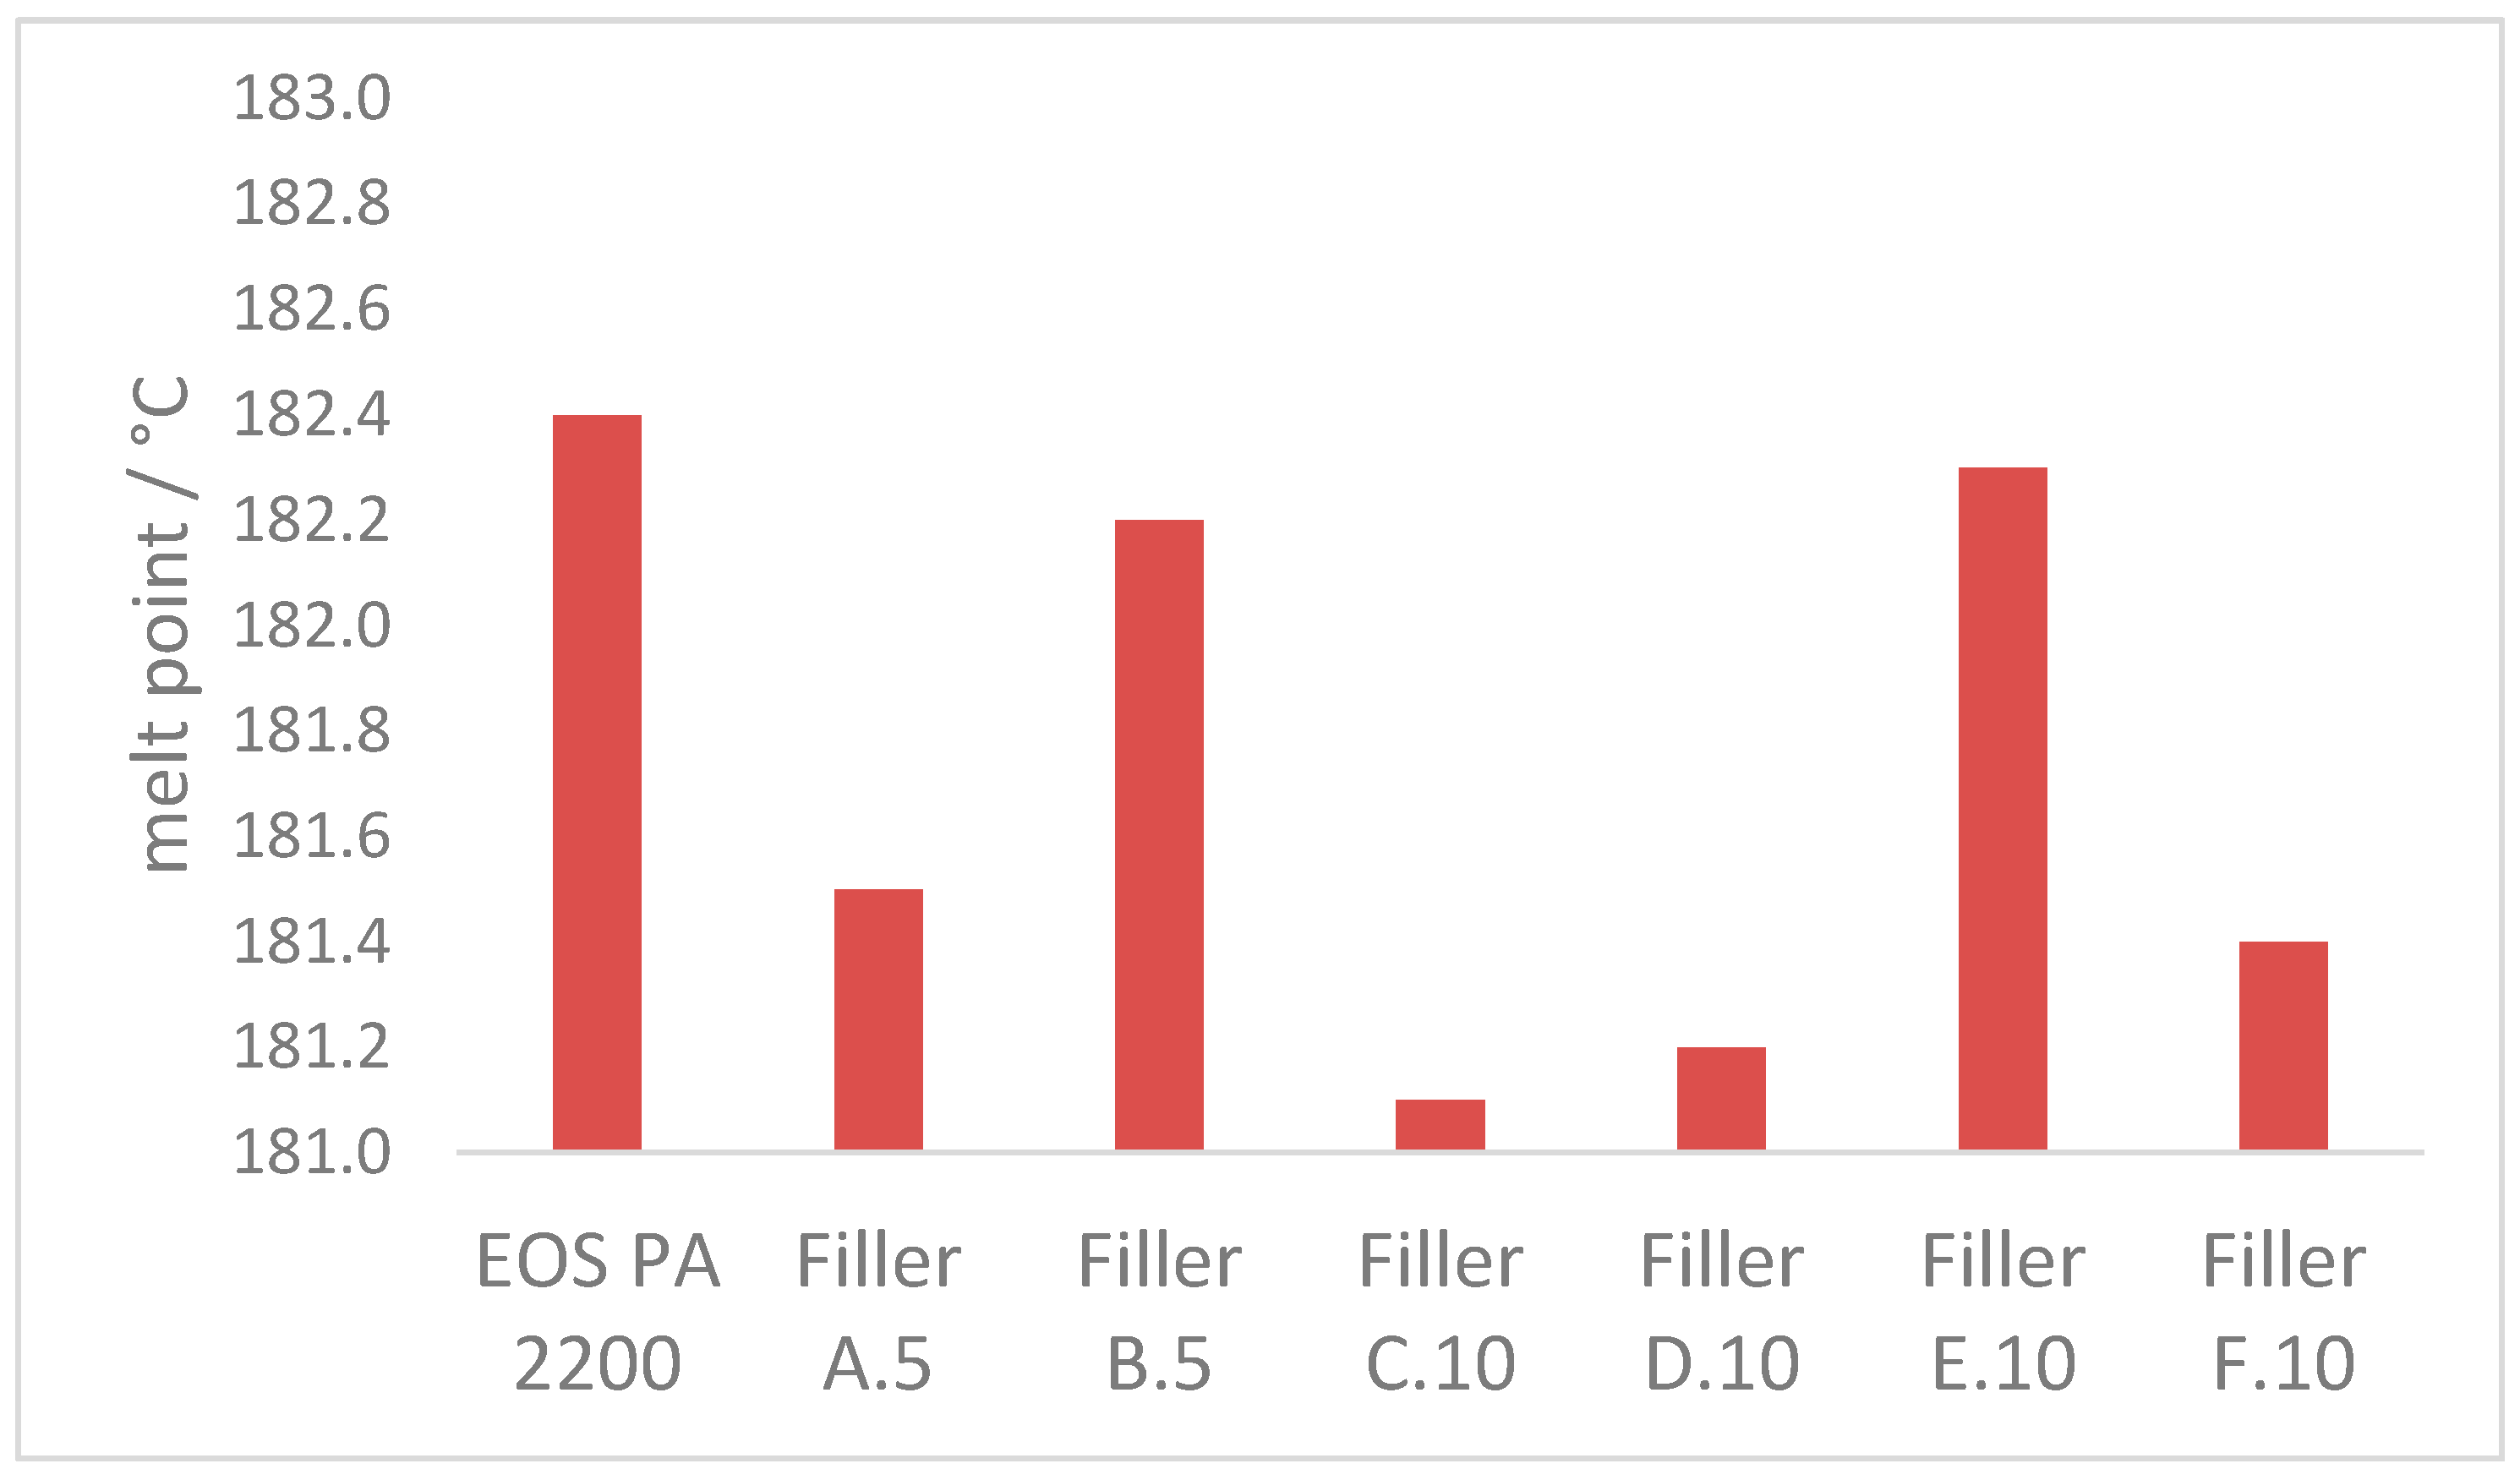
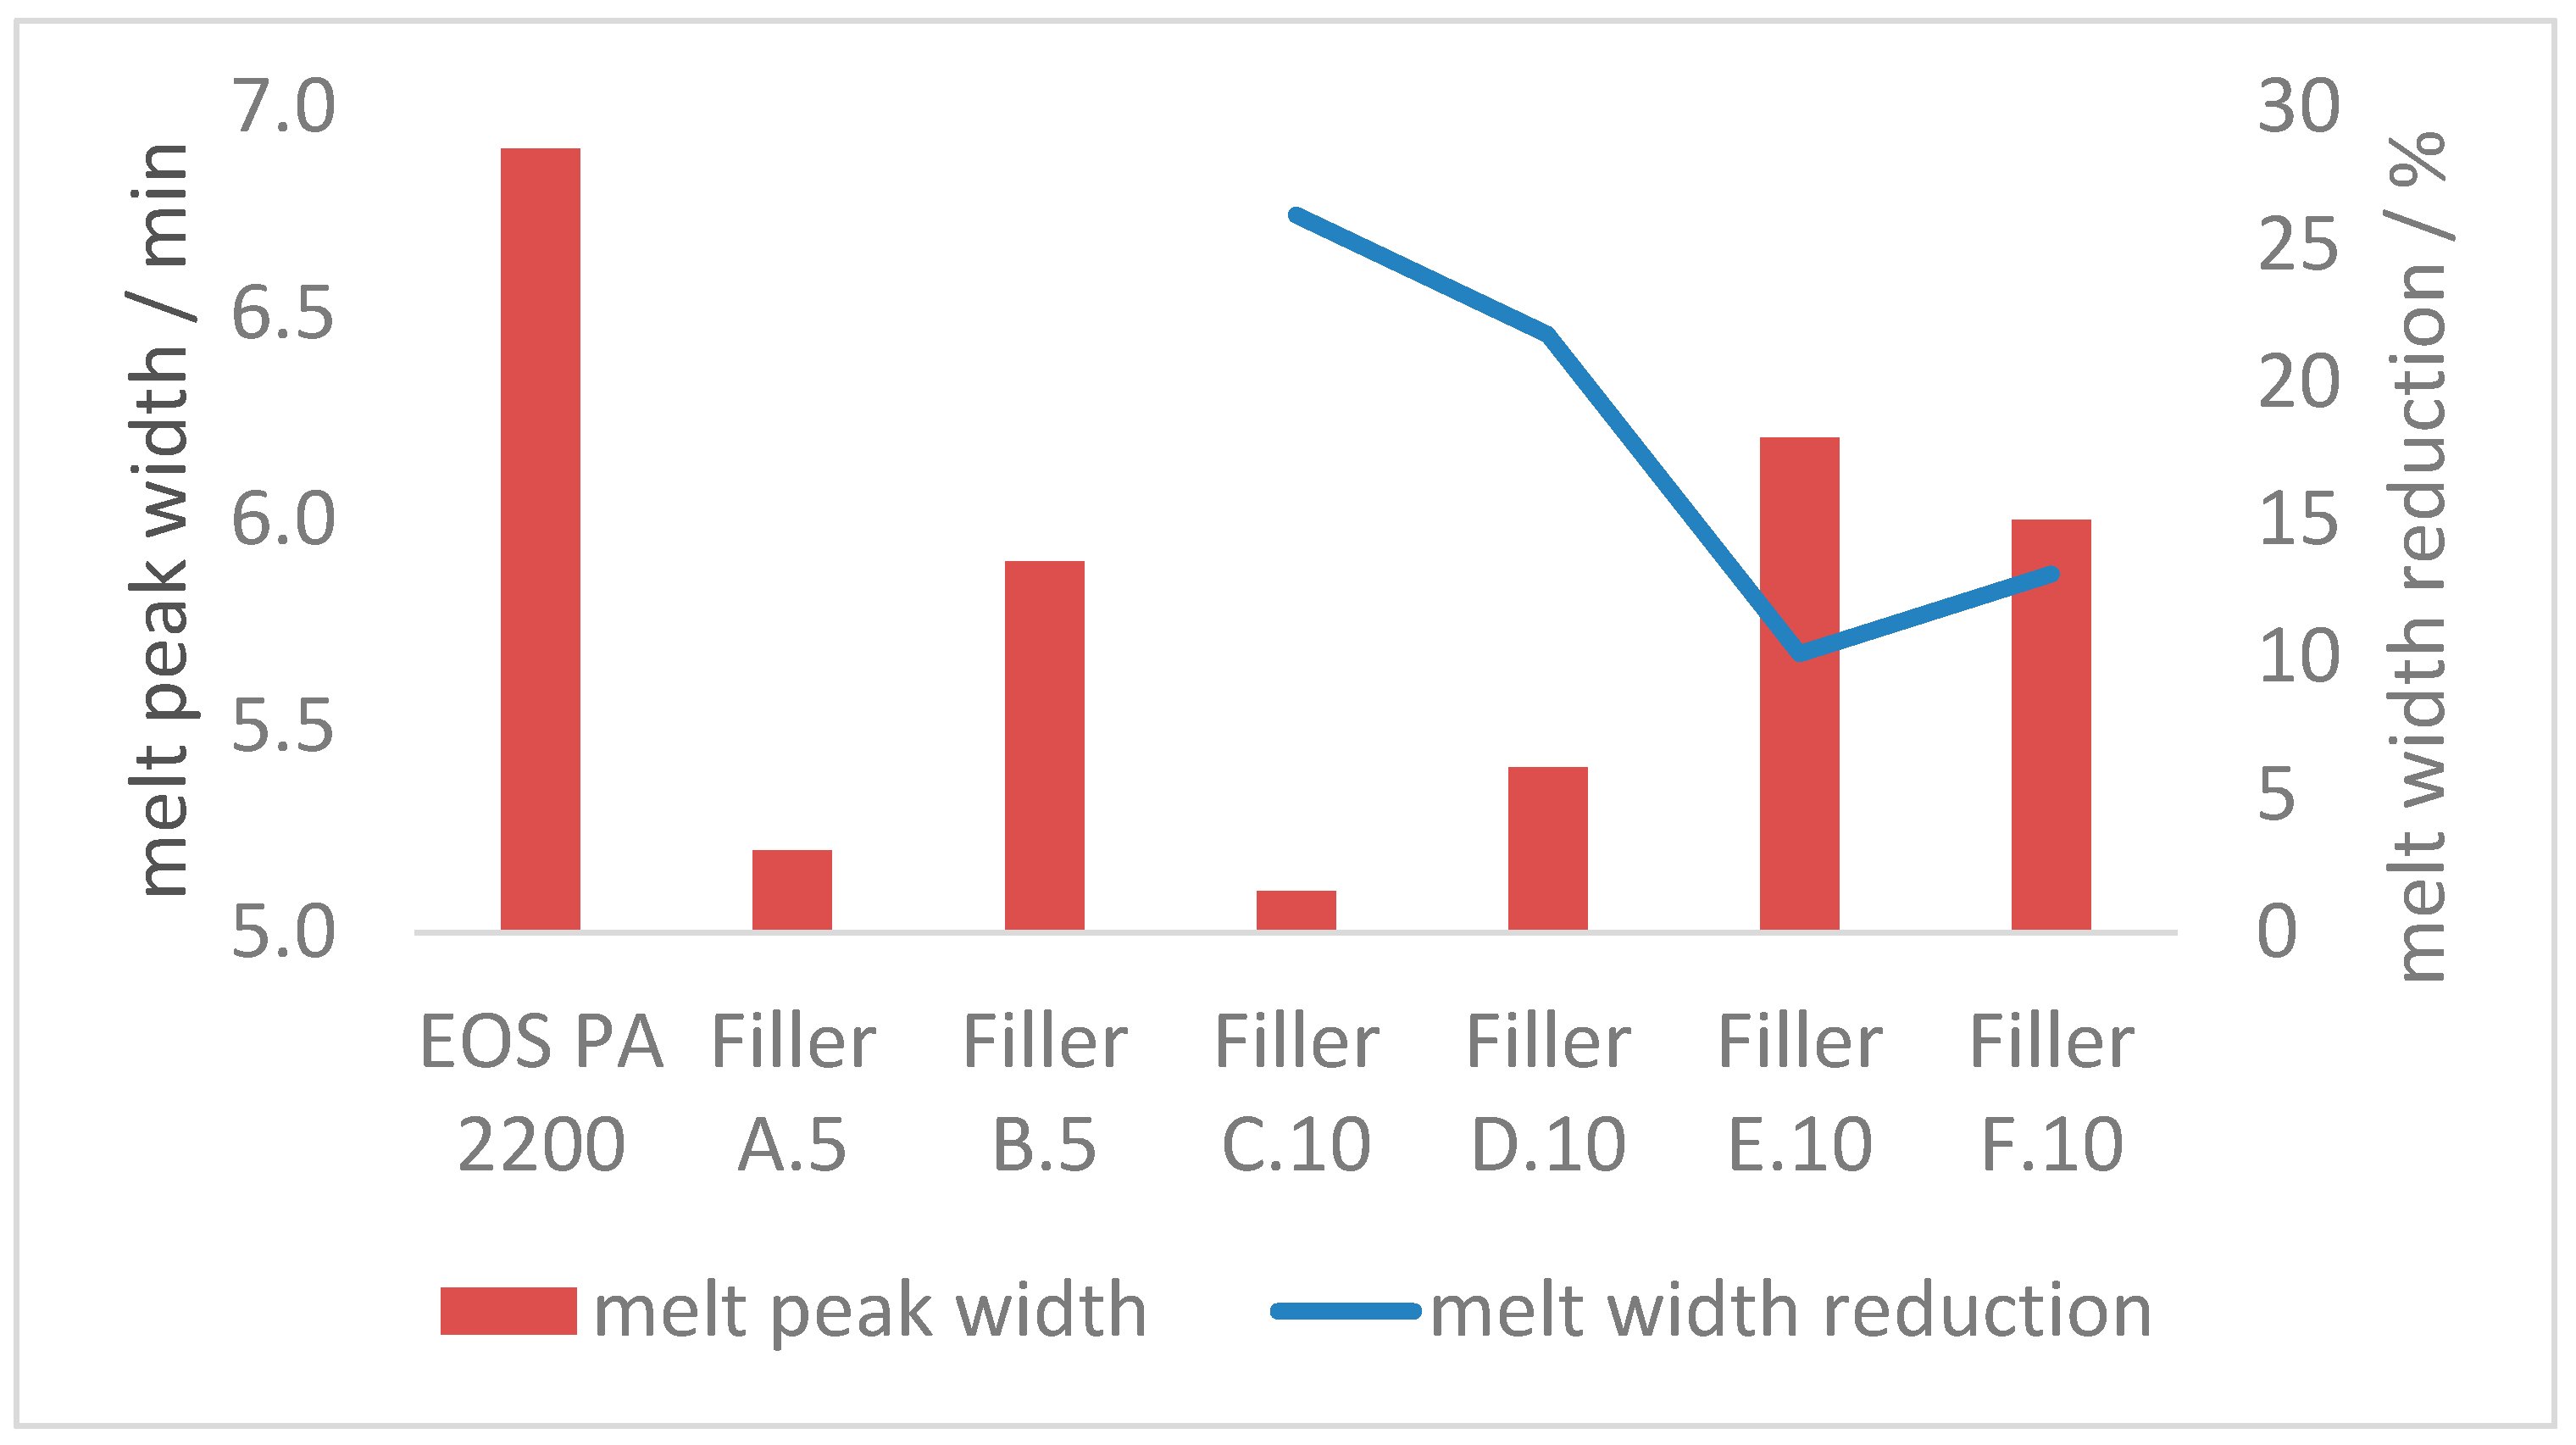
3.2.2. Melt Properties

As it was already shown in the previous investigation, the increase in the melt flow due to the introduction of a solid mineral filler shows a significant dependency on the filler particle size as well as the processing-induced filler surface in the compound matrix. Figure 6 shows how the melt flow increased more significantly if only 10 m2 of coarse mineral filler is implemented into 100 g of polyamide 12 instead of finer mineral filler. Blending the same amount of coarse filler material with a finer fraction showed no significant increase in the melt flow. Therefore, the overall increase can be reduced by approx. 50%. Sample ‘Filler F.10′ shows how the melt flow increases up to 20% if the fine mineral filler fraction exceeds the optimum range. This effect was shown by using finer filler particles with a smaller single-particle volume than that of coarser filler particles. This results in a better melt flow in comparison with the implementation of only coarser calcium carbonate particles. This results in a better melt flow during a selective laser sintering print, hence higher final part density.
Figure 7 and Figure 8 show how the melting point can be manipulated with the introduction of a precise amount of coarse mineral filler into the polymer matrix. The possible melt-point reduction of approx. 1 °C with the implementation of 10 m2 of coarse mineral filler (Filler A.5), can also be achieved with Filler C.10, Filler D.10, as well as Filler F.10. All three filler combinations introduced approx. 10 m2 of coarse filler material, where the finer filler fraction varied and did not show any significant effect on the melt point manipulation. Referring to the particle size distribution of the coarse fraction in Figure 1, the sensitivity of melting point to the use of a small amount of coarse filler A in the blend relates to particles significantly larger than the volume median, dv50, which control the thermal properties more strongly. Filler E.10 showed how the melting point is not affected if the coarser mineral filler fraction is reduced below the optimum range of 10 m2 per 100 g polymer matrix. The same effect can be seen in Figure 7, which shows the melting transition width behavior, given by the peak width of the total time over which the melt transition occurs. The melt peak width can be reduced by up to 25% if the compound is filled with 10 m2 of coarse filler material within 100 g of polyamide 12. Filler E.10 and F.10 showed how an extensive amount of the fine filler fraction masks the benefits of the coarser fractions. Considering the difference in the thermal properties between the functional filler and the polymer matrix (higher thermal conductivity and lower specific heat of calcium carbonate), the energy taken up by the filler material is taken up quickly and released more rapidly to the polyamide 12, surrounding the filler particle. More thermal energy can be transmitted due to the greater single-particle volume of the coarser calcium carbonate particles, in comparison with a multitude of single fine filler particles. This results in a greater influence on the melting behavior of the compound with the inclusion of a few coarse instead of many fine calcium carbonate filler particles [1]. The extensive number of fine filler particles take up all the energy and therefore hinder the more ready distribution of the stored energy by the coarser fraction. This results in the loss of the melt energy efficiency effect given by the coarse calcium carbonate filler particles.

3.2.3. Crystallization Properties

Figure 9 reveals how the increase of the crystallization point can be achieved if an optimized amount of fine calcium carbonate filler particles is present in the blend. Filler A.5 shows the purely coarse fraction, implemented into the polymer matrix, does not influence the crystallization point. This can be explained by the reduced filler particle number in the compound at a given mass loading of the coarse-only filler when compared with the case of many more submicrometer/nanoscale calcium carbonate particles in the polymer matrix. It is the greater single-particle number and homogeneous distribution of fine filler particles, when present within the polymer matrix, which promotes more frequent points of nucleation for crystallization to occur during the temperature reduction phase, resulting in a larger/more rapid onset at the point of crystallization [1].
Figure 10 reflects the results shown in the previous investigations. With the addition of an increased surface area of calcium carbonate filler material within the polymer matrix, the crystallization kinetics show a filler surface area dependency. Even a low, coarse filler loading, as with the low addition level of Filler A.5, the crystallization time at a constant 170 °C can be reduced by approx. 60%. This manipulation of faster crystallization rate remains supported even when large numbers of fine filler particles are added. These findings support the hypothesis that the crystallization point is dependent on particle number, i.e., available nucleation points.

4. Conclusions

In this study, calcium carbonate–polyamide 12 composites were produced via twin-screw compounding using a calcium carbonate blend of discrete particle sizes as functional filler material. The filler particle size distributions and filler ratio were improved to optimize the dual functions seen in the previous investigations. The melting, as well as crystallization behavior of polyamide 12, can be manipulated, dependent on the particle size distribution and filler surface area introduction.
The effect of the mineral filler on the thermal properties can potentially be optimized with a combination of a precise amount of coarse and fine calcium carbonate filler.
  • The increase of the melt flow, due to the introduction of a coarse filler fraction, can be reduced with the introduction of a finer filler into the blend. This increase in melt viscosity generated by the coarse filler can be reduced up to 60% with the precise amount of fine filler in the blend. If the fine filler fraction exceeds the optimum range of 80–130 m2 per 100 g polyamide 12, the improvement on the melt viscosity is reduced or even lost totally;
  • The degradation temperature of the polymer compound can be increased by up to 6% with the implementation of at least 10 m2 of the coarse and 80 m2 of the fine filler fraction within 100 g of polyamide 12;
  • With the combination of 10 m2 of coarse and 130 m2 fine filler in 100 g of polyamide 12, the melting transition can be sharpened up to 25% (reduced time required);
  • Due to the higher single-particle-volume of the coarse fraction, the effect on the overall degradation and melting properties is reduced if the coarse filler fraction falls below the optimum threshold of 10 m2 per 100 g polyamide 12. The same counts for when the finer filler fraction is increased significantly;
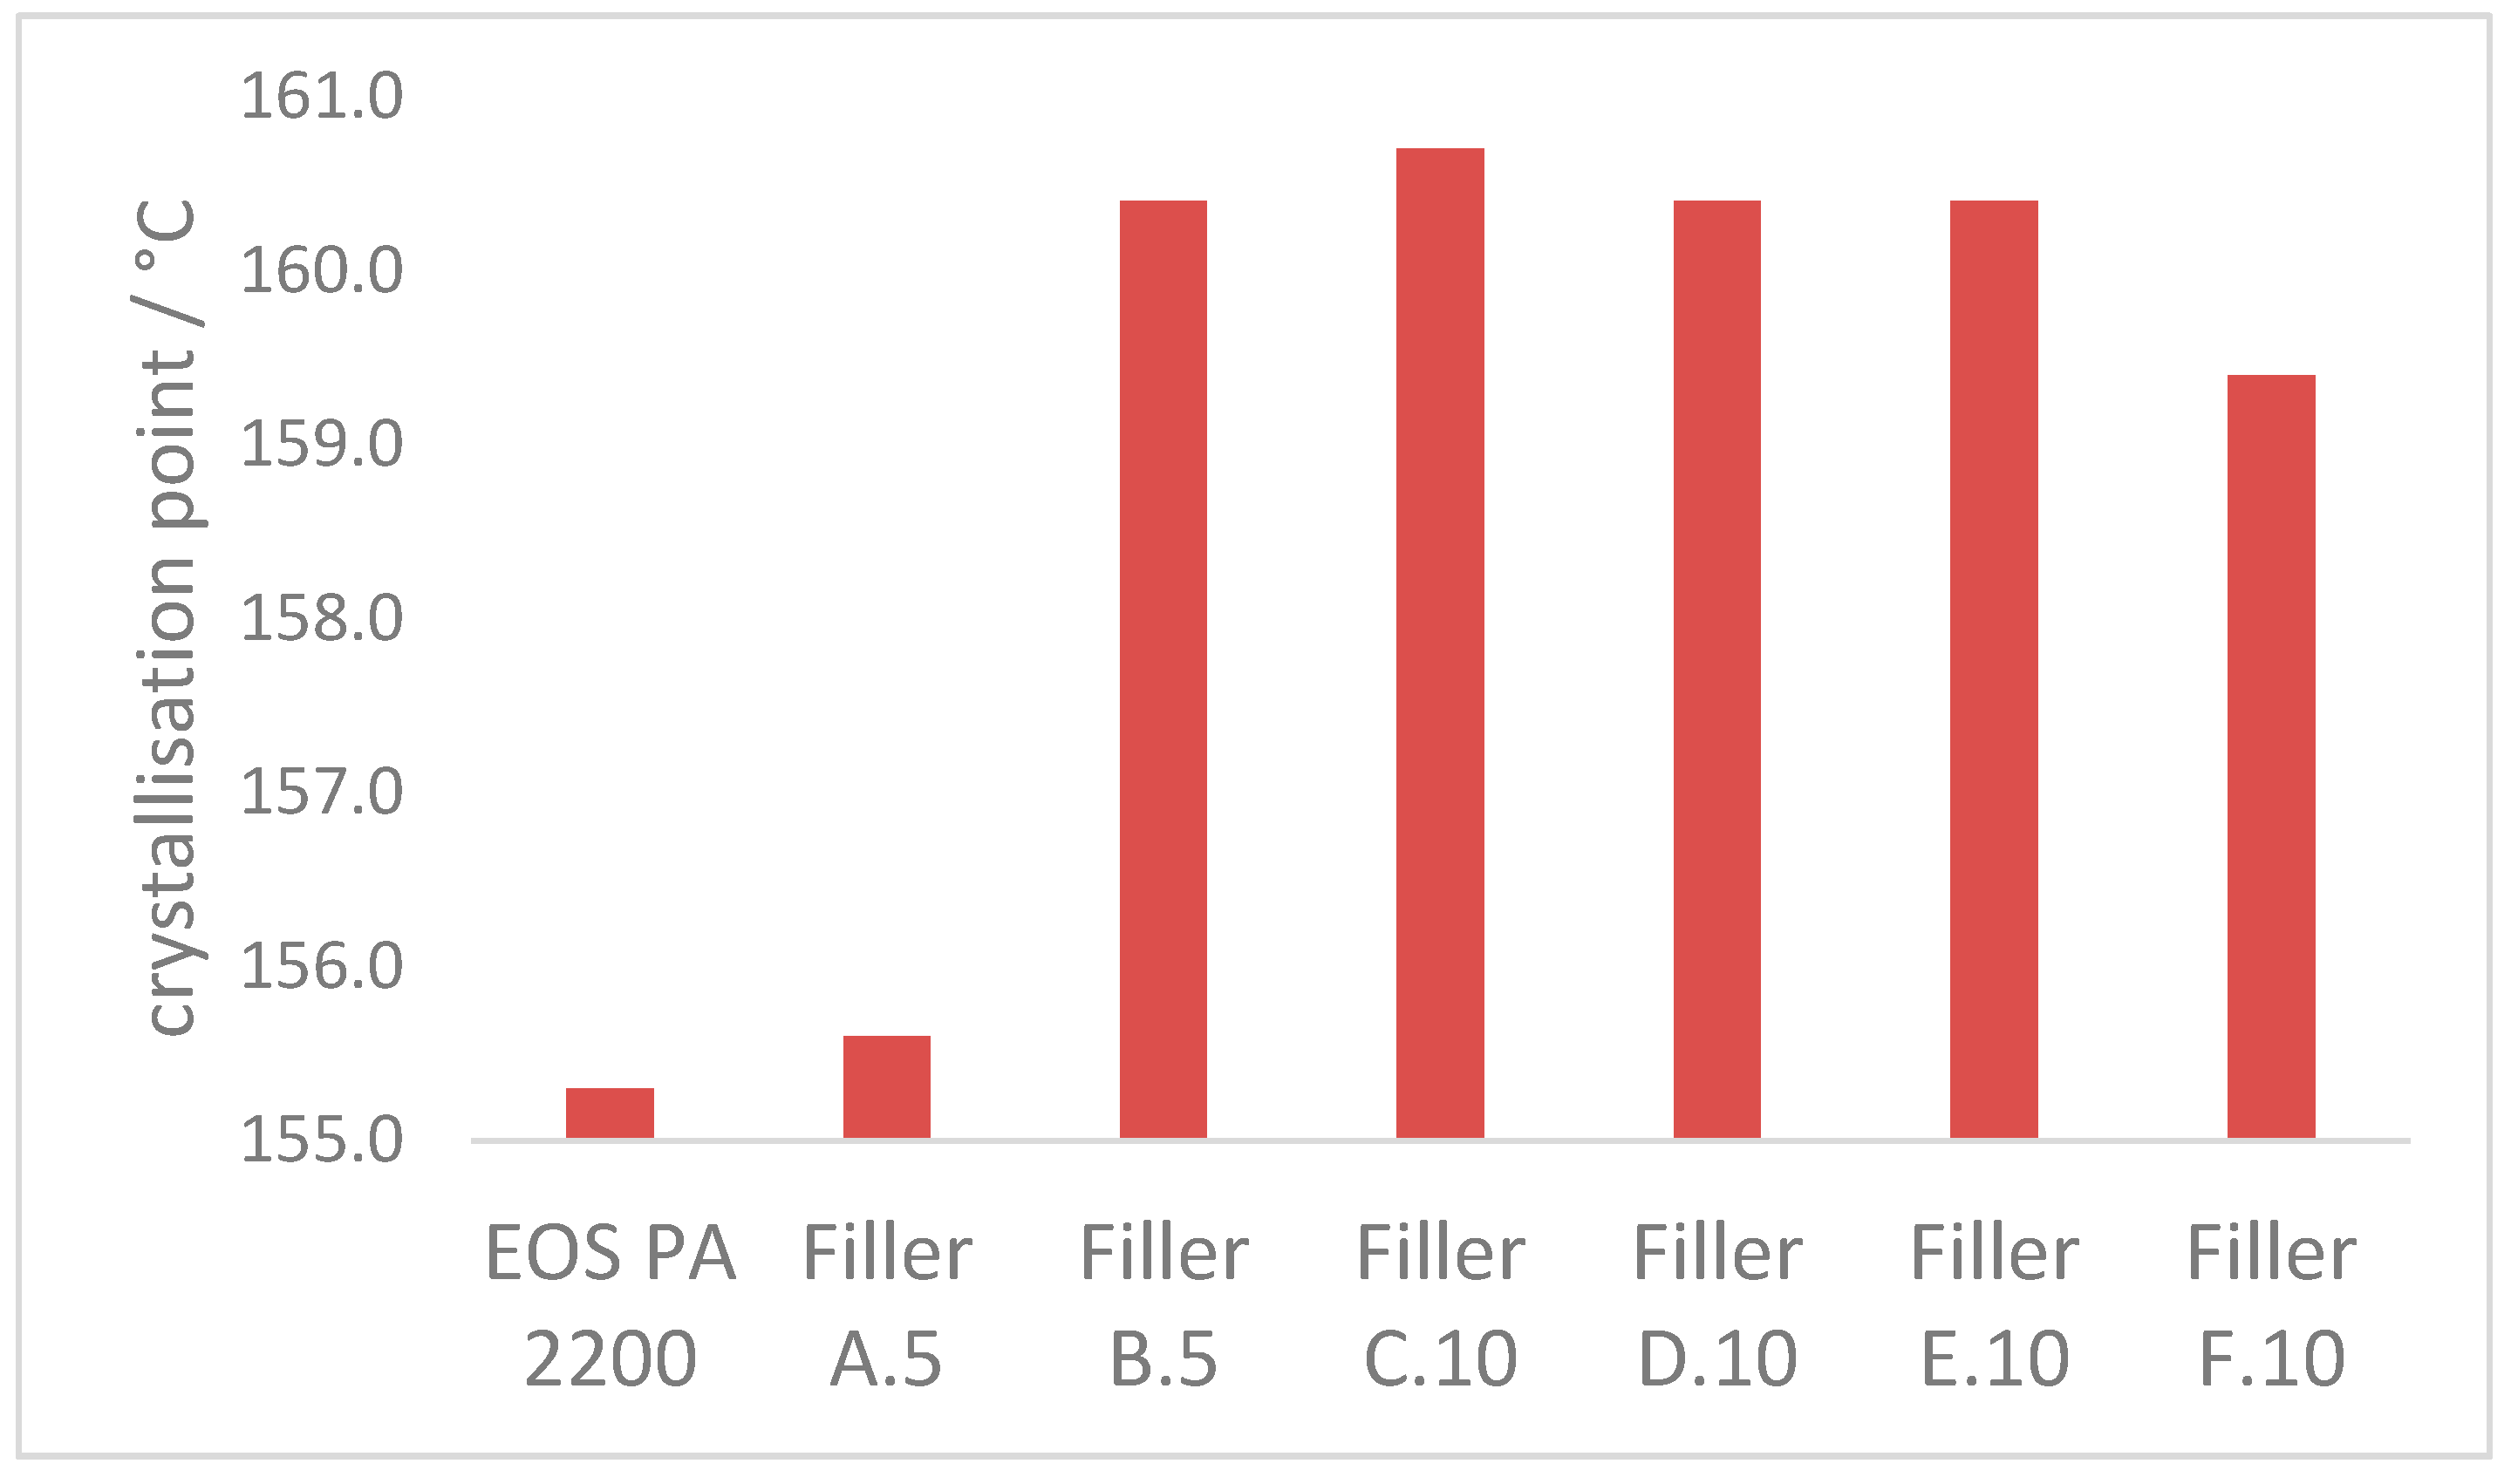
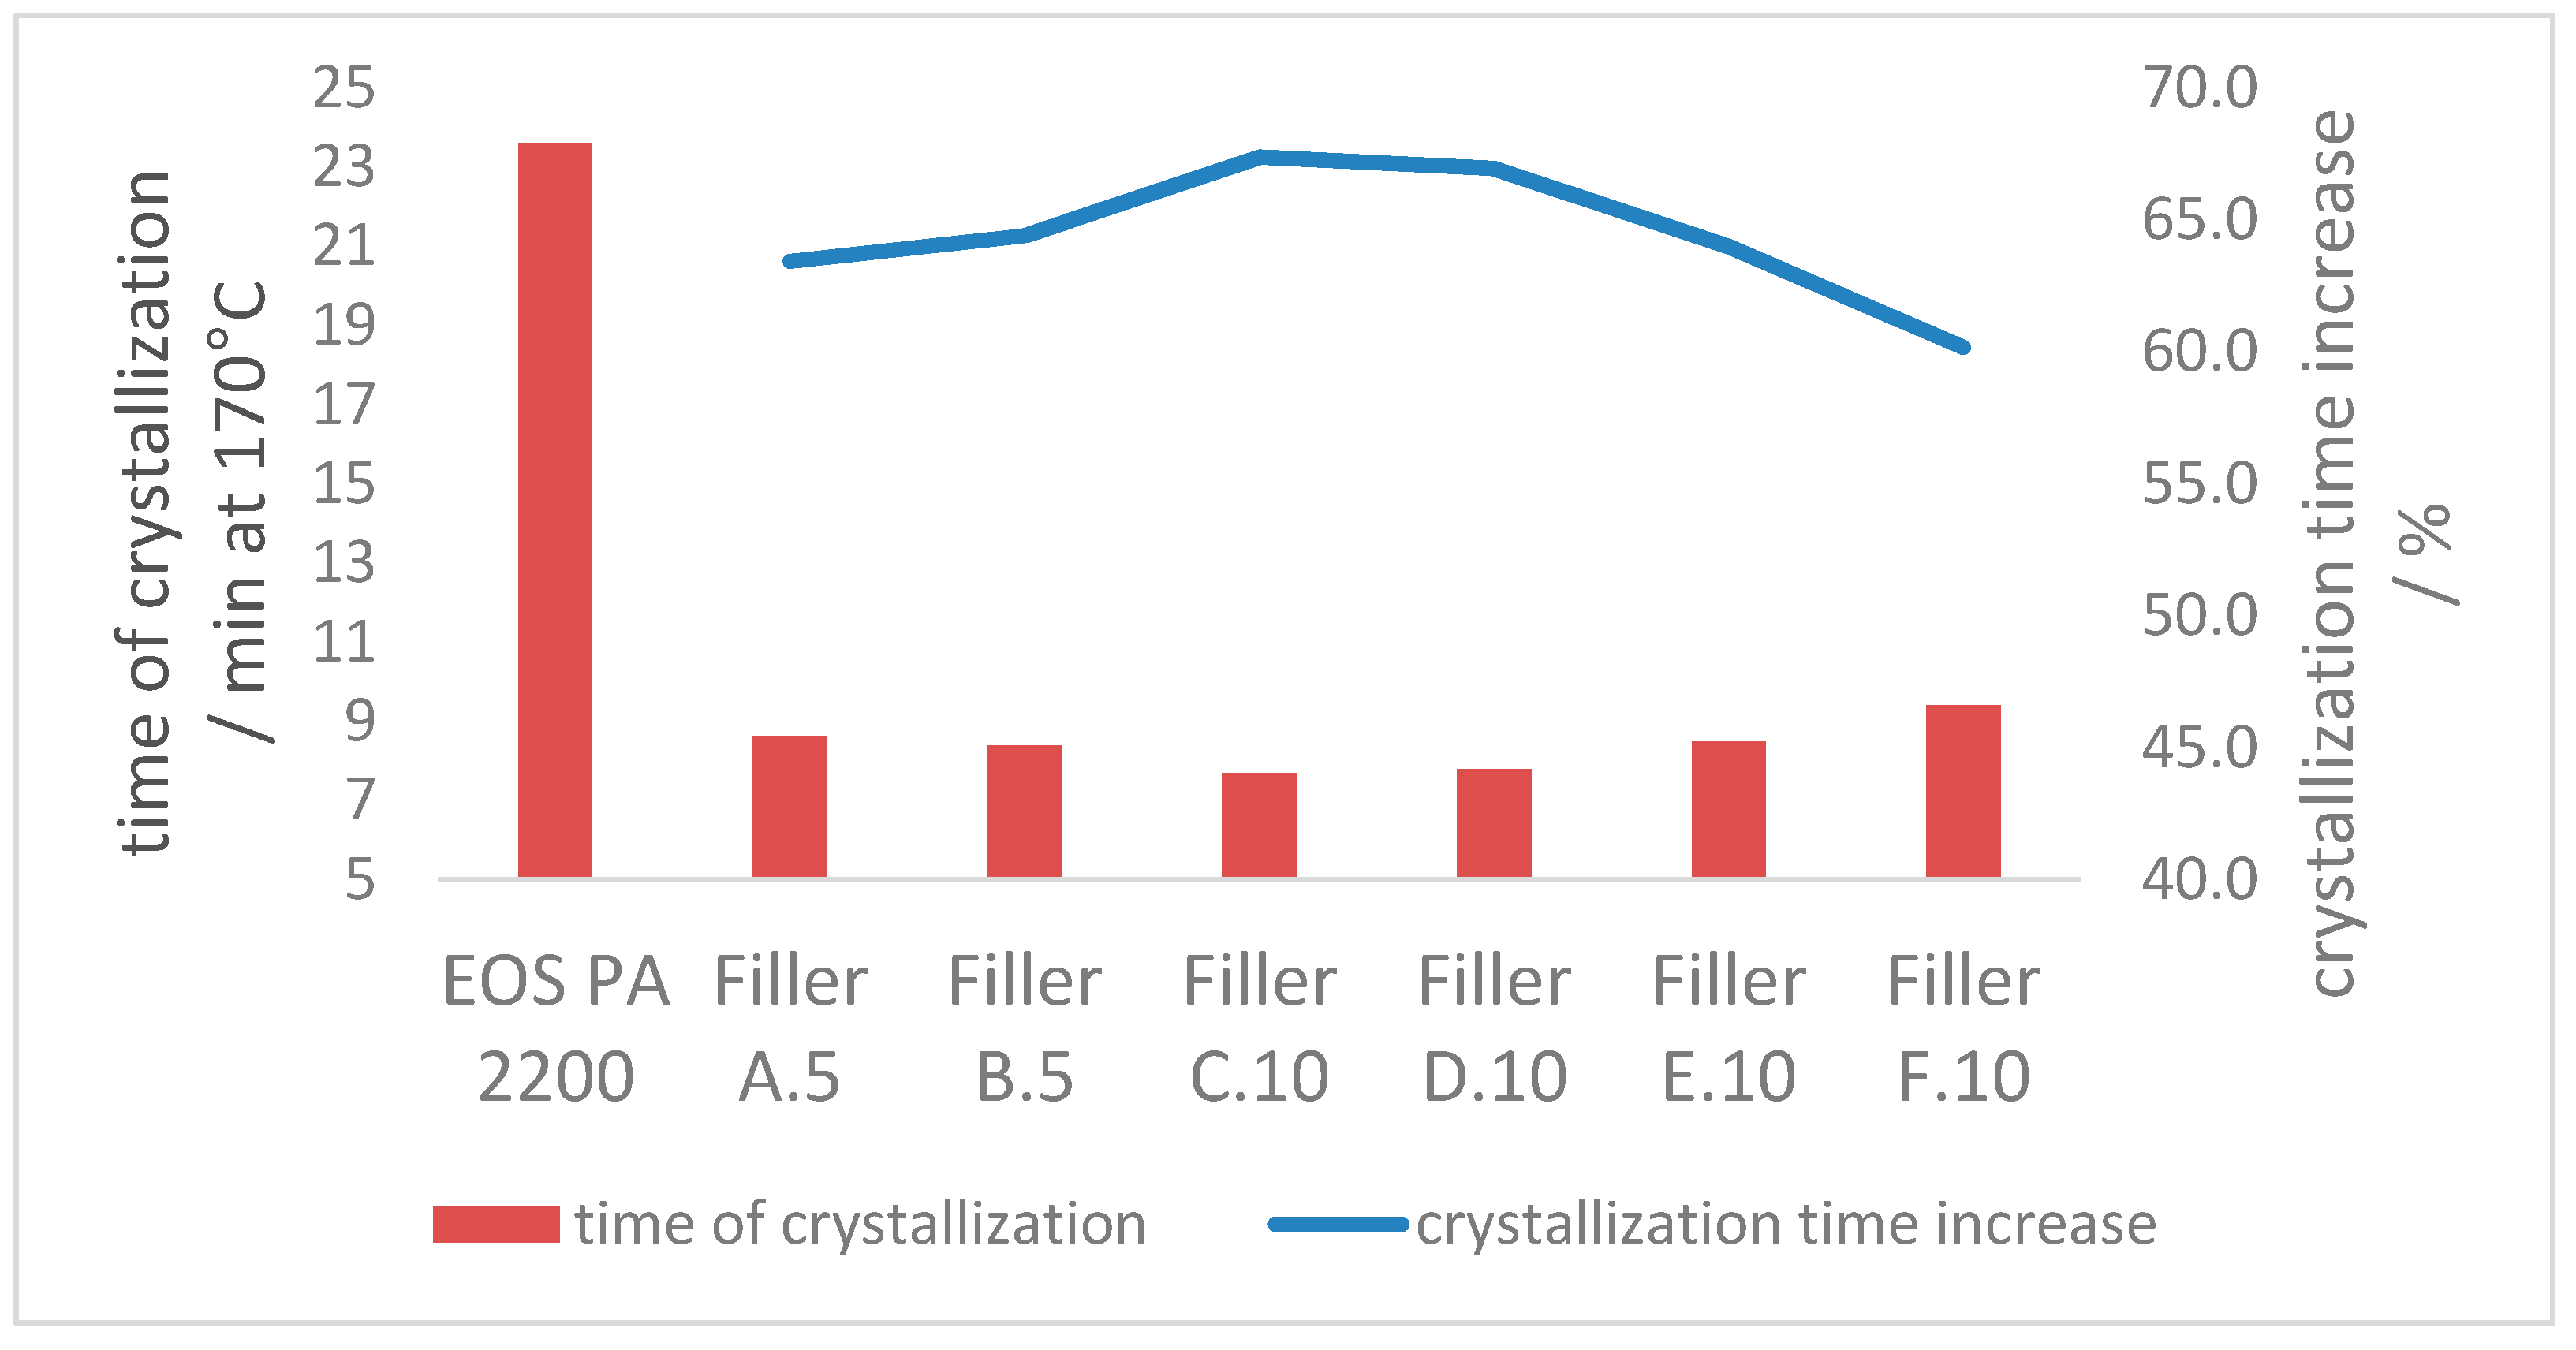
  • The crystallization process at 170 °C can be accelerated approx. 60% with the introduction of enough additional nucleation points, independent of the ratio of coarse and fine filler material in the blend. The crystallization point is significantly increased by the higher particle number of the fine filler fraction, in comparison with the coarse filler introduction only.
The thermal and flowability properties of a polyamide 12 matrix can potentially be optimized with a combination of a precise amount of broad size distribution coarse and narrow size distribution fine calcium carbonate filler. Out of the tested functional filler blends, “Filler C” and “Filler D” showed the most beneficial improvements in the overall thermal properties.
These improvements found under twin-screw extrusion compounding of polyamide 12 demonstrate the possible usage of optimized calcium carbonate as a functional filler in additive manufacturing, which can potentially be transferred via a subsequent investigation into the selective laser sintering process.

Author Contributions

Conceptualization, F.I., G.H., T.C., P.G.; validation, G.H., T.C., P.G.; investigation, F.I.; resources, F.I.; writing—original draft preparation, F.I.; writing—review and editing, G.H., T.C., P.G.; visualization, F.I.; supervision, G.H., T.C., P.G.; project administration, F.I. All authors have read and agreed to the published version of the manuscript.

Funding

This research received no external funding.

Institutional Review Board Statement

Not applicable.

Informed Consent Statement

Not applicable.

Data Availability Statement

The data presented in this study are available on request from the corresponding author. The data are not publicly available due to company ownership.

Acknowledgments

The authors gratefully acknowledge the support and Omya International AG for financial support as well as providing filler raw material and experimental laboratory facilities.

Conflicts of Interest

The authors declare no conflict of interest.

References

  1. Ippolito, F.; Rentsch, S.; Hübner, G.; Claypole, T.; Gane, P. Influence of calcium carbonate on polyamide 12 regarding melting, formability and crystallization properties. Compos. Part B Eng. 2019, 164, 158–167. [Google Scholar] [CrossRef] [Green Version]
  2. Mueller, B. Additive manufacturing technologies–rapid prototyping to direct digital manufacturing. Assem. Autom. 2012, 32. [Google Scholar] [CrossRef]
  3. Hague, R.; Mansour, S.; Saleh, N. Design opportunities with rapid manufacturing. Assem. Autom. 2003, 23, 346–356. [Google Scholar] [CrossRef]
  4. Gibson, I.; Rosen, D.; Stucker, B. Additive Manufacturing Technologies: 3D Printing, Rapid Prototyping, and Direct Digital Manufacturing; Springer: New York, NY, USA, 2014. [Google Scholar]
  5. Kumar, S. Selective Laser Sintering/Melting, Comprehensive Materials Processing; Hashmi, S., Batalha, G.F., Van Tyne, C.J., Yilbas, B., Eds.; Elsevier: Oxford, UK, 2014; pp. 93–134. [Google Scholar]
  6. Lin, L.-L.; Shi, Y.-S.; Zeng, F.-D.; Huang, S.-H. Microstructure of selective laser sintered polyamide. J. Wuhan Univ. Technol. Sci. Ed. 2003, 18, 60–63. [Google Scholar]
  7. Childs, T.H.C.; Berzins, M.; Ryder, G.R.; Tontowi, A. Selective laser sintering of an amorphous polymer—simulations and experiments. Proc. Inst. Mech. Eng. Part B J. Eng. Manuf. 1999, 213, 333–349. [Google Scholar] [CrossRef]
  8. Schmidt, M.; Pohle, D.; Rechtenwald, T. Rechtenwald, Selective laser sintering of PEEK. CIRP Ann. 2007, 56, 205–208. [Google Scholar] [CrossRef]
  9. Koo, J.; Lao, S.; Ho, W.; Ngyuen, K.; Cheng, J.; Pilato, L.; Wissler, G.; Ervin, M. Polyamide nanocomposites for selective laser sintering. Proc. SFF Symp. Austin 2006, 392–409. [Google Scholar]
  10. Schmid, M.; Amado, A.; Wegener, K. Polymer Powders for Selective Laser Sintering (SLS); ETH-Zürich: Zürich, Switzerland, 2014. [Google Scholar]
  11. Kim, J.; Creasy, T. Selective laser sintering characteristics of nylon 6/clay-reinforced nanocomposite. Polym. Test. 2004, 23, 629–636. [Google Scholar] [CrossRef]
  12. Goodridge, R.; Tuck, C.; Hague, R. Laser sintering of polyamides and other polymers. Prog. Mater. Sci. 2012, 57, 229–267. [Google Scholar] [CrossRef]
  13. Guo, Y.; Jiang, K.; Bourell, D.L. Preparation and laser sintering of limestone PA 12 composite. Polym. Test. 2014, 37, 210–215. [Google Scholar] [CrossRef]
  14. Ippolito, F.; Hübner, G.; Claypole, T.; Gane, P.A.C. Influence of the Surface Modification of Calcium Carbonate on Polyamide 12 Composites. Polymers 2020, 12, 1295. [Google Scholar] [CrossRef] [PubMed]
  15. Sreenivasan, R.; Goel, A.; Bourell, D. Sustainability issues in laser-based additive manufacturing. Phys. Procedia 2010, 5, 81–90. [Google Scholar] [CrossRef] [Green Version]
  16. Ford, S.J.; Despeisse, M. Additive manufacturing and sustainability: An exploratory study of the advantages and challenges. J. Clean. Prod. 2016, 137, 1573–1587. [Google Scholar] [CrossRef]
  17. Le Bourhis, F.; Kerbrat, O.; Hascoet, J.-Y.; Mognol, P. Sustainable manufacturing: Evaluation and modeling of environmental impacts in additive manufacturing. Int. J. Adv. Manuf. Technol. 2013, 69, 1927–1939. [Google Scholar] [CrossRef] [Green Version]
  18. Kruth, J.-P.; Levy, G.; Schindel, R.; Craeghs, T.; Yasa, E. Consolidation of polymer powders by selective laser sintering. In Proceedings of the 3rd International Conference on Polymers and Moulds Innovations, Ghent, Belgium, 19–21 September 2008; pp. 15–30. [Google Scholar]
  19. Höhne, G.W.H.; Hemminger, W.; Flammersheim, H.-J. Theoretical Fundamentals of Differential Scanning Calorimeters, Differential Scanning Calorimetry; Springer: Berlin/Heidelberg, Germany, 1996; pp. 21–40. [Google Scholar]
  20. Wunderlich, B. Thermal Analysis of Polymeric Materials; Springer Science & Business Media: Berlin/Heidelberg, Germany, 2005. [Google Scholar]
  21. Drummer, D.; Rietzel, D.; Kühnlein, F. Development of a characterization approach for the sintering behavior of new thermoplastics for selective laser sintering. Phys. Procedia 2010, 5, 533–542. [Google Scholar] [CrossRef] [Green Version]
Figure 1. Particle size distribution of developed fillers.
Applsci 11 00641 g001
Figure 2. Schematic temperature program used in differential scanning calorimetry measurements for melting and crystallization behavior.
Applsci 11 00641 g002
Figure 3. Schematic temperature program used in differential scanning calorimetry measurements for crystallization time behavior.
Applsci 11 00641 g003
Figure 4. SEM images of the filler distribution within the polyamide 12-CaCO3 composites: A.5; B.5; C.10; D.10; E.10; F.10 (from left up to right down).
Applsci 11 00641 g004
Figure 5. Thermogravimetric analysis–degradation temperature comparison.
Applsci 11 00641 g005
Figure 6. Melt properties–melt viscosity comparison at 190 °C, 2.16 kg.
Applsci 11 00641 g006
Figure 7. Melt properties–melt point comparison at 5 K min−1.
Applsci 11 00641 g007
Figure 8. Melt properties–melt peak width comparison at 5 K min−1.
Applsci 11 00641 g008
Figure 9. Crystallization properties–crystallization point comparison at 5 K min−1.
Applsci 11 00641 g009
Figure 10. Crystallization properties–crystallization time comparison at 170 °C.
Applsci 11 00641 g010
Table 1. Material specification.
Omyacarb 10-AVPA2200
Producer/supplierOmya InternationalEOS e-Manufacturing
Volume-based median Particle size, dv509 μm60 μm
Particle shapeirregularspherical
Approx. thermal Conductivity at 298 K1.3 Wm−1 K−10.2 Wm−1 K−1
Approx. specific heat0.8 kJkg−1 K−11.2 kJkg−1 K−1
Table 2. Resulting filler particle data after drying step.
Fillerdv10/μmdv50/μmdv90/μmSpecific Surface Area/m2g−1
A0.996.3418.91.9
B0.240.561.1623.3
Table 3. Resulting filler particle data after filler mixing.
Fillerdv50/μmAmount Filler A/w/w%Amount Filler B/w/w%Specific Surface Area/m2g−1
C4.12505012.2
D5.0070307.8
E2.59307021.8
F2.87336621.6
Table 4. Tested filler loadings and introduced surface area of filler per 100 g polyamide 12.
Filler DefinitionUsed FillerFiller Amount/w/w%Total Carbonate Surface per 100 g Polyamide 12/m2Filler A Surface per 100 g Polyamide 12/m2Filler B Surface per 100 g Polyamide 12/m2
A.5A510100
B.5B51200120
C.10C1014111130
D.10D10951580
E.10E101876181
F.10F1028611275
Publisher’s Note: MDPI stays neutral with regard to jurisdictional claims in published maps and institutional affiliations.

