Article

Effects of Stratification on Soil–Foundation–Structure Interaction: Centrifugal Observation and Numerical Simulation

1
Department of Civil Engineering, Chonnam National University, Yongbong-ro 77, Buk-gu, Gwangju 61186, Korea
2
Lecturer, Faculty of Civil Engineering, Thuyloi University, 175 Tay Son Street, Dong Da District, Hanoi 100000, Vietnam
*
Author to whom correspondence should be addressed.
Appl. Sci. 2021, 11(2), 623; https://doi.org/10.3390/app11020623
Submission received: 7 December 2020 / Revised: 1 January 2021 / Accepted: 7 January 2021 / Published: 11 January 2021
(This article belongs to the Section Mechanical Engineering)

Abstract

:
It is essential to reduce structural damages caused by earthquakes in severe conditions, such as layered ground, especially when a soft soil layer is close to the surface. In this study, the kinematic and inertial interactions, two mechanisms of soil–foundation–structure interaction (SFSI), of different soil–foundation–structure systems (SFS) were investigated on uniform and layered grounds. Two layered soil profiles composed of a low stiffness layer laid over another were prepared in an equivalent shear beam container. Nine centrifuge experiments were carried out for three structures located on the surface of each ground and exposed to the Hachinohe earthquake while increasing the peak acceleration of the input motion. Numerical simulations were performed to simulate the centrifuge tests. It was found that roof motion (RM) of the tall structure increased in layered profile even though the free-field motion (FFM) decreased compared to homogeneous ground. The appearance of a soft layer beneath structures modifies the SFS system’s stiffness that causes kinematic and inertial interactions to alter to those on uniform soil profile.

1. Introduction

The fundamental influence of the soil–foundation–structure interaction (SFSI) on the seismic response of structures during earthquakes is well known. Kinematic and inertial interactions are the most important mechanisms in SFSI analysis because they cause Foundation Input Motion (FIM) to alter under Free-field Motion (FFM) and control the behavior of the structure. The inertial interaction is caused by the translational and rocking behaviors of the soil–foundation–structure (SFS) system, which increases the system period and damping compared to fixed-base structures [1,2,3,4]. On the other hand, kinematic interaction is generally described by base-slap averaging and embedment effects by means of the transfer functions between FFM to FIM and is responsible for the reduction in the FIM at high-frequency contents compared to the FFM [5,6,7,8]. Veletsos, Prasad [6] proposed closed-form expressions of translational and rotational transfer functions for rectangular and circular foundations where the amplitude depends mostly on incoherence parameters (i.e., kt for translational and kr for rocking behaviors) in a homogeneous ground condition. It is essential when estimating FIM in analytical SFSI analysis to choose reasonable values for these incoherence parameters. Motivated by this, Kim and Stewart [8] explored how kt increases with increasing shear wave velocity (Vs) of the soil or with decreasing width of the foundation.
However, the layered ground condition, an essential case in SFSI, has not been well-considered in these previous studies. Because of serious damage to structures located on soft layers after the 1985 Mexico City earthquake and the Great Hanshin earthquake (i.e., Kobe earthquake) in 1995, numerous studies have been conducted on the effects of local site conditions on soil amplification as well as the structure’s response [9,10,11]. Seismic waves, in general, tend to be amplified more in softer geologic grounds. As a result, more severe damage occurs to structures during earthquakes. Based on the analytical approach, numerical modeling, and centrifugal experiments, several types of research reported that it is essential to understand the effects of the local site on soil amplification and SFSI to reduce earthquake damage: (1) damage to structures was more significant as the thickness of the soft layer increased, and higher structures with more stories experienced more damage than shorter structures built on the same ground [12]; (2) an increase in structure response on a layered profile was observed because the static stiffness of the foundation decreases due to the pressure bulb of horizontal shear stresses in the soil layer beneath the structure located on layered profiles [13,14,15,16,17], and (3) structure displaced more when the thickness of the soft layer decreased [14,15,17]. However, most of the studies focused on the structure responses without considering the effects of stratification on kinematic and inertial interactions with incoherence parameters and rocking behavior.
The objective of this study is to evaluate the effect of seismic behavior on various foundation–structure systems located on different layered grounds. Nine centrifuge experiments were carried out with three different structures located on three soil profiles combined into two soil layers with different thicknesses and stiffnesses. Numerical models were performed with nonlinear soil properties to simulate the centrifugal experiments. The kinematic and inertial interactions with regard to the response of three structures were investigated under various local site conditions.

2. Model Preparation and Testing Procedure
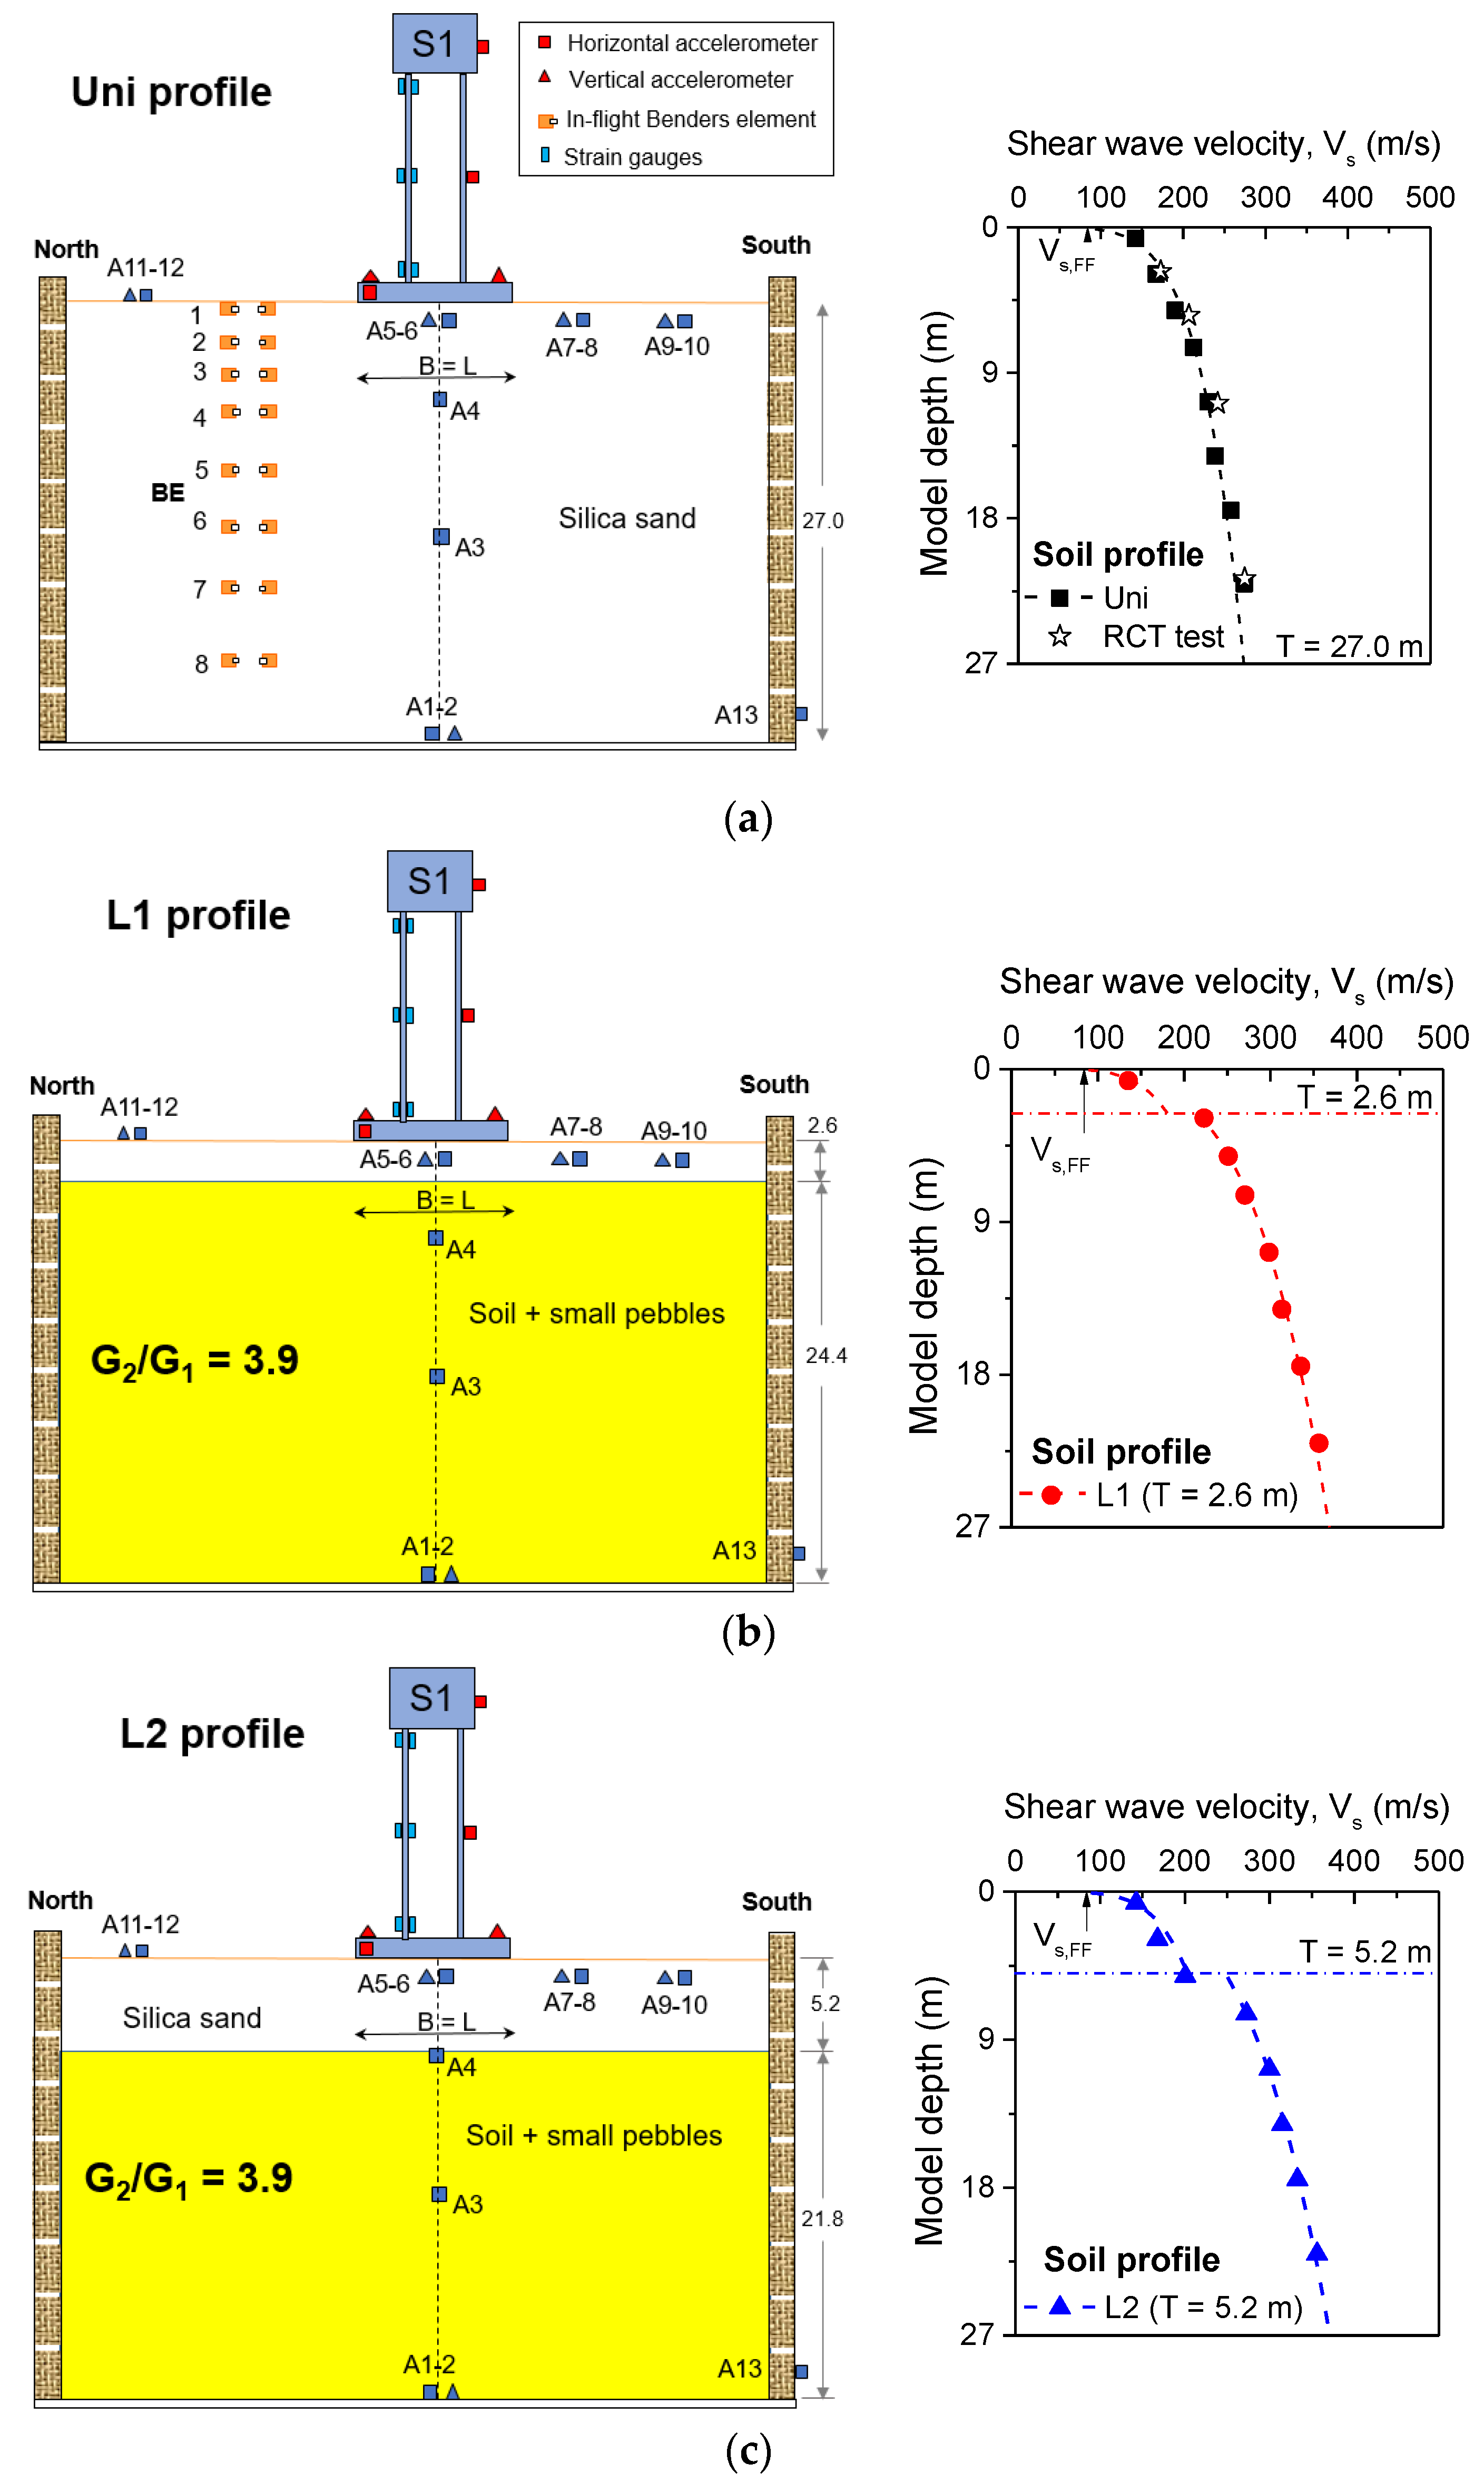
Geo-Centrifuge tests were performed at 45 g acceleration using a 5 m radius beam centrifuge located in the KOCED Geotechnical Centrifuge Center at KAIST, South Korea. An electro–hydraulic earthquake simulator (EQS) installed in the centrifuge machine was used to apply a one-dimensional base input motion. Soil models were prepared in an equivalent shear beam (ESB) container with inner dimensions of 0.45 m in length, 0.45 m in width, and 0.63 m in height.

2.1. Soil Models

Three ground models were prepared, including uniform (Uni) and two layered soil profiles (L1 and L2), as shown in Figure 1. Considering the scaling law [18], the total thickness of the prototype ground was equivalent to 27 m. The layered profiles included a relatively thin low stiffness layer laid over a higher stiffness layer, and a uniform profile contained only the low stiffness layer. The thickness of the low stiffness upper layer (T) was 2.6 m for profile L1, 5.2 m for L2, and 27 m for the Uni profile, which is approximately 0.5, 1.0, and 5.0 times the foundation width (B) of the S1 structure. Figure 1 shows the cross-sections of ground soils modeled in the ESB container at a prototype scale for the centrifuge experiments. Two types of soil were used in this study, a poor-graded silica sand for preparing the low stiffness layer and a mixture of small pebbles with weathered soil to simulate the high stiffness layer. An air-pluviation method was used to prepare the low stiffness layer that uses the silica sand with a relative density (Dr) of about 80%, corresponding to a dry density (ρ) of 1.54 t/m3. The high stiffness soil was prepared by mixing soil with a weight ratio of 45% pebbles and 55% weathered soil at the optimum water content (ωopt) to obtain its maximum dry unit weight and shear stiffness (G). Note that ωopt of the mixture was defined as approximately 10.5% based on standard compaction test results. The high stiffness layer was divided into several thin layers (i.e., the thickness of 5 cm in model scale) and was carefully tamped until reaching the pre-determined unit weight. The resonant column (RC) tests were performed on the soil samples under the same conditions (i.e., Dr, unit weight, and water content) as the soil in the models to find the variation of shear modulus degradation and damping curves of the two soils under different confinements.
An array of bender elements (BE) was placed in the ESB container to measure the shear wave velocity profile of the ground at the given centrifugal acceleration. The shear wave profiles measured for Uni, L1, and L2 profiles are plotted in Figure 1. The measured Vs profile for the silica sand layer matched the results of the resonant column (RC) tests well on specimens with the same conditions as the soils in the ESB container. The measured Vs for the high stiffness layer shows relatively high values compared to the low stiffness layer. The free-field shear wave velocity (Vs,FF) was measured to be about 95 m/s for all three soil profiles. The estimated shear modulus suggested that the shear stiffness of the stiff lower layer was approximately 3.9 times that of the soft upper layer (G2/G1 = 3.9, as shown in Figure 1). Note that the dashed lines in the figure were calculated by a power function of mean effective stress, which increased with model depth [19]. The site fundamental frequencies (fG), which can be calculated from the Vs profile, were 2.02 Hz, 2.60 Hz, and 2.50 Hz for Uni, L1, and L2 profiles, respectively [20].

2.2. Structural Models

To investigate the effects of the ground layer on SFSI for different structures with various masses and foundation widths, three single-degree-of-freedom (SDOF) structures, namely S1, S2, and S3, were designed with various dynamic structural characteristics. Note, the structures used in this study were made of aluminum. Table 1 indicates the dimensions and dynamic properties of the three structures. The foundation width (B) was 5.2 m for both S1 and S2, and 1.2 m for S3. The heights of the three structures were 9.4 m for S1, 8.25 m for S2, and 2.97 m for S3. Furthermore, impact hammer tests were performed to identify the fixed-base natural frequency (fn) of the three small-scale structural models with the help of an acceleration attached to the lumped mass of the structure. The signal was recorded by using an oscilloscope. Using the scaling law and fast Fourier transform (FFT) analysis for the recorded signal, the fn was found to be 2.19 Hz, 1.82 Hz, and 7.05 Hz for S1, S2, and S3 structures, respectively.

2.3. Sensor Arrangements

As shown in Figure 1, several accelerometers were installed to monitor input motion (A13), to record the soil’s seismic response (A1 to A5), and capture the free-field motion (A11 and A12). Note that A11 and A12 were placed on the ground as far from the structures as possible. Because of the limitation in size of the ESB container, the distance from these accelerometers to the boundary was smaller than that recommended by Lanzano, Bilotta [21] and Lanzano, Bilotta [22]; however, this effect was minimized by using the ESB container [20]. Two accelerometers, A5 and A6, were buried just beneath the foundation to record the horizontal and vertical responses of the soil to the vibrations of the structures. Several accelerometers were attached to the foundation and the roof of the structures to record horizontal motions and monitor vertical and rocking motions. Moreover, three pairs of strain gauges were attached to the wall of the S1 structure at three positions, top, middle, and bottom (Figure 1), to define the bending moments of the structure’s wall and the overturning moment of the foundation during seismic loading [23,24].

2.4. Input Motion and Studying Program

A historical earthquake named Hachinohe, which was recorded in 1968 at Tokachi Oki, Japan, was selected as the input motion in this study. The input excitations were scaled into different levels from low to high intensity by enlarging the peak acceleration of the base motion (PGABM) from about 0.04 g to 0.3 g. Nine centrifuge tests were carried out for three structures, S1, S2, and S3, with three soil profiles for each different level of the Hachinohe earthquake.

3. Numerical Simulation

The numerical analyses were performed to investigate the layer effects on the structural response and SFSI with various factors, such as increasing the soft layer thickness above (T) and changing the structures. The numerical simulations were made using a three-dimensional finite-difference program, which is capable of performing nonlinear time history analysis with embedded nonlinear dynamic behaviors of soil, structure, and interface between soil and structure [25,26,27].

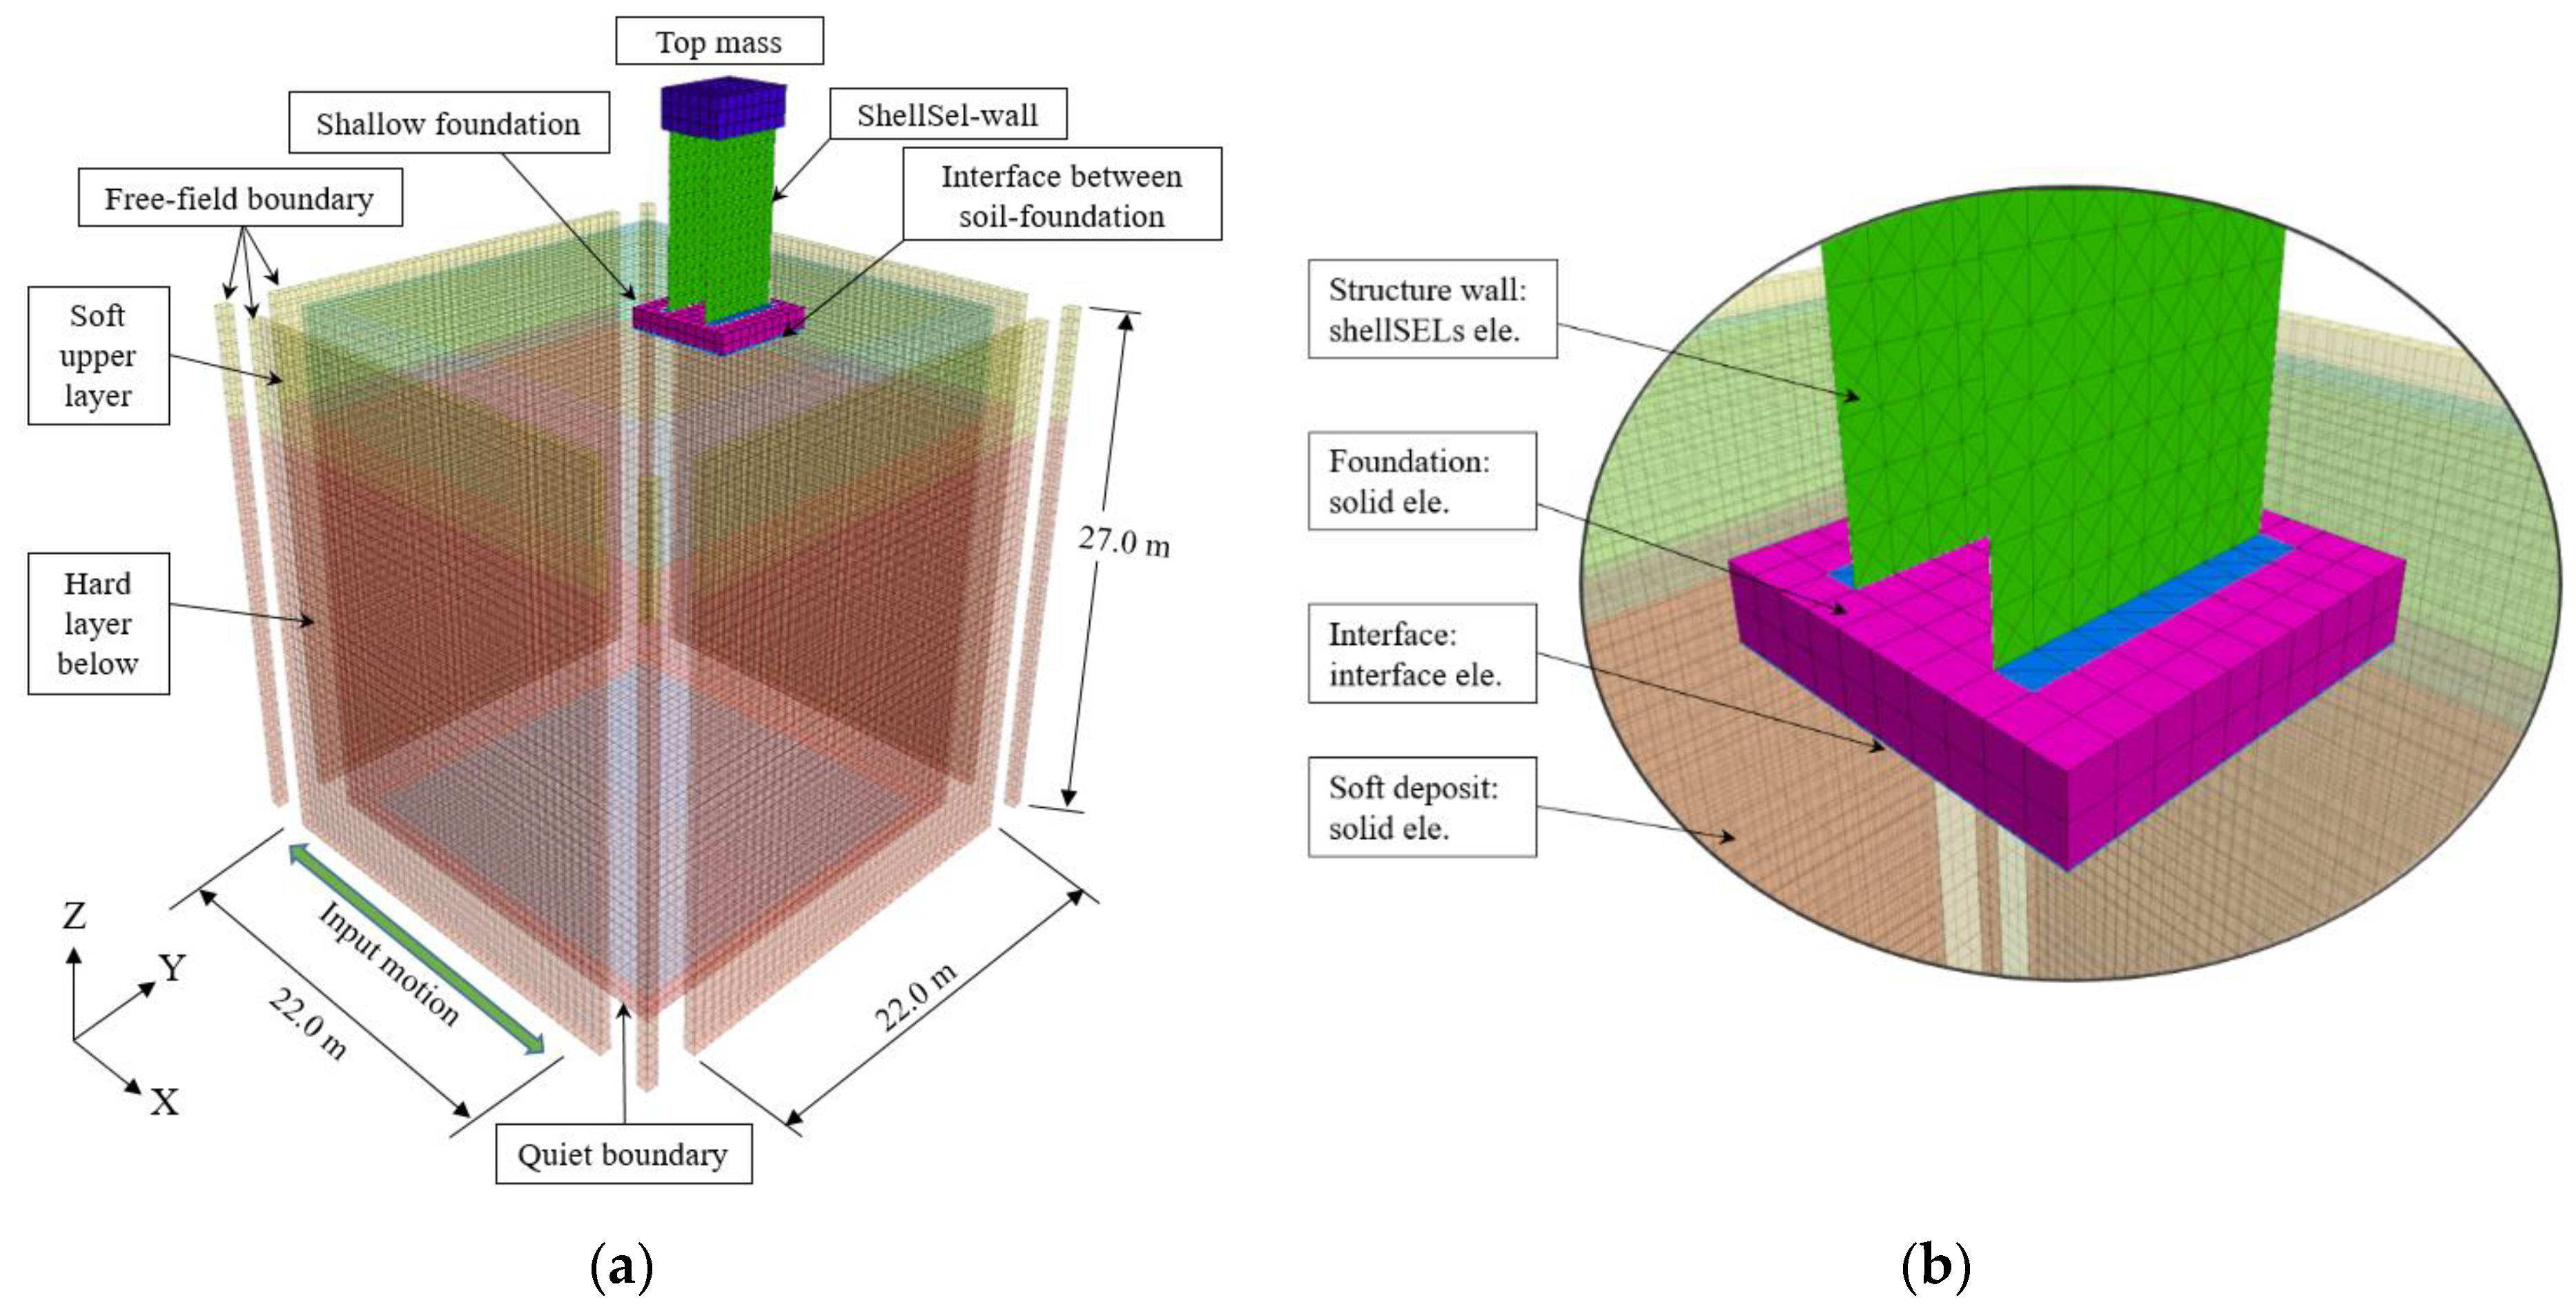
3.1. Numerical Model Properties

The dimensions of the models used for numerical simulations were similar to the prototype scale performed at the experiments (Figure 2). To increase the accuracy and reduce calculation time, the selected maximum size of hexahedral-dominant mesh for soil media, foundations, and lumped masses was 0.5 m with a concerning frequency of below 25 Hz (Itasca 2013; Rayhani and El Naggar 2008). The Mohr–Coulomb soil criterion, in accordance with the hysteretic damping model, was implemented to simulate the nonlinear behavior of soil. The parameters required for the Mohr–Coulomb model of the two soils, such as friction angle (φ) and cohesion (c), were determined through experiments on soil specimens at a similar relative density (Dr) to the soil in ESB container, such as tri-axial test. The model properties, which are depth-dependent, such as shear modulus (G) and bulk modulus (K), were calculated from Vs profiles as functions of the model depth (Figure 1). The Hardin–Drnevich hyperbolic model fitting to RC test results on the same soils was adopted to simulate degradation of soil shear modulus and increase in damping with the shear strain [28]. A Rayleigh damping was applied to be the minimum damping (Dmin) at a small strain (the damping at 10−3 shear strain obtained from RC tests) for all the soil elements with a frequency range from 0.5 Hz to 10 Hz.
The foundation and top mass of structures were simulated using solid elements. The shell elements (ShellSELs) were implemented to model the walls of structures. The thickness of shell elements was taken to be equal to the thickness of the structural walls at the prototype scale, which was 0.28 m for S1, and 0.18 m for S2 and S3 structures. A Poisson’s ratio of 0.33 was used for aluminum materials, and values of Young’s modulus for the structural material were defined by calibrating the value of the fixed-base frequency of each structure using the linear frequency solver in ABAQUS software [29]. To model the interaction between the foundation and soil elements, the interface elements were adopted as systems of linear spring and slider (Figure 2). The Mohr–Coulomb failure criterion was embedded for the interface shear strength with friction coefficient taken as 0.57 following Xu and Fatahi [26]. Values of normal (kn) and shear stiffness (kn) of interface elements, which control relative movement of the interface, were defined following the recommendation of Itasca [28] with a reduction reported by Rayhani and El Naggar [25] because of the reduction in soil stiffness during the earthquake. The free-field boundary was applied for the sides of the model to minimize reflected waves from these boundaries. The quiet boundary was used for the base, and the input motion was applied as shear stress estimated from the velocity of input motion.

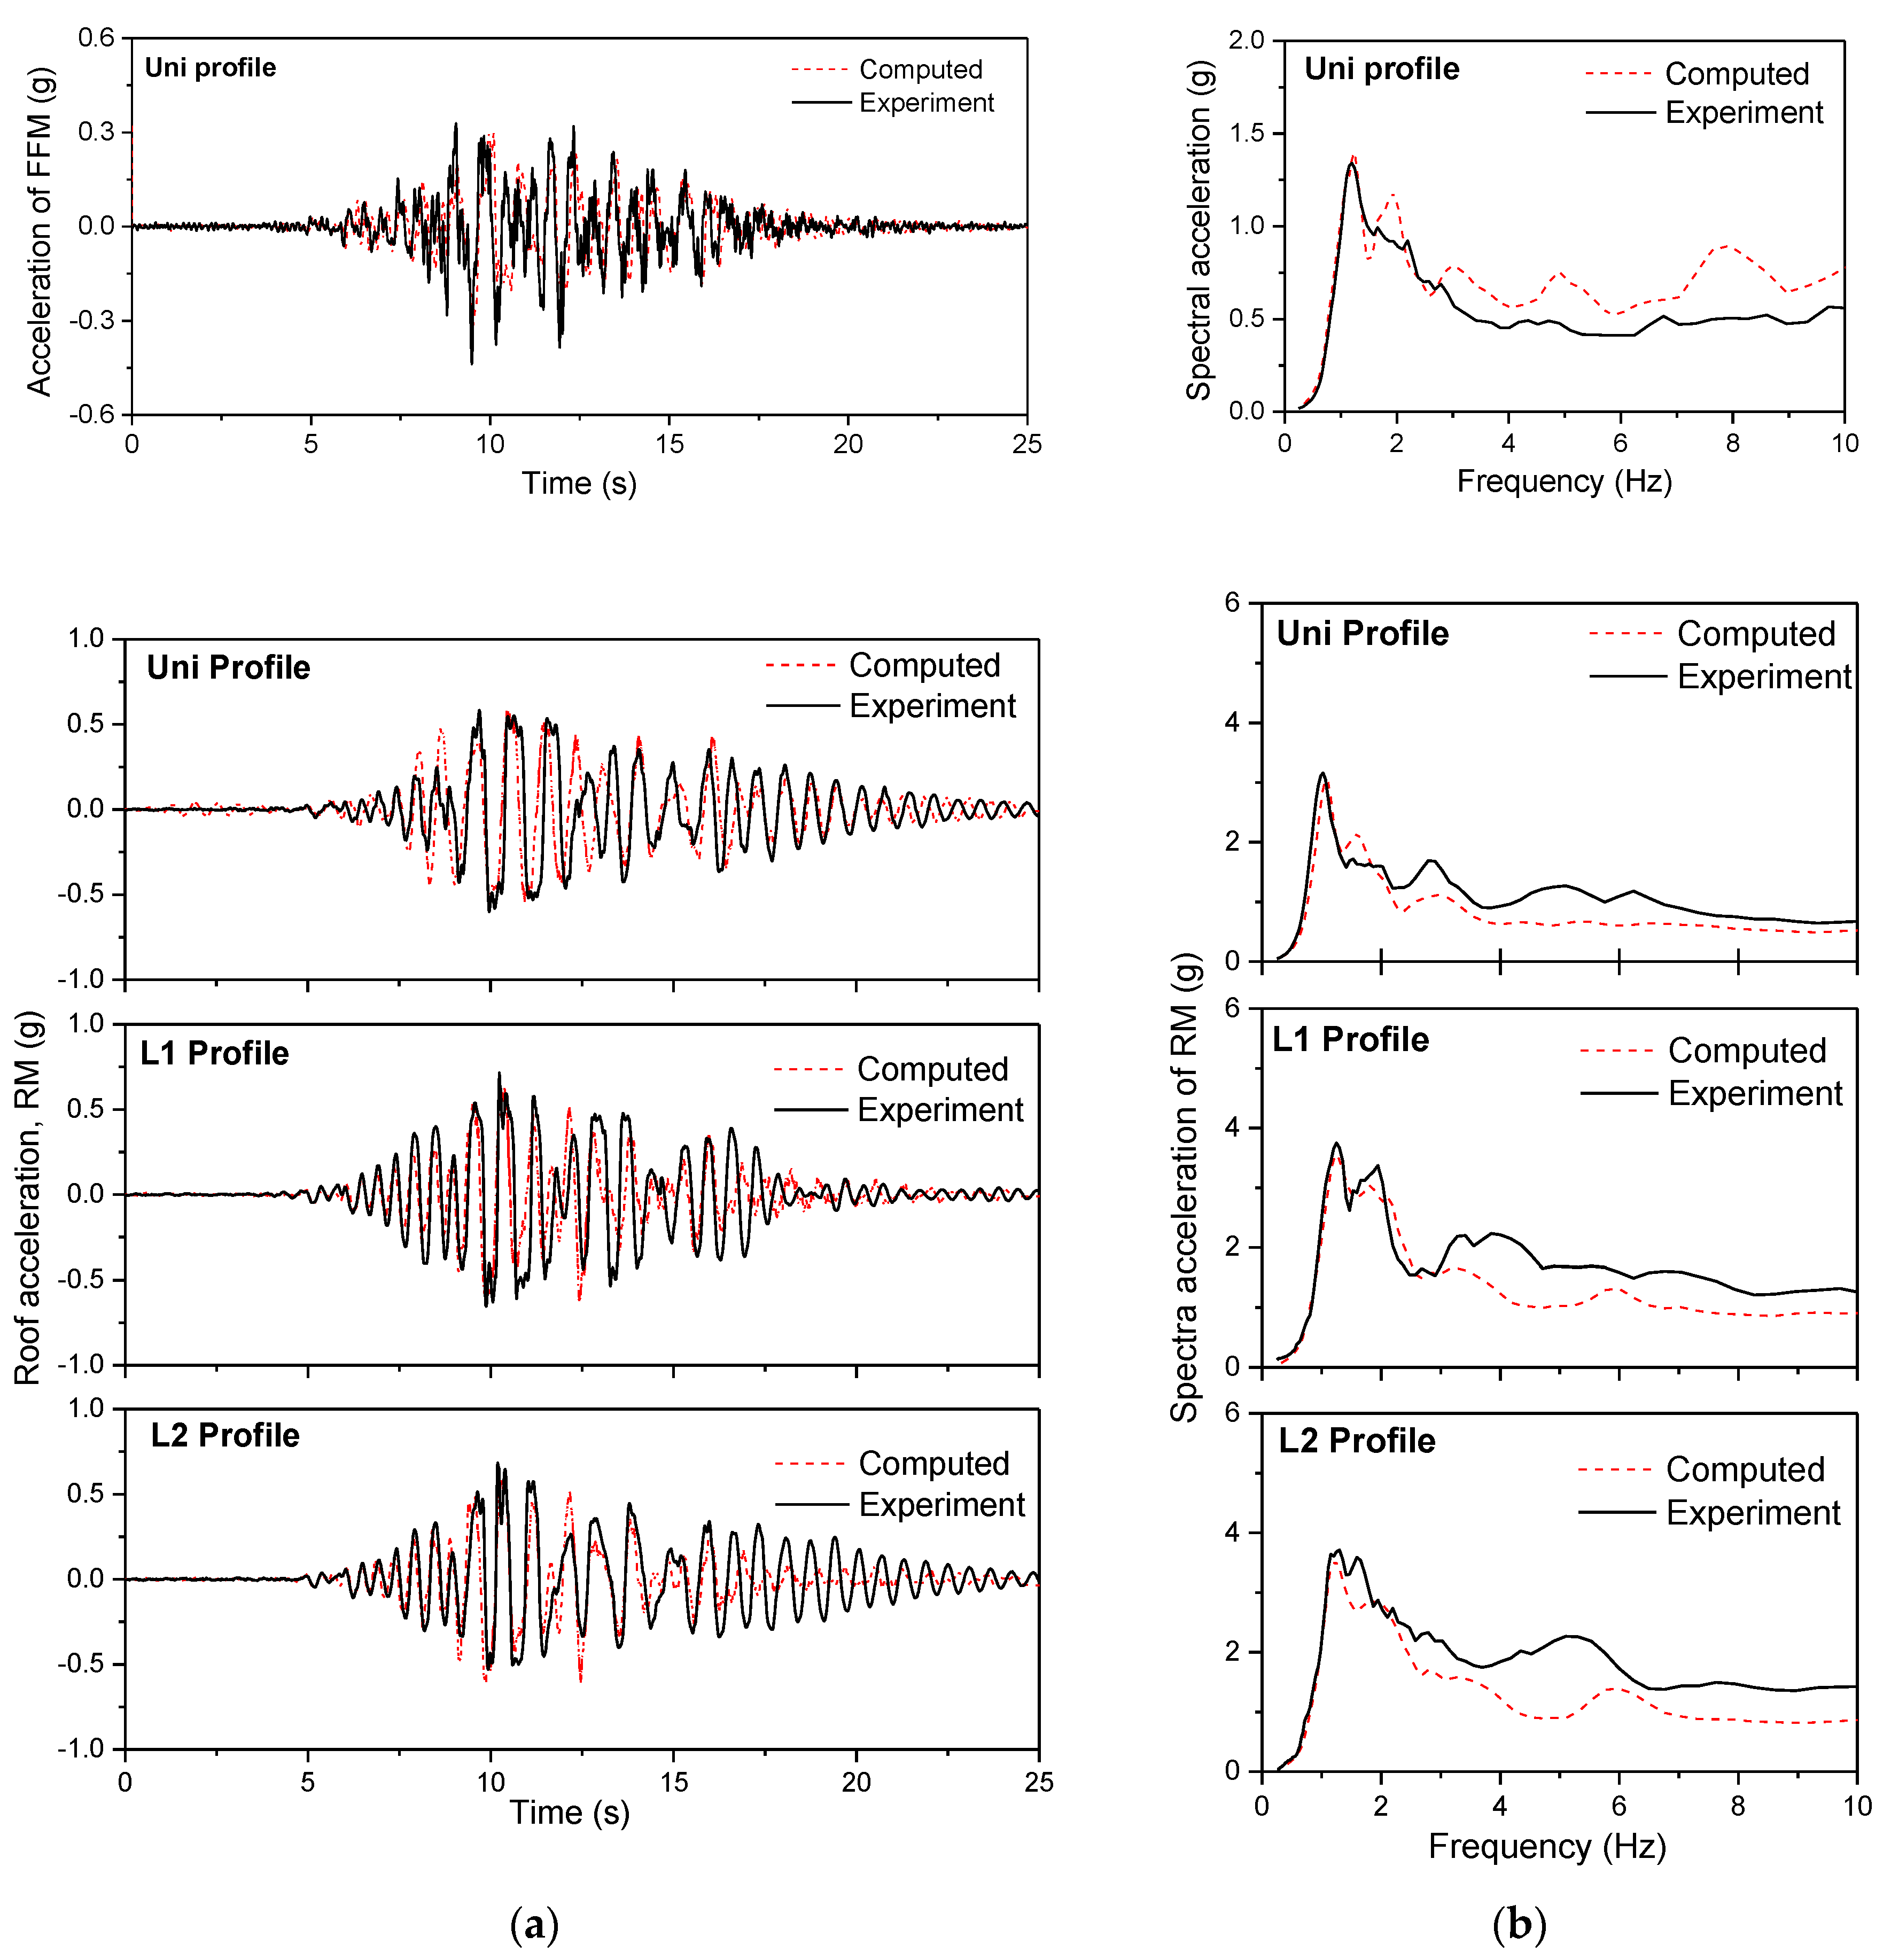
3.2. Model Verification

Representative results of numerical simulation (i.e., time history and 5% damping response spectra) for three soil profiles (Uni, L1, and L2) with free-field motion (FFM) and roof motion (RM) at earthquake with PGABM of 0.22 g are illustrated in Figure 3. The good agreement between the centrifuge and numerical data in terms of time and frequency domains indicates the capacity of numerical analysis in estimating SFSI during an earthquake, both in uniform and layered profiles. The hysteretic and Rayleigh damping applied in the model capture appropriately a nonlinear soil dynamic characteristic in the centrifuge model.

4. Results and Discussion

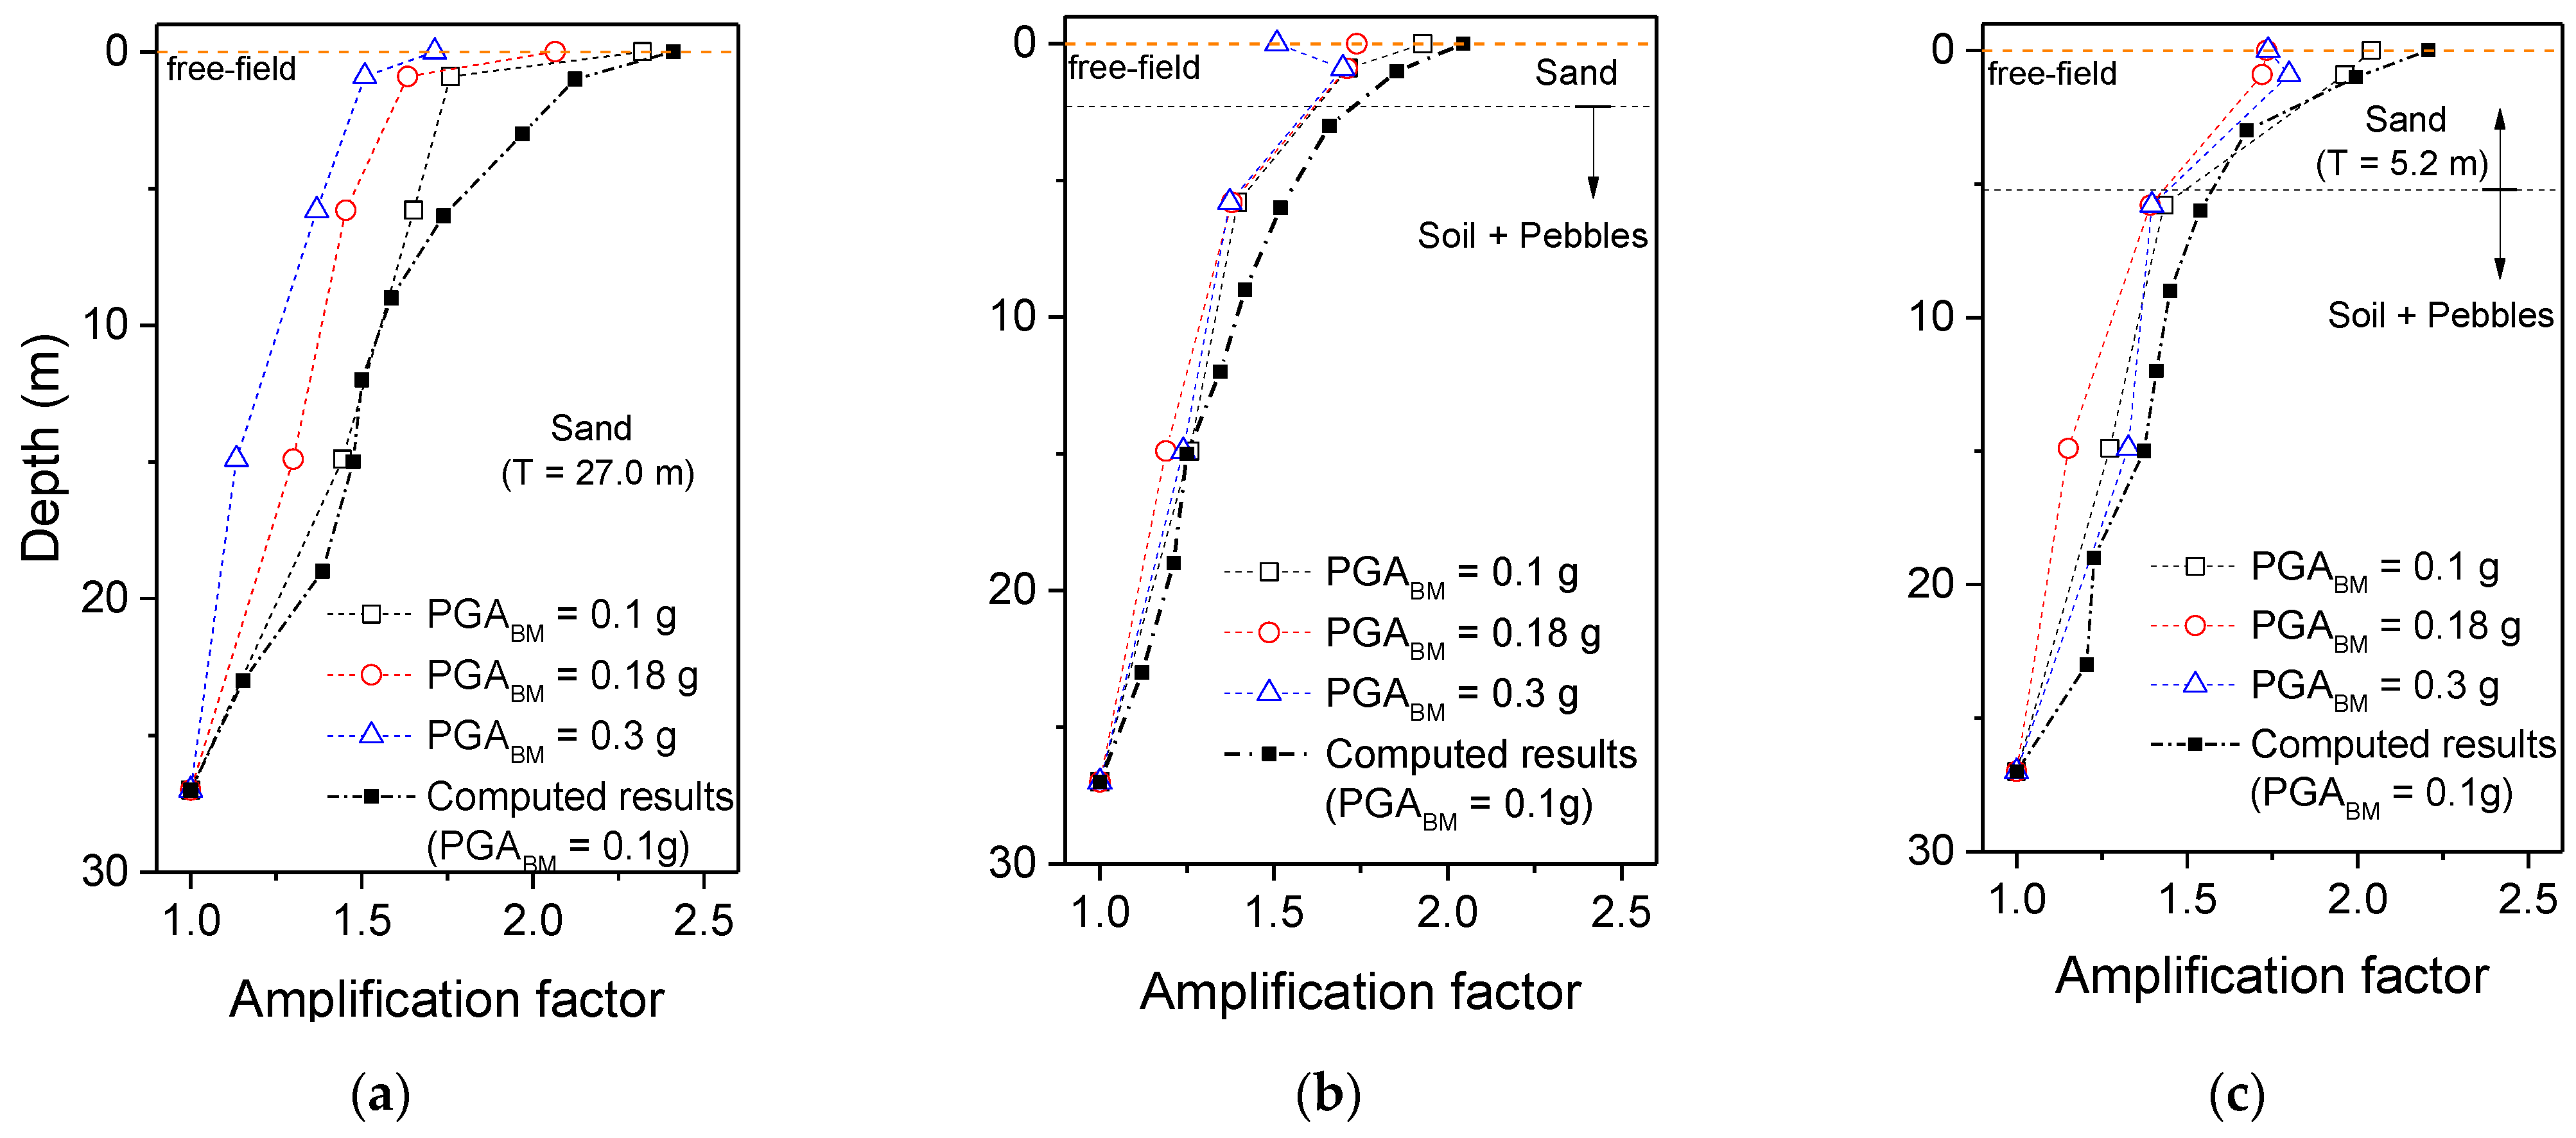
4.1. Soil Amplification

The amplification factor was estimated by normalizing the peak acceleration of the motion measured in the soil and the free field (PGAFFM) to the input motion measured at the base (PGABM). Figure 4 illustrates the soil amplification factor with the depth of the three soil models at three levels of PGABM. It was found that earthquake motion was amplified according to depth and amplified slightly more at lower earthquake intensities, especially in the soil near the ground surface. The smaller amplification at high earthquake intensities with a PGABM of 0.3 g was observed due to the nonlinear behavior of soil, leading to a reduction in soil stiffness. The amplification in the mixed layer at the L2 profile was slightly higher than those at the L1 profile because a lower confining pressure was applied to this layer in L2 profile, and the soil becoming slightly looser after several earthquakes, as indicated in Figure 1. An exception was observed in the layered profiles (Figure 4b,c) at a PGABM of 0.3 g. The measured PGAFFM was smaller than the peak acceleration recorded at the A5 accelerometer. Note that A5 was placed in the thin, soft layer below the S1 structure, as indicated in Figure 1. The effects of structural vibration and reflected waves from the interface between layers in a high amplitude earthquake could cause this increase in the motion of the soil beneath the structure [17].
Figure 5a compares the variation of PGAFFM in the layered profiles with that in the Uni profile. Although the input intensity at the base was kept roughly the same, the PGAFFM in the L1 and L2 profiles were smaller than those in the Uni profile by about 14% and 7%, respectively. There was an increase in the PGAFFM with an increase in the thickness of the soft upper layer at all tested input levels, which has also been observed in numerous other studies and field data [12,27,30,31]. However, the soil’s response beneath the structure indicated an inverse trend when the horizontal and vertical peak acceleration measured at the A5 (PGAA5) and A6 accelerometers (PGAA6) increased with decreasing T, as indicated in Figure 5b,c. At low input intensity, the values of PGAA5 in L1 and L2 profiles were close to those in the Uni profile. However, for larger earthquakes, PGAA5 in L1 and L2 profiles highly exceeded those from the Uni profile by about 27% and 13%. A more severe increment can be seen in the vertical motion (PGAA6), where it was 53% and 37% higher for the respective L1 and L2 profiles. Several studies [13,17,32] reported a reduction in the stiffness of soil beneath the structure (in the soft layer) at high input intensity. This was caused by the stress concentrations formed beneath the structure and could account for the increments in response to the soil in both horizontal and vertical directions. As the thickness of the soft layer decreased, the response of soil increased due to the significantly concentrated stress in the soft soil layer caused by the structure. Moreover, compared to the increase in horizontal motion in the layered profiles, the vertical motion increments were more significant regardless of input intensity or thickness of the soft upper layer, which implies the influence comes from the dynamic vertical force in the structure.

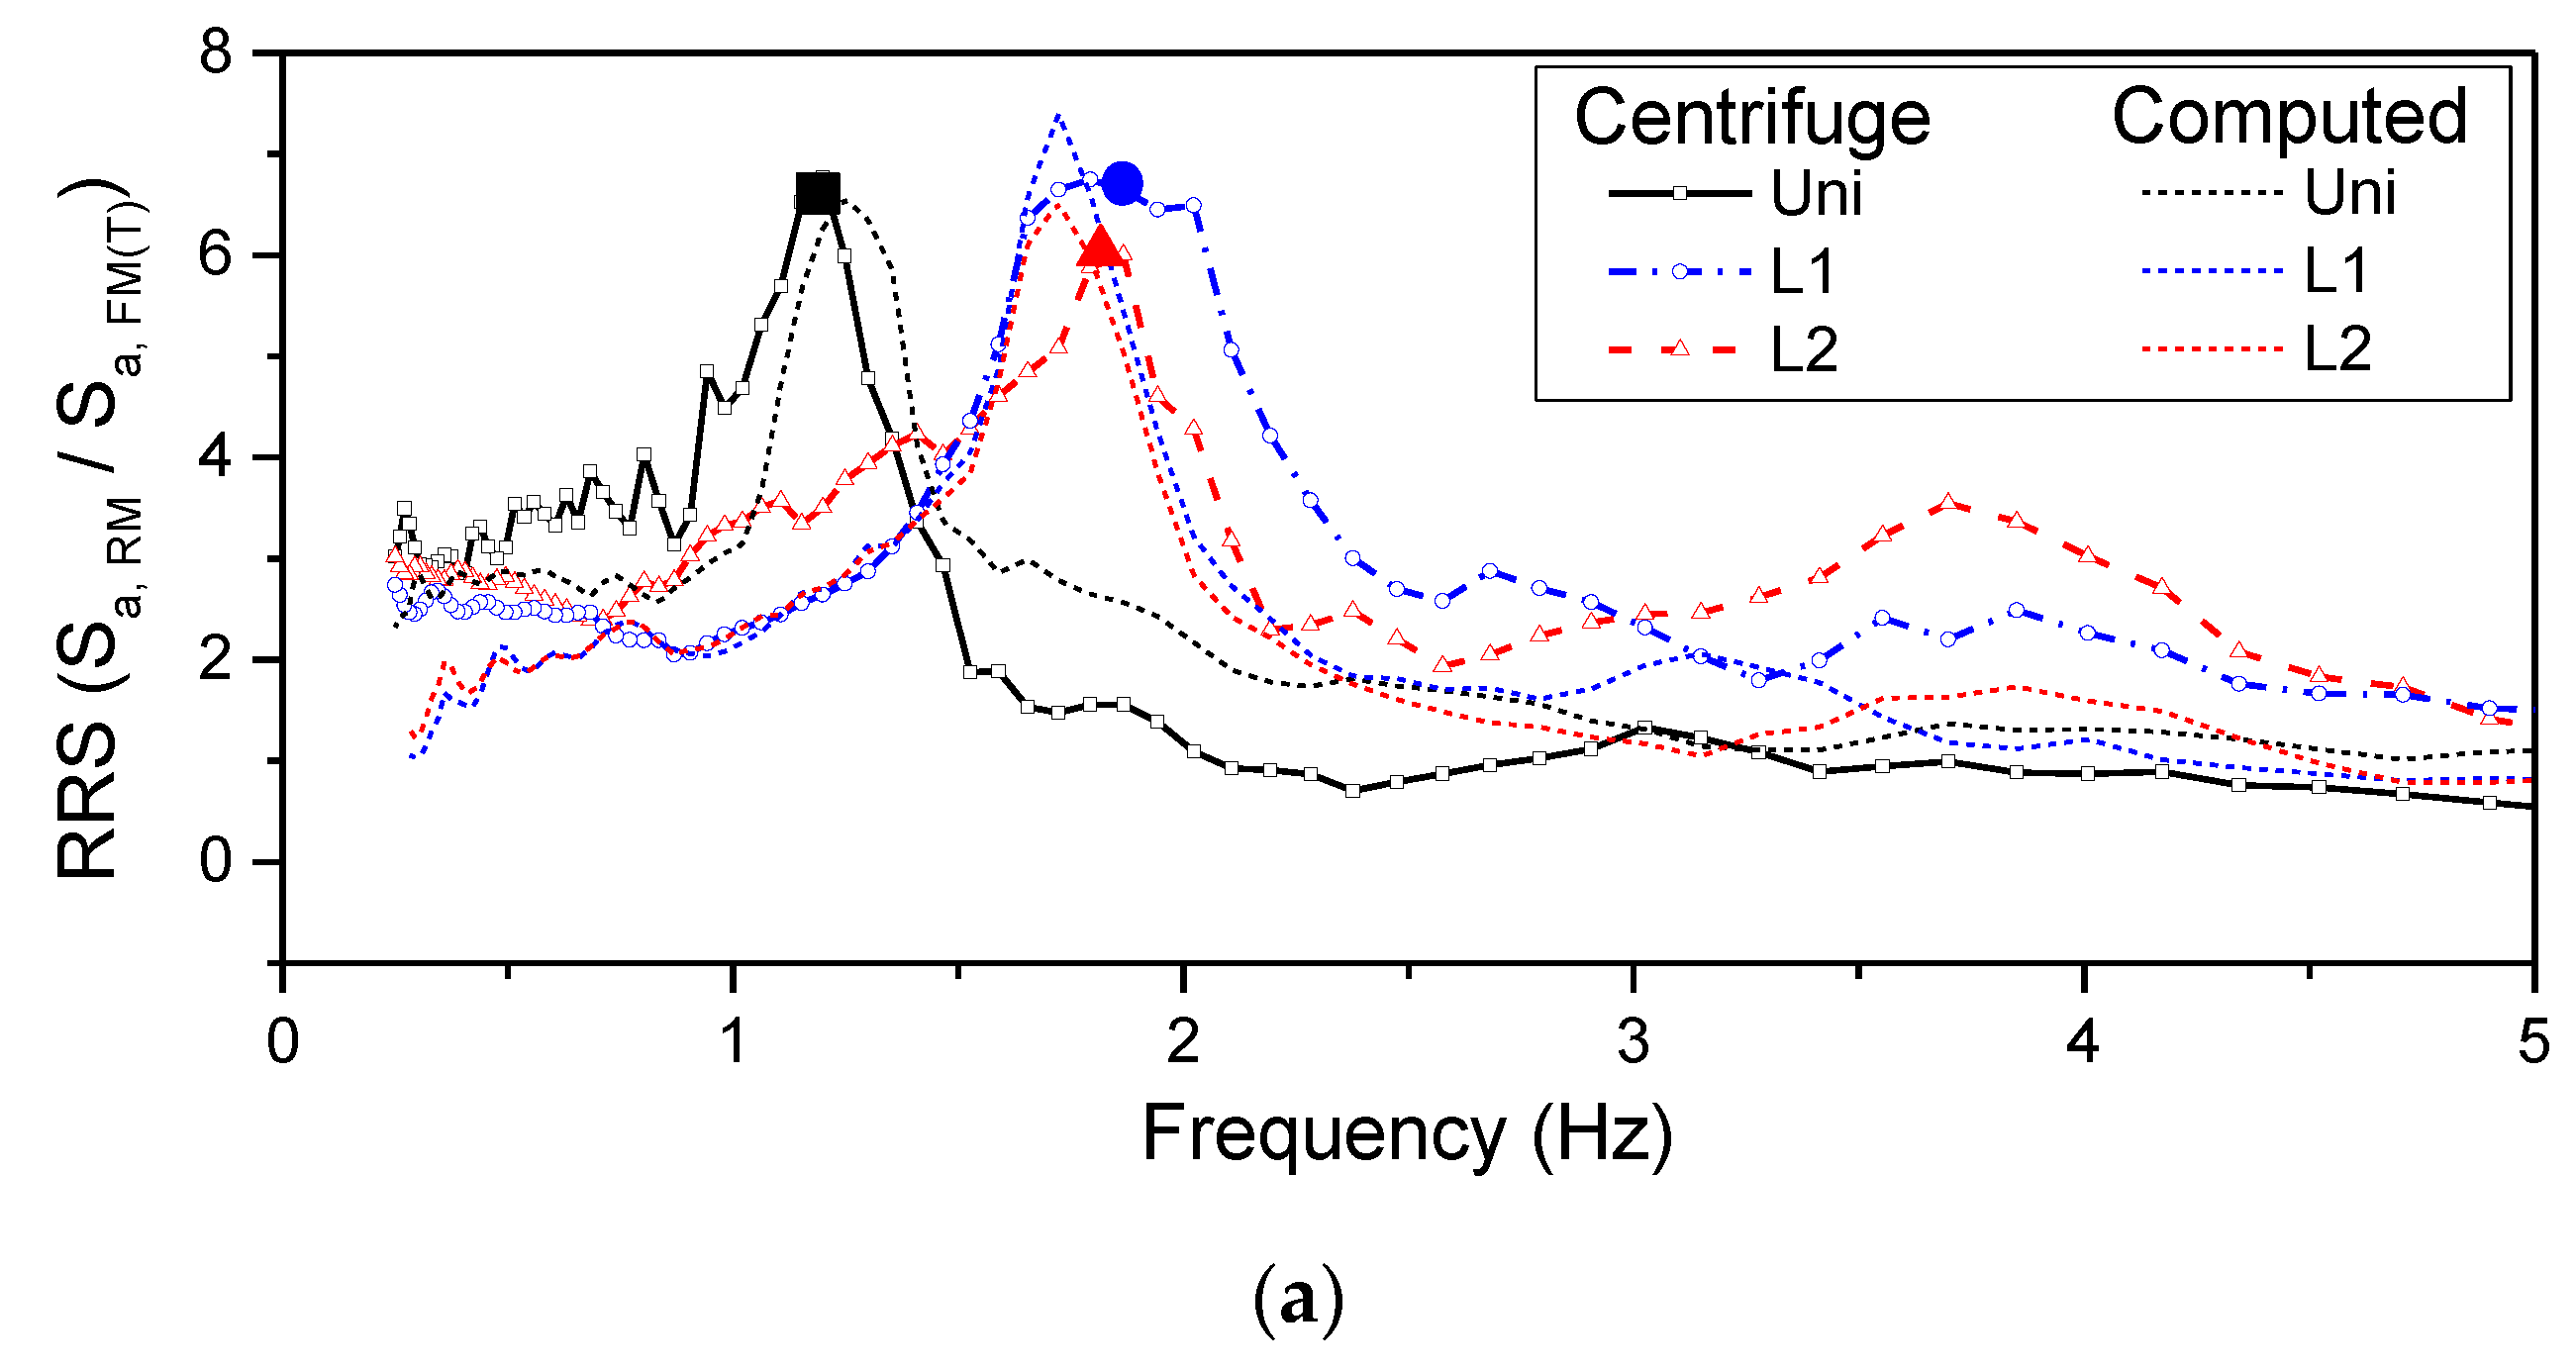
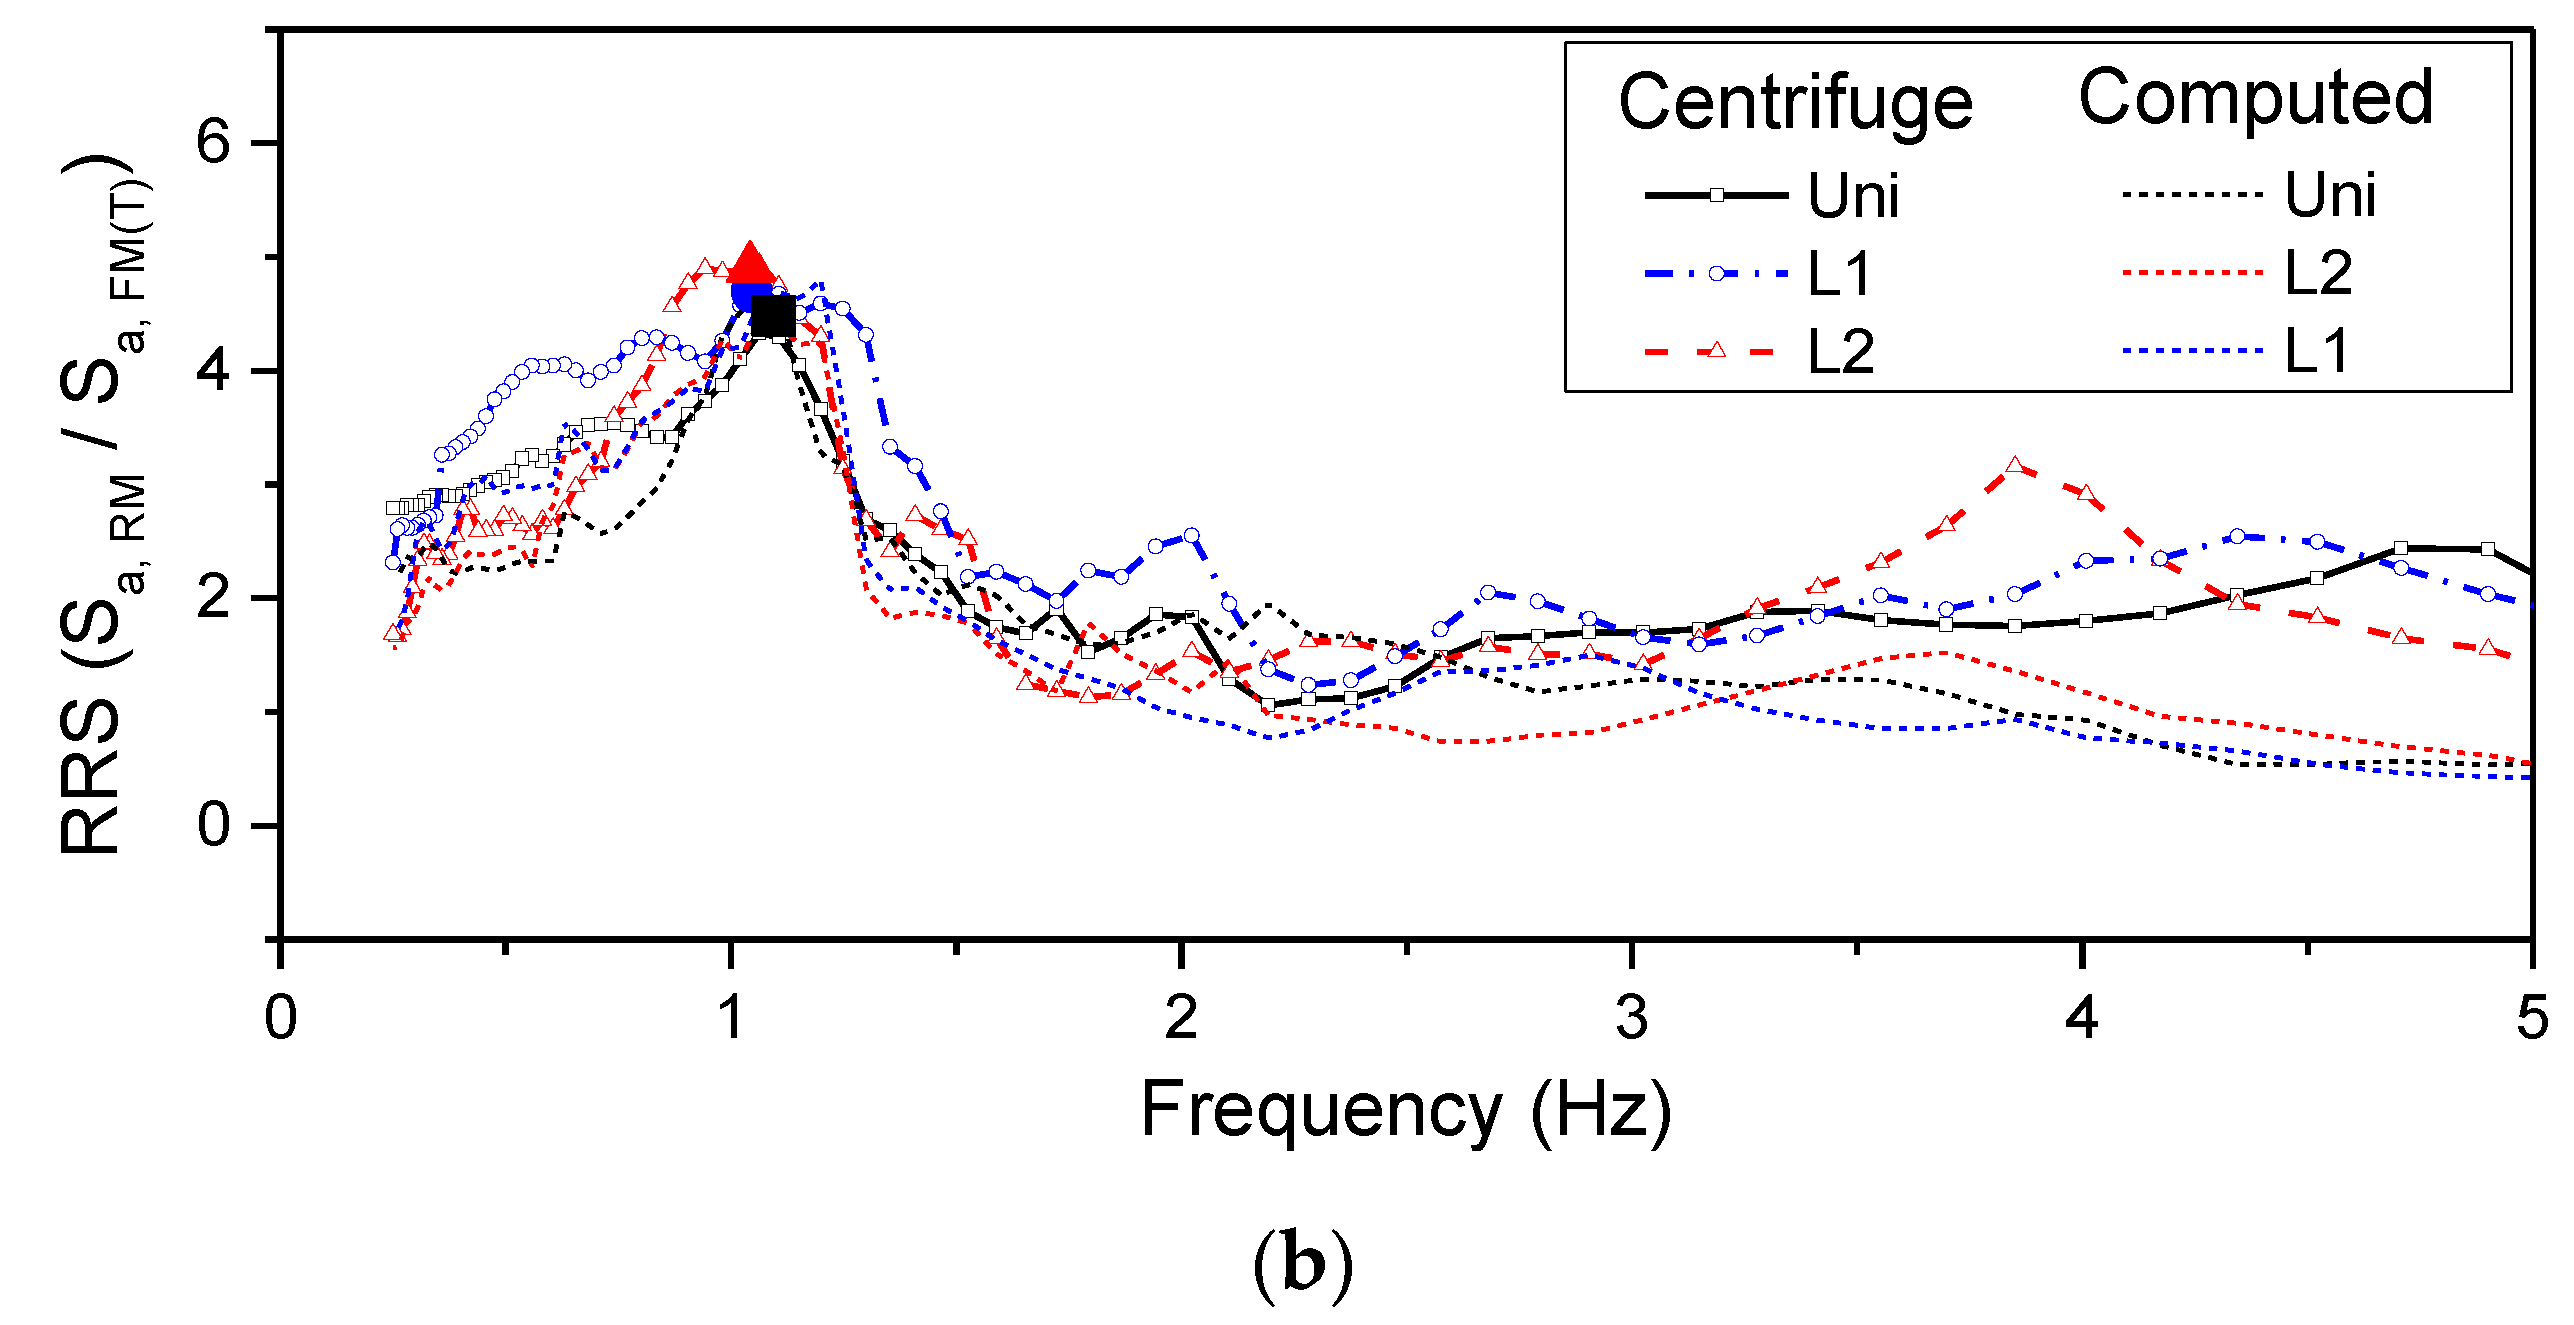
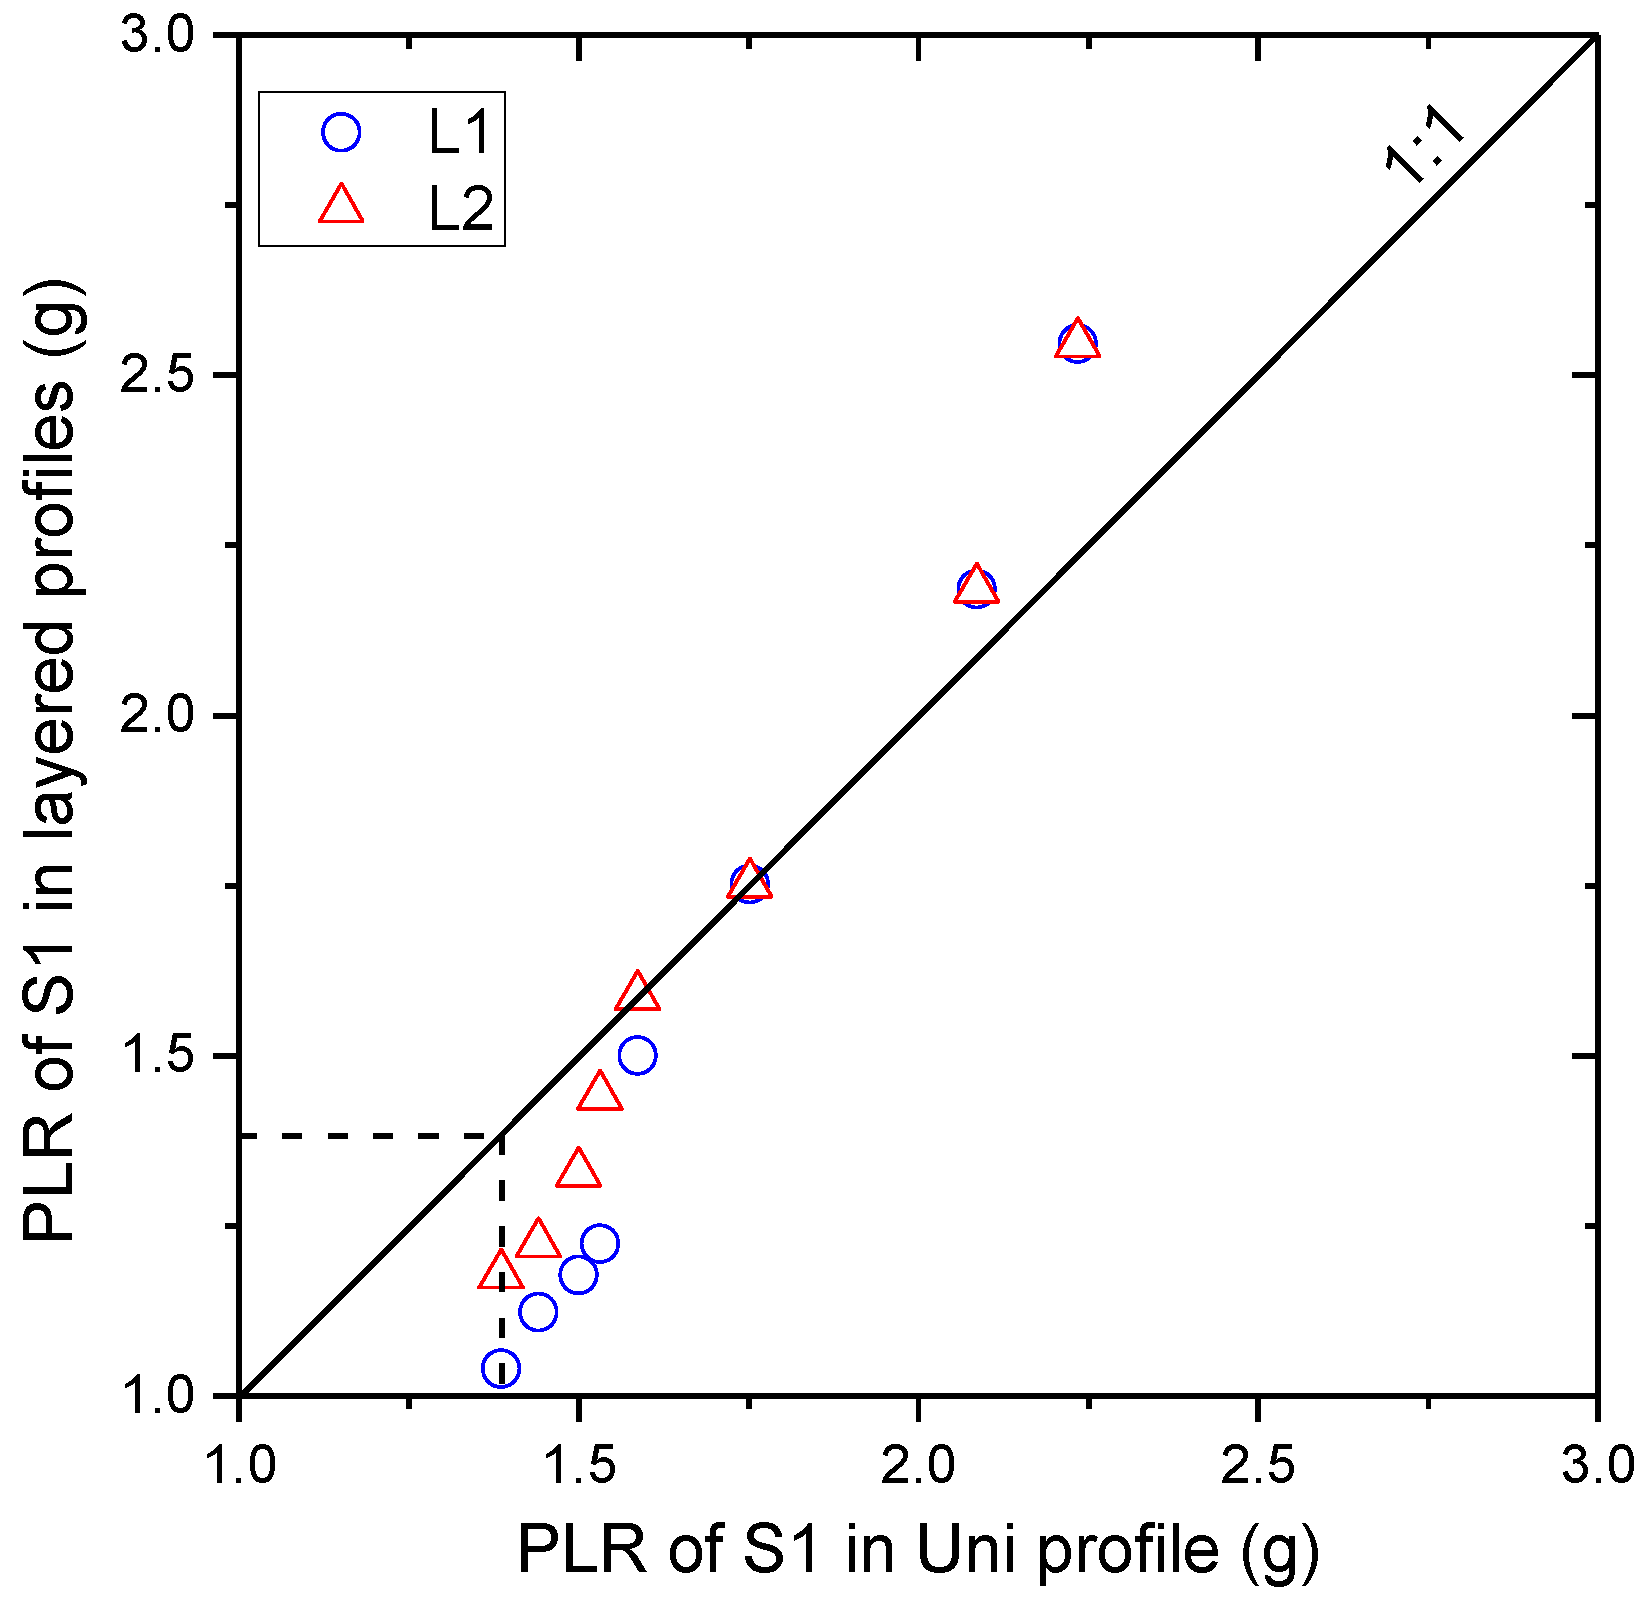
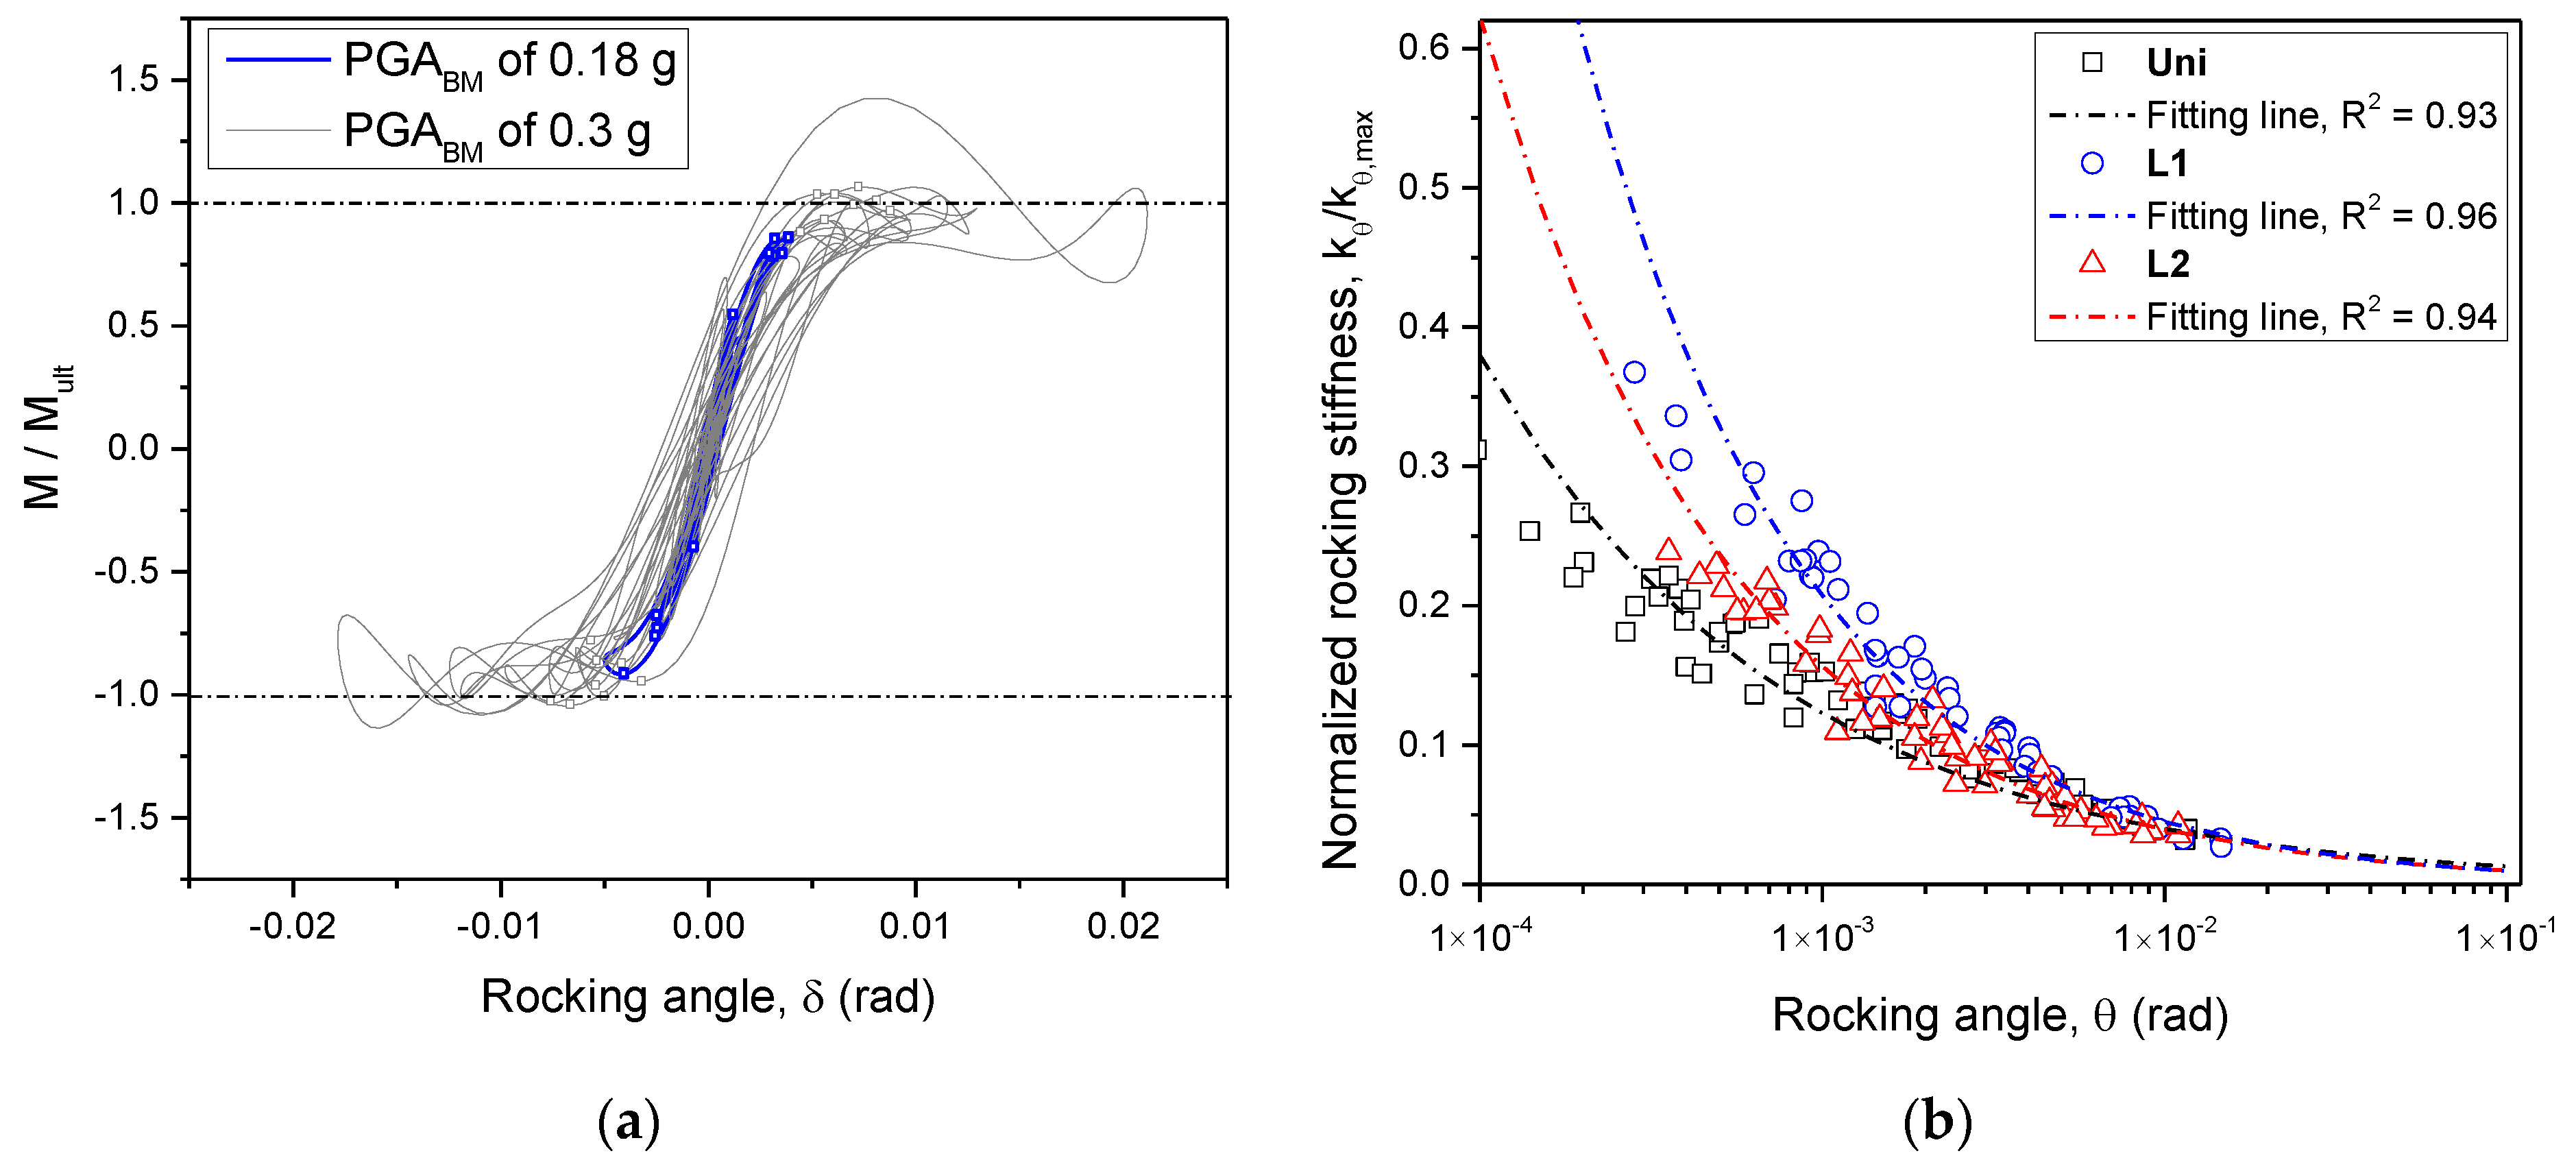
4.2. Inertial Interaction, Flexible-Base Frequency, and Rocking Effects

Figure 6 shows the spectral acceleration of ratio roof motion (RM) to translational foundation motion (FMT) for the S1 structure, referred to as RM/FMT, at the PGABM of 0.1 g and 0.22 g. Results from numerical simulation showed a good agreement with the centrifuge experiments. The frequency at the peak of the RM/ FMT ratio indicated the flexible-base frequency (fflex) of the soil–foundation–structure (SFS) system [2,33]. fflex could be related to the foundation’s sliding and rocking stiffness (i.e., ks and kθ) and unchanged structure properties, such as fixed-base frequency (fn), height (h) and stiffness (k), as follows [1]:
f f l e x = f n 1 + k k s + k h 2 k θ
A reduction in fflex implies that ks and kθ of the SFS system reduced during the seismic load. At a relatively low input motion with a PGABM of 0.1 g, fflex of the S1 structure located on the Uni profile was 1.4 Hz, which was smaller than the fixed-base frequency (fn of 2.19 Hz) because of period lengthening effects. Moreover, fflex significantly increased in the layered profiles: It was 1.4 Hz for Uni profile and about 1.9 Hz for L1 and L2 soil profiles. A similar trend was observed in numerical analyses. At low input intensity (Figure 6a), the increase in global stiffness of the soil in the layered profiles compared to the Uni soil contributed to this increment in translation and rocking stiffness of the foundation, and as a result, the fflex of the S1 structure increased. However, at higher earthquake intensity (Figure 6b), the S1 structure experienced similar fflex in all soil profiles because of the reduction in the stiffness of soil beneath the structure in layered cases. The stiffness of soil in the thin layer underneath the structure decreased, which resulted in the fflex of the structure above the layered ground decreasing until it reached that of uniform soil. The variations in period lengthening ratio (PLR = fn/fflex), are plotted in Figure 7. The dashed line indicates a PLR value of 1.31 for the S1 structure, which was calculated based on the equation suggested by Stewart, Fenves Gregory [1]. In general, the value of fflex for the S1 structure on the three soil profiles increased with an increase in PGABM. The PLR values for layered profiles during low-intensity earthquakes were significantly higher than those for the Uni profile because of the increase in soil stiffness. However, with increasing earthquake intensity, the stiffness of the soil beneath the structure in layered profiles decreased sharply due to stress concentration, and the response of the structures. This caused PLR for the S1 structure on the layered profiles to become similar to that for the Uni profile. At the highest input excitation with a PGABM of 0.3 g, the PLR of the S1 structure on the Uni profile was slightly higher than for the layered profiles because of the reduction in stiffness of SFS system in layered profiles at high earthquake intensity.
Recently, rocking behavior and its effects on SFSI have been defined and recognized [34,35,36,37,38]. During a strong earthquake, the overturning moment (M) at the foundation level, which is generated by the inertial response of the above structure, is restricted by the ultimate moment capacity of the foundation, and, therefore, the seismic response is limited. In this study, the overturning moment at the surface of the foundation and the rocking angle of the structure in the time domain were identified based on measured values from two vertical accelerations attached to the foundation and three pairs of strain gauges attached to the structure’s walls [23,24]. The rocking stiffness (kθ) can be estimated from the hysteretic backbone curve of the overturning moment and rocking angle. An example is illustrated in Figure 8a for the S1 structure at a PGABM of 0.1 g and 0.3 g. The overturning moment was normalized to the ultimate moment capacity (Mult = Wp∙L(1 − 1/FSv)/2), which is defined based on structure weight (Wp), foundation length (L), and soil strength through the vertical safety factor (FSv) [24,39,40]. The estimated overturning moment increased with an increase in rocking angle; however, it was limited by the Mult of the SFS system that reduced the structure response during high-intensity earthquakes [38]. The rocking stiffness (kθ) was calculated from these backbone curves and then normalized to the maximum rocking stiffness (kθ,Max), as shown in Figure 8b [24,39]. The kθ,Max can be calculated from the initial shear modulus of soil beneath structure (Gmax), moment of inertia at the centroid of the foundation in the direction of rocking (I), and foundation dimensions (i.e., length of L and width of B) as [41]:
k θ , M a x = G m a x 1 ϑ I 0.75 ( L B ) 0.25 [ 2.4 + 0.5 B L ]   ( KN · m )
The rocking stiffness values were obtained in the earthquake with a PGABM above 0.1 g since the rocking behavior dominated during strong motion. The lines in Figure 8b indicate the power fitting functions for normalized rocking stiffness (kθ/kθ,Max) with the rocking angle at a high regression number (i.e., values of R2 were above 0.93). Due to the reduction in the contact area between the soil and foundation surface, the rocking stiffness significantly decreased with increasing rocking angle [36]. At low earthquake intensity with small values of rocking angle, the rocking stiffness for the S1 structure on the layered profiles was higher than those obtained with the Uni profile because of the higher stiffness of the lower layer and the ultimate moment capacity that implied an increase in ultimate bearing capacity of the foundation when it was located on layered ground [41,42]. Moreover, as the thickness of the soft upper layer decreased to approximately 0.5 B, the rocking stiffness sharply increased. At high rocking angles, the rocking stiffness of the S1 structure on the three soil profiles converged. This can be partially attributed to the reduction in soil stiffness observed in Figure 6 with period lengthening effects. The rocking stiffness for the structure located on the Uni profile was slightly higher than for those on layered profiles at a rocking angle above 0.008 rad. This can be attributed to the large decrease in the soil’s stiffness underneath the structure, as indicated in Figure 5b and Figure 7.

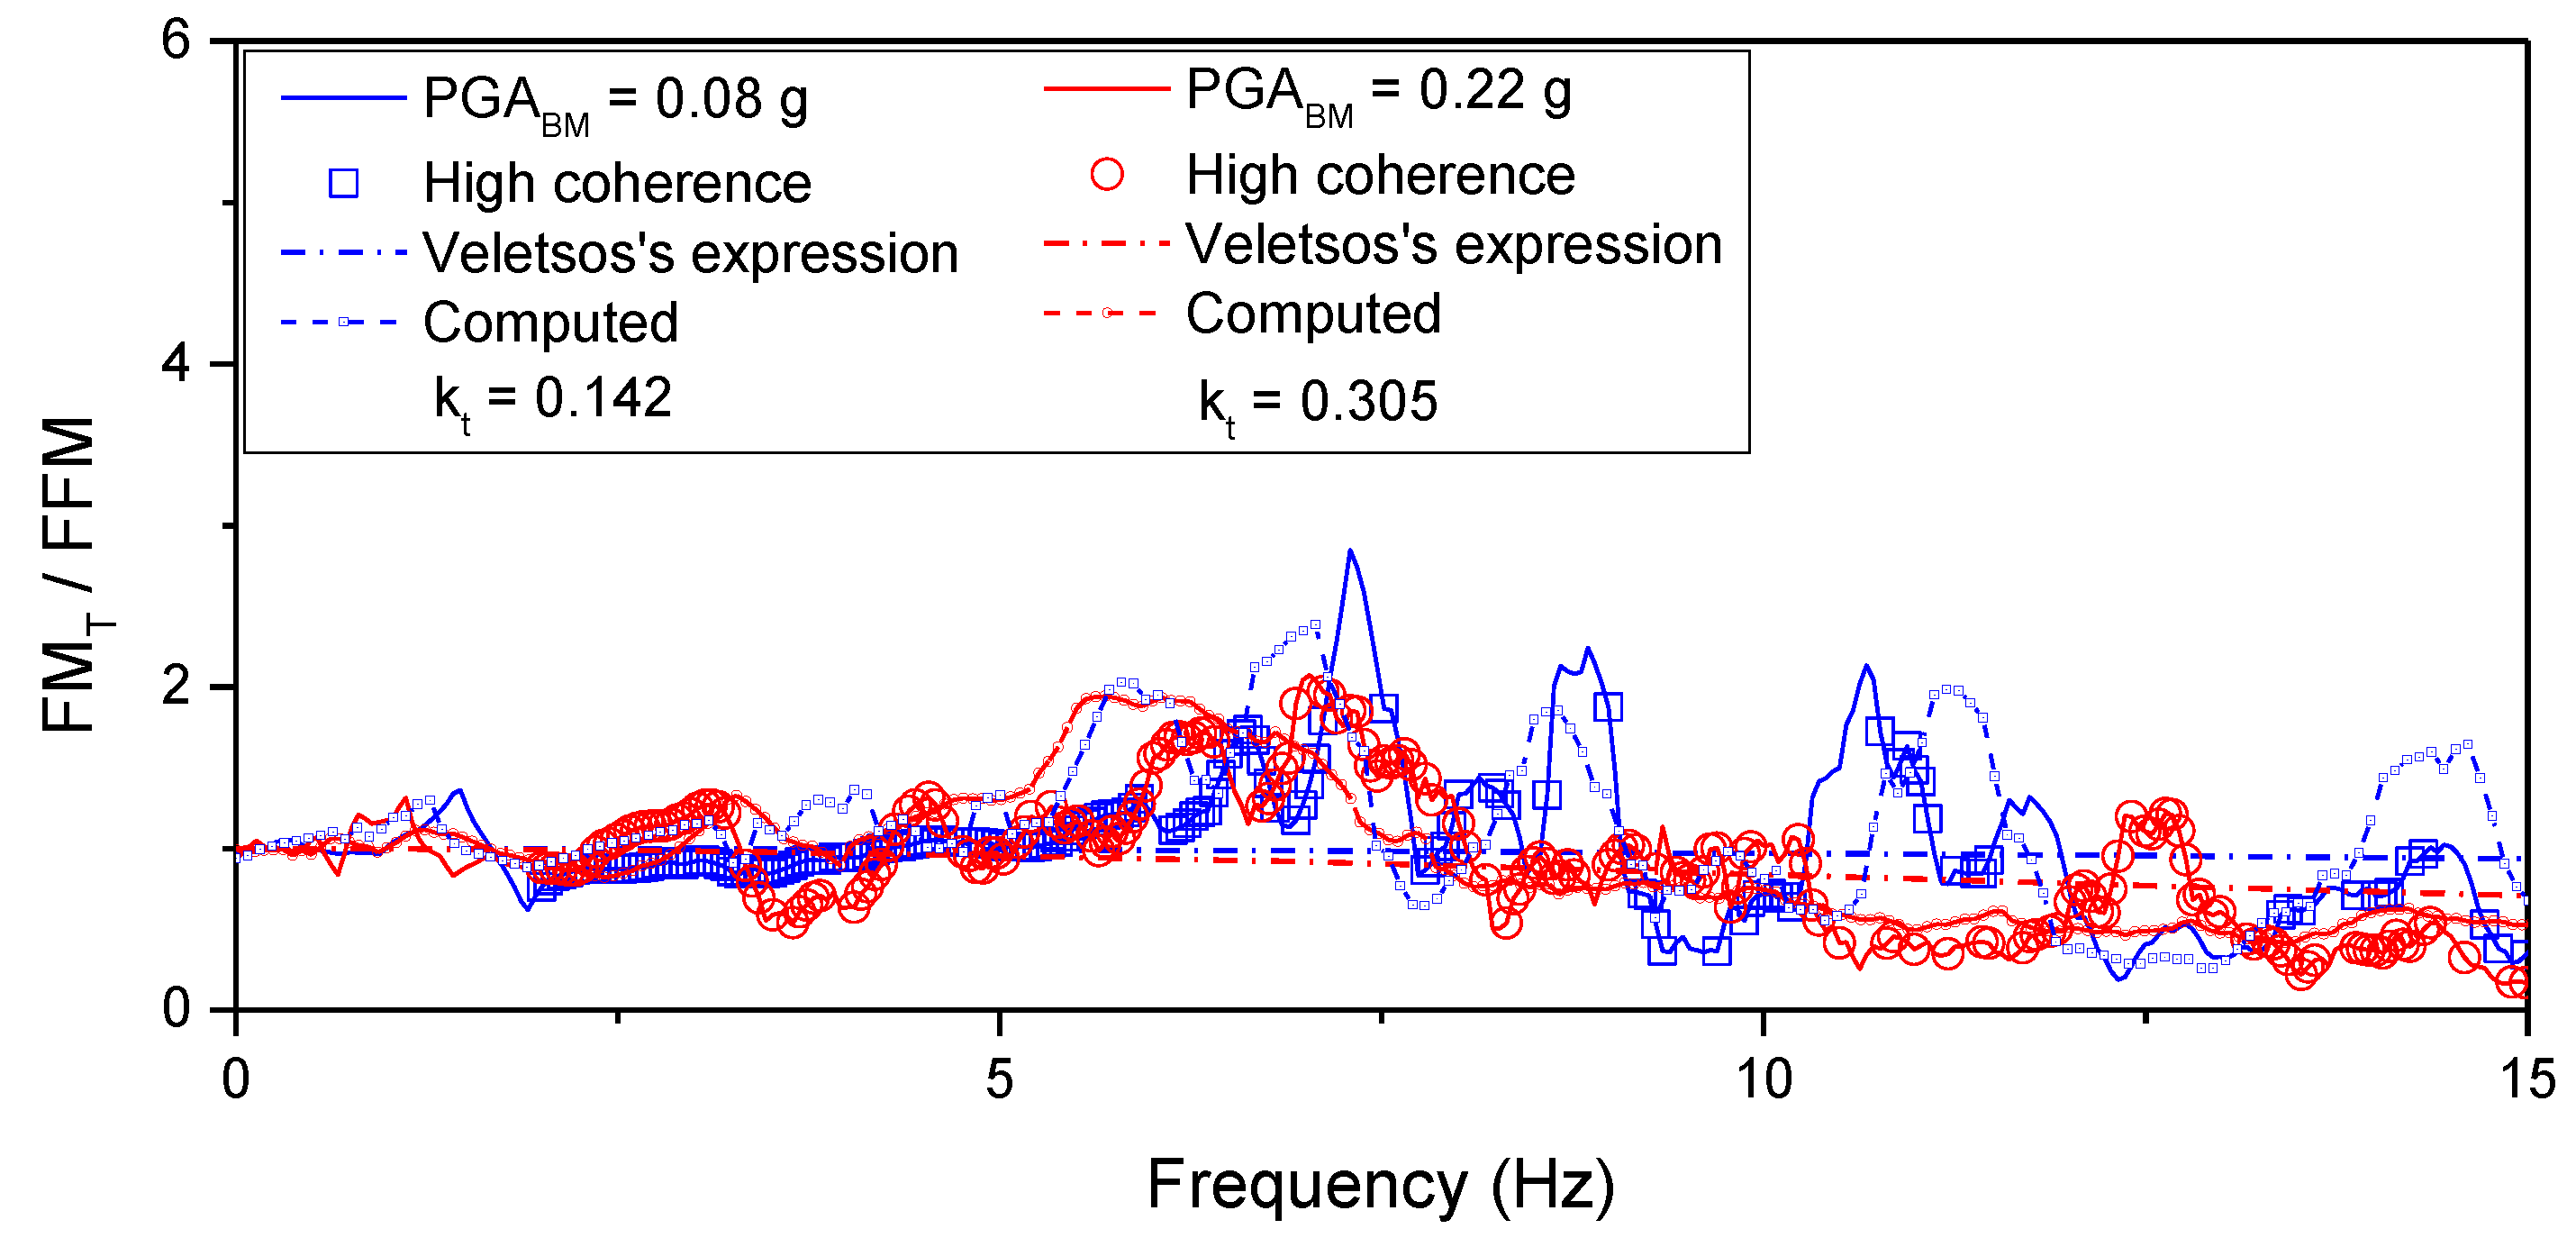
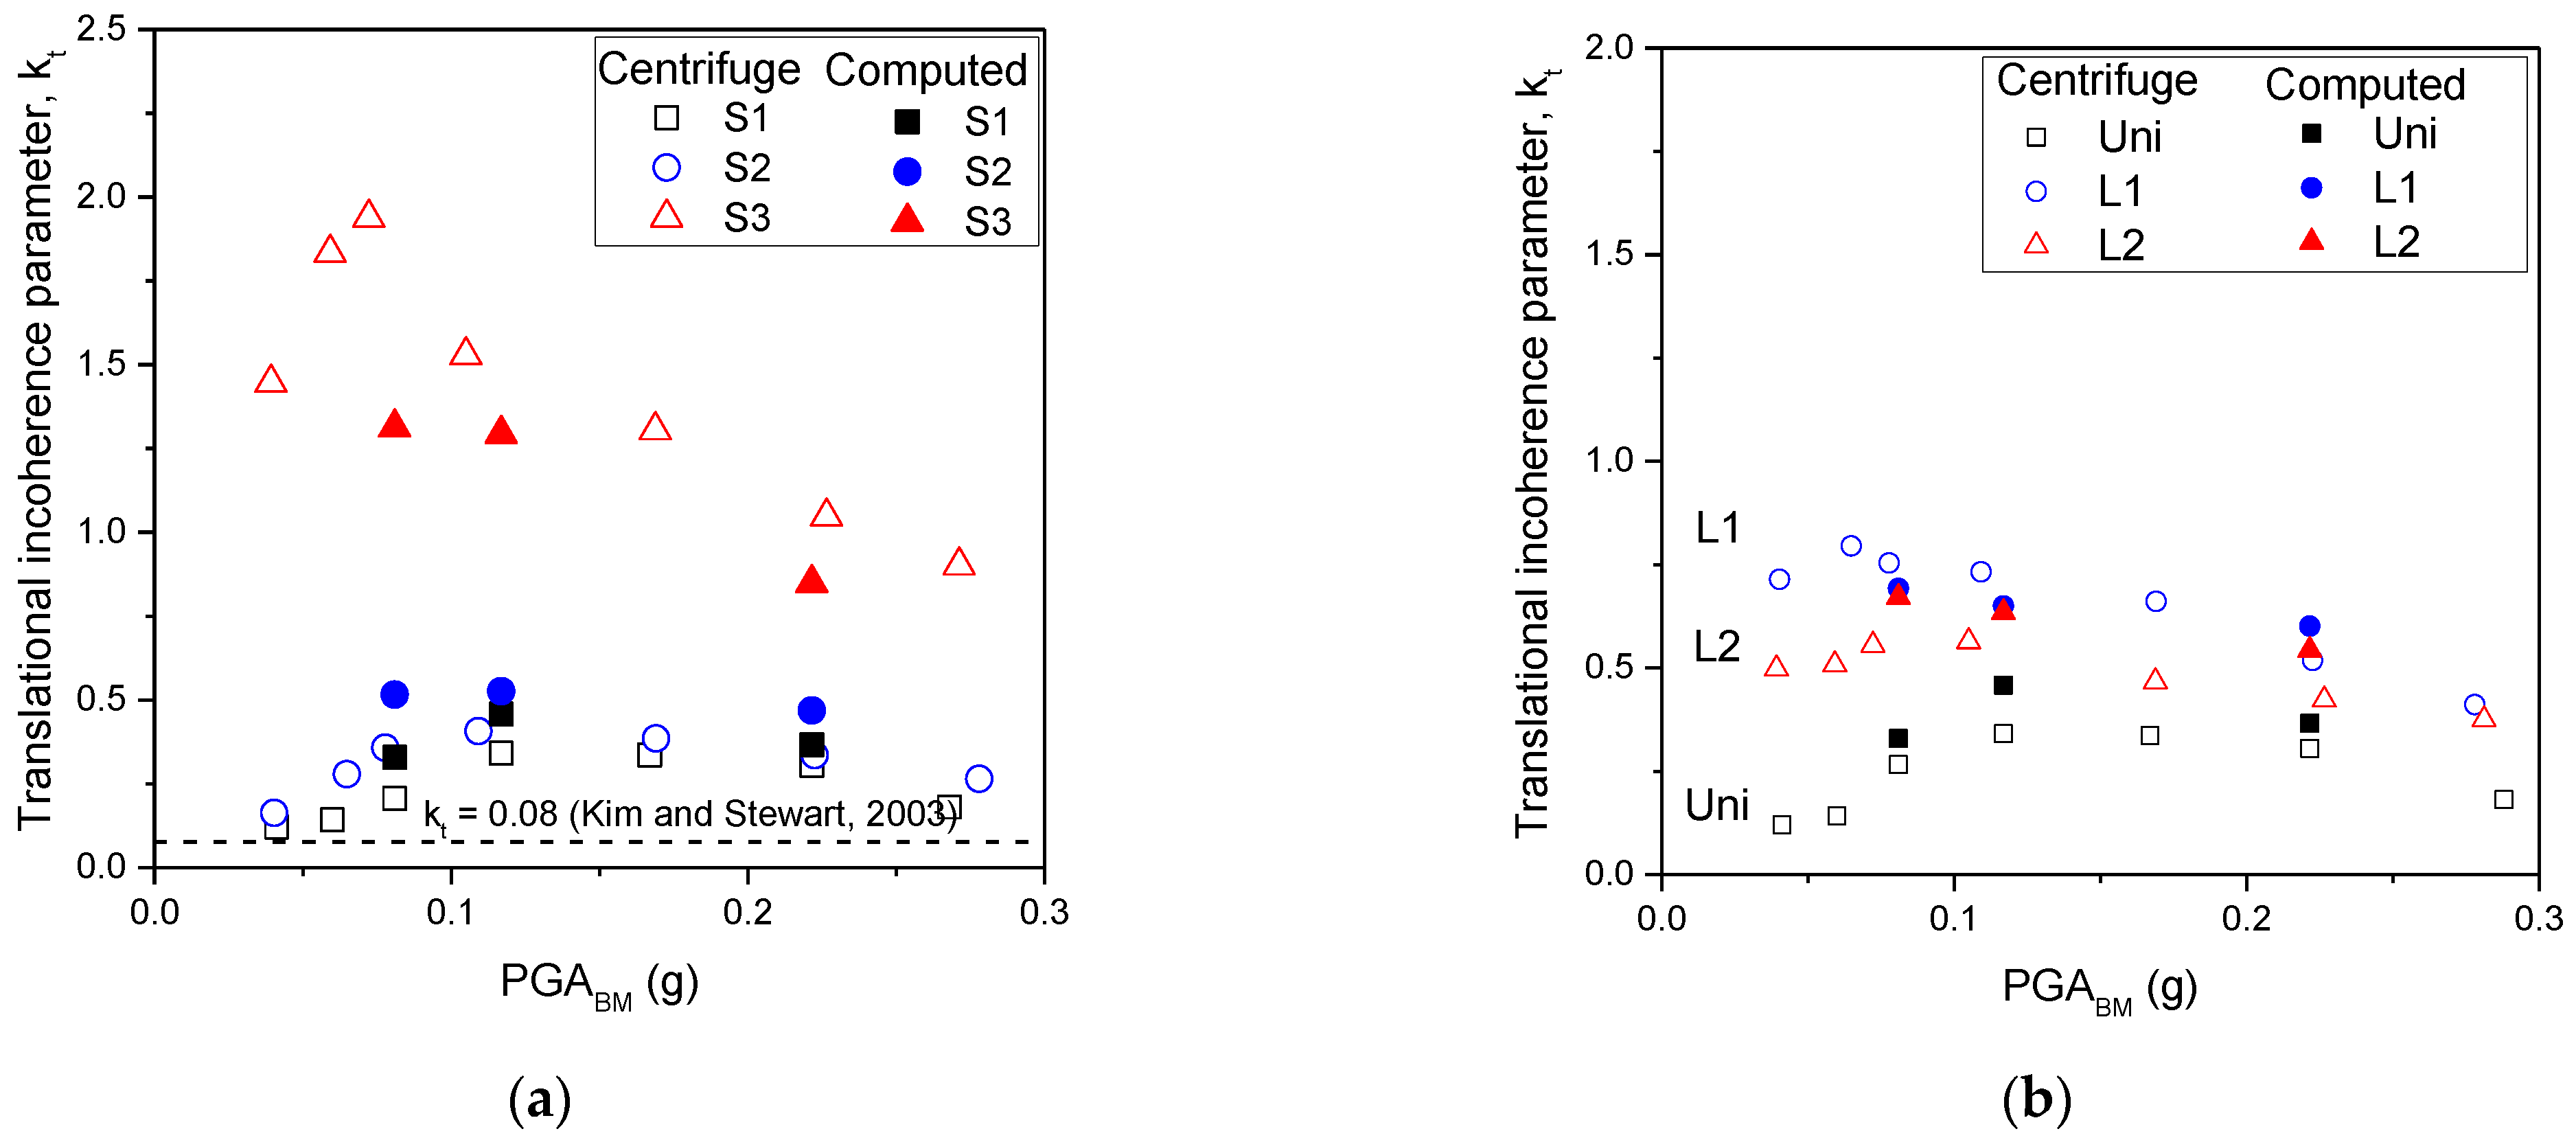
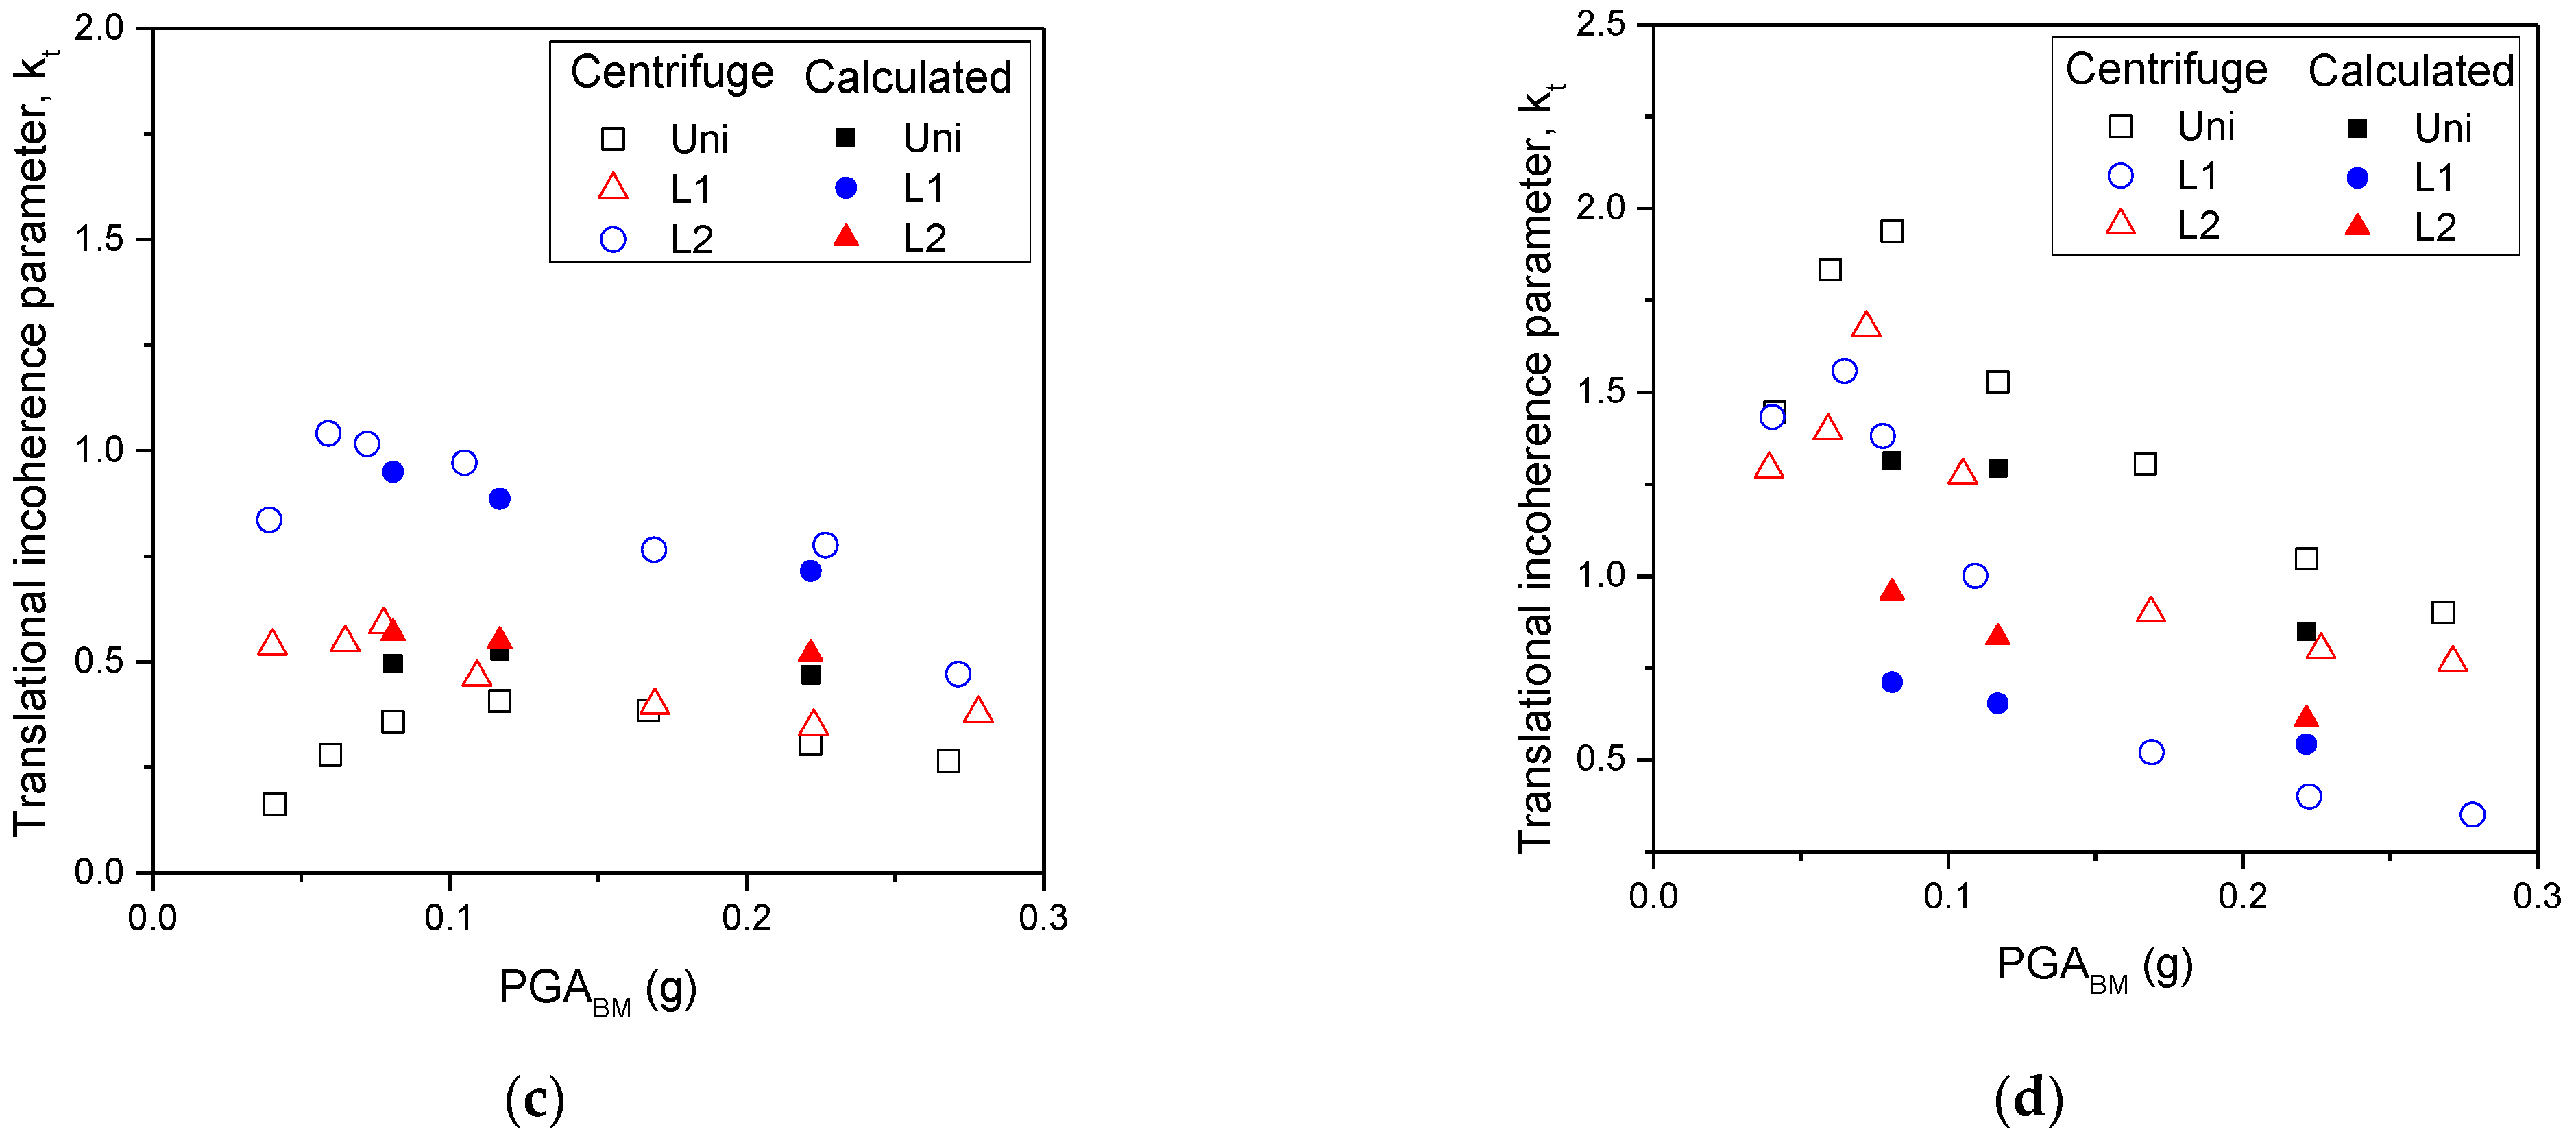
4.3. Kinematic Interaction and Incoherence Parameter

The kinematic interaction between the soil and foundation is generally represented by a transfer function, which is the ratio of the Fourier transform between foundation input motion (FIM) and FFM. To measure kinematic interaction and FIM at the foundation level without the effects of inertial interaction is a practically impossible requirement because both foundation and structure are massless. However, the effects of inertial interaction on foundation level motion could be reduced by evaluating transfer function at a frequency above the flexible-base frequency [5,8]. In this study, the translational foundation motion (FMT) was used instead of FIM in estimating kinematic interaction to indicate results estimated from the centrifuge experiment clearly.
To reduce unrealistic spikes at frequencies (f) for which the Fourier transform of FFM was close to zero, the smoothed power spectral density function of FFM (Sxx(f)) and the cross-power spectral density function of FFM and FMT (Sxy(f)) were used to estimate the transfer functions, as follows [8]:
H ( f ) =   | S x y ( f ) S x x ( f ) |
To assess the noise level and nonlinearities of the transfer function between FFM and FMT, the cohesion function can be estimated as follows:
γ 2 ( f ) = | S x y ( f ) | 2 S x x ( f ) S y y ( f )
where Syy(f) is a smoothed power spectral density function of FMT. The value of γ2 varies from zero to one, and the frequencies at which the value of γ2 is above 0.8 indicates that noise between the two motions is minor [8]. The translational transfer functions and its incoherence parameter (i.e., kt), which were used to define transfer functions based on Veletsos’s expression [6], were determined following the steps proposed by Kim and Stewart [8] and Borghei and Ghayoomi [5] at the frequencies with coherence values above 0.8. Note that these parameters indicate stochastic incoherence between FMT and FFM caused by the averaging of incident waves across the foundation region. Figure 9 shows the translational transfer function for the horizontal motion of the S1 foundation at PGABM of 0.08 g and 0.22 g with the corresponding, respective, estimated values of kt at 0.142 and 0.305. The measured data surrounding the flexible frequency range (from 0.9 to 2.1 Hz, as shown in Figure 7) was excluded when estimating the kt parameter to reduce the effects of structural inertia on foundation motions. The translation transfer function was lower than unity at high frequency, which indicates the base-slab averaging effect of SFSI [8]. The translational transfer function was estimated from the results of numerical simulation for the S1 structure at PGABM of 0.08 g and 0.22 g with a kt parameter of 0.229 and 0.366, respectively, as shown in Figure 9. The base-slab averaging effect with a decrement of the transfer function at high frequency was obtained following centrifuge experiment results.
Values for the kt parameter were estimated for S1, S2, and S3 structures located on the Uni ground and plotted against increases in input intensity in Figure 10a. The dashed line at the kt value of 0.08 represents the value predicted for shallow foundations by Kim and Stewart [8] at a shear wave velocity of about 95 m/s. The measured value of kt, measured at low input intensity, was slightly higher than the predicted value for two reasons in this study: (a) the foundation was just placed on the ground surface, and (b) the foundation’s width was relatively small. At low input intensity, kt estimates for all three structures increased with PGABM due to the loose contact between the soil and foundation and due to the increase in the wave’s inclination because of reflected waves in the ESB. kt decreased with a further increase in PGABM because of a decrease in soil stiffness at a higher earthquake intensity [5,8]. Regardless of the input intensity, the kt parameter for the S3 structure was larger than those for S2 and S1, which indicates that the kt is higher for structures with smaller foundation size [8]. A similar trend was also found in numerical simulation results, as shown in Figure 10a.
Figure 10b shows the variation of kt against peak acceleration of the base motion (PGABM) for S1 structure on the three soil profiles. Similar to the results obtained for the Uni profile shown in Figure 10a, the kt parameter in layered profiles initially increased with an increase in PGABM before decreasing due to the reduction in the soil’s stiffness beneath the structure. For horizontal response, the higher kt value indicates a more regressive decrease in transmissibility between FFM and FMT. Moreover, the values of kt for the layered profiles were always higher than those obtained for the Uni profile; this indicates the effects of the soft upper layer on increasing kinematic interaction in SFSI because when propagating in the layer profiles, the seismic wave inclined more and caused the kt parameter to increase. This effect was not accounted for in previous studies and design codes [43,44]. As the thickness of the soft upper layer decreased from 5.2 m to 2.6 m, the values of kt further increased, pointing to the existence of a highly inclined seismic wave when the foundation is located near the interface between soil layers.

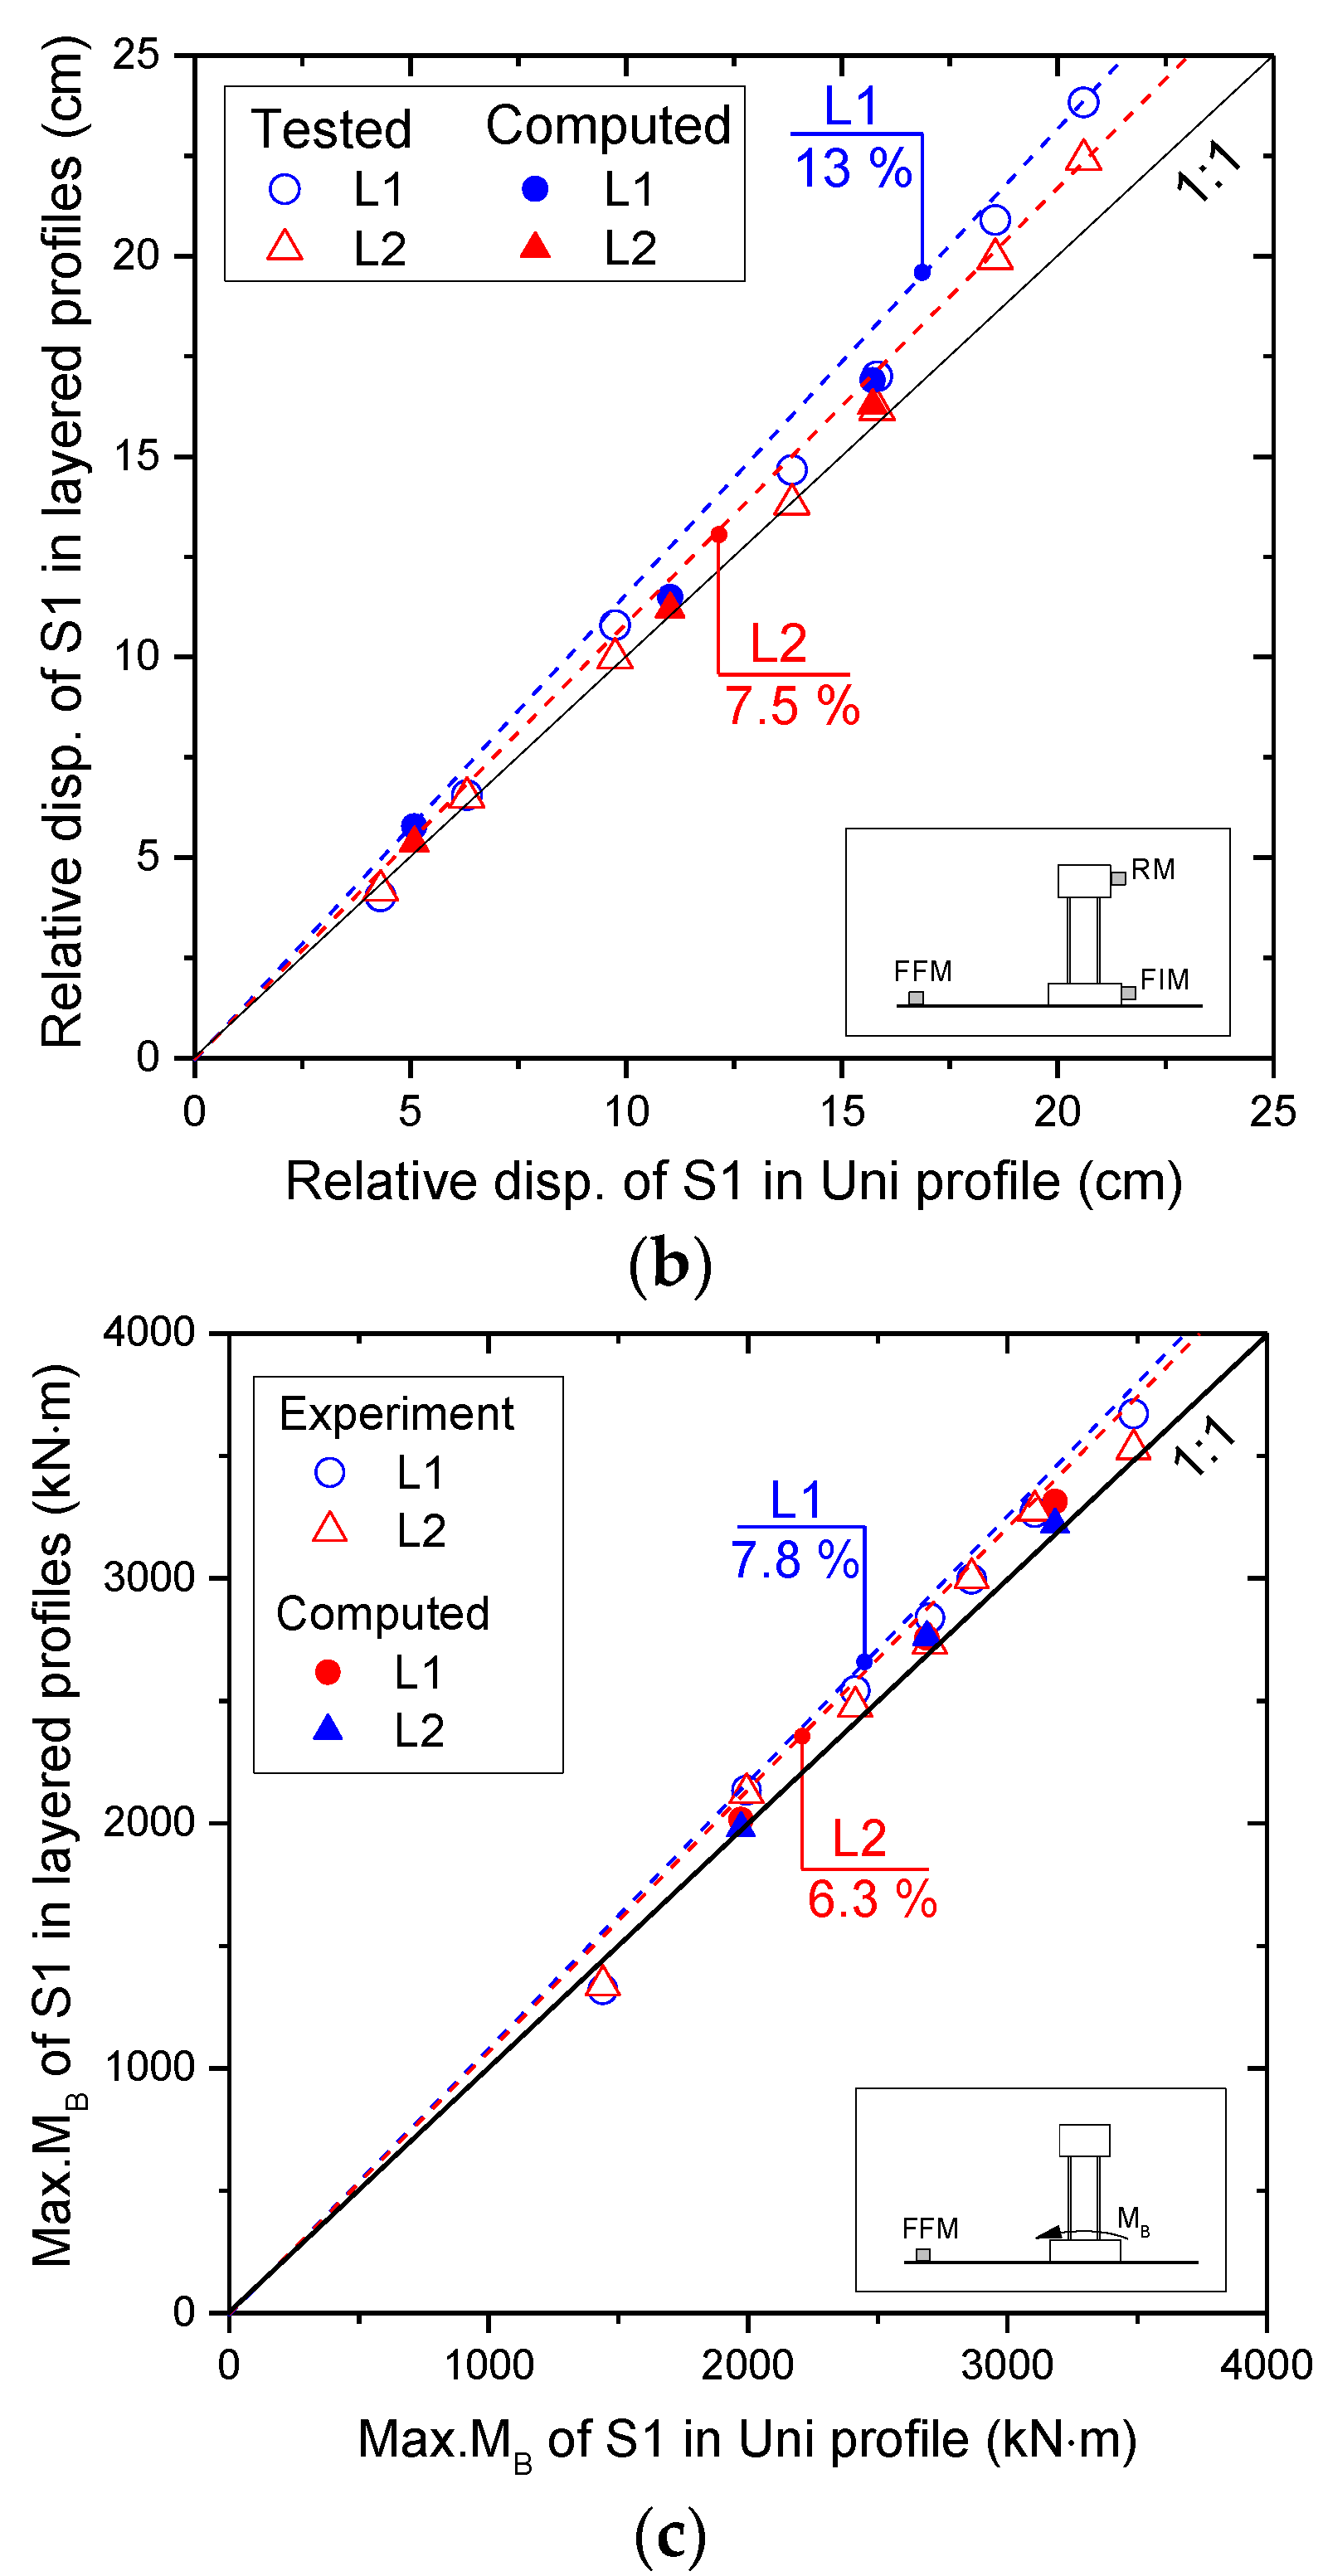
4.4. Structure Responses

Figure 11a compares the peak acceleration for the roof motion (PGARM) of the S1 structure on layered profiles (i.e., L1 and L2) with that on the Uni profile. For tests with low input earthquakes, the PGARM values for the S1 structure on the layered profiles were similar to those on uniform ground even though the FFM in the layered grounds were slightly lower. As input intensity increased, the PGARM in the layered grounds were observed to drastically increase, up to 20% and 15% for the L1 and L2 profiles at the highest PGABM, respectively, making it higher than for uniform ground. The reduction in stiffness of the soft upper layer as well as in foundation rocking stiffness could contribute to these changes [17]. The structure response for the L1 profile, with a thinner, soft upper layer, increased more than for the L2 profile. At high input intensity, since there was a drastic reduction in soil stiffness for the soft, upper layer, as indicated in Figure 5b and Figure 8b, it was observed a significant increase in structure response, especially in the profile with a thin layer near the foundation. The absolute displacement of the roof of the S1 structure was estimated by double integration of the recorded RM. By subtracting this absolute displacement from the horizontal displacement of the free-field motion, the relative lateral displacement of the structure was calculated.
Figure 11b compares the maximum of relative lateral movement of the S1 structure observed on the layered grounds with that for the uniform ground at various levels of input excitation. Compared to the results observed on the homogeneous ground (Uni profile), the structure was displaced more on the layered grounds, especially at high input intensity, which shows a similar trend to what is seen with PGARM in Figure 11a and PGAA5 in Figure 5b. In addition, the structure slid more after a decrease in the thickness of the soft, upper layer. This is because the increase in the response of the soil beneath the structure caused a greater reduction in its stiffness and, as a result, the relative displacement and peak acceleration of the structure further increased. The bending moments, in time series, for three positions on the wall of the S1 structure were measured using three pairs of strain gauges (Figure 1). The maximum bending moment at the bottom (Max.MB) for the layered profiles was found and compared with those for the Uni profile in Figure 11c. The demand bending moment of the structure on the layered profiles increased. This can be attributed to the higher peak acceleration and relative displacement observed in the structure in Figure 11a,b, respectively. As the thickness of the soft upper layer decreased, the bending moments of the S1 structure increased.

4.5. Effects of Stratification on SFSI with Various Structures

Figure 12 compares the roof motion’s peak acceleration for S1, S2, and S3 (PGARM) obtained on layered profiles to those on uniform ground for different levels of input earthquake. The layered ground leads to an increased PGARM for the S2 structure, which followed a similar trend to the S1 structure. Furthermore, the increment for the L1 profile was more significant than for the L2 profile, where the greatest changes were about 22.6% and 17.4%, respectively. However, the layered ground led to a decrease in response for the S3 structure where the values of PGARM on the layered profiles were smaller than those on uniform ground because (1) the S3 structure had a high fixed-base frequency of 7.05 Hz compared to site-fundamental frequency (fG of approximately 2 Hz); and (2) the width of the S3 foundation (BS3 = 1.2 m) was much smaller than the thickness of the soft, upper layer and. Therefore, the effect of the layered ground was reduced [15,16]. The trend of a slight reduction in response for the S3 structure continued for PGAFFM, shown in Figure 5a, revealing that any amplification by the soft upper layer had been eliminated.
A similar procedure to define the transfer function and incoherence parameters for the S2 and S3 structures on all three soil profiles was carried out. Figure 10c,d shows the variation of the kt parameter for the S2 and S3 structures on all three soil profiles with increasing PGABM. For the S2 structure, the kt parameter increased on layered profiles, which was similar to the S1 structure, as shown in Figure 10b, because of the variation in the wave path. However, the kt parameter observed for the S3 structure on layered profiles was smaller than on Uni profiles. This inverse trend could be attributed to a reduction in soil amplification in layered profiles that cause a decrease in wave reflection, while the effects of variation of wave path in layered profiles, which was observed in the S1 and S2 structures, reduced with the width of the foundation. The numerical simulation results indicate a similar trend with increment in kt of the S2 structure and reduction in the S3 structure in the layered profile compared to those in uniform ground.

5. Conclusions

In this study, the problem of soil–foundation–structure interaction on layered ground was investigated by performing centrifuge tests. Low stiffness soil was represented by silica sand, while high stiffness soil was simulated using a mixture of weathered soil and small pebbles. Three structural models with different fixed-base frequencies were used in the tests, while various levels of input earthquake were applied. The major observations are as follows:
  • Soil response was amplified less at higher input intensity because the soil’s damping significantly increased with increasing strain level. As the thickness of the soft, upper layer (T) decreased, PGAFFM reduced due to the reduced amplification from the layered profiles. For layered ground, the motion of the soil beneath the structure was highly amplified both horizontally and vertically due to feedback from the structure, reflected waves from the interface, and the reduction in stiffness of soil in the soft, upper layer. The motion of the soil beneath the structure became more amplified when T decreased, which indicates that the layered effects had become more significant.
  • For earthquakes with low intensity, the flexible-base frequency (fflex) of the structure increased for layered soil profiles, while the period lengthening ratio (PLR) decreased. The increase in rocking stiffness was also observed for the S1 structure. However, at higher input intensity, fflex of the S1 structure on layered soils sharply decreased to that observed on uniform soil due to a reduction in stiffness of the soft, upper layer. This reduction in soil stiffness resulted in a reduction in rocking stiffness on the layered profiles compared to on the uniform profile at a large rocking angle.
  • Compared to the uniform profile, the kinematic interaction of the S1 structure on the layered profiles was more severe, which was indicated by a higher translational (kt) incoherence parameter. The kt parameter was experimentally and numerically found to increase with a decrease in T due to the inclination of wave path in the layered profiles.
  • The structures placed on the layered profiles also experienced higher peak acceleration for roof motion (PGARM), relative displacement, and bending moment compared to structures located on uniform ground. The observed relative displacement, rocking angle, and bending moment increased as T decreased, especially for relatively small values of T.
  • The increase in the response of structures on layered soil was more significant for the structures that have a fixed-base frequency close to the site-fundamental frequency. These layered effects increased with a decrease in the thickness of the soft, upper layer. The layered effects were diminished for structure with the smallest foundation width (i.e., S3). The translational incoherence parameter decreased on the layered profiles for the S3 structure, the opposite to what was observed for the S1 and S2 structures.

Author Contributions

Conceptualization, C.L. and J.-M.K.; Data Curation, V.-L.N.; Formal Analysis, C.L. and V.-L.N.; Funding Acquisition, J.-M.K.; Methodology, C.L., J.-M.K.; Project Administration, J.-M.K.; Supervision, C.L. and J.-M.K.; Validation, V.-L.N.; Experimental Program, C.L. and V.-L.N.; Resources, C.L. and J.-M.K.; Writing—Original Draft Preparation, V.-L.N.; Writing—Review & Editing, C.L. and J.-M.K. All authors have read and agreed to the published version of the manuscript.

Funding

This research was funded by the Ministry of Trade, Industry & Energy (MOTIE) of the Republic of Korea (No. 20193110100020).

Institutional Review Board Statement

Not applicable.

Informed Consent Statement

Not applicable.

Data Availability Statement

Data sharing is not applicable to this article.

Acknowledgments

This research was supported by the Ministry of Trade, Industry & Energy (MOTIE) of the Republic of Korea (No. 20193110100020).

Conflicts of Interest

The authors declare no conflict of interest.

References

  1. Stewart, J.P.; Gregory, L.F.; Raymond, B.S. Seismic Soil-Structure Interaction in Buildings. I: Analytical Methods. J. Geotech. Geoenviron. Eng. 1999, 125, 26–37. [Google Scholar] [CrossRef]
  2. Ghayoomi, M.; Dashti, S. Effect of Ground Motion Characteristics on Seismic Soil-Foundation-Structure Interaction. Earthq. Spectra 2015, 31, 1789–1812. [Google Scholar] [CrossRef] [Green Version]
  3. Mylonakis, G.; Nikolaou, S.; Gazetas, G. Footings under seismic loading: Analysis and design issues with emphasis on bridge foundations. Soil Dyn. Earthq. Eng. 2006, 26, 824–853. [Google Scholar] [CrossRef]
  4. Stewart, J.P.; Seed, R.B.; Fenves, G.L. Empirical Evaluation of Inertial Soil-Structure Interaction Effects; Pacific Earthquake Engineering Research Center University of California: Berkeley, CA, USA, 1998. [Google Scholar]
  5. Borghei, A.; Ghayoomi, M. The role of kinematic interaction on measured seismic response of soil-foundation-structure systems. Soil Dyn. Earthq. Eng. 2019, 125, 105674. [Google Scholar] [CrossRef]
  6. Veletsos, A.S.; Prasad, A.M.; Wu, W.H. Transfer Functions For Rigid Rectangular Foundations. Earthq. Eng. Struct. Dyn. 1997, 26, 5–17. [Google Scholar] [CrossRef]
  7. Mita, A.; Luco, J. Response of Structures to a Spatially Random Ground Motion. In Proceedings of the 3rd US National Conference on Earthquake Engineering, Charleston, SC, USA, 24–28 August 1986; Earthquake Engineering Research Inst.: San Francisco, CA, USA, 1986. [Google Scholar]
  8. Kim, S.; Stewart, J.P. Kinematic Soil-Structure Interaction from Strong Motion Recordings. J. Geotech. Geoenviron. Eng. 2003, 129, 323–335. [Google Scholar] [CrossRef]
  9. Seed, H.B.; Romo, M.P.; Sun, J.I.; Jaime, A.; Lysmer, J. The Mexico Earthquake of September 19, 1985—Relationships between Soil Conditions and Earthquake Ground Motions. Earthq. Spectra 1988, 4, 687–729. [Google Scholar] [CrossRef]
  10. Kokusho, T.; Aoyagi, T.; Wakunami, A. In Situ Soil-Specific Nonlinear Properties Back-Calculated from Vertical Array Records during 1995 Kobe Earthquake. J. Geotech. Geoenviron. Eng. 2005, 131, 1509–1521. [Google Scholar] [CrossRef]
  11. Fukushima, Y. Characteristics of Observed Peak Amplitude for Strong Ground Motion from the 1995 Hyogoken Nanbu (Kobe) Earthquake. Bull. Seism. Soc. Am. 2000, 90, 545–565. [Google Scholar] [CrossRef]
  12. Trifunac, M.D. Site conditions and earthquake ground motion—A review. Soil Dyn. Earthq. Eng. 2016, 90, 88–100. [Google Scholar] [CrossRef]
  13. Ahmad, S.; Rupani, A. Horizontal impedance of square foundation in layered soil. Soil Dyn. Earthq. Eng. 1999, 18, 59–69. [Google Scholar] [CrossRef]
  14. Jaya, V.; Dodagoudar, G.R.; Boominathan, A. Seismic soil-structure interaction analysis of tall slender structures. Int. J. Geotech. Eng. 2008, 2, 381–393. [Google Scholar] [CrossRef]
  15. Liang, J.; Fu, J.; Todorovska, M.; Trifunac, M.D. Effects of the site dynamic characteristics on soil–structure interaction (I): Incident SH-Waves. Soil Dyn. Earthq. Eng. 2013, 44, 27–37. [Google Scholar] [CrossRef]
  16. Liang, J.; Fu, J.; Todorovska, M.; Trifunac, M.D. Effects of site dynamic characteristics on soil–structure interaction (II): Incident P and SV waves. Soil Dyn. Earthq. Eng. 2013, 51, 58–76. [Google Scholar] [CrossRef]
  17. Rayhani, M.H.T.; El Naggar, M.H. Centrifuge modeling of seismic response of layered soft clay. Bull. Earthq. Eng. 2007, 5, 571–589. [Google Scholar] [CrossRef]
  18. Schofield, A.N. Cambridge Geotechnical Centrifuge Operations. Géotechnique 1980, 30, 227–268. [Google Scholar] [CrossRef] [Green Version]
  19. Ha, J.-G.; Lee, S.-H.; Kim, N.-S.; Choo, Y.W. Simulation of soil–foundation–structure interaction of Hualien large-scale seismic test using dynamic centrifuge test. Soil Dyn. Earthq. Eng. 2014, 61, 176–187. [Google Scholar] [CrossRef]
  20. Lee, S.-H.; Choo, Y.-W.; Kim, D.-S. Performance of an equivalent shear beam (ESB) model container for dynamic geotechnical centrifuge tests. Soil Dyn. Earthq. Eng. 2013, 44, 102–114. [Google Scholar] [CrossRef]
  21. Lanzano, G.; Bilotta, E.; Russo, G.; Silvestri, F.; Madabhushi, S.P.G. Centrifuge Modeling of Seismic Loading on Tunnels in Sand. Geotech. Test. J. 2012, 35, 854–869. [Google Scholar] [CrossRef]
  22. Lanzano, G.; Bilotta, E.; Russo, G.; Silvestri, F. Experimental and numerical study on circular tunnels under seismic loading. Eur. J. Environ. Civ. Eng. 2014, 19, 539–563. [Google Scholar] [CrossRef]
  23. Trombetta, N.; Mason, H.; Chen, Z.; Hutchinson, T.; Bray, J.; Kutter, B. Nonlinear dynamic foundation and frame structure response observed in geotechnical centrifuge experiments. Soil Dyn. Earthq. Eng. 2013, 50, 117–133. [Google Scholar] [CrossRef]
  24. Ngo, V.-L.; Kim, J.-M.; Lee, C. Influence of structure-soil-structure interaction on foundation behavior for two adjacent structures: Geo-centrifuge experiment. Geomech. Eng. 2019, 19, 407–420. [Google Scholar]
  25. Rayhani, M.H.; El Naggar, M.H. Numerical Modeling of Seismic Response of Rigid Foundation on Soft Soil. Int. J. Géoméch. 2008, 8, 336–346. [Google Scholar] [CrossRef]
  26. Xu, R.; Fatahi, B. Novel application of geosynthetics to reduce residual drifts of mid-rise buildings after earthquakes. Soil Dyn. Earthq. Eng. 2019, 116, 331–344. [Google Scholar] [CrossRef]
  27. Rayhani, M.; El Naggar, M.H. Physical and Numerical Modeling of Seismic Soil-Structure Interaction in Layered Soils. Geotech. Geol. Eng. 2011, 30, 331–342. [Google Scholar] [CrossRef]
  28. Itasca, F.D. Fast Lagrangian Analysis of Continua in 3 Dimensions. In User Manual, Version 5.0; Itasca Consulting Group: Minneapolis, MN, USA, 2012. [Google Scholar]
  29. Comte, C.; Von Stebut, J. Microprobe-type measurement of Young’s modulus and Poisson coefficient by means of depth sensing indentation and acoustic microscopy. Surf. Coat. Technol. 2002, 154, 42–48. [Google Scholar] [CrossRef]
  30. Bazzurro, P.; Cornell, C.A. Ground-Motion Amplification in Nonlinear Soil Sites with Uncertain Properties. Bull. Seismol. Soc. Am. 2005, 95, 2027. [Google Scholar] [CrossRef] [Green Version]
  31. Alterio, L.; Russo, G.; Silvestri, F. Seismic Vulnerability Reduction for Historical Buildings with Non-Invasive Subsoil Treatments: The Case Study of the Mosaics Palace at Herculaneum. Int. J. Arch. Heritage 2017, 11, 1–17. [Google Scholar] [CrossRef] [Green Version]
  32. Apsel, R.J.; Luco, J.E. Impedance functions for foundations embedded in a layered medium: An integral equation approach. Earthq. Eng. Struct. Dyn. 1987, 15, 213–231. [Google Scholar] [CrossRef]
  33. Ko, K.-W.; Ha, J.-G.; Park, H.-J.; Kim, D.-S. Investigation of Period-Lengthening Ratio for Single-Degree-of-Freedom Structures Using Dynamic Centrifuge Test. J. Earthq. Eng. 2019, 1–23. [Google Scholar] [CrossRef]
  34. Gajan, S.; Kutter, B.L.; Phalen, J.D.; Hutchinson, T.C.; Martin, G.R. Centrifuge modeling of load-deformation behavior of rocking shallow foundations. Soil Dyn. Earthq. Eng. 2005, 25, 773–783. [Google Scholar] [CrossRef]
  35. Gazetas, G.; Anastasopoulos, I.; Adamidis, O.; Kontoroupi, T. Nonlinear rocking stiffness of foundations. Soil Dyn. Earthq. Eng. 2013, 47, 83–91. [Google Scholar] [CrossRef]
  36. Gajan, S.; Kutter, B.L. Contact Interface Model for Shallow Foundations Subjected to Combined Cyclic Loading. J. Geotech. Geoenviron. Eng. 2009, 135, 407–419. [Google Scholar] [CrossRef]
  37. Anastasopoulos, I.; Kourkoulis, R.S.; Gelagoti, F.; Papadopoulos, E. Rocking response of SDOF systems on shallow improved sand: An experimental study. Soil Dyn. Earthq. Eng. 2012, 40, 15–33. [Google Scholar] [CrossRef]
  38. Kim, D.-K.; Lee, S.-H.; Choo, Y.W.; Park, H.-G. Rocking Effect of a Mat Foundation on the Earthquake Response of Structures. J. Geotech. Geoenviron. Eng. 2015, 141, 04014085. [Google Scholar] [CrossRef]
  39. Gajan, S.; Kutter, B.L. Capacity, Settlement, and Energy Dissipation of Shallow Footings Subjected to Rocking. J. Geotech. Geoenviron. Eng. 2008, 134, 1129–1141. [Google Scholar] [CrossRef] [Green Version]
  40. Gajan, S.; Kutter, B.L. Effects of Moment-to-Shear Ratio on Combined Cyclic Load-Displacement Behavior of Shallow Foundations from Centrifuge Experiments. J. Geotech. Geoenviron. Eng. 2009, 135, 1044–1055. [Google Scholar] [CrossRef]
  41. Gazetas, G. Foundation Vibrations. In Foundation Engineering Handbook; Fang, H.-Y., Ed.; Springer US: Boston, MA, USA, 1991; pp. 553–593. [Google Scholar]
  42. Meyerhof, G.G.; Hanna, A.M. Ultimate bearing capacity of foundations on layered soils under inclined load. Can. Geotech. J. 1978, 15, 565–572. [Google Scholar] [CrossRef]
  43. ASCE/SEI. Minimum Design Loads and Associated Criteria for Buildings and Other Structures; American Society of Civil Engineers: Reston, VA, USA, 2017. [Google Scholar]
  44. FEMA. Improvement of Nonlinear Static Seismic Analysis Procedures; FEMA 440; ATC-55 Project; Applied Technology Council: Redwood City, CA, USA, 2005. [Google Scholar]
Figure 1. Three soil profiles with an in-flight bender element, accelerometer (left), and shear wave velocity (Vs) profile (right) at (a) Uni: uniform ground, (b) L1: ground with 2.6 m soft above layer, and (c) L2: ground with 5.2 m soft above layer. Unit: m.
Applsci 11 00623 g001
Figure 2. FLAC3D model with the S1 structure at (a) L2 profile case and (b) soil and structural elements.
Applsci 11 00623 g002
Figure 3. Comparison of computed results with the centrifuge test series for (a) acceleration and (b) response spectra.
Applsci 11 00623 g003
Figure 4. Amplification factor in the soil at (a) Uni, (b) L1, and (c) L2 profiles.
Applsci 11 00623 g004
Figure 5. Comparison of (a) peak acceleration (PGA)FFM, (b) PGAA5 (horizontal motion), and (c) PGAA6 (vertical motion) obtained on layered profiles (i.e., L1 and L2) with those on uniform profile (Uni). The values in the figure indicate the maximum difference between the two measured data.
Applsci 11 00623 g005
Figure 6. Ratio of response spectra (RRS) of roof motion (RM) to foundation motion (FMT) for three soil profiles at (a) PGA = 0.1 g and (b) PGA = 0.22 g. Solid markers indicate peak RRS corresponding to fflex for each case.
Applsci 11 00623 g006aApplsci 11 00623 g006b
Figure 7. Comparison of period lengthening ratio (PLR) for the S1 structure on L1 and L2 profiles to those on Uni profile.
Applsci 11 00623 g007
Figure 8. (a) Relationship between overturning moment (M) and rocking angle (θ), and (b) rocking stiffness for S1 structure on three soil profiles.
Applsci 11 00623 g008
Figure 9. Translational transfer function between FM and FFM for the S1 structure at two levels of peak acceleration of the base motion (PGABM).
Applsci 11 00623 g009
Figure 10. Translational incoherence parameters defined for (a) three structures on Uni profile, (b) S1 structure on three profiles, (c) S2 structure on three profiles, and (d) S3 structure on three profiles.
Applsci 11 00623 g010aApplsci 11 00623 g010b
Figure 11. Comparison of the maximum of (a) acceleration of RM, (b) relative displacement of the roof, and (c) bending moment at the bottom (Max.MB) for the S1 structure on L1 and L2 profiles with those on Uni profile.
Applsci 11 00623 g011aApplsci 11 00623 g011b
Figure 12. Comparison of peak acceleration of RM (PGARM) for the S1, S2, and S3 structures on L1 and L2 profiles with those on Uni profile.
Applsci 11 00623 g012
Table 1. Foundations and structures’ characteristics.
StructuresS1S2S3
Foundations
Dimension L × B × H (m)5.22 × 5.22 × 0.95.22 × 3.94 × 0.91.2 × 2.0 × 0.9
rs = ( B · L ) / π (m)2.952.550.82
Structures
fn at 1 g (Hz)98.682.0317.4
fn at 45 g (Hz)2.191.827.05
Structure height, h (m)9.4 8.252.97
Note: rs = foundation equivalent sliding radius; fn = structural fixed-base frequency.
Publisher’s Note: MDPI stays neutral with regard to jurisdictional claims in published maps and institutional affiliations.

