1. Introduction
The mitigation of climate change requires the substitution of fossil carbon in carbonaceous fuels and goods by renewable carbon sources. Renewable carbon sources are, for instance, biomasses, such as wood or energy crops. However, the current available biomass feedstock cannot satisfy the massive amount of fossil carbon that is currently utilized worldwide. Therefore, also the utilization of carbon from available biogenic residues and waste streams has to be considered in order to replace as much fossil carbon as possible. Sewage sludge is a not avoidable residue with a quantity of over 10 × 10
9 kg a
−1 on dry basis in Europe [
1], over 12 × 10
9 kg a
−1 in the USA [
2] (1999 only 7 × 10
9 kg a
−1 [
3]), and over 6 × 10
9 kg a
−1 in China with a steep increase [
4]. Besides the utilization of the energy and carbon contents of sewage sludge, the recovery of phosphorous (e.g., from sewage sludge ash) to close the nutrient cycle and the safe recycling or disposal of hazardous components such as heavy metals are also of great importance [
5]. Therefore, a change from the currently mostly practiced sewage sludge disposal methods, e.g., land-“use”, landfill, and co-incineration in coal-fired power plants or cement plants, to mono-treatment recycling methods is required in order to fulfill the goals of a circular economy and climate change mitigation. For instance in Germany, the need of phosphorous recovery has already been put into regulation [
6]. The utilization of sewage sludge as fuel is also economically favorable as high disposal fees are attainable.
A conversion process is needed to practically replace fossil carbon with renewable carbon in established products such as transport fuels, chemicals or plastics. A promising and very flexible conversion process considering feedstock quality and product choice is the thermochemical gasification that generates a high calorific syngas which can be further converted to the desired product in a downstream catalytic synthesis [
7]. Such a gasification process is the steam-oxygen fluidized bed gasification, that produces a nitrogen-lean and thus high calorific syngas, that is rich in hydrogen and carbon monoxide, and thus can be used for synthesis of fuels (e.g., synthetic natural gas, dimethyl ether, kerosene) and chemicals (methanol, plastic monomers) [
8]. Also, the recovery of phosphorous can be achieved well from gasification-derived sewage sludge ash [
9,
10,
11].
As gasification agent, a mixture of steam and oxygen is used to provide the necessary heat for the endothermic gasification process through partial fuel oxidation. Therefore only a single fluidized bed reactor is needed, which simplifies the process layout in contrast to the allothermal indirect dual fluidized bed (DFB) steam gasification [
12,
13]. The needed oxygen can be generated by an on-site power-to-gas facility that produces oxygen as by-product from water electrolysis, by a state of the art cryogenic air separation unit (ASU) with acceptable energy consumption of 720 kJ per kg O
2 [
14,
15] or tentatively in future by air separation with membranes. The sewage sludge has to be dried in order to be utilized in fluidized bed gasification. To minimize the energy consumption for drying, a combination of mechanical dewatering (e.g., centrifuge) to a dry matter fraction of around 0.25 kg kg
−1, solar drying, and thermal drying using low temperature heat will finally obtain a dry matter fraction of around 0.9 kg kg
−1 that can be used for fluidized bed gasification [
16].
In the steam-oxygen gasification, the gasifier is operated at temperatures of about 850 °C which enables the thermochemical decomposition of fuel into permanent gases, tars, char and ash. The so produced char and tars are then gasified or reformed by reaction with oxygen and steam. The raw syngas is comprised of H2O, H2, CO, CO2, CH4, light hydrocarbons (mostly C2H4), and tars (larger hydrocarbons, e.g., aromatics and polyaromatics).
Steam-oxygen gasification of wood and biogenic residues has been studied by other researches [
15,
17,
18,
19,
20,
21,
22,
23,
24], however there is not as much data available as on other gasification processes. Results from these literature references are summarized in previous work of this author [
14], but also in the results section of this paper these references are used for a comparison of results where applicable. Also, semi-commercial demonstration plants for the steam-oxygen fluidized bed gasification of biomass have already been in operation with a thermal input of 18 MW [
25] and 100 MW [
26,
27]. The technical results of these endeavors were encouraging, underlining the potential of the technology. However, for sewage sludge, little fuel data were available. This is why this paper is needed, and constitutes one core goal of this paper.
The product gas contains beside the desired syngas species, tars and other impurities. Especially for sewage sludge, a high H
2S and NH
3 concentration is observed in the syngas which is not tolerated by downstream synthesis catalysts [
28]. Therefore, gas cleaning is required before synthesis. Reducing the costs of gas cleaning is important for the economic feasibility of the process [
29]. To design and develop the entire process chain consisting of gasification, gas cleaning, and synthesis, detailed information on the product gas quality and composition, including impurities such as tars, sulfur-species, and ammonia, is needed.
The reduction of tars and impurities by primary measures such as active bed materials is considered economically and technically favorable compared to secondary measures [
30,
31]. A CaO-containing bed material, e.g., achieved by addition of limestone (CaCO
3) or dolomite is catalytically active for cracking and steam reforming of tars [
28,
32,
33] and acts as sorbent to capture H
2S (CaO + H
2S ⬌ CaS + H
2O) and COS (CaO + COS ⬌ CaS + CO
2) [
31,
34,
35]. This work delivers experimental data on the application of this sulfur capture for sewage sludge gasification and its temperature dependency.
This study continues the author’s previous research on steam-oxygen gasification wherein sewage sludge gasification was compared to straw and wood gasification [
14] and the influence of limestone as bed additive for sewage sludge gasification was investigated [
36]. In this paper, a deeper look is cast on the effect of operation conditions on the gasification performance. These insights are important to validate process models and to support process design.
2. Materials and Methods
2.1. Fuel and Bed Material
The sewage sludge used in this work originated mainly from the municipal waste water treatment plant Häldenmühle in Marbach am Neckar in south-west Germany. A minor fraction of the sludge (less than 0.2 kg kg−1) came from the municipal wastewater treatment plants “Beilstein” and “Oberes Bottwartal” that are also located in south-west Germany. Those treatment plants delivered the sludge to the drying facility of Bioenergie Bottwartal GmbH&Co.KG, where the sludge was dried thermally with hot flue gases from a biogas CHP. After drying, the fuel had particle sizes of 5–10 mm, which might already be suitable for application in commercial fluidized beds. To suit the used experimental facility, the dried sewage sludge was crushed with a beater mill using a 2 mm sieve. The sewage sludge, gasified in the experiments, had high N, S, Cl, and ash contents. The ash summed up to almost half of the fuels dry mass. Therefore, the ash itself was used as bed material.
The proximate and elemental analysis is given in
Table 1. The composition of this sewage sludge lies within the ranges reported by [
37], wherein information on organic and non-organic components of typical sewage sludge is also given.
For some experiments, limestone was used as bed additive without pre-calcination. The calcination took then place in-situ in the gasifier releasing CO2. The limestone type “Messinghausener Sand 0.3–0.7” was obtained from LHOIST Germany/Rheinkalk GmbH with origin Messinghausen in Germany and consisted of the sieve fraction 0.3 mm–0.7 mm.
Table 2 shows the mineral composition of sewage sludge ash and limestone. The major elements are Si, Ca, P, Al, and Fe. Heavy metal concentrations in the dry sewage sludge are presented in Table 9.
The particle sizes of the used solids are shown in
Table 3. The dried sewage sludge had a wide range in particle sizes. During the gasification process, the sewage sludge particles seemed to release their volatile components with only a slight decrease in particle size, as the comparison of the particle sizes of sewage sludge and its ash showed. The limestone reduced its particle size during its residence time in the gasifier due to calcination and abrasion and was finer than the sewage sludge ash. Comprehensive particle size distributions on these materials are given in [
14].
2.2. Experimental Facility
A 20 kW fuel input fluidized bed facility was used in this work. It is shown schematically in
Figure 1. The bubbling fluidized bed reactor is 3.5 m high and has an internal diameter of 0.15 m in the fluidized bed region and 0.20 m in the freeboard above. The facility is equipped with several thermocouples and pressure transducers. Electrical heating allowed to control and adjust the temperature inside the gasifier and to compensate unwanted heat losses that are inherent to a research scale facility. Preheated steam was injected through six bubble cap nozzles to fluidize the bed. Oxygen could due to technical reasons not be mixed with the steam like in an industrial plant but was introduced through two additional bubble cap nozzles. For safety reasons N
2 was added to the oxygen stream to reduce the O
2 concentration to 0.75 m
3 m
−3. The mass flow of N
2 and O
2 in these gas feeds was controlled by automatic mass flow controllers.
Dried sewage sludge was dosed gravimetrically with a screw feeder into the lower part of the fluidized bed, for which a small amount of nitrogen purge gas was also required. As a result of the high ash content in sewage sludge, the bed material was continuously removed during the gasification process by an overflow port to maintain a constant bed height.
For some experiments limestone was used as additive, which was dosed gravimetrically by a second doser through a port above the fluidized bed. A double ball-valve lock was used for pressure sealing.
After the gasifier, the product gas is cleaned from particles by two cyclones and a candle filter, which are heated to 400 °C to prevent tar condensation. The gas passed a pressure control valve before it was combusted in a flare.
2.3. Analysis Methods
Three slipstreams of the product gas were extracted for gas measurements after the candle filter of the facility. H2, CO, CO2, and CH4 were measured continuously in a combined NDIR and thermal conductivity gas analyzer (ABB AO2020), whereas hydrocarbons from C2 to C4 (CxHy), H2S and COS were semi-continuously (every 3 min) analyzed with a Varian CP-4900 Micro-GC. The slipstream for these devices was lead from the facility through a heated filter and a heated hose (both 180 °C) directly into 4 chilled impinger bottles, wherein the gas passed through an equal mixture of isopropanol and a 0.30 kg kg−1 sulfuric acid aquatic solution for tar removal. Afterwards the gas was lead through an impinger bottle with a 0.15 kg kg−1 sulfuric acid aquatic solution at ambient temperature to capture evaporated isopropanol. By these means, tars were removed to prevent damage to the analytical equipment, but due to the low pH value of the solution, H2S and COS remained in the gas.
The continuous online gas measurement was also used to measure the dry volume flow of the syngas by a dilution method. After the candle filter, the syngas was diluted by a known N2-stream controlled by a mass flow controller. The permanent gas concentrations were measured before and after the dilution. The syngas volume flow was calculated from the concentration changes.
The second sample line was used for wet chemical NH
3 measurement according to a modified VDI 3838 [
38] guideline: An impinger bottle was used to absorb the gaseous ammonia in a 1 mol L
−1 H
2SO
4-solution. For tar and humidity removal an isopropanol impinger bottle was arranged before the absorption solution. To avoid NH
3 loss in the isopropanol bottle, the pH value was increased by adding NaOH. The samples were analyzed with UV-Vis spectroscopy.
The third sample line was used for tar measurement, where a heated filter and heated hose at 350 °C were used. Tars were measured by extractive sampling and analysis according to the tar protocol CEN/TS 15439 [
39]. For this, a quantified volume of the product gas was directed through cooled isopropanol washing bottles, wherein the tars were solved and condensed. The collected isopropanol-tar samples were analyzed by two methods as follows.
(i) In the gravimetric analysis the isopropanol is vaporized out of the sample to gain a solvent free tar residue from whose mass the gravimetric tar concentration is derived. According to [
40] this sample covers all “heavy” tar species with a molar mass over approximately 180 g mol
−1 (phenanthrene). Also tars with lower molar mass can be detected with this method, but with decreasing molar mass the detectability of tar species by gravimetric analysis decreases. Very “light” species, such as benzene, toluene, and xylene (BTX), are not detected or only to a small extend by gravimetric analysis. The gravimetric tar concentration is particularly important to assess the amount of very heavy tars with high boiling temperatures, that may condense easily on cold facility parts (e.g., gas coolers, valves) and can cause blockage and operation failure. The gravimetric analysis is performed three times for each tar sample and a mean value was calculated. As a novel method, elemental analysis of C, H, N, S, and Cl, as well as the heating value of the gravimetric tar was conducted for some samples to assess its composition.
(ii) With gas chromatography (GC) analysis of the isopropanol-tar sample, actual tar components can be individually intentified and quantified. Especially “light” species can be detected very well. These species are partially still present after gas cooling, condensation and possibly after gas washing and thus have to be considered for downstream equipment. On the contrary, heavy tar species can only be detected up to a certain molar mass with a GC, in this work this was pyrene with 202 g mol
−1. Quantification of all evaluated tar species was conducted with GC-FID by the institute of energy and process engineering of FAU University of Erlangen-Nuremberg with the following equipment and specifications: Agilent GC 7890A, column CP Sil 8 CB (L = 25 m, d = 0.25 mm), temperature programme: 3 min at 40 °C, heating rate 4.7 K min
−1 to 300 °C [
41]. For simplification, benzene is also considered a tar component despite the fact that it is not named as tar in most of the literature.
Elemental and heating value analysis of fuel and gravimetric tar residues were conducted by a CHN-analyzer and combustion in a bomb calorimeter with wet sampling and ion-chromatography of S and Cl. Inorganic elemental analysis of sewage sludge ash and limestone was done by using acid digestion with subsequent ICP analysis.
Particle size distributions were measured by sieve analysis and with a laser diffraction particle size analyser.
2.4. Experimental Parameters
The main operation parameters for the steam-oxygen gasification process are gasification temperature, steam to carbon ratio, oxygen ratio, weight hourly space velocity and the bed material type.
For the choice of the gasification temperature, the following trade-off needs to be considered: Higher temperatures lead to faster gasification reactions and thus improved char and tar conversion but, on the other hand, can result in bed agglomeration when fuels with low temperature ash melting behaviour like straw are used. Also, higher gasification temperatures require more oxygen and thus reduce the overall conversion efficiency. The used bed material, sewage sludge ash, has a rather high ash melting temperature of 1200 °C but it already begins sintering at about 900 °C [
42]. Therefore, the maximum bed temperature should be kept below that. In this work gasification temperatures from 650 °C to 900 °C were investigated to generate insight in the temperature influence on the process. Because of the advantages of higher gasification rates and lower tar yields, it is expected that an industrial sewage sludge gasifier will be operated at a temperature above 800 °C but below 900 °C, so as to prevent sintering and agglomeration of the bed.
The steam to carbon ratio,
nSC, describes the ratio of the total mole flow of water, including the fuel’s moisture, to the mole flow of biomass carbon introduced into the gasifier:
Generally, higher nSC results in a reduced energetic efficiency as additional steam needs to be introduced to the gasifier. On the other hand, low S/C ratios can reduce char conversion and cause higher tar yields. The water-gas-shift reaction (CO + H2O ⬌ H2 + CO2) is severely influenced by the steam to carbon ratio, since H2O pushes the equilibrium to the right side. Therefore, the H2 yield as well as the H2/CO-ratio, that is important for downstream synthesis processes, can be increased with increasing S/C ratio.
The oxygen ratio
nO2 (analogue to air ratio
λ in combustion processes), often also referred to as equivalence ratio ER, expresses the ratio of the amount of oxygen actually used in the process to the amount of oxygen which would be required for the stoichiometric oxidation of the fuel:
In a technical process, nO2 cannot be chosen independently of the gasifier’s temperature, but is a function thereof. However, due to the electrical heating of the experimental facility used in this work, nO2 is not coupled with the gasifier temperature and hence needs to be set by the operator. Nevertheless, in order to simulate industrially relevant conditions within the experiments, nO2 was chosen according to adiabatic conditions. These calculations resulted in ranges of n from 0.2 to 0.3. To generate comparable conditions, the base case of nO2 = 0.25 was chosen.
T weight hourly space velocity,
nWHSV, is the ratio of the fuel feeding rate to bed inventory mass:
Therefore nWHSV is a design value that brings the fuel load and the size of the fluidized bed reactor vessel in correlation. The nWHSV is correlated reciprocally to the fuel residence or space time in the bed. That means, for higher nWHSV the fuel has a shorter residence time in the bed.
The limestone additive ratio
nCaCO3 expresses the mass ration of limestone additive to sewage sludge feed.
The superficial velocity
u0 in the fluidized bed was calculated by dividing the volume flow of steam and oxygen at operation conditions by the cross sectional area
Agasifier of the gasifier (d
gasifier = 0.15 m):
The minimum fluidizing velocity
umf was derived from the particle Reynolds number at minimum fluidizing conditions
Rep,mf which was calculated according to Kunii and Levenspiel and Wen and Yu.
The experimental parameters are summarized in
Table 4.
2.5. Experimental Procedure
Prior to the experiments, the gasifier was heated to the desired bed temperature with around 7 kg of bed material, consisting of sewage sludge ash. The flows of sewage sludge, steam and oxygen were adjusted according to the desired experimental parameters. When the temperature and gas concentrations were steady, the experimental point commenced. Each experimental point was held in steady state conditions for at least 30 min and mean values for the continuously recorded data were calculated over this period. The tar and NH3 measurements, with a duration of 20 min each, were conducted during steady state operation conditions.
For the experiments with limestone as bed additive, a respective batch of limestone was added prior to the experiment to set up the desired fraction of CaO in the bed. After that, a continuous dosing of limestone with the additive ratio of 0.25 kg kg−1 (mass limestone per sewage sludge as used) was started.
2.6. Thermochemical Equilibrium Calculations for Sulfur Capture with Calcium
The thermochemical equilibrium can be used to calculate the theoretical optimum of the H
2S and COS capture by reaction with CaO during gasification [
34,
43]. CaO is present in sewage sludge ash but can also be added in form of limestone (CaCO
3) bed additive. The H
2S and COS capture follows the equilibrium reaction equations [
31,
34,
44,
45]:
Since, in the gasifier, a reducing atmosphere is present, no CaSO4 can be formed, but instead, CaS.
With the data from
Table 1 and
Table 2, the molar ratio of calcium and sulfur fed into the gasifier by the sewage sludge can be calculated:
It can be seen that the sewage sludge has enough CaO present in its ash to capture all of the sludge’s sulfur (nCa,S = 3.5 mol mol−1). However, sulfur capture can only occur until the equilibrium concentration of H2S and COS is reached in the syngas. Since also H2O and CO2 are part of the relevant chemical equations (Equations (4)–(6)), the total syngas atmosphere influences the equilibrium concentrations of H2S and COS. Hence, equilibrium calculations of the whole gasification process needed to be performed.
For this, the software FactSage 7.3, described in [
46], with the database FactPS (pure substances) including all species relevant for this gasification process was used. FactSage’s numerical solver then calculated the product composition where the Gibbs energy is at its minimum–the thermodynamic equilibrium:
The input masses necessary for the gasification of 1 kg sewage sludge as used together with the gasification agents according to
Table 5 and
Table 6 were entered into the FactSage solver. The gasification temperature was set. All calculations were done for ambient pressure of 1 bar. The database FactPS was used. Then, the equilibrium product composition, including the permanent gases like H
2, CO, CO
2, as well as H
2S and COS, was calculated. From this result, the equilibrium concentrations of H
2S and COS were calculated as volume fraction based on the dry syngas.
3. Results and Discussion
In this paper experimental runs investigating the influence of key operation parameters on sewage sludge gasification are presented. The actual operation values for these runs are summarized
Table 4.
3.1. Permanent Gases
In this chapter the influence of the operation parameters on the permanent gas composition and yields are shown. The concentration of the permanent gases H2, CO, CO2, CH4 and CxHy (C2 to C4 hydrocarbons) are given as volume fractions on a dry N2-free basis and the permanent gas yield as dry N2-free volume in STP conditions (273.17 K, 101,300 Pa) per mass of dry ash free sewage sludge. In addition, the water concentration is shown as volume fraction on wet N2-free basis.
3.1.1. Variation of Oxygen Ratio nO2
Figure 2 shows the influence of the oxygen ratio
nO2 on the permanent gases at constant temperature ϑ. With increasing oxygen ratio, the H
2 concentration decreased and the CO
2 and H
2O concentration increased. Also, a slight decrease of CO was observed. This reflects the increased combustion of H
2 and CO to H
2O and CO
2 due to the higher oxygen supply. The CH
4 and C
yH
y concentrations were not influenced by the oxygen ratio in the investigated range. A rather constant value was observed for the gas yield.
In most experiments found in the literature, other parameters such as temperature also varied when different
nO2 were investigated. Therefore, it is difficult to compare the trends [
22,
47,
48,
49]. For coal gasification in a steam-oxygen blown slightly pressurized spouting bed at 940 °C [
50],
nO2 variation also showed increasing CO
2 concentration whereas H
2 and CO were increasing until
nO2 = 0.35 but then decreased with increasing
nO2. The reference connects this to increased gas yield and carbon conversion up to
nO2 = 0.35 followed by constant values for higher
nO2. The trend of higher y
CO2 for higher
nO2 in that reference is fitting well to this work. The variation of gas yield and carbon conversion with
nO2 is significantly dependent on the fuel reactivity and temperature, which could be the explanation for the differences between both studies.
3.1.2. Variation of Temperature ϑ
Figure 3 shows the influence of the gasification temperature ϑ on the permanent gases for a constant
nO2. With increasing temperature, the gas yield increased due to higher carbon conversion to permanent gases. Also the H
2 and CO concentration increased and the H
2O concentration decreased with increasing temperature, which is also related to an increased fuel conversion by steam gasification. No influence was seen on CH
4 and C
xH
y concentrations. Similar trends were found for steam-air gasification of corn straw [
51] and sewage sludge [
32] also, with regard to the N
2-free basis, and similar gas concentrations of all permanent gases were reported. Also, the temperature influence in steam-oxygen gasification of wood is reported in literature [
22] and shows similar trends compared to this study concerning H
2, CO
2, and gas yield. However, differences were reported in the trend of the CO, CH
4, and C
xH
y concentrations, which decreased slightly with temperature in the reference whereas in this study they slightly increased (CO) or stayed constant (CH
4, C
xH
y). Similar trends to this study were also obtained by steam gasification of sewage sludge in the same gasifier operated in DFB mode [
52].
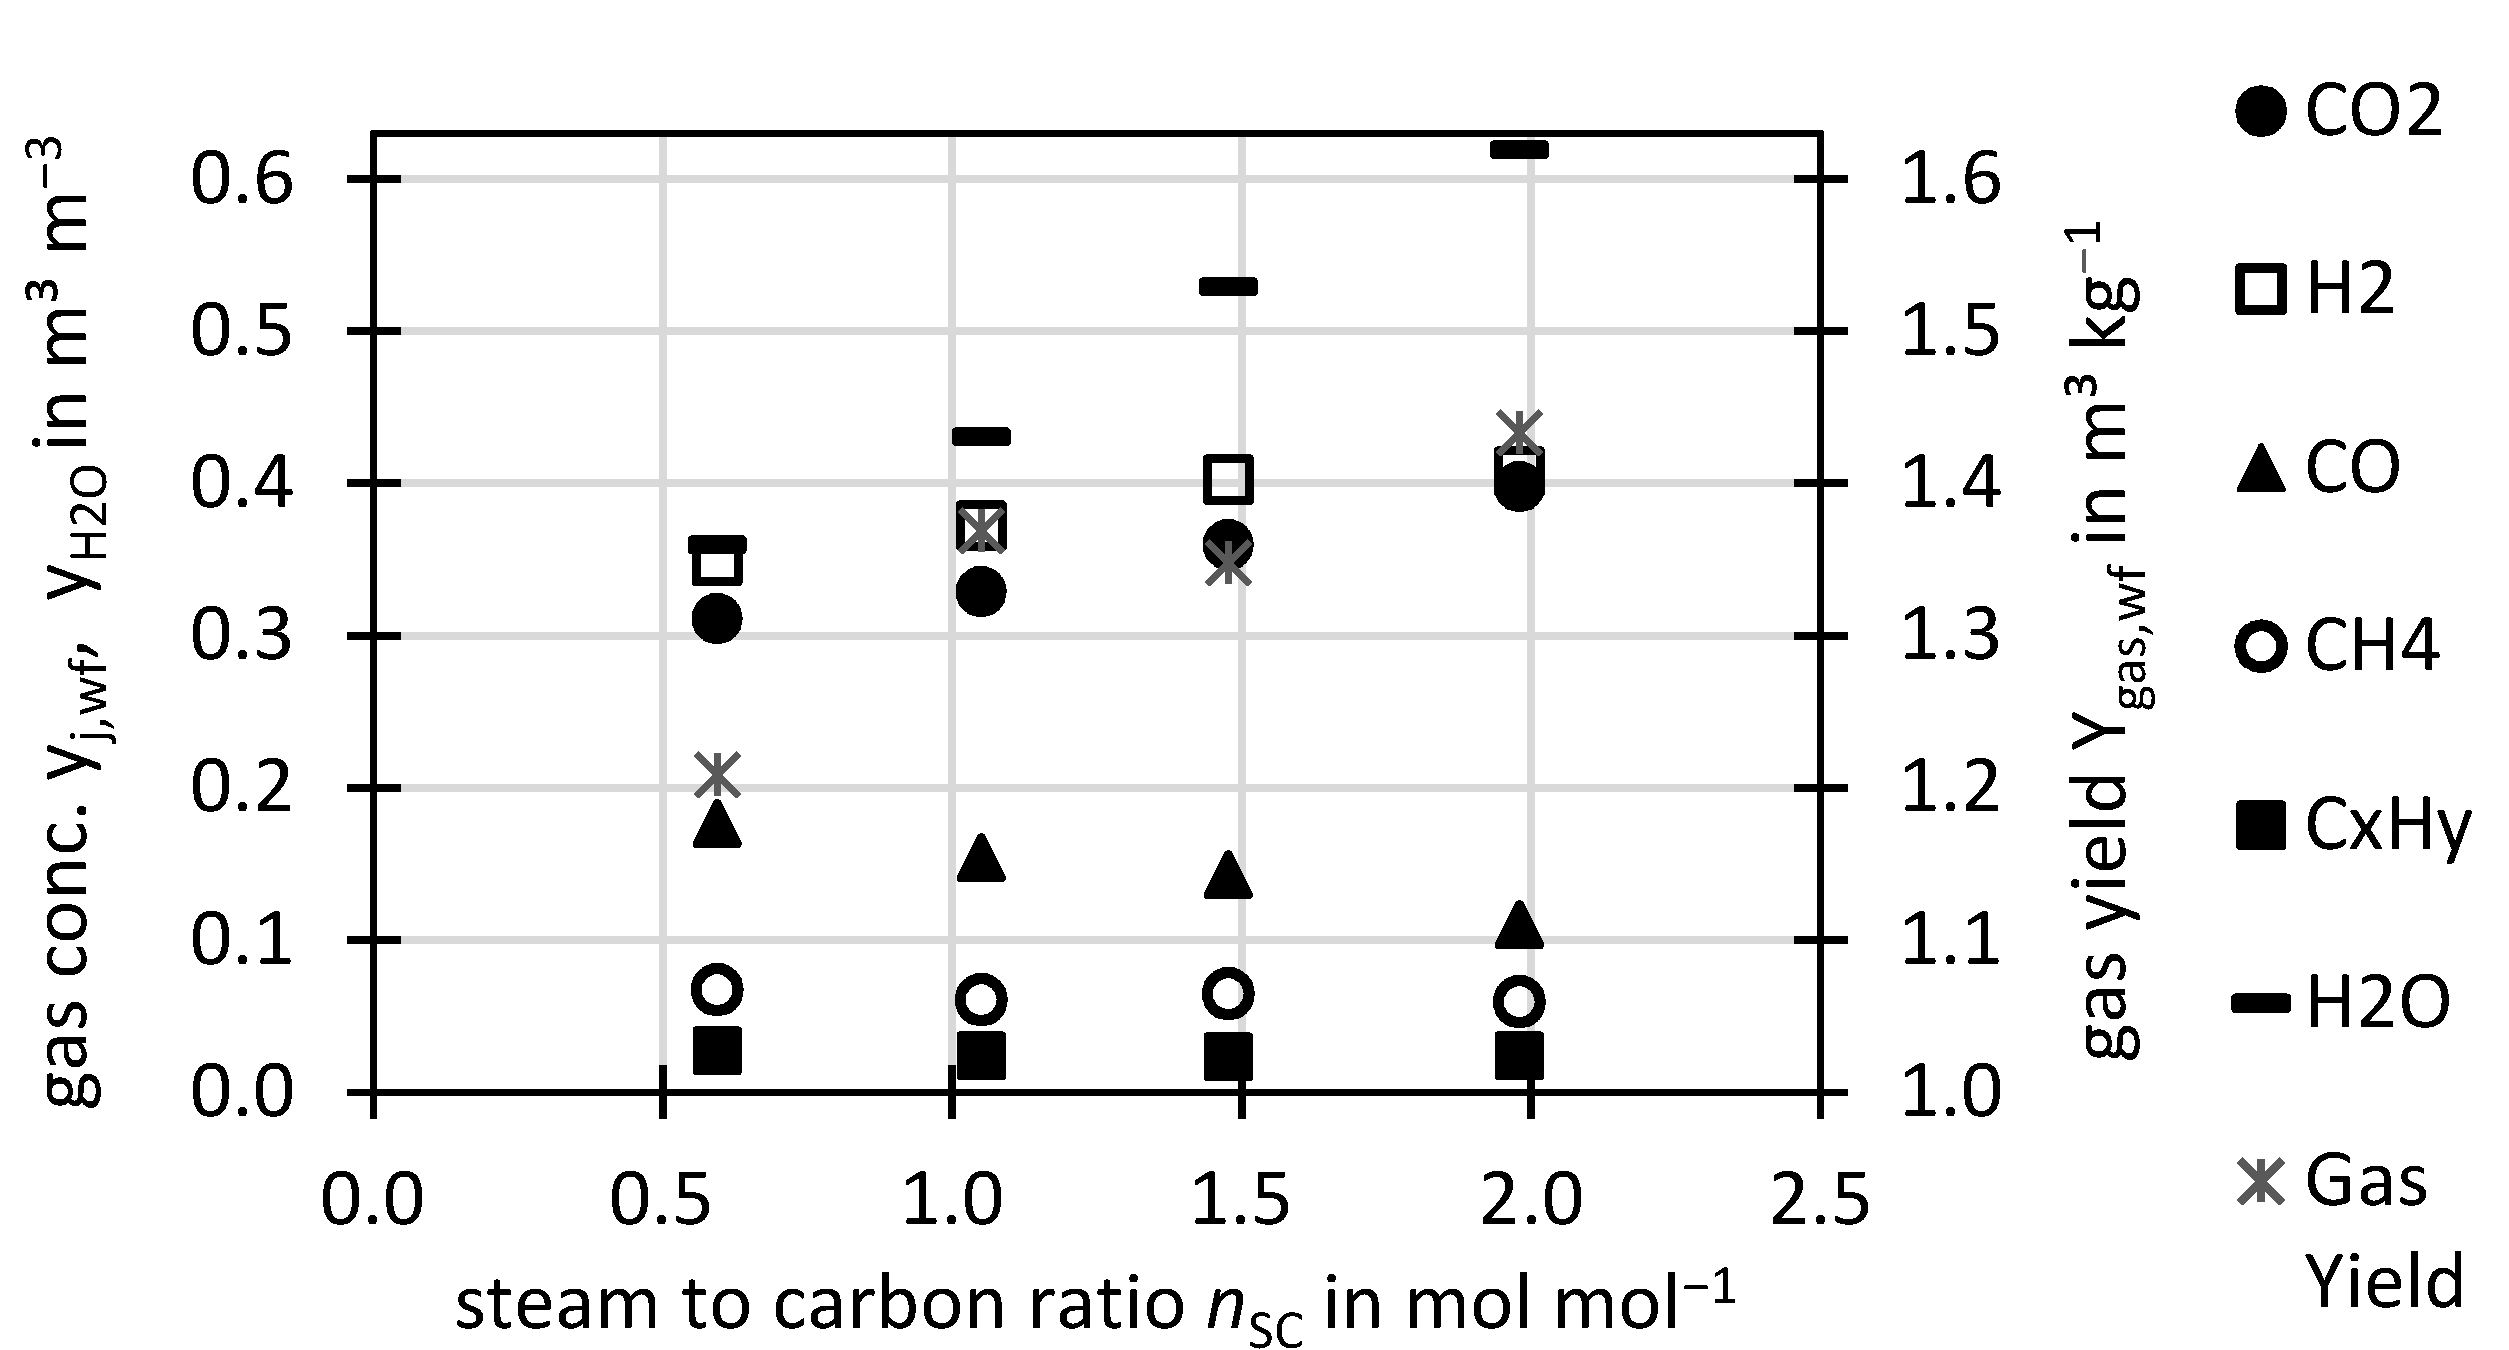
3.1.3. Variation of Steam to Carbon Ratio nsc
Figure 4 shows the influence of the steam to carbon ratio
nSC on the permanent gases. The
nSC had a strong influence on the permanent gas composition, since H
2 and CO
2 strongly increased and CO decreased with
nSC. This was due to the water gas shift reaction (CO + H
2O ⬌ H
2 + CO
2) that was driven to the right side by adding steam. Therefore also the dry gas yield rose, since water was converted to H
2. The CH
4 and C
xH
y concentrations were mostly unaffected. Naturally, as more steam was introduced, the H
2O concentration increased with
nSC. Parameter variation in steam-oxygen gasification of wood in a comparable facility was conducted by [
22] and in air-steam gasification of corn straw by [
51], where similar trends for H
2, CO, CO
2 and H
2O were found, but other than in this work, a slight decrease of CH
4 and C
xH
y was reported with increasing
nSC in the reference. High CO and lower H
2 and CO
2 concentrations at low
nSC as in this work were also reported by [
21]. For steam-air gasification of refuse-derived fuel in a rotary kiln also a rise in gas yield with
nSC was reported [
53].
These results indicate, that through a higher
nSC a conversion of CO to H
2 and CO
2 can be achieved to improve the H
2-yield or to adjust the H
2/CO-ratio. However, higher
nSC requires more energy-intensive steam production, so that in practice it always needs to be considered if a higher
nSC or a downstream catalytic WGS unit, which are currently developed for uncleaned syngas [
54], is preferred.
3.1.4. Variation of Weight Hourly Space Velocity nWHSV
Figure 5 shows the influence of the weight hourly space velocity
nWHSV, given in mass flow of dry ash-free sewage sludge per bed inventory mass, on the permanent gases. It has to be mentioned, that
nWHSV was changed, both, by variation of fuel throughput and bed inventory as can be seen in
Table 4. For the gases CO, CO
2, CH
4, and C
xH
y, no clear trend was observed for different
nWHSV. A slight decrease for the H
2 concentration with increased
nWHSV was present, which could be related to slightly decreased water-gas-shift reaction due to the decreasing residence time of the gas. Similar behavior was reported for sewage sludge steam-air gasification by [
15], where for a higher turnover rate, respectively higher
nWHSV, lower H
2 concentrations, and no or only little change in the other permanent gas concentrations were found.
3.2. Tar Concentration
As described previously, tar sampling was conducted wet chemically and two sample analysis methods were used: GC analysis and gravimetric analysis. By GC analysis 18 tar species (named in [
14]) were quantified. In the following, the GC tars are shown as ECN tar classes [
40]. The majority of the GC-detectable tars were found to be benzene, toluene, xylene (BTX) included in the here used classes “benzene” and “ECN3”. In previous work [
36] it was found, that also unneglectable amounts of heterocyclic species, mainly pyridine, are present in tar from sewage sludge gasification. However, pyridine was not quantified in the GC analysis presented in this work since the used GC was not calibrated for that.
The gravimetric analysis detects mostly heavy tars, but also inorganic components e.g., salts from ammonia, sulfur and chlorine can be present (see previous work [
14,
36]). The carbon mass fraction in the gravimetric tars was found to be around 0.5 kg kg
−1, which has to be considered when using the presented tar concentrations for calculating a carbon mass balance.
All concentrations are shown as tar mass per volume of dry and N
2-free syngas in STP conditions. The tar yields can be calculated by multiplying the tar concentration with the gas yields from
Section 3.1.
In the following, the influence of different operation conditions on the tar concentrations are shown. In this study the influence of the operation parameters
nO2,
ϑ,
nSC,
nWHSV is shown. The tar concentration is also significantly dependent on the catalytic activity of the bed material e.g. in case of limestone or dolomite addition which was not subject of this work but was investigated in literature [
51].
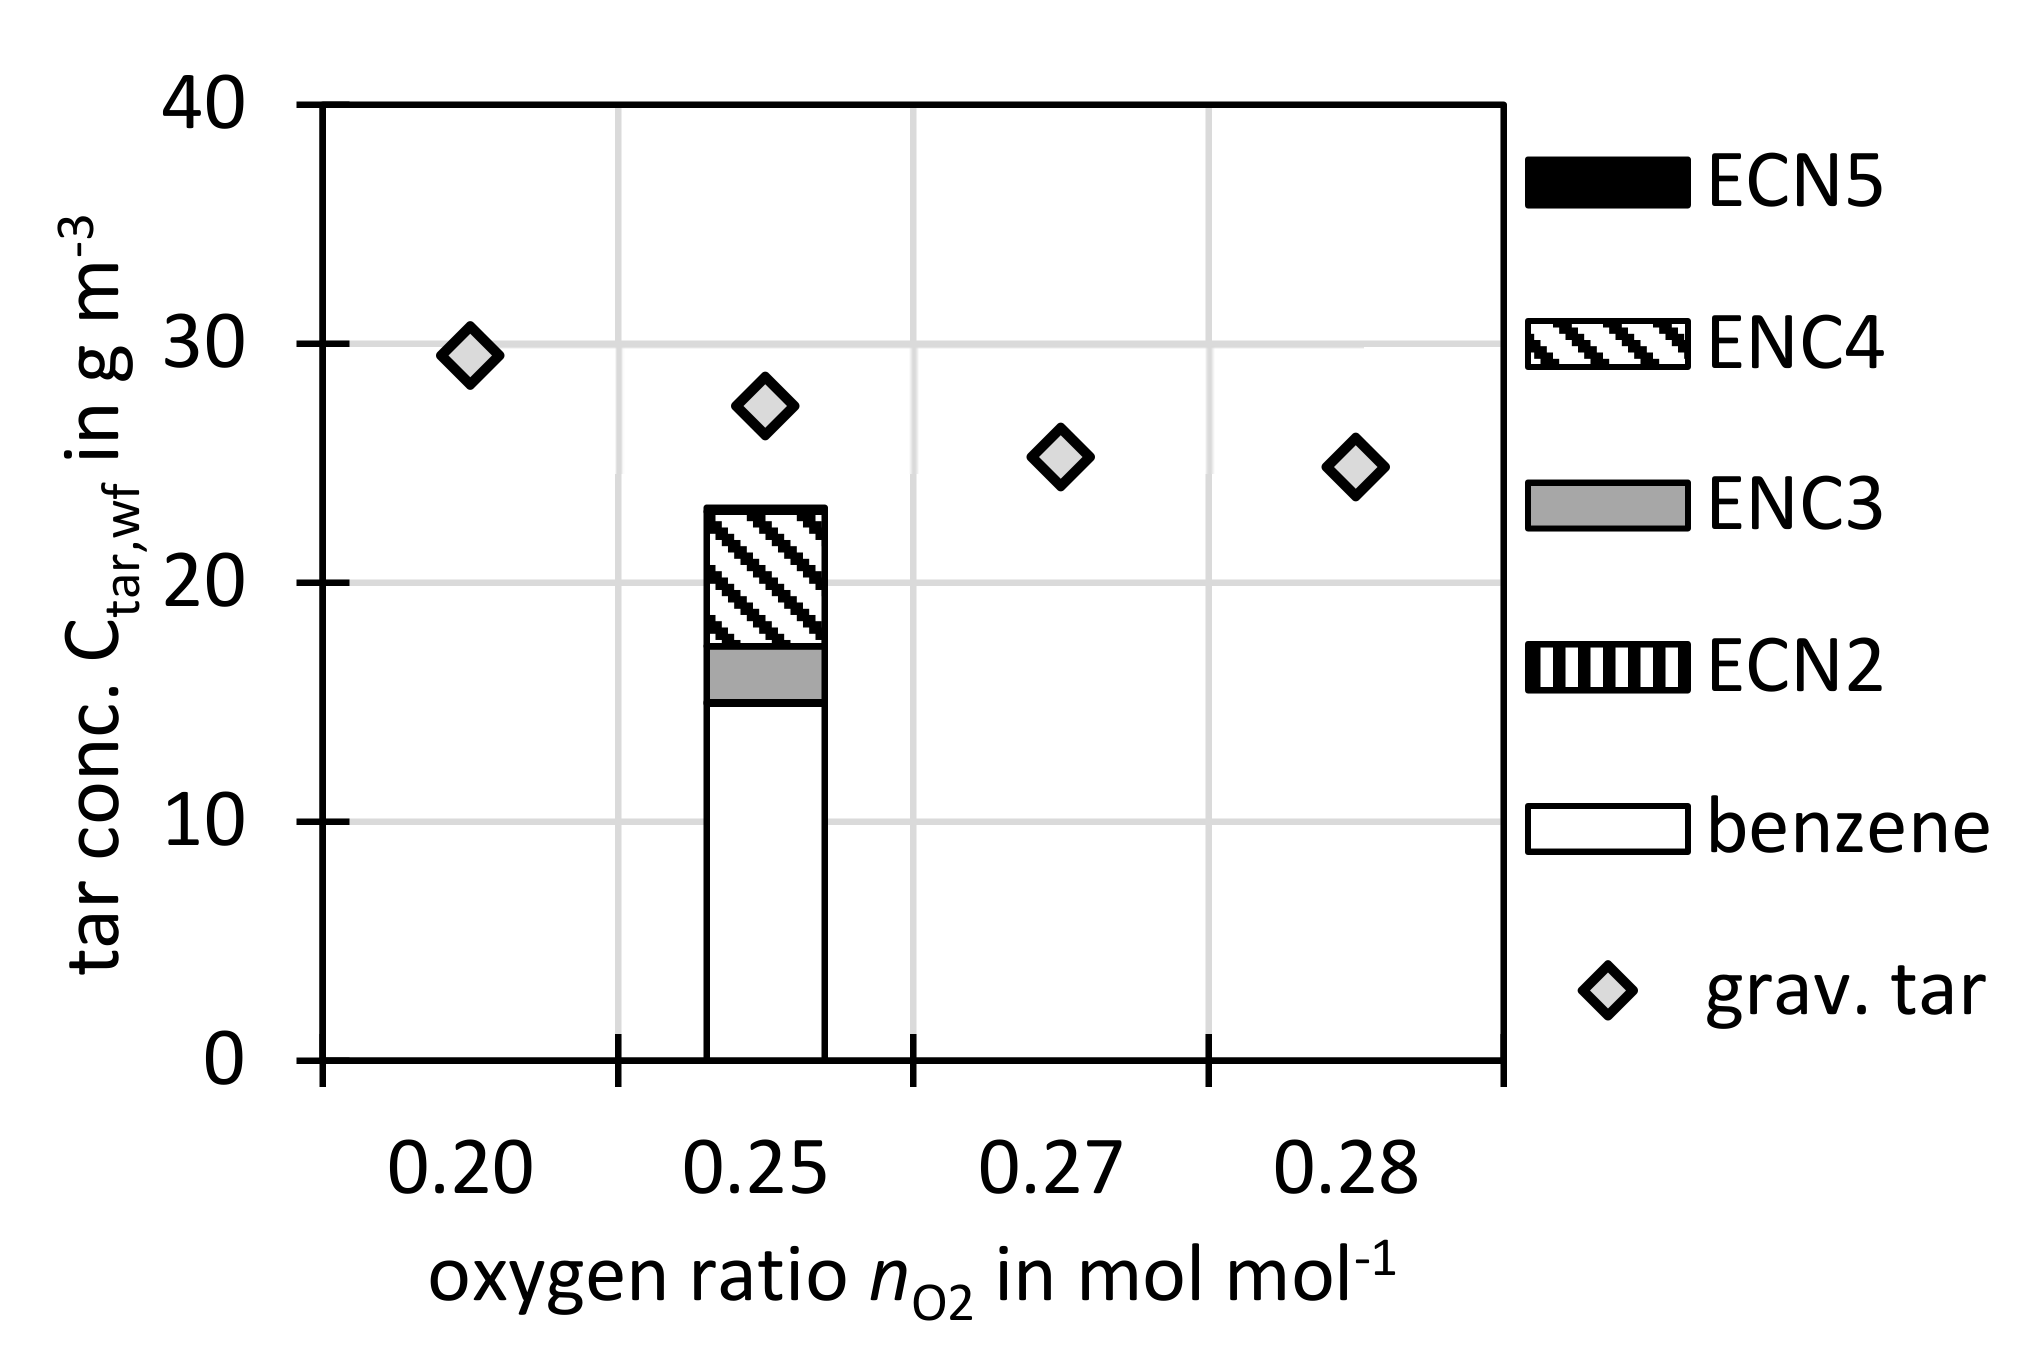
3.2.1. Variation of Oxygen Ratio nO2
Figure 6 shows the influence of the oxygen ratio
nO2 on the tar concentration. The gravimetric tar concentration is dropping slightly with increasing oxygen ratio. This could be related to enhanced tar oxidation. Since due to technical reasons only one GC analysis was performed for this parameter variation, no trend can be observed.
Again, although
nO2 was varied by several researchers [
22,
47,
48,
49], in all found references, other significant parameters such as temperature were altered as well. Therefore, no exclusive variation of
nO2 was found in the literature. This study can thus at least shed some light on the behaviour of gravimetric tar concentration at different
nO2.
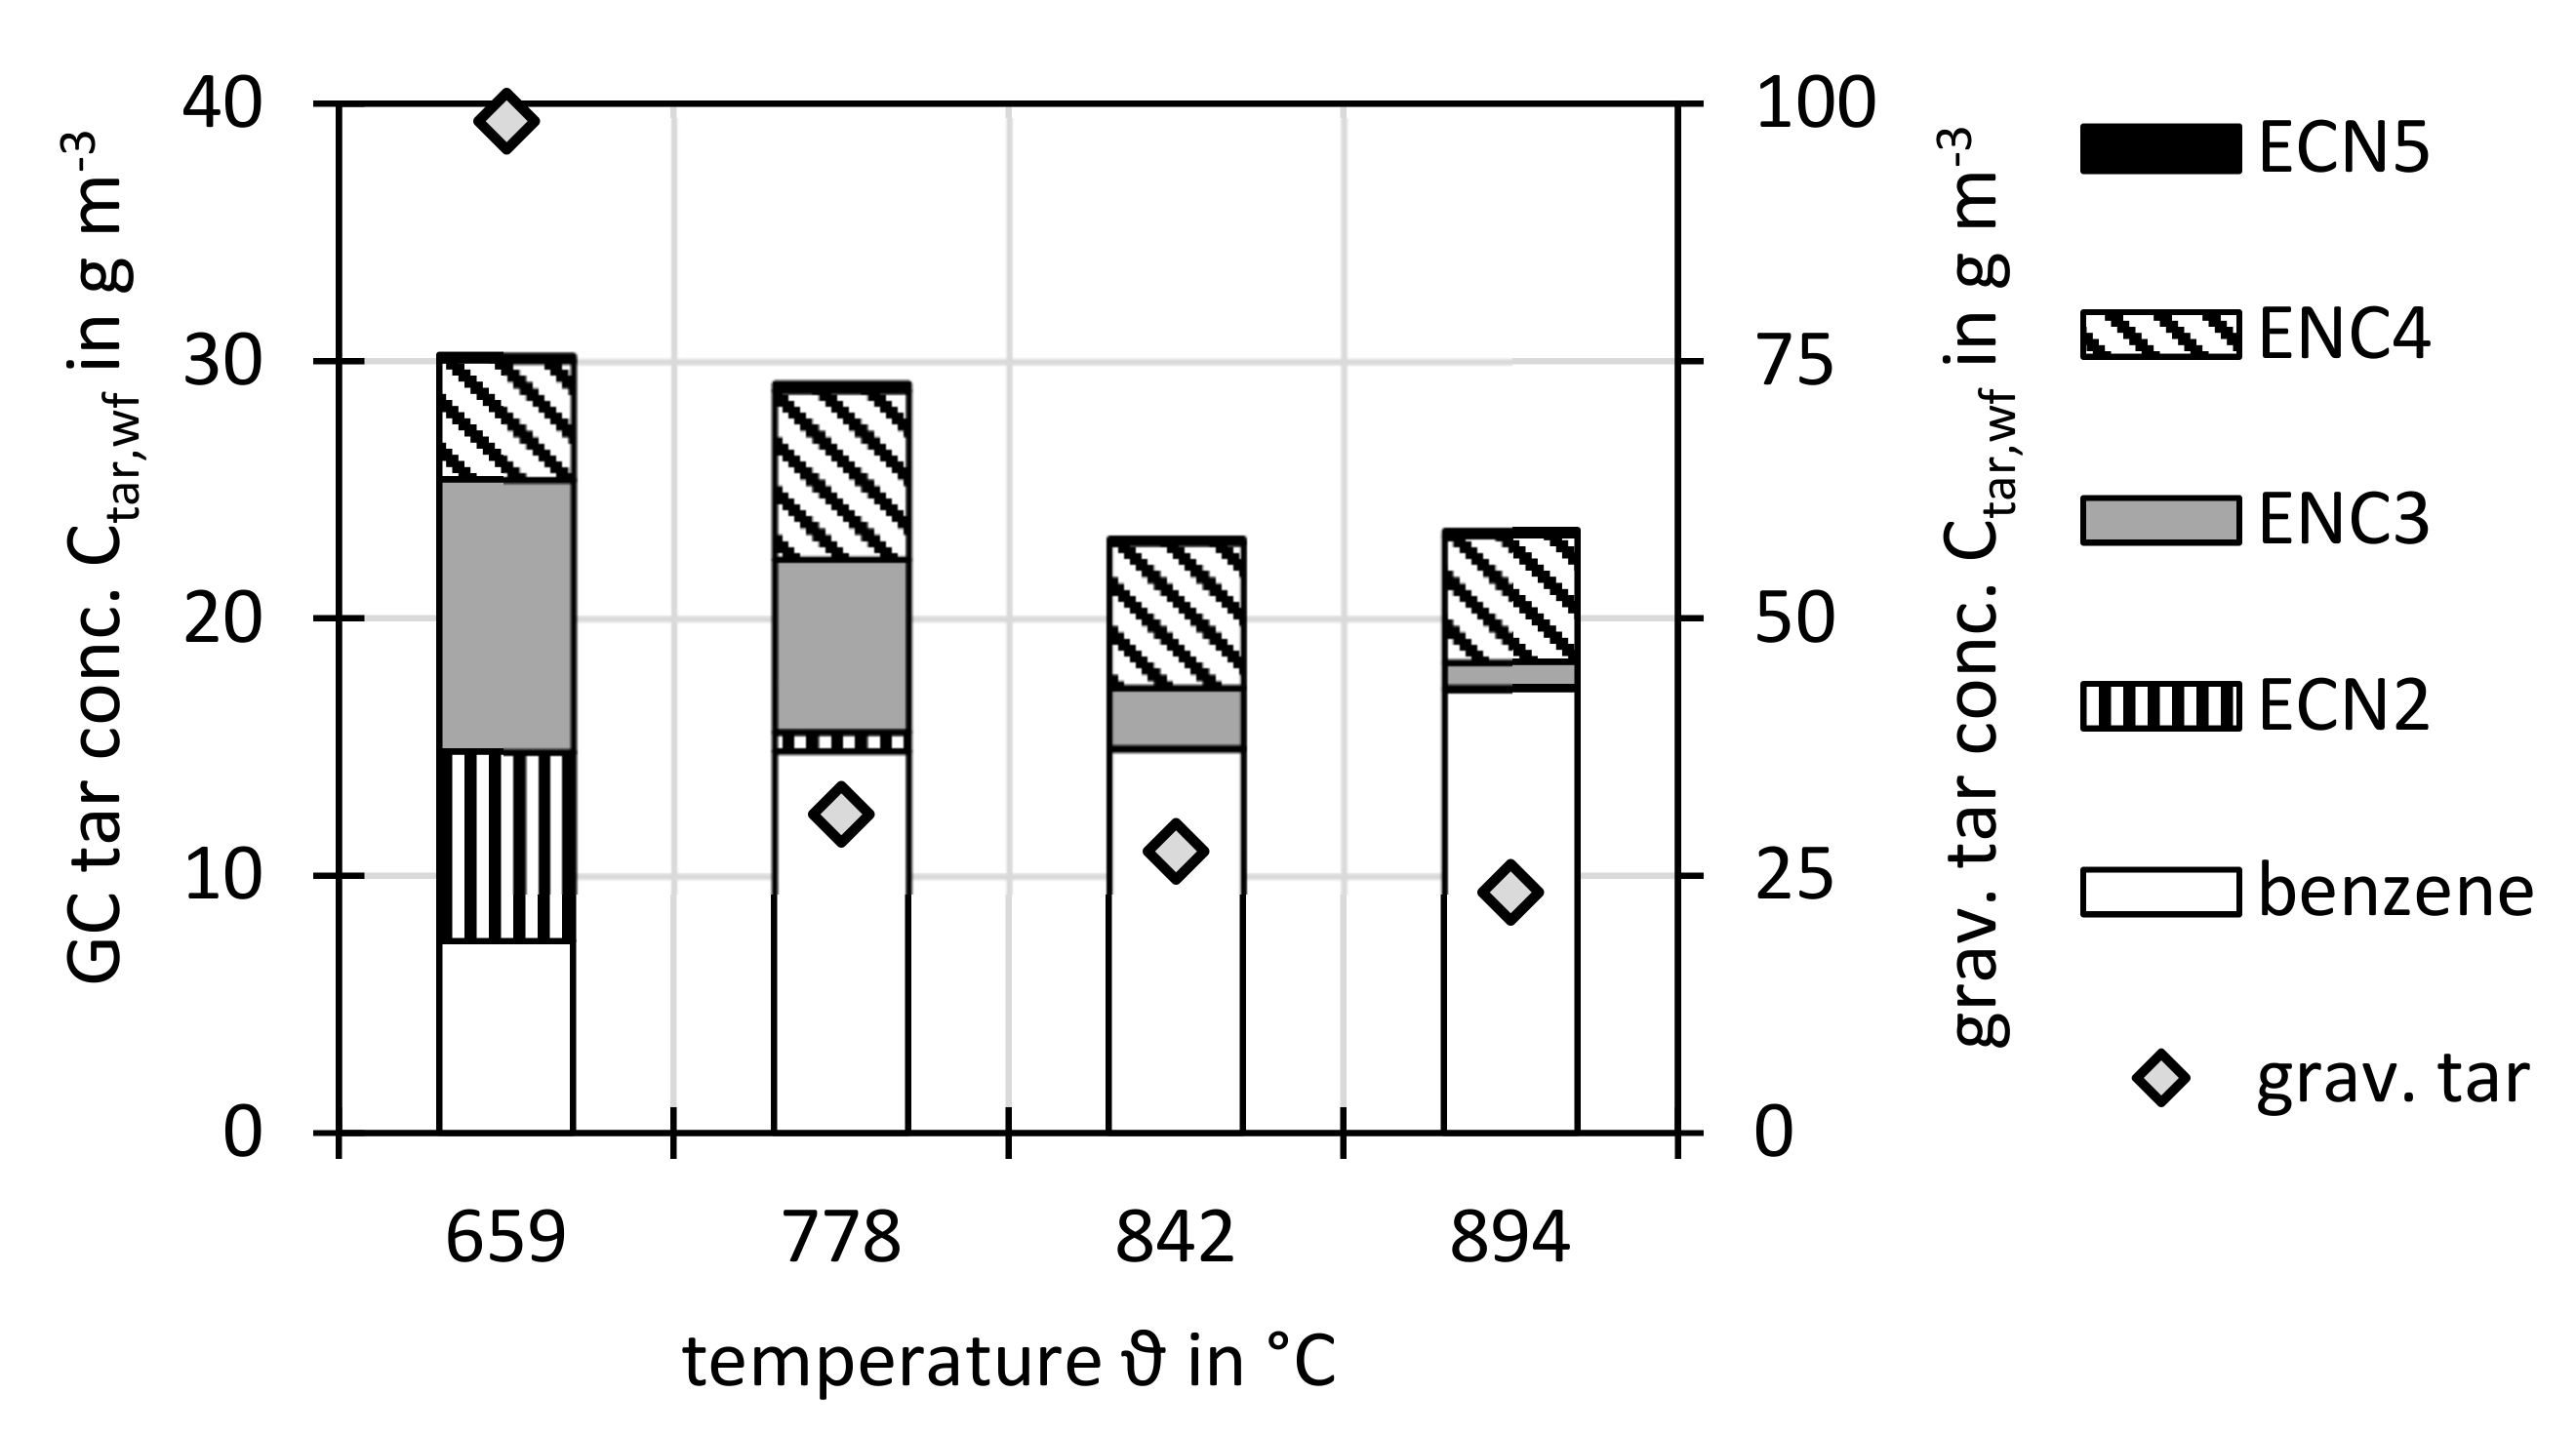
3.2.2. Variation of Temperature ϑ
Figure 7 shows the tar concentration at different gasification temperatures
ϑ. At the 659 °C a very high gravimetric tar concentration of 98 g m
−3 was measured. When the temperature was increased to 778 °C the concentration drastically dropped to 31 g m
−3. With further temperature increase, the gravimetric tar concentration steadily dropped to 27 g m
−3 and 21 g m
−3 for 842 °C and 894 °C, respectively. As known [
55], at low gasification temperatures, considerable fractions of the fuel are not converted into small molecules, but form large tar molecules which are detected well by gravimetric analysis. At higher temperatures those gravimetric tars are cracked or reformed into smaller tar species or into permanent gases.
The total GC tar concentration was 31 g m−3 at 659 °C. When the temperature was increased, the GC tars were found to be decreasing slightly but steadily to 23 g m−3 at 894 °C. It has to be noted that the concentration of tar species from ECN2 and ECN3 classes decreased severely with temperature, while benzene is increasing.
In the literature, overall similar behaviour is reported [
22,
47,
52,
56,
57,
58,
59].
3.2.3. Variation of Steam to Carbon Ratio nSC
Figure 8 shows the tar concentrations against steam to carbon ratio
nSC, where a decrease of the gravimetric tar concentration with increasing
nSC was observed. This could be due to the known [
55,
60] effect of higher steam concentrations on reforming of gravimetric tars. The GC tars stayed rather constant over
nSC. This corresponds well to other gasification experiments where higher steam concentrations also reduced tar concentrations [
22,
60,
61].
3.2.4. Variation of Weight Hourly Space Velocity nWHSV
Figure 9 shows the tar concentration against the weight hourly space velocity
nWHSV. For the gravimetric tars no clear trend was observed. It also has to be noted that the point at
nWHSV = 1.3 h
−1 was conducted with a higher fuel mass flow of around 14 kg h
−1 compared to around 7 kg h
−1 (see
Table 4) for the other points. Despite that, the tar concentration for the points at
nWHSV = 1.2 h
−1 and 1.3 h
−1 were found to be similar.
When comparing the two gravimetric tar concentrations lower nWHSV with the two ones at higher nWHSV, a decrease can be seen. For the GC tars no trend is visible. However, a more comprehensive study is needed to fully assess the influence of nWHSV on tar concentration.
In literature [
15] for steam-air gasification it was reported that tar concentration is slightly increased with higher “turnover rate” respective higher
nWHSV. For steam gasification, [
56] found slightly increased gravimetric tar yields but constant GC tar yields for increasing
nWHSV which is consistent with this work.
3.2.5. Gravimetric Tar Composition and Heating Value
For some runs, the gravimetric tar sample was retrieved after the completed gravimetric analysis and analysed.
Figure 10 shows the elemental composition of gravimetric tars. It can be seen that the carbon mass fraction is only around 0.5 kg kg
−1 compared to up to 0.87 kg kg
−1 for tar from wood [
14]. Also, significant amounts of S, N, and Cl were found in sewage sludge gravimetric tar in this study. It is therefore assumed that, when applied for sewage sludge derived syngas, the gravimetric analysis does not only sample typical tar species (e.g., PAH), but also salts like NH
4Cl, (NH
4)
2CO
3, and (NH
4)
2SO
4 that are formed from NH
3, HCl, and H
2S which are present in high concentrations in the syngas. This hypothesis is supported by the measured higher heating value of the gravimetric tars, which were found to be around 25 MJ/kg and are thus around 40% below the heating value of a typical gravimetric tar species (e.g., naphthalene 40 MJ kg
−1).
3.3. H2S and COS Concentration
In this chapter the concentrations of the gaseous sulfur species H2S and COS are discussed.
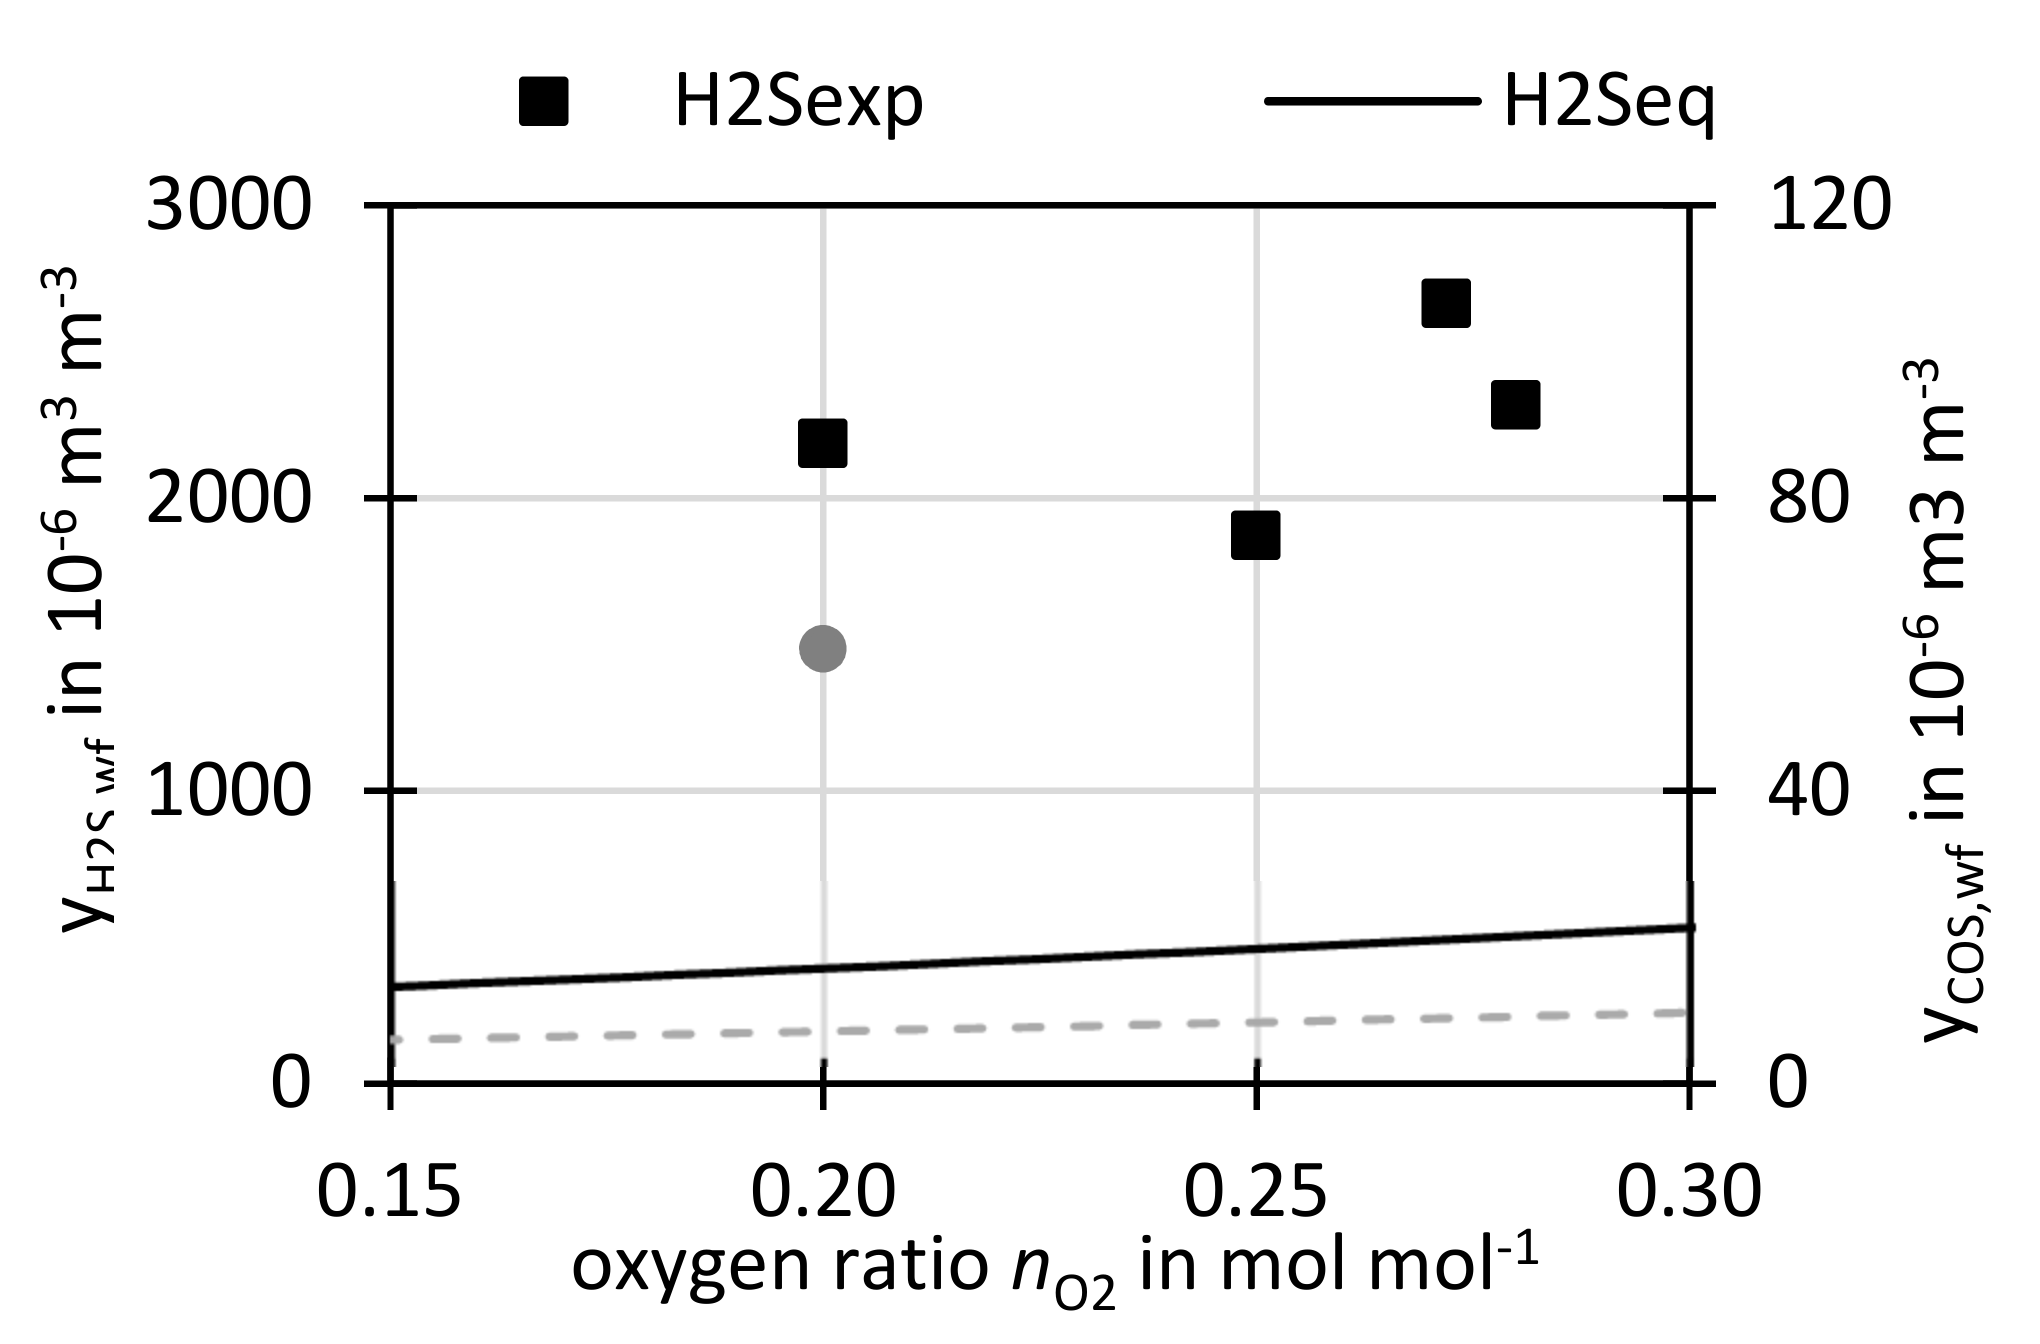
3.3.1. Variation of Oxygen Ratio nO2
Figure 11 shows the measured H
2S and COS concentrations as well as the equilibrium concentrations, calculated with FactSage
® (see
Section 2.6), over the oxygen ratio
nO2. All concentrations are presented in water free (wf) and N
2-free basis. For oxygen ratios from 0.20 to 0.28, H
2S concentrations between 2000 × 10
−6 m
3 m
−3 and 3000 × 10
−6 m
3 m
−3 were measured at the respective conditions of 847 ± 5 °C. From the measurements of this work, it is hard to deduct a specific trend for H
2S, but it can be noted that the two points at higher
nO2 show slightly higher concentrations. For COS only one measurement was performed of 60 × 10
−6 m
3 m
−3 at
nO2 = 0.2 mol mol
−1.
The equilibrium predicts a slight increase of H2S and COS concentration with nO2. This is related to higher feed of oxygen to the gasifier at higher nO2, leading to the formation of H2O and CO2. This drives Equations (5) and (6) away from sulfur capture following Le Chatelier’s principle.
3.3.2. Variation of Temperature ϑ
Figure 12 shows the H
2S concentration and
Figure 13 the COS concentration at different temperatures for cases with the reference bed material, sewage sludge ash, but also for runs with limestone additive. Additionally, the H
2S and COS concentrations in the thermochemical equilibrium, calculated by the software FactSage
® as described
Section 2.6 are shown.
A strong dependence of the concentration of the two sulfur species on the temperature could be observed in the experiment as well as in the equilibrium calculations. At low temperatures high concentrations of up to 7653 × 10−6 m3 m−3 for H2S and up to 215 × 10−6 m3 m−3 for COS were measured with sewage sludge ash as bed material. With increasing temperatures the H2S and COS concentrations were decreasing until a minimum was reached before the concentration increased again at higher temperatures. This is related to the facts, that sewage sludge ash contains CaO which is can capture sulfur through reactions Equations (5) and (6) which are exothermic and therefore favored at lower temperatures. However the calcination reaction (Equation (4)) is favored at higher temperatures. The overlay of calcination and sulfur capture leads to the here seen temperature dependency.
For the case with limestone additive, a similar trend was observed but consequently lower concentrations were measured. The equilibrium has a similar trend as the experiments, but shows for all cases lower concentrations, which is in agreement with the fact that the equilibrium predicts optimal sulfur capture and thus the lowest possible concentration. The lowest measured concentration without limestone additive was 1855 × 10−6 m3 m−3 at 778 °C and with limestone additive the lowest concentration was 624 × 10−6 m3 m−3 at 770 °C. With the limestone additive the H2S concentration could thus be reduced by around factor 3 at these temperatures. The absolute equilibrium minimum is was calculated for 740 °C with 243 × 10−6 m3 m−3.
For COS similar behavior was observed, at 770 °C–778 °C the concentration for sewage sludge ash bed is 40 × 10−6 m3 m−3, with limestone additive it is reduced to 13 × 10−6 m3 m−3, also by factor 3. The COS minimum equilibrium concentration was calculated for 740 °C with 6 × 10⁻⁶ m3 m−3.
As said, with further increasing temperatures the measured and equilibrium H
2S and COS concentrations are rising again. At the reference temperature of 840 °C, which is also a very common temperature to operate sewage sludge incinerators and gasifiers [
62], slightly higher concentrations of H
2S with 1873 × 10
−6 m
3 m
−3 and COS of 59 × 10
−6 m
3 m
−3 were observed without additive. Again, the limestone additive brings a reduction. It was noticed that, with limestone additive, the COS concentrations can be brought very close to the equilibrium for all investigated temperatures above 750 °C, while for H
2S, the concentrations with additive still have some distance to the equilibrium.
In literature [
34,
43], similar trends of H
2S concentrations over temperature in the presence of CaO were also reported in experiments and equilibrium calculations.
3.3.3. Variation of Steam to Carbon Ratio nSC
Figure 14 shows the H
2S and COS concentrations for different steam to carbon ratios
nSC. The measured H
2S concentrations increased with
nSC. The lowest S/C ratio tested was 0.6 mol mol
−1 which lowered the H
2S concentration to 1340 × 10
−6 m
3 m
−3. A similar trend was found by [
34]. This follows well the trend of the equilibrium where the H
2S concentrations are increasing with
nSC following Le Chatelier’s principle: With higher
nSC, more steam is introduced into the gasifier, driving Equation (5) to the left towards less H
2S capture.
The measured COS concentration stayed on the same level throughout the nSC variation, whereas the equilibrium predicts a very small increase. Since steam is not present in Equation (6), nSC has no direct effect on COS capture. However through the water gas shift reaction, steam addition also produces more CO2 influencing the COS capture.
Additionally, the equilibrium for 750 °C is shown since sulfur capture is maximized at this temperature. It can be seen that, at operation conditions of 750 °C and low nSC, very low concentrations are achievable according to the equilibrium.
In literature [
34,
43], similar trends of H
2S concentrations over
nSC in the presence of CaO were also reported in experiments and equilibrium calculations.
3.3.4. Variation of Weight Hourly Space Velocity nWHSV
Figure 15 shows the H
2S and COS concentration at different fuel space velocities
nWHSV. For the measured values, no specific trend could be observed. Since the equilibrium already assumes infinite residence time of the fuel, it cannot produce trends of the space velocity and thus a constant equilibrium concentration is shown.
3.4. NH3 Concentration
Figure 16 shows the measured NH
3 concentrations in the syngas with respect to different operation conditions. As indicated above, NH
3 was measured wet chemically. Therefor these measurements were not performed for every experimental point. Due to the limited points, it is not always possible to deduct a clear trend, therefore further studies with more comprehensive NH
3 analysis are needed.
For most runs, NH3 concentrations of between 4000 × 10−6 m3 m−3 and 8000 × 10−6 m3 m−3 were measured. However, for runs with lower ϑ or with higher nSC higher NH3 concentrations of up to 15,000 × 10−6 m3 m−3 were measured.
It can be concluded that NH
3 is present in considerable concentrations in sewage sludge derived syngas, which is clearly related to the high nitrogen content in the fuel. Other research also shows high NH
3 concentration for high N-containing fuels such as sewage sludge [
14,
52], manure [
52], peat [
26], or coal [
63]. It has to be noted that steam-oxygen gasification seams to show considerably lower NH
3 concentration than steam gasification [
52] in the same facility at IFK University of Stuttgart. Literature also reports decreasing NH
3 concentrations with increasing temperature, which is in line with this study [
64].
3.5. Ash Yields and Carbon Contents
Depending on the process design, different kinds of ash streams are produced and are usually divided in bed ash and fly ash. Carbon contained in ashes leaves the reactor ungasified and therefore reduces the conversion efficiency of the process.
3.5.1. Bed Ash
In the used research facility as well as in some commercial sewage sludge gasifiers [
65], the bed ash is the main ash stream since granular dried sludge is used as fuel. The bed ash is therefore also serving as bed material. Since constantly new bed ash is produced, it is discharged continuously over an overflow. In this work, the bed ash had a particle size of
dp,50 = 520 µm and was only slightly smaller than the used fuel (see [
14] for detailed particle distribution).
The bed ash yield per dry fuel is around 0.41 kg/kg as calculated from the difference of the fuels ash content (proximate analysis
Table 1) and the measured fly ash yields (
Table 6). The carbon content of the bed material after discharge from the reactor was around 0.017 kg/kg at a reference gasification temperature of 850 °C however for lower temperature the carbon content was found to be higher up to 0.04 kg/kg at 668 °C (
Table 7).
3.5.2. Fly Ash
Smaller sized fuel particles, dust produced by attrition in the bed or soot formed by fuel conversion are entrained from the fluidized bed and are considered fly ash. As described in
Section 2.2, this fly ash is in the used research facility captured by a primary cyclone, a secondary cyclone and a ceramic candle filter. The yields of the respective fly ash fractions for the reference run (
nO2 = 0.25,
ϑ = 842,
nSC = 1.05 mol mol
−1) are
Yash,prim.cyclone = 0.051 kg kg
−1,
Yash,sec.cyclone = 0.008 kg kg
−1 and
Yash,filter = 0.003 kg kg
−1. It can be seen that the majority of the fly ash is separated by the primary cyclone.
In
Table 7, the fly ash yield and the carbon mass fraction are shown for different runs, wherein all respective fly ash fractions (prim. cyclone, sec. cyclone, filter) have been cumulated. It can be seen that the fly ash yield per fuel mass is for all presented runs between 0.059 kg kg
−1 and 0.072 kg kg
−1. The carbon mass fraction of the fly ash varied between 0.047 kg kg
−1 and 0.110 kg kg
−1 and was found to be dependent on gasification temperature.
3.6. Ash Main Elements and Heavy Metal Content
Table 8 shows the main elemental analysis of the ash fractions of the reference run. It can be seen that the elemental composition for all ash fractions was similar. The major components of the ash were calcium, silica, phosphorous, aluminium and iron. These elements originated from the mineral content of waste water and additives for phosphorous precipitation. Due to the high phosphorous content, the ash can be used as fertilizer if it fulfils the respective regulations or as raw material for industrial fertilizer production.
Table 9 shows the heavy metal concentration in dry sewage sludge and the ash fractions from the gasification experiments. Also the German legal limits for fertilizers [
66] in general and specifically for the deployment of sewage sludge as fertilizer [
67] are given. It can be seen that the used dry sewage sludge already fulfils the legal limits for all components except Thallium. Depending on the species, the concentration of the heavy metals in the ashes are different to those of the sewage sludge. For more volatile elements such as Cd, Pb and Tl, the concentration in the bed ash is reduced compared to the sewage sludge, but these elements are found again in the fly ashes with increased concentrations. It is gratifying, that the bed ash is therefore, compared to sewage sludge, depleted of Cd, Hg, Tl and has reduced Pb concentrations. The bed ash fulfils all legal limits except of Nickel, however the high Ni concentrations of the bed ash are assumed to come from the high temperature steel pipe of the reactor and are not attributed to the Ni present in the sewage sludge. Since in industrial plants are refractory lined, the industrial ash is expected to meet the Ni limits. The bed ash is only slightly below the Cu limit, though.
It has to be noted, that in this study only the total value of chrome was measured, but not Cr
VI for which strict limits are imposed [
66]. However, from a commercial air-blown sewage sludge fluidized bed gasifier the heavy metal concentrations of the bed ash were reported, and the Cr
VI concentration was below 0.5 mg kg
−1 and with that below the legal limit [
62]. From this commercial facility also very low concentrations of Cd, Hg and Tl were reported, each below 0.2 mg kg
−1, 0.05 mg kg
−1 and 0.5 mg kg
−1, respectively, and Pb was reported with 20 mg kg
−1. These values correspond well to the findings of this study. The Ni concentration was reported to be much lower in the commercial gasifier, underlining the hypothesis that, in this study, the Ni loading of the ash came from the high temperature steel of the reactor pipe. Arsenic, at 3 mg kg
−1, was reported to be much lower in the commercial gasifier compared to this study, however there could also be differences in the sewage sludge composition, which is not considered in [
62].
3.7. Hydrodynamic Behavior of the Sewage Sludge Ash Bed Material
Overall, the fluidization behaviour of the bed material was good during the experiments. The facility was in operation with sewage for around 25 trial days with each a gasification operation of 4 h to 8 h. In most cases the experimental conditions were varied several times per day to investigate different experimental points. During the majority of the experiments, stable hydrodynamical conditions were reached quickly, visible by a constant pressure drop over the fluidized bed.
However, bed melting and agglomeration have been observed on few occasions for operation points with low superficial fluidization velocity of u0 < 0.2 m s−1 corresponding to u0 umf−1 < 3 and temperatures over 850 °C. In these cases at the beginning stable condition could be reached, but then a rapid temperature rise accompanied with partial bed material melting and agglomeration was triggered by a short interruption of the fuel supply. After that, fluidization was not possible anymore and the agglomerated bed material needed to be removed from the reactor. Such short fuel supply interruptions also occurred at other operation points with higher fluidization velocity, but no negative effect was present there. Leading to the explanation, that after the fuel supply interruption the endothermic effect of the fuel conversion ceased and the further supplied oxygen could exothermally oxidize char and reduced metals (e.g., FeO) in the bed. Due to the low fluidization velocity, the bed was poorly mixed and therefore the temperature could rise above the ash melting temperature locally at the gasifier bottom. The authors therefore advise to always ensure a good bed material mixing by maintaining sufficient fluidization velocity of u0 umf−1 >> 3. However, it is likely that this problem was more prominent in the small electrically heated research reactor than in a bigger industrial facility.
3.8. Carbon Balance
Figure 17 shows the carbon yields for different gasifier temperatures. On the left y-axis, the carbon yield in tars, in bed ash and in fly ash is shown. On the right y-axis, the carbon yield in the syngas main components (CO, CO
2, CH
4, C
xH
y) as well as the total sum of all measured carbon yields is depicted.
The carbon yield in tars was calculated as sum of carbon in gravimetric tars as measured from gravimetric tar concentration (
Figure 7) and its elemental analysis (
Figure 10) as well as the carbon in benzene, toluene and xylene (ECN3 in
Figure 7) taken from the GC analysis. This approach adds the light tars to the gravimetric tars to represent a total tar amount. The carbon yield in tars decreased with temperature, since the tars are thermally cracked at higher temperatures.
The carbon yield in bed ash and fly ash decreased with increasing temperature since more char was gasified, e.g., by the water-gas reaction at higher temperatures due to faster reaction rates.
The carbon yield in the syngas main components increased with temperature, since at higher temperature more char and tar is converted to gases such as CO, CO2, and CH4.
The total carbon yield sum for all shown carbon points are close to 1 kg kg−1, which means that almost the same amount of carbon was found in the products than introduced with the sewage sludge.
4. Conclusions and Outlook
This work offers a comprehensive experimental study of the steam-oxygen gasification of sewage sludge for synthesis gas production in a 20 kW fluidized bed plant. The experimental results can be utilized for process design and to set-up and validate a gasifier model, since product gas, char, tar and impurity yields as well as their dependencies on the operation conditions are presented.
Since the gas yield was enhanced and the tar yield decreased with increasing gasification temperature it can be concluded, that the gasification temperature should be chosen as high as practically feasible (i.e., 850 °C to 900 °C) taking into account the ash melting behavior.
The H2/CO-ratio can be controlled by altering the steam to carbon ratio nSC as steam promotes the water gas shift reaction. It could be shown that the H2/CO-ratio could be tailored to 2 (e.g., for methanol or DME-production) or 3 (for methanation) with a reasonable range of nSC.
In the investigated process, the majority of the ash is received as bed ash. Hazardous cadmium, mercury and thallium, contained in the sewage sludge, is evaporated in the gasification process, therefore the bed ash was found to be free of or very lean in those elements, which is beneficial for the ash application for fertilizer production. Since the sewage sludge ash contains calcium, the majority of the sludge’s sulfur is bound in the bed ash. By adding limestone to the gasifier this sulfur capture is enhanced and the H2S and COS concentrations in the syngas are lowered.
Overall, the steam-oxygen gasification proved to be an efficient and technically feasible process for sewage sludge treatment. The process can play a role in closing the loop for carbon by converting the organic fraction of sewage sludge to carbon-containing bio-fuels or chemicals as well as in closing the loop for phosphorous that can be recovered from the heavy metal lean ash. Therefore, in future, this process can be considered as an alternative to fluidized bed incineration.


