Effect of Sea Buckthorn (Hippophae rhamnoides L.) Mousse on Properties of Probiotic Yoghurt

 ,
,  ,
,  ,
, 
 , and
, and
Abstract
1. Introduction
2. Materials and Methods
2.1. Research Material
2.2. Milk Analysis
Acidity and Basic Composition
2.3. Yoghurt Production
2.4. Yoghurt Analysis
2.4.1. Acidity and Nutritional Value
2.4.2. Sensory Evaluation
2.4.3. Microbiological Evaluation
2.4.4. Microstructure Analysis
2.4.5. FTIR Measurements
2.5. Statistical Analysis
3. Results
3.1. Basic Physico-Chemical Parameters in Milk
3.2. Yoghurts
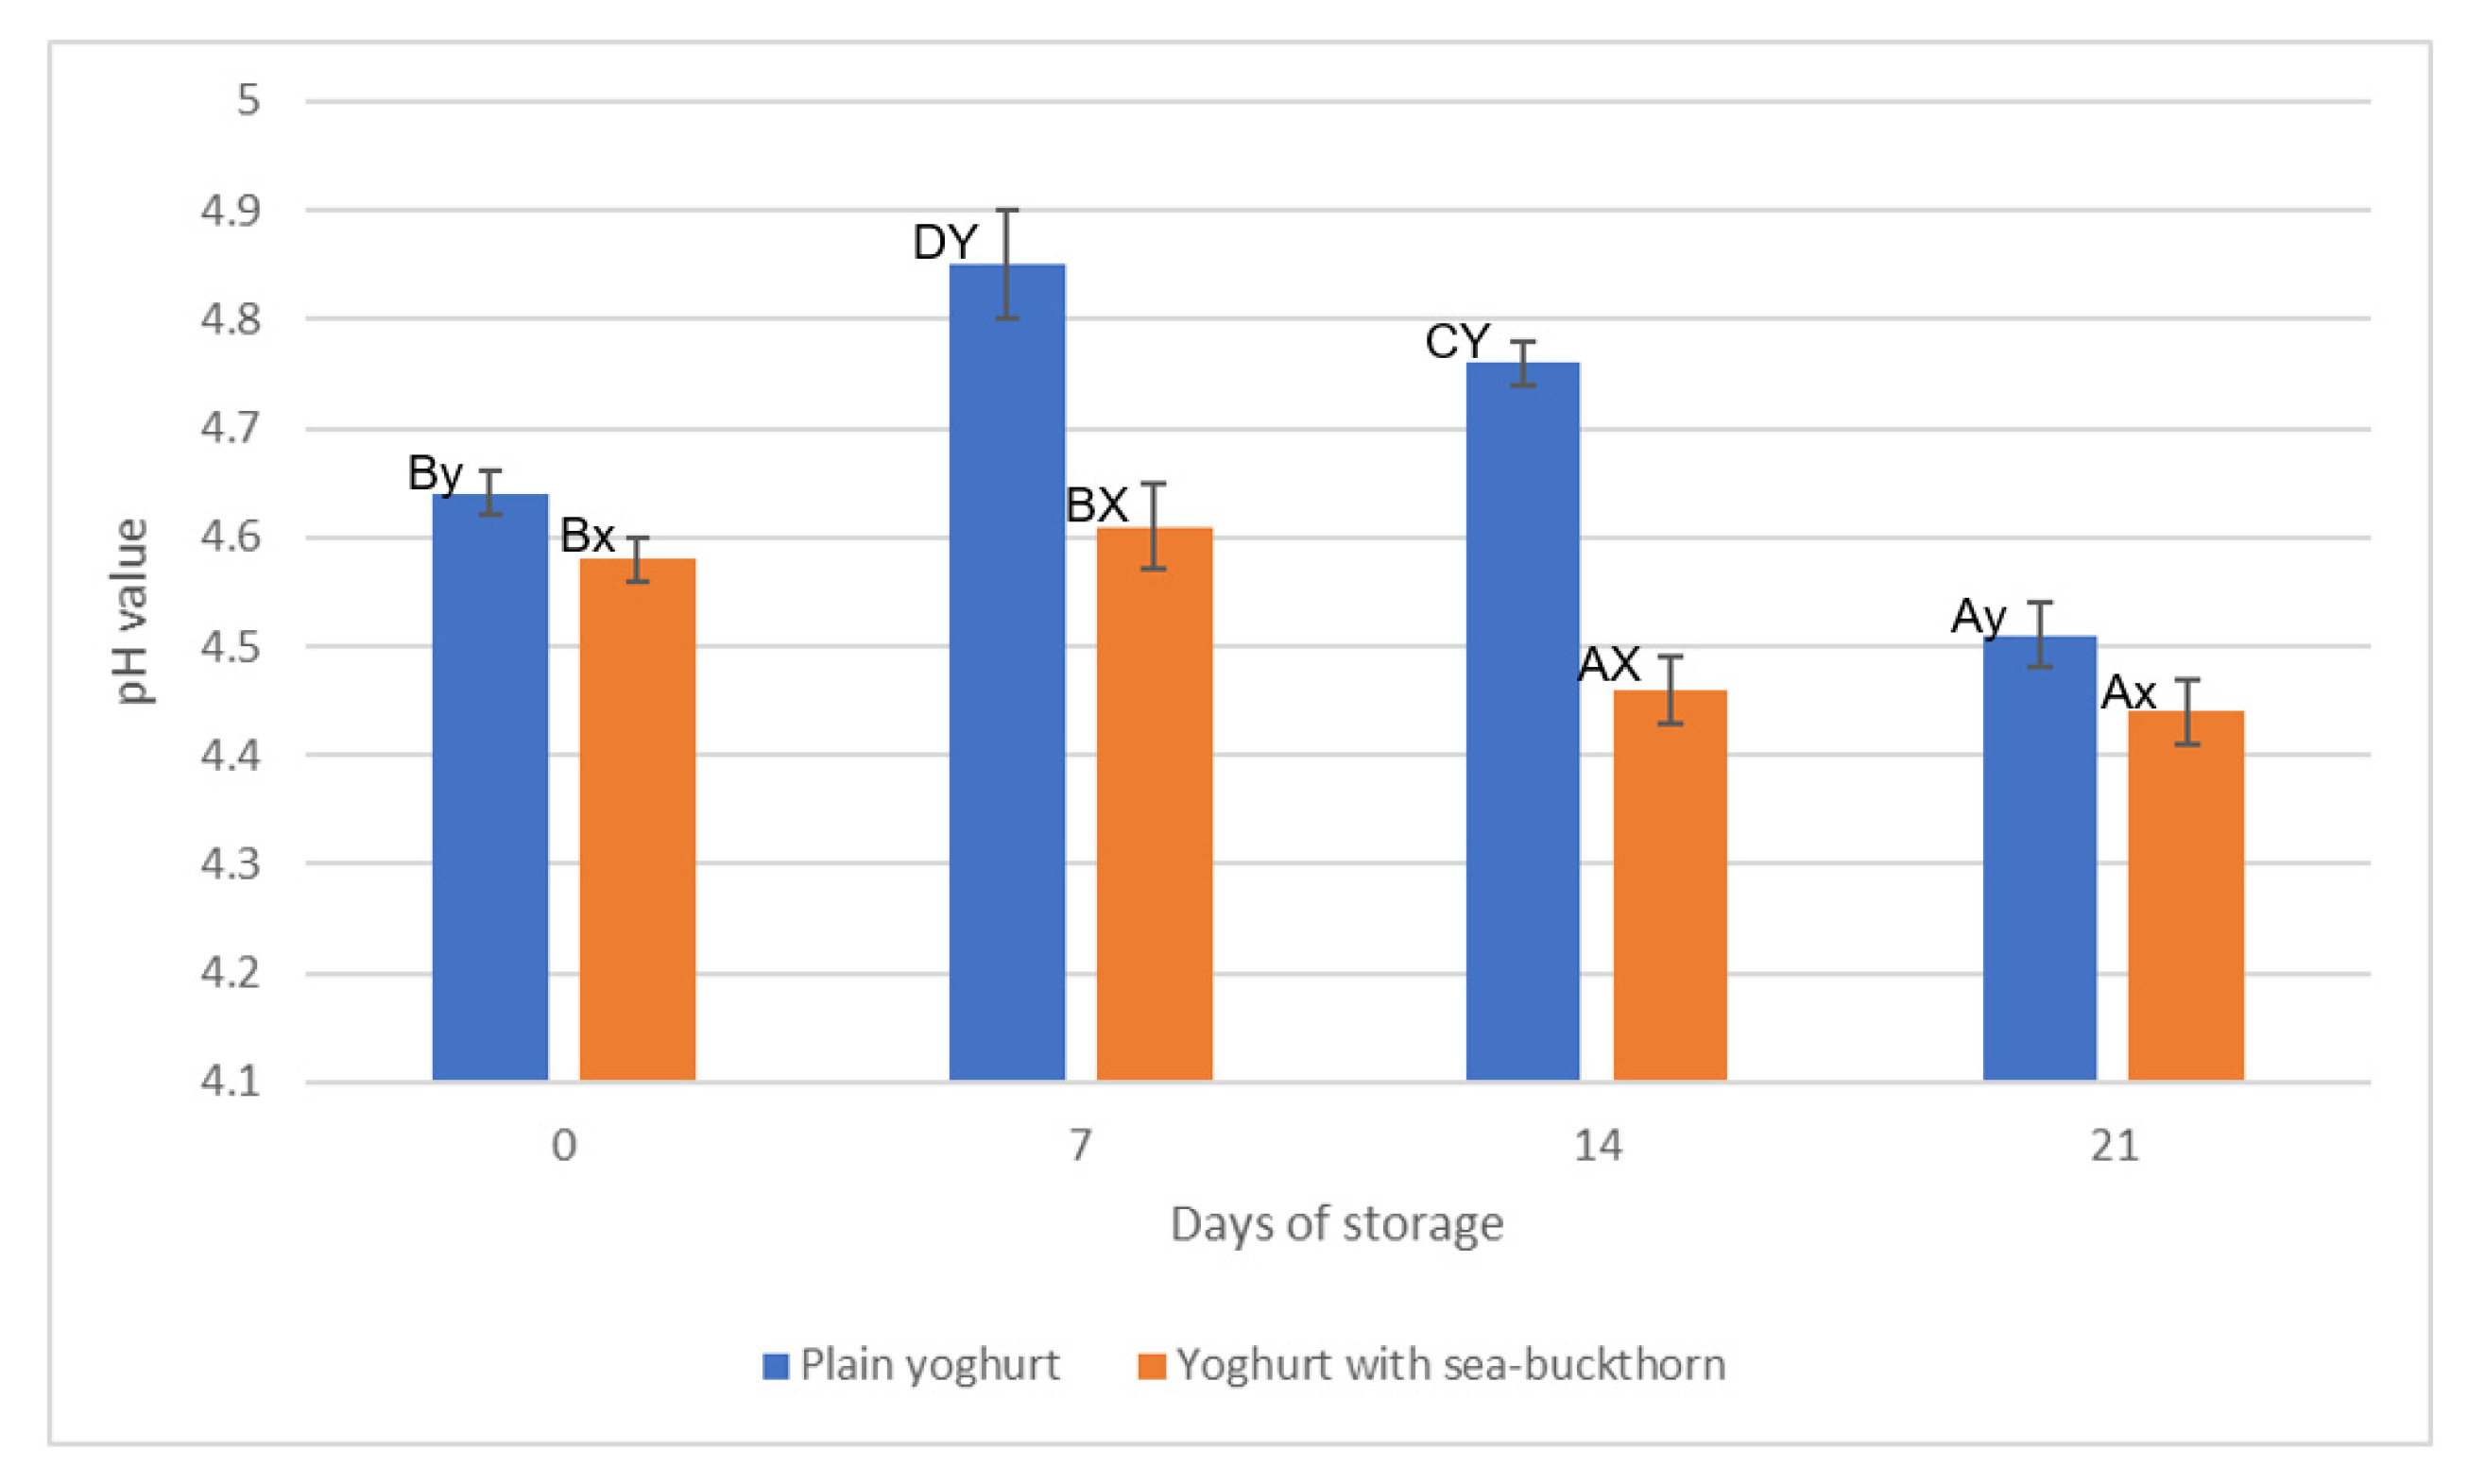
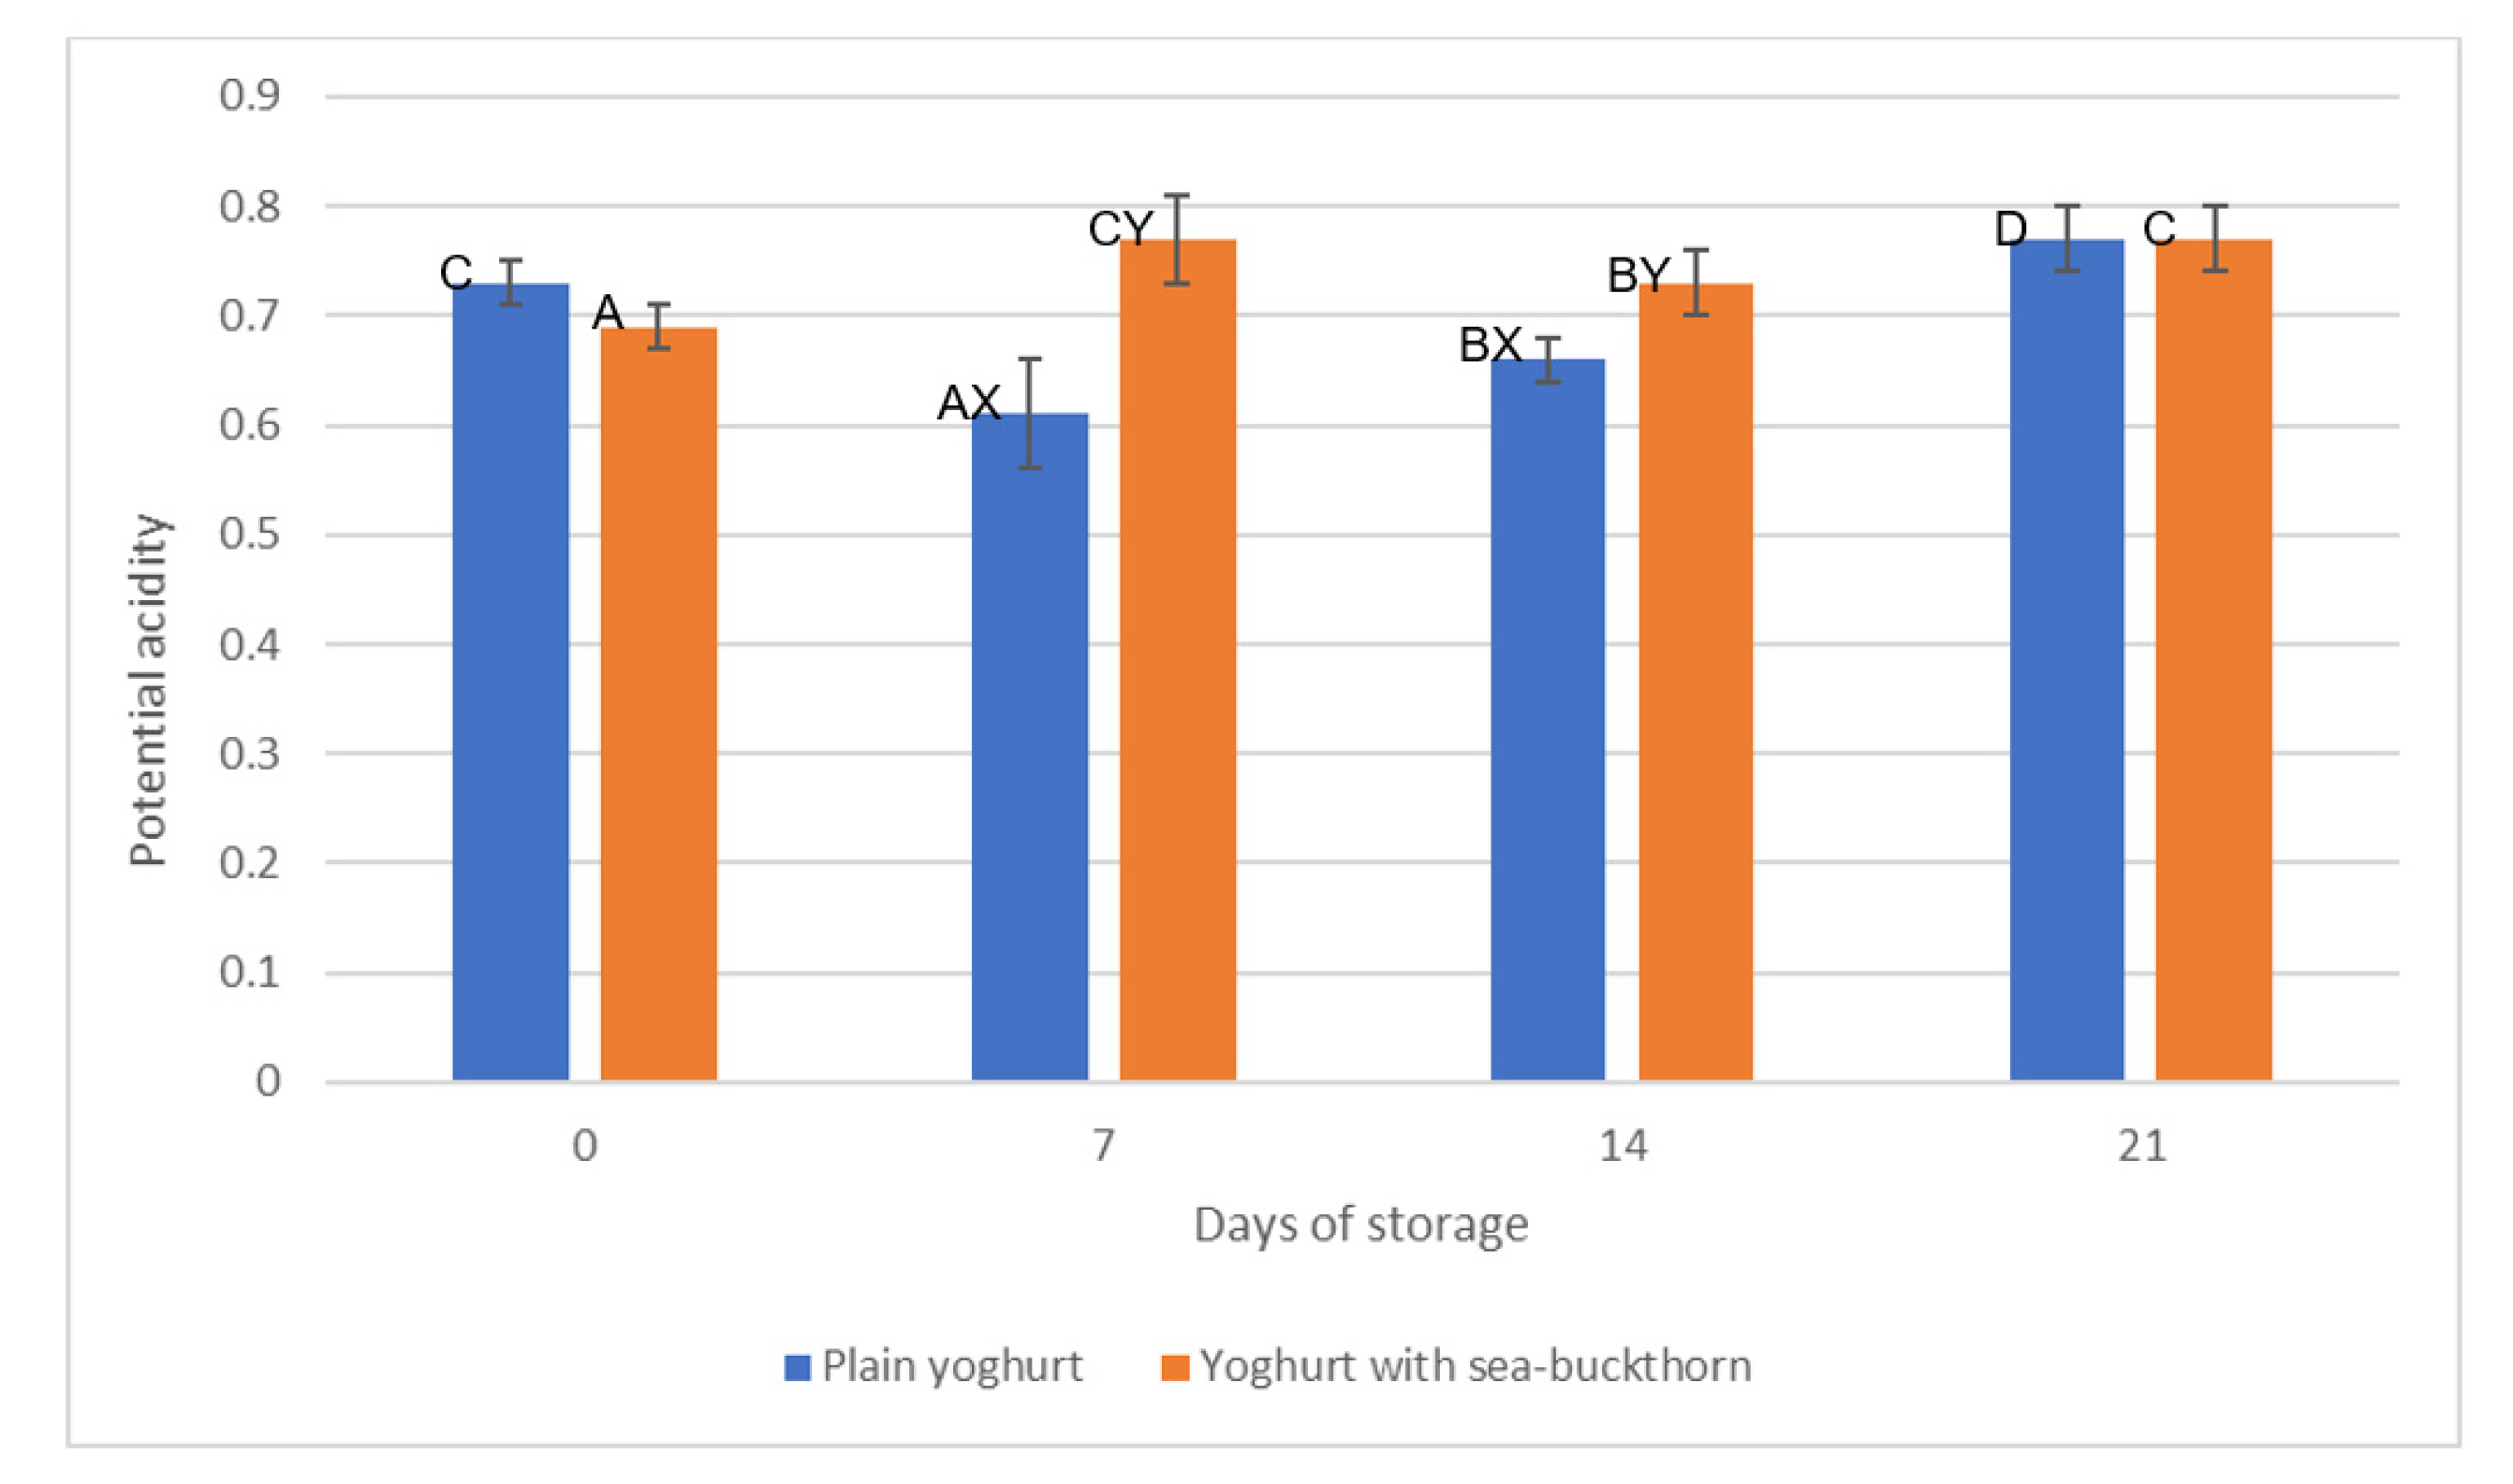
3.2.1. Acidity
3.2.2. Nutritional Value
3.2.3. Sensory Evaluation
3.2.4. Microbiological Evaluation
3.2.5. Microstructure Analysis
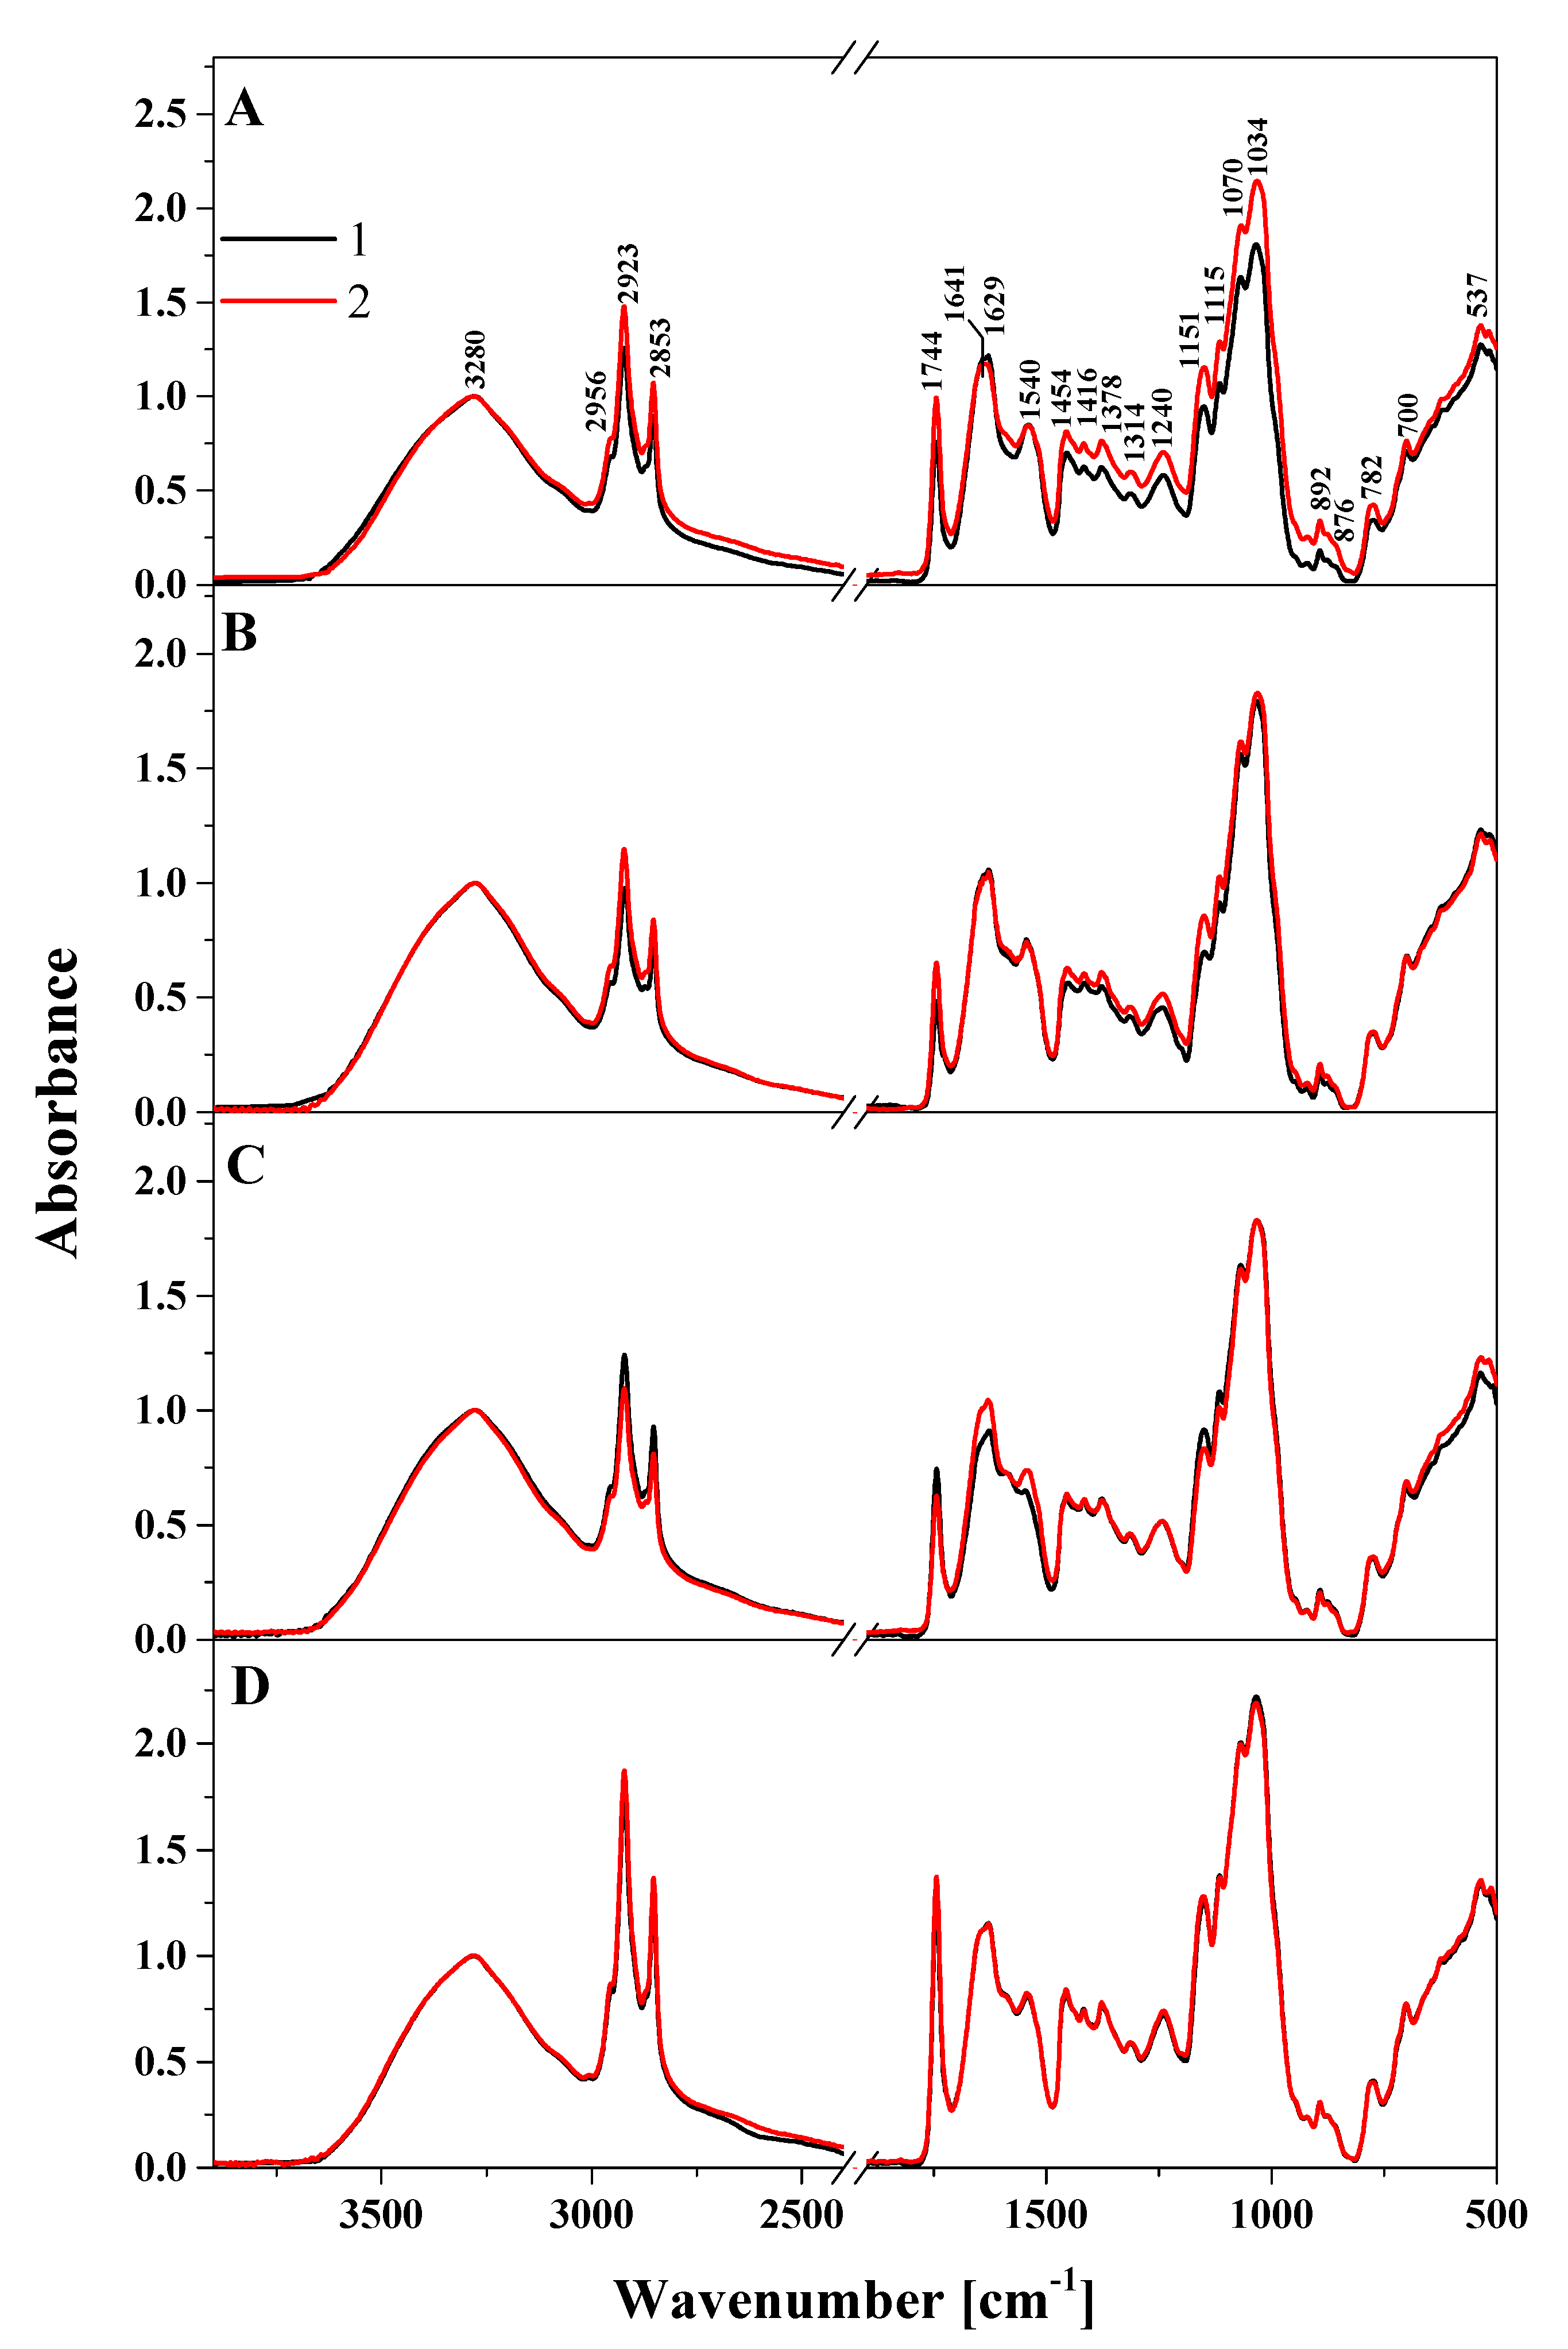
3.2.6. FTIR Measurements
4. Discussion
4.1. Basic Physico-Chemical Parameters in Milk
4.2. Yoghurts
4.2.1. Acidity
4.2.2. Nutritional Value
4.2.3. Sensory Evaluation
4.2.4. Microbiological Evaluation
4.2.5. Microstructure Analysis
4.2.6. FTIR Measurements
5. Conclusions
Author Contributions
Funding
Institutional Review Board Statement
Informed Consent Statement
Data Availability Statement
Conflicts of Interest
References
- Aryana, K.J.; Olson, D.W. A 100-Year Review: Yogurt and other cultured dairy products. J. Dairy Sci. 2017, 100, 9987–10013. [Google Scholar] [CrossRef] [PubMed]
- Granato, D.; Santos, J.S.; Salem, R.D.S.; Mortazavian, A.M.; Rocha, R.S.; Cruz, A.G. Effects of herbal extracts on quality traits of yogurts, cheeses, fermented milks, and ice creams: A technological perspective. Curr. Opin. Food Sci. 2018, 19, 1–7. [Google Scholar] [CrossRef]
- Sarfraz, F.; Farooq, U.; Shafi, A.; Hayat, Z.; Akram, K.; Rehman, H.U. Hypolipidaemic effects of synbiotic yoghurt in rabbits. Int. J. Dairy Technol. 2019, 72, 545–550. [Google Scholar] [CrossRef]
- El-Shafei, S.M.S.; Sakr, S.S.; Abou-Soliman, N.H.I. The impact of supplementing goats’ milk with quinoa extract on some properties of yoghurt. Int. J. Dairy Technol. 2020, 73, 126–133. [Google Scholar] [CrossRef]
- Lucatto, L.N.; da Silva-Buzanello, R.A.; de Mendonça, S.N.T.G.; Lazarotto, T.C.; Sanchez, J.L.; Bona, E.; Drunkler, D.A. Performance of different microbial cultures in potentially probiotic and prebiotic yoghurts from cow and goat milks. Int. J. Dairy Technol. 2020, 73, 144–156. [Google Scholar] [CrossRef]
- FAO/WHO. Codex Alimentarius: Milk and Milk Products. Codex Standard for Fermented Milk; 2011; pp. 6–16. Available online: http://www.fao.org/3/i2085e/i2085e00.pdf (accessed on 27 October 2020).
- Routray, W.; Mishra, H.N. Scientific and technical aspects of yoghurt aroma and taste: A review. Compr. Rev. Food Sci. Food Saf. 2011, 10, 208–220. [Google Scholar] [CrossRef]
- Barros, C.P.; Guimarães, J.T.; Esmerino, E.A.; Duarte, M.C.K.; Silva, M.C.; Silva, R.; Ferreira, B.M.; Sant’Ana, A.S.; Freitas, M.Q.; Cruz, A.G. Paraprobiotics, postbiotics and psychobiotics: Concepts and potential applications in dairy products. Curr. Opin. Food Sci. 2020, 32, 1–8. [Google Scholar] [CrossRef]
- Roobab, U.; Batool, Z.; Manzoor, M.F.; Shabbir, M.A.; Khan, M.R.; Aadil, R.M. Sources, formulations, advanced delivery and health benefits of probiotics. Curr. Opin. Food Sci. 2020, 32, 17–28. [Google Scholar] [CrossRef]
- Champagne, C.P.; Gomes da Cruz, A.; Daga, M. Strategies to improve the functionality of probiotics in supplements and foods. Curr. Opin. Food Sci. 2018, 22, 160–166. [Google Scholar] [CrossRef]
- Hill, C.; Guarner, F.; Reid, G.; Gibson, G.R.; Merenstein, D.J.; Pot, B.; Morelli, L.; Canani, R.B.; Flint, H.J.; Salminen, S.; et al. The International Scientific Association for Probiotics and Prebiotics consensus statement on the scope and appropriate use of the term probiotic. Nat. Rev. Gastroenterol. Hepatol. 2014, 11, 506–514. [Google Scholar] [CrossRef]
- Herrero-Barbudo, M.C.; Granado-Lorencio, F.; Blanco-Navarro, I.; Olmedilla-Alonso, B. Retinol, α- and γ-tocopherol and carotenoids in natural and vitamin A- and E-fortified dairy products commercialized in Spain. Int. Dairy J. 2005, 15, 521–526. [Google Scholar] [CrossRef]
- Brodziak, A.; Król, J.; Litwińczuk, Z.; Florek, M. Bioactive compound levels and sensory quality of partially skimmed organic yoghurts: Effects of the milk treatment, production season and starter culture. Int. J. Dairy Technol. 2020. [Google Scholar] [CrossRef]
- Mojka, K. Characteristics of fermented milk drinks. Probl. Hig. Epidemiol. 2013, 94, 722–729. [Google Scholar]
- Glibowski, P.; Rybak, P. Rheological and sensory properties of stirred yoghurt with inulin-type fructans. Int. J. Dairy Technol. 2016, 69, 122–128. [Google Scholar] [CrossRef]
- Kushkevych, I.; Kotrsová, V.; Dordević, D.; Buňková, L.; Vítězová, M.; Amedei, A. Hydrogen sulfide effects on the survival of Lactobacilli with emphasis on the development of inflammatory bowel diseases. Biomolecules 2019, 9, 752. [Google Scholar] [CrossRef]
- Savaiano, D.A. Lactose digestion from yogurt: Mechanism and relevance. Am. J. Clin. Nutr. 2014, 99, 1251S–1255S. [Google Scholar] [CrossRef] [PubMed]
- Liu, D. Effect of Fuzhuan brick-tea addition on the quality and antioxidant activity of skimmed set-type yoghurt. Int. J. Dairy Technol. 2018, 71, 22–33. [Google Scholar] [CrossRef]
- Mercan, E.; Sert, D.; Karakavuk, E.; Akin, N. Effect of different levels of grapeseed (Vitis vinifera) oil addition on physicochemical, microbiological and sensory properties of set-type yoghurt. Int. J. Dairy Technol. 2018, 71, 34–43. [Google Scholar] [CrossRef]
- Yildiz, E.; Ozcan, T. Functional and textural properties of vegetable-fibre enriched yoghurt. Int. J. Dairy Technol. 2019, 72, 199–207. [Google Scholar] [CrossRef]
- Gut, M.; Gasik, A.; Mitek, M. Sea buckthorn—A plant like a pharmacy. Przem. Spoż. 2008, 6, 36–38. [Google Scholar]
- Ting, H.C.; Hsu, Y.W.; Tsai, C.F.; Lu, F.J.; Chou, M.C.; Chen, W.K. The in vitro and in vivo antioxidant properties of seabuckthorn (Hippophaë rhamnoides L.) seed oil. Food Chem. 2011, 125, 652–659. [Google Scholar] [CrossRef]
- Banach, K.; Rutkowska, B.; Glibowski, P. Polska “super żywność” w prewencji chorób nowotworowych. Bromat. Chem. Toksykol. 2017, 2, 106–114. [Google Scholar]
- Mateuszuk, K.; Biel, W. Sea buckthorn (Hippophae rhamnoides L.) is a valuable source of food additives. Przem. Spoż. 2020, 74, 33–36. [Google Scholar]
- Gunenc, A.; Khoury, C.; Legault, C.; Mirrashed, H.; Rijke, J.; Hosseinian, F. Seabuckthorn as a novel prebiotic source improves probiotic viability in yogurt. LWT Food Sci. Technol. 2016, 66, 490–495. [Google Scholar] [CrossRef]
- Terpou, A.; Gialleli, A.J.; Bosnea, L.; Kanellaki, M.; Koutinas, A.A.; Castro, G.R. Novel cheese production by incorporation of sea buckthorn berries (Hippophae rhamnoides L.) supported probiotic cells. LWT Food Sci. Technol. 2017, 79, 616–624. [Google Scholar] [CrossRef]
- Tifrea, A.; Tiţa, O.; Máthé, E.; Ketney, O. Physicochemical parameters of probiotic yoghurt with bioactive natural products from sea buckthorn. Acta Univ. Cibinien. Ser. E Food Technol. 2013, 17, 27–38. [Google Scholar] [CrossRef]
- Selvamuthukumaran, M.; Farhath, K. Evaluation of shelf stability of antioxidant rich seabuckthorn fruit yoghurt. Int. Food Res. J. 2014, 21, 759–765. [Google Scholar]
- Dabija, A.; Oroian, M.A.; Mironeasa, S.; Sidor, A.M. Physicochemical and sensory properties of yogurt with seabuckthorn powder, rosehip powder and grape seed extract during storage. In Proceedings of the 18th International Multidisciplinary Scientific GeoConference SGEM 2018, Albena, Bulgaria, 2–8 July 2018; pp. 1–9. [Google Scholar]
- PN-68/A-86122. Milk. Research Methods. Available online: https://sklep.pkn.pl/ (accessed on 14 September 2020).
- AOAC—Official Methods of Analysis, No. 998.06, 17th ed.; AOAC International: Arlington, VA, USA, 2000; Available online: http://m.wdfxw.net/goDownFiles.aspx?key=12212363 (accessed on 15 September 2020).
- PN-EN ISO 4833-2:2013. Microbiology of the Food Chain—Horizontal Method for the Enumeration of Microorganisms—Part 2: Colony Count at 30 Degrees C by the Surface Plating Technique. Available online: https://sklep.pkn.pl/ (accessed on 15 September 2020).
- PN-A-86061:2002. Milk and Milk Products. Fermented Milk. Available online: https://sklep.pkn.pl/ (accessed on 4 September 2020).
- PN-EN ISO 8968–1:2014. Milk and milk Products—Determination of Nitrogen Content—Part 1: Kjeldahl Principle and Crude Protein Calculation. Available online: https://sklep.pkn.pl (accessed on 15 September 2020).
- Baryłko-Pikielna, N.; Matuszewska, I. Sensory food testing. In Basics. Methods. Usage, 2nd ed.; PTTŻ Scientific Publisher: Krakov, Poland, 2014; pp. 267–275. [Google Scholar]
- PN-EN ISO 7218:2008/A1:2013-10. Food and Feed Microbiology—General Requirements and Principles of Microbiological Testing. Available online: https://sklep.pkn.pl/ (accessed on 15 September 2020).
- PN-EN ISO 6887-5:2020-10. Food Chain Microbiology—Preparation of Samples, Stock Suspension and Tenfold Dilutions for Microbiological Analysis—Part 5: Specific Guidelines for the Preparation of Milk and Milk Products. Available online: https://sklep.pkn.pl/ (accessed on 15 September 2020).
- PN-ISO 7889:2007. Yogurt—Enumeration of Characteristic Microorganisms—Colony Count Technique at 37 °C. Available online: https://sklep.pkn.pl/ (accessed on 15 September 2020).
- PN-ISO 6611: 2007. Milk and milk Products—Enumeration of Colony Forming Units of Yeast and/or Mold—Plate Method at 25 °C. Available online: https://sklep.pkn.pl/ (accessed on 15 September 2020).
- PN-ISO 4832:2007. Food and Feed Microbiology—Horizontal Method for the Enumeration of Coliform Bacteria—Plate Method. Available online: https://sklep.pkn.pl/ (accessed on 15 September 2020).
- PN-ISO 15213:2005. Food and Feed Microbiology—Horizontal Method for the Enumeration of Sulphate (IV) Reducing Bacteria Growing under Anaerobic Conditions. Available online: https://sklep.pkn.pl/ (accessed on 15 September 2020).
- PN-ISO 20128:2012. Dairy Products—Enumeration of Putative Lactobacillus acidophilus on a Selective Medium—Colony Count Technique at 37 °C. Available online: https://sklep.pkn.pl/ (accessed on 15 September 2020).
- ISO 29981:2010. Milk Products—Enumeration of Presumptive Bifidobacteria—Colony Count Technique at 37 °C. Available online: https://sklep.pkn.pl/ (accessed on 15 September 2020).
- PN-EN ISO 6579-1:2017-04. Food Chain Microbiology—Horizontal Detection Method, Enumeration and Serotyping of Salmonella—Part 1: Salmonella spp. Detection. Available online: https://sklep.pkn.pl/ (accessed on 15 September 2020).
- Ahmed, Z.; Wang, Y.; Anjum, N.; Ahmad, H.; Ahmad, A.; Raza, M. Characterization of new exopolysaccharides produced by coculturing of L. kefiranofaciens with yoghurt strains. Int. J. Biol. Macromol. 2013, 59, 377–383. [Google Scholar] [CrossRef]
- Chen, Z.; Shi, J.; Yang, X.; Nan, B.; Liu, Y.; Wang, Z. Chemical and physical characteristics and antioxidant activities of the exopolysaccharide produced by Tibetan kefir grains during milk fermentation. Int. Dairy J. 2015, 43, 15–21. [Google Scholar] [CrossRef]
- Adam, M.; Dobiáš, P. Comparison of various methods for determination of water in white yoghurts. Food Chem. 2009, 115, 1069–1073. [Google Scholar] [CrossRef]
- Bater, C.; Galmarini, M.S. Influence of different storage conditions on the performance of spray-dried yogurt used as inoculum for milk fermentation. J. Dairy Sci. 2019, 86, 354–360. [Google Scholar] [CrossRef] [PubMed]
- Darwish, A.M.; Khalifa, R.E. Functional properties of chia seed mucilage supplemented in low fat yoghurt. Alex. Sci. Exch. J. 2018, 39, 450–459. [Google Scholar] [CrossRef]
- El-Kholy, W.M.; Soliman, T.N. Evaluation of date palm pollen (Phoenix dactylifera L.) encapsulation, impact on the nutritional and functional properties of fortified yoghurt. PLoS ONE 2019, 14, e0222789. [Google Scholar] [CrossRef] [PubMed]
- Jaafar, A.A.; Atyea, A.S. Study and evaluation of yoghurt products prepared from various commercial starter cultures. Plant Arch. 2020, 20, 3250–3254. [Google Scholar]
- Jaya, S. Microstructure analysis of dried yogurt: Effect of different drying methods. Int. J. Food Prop. 2009, 12, 469–481. [Google Scholar] [CrossRef]
- Khanmohammadi, M.; Garmaudi, A.B. Artificial neural network for quantitative determination of total protein in yogurt by infrared spectrometry. Microchem. J. 2009, 91, 47–52. [Google Scholar] [CrossRef]
- Moros, J.; Iñón, F.A. Evaluation of the application of attenuated total reflectance—Fourier transform infrared spectrometry (ATR–FTIR) and chemometrics to the determination of nutritional parameters of yogurt samples. Anal. Bioanal. Chem. 2006, 385, 708–715. [Google Scholar] [CrossRef]
- Mudgil, P.; Jumah, B. Rheological, micro-structural and sensorial properties of camel milk yogurt as influenced by gelatin. LWT Food Sci. Technol. 2018, 98, 646–653. [Google Scholar] [CrossRef]
- Nazari, M.; Nazari, M. Garlic essential oil nanophytosomes as a natural food preservative: Its application in yogurt as food model. Colloids Interface Sci. 2019, 30, 100176. [Google Scholar] [CrossRef]
- Temizkan, R.; Can, A.; Dogan, M.A.; Mortas, M.; Ayvaz, H. Rapid detection of milk fat adulteration in yoghurts using near and mid-infrared spectroscopy. Int. Dairy J. 2020, 110, 104795. [Google Scholar] [CrossRef]
- Yuan, H.; Lv, J. Secondary structures and their effects on antioxidant capacity of antioxidant peptides in yogurt. Int. J. Food Prop. 2018, 21, 2167–2180. [Google Scholar] [CrossRef]
- da Silva, S.C.; Fenandes, I.P. Spray-dried Spirulina platensis as an effective ingredient to improve yogurt formulations: Testing different encapsulating solutions. J. Funct. Foods 2019, 60, 103427. [Google Scholar] [CrossRef]
- Codex Alimentarius International Food Standards, Code of Hygienic Practice for Milk and Milk Products, No. CAC/RCP 57-2004, Modified in 2009. 2009. Available online: http://www.fao.org/fao-who-codexalimentarius/sh-proxy/en/?lnk=1&url=https%253A%252F%252Fworkspace.fao.org%252Fsites%252Fcodex%252FStandards%252FCXC%2B57-2004%252FCXC_057e.pdf (accessed on 4 September 2020).
- Lorenzen, P.C.; Clawin-Rädecker, I.; Einhoff, K.; Hammer, P.; Hartmann, R.; Hoffmann, W.; Martin, D.; Molkentin, J.; Walte, H.G.; Devrese, A. A survey of the quality of extended shelf life (ESL) milk in relation to HTST and UHT milk. Int. J. Dairy Technol. 2011, 64, 166–178. [Google Scholar] [CrossRef]
- PN-A-86003/A1:1998. Milk and Dairy Products–Drinking Milk. Available online: https://sklep.pkn.pl (accessed on 17 September 2020).
- Brodziak, A.; Król, J.; Litwińczuk, Z.; Nowakowicz-Dębek, B.; Czernecki, T. Effect of cold chain retention on the nutritional value of drinking milk, including content of bioactive components. Przem. Chem. 2017, 96, 1378–1380. (In Polish) [Google Scholar]
- Kudełka, W. The Possibility of Modelling the Quality of Fermented Milk Beverages during Storage; Economics University in Cracow Publishing: Cracow, Poland, 2008. (In Polish) [Google Scholar]
- Lee, W.J.; Lucey, J.A. Formation and physical properties of yoghurt. Asian Aust. J. Anim. Sci. 2010, 23, 1127–1136. [Google Scholar] [CrossRef]
- Brodziak, A.; Król, J.; Barłowska, J.; Teter, A.; Florek, M. Changes in the physicochemical parameters of yoghurts with added whey protein in relation to the starter bacteria strains and storage time. Animals 2020, 10, 1350. [Google Scholar] [CrossRef] [PubMed]
- Chen, C.; Zhao, S.; Hao, G.; Yu, H.; Tian, H.; Zhao, G. Role of lactic acid bacteria on the yogurt flavour: A review. Int. J. Food Prop. 2017, 20, S316–S330. [Google Scholar] [CrossRef]
- Cheng, H. Volatile flavor compounds in yogurt: A review. Crit. Rev. Food Sci. Nutr. 2010, 50, 938–950. [Google Scholar] [CrossRef]
- Grega, T.; Sady, M.; Wszołek, M.; Gambuś, H. Evaluation of the quality of yoghurts with the addition of amaranth seeds. Przegl. Mlecz. 2001, 5, 223–226. (In Polish) [Google Scholar]
- Kycia, K.; Krysiński, C. Microbiological and hygienic quality of commercial goat milk yoghurts in context of their therapeutic properties. Probl. Hig. Epidemiol. 2014, 95, 186–191. [Google Scholar]
- Codex Stan 243-2003. Codex Standard for Fermented Milks 2003. Available online: http://www.fao.org/fao-who-codexalimentarius/sh-proxy/en/?lnk=1&url=https%253A%252F%252Fworkspace.fao.org%252Fsites%252Fcodex%252FStandards%252FCXS%2B243-2003%252FCXS_243e.pdf (accessed on 30 November 2020).
- Birollo, G.A.; Reinheimer, J.A. Viability of lactic acid microflora in different types of yoghurt. Food Res. Int. 2000, 33, 799–805. [Google Scholar] [CrossRef]
- Tamime, A.Y.; Robinson, R.K. Yoghurt: Science and Technology, 1st ed.; Woodhead: Cambridge, UK, 2007. [Google Scholar]
- Augustyniak, A. Survival of Lactic Acid Bacteria in Yoghurts during Cold Storage. Master’s Thesis, SGGW, Warsaw, Poland, 2012. [Google Scholar]
- Ranadheera, C.S.; Evans, C.A. Probiotic viability and physico-chemical and sensory properties of plain and stirred fruit yogurts made from goat’s milk. Food Chem. 2012, 135, 1411–1418. [Google Scholar] [CrossRef] [PubMed]
- Zmarlicki, S. Health aspects of milk and milk products. Zdr. Publ. 2006, 116, 142–146. [Google Scholar]
- Molska, I. The importance of Enterobacteriaceae bacteria in food products. Przem. Spoż. 2007, 61, 30–32. [Google Scholar]
- Fleet, G.H. Yeasts in dairy products. A review. J. Appl. Bacteriol. 1990, 68, 199–211. [Google Scholar] [CrossRef]
- Viljoena, B.C.; Lourens-Hattingh, A.; Ikalafenga, B.; Peter, G. Temperature abuse initiating yeast growth in yoghurt. Food Res. Int. 2003, 36, 193–197. [Google Scholar] [CrossRef]
- Akalın, A.S.; Unal, G.; Dinkci, N.; Hayaloglu, A.A. Microstructural, textural, and sensory characteristics of probiotic yogurts fortified with sodium calcium caseinate or whey protein concentrate. J. Dairy Sci. 2012, 95, 3617–3628. [Google Scholar] [CrossRef] [PubMed]


| Characteristic | Description |
|---|---|
| Milk type | Organic |
| Season of milk production | Spring/summer (pasture) season |
| Milk thermal treatment | Very high temperature (VHT) pasteurization (85 °C for 20–25 s) |
| Addition | Sea buckthorn mousse (5%) |
| Starter strains of yoghurt bacteria | Thermophilic, probiotic starter yoghurt cultures, i.e., ABT-1 (0.15 g/L) |
| Yoghurt type | Plain, natural yoghurt |
| Yoghurt with sea buckthorn fruit mousse | |
| Day of storage | 0 |
| 7 | |
| 14 | |
| 21 |
| Active Acidity (pH) | Potential Acidity (°SH) | Total Protein (%) | Casein (%) | Fat (%) | Lactose (%) | Dry Matter (%) |
|---|---|---|---|---|---|---|
| 6.70 ± 0.05 | 6.82 ± 0.08 | 3.06 ± 0.10 | 2.48 ± 0.08 | 3.25 ± 0.08 | 4.75 ± 0.06 | 12.16 ± 0.15 |
| Yoghurt Type | Day of Storage | Total Protein (%) | Fat (%) | Dry Matter (%) |
|---|---|---|---|---|
| Plain, natural yoghurts | 0 | 3.07 b ± 0.07 | 3.24 ± 0.08 | 12.21 B ± 0.15 |
| 7 | 3.05 ab ± 0.10 | 3.18 ± 0.10 | 12.08 B ± 0.20 | |
| 14 | 3.01 ab ± 0.14 | 3.16 ± 0.09 | 11.49 B ± 0.18 | |
| 21 | 2.80 a ± 0.15 | 3.10 ± 0.12 | 10.10 A ± 0.23 | |
| Yoghurts with sea buckthorn fruit mousse | 0 | 3.11 b ± 0.10 | 3.33 b ± 0.07 | 12.38 C ± 0.19 |
| 7 | 3.09 ab ± 0.13 | 3.30 b ± 0.11 | 12.20 C ± 0.17 | |
| 14 | 3.04 ab ± 0.18 | 3.23 ab ± 0.09 | 11.64 B ± 0.20 | |
| 21 | 2.82 a ± 0.16 | 3.15 a ± 0.12 | 10.29 A ± 0.23 |
| Yoghurt Type | Day of Storage | Total Bacterial Count | Total Number of Fungi | Total Number of Lactic Acid Bacteria | Total Number of Bacteria of the Genus Clostridium sp. | Total Number of Coli Bacteria (Endo) | Total Number of Faecal Coliforms (mFC) | Total Number of Bacteria of the Genus Bifidobacterium sp. | Presence of Salmonella Bacilli | Presence of Campylobacter Bacilli |
|---|---|---|---|---|---|---|---|---|---|---|
| Plain, natural yoghurts | 0 | <1.5 × 101 A | 0 * | 8.2 × 10⁷ | 0 | 0 | 0 | 7.6 × 10⁶ | 0 | 0 |
| 7 | 8.0 × 10⁵ B ** | 0 * | 5.6 × 10⁷ | 0 | 0 | 0 | 1.6 × 10⁷ * | 0 | 0 | |
| 14 | 2.2 × 10⁶ B ** | 0 * | 4.7 × 10⁷ | 0 | 0 | 0 | 2.4 × 10⁶ | 0 | 0 | |
| 21 | 3.2 × 10⁵ B ** | 0 * | 6.7 × 10⁷ | 0 | 0 | 0 | 3.1 × 10⁷ | 0 | 0 | |
| Yoghurts with sea buckthorn fruit mousse | 0 | 4.5 × 101 B | 7.2 × 10² ** | 8.1 × 10⁷ | 0 | 0 | 0 | 7.8 × 10⁷ | 0 | 0 |
| 7 | <1.5 × 101 B ** | <1.0 × 10² ** | 8.9 × 10⁷ | 0 | 0 | 0 | 7.2 × 10⁵ * | 0 | 0 | |
| 14 | 0 A ** | <1.0 × 10² ** | 8.2 × 10⁷ | 0 | 0 | 0 | 1.2 × 10⁶ | 0 | 0 | |
| 21 | 0 A ** | 1.0 × 10⁴ ** yeast | 5.1 × 10⁷ | 0 | 0 | 0 | 2.9 × 10⁷ | 0 | 0 |
| FTIR | Type and Origin of Vibrations |
|---|---|
| 3280 | ν(-O-H) |
| 2956 | ν(-CH2) and ν(-CH3), s and as |
| 2923 | |
| 2853 | |
| 1744 | ν(-C=O) in esters or carboxylic acid |
| 1641 | amide I oraz δ(-OH) (ν(C=O)+ ν(N-H) in-plane and δ(C-N)) |
| 1629 | |
| 1540 | amide II, fatty acids, proteins, and polisacharides (ν(C=C) of nonconjugated trans and cis-lipids etc.) |
| 1416 | |
| 1378 | |
| 1314 | |
| 1240 | |
| 1151 | polisacharides (ν(C-O-C) and ν(C-O)) |
| 1115 | |
| 1070 | |
| 1034 | |
| 892 | α-glycosidic bond |
| 876 | |
| 782 | |
| 700 | |
| 537 |
Publisher’s Note: MDPI stays neutral with regard to jurisdictional claims in published maps and institutional affiliations. |
© 2021 by the authors. Licensee MDPI, Basel, Switzerland. This article is an open access article distributed under the terms and conditions of the Creative Commons Attribution (CC BY) license (http://creativecommons.org/licenses/by/4.0/).
Share and Cite
Brodziak, A.; Król, J.; Matwijczuk, A.; Czernecki, T.; Glibowski, P.; Wlazło, Ł.; Litwińczuk, A. Effect of Sea Buckthorn (Hippophae rhamnoides L.) Mousse on Properties of Probiotic Yoghurt. Appl. Sci. 2021, 11, 545. https://doi.org/10.3390/app11020545
Brodziak A, Król J, Matwijczuk A, Czernecki T, Glibowski P, Wlazło Ł, Litwińczuk A. Effect of Sea Buckthorn (Hippophae rhamnoides L.) Mousse on Properties of Probiotic Yoghurt. Applied Sciences. 2021; 11(2):545. https://doi.org/10.3390/app11020545
Chicago/Turabian StyleBrodziak, Aneta, Jolanta Król, Arkadiusz Matwijczuk, Tomasz Czernecki, Paweł Glibowski, Łukasz Wlazło, and Anna Litwińczuk. 2021. "Effect of Sea Buckthorn (Hippophae rhamnoides L.) Mousse on Properties of Probiotic Yoghurt" Applied Sciences 11, no. 2: 545. https://doi.org/10.3390/app11020545
APA StyleBrodziak, A., Król, J., Matwijczuk, A., Czernecki, T., Glibowski, P., Wlazło, Ł., & Litwińczuk, A. (2021). Effect of Sea Buckthorn (Hippophae rhamnoides L.) Mousse on Properties of Probiotic Yoghurt. Applied Sciences, 11(2), 545. https://doi.org/10.3390/app11020545