
Mechanical Characteristics of Structures and Ground Deformation Caused by Shield Tunneling Under-Passing Highways in Complex Geological Conditions Based on the MJS Method


Abstract
:1. Introduction
2. Case Description
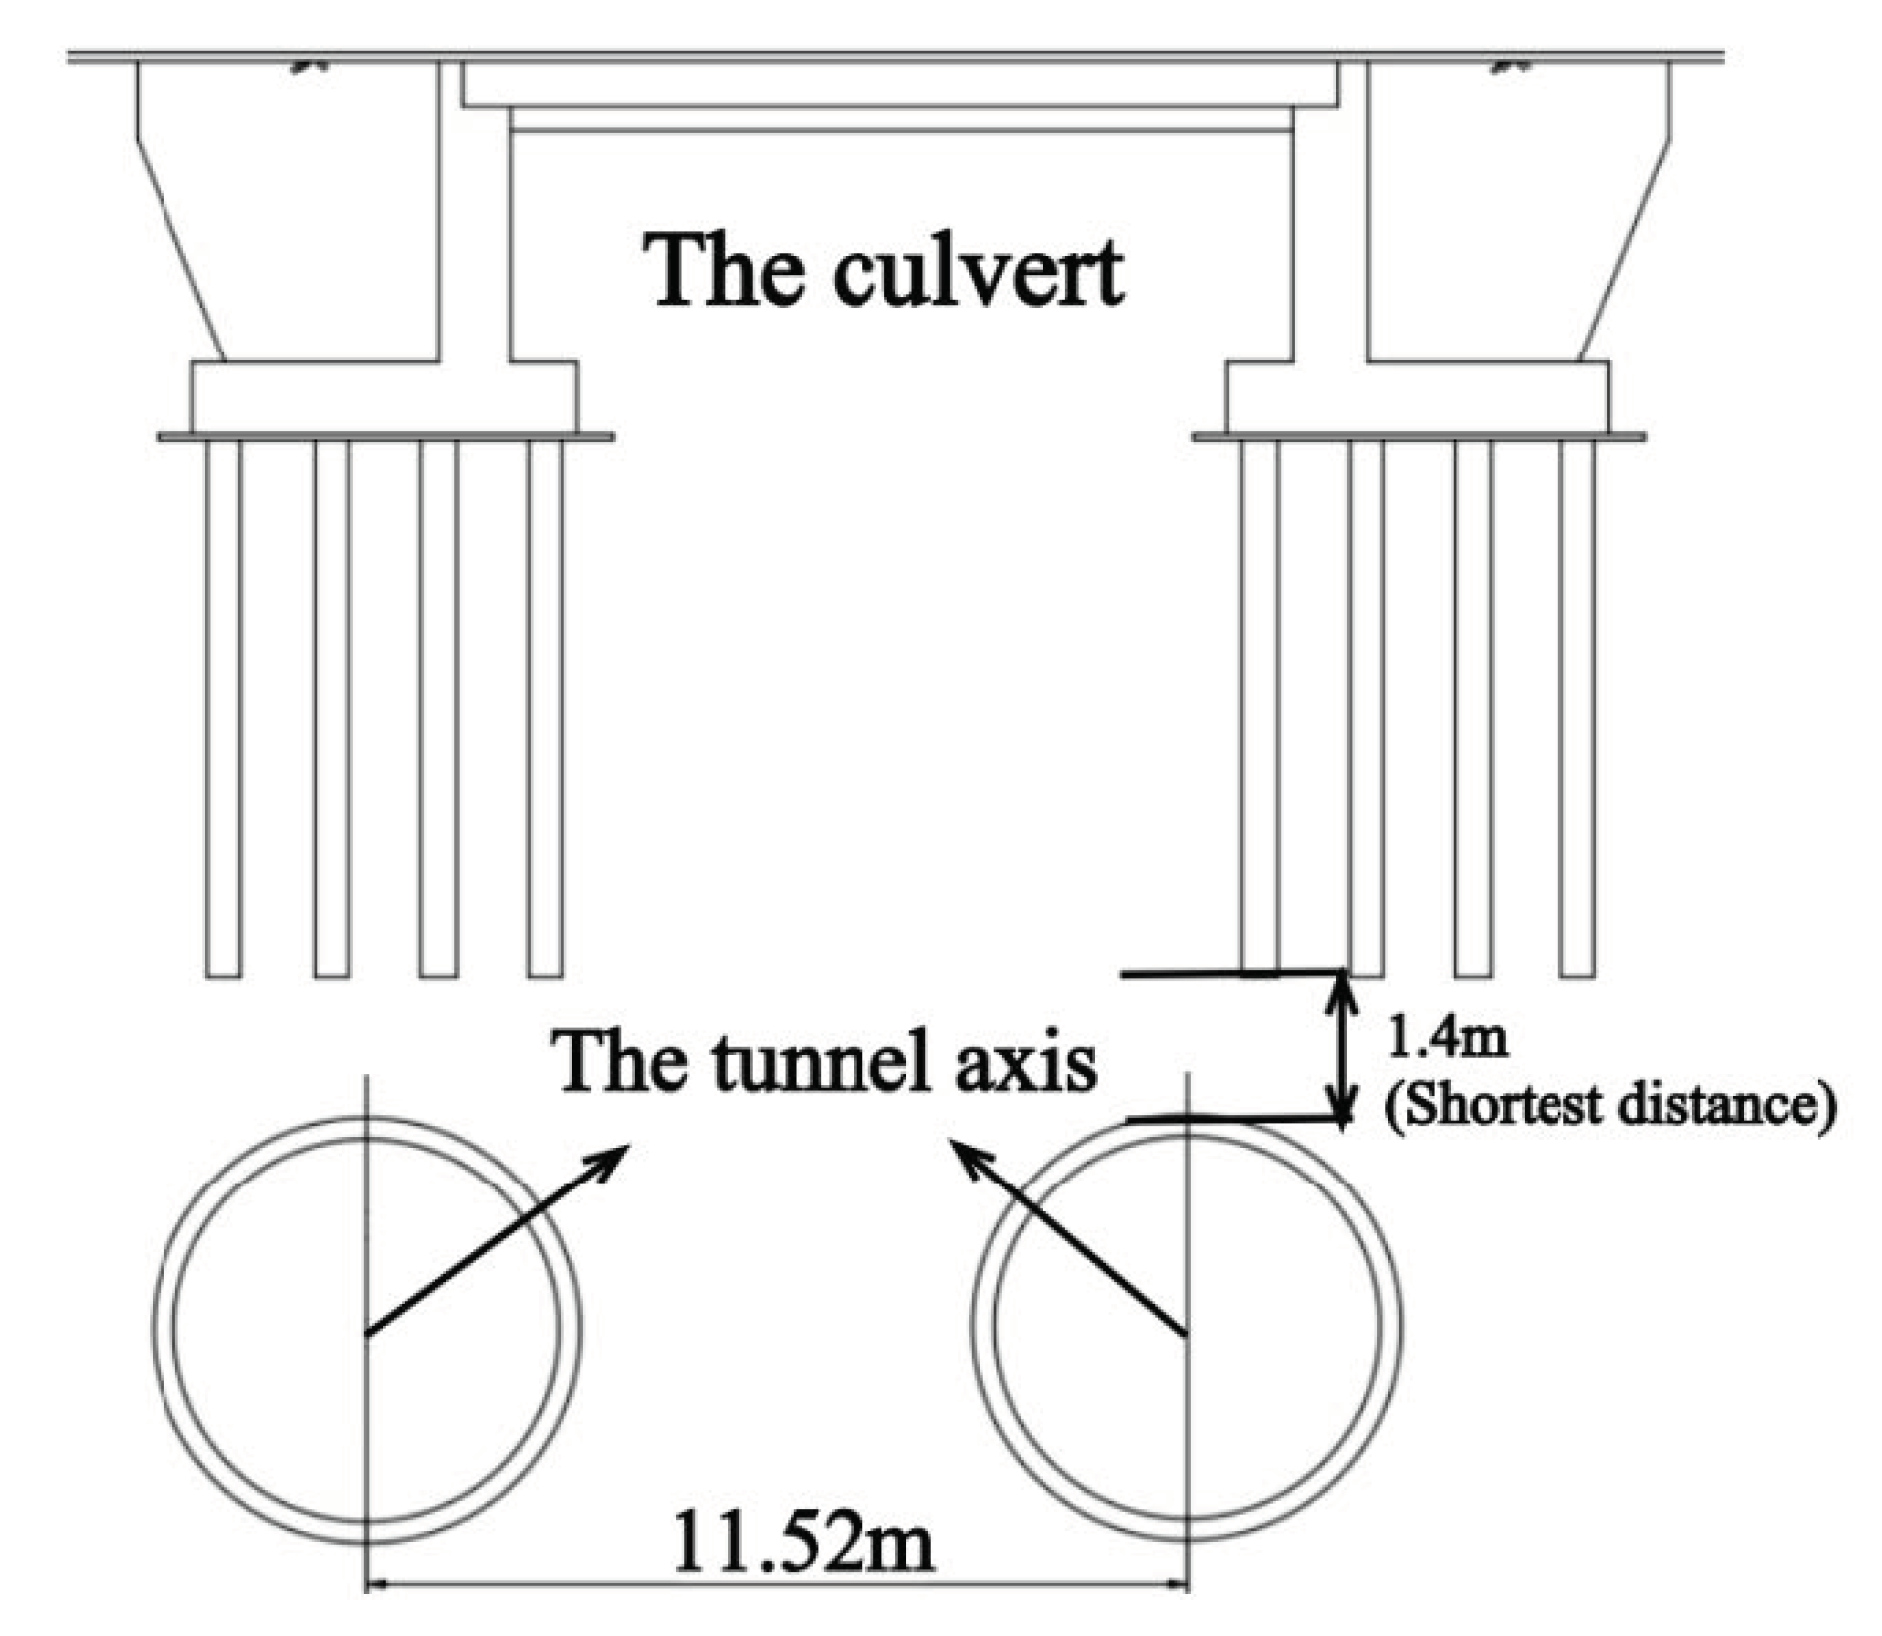
2.1. Overview
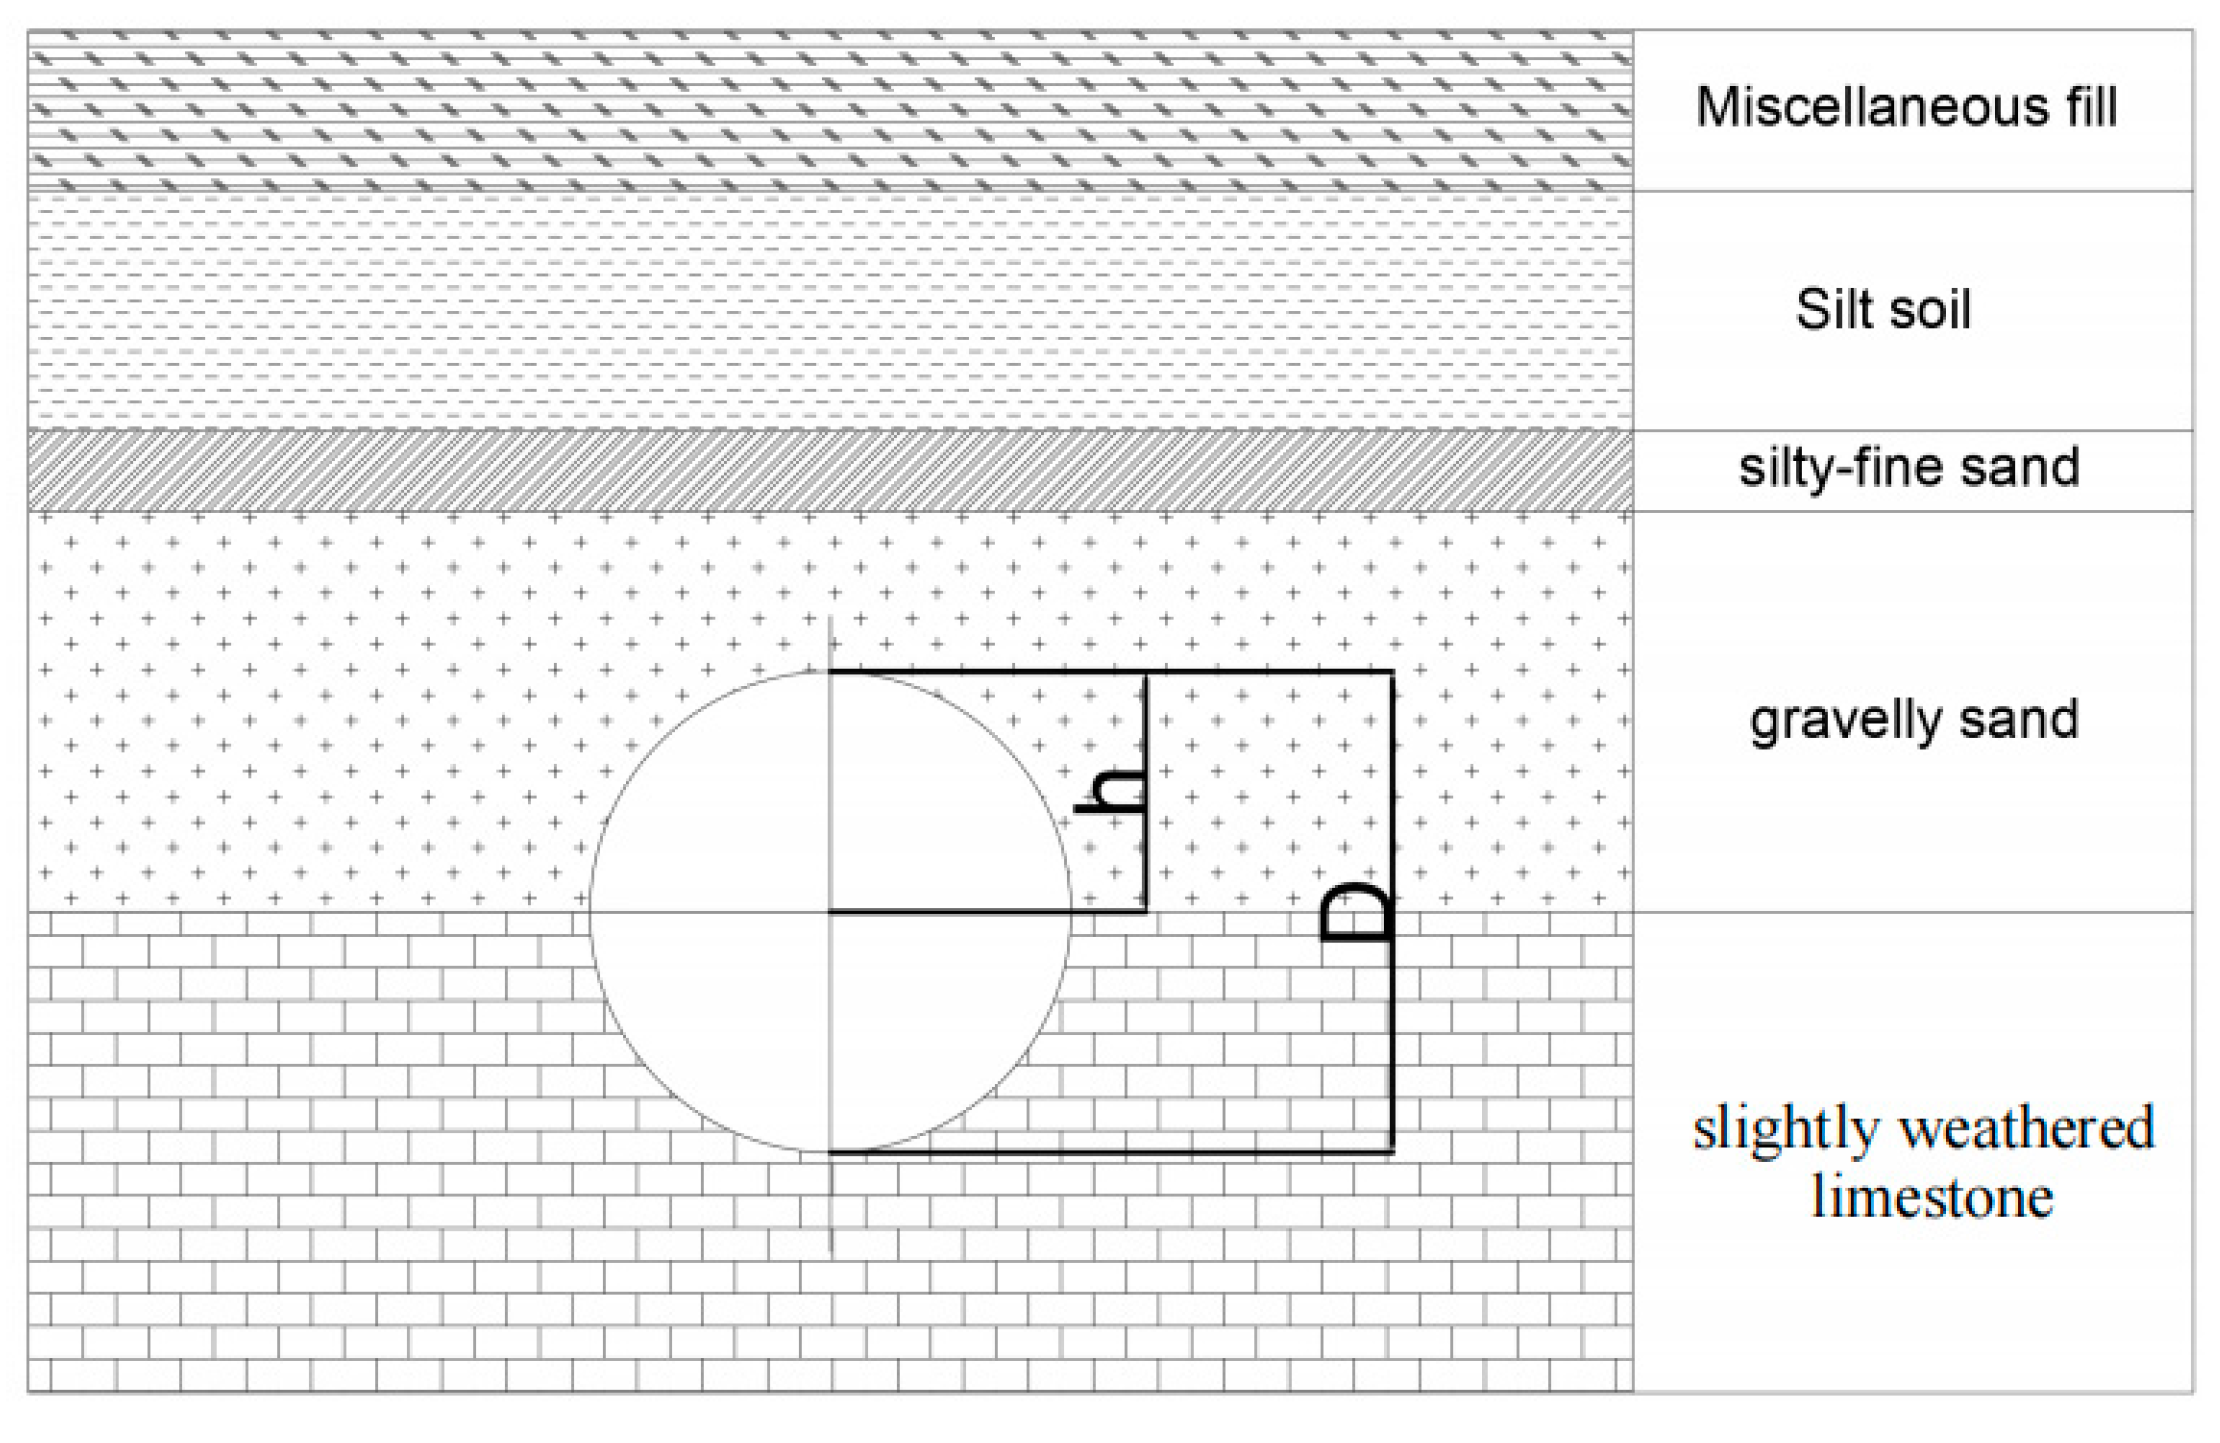
2.2. Geological and Hydrologic Conditions of the Construction Site
2.3. Definition of Soft-Rock Height Ratio
2.4. Engineering Difficulties and Measure
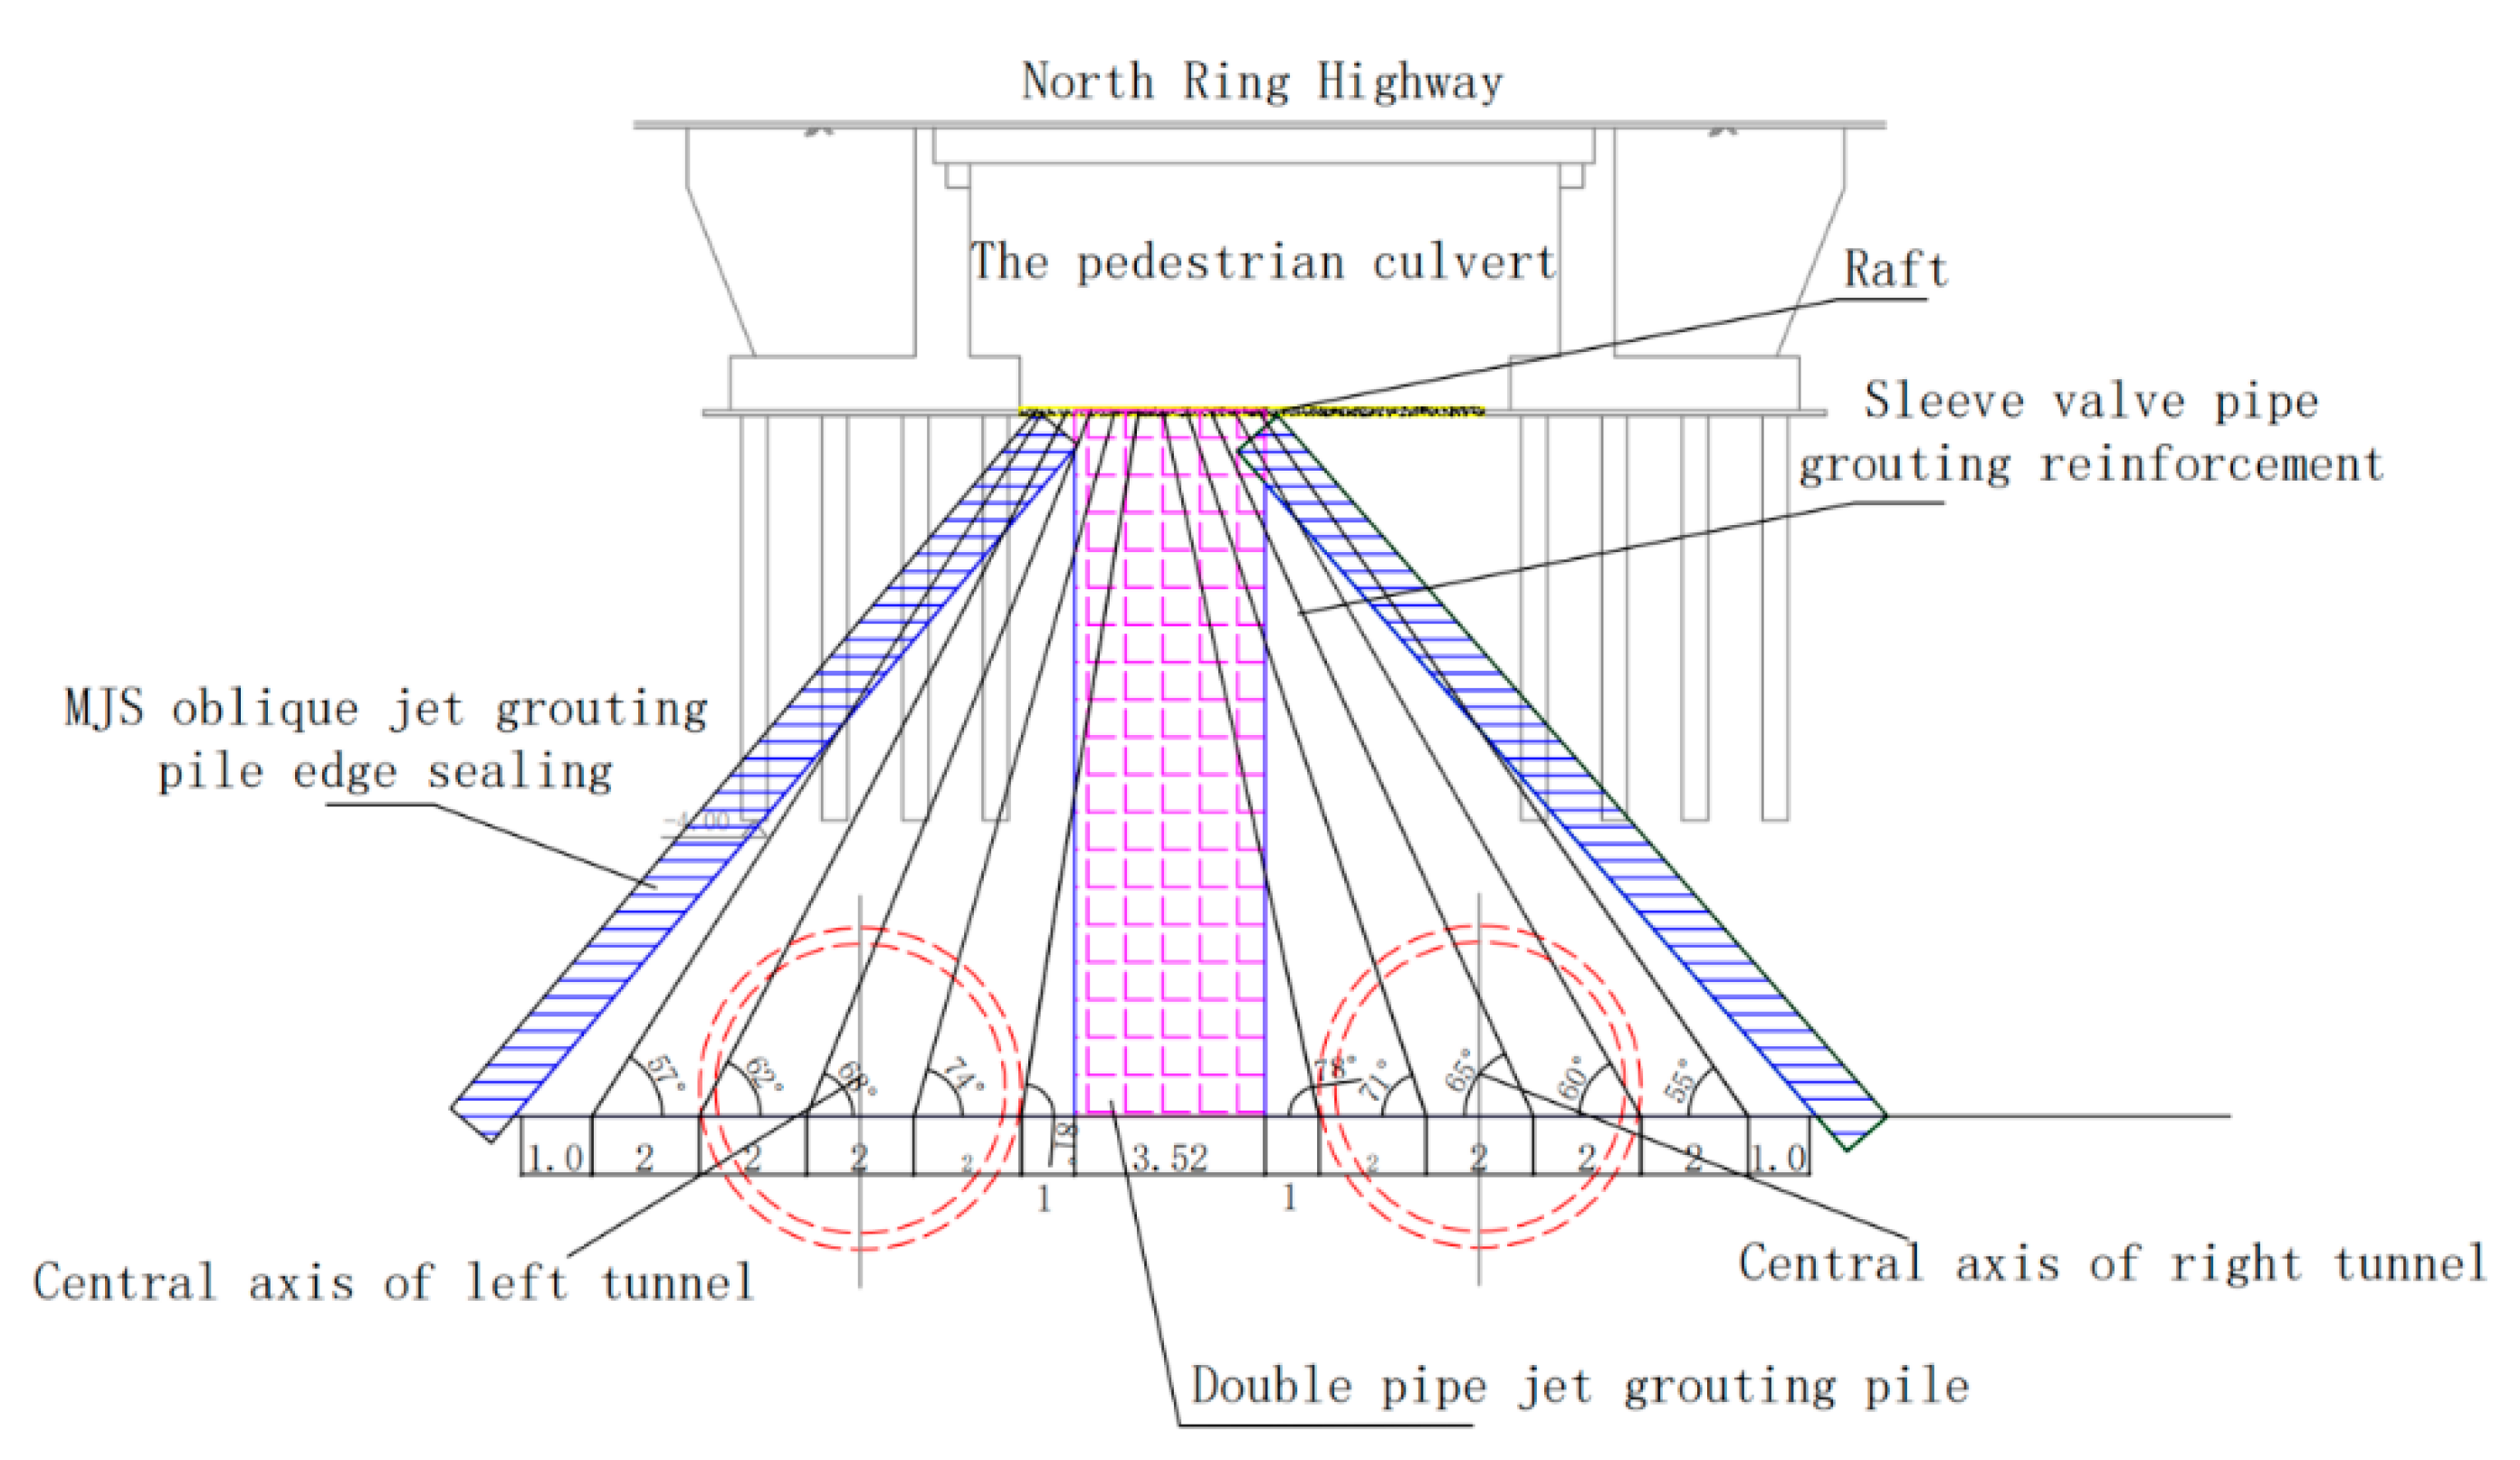
2.5. Reinforcement Plan for Shield Construction Under-Passing Bridges and Culverts
3. Monitoring and Analysis of Subsidence in Shield Tunneling Under-Passing the Bridge and Culvert
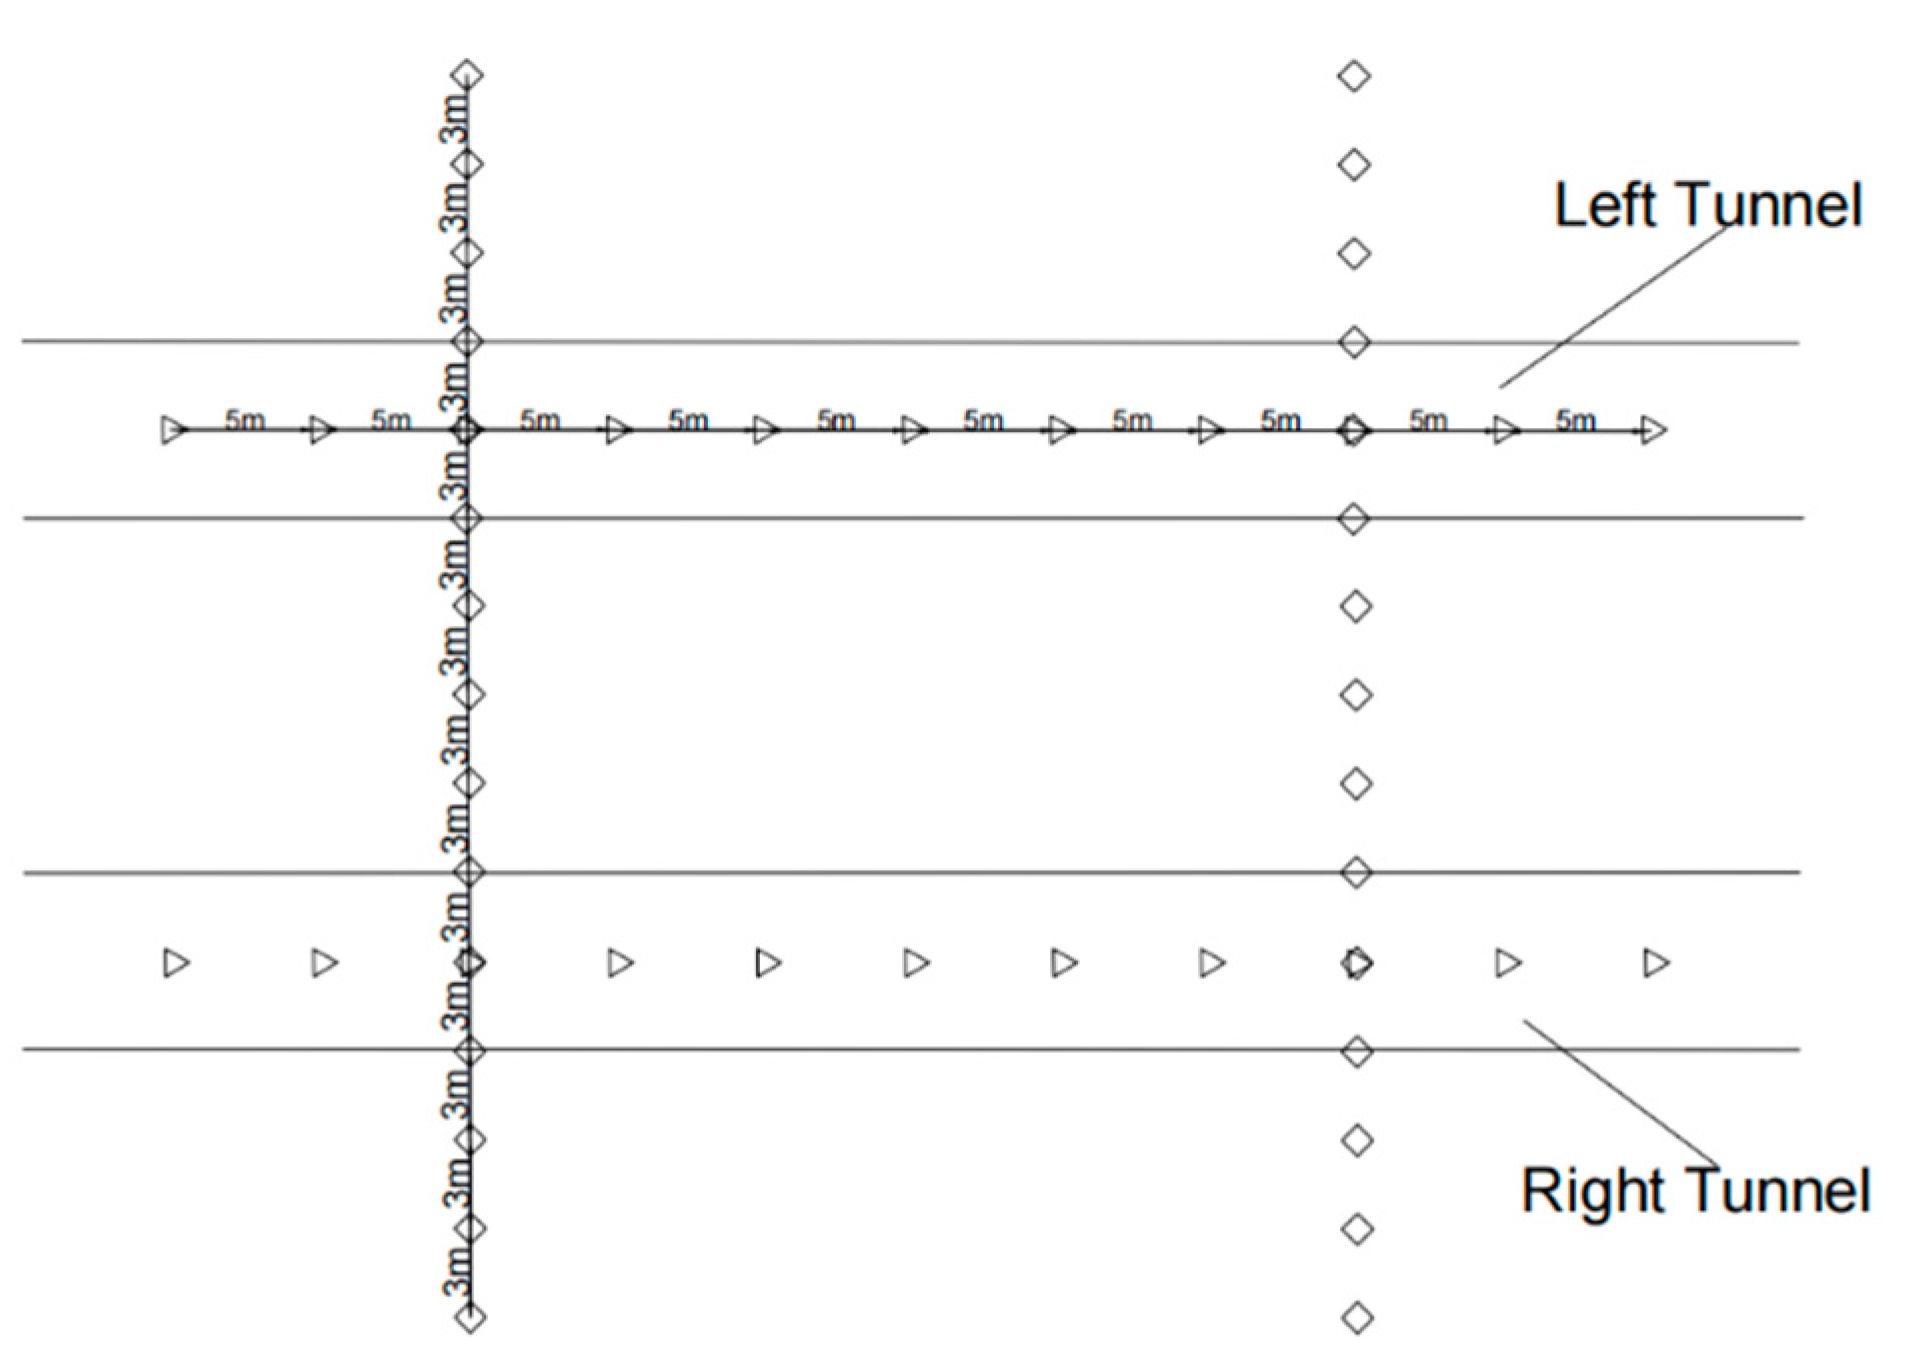
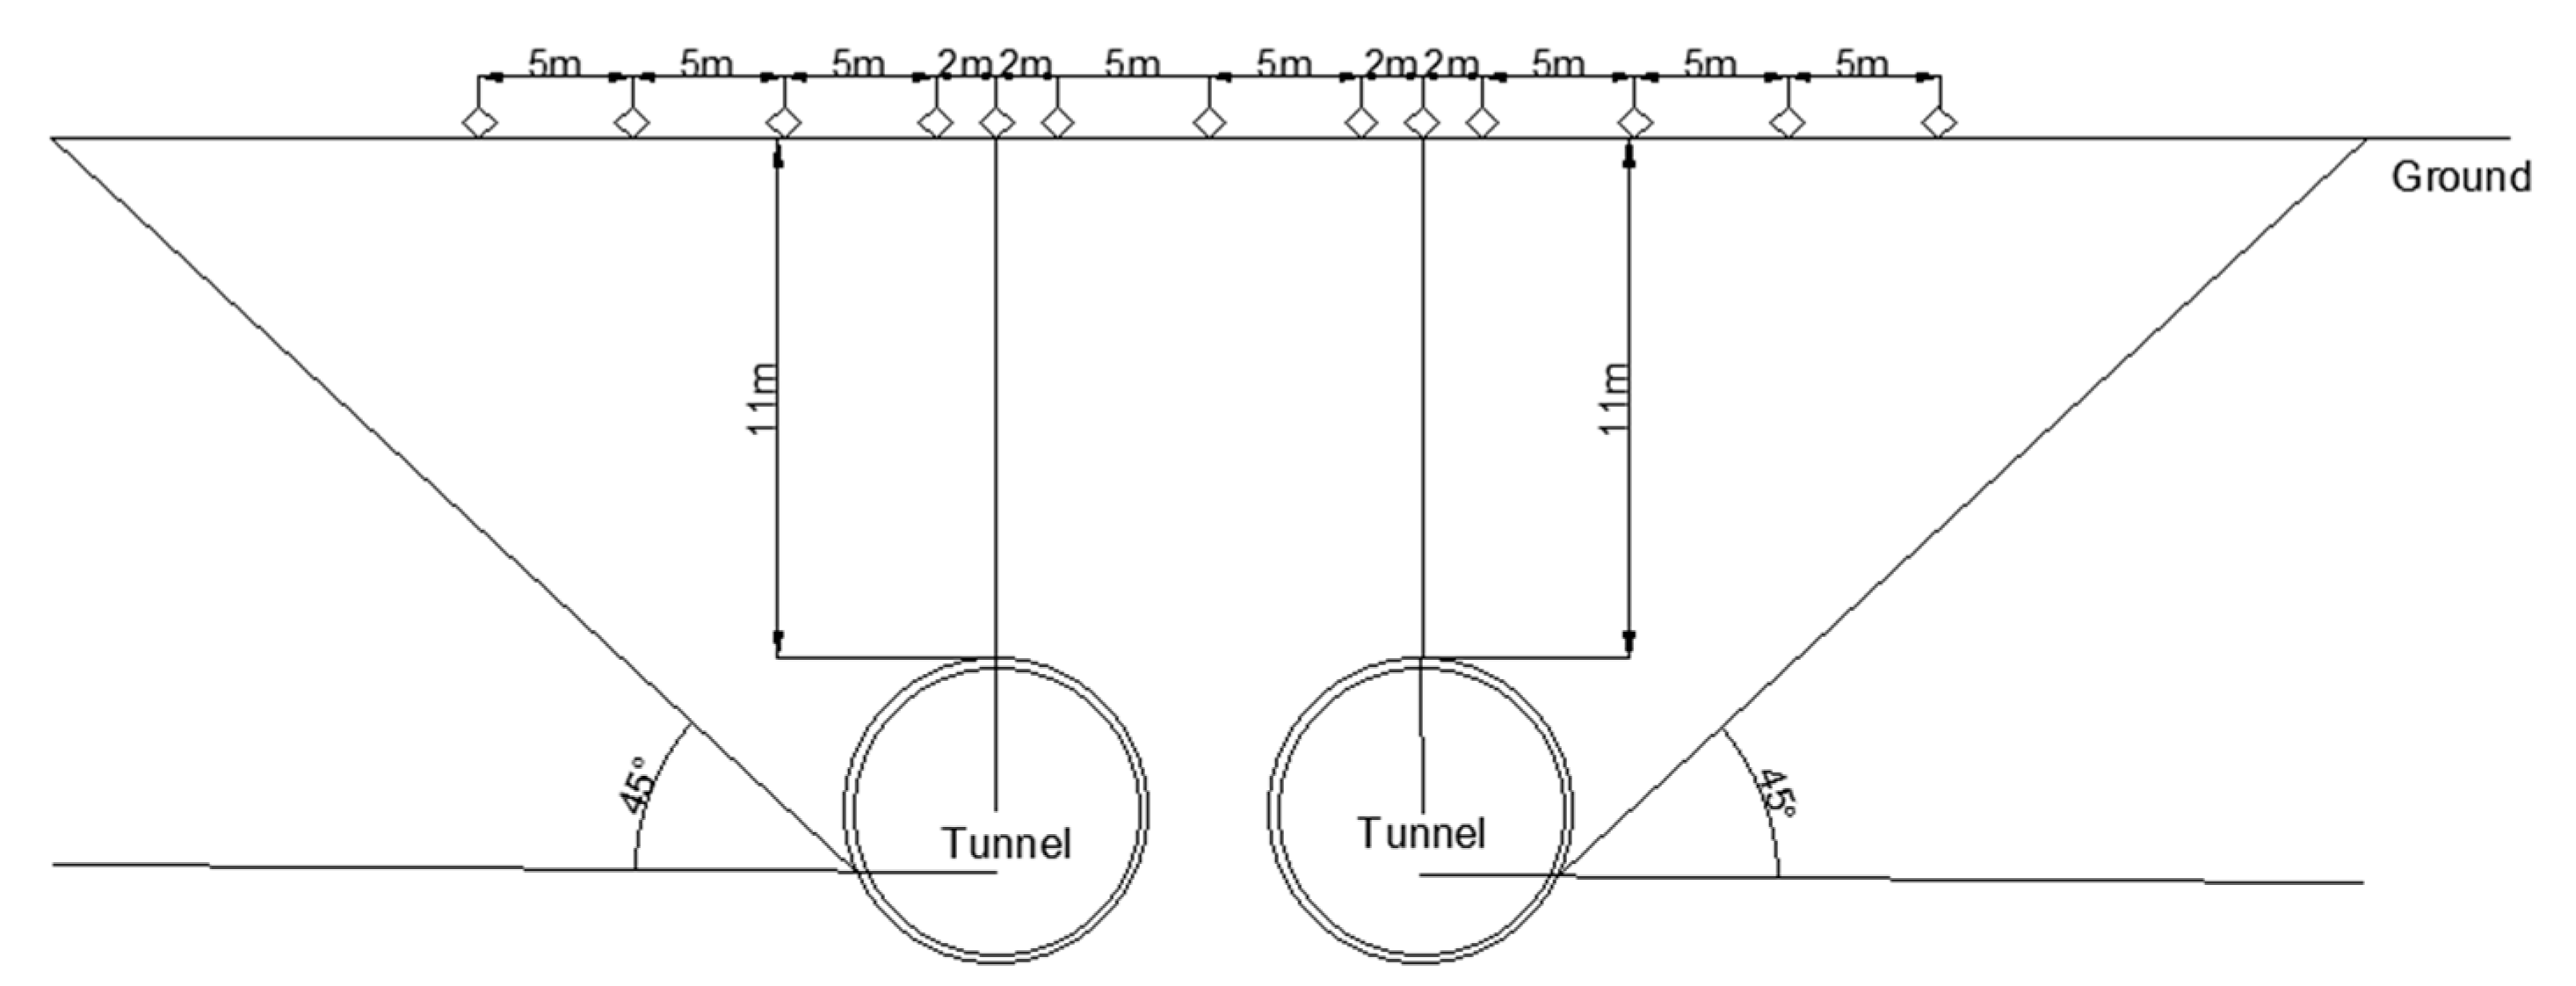
3.1. Layout of Monitoring Points for Subsidence
3.2. Monitoring and Analysis of Ground Subsidence
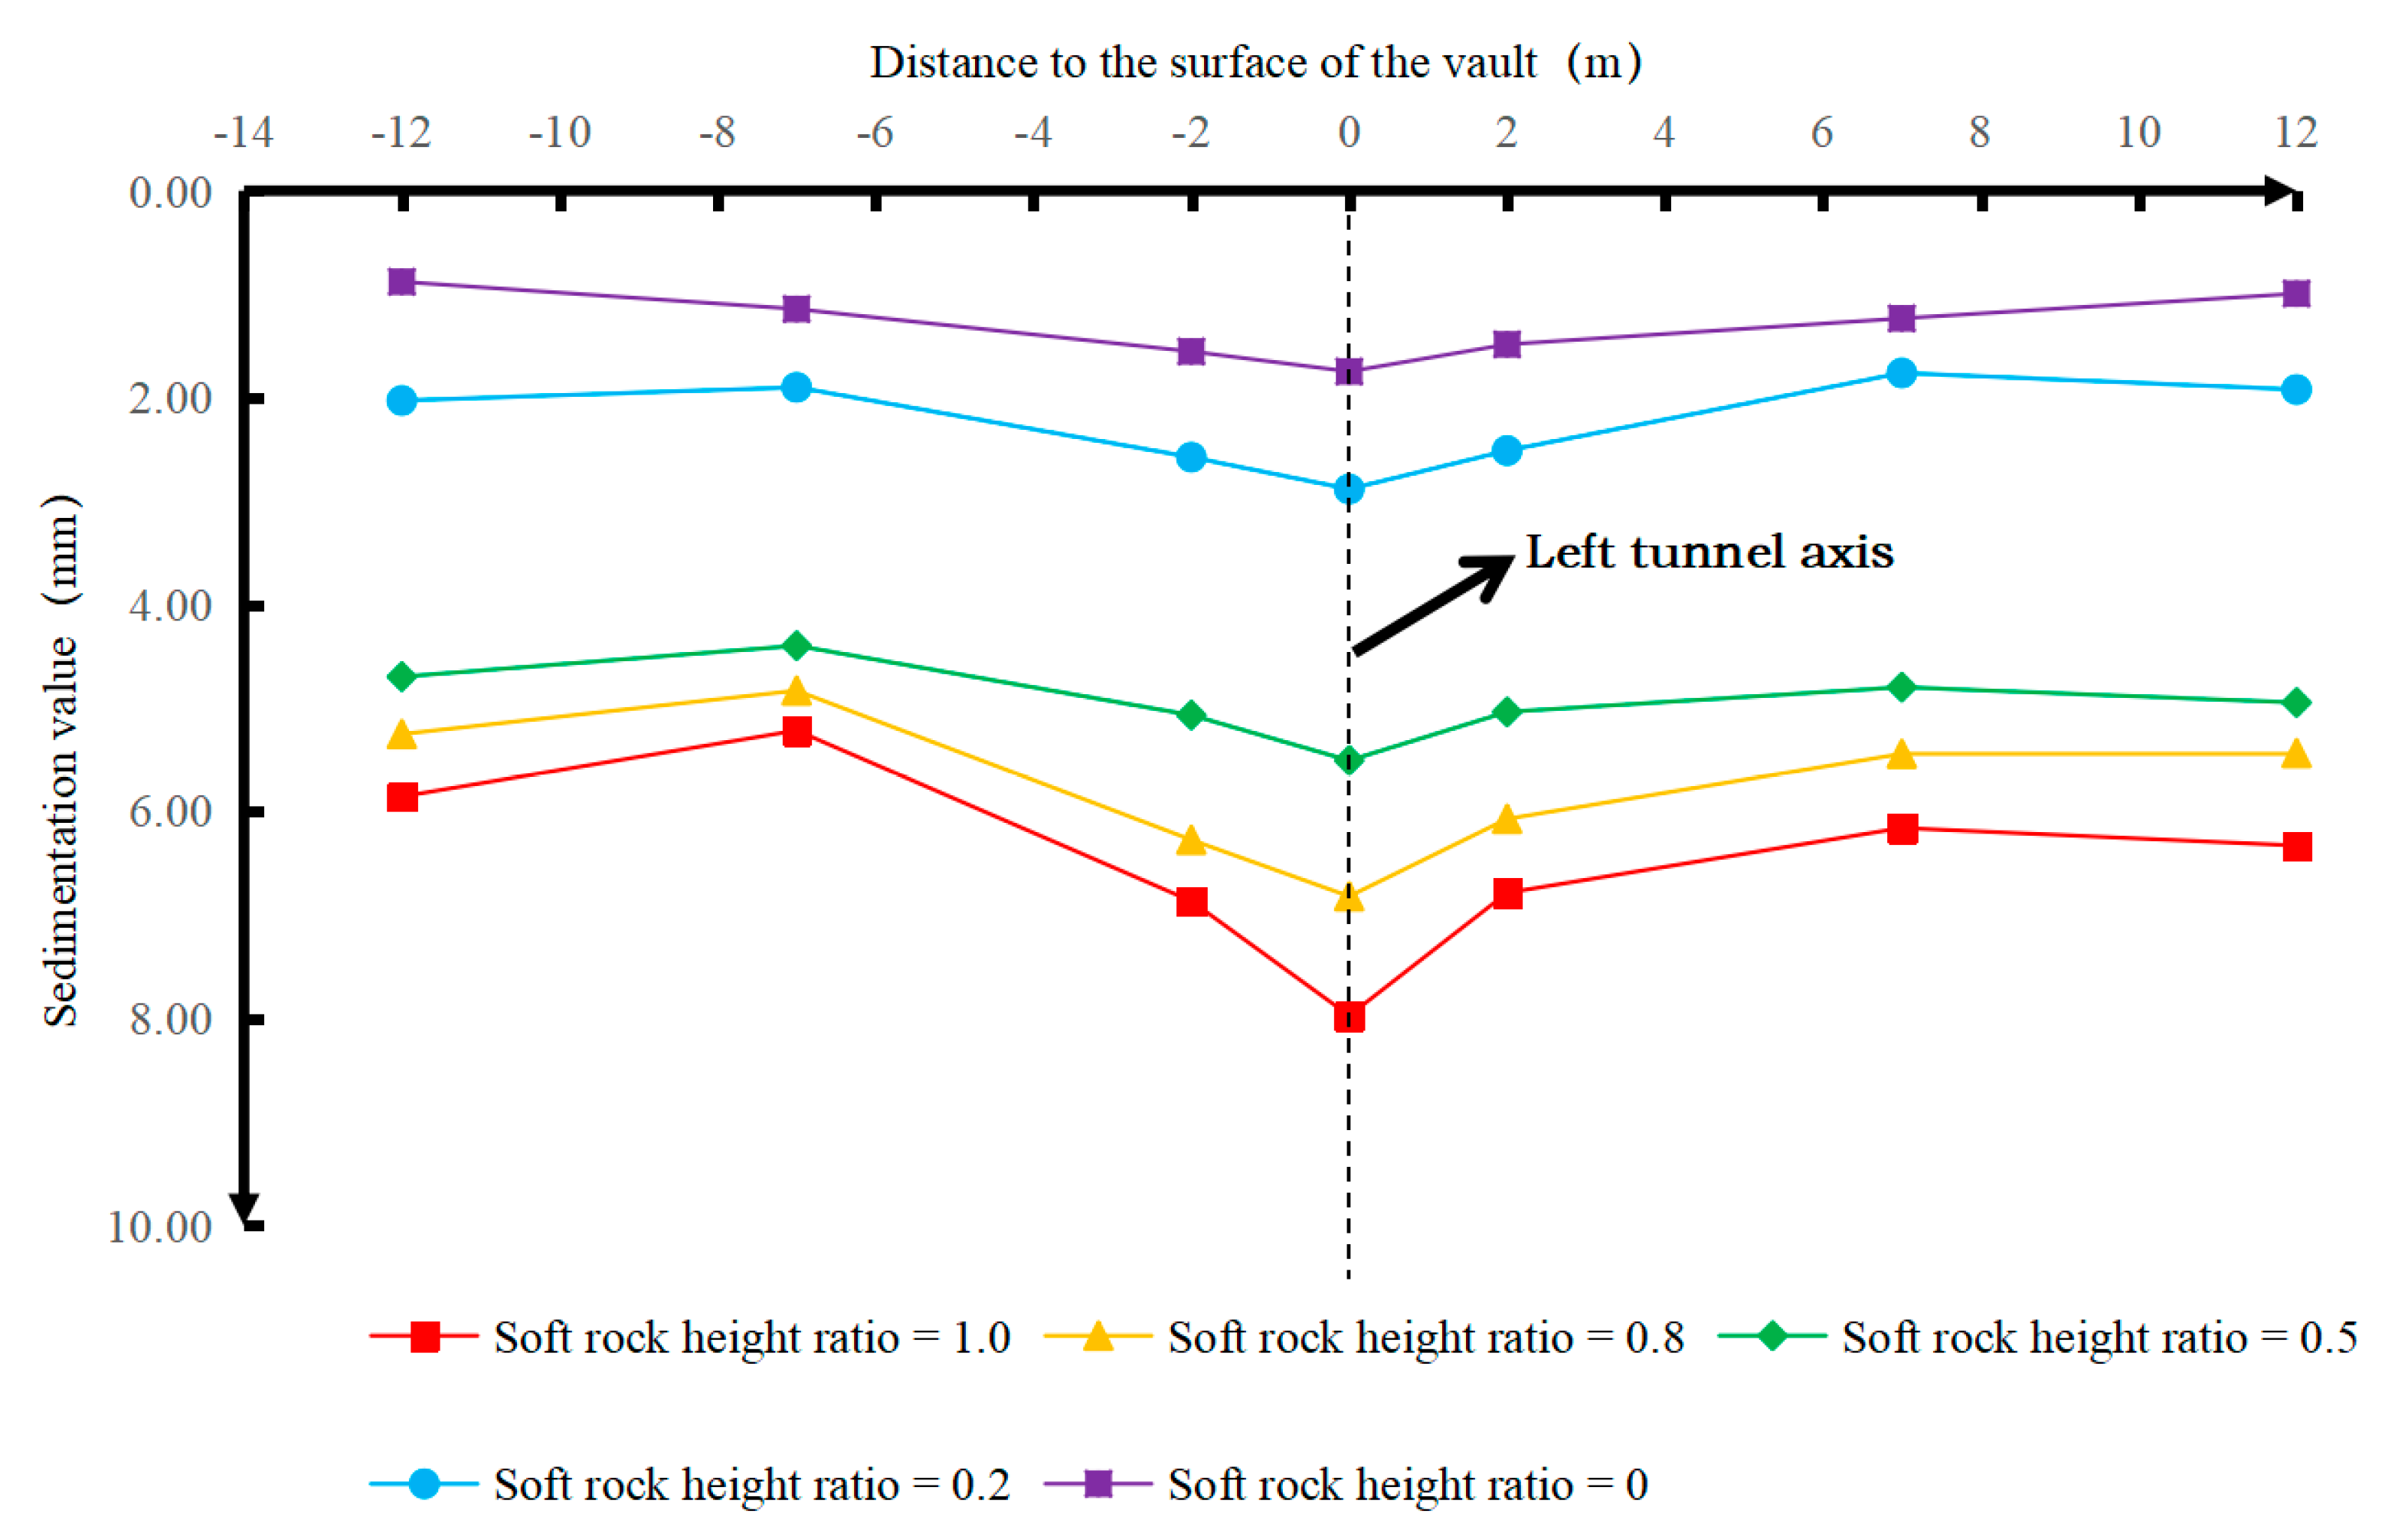
3.2.1. Monitoring and Analysis of Surface Subsidence at Transverse Measuring Points
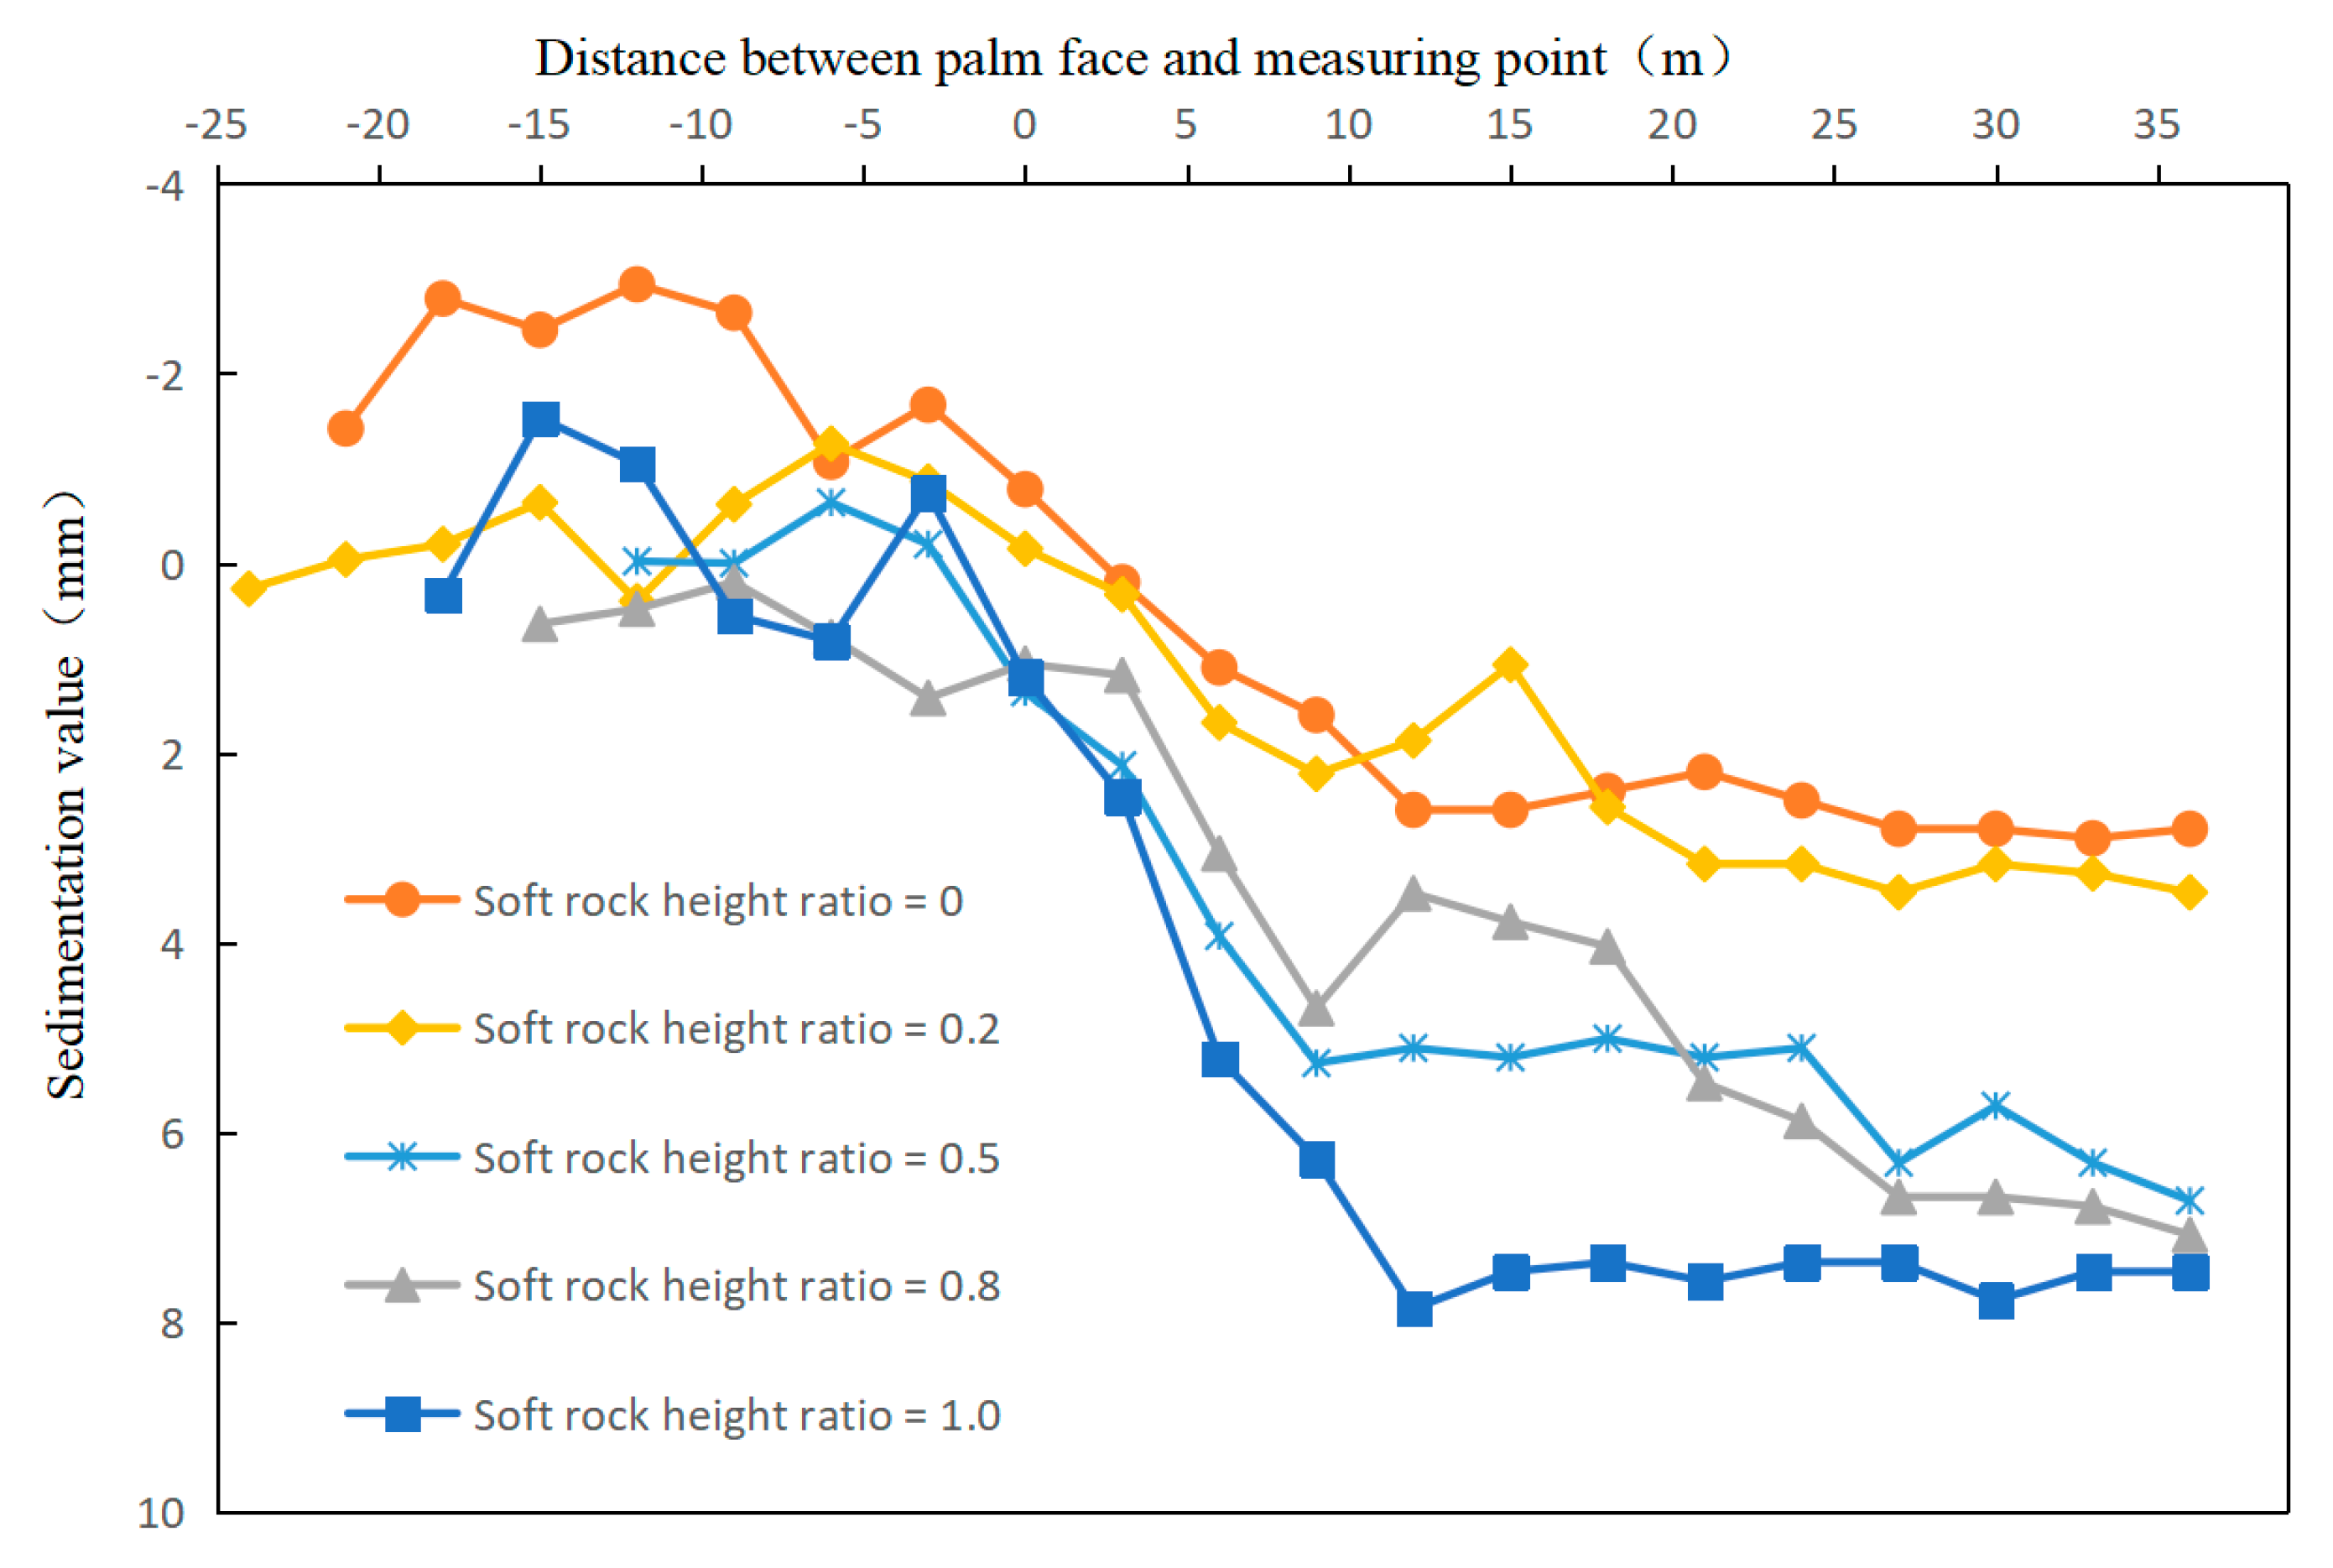
3.2.2. Monitoring and Analysis of Longitudinal Ground Subsidence
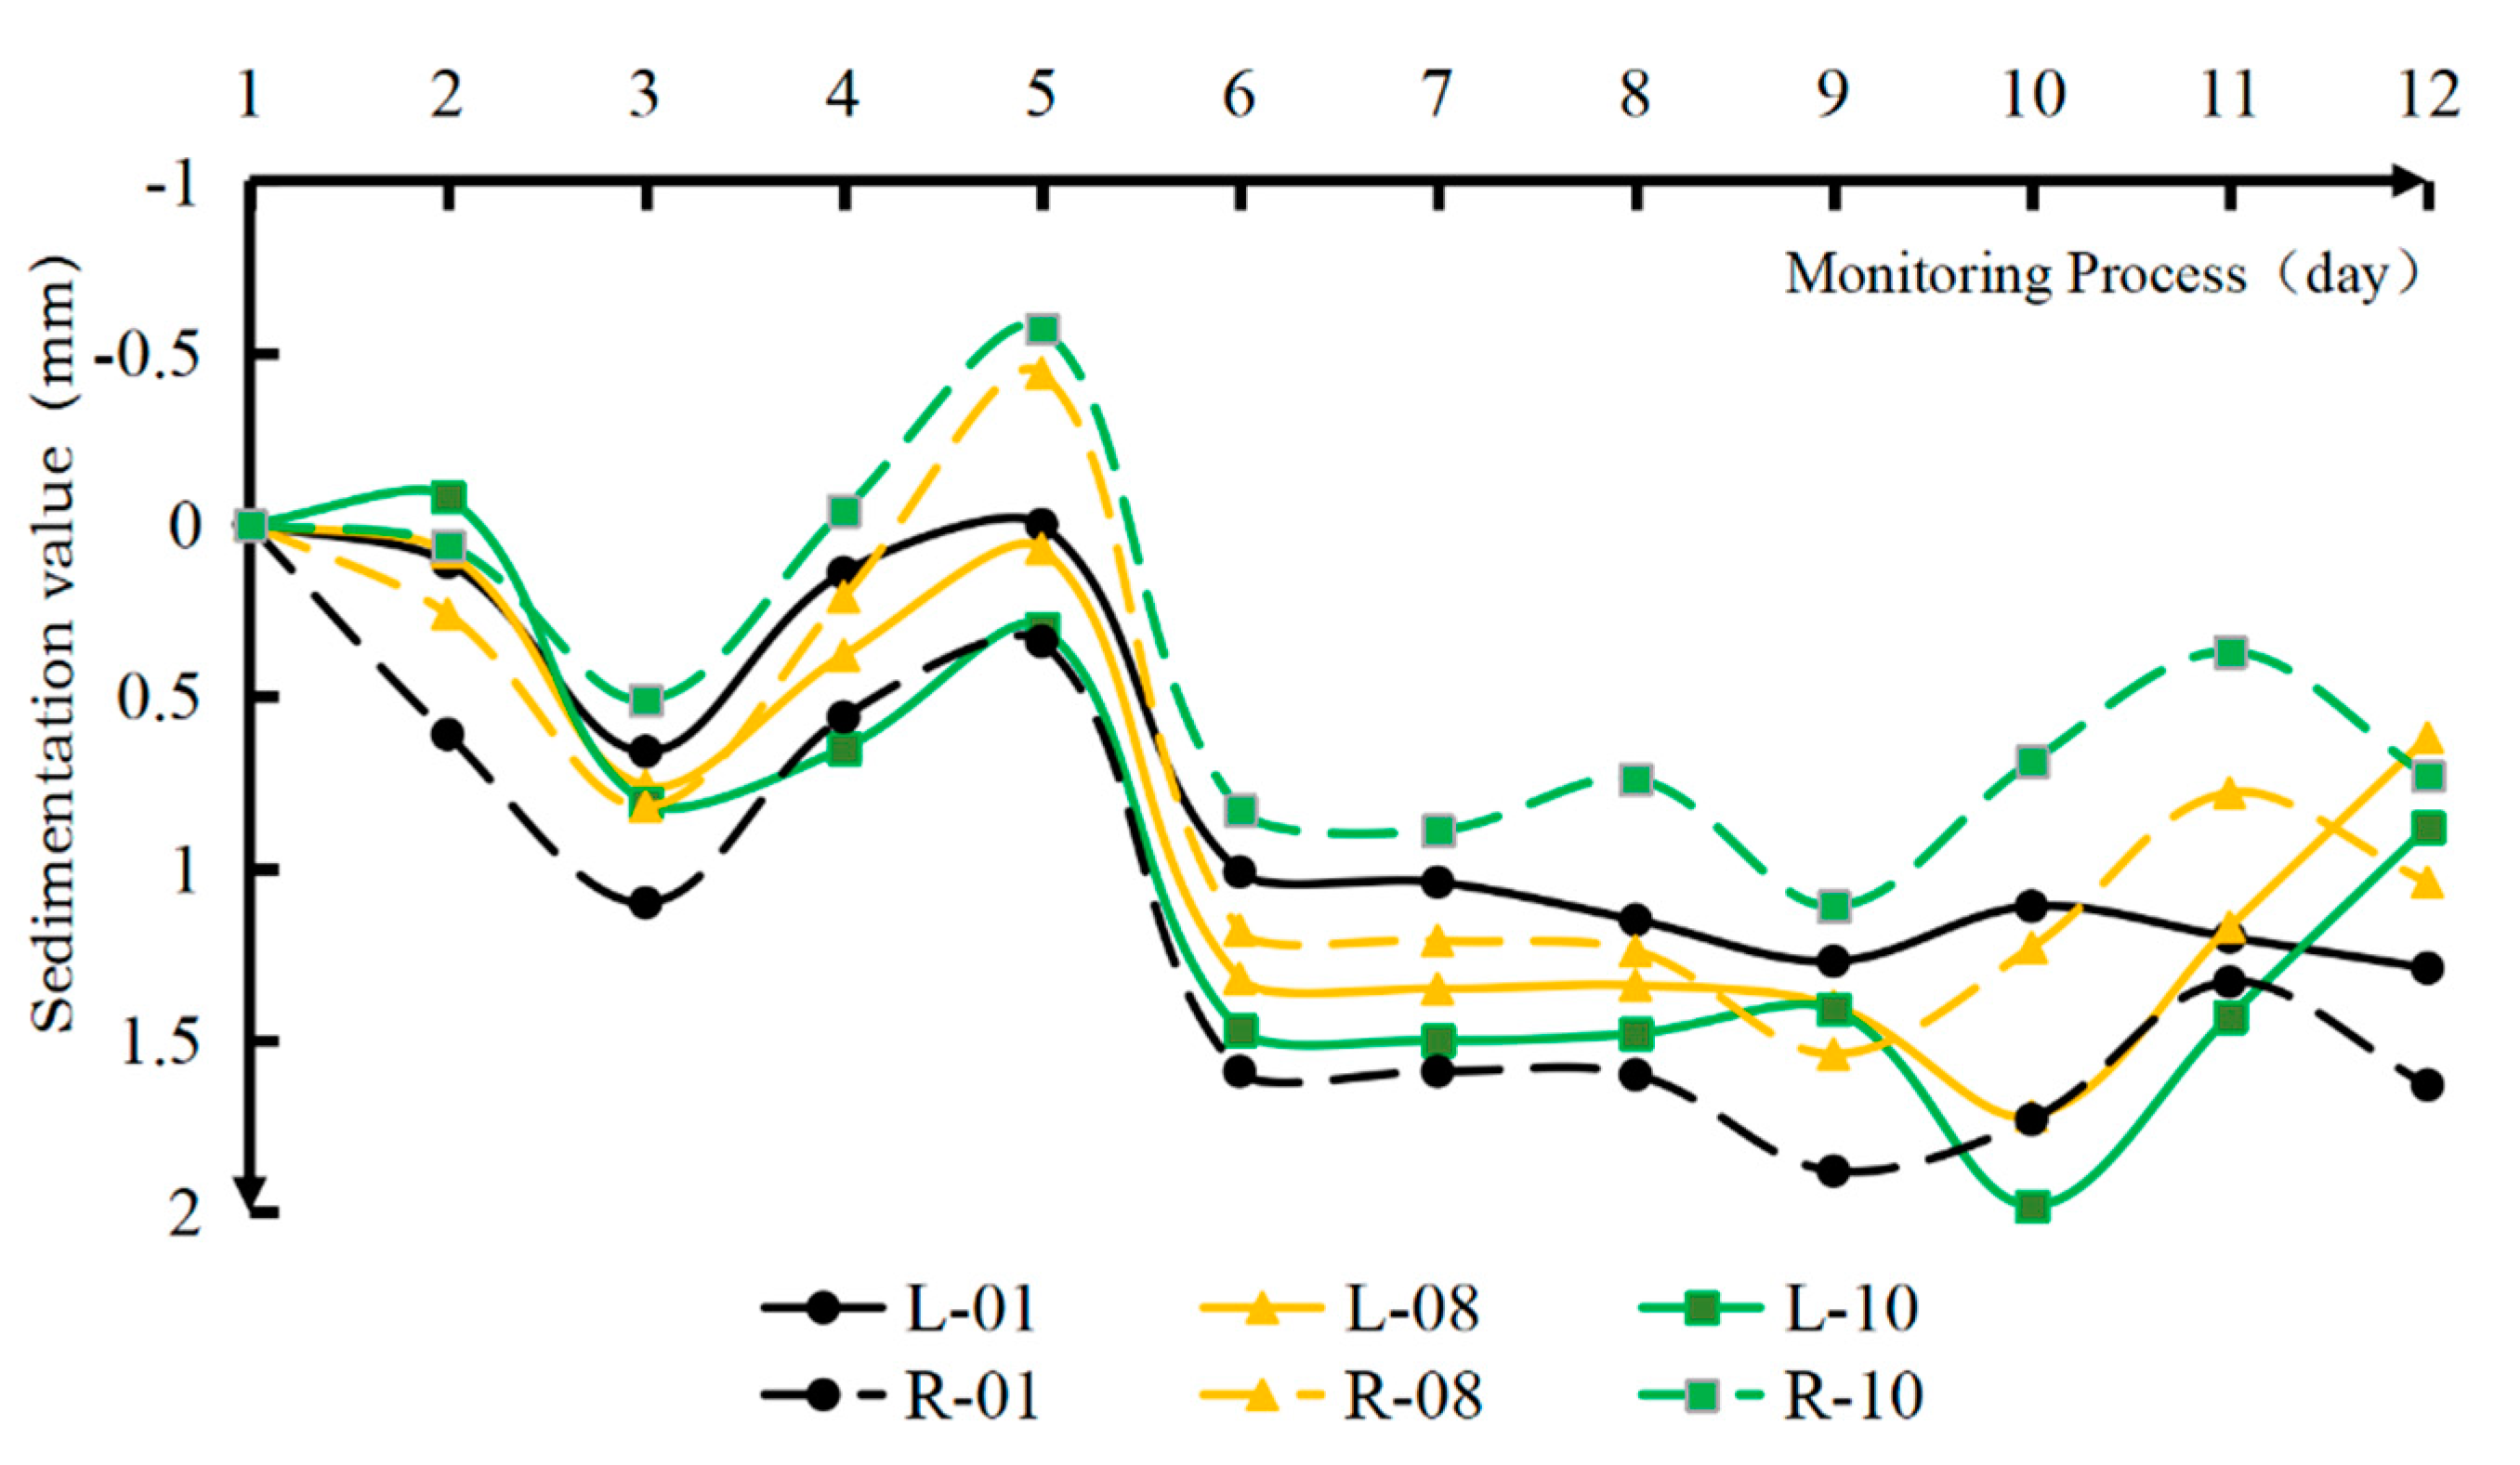
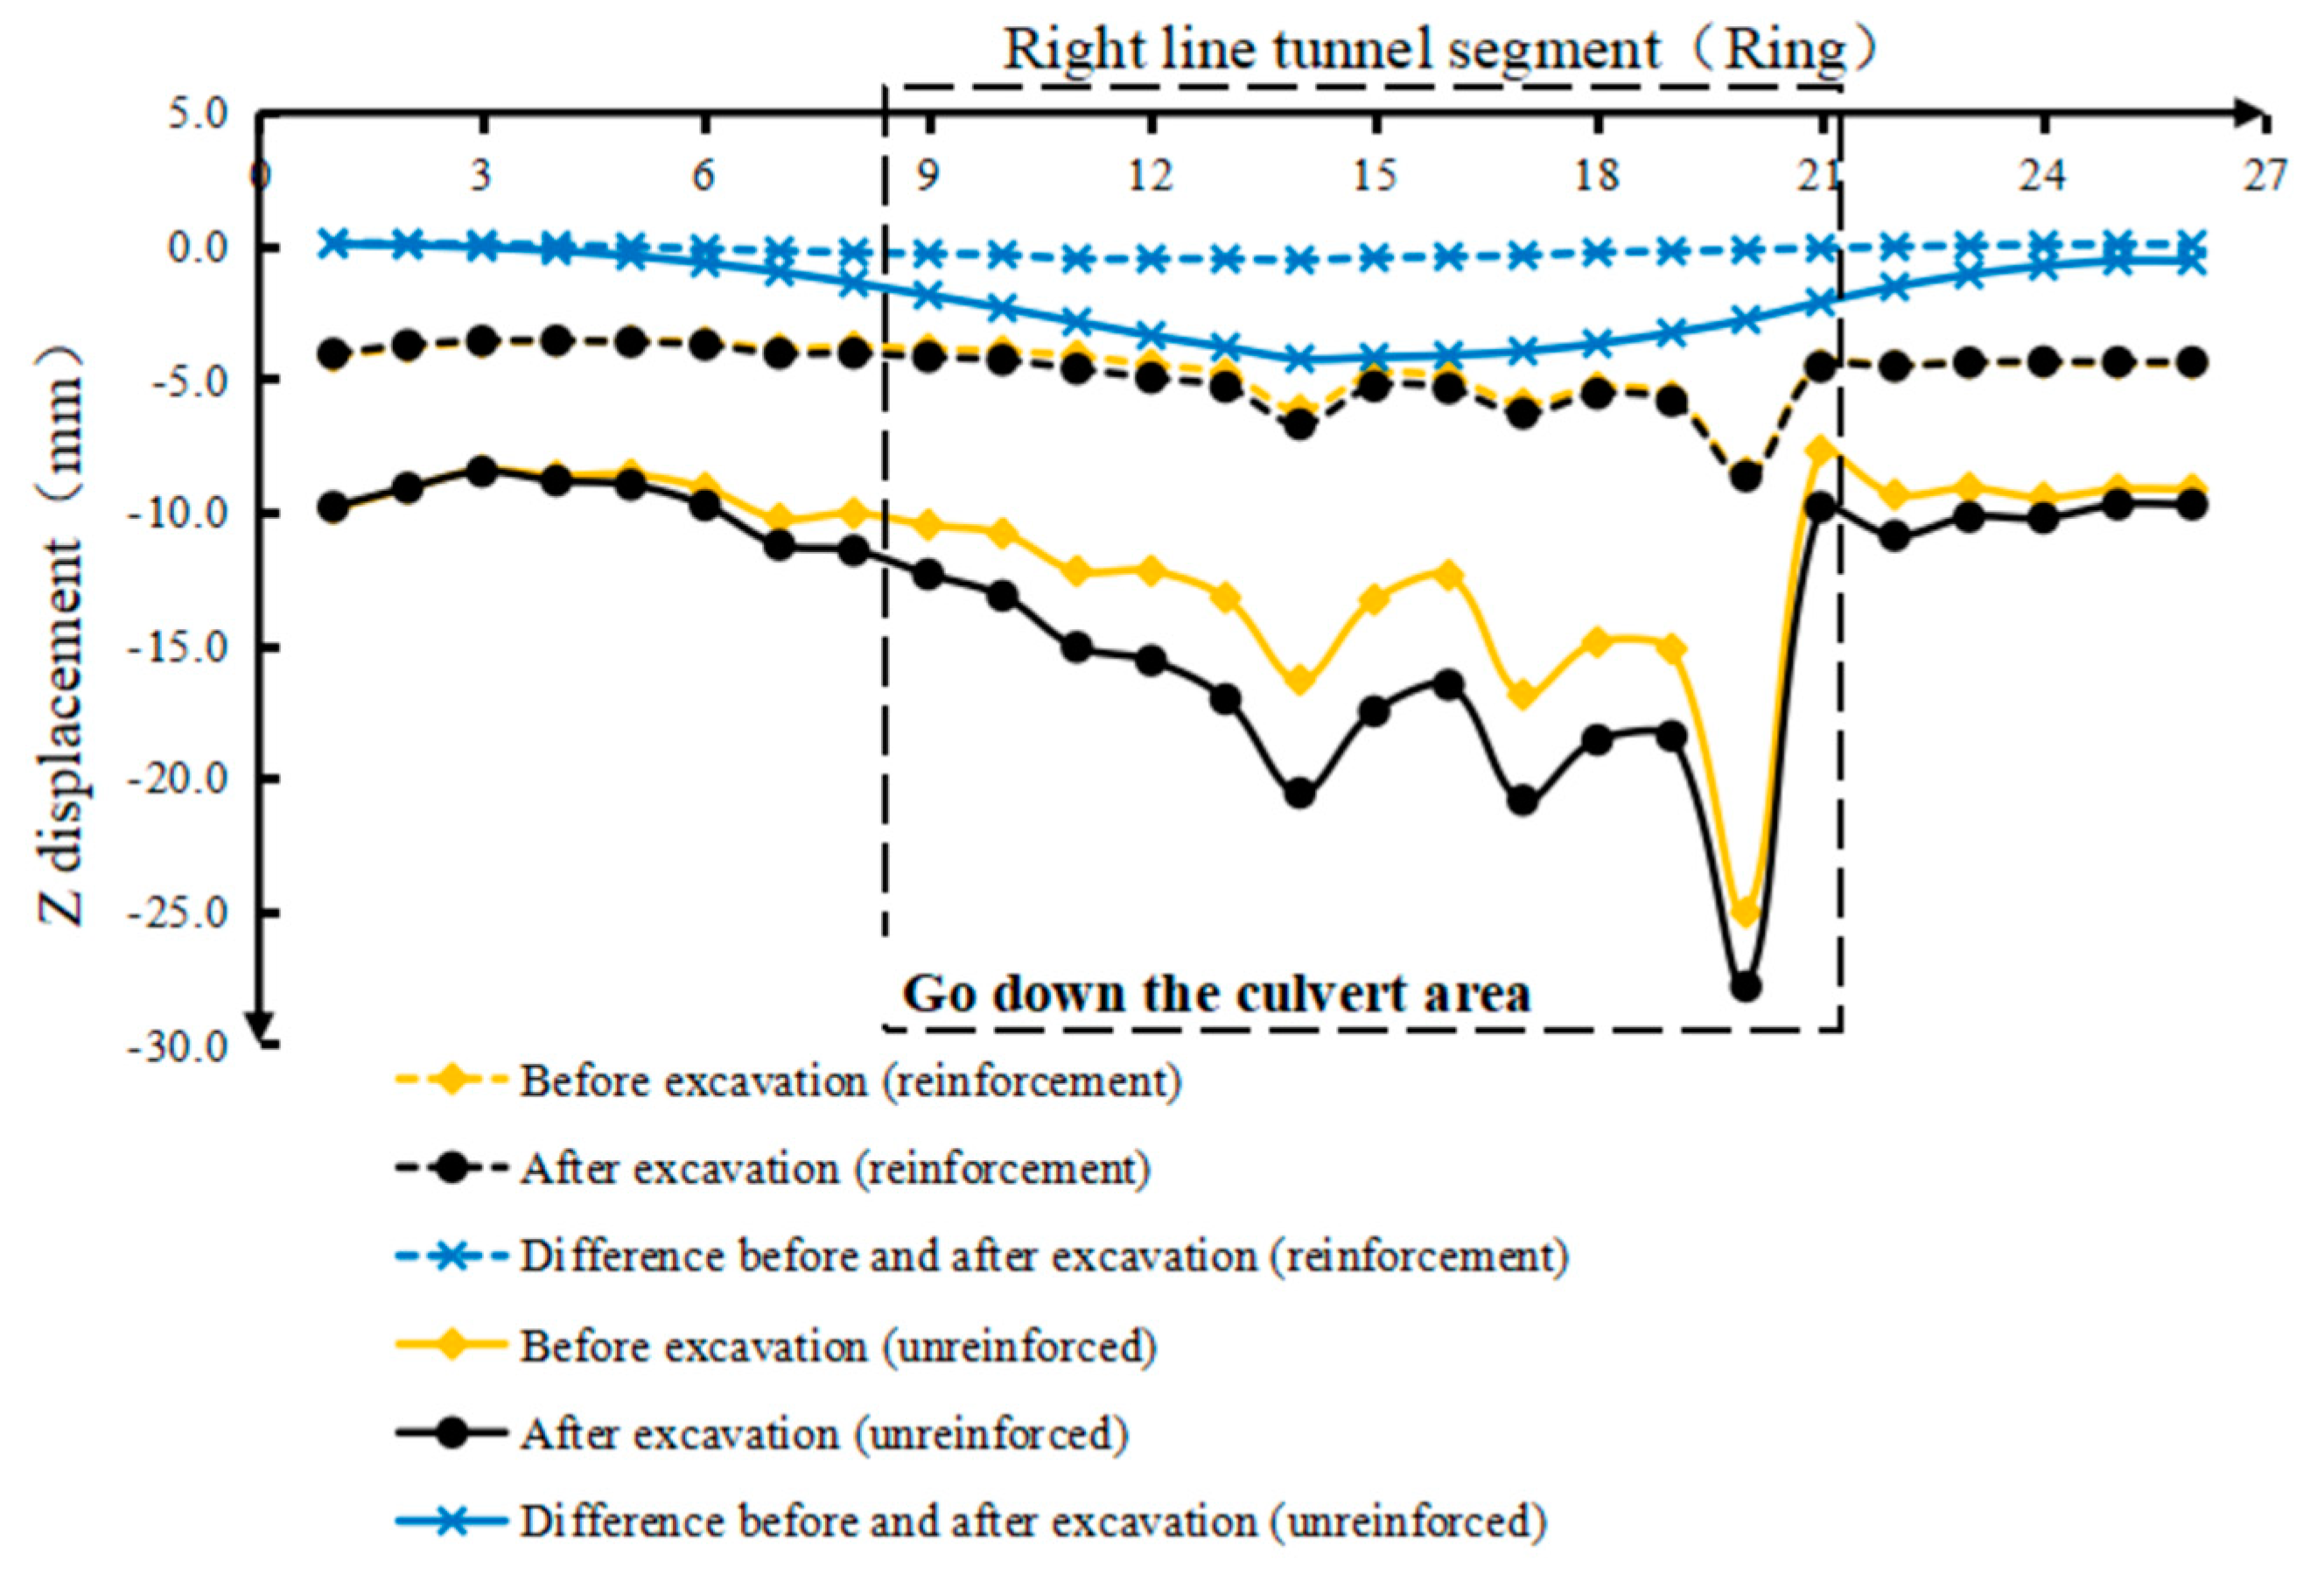
3.3. Monitoring and Analysis of Subsidence in Bridge and Culvert
4. Numerical Simulation
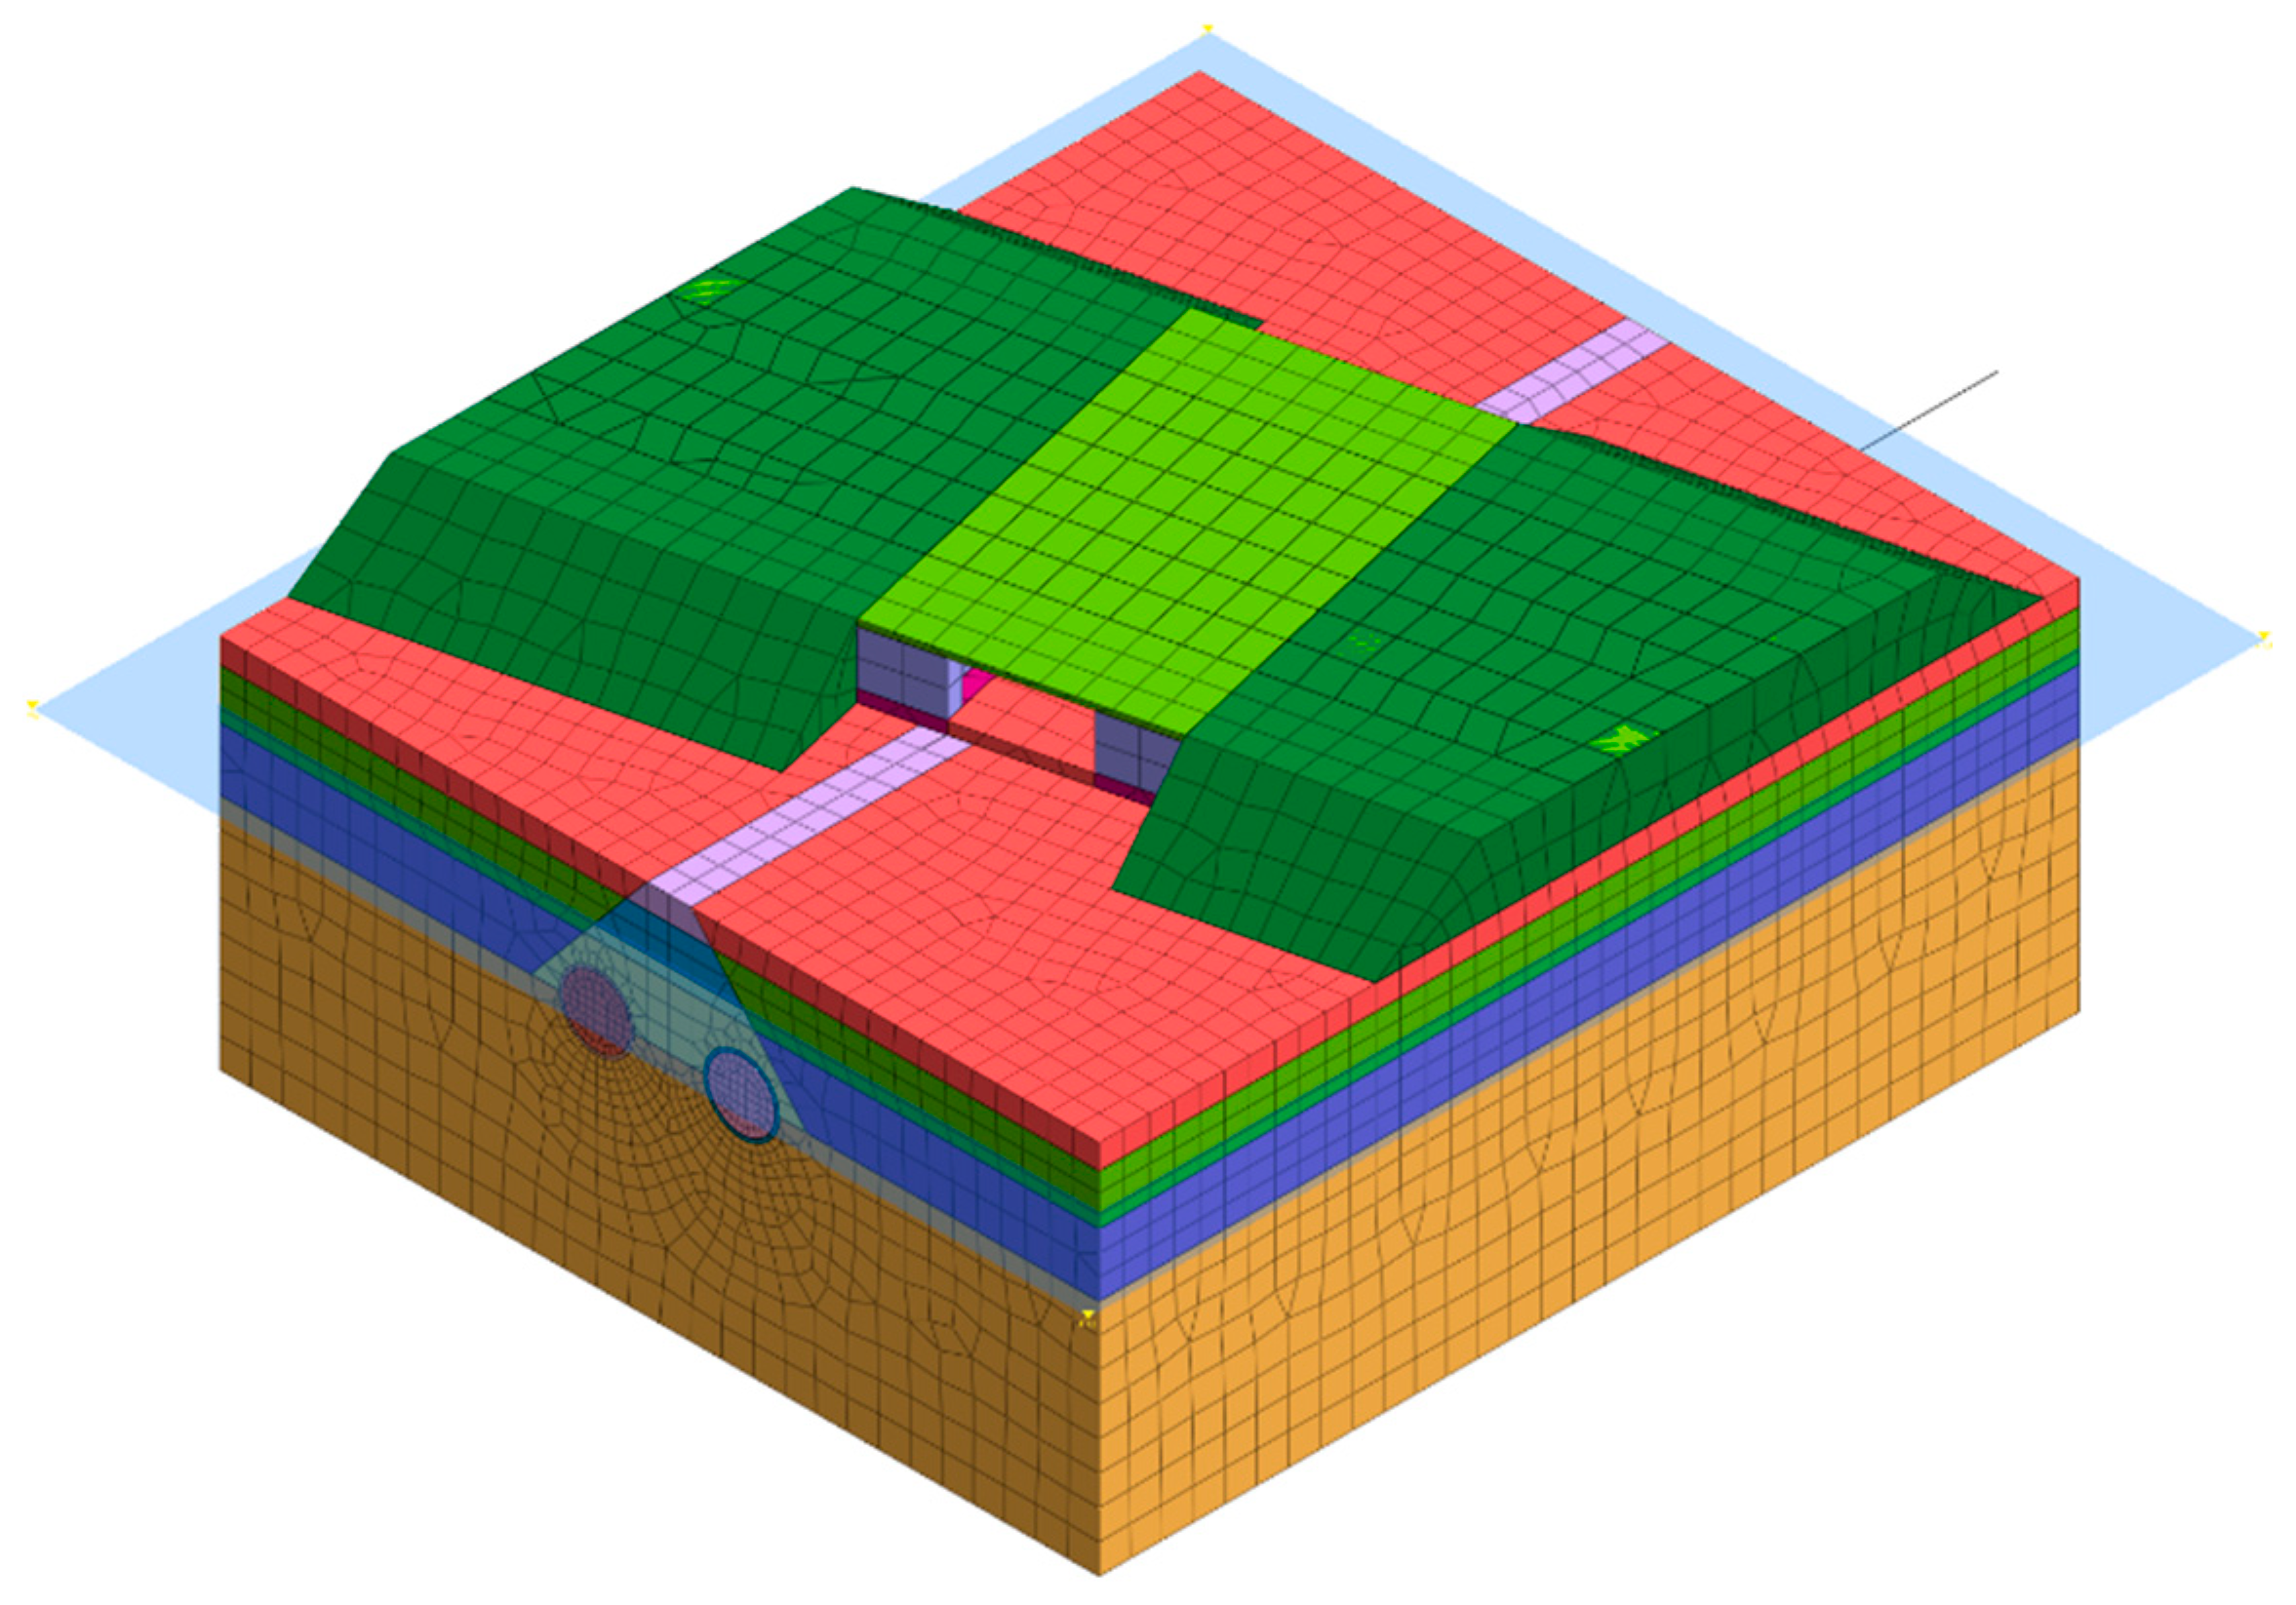
4.1. Establishment of the Finite Element Model
4.2. Simulation of Related Working Conditions
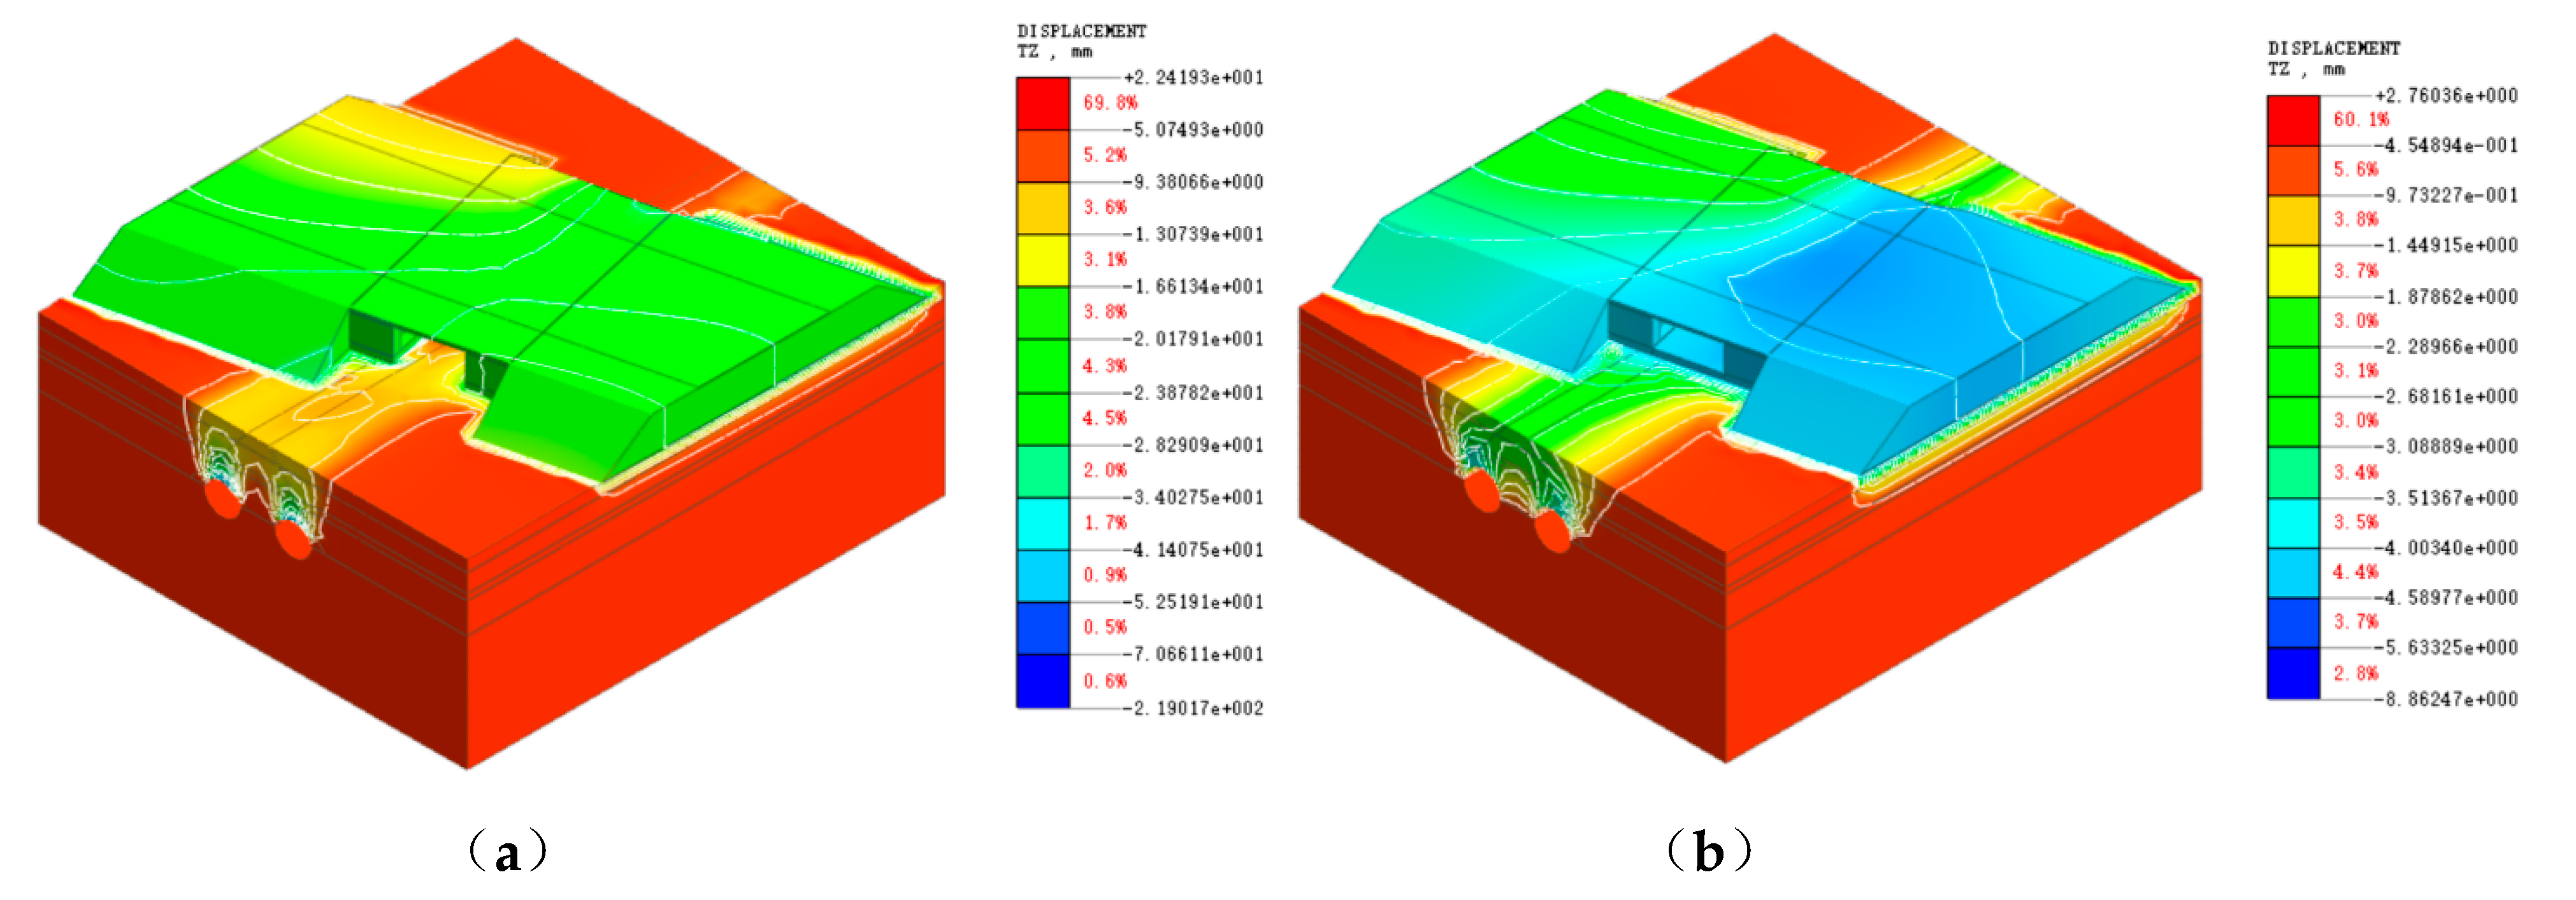
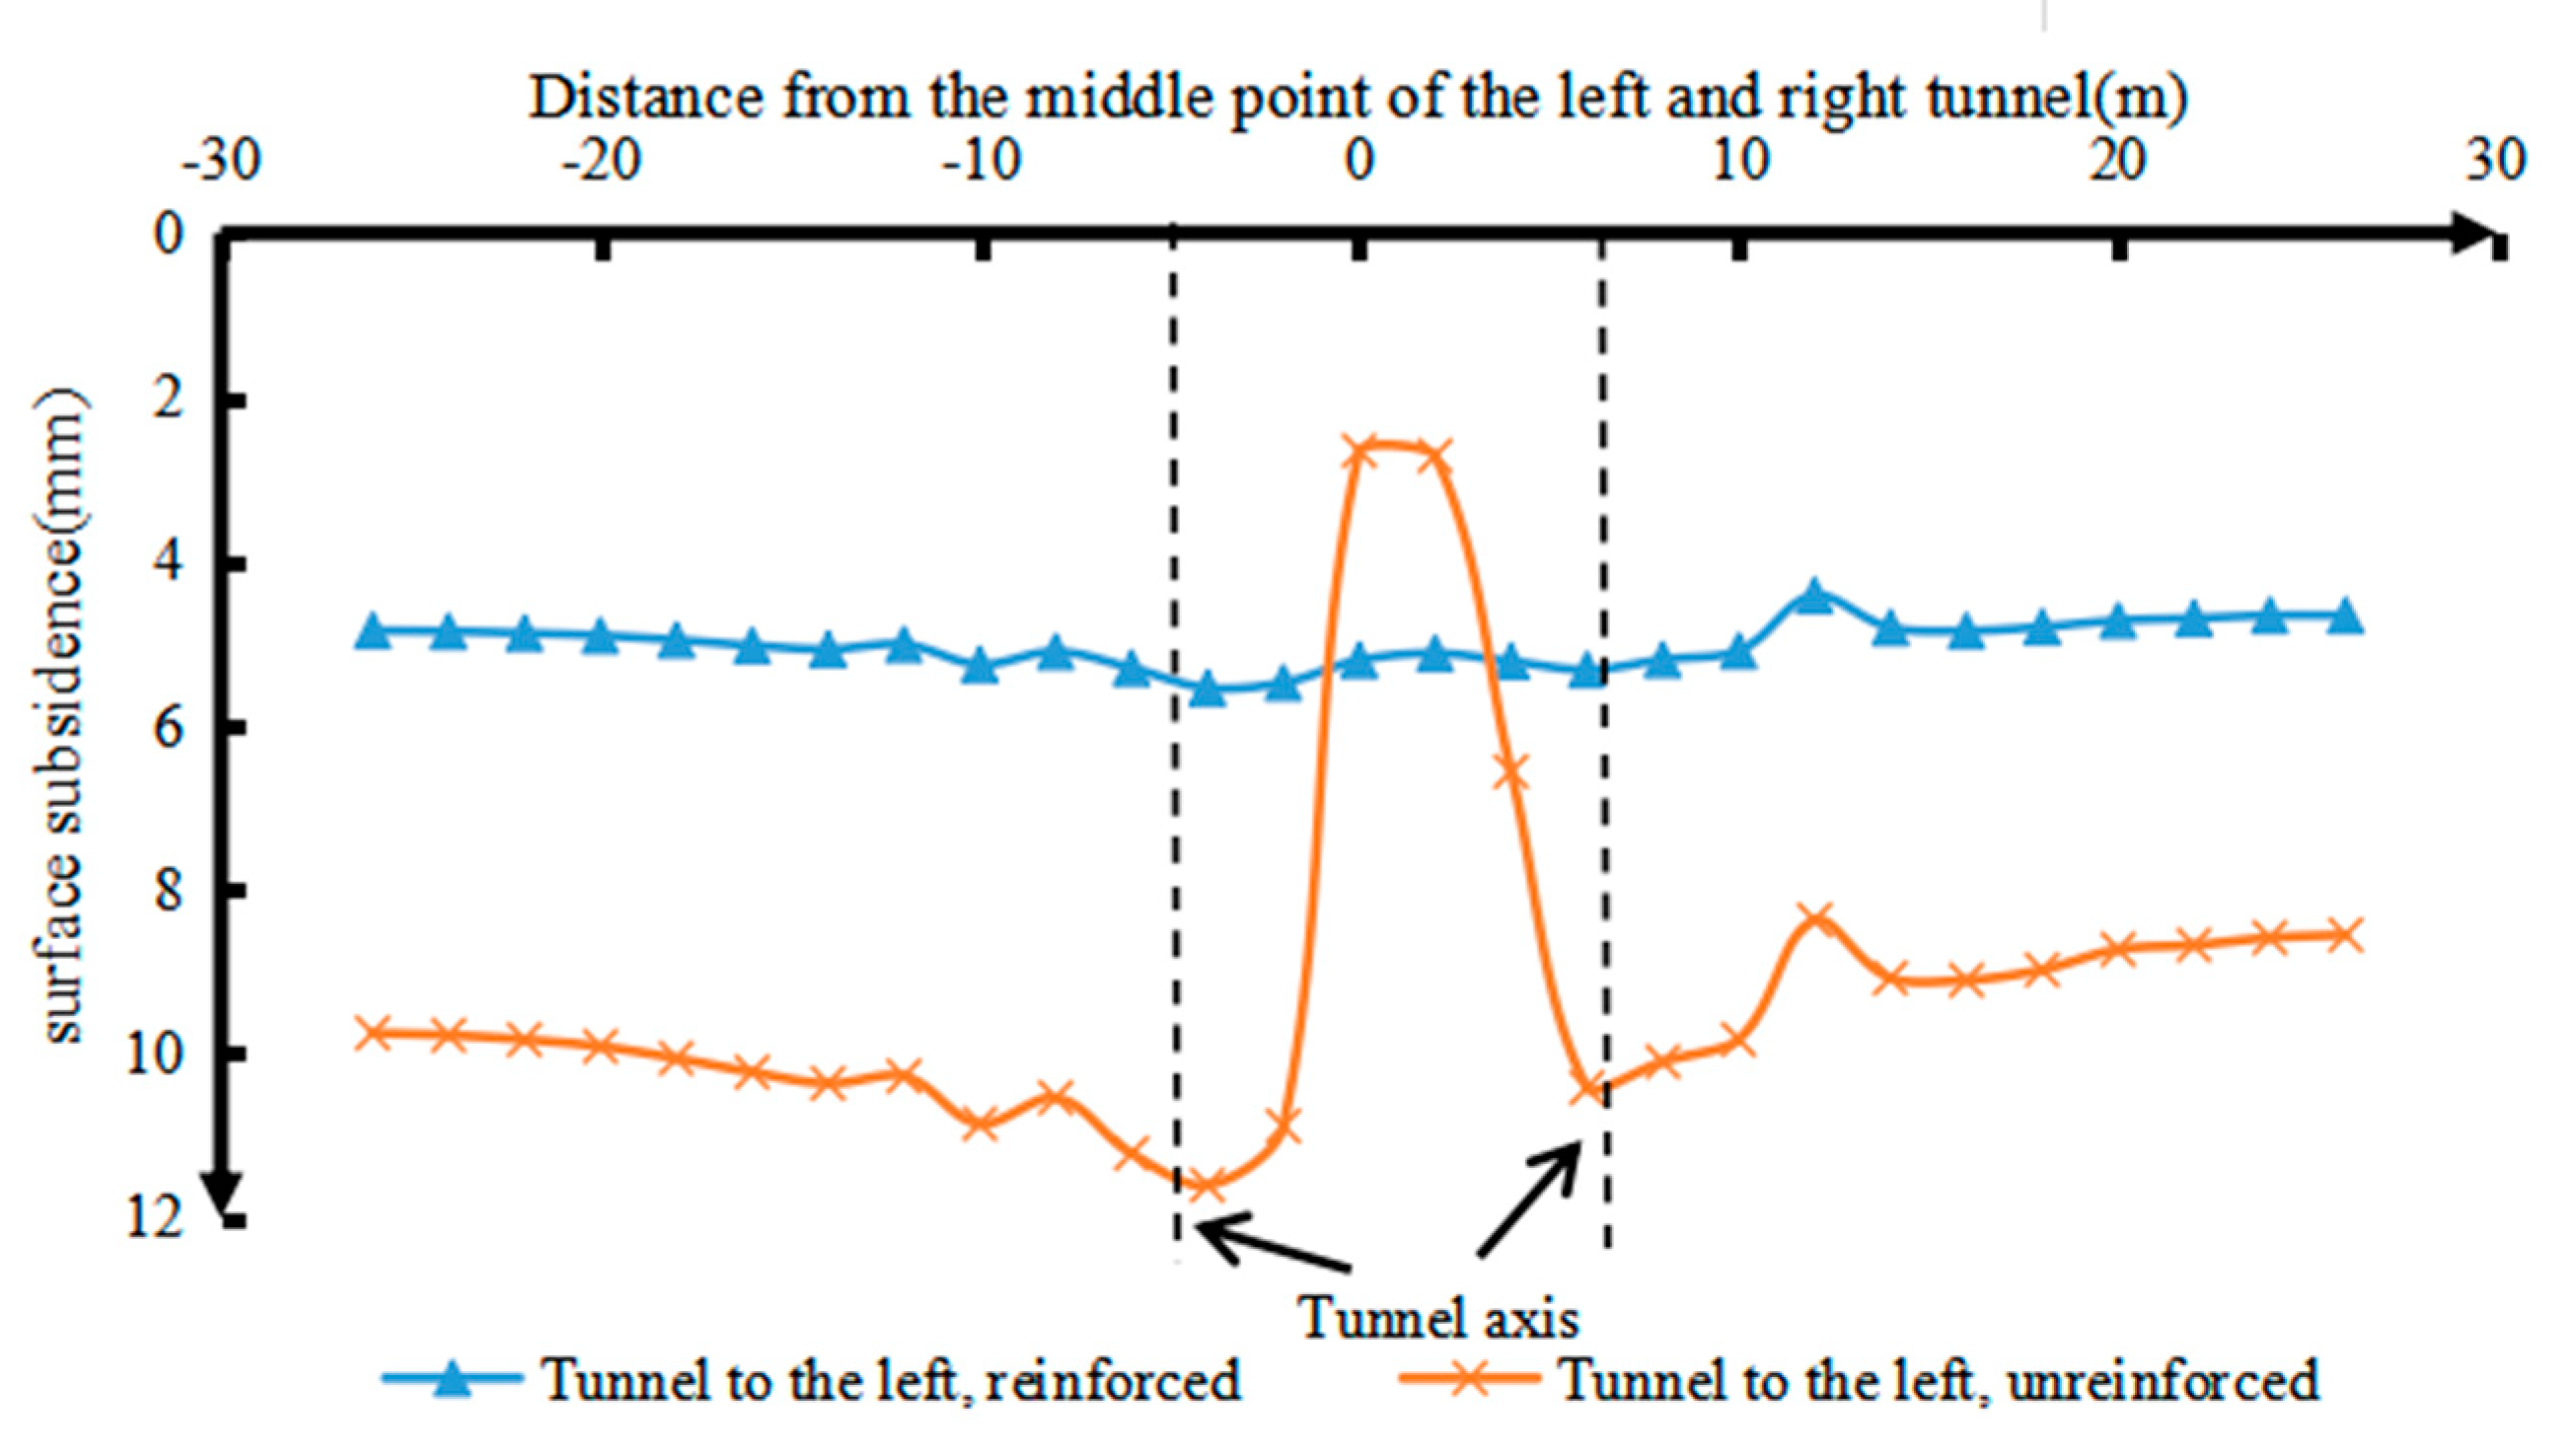
4.3. Ground Subsidence
4.4. Deformation of Tunnel Segments
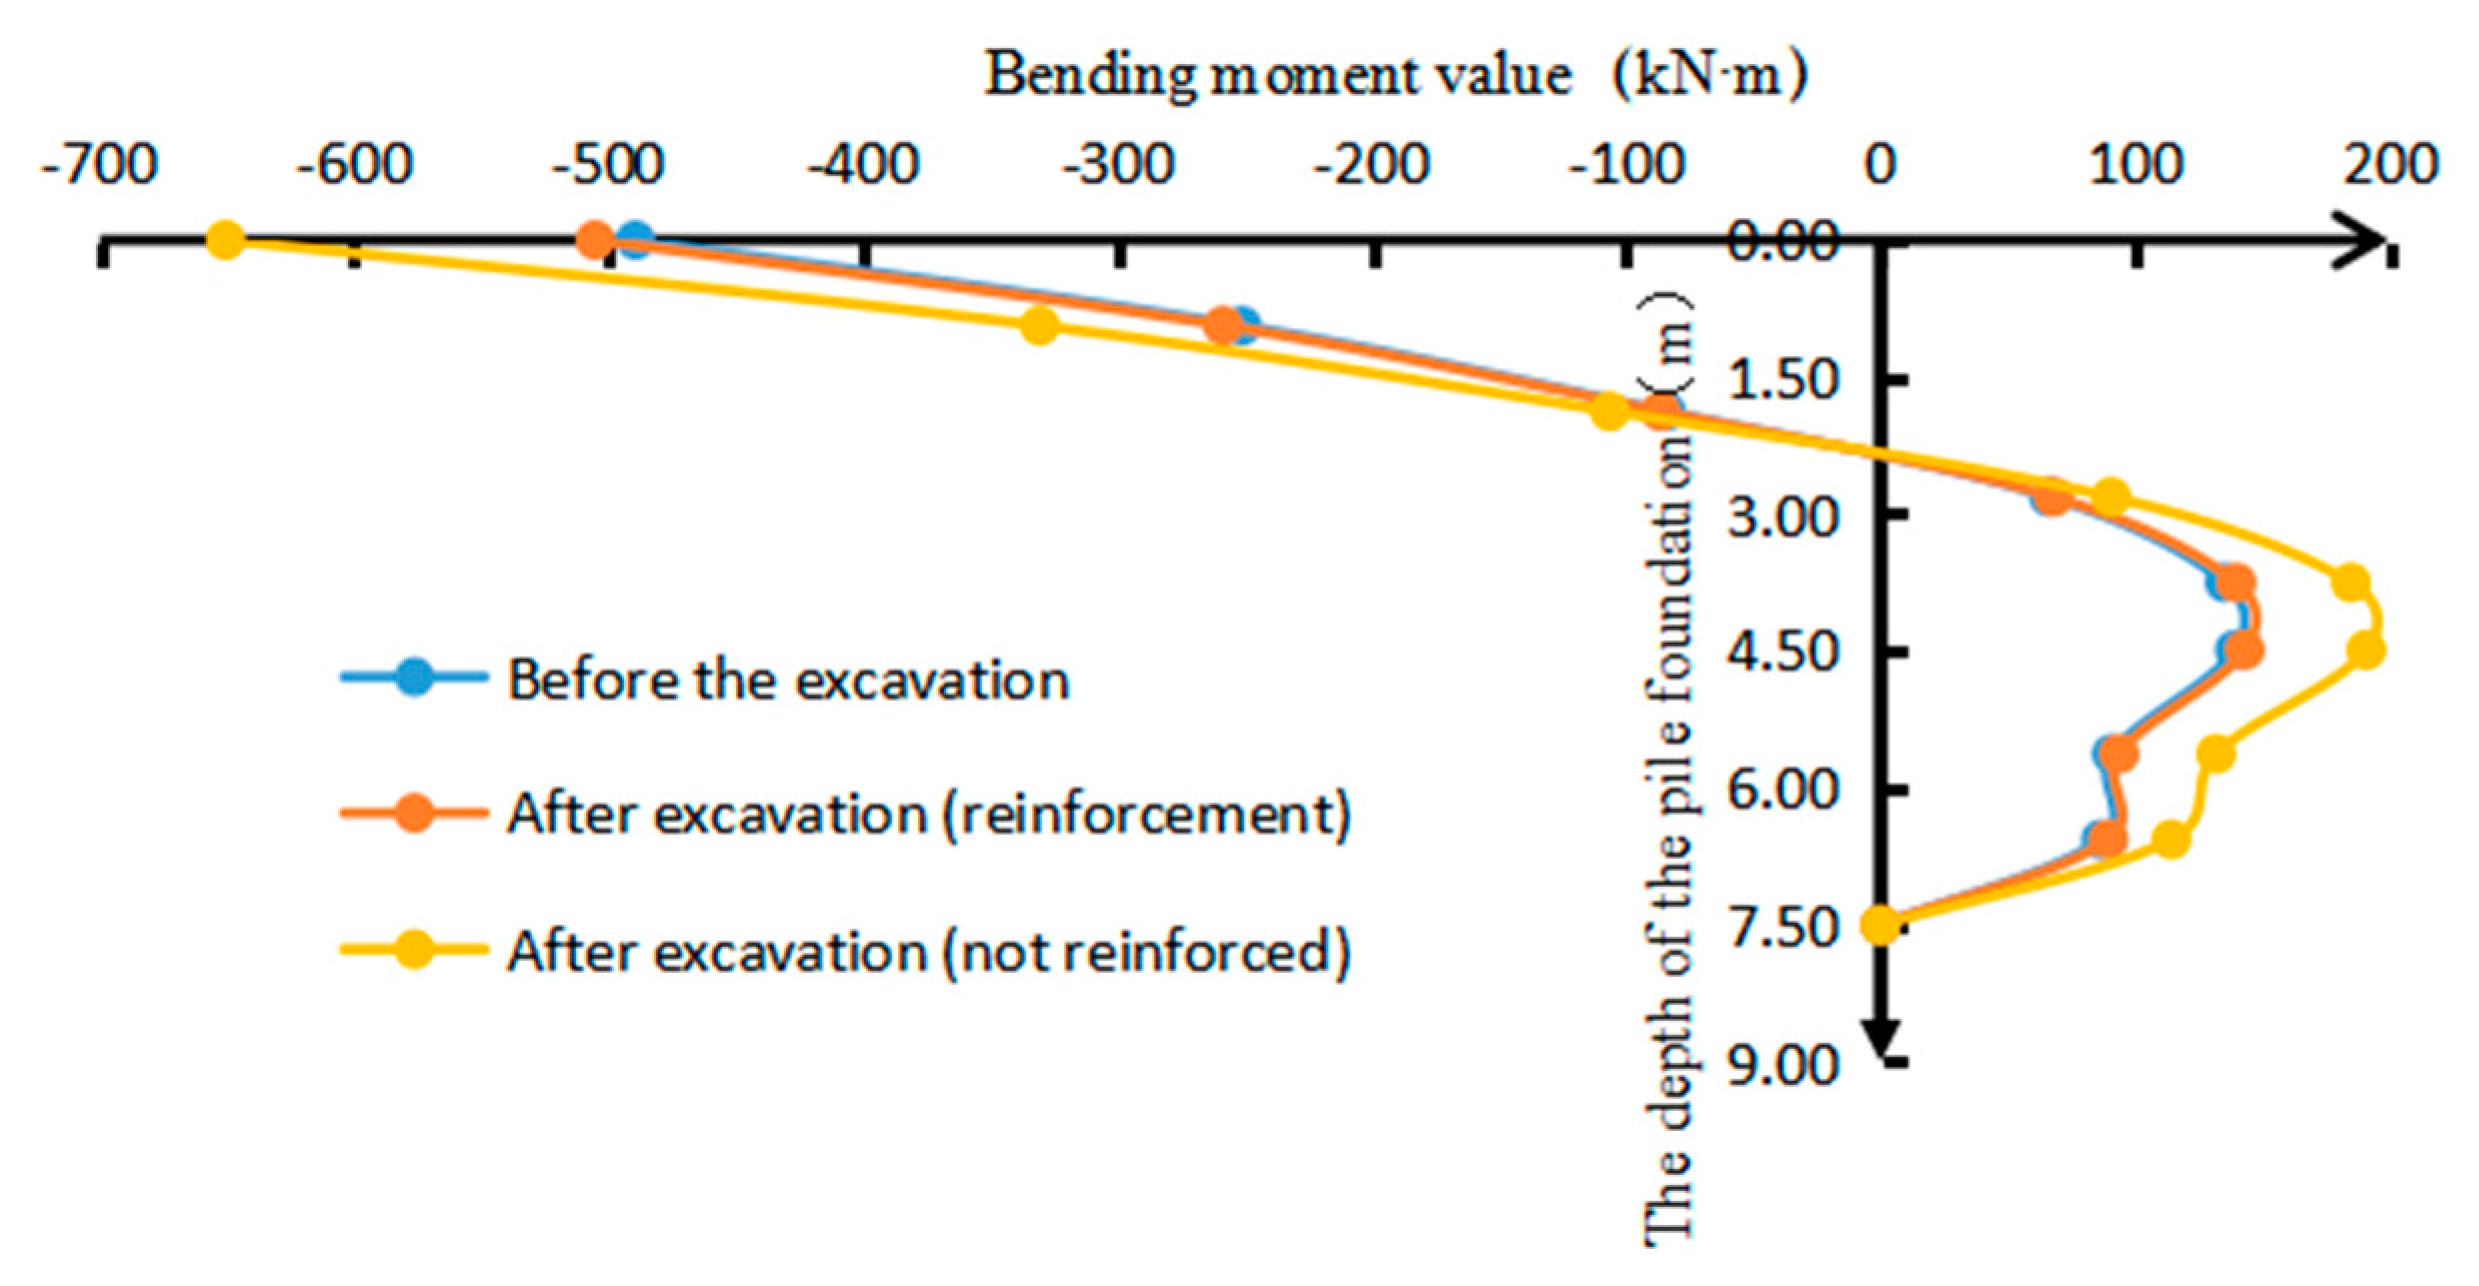
4.5. Pile Foundation Deformation and Internal Force Analysis
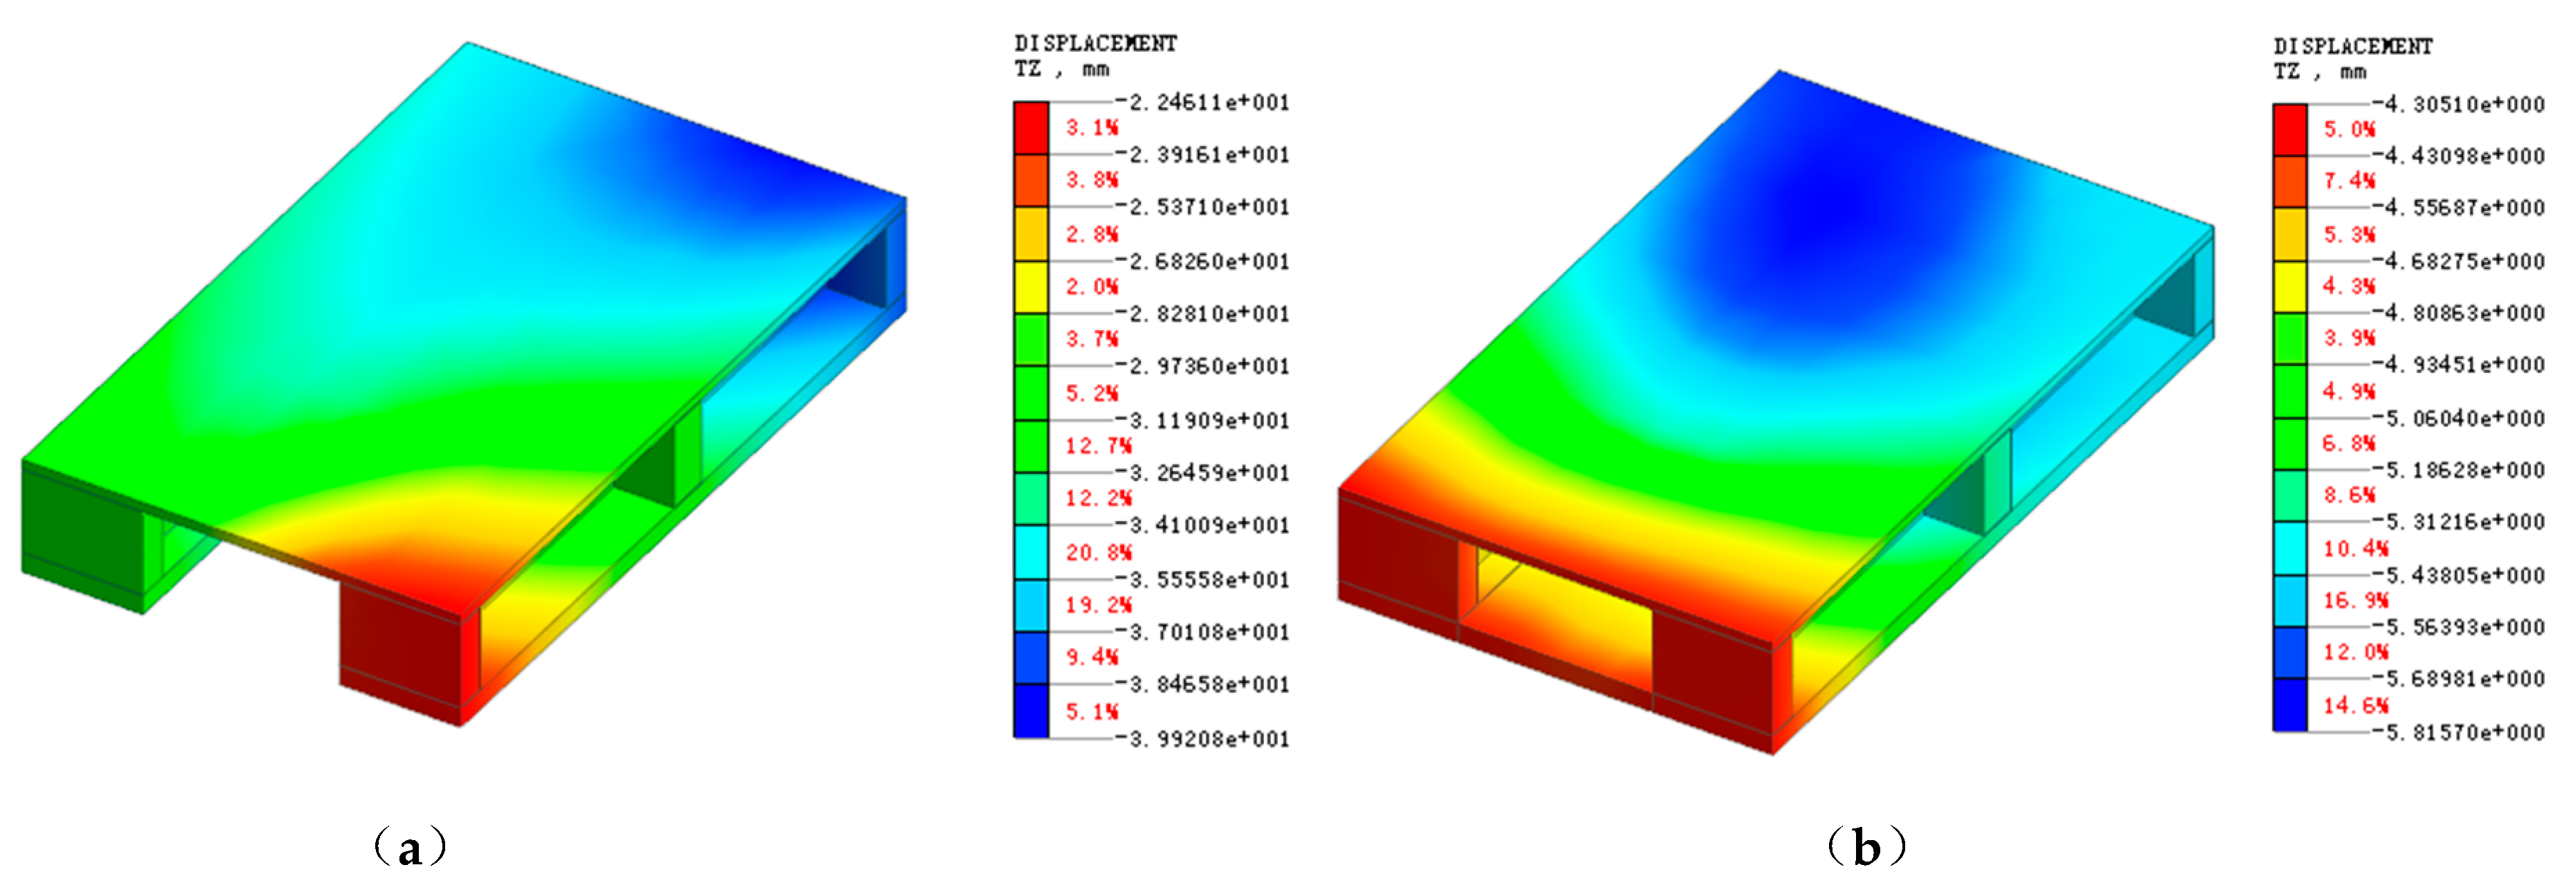
4.6. Analysis of Deformed Culverts
5. Conclusions
Author Contributions
Funding
Institutional Review Board Statement
Informed Consent Statement
Conflicts of Interest
References
- Ng, C.; Fong, K.; Liu, H. The effects of existing horseshoe-shaped tunnel sizes on circular crossing tunnel interactions: Three-dimensional numerical analyses. Tunn. Undergr. Space Technol. 2018, 77, 68–79. [Google Scholar] [CrossRef] [Green Version]
- Lee, J.K.; Yoo, H.; Ban, H.; Park, W.-J. Estimation of Rock Load of Multi-Arch Tunnel with Cracks Using Stress Variable Method. Appl. Sci. 2020, 10, 3285. [Google Scholar] [CrossRef]
- He, Z.; Li, C.; He, Q.; Yang Liu, Y.; Chen, J. Numerical Parametric Study of Countermeasures to Alleviate the Tunnel Excavation Effects on an Existing Tunnel in a Shallow-Buried Environment near a Slope. Appl. Sci. 2020, 10, 608. [Google Scholar] [CrossRef] [Green Version]
- Li, S.; Li, P.; Zhang, M.; Liu, Y. Influence of Approaching Excavation on Adjacent Segments for Twin Tunnels. Appl. Sci. 2019, 10, 98. [Google Scholar] [CrossRef] [Green Version]
- Ma, M.; Cao, R.; Niu, C.; Zhang, H.; Liu, W. Influence of Soil Parameters on Detecting Voids behind a Tunnel Lining Using an Impact Echo Method. Appl. Sci. 2019, 9, 5403. [Google Scholar] [CrossRef] [Green Version]
- Li, X.L.; Wang, B.L.; Li, X.; Ji, C. Analysis of Anti-Floating Measures and Construction Parameters of Shield Tunnel through River under Ultra-Shallow Covering. Appl. Mech. Mater. 2013, 2545, 628–634. [Google Scholar] [CrossRef]
- Xu, H.-Q.; Xiao, C.-J.; Liu, W.-L.; Zuo, Y.-Z.; Wei, C.-Q. Numerical Study on Karst Treatment Technology of Wuhan Metro Line 6. IOP Conf. Ser. Earth Environ. Sci. 2020, 571, 012090. [Google Scholar] [CrossRef]
- Qiu, J.; Liu, H.; Lai, J.; Lai, H. Investigating the Long-Term Settlement of a Tunnel Built over Improved Loessial Foundation Soil Using Jet Grouting Technique. J. Perform. Constr. Facil. 2018, 32, 04018066. [Google Scholar] [CrossRef]
- Tsuboi, H.; Fukada, H.; Ootsuka, M.; Nitao, H.; Isoya, S.; Higashi, S.; Kusakabe, F.; Matsui, T. Quality Characteristics of Improved Soil Columns by New Type Jet Grout Mixing Method. In Proceedings of the 17th International Offshore and Polar Engineering Conference, Lisbon, Portugal, 1–6 July 2007. [Google Scholar]
- Haider, T.F.; Byle, M.J. Verification of Jet Grouting for Structure Rehabilitation. In Proceedings of the Specialty Conference on Performance Confirmation of Constructed Geotechnical Facilities, Amherst, MA, USA, 9–12 April 2000. [Google Scholar]
- Peila, P.D. Soil and rock reinforcements in tunneling. Tunn. Undergr. Space Technol. 1993, 8, 357–372. [Google Scholar]
- Mcwilliam, F. Jet setting under Bonn: Tunn Tunnlg V23, N4. Int. J. Rock Mech. Min. Sci. Geomech. Abstr. 1991, 91, 29–31. [Google Scholar]
- Wu, H.-N.; Zhang, P.; Chen, R.-P.; Lin, X.-T.; Liu, Y. Ground Response to Horizontal Spoil Discharge Jet Grouting with Impacts on the Existing Tunnels. J. Geotech. Geoenviron. Eng. 2020, 146, 05020006. [Google Scholar] [CrossRef]
- Zhang, S.; He, S.; Qiu, J.; Xu, W.; Garnes, R.S.; Wang, L. Displacement Characteristics of an Urban Tunnel in Silty Soil by the Shallow Tunnelling Method. Adv. Civ. Eng. 2020, 2020, 3975745. [Google Scholar] [CrossRef]
- Zhao, C.; Lei, M.; Shi, C.; Cao, H.; Yang, W.; Deng, E. Function mechanism and analytical method of a double layer pre-support system for tunnel underneath passing a large-scale underground pipe gallery in water-rich sandy strata: A case study. Tunn. Undergr. Space Technol. Inc. Trenchless Technol. Res. 2021, 115, 104041. [Google Scholar] [CrossRef]
- Burke, G.K. Jet Grouting Systems: Advantages and Disadvantages. In Proceedings of the Geosupport Conference, Orlando, FL, USA, 29–31 December 2004. [Google Scholar]
- Filz, G.M.; Hodges, D.K.; Weatherby, D.E.; Marr, W.A. Standardized Definitions and Laboratory Procedures for Soil-Cement Specimens Applicable to the Wet Method of Deep Mixing. In Proceedings of the Innovations in Grouting and Soil Improvement, Austin, TX, USA, 24–26 January 2005. [Google Scholar]
- Lorenzo, G.A.; Bergado, D.T. Fundamental Parameters of Cement-Admixed Clay—New Approach. J. Geotech. Geoenviron Eng. 2004, 130, 1042–1050. [Google Scholar] [CrossRef]
- Reddy, B.; Gupta, A. Characteristics of cement-soil mortars. Mater. Struct. 2005, 38, 639–650. [Google Scholar] [CrossRef]
- Lignola, G.P.; Flora, A.; Manfredi, G. Simple Method for the Design of Jet Grouted Umbrellas in Tunneling. J. Geotech. Geoenviron. Eng. 2008, 134, 1778–1790. [Google Scholar] [CrossRef]
- Tonon, F. ADECO full-face tunnel excavation of two 260 m2 tubes in clays with sub-horizontal jet-grouting under minimal urban cover. Tunn. Undergr. Space Technol. 2011, 26, 253–266. [Google Scholar] [CrossRef]
- Pichler, C.; Lackner, R.; Martak, L.; Mang, H.A. Optimization of jet-grouted support in NATM tunneling. Int. J. Numer. Anal. Methods Geomech. 2004, 28, 781–796. [Google Scholar] [CrossRef]
- Peck, R.B. Deep excavations and tunneling in soft ground. In Proceedings of the 7th International Conference on Soil Mechanics and Foundation Engineering, Mexico City, Mexico, 29 August 1969. [Google Scholar]
- Rowe, R.K.; Kack, G.J. A theoretical examination of the settlements induced by tunneling: Four case histories. Can. Geotech. J. 2011, 20, 299–314. [Google Scholar] [CrossRef]
- Lee, K.M.; Rowe, R.K.; Lo, K.Y. Subsidence owing to tunneling. I. Estimating the gap parameter. Can. Geotech. J. 1992, 29, 929–940. [Google Scholar] [CrossRef]
- Rowe, R.K.; Lee, K.M. Subsidence owing to tunneling. II. Evaluation of a prediction technique. Can. Geotech. J. 1992, 29, 92–105. [Google Scholar] [CrossRef]
- Attewell, P.B.; Woodman, J.P. Predicting the dynamics of ground settlement and its derivatives caused by tunneling in soil. Ground Eng. 1982, 15, 13–22. [Google Scholar]
- Bobet, A. Analytical Solutions for Shallow Tunnels in Saturated Ground. J. Eng. Mech. 2001, 127, 1258–1266. [Google Scholar] [CrossRef]
- Hisstske, M.A. new settlement analysis in tunnel excavation. tunnels and underground. Jpn. Tunn. Assoc. 2009, 40, 45–50. [Google Scholar]
- Hisatake, M.A. proposed methodology for analysis of ground settlements caused by tunneling, with particular reference to the “buoyancy” effect. Tunn. Undergr. Space Technol. Inc. Trenchless Technol. Res. 2011, 26, 130–138. [Google Scholar] [CrossRef]
- Sun, H.; Wang, L.; Chen, S.; Deng, H.; Zhang, J. A Precise Prediction of Tunnel Deformation Caused by Circular Foundation Pit Excavation. Appl. Sci. 2019, 9, 2275. [Google Scholar] [CrossRef] [Green Version]
- Huasheng, S.; Wenbin, S. Effect of Soil Reinforcement on Tunnel Deformation as a Result of Stress Relief. Appl. Sci. 2019, 9, 1420. [Google Scholar]
- Gan, X.; Yu, J.; Gong, X.; Zhu, M. Characteristics and Countermeasures of Tunnel Heave due to Large-Diameter Shield Tunneling Underneath. J. Perform. Constr. Facil. 2020, 34, 04019081. [Google Scholar] [CrossRef]
- Zhang, Y.; Yin, Z.; Xu, Y. Analysis of surface deformation caused by shield tunneling. Chin. J. Rock Mech. Eng. 2002, 3, 388–392. [Google Scholar]


| Name of Soil or Structure | Modulus of Elasticity (MPa) | Poisson’s Ratio | Severe (KN/m3) | Cohesive Force (kPa) | Internal Friction Angle (°) |
|---|---|---|---|---|---|
| <1> Miscellaneous fill | 2.5 | 0.35 | 16.5 | 8 | 10 |
| <4-2B> Silty sand | 5 | 0.42 | 17 | 12.6 | 12.8 |
| <3-1> Silty-fine sand | 12 | 0.25 | 20.3 | 15 | 35 |
| <3-3> Gravelly sand | 40 | 0.30 | 19.6 | 10 | 30.5 |
| <9C-2> Slightly weathered limestone | 10,000 | 0.30 | 25 | 1500 | 55 |
| Grouting reinforcement material | 2000 | 0.23 | 20 | - | - |
| Raft | 30,000 | 0.3 | 25 | - | - |
| Segment | 34,500 × 0.7 | 0.2 | 25 | - | - |
| Equivalent layer | 13 | 0.3 | 22.5 | - | - |
Publisher’s Note: MDPI stays neutral with regard to jurisdictional claims in published maps and institutional affiliations. |
© 2021 by the authors. Licensee MDPI, Basel, Switzerland. This article is an open access article distributed under the terms and conditions of the Creative Commons Attribution (CC BY) license (https://creativecommons.org/licenses/by/4.0/).
Share and Cite
Li, Z.; Lv, J.; Xie, X.; Fu, H.; Huang, J.; Li, Z. Mechanical Characteristics of Structures and Ground Deformation Caused by Shield Tunneling Under-Passing Highways in Complex Geological Conditions Based on the MJS Method. Appl. Sci. 2021, 11, 9323. https://doi.org/10.3390/app11199323
Li Z, Lv J, Xie X, Fu H, Huang J, Li Z. Mechanical Characteristics of Structures and Ground Deformation Caused by Shield Tunneling Under-Passing Highways in Complex Geological Conditions Based on the MJS Method. Applied Sciences. 2021; 11(19):9323. https://doi.org/10.3390/app11199323
Chicago/Turabian StyleLi, Zikun, Jianbing Lv, Xiaodong Xie, Helin Fu, Juan Huang, and Zhanrong Li. 2021. "Mechanical Characteristics of Structures and Ground Deformation Caused by Shield Tunneling Under-Passing Highways in Complex Geological Conditions Based on the MJS Method" Applied Sciences 11, no. 19: 9323. https://doi.org/10.3390/app11199323
APA StyleLi, Z., Lv, J., Xie, X., Fu, H., Huang, J., & Li, Z. (2021). Mechanical Characteristics of Structures and Ground Deformation Caused by Shield Tunneling Under-Passing Highways in Complex Geological Conditions Based on the MJS Method. Applied Sciences, 11(19), 9323. https://doi.org/10.3390/app11199323