
Strain-Softening Analyses of a Circular Bore under the Influence of Axial Stress

Abstract
:1. Introduction
2. Problem Definition and Analytical Method
2.1. Problem Definition
2.2. Critical Pressure
3. Strain-Softening Analyses and Solution Procedure
3.1. Strain-Softening Process
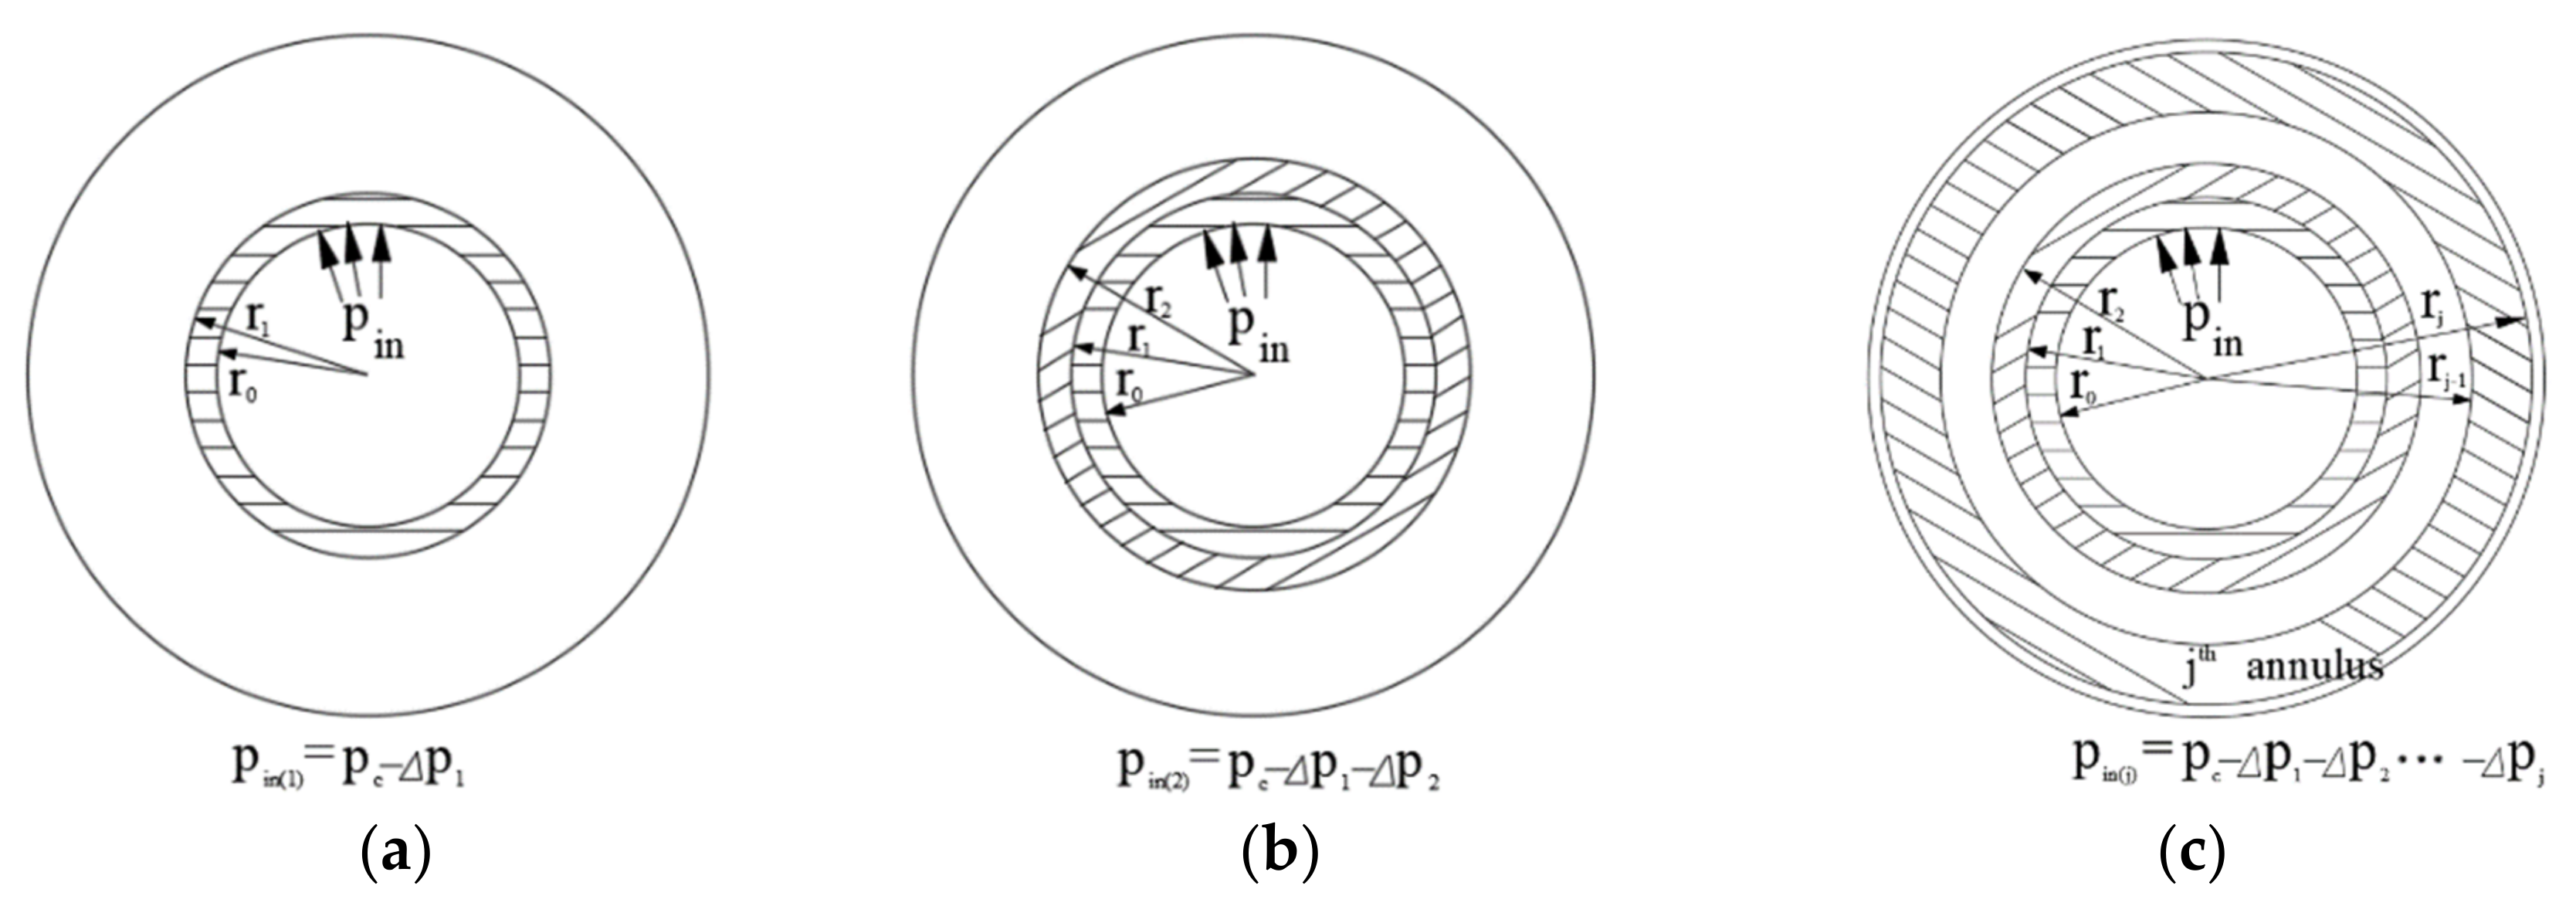
3.2. Solution Procedures
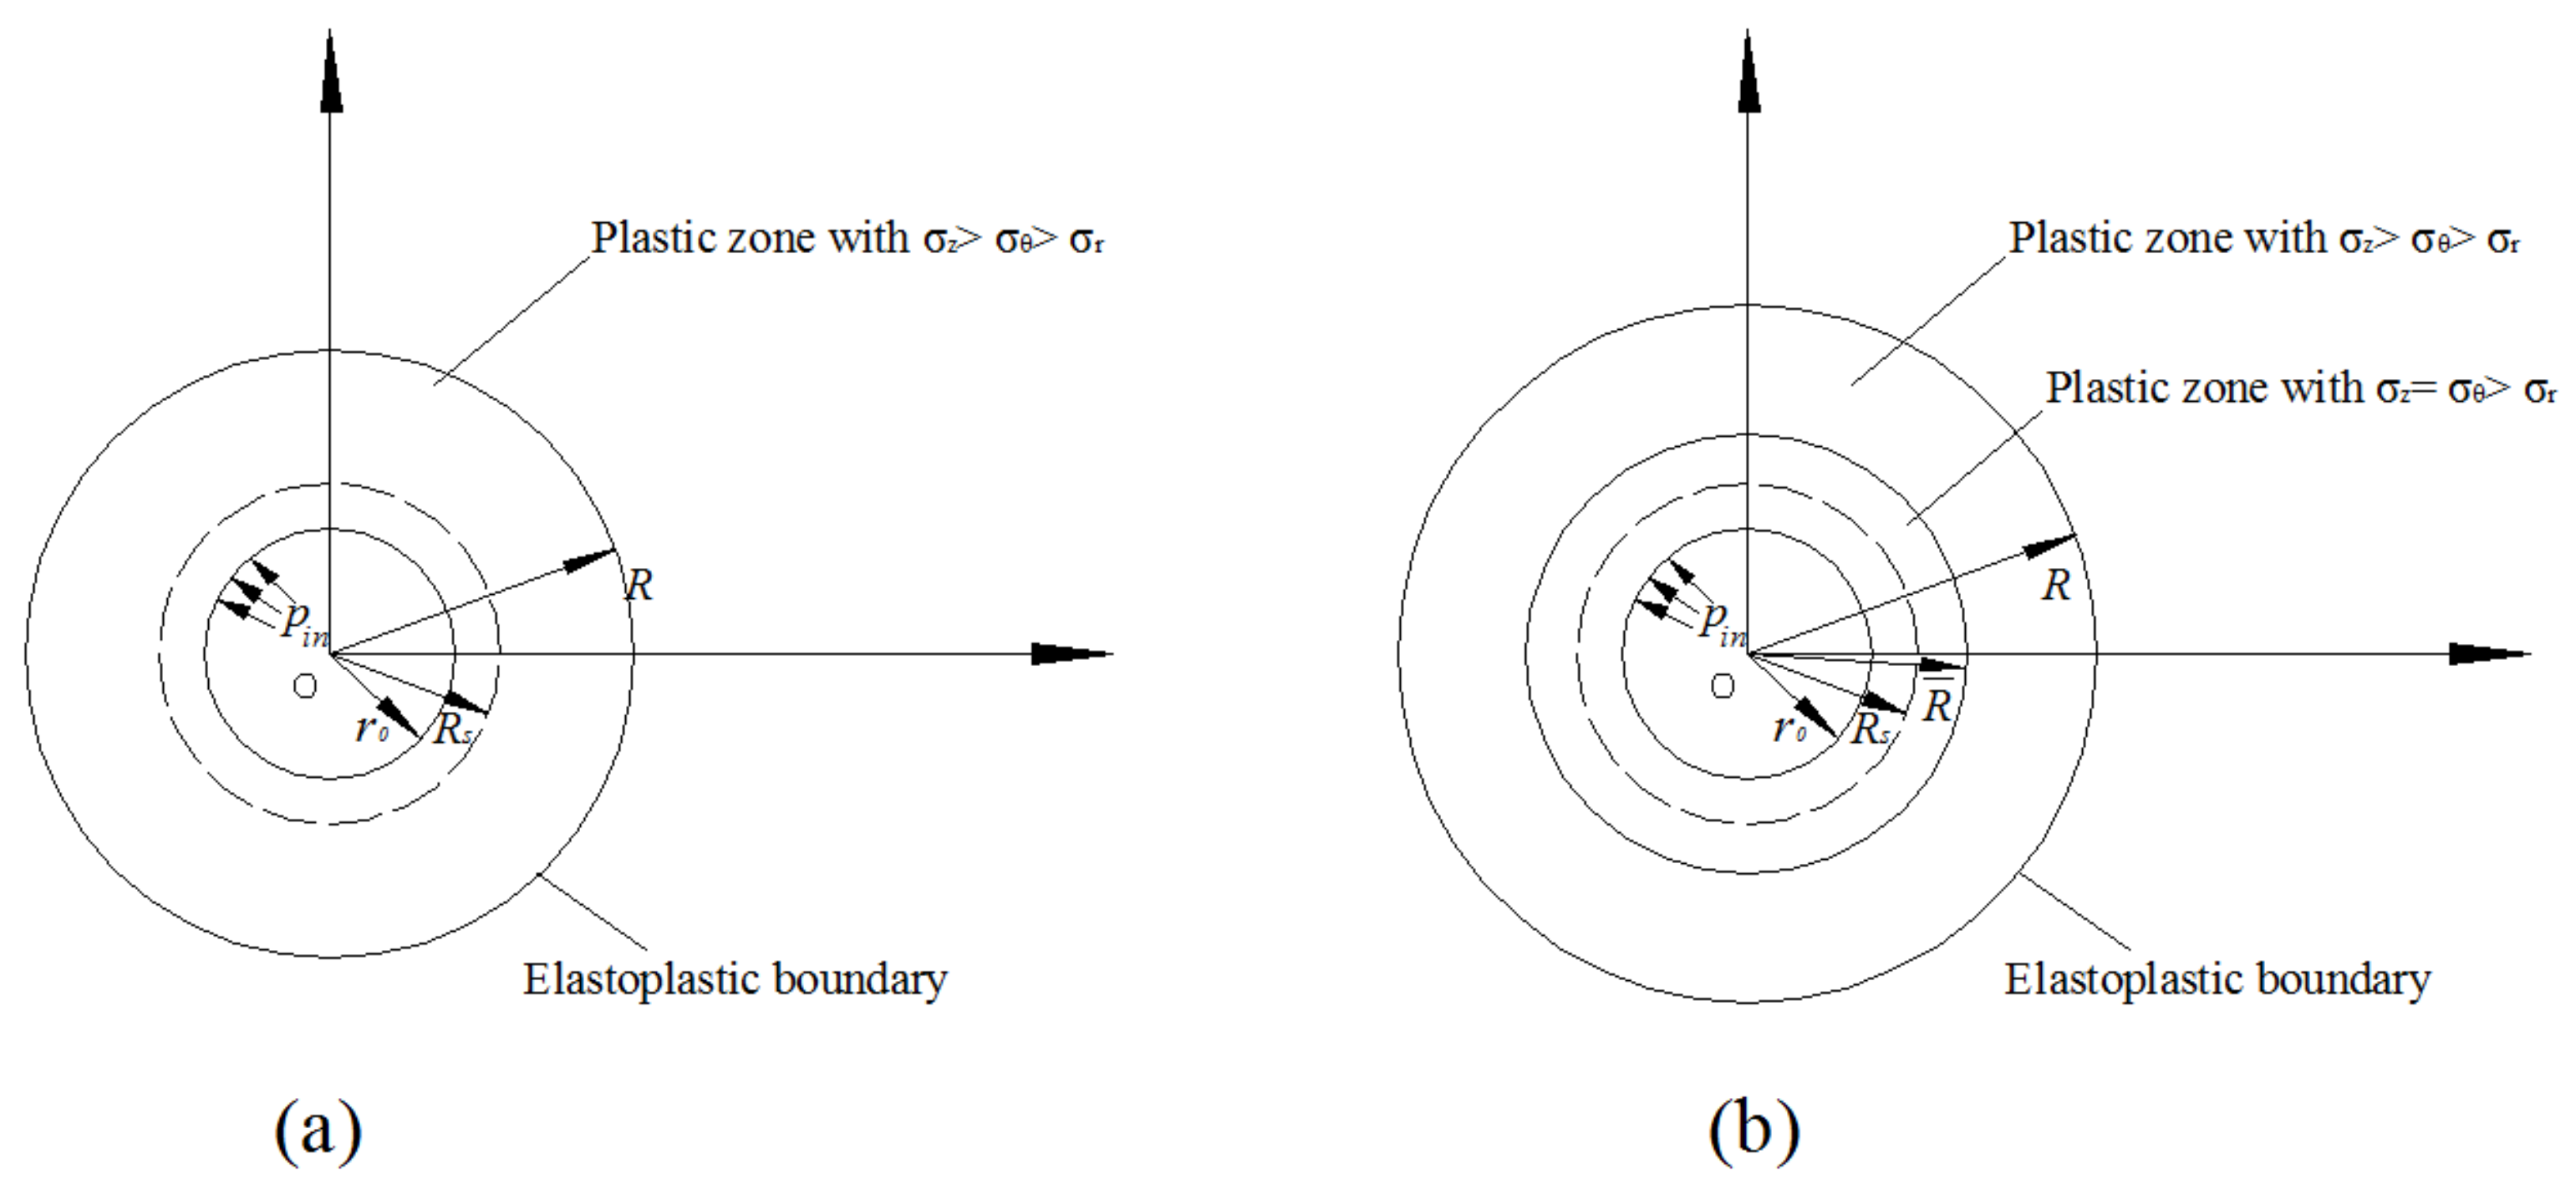
3.3. : 1st Principle Stress
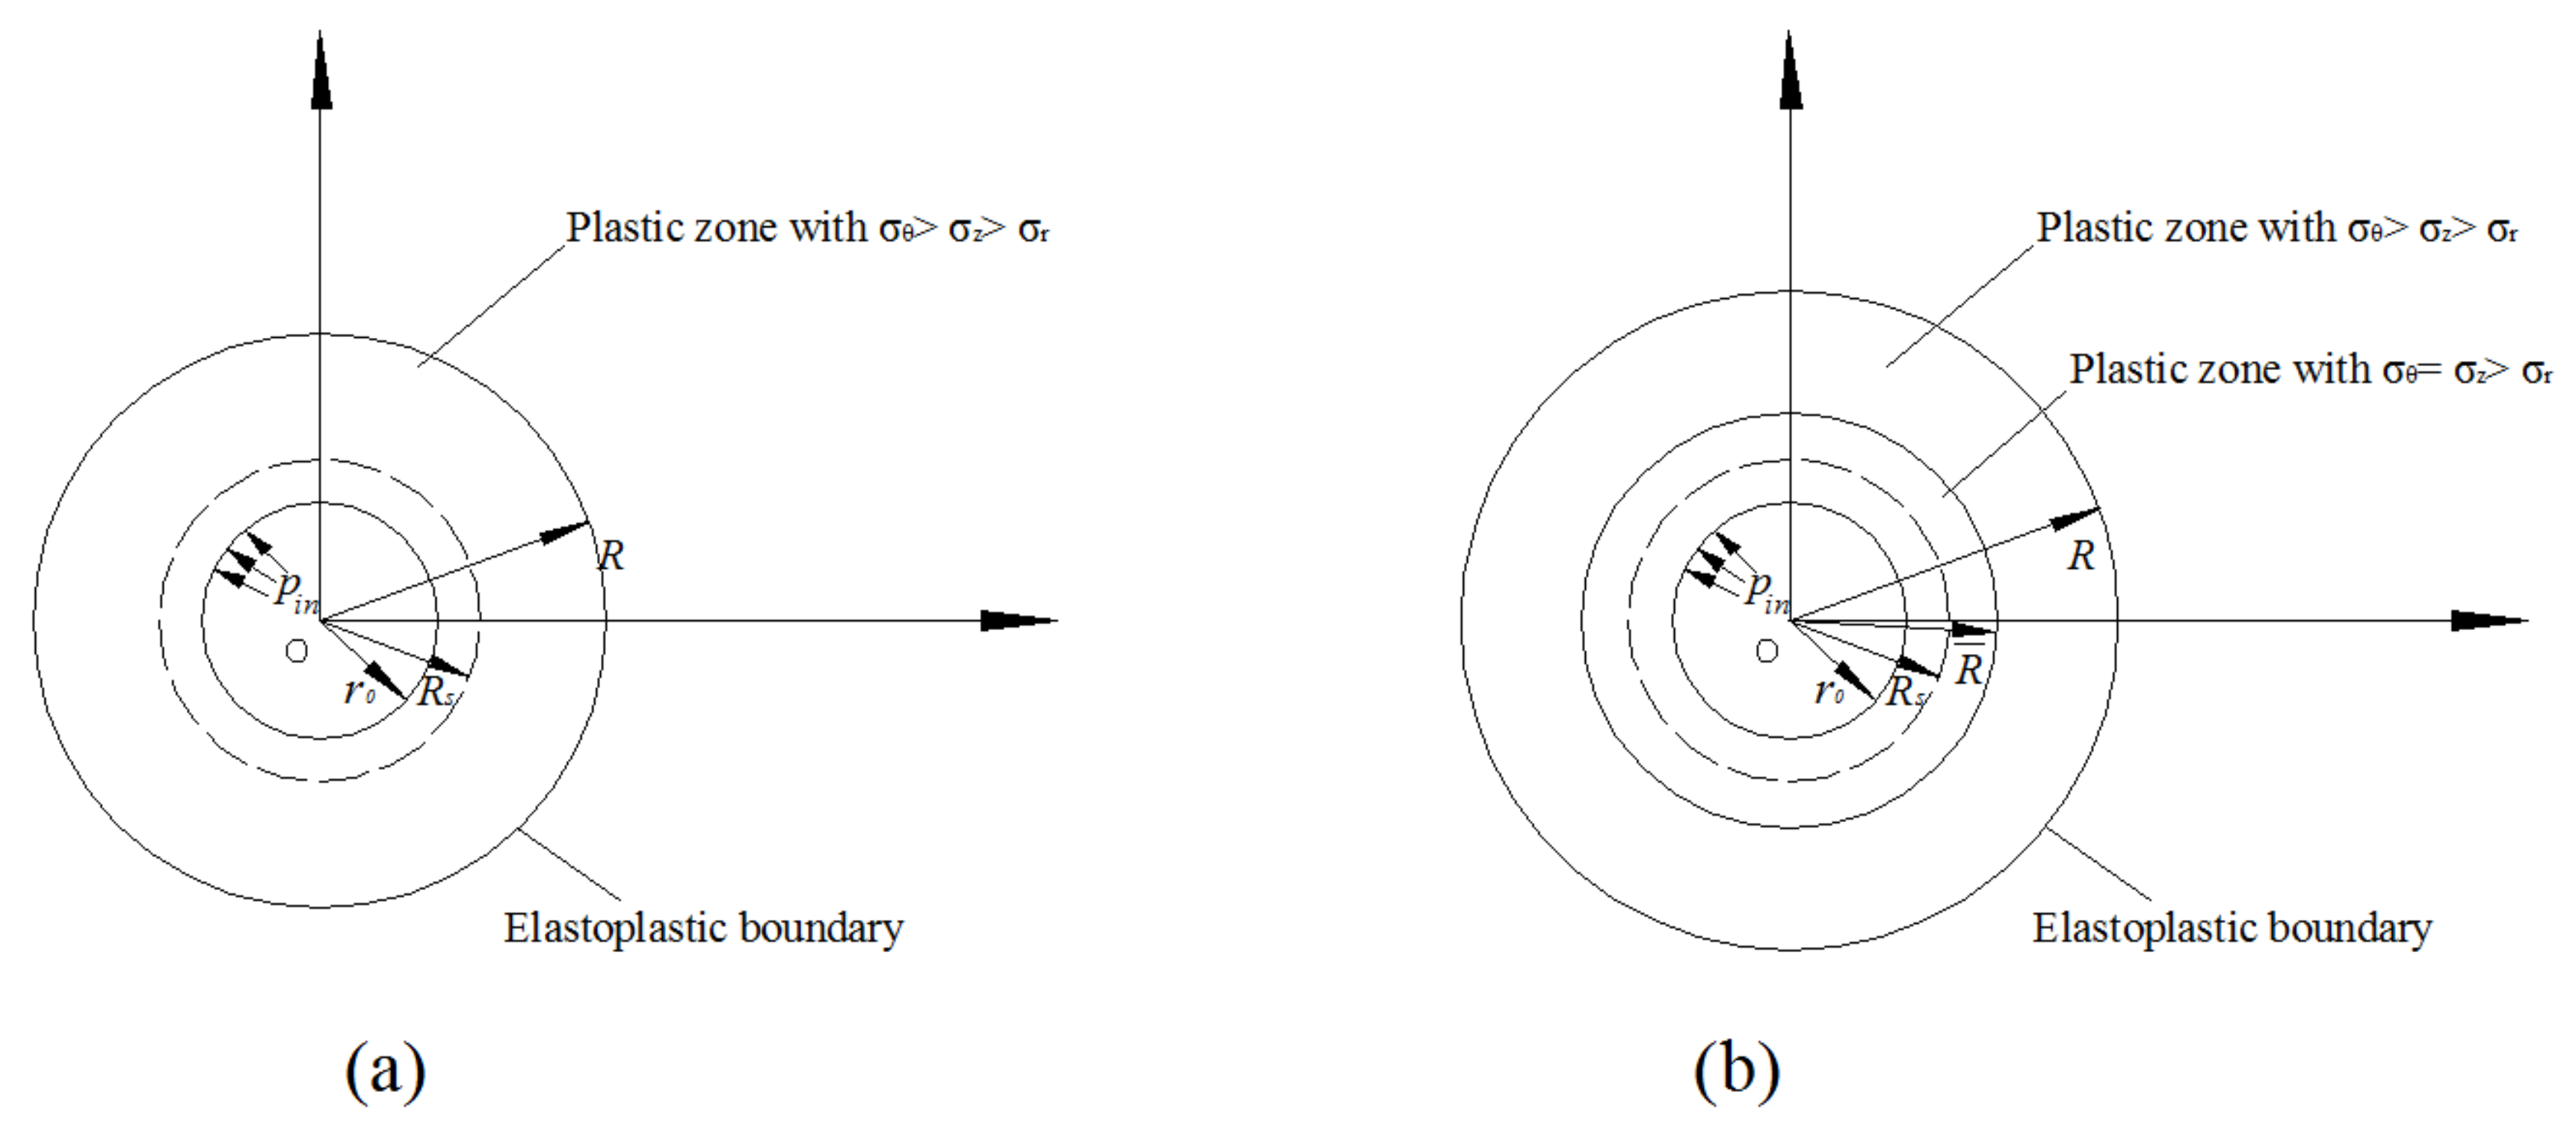
3.4. : 2nd Principle Stress
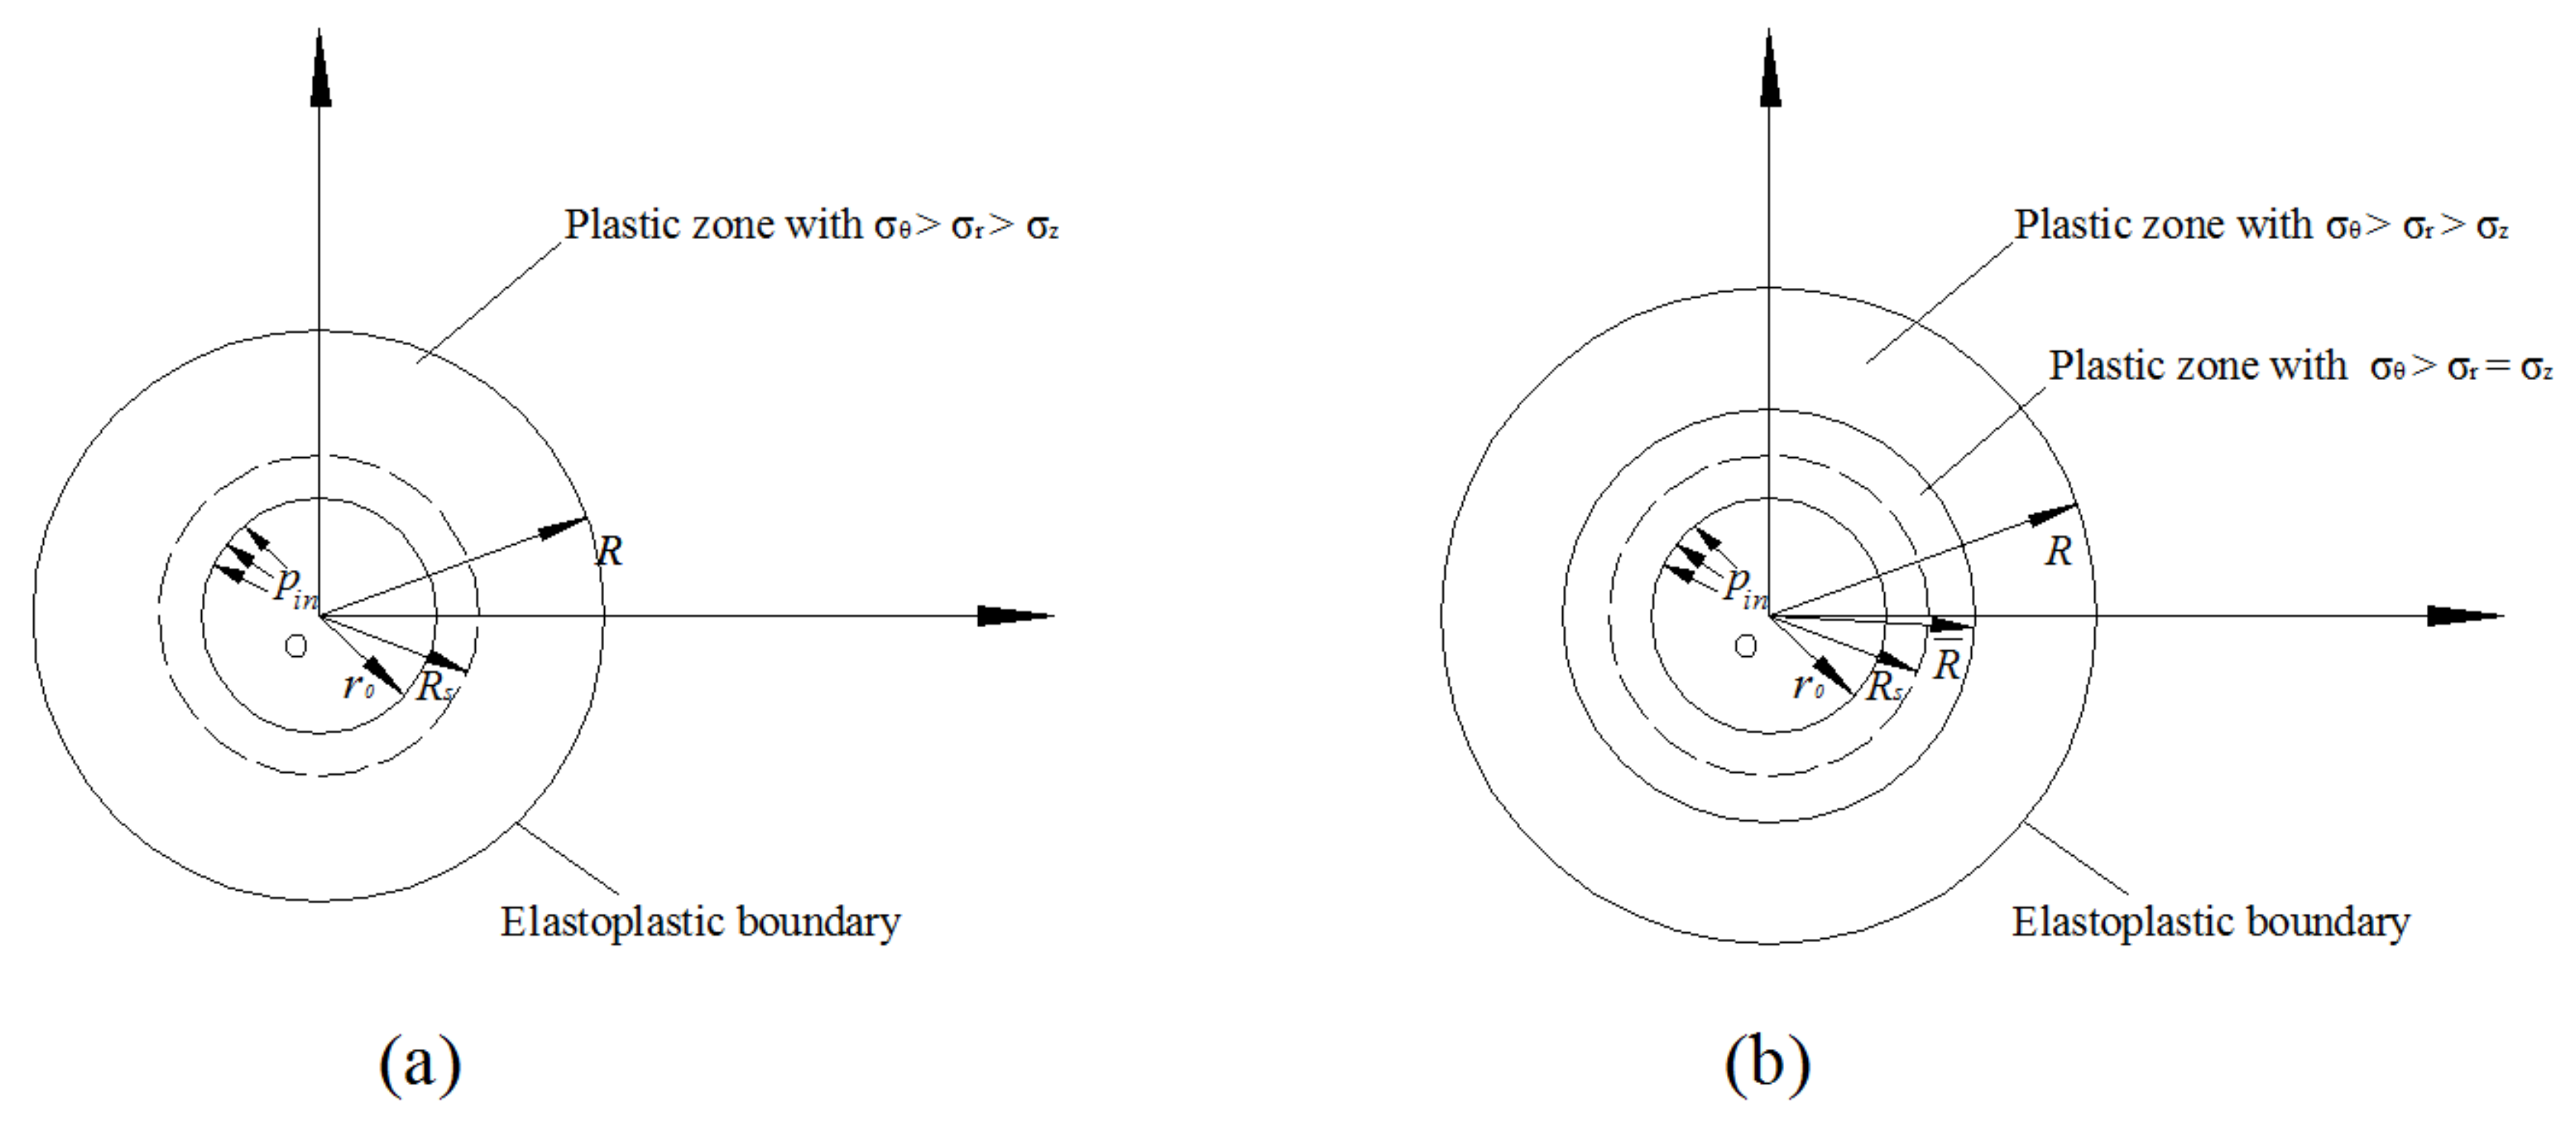
3.5. : 3rd Principle Stress
4. Numerical Examples
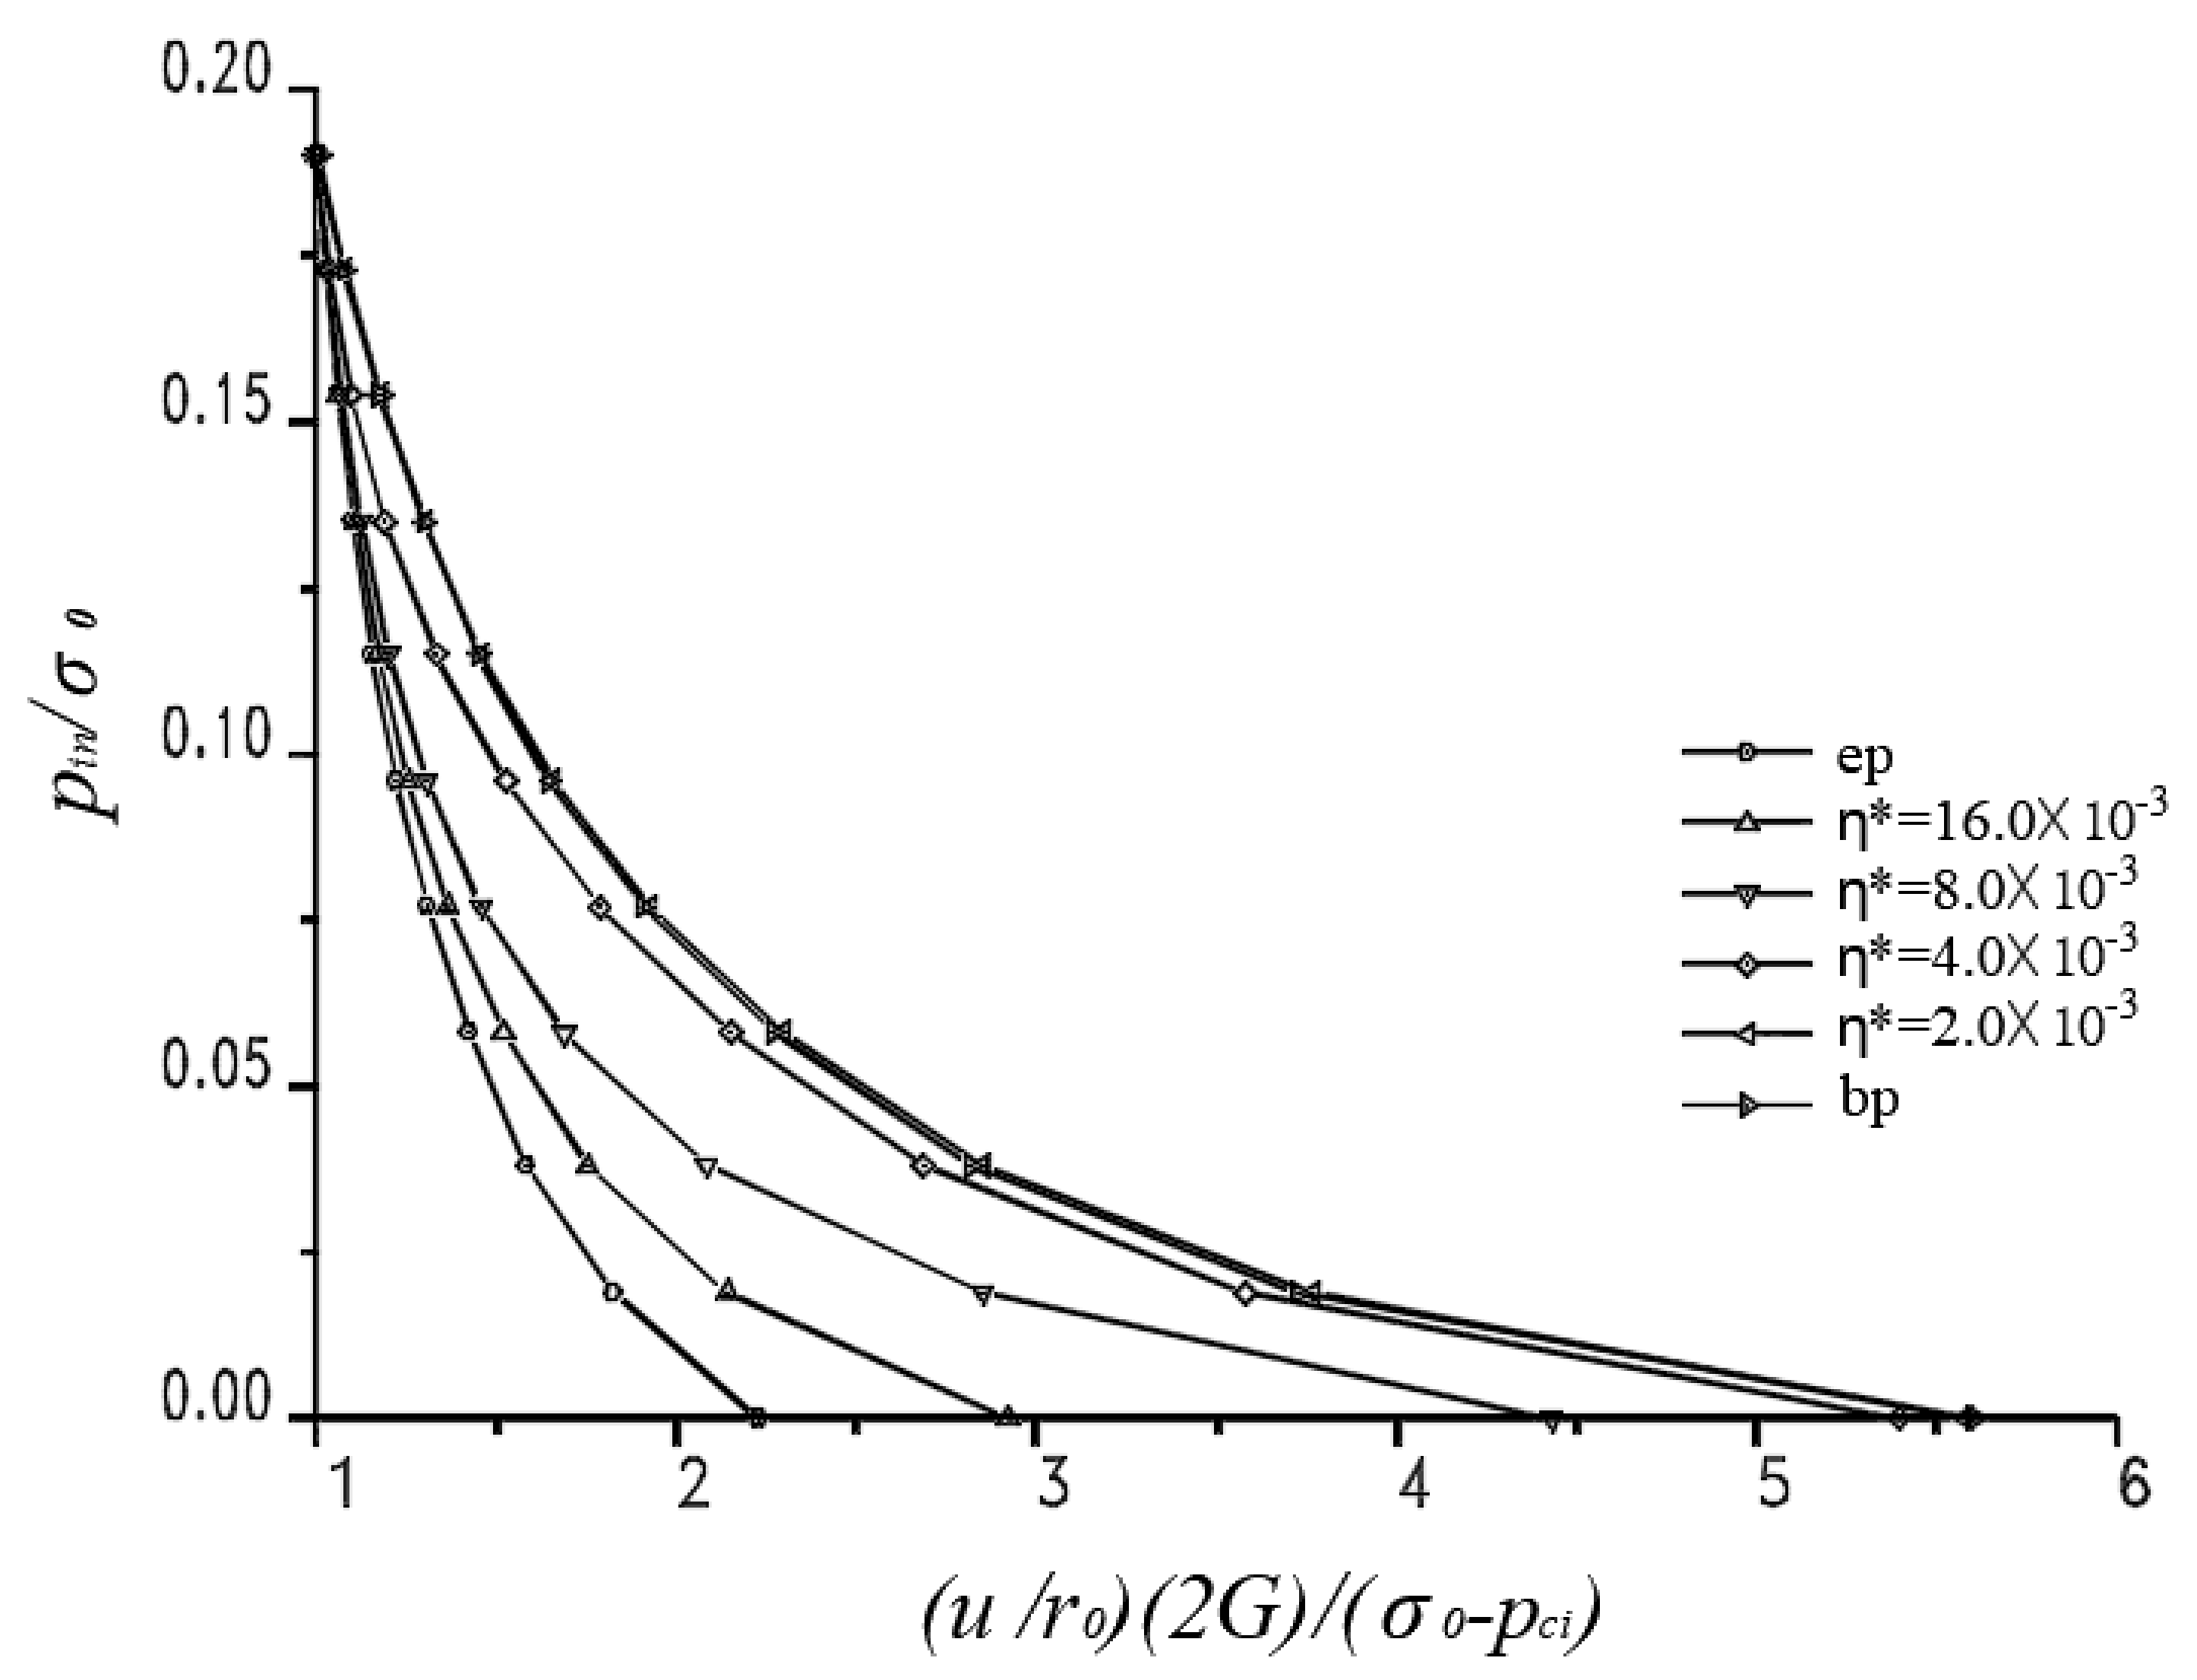
4.1. Convergence of Numerical Solutions
4.2. Numerical Analysis
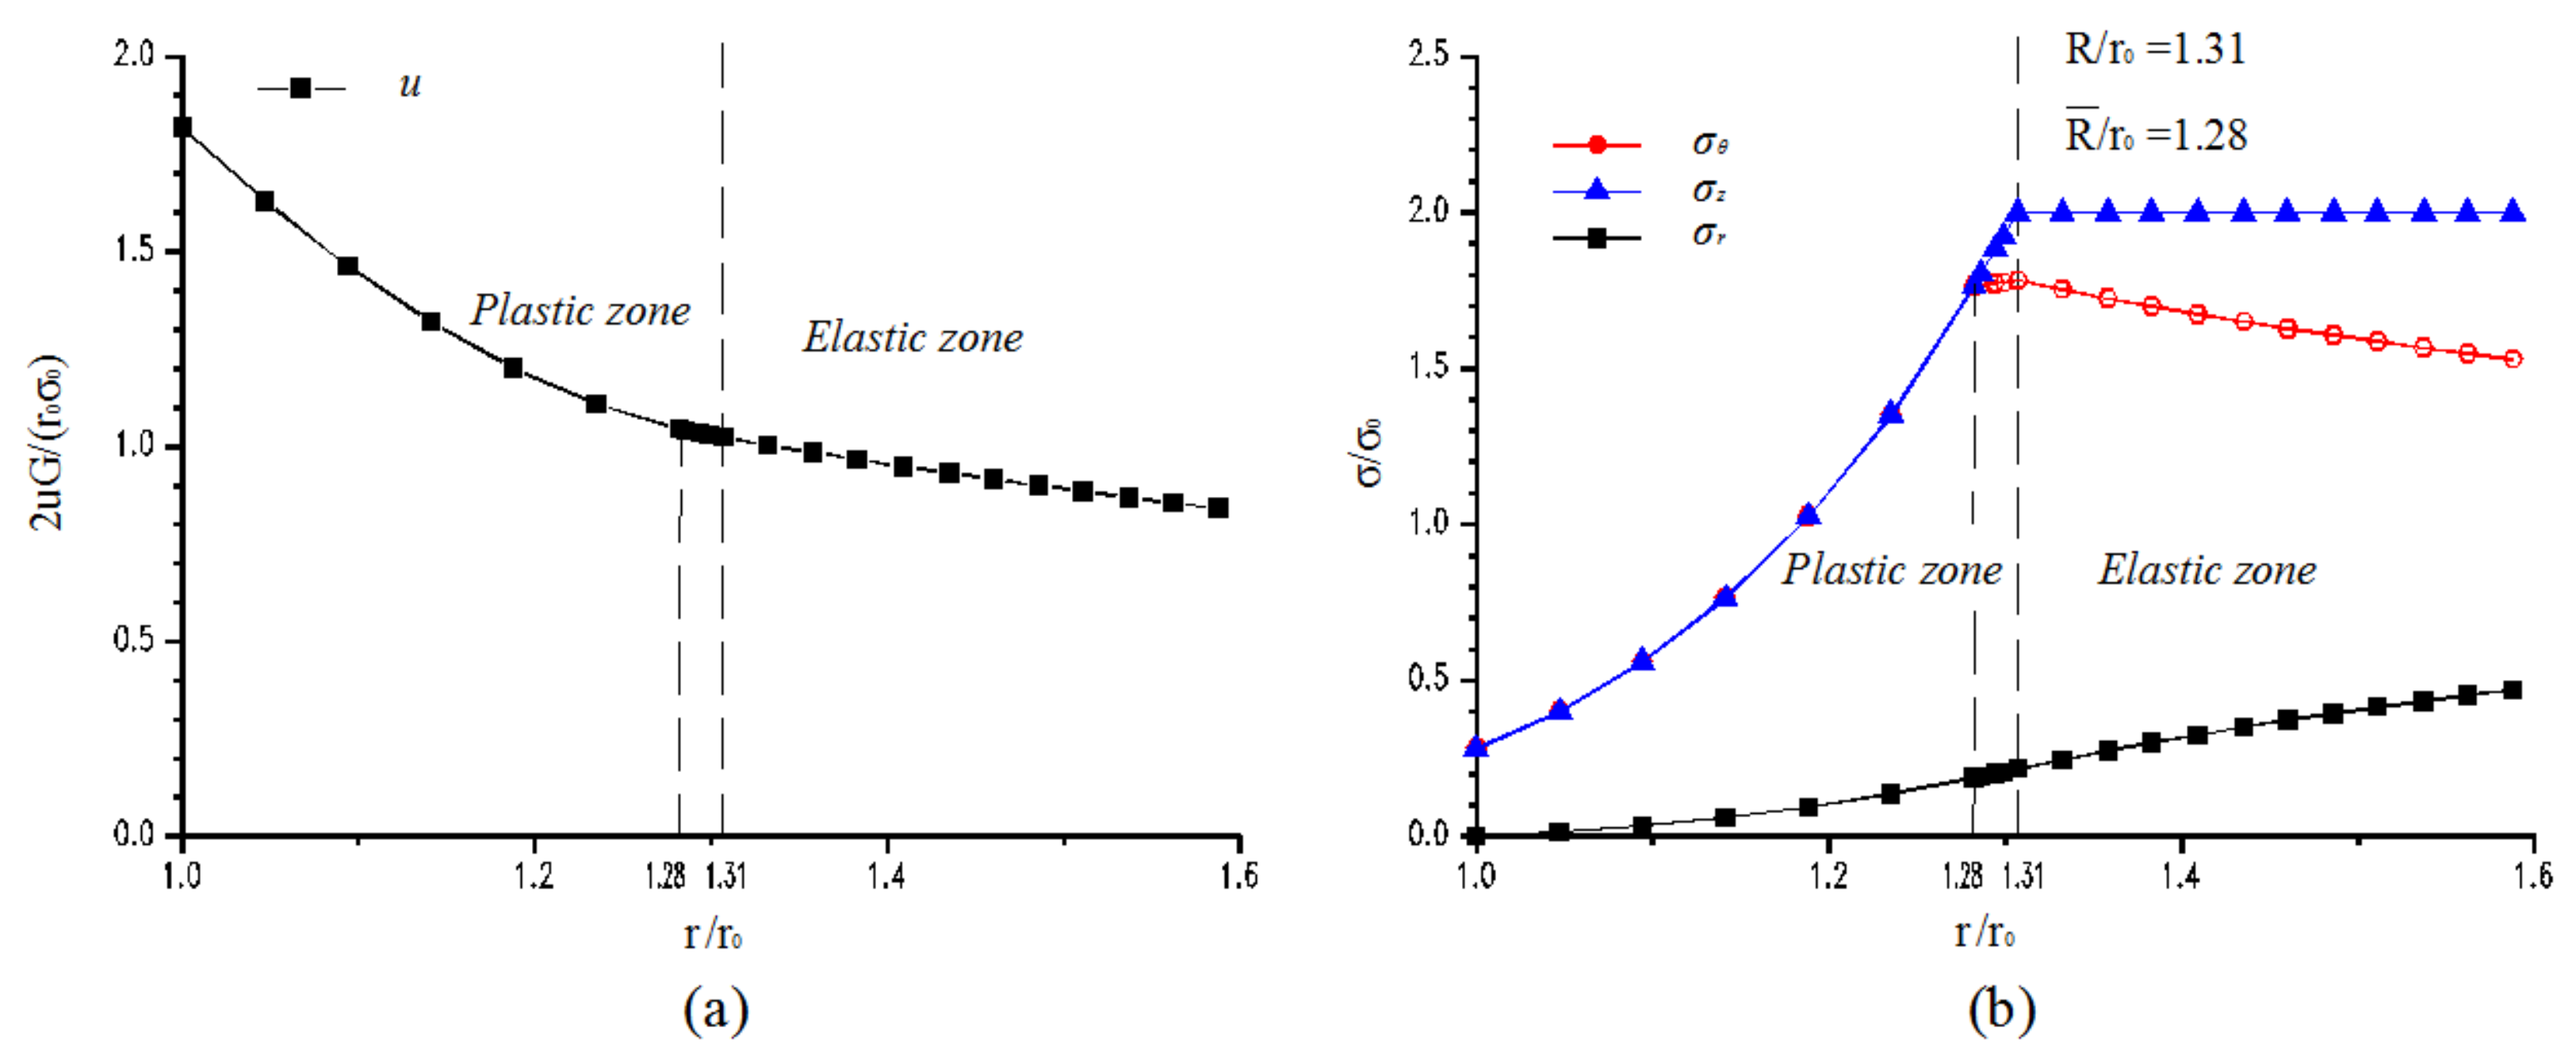
4.2.1. Axial Stress: q = 30 MPa
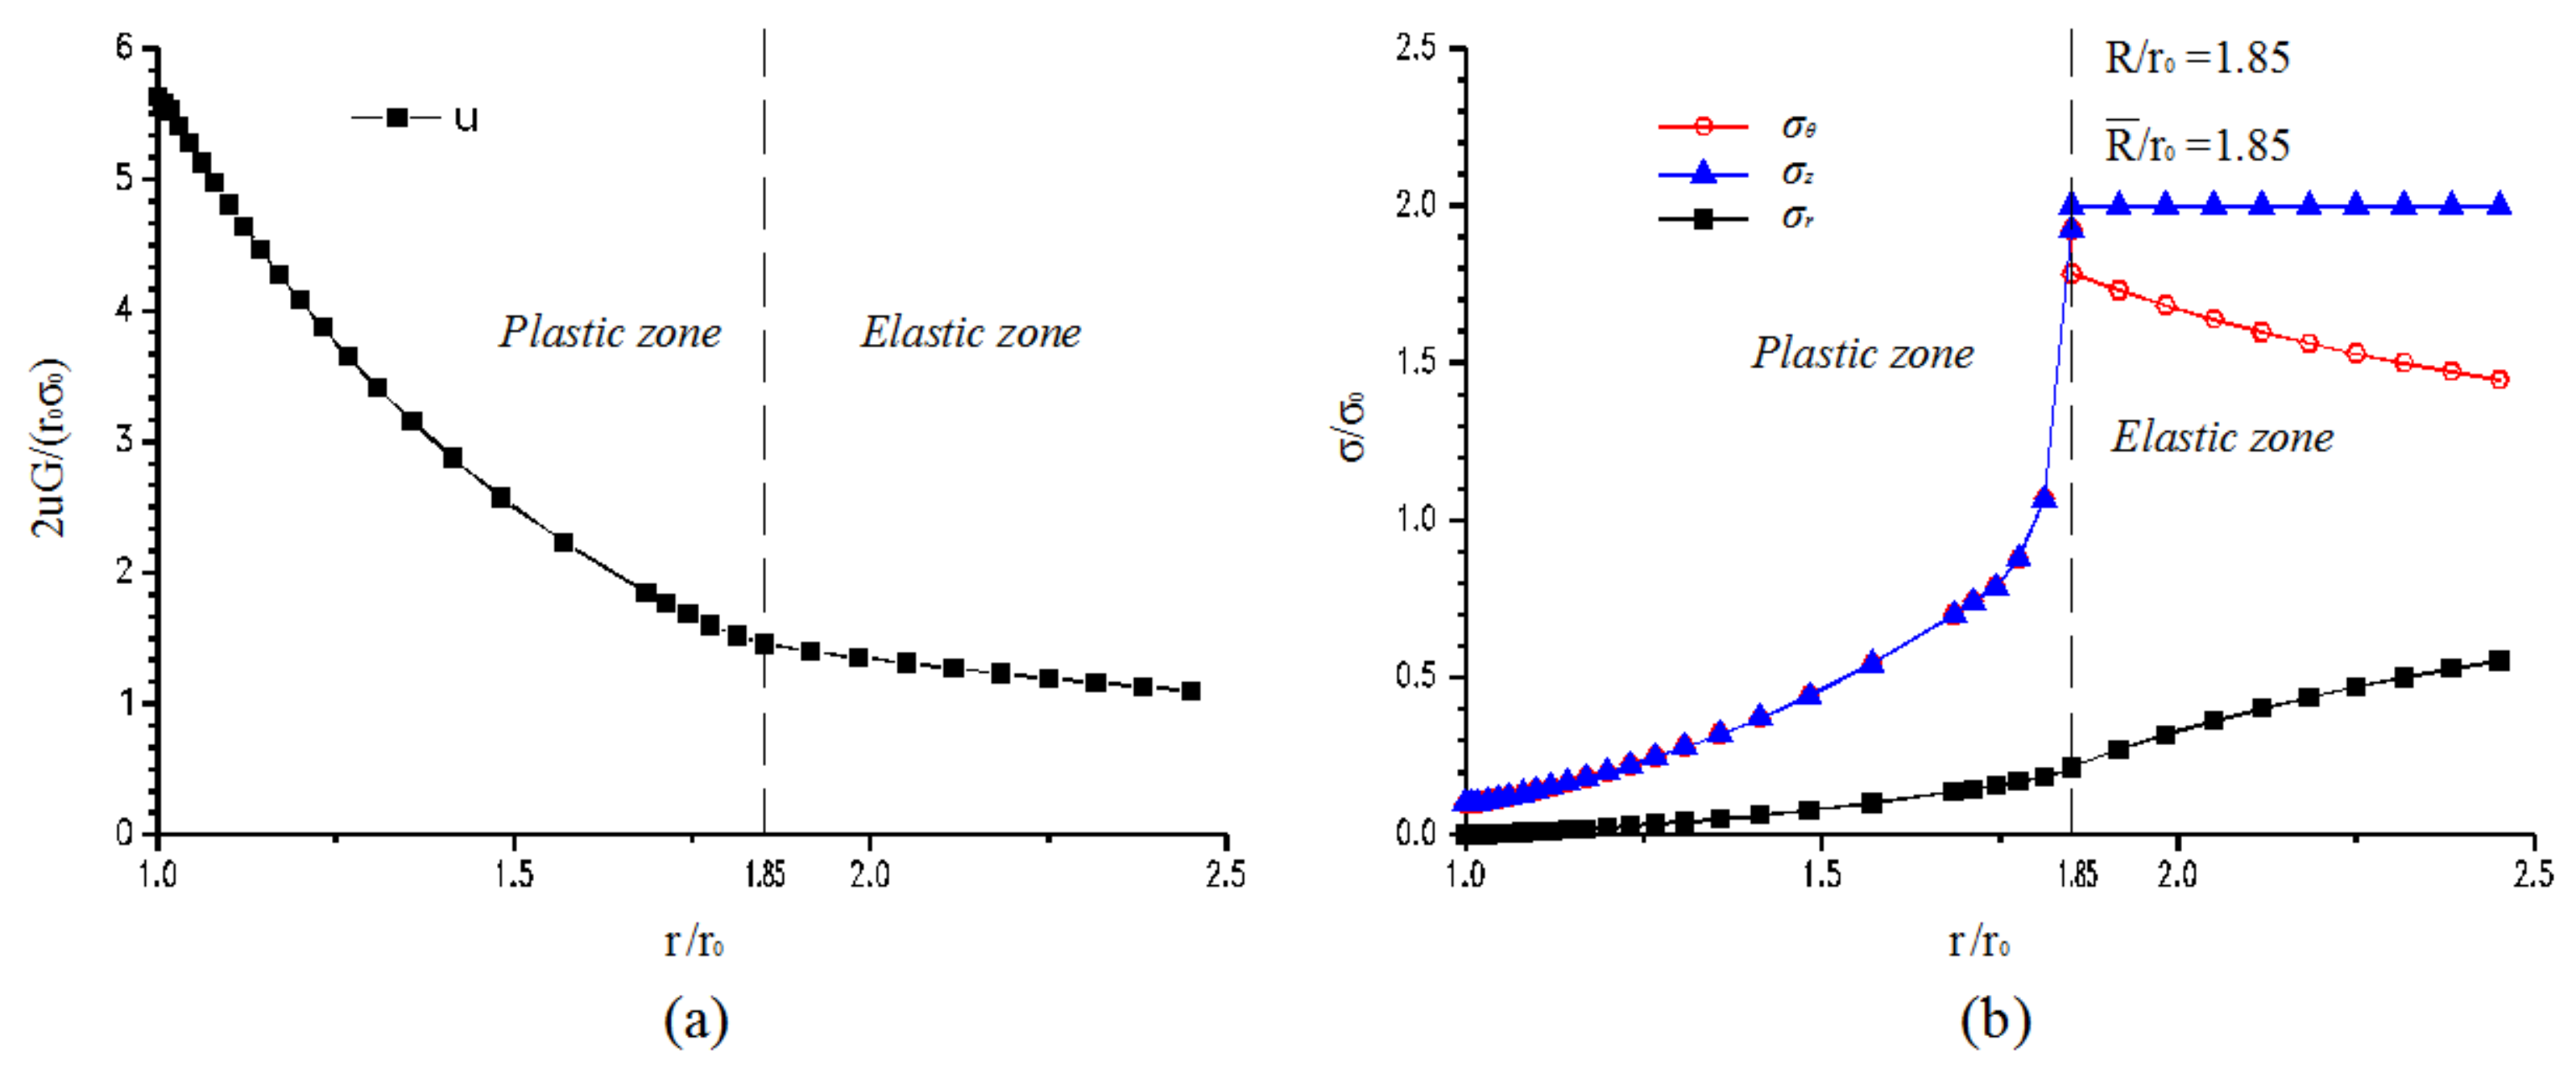
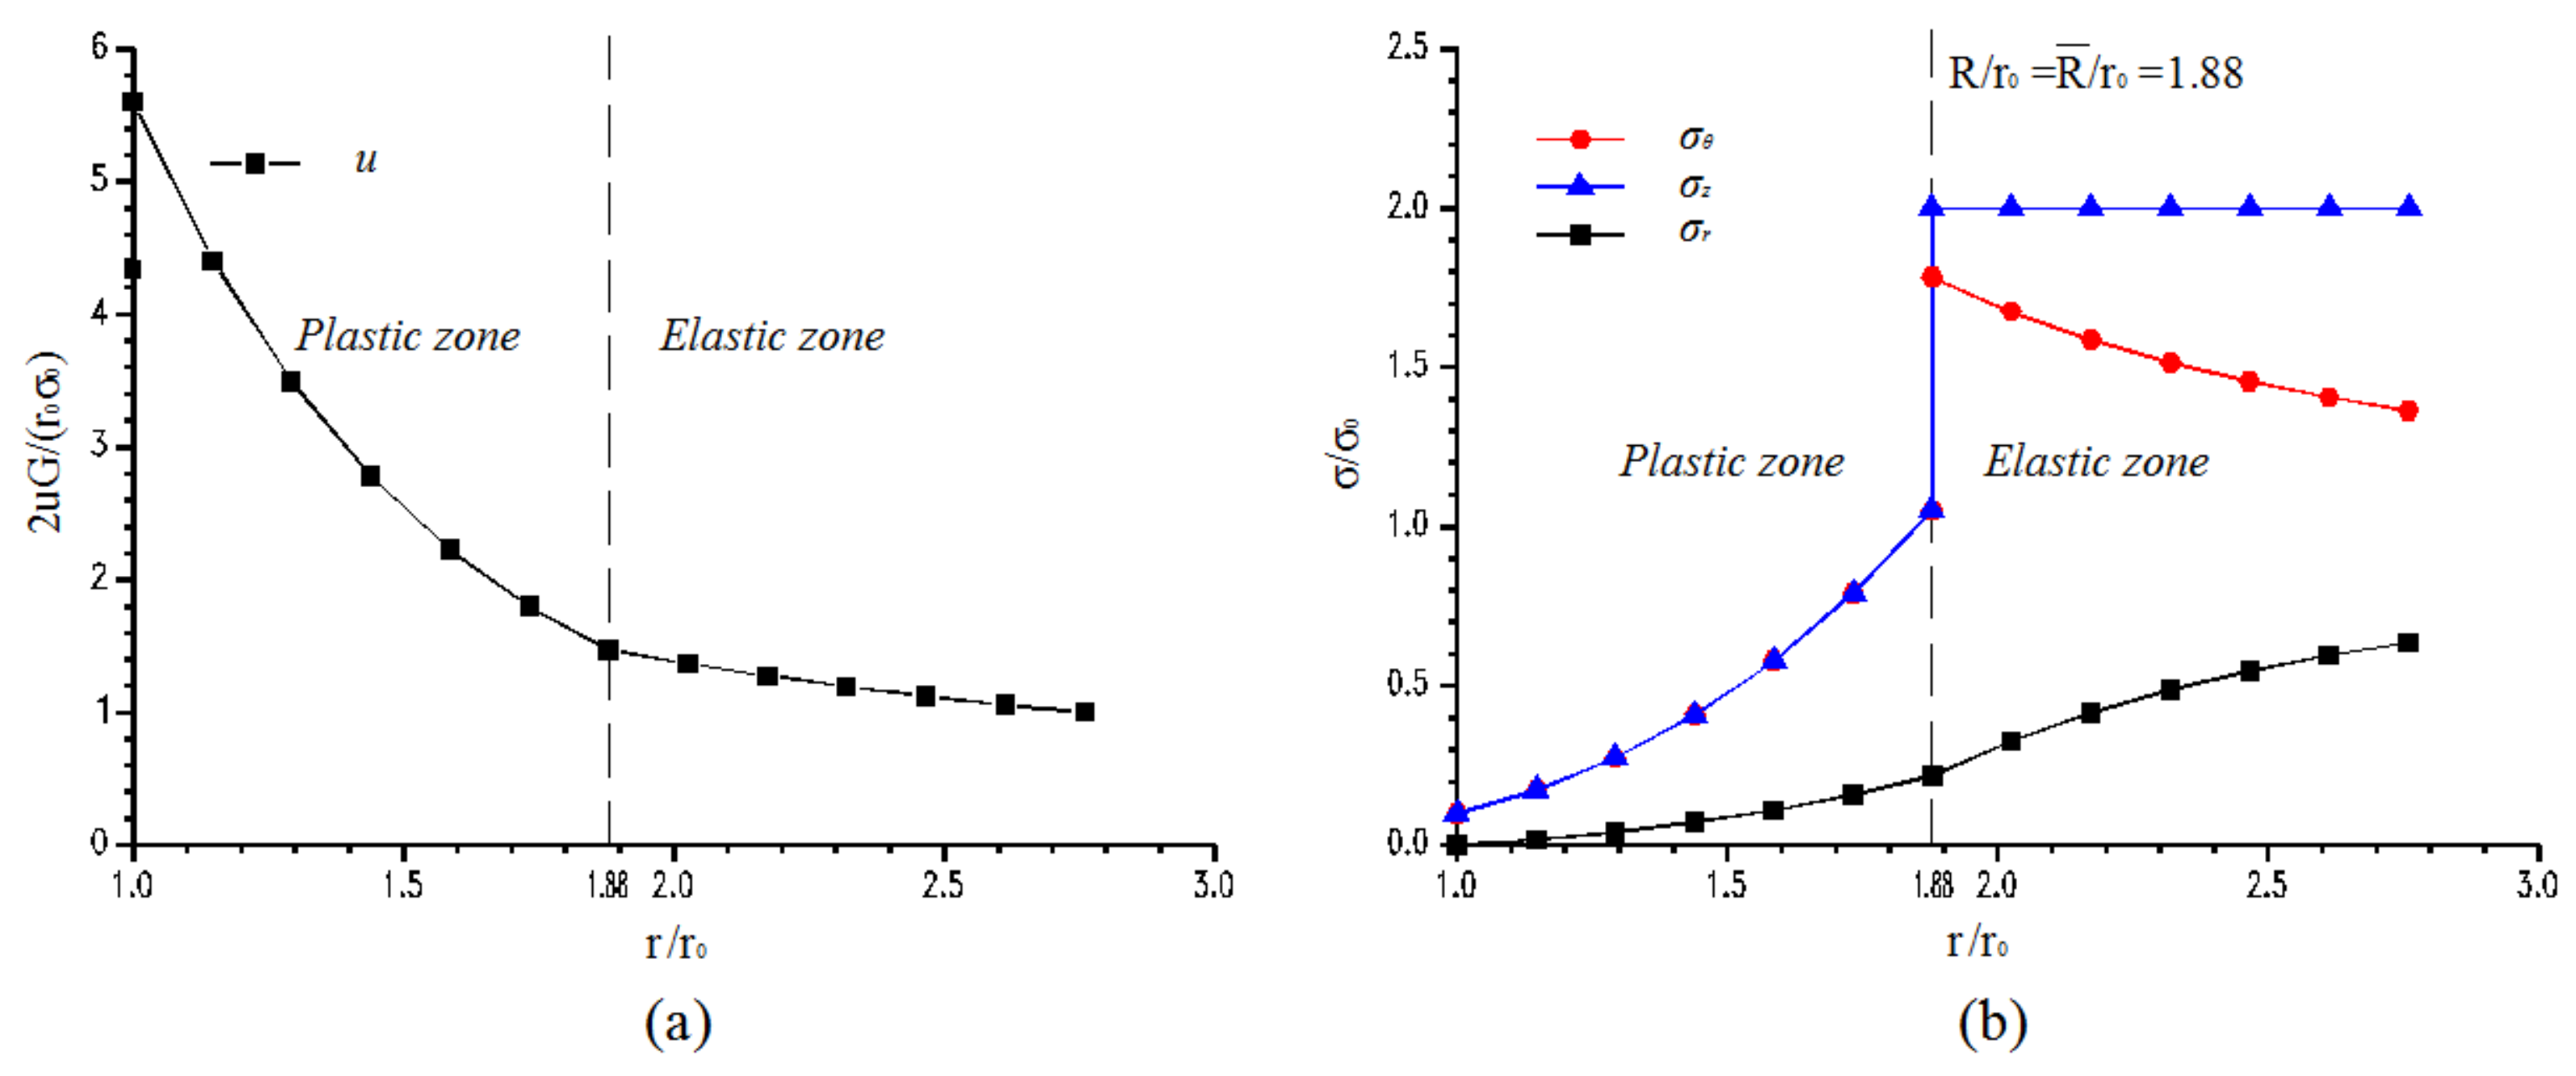
4.2.2. Out-of-Plane Stress: q = 60 MPa
4.2.3. Influences of the Dilation Angle on Numerical Results
4.3. Discussions of the Numerical Analysis
5. Concluding Remarks
Author Contributions
Funding
Institutional Review Board Statement
Informed Consent Statement
Data Availability Statement
Conflicts of Interest
Nomenclature
| constant | |
| constant | |
| c | cohesion |
| cp | peak cohesion |
| cr | residual cohesion |
| E | elastic modulus |
| shear modulus | |
| axial in situ stress | |
| r0 | radius of the circular bore |
| r | radial coordinate in the cylindrical polar coordinate system |
| ri | the radius of the ith plastic annulus |
| radius of the interface of the inner plastic zone and the outer plastic zone | |
| radius between softening and residual zones | |
| plastic radius | |
| the critical internal pressure. The out-of-plane in situ stress is the major principle stress for i = 1, it is the intermediate principle stress for i = 2 and the minor principle stress for i = 3 | |
| pin | the internal pressure |
| the kth pressure decrease | |
| the displacement at the interface of the plastic zone and the elastic zone. The out-of-plane in situ stress is the major principle stress for i = 1, it is the intermediate principle stress for i = 2 and the minor principle stress for i = 3. | |
| the displacement at the interface of the inner plastic zone and the outer plastic zone | |
| radial displacement | |
| incremental radial displacementat the ith load increment | |
| constant | |
| constant | |
| constant | |
| constant | |
| constant | |
| the radial strain | |
| the elastic part of radial strain | |
| the plastic part of radial strain | |
| the incremental radial strain at the ith load increment | |
| elastic part of the incremental radial strain at the ith load increment | |
| plastic part of the incremental radial strain at the ith load increment | |
| the tangential strain | |
| the elastic part of tangential strain | |
| the plastic part of tangential strain | |
| the incremental tangential strain at the ith load increment | |
| elastic part of the incremental tangential strain at the ith load increment | |
| plastic part of the incremental tangential strain at the ith load increment | |
| the axial strain | |
| the elastic part of axial strain | |
| the plastic part of axial strain | |
| the incremental axial strain at the ith load increment | |
| elastic part of the incremental axial strain at the ith load increment | |
| plastic part of the incremental axial strain at the ith load increment | |
| φ | friction angle |
| φp | peak friction angle |
| φr | residual friction angle |
| η | parameter to indicate plastic strains |
| Poisson’s ratio | |
| tangential coordinate in the cylindrical polar coordinate system | |
| uniform in-plane in situ stress | |
| major principle stress | |
| intermediate principle stress | |
| minor principle stress. | |
| radial stress | |
| radial stress at the end of the i−1th load increment | |
| incremental radial stress at the ith load increment | |
| tangential stress | |
| tangential stress at the end of the i−1th load increment | |
| incremental tangential stress at the end of the ith load increment | |
| axial stress | |
| axial stress at the end of the i−1th load increment | |
| incremental axial stress at the end of the ith load increment | |
| the radial stress at the interface of the inner plastic zone and the outer plastic zone | |
| ψ | the dilation angle |
| ψp | peak dilation angle |
| ψr | residual dilation angle |
References
- Brown, E.T.; Bray, J.W.; Ladanyi, B.; Hoek, E. Ground response curves for rock tunnels. J. Geotech. Eng. 1983, 109, 15–39. [Google Scholar] [CrossRef]
- Detournay, E. Elasto-plastic model of a deep tunnel for a rock with variable dilatancy. Rock Mech. Rock Eng. 1986, 19, 99–108. [Google Scholar] [CrossRef]
- Ogawa, T.; Lo, K.Y. Effects of dilatancy and yield criteria on displacements around tunnels. Can. Geotech. J. 1987, 24, 100–113. [Google Scholar] [CrossRef]
- Wang, Y. Ground response of circular tunnel in poorly consolidated rock. J. Geotech. Eng. 1996, 122, 703–708. [Google Scholar] [CrossRef]
- Carranza-Torres, C. Self Similarity Analysis of the Elastoplastic Response of Underground Openings in Rock and Effects of Practical Variables. Ph.D. Thesis, University of Minnesota, Minneapolis, MN, USA, 1998. [Google Scholar]
- Carranza-Torres, C.; Fairhurst, C. The elasto-plastic response of underground excavations in rock masses that satisfy the Hoek–Brown failure criterion. Int. J. Rock Mech. Min. Sci. 1999, 36, 777–809. [Google Scholar] [CrossRef]
- Yu, H.S. Cavity Expansion Methods in Geomechanics; Kluwer Academic Publishers: Dordrecht, The Netherlands, 2000. [Google Scholar]
- Park, K.H.; Kim, Y.J. Analytical solution for a circular opening in an elasto-brittle-plastic rock. Int. J. Rock Mech. Min. Sci. 2006, 43, 616–622. [Google Scholar] [CrossRef]
- Sharan, S.K. Analytical solutions for stresses and displacements around a circular opening in a generalized Hoek-Brown rock. Int. J. Rock Mech. Min. Sci. 2008, 45, 78–85. [Google Scholar] [CrossRef]
- Frikha, W.; Bouassida, M. Cylindrical cavity expansion in elastoplastic medium with a variable potential flow. Int. J. Geomech. 2013, 13, 9–15. [Google Scholar] [CrossRef]
- Tran, V.D.; Meguid, M.A.; Chouinard, L.E. Discrete element and experimental investigations of the earth pressure distribution on cylindrical shafts. Int. J. Geomech. 2014, 14, 80–91. [Google Scholar] [CrossRef]
- Alonso, E.; Alejano, L.R.; Varas, F.; Fdez-Manin, G.; Carranza-Torres, C. Ground response curves for rock masses exhibiting strain-softening behavior. Int. J. Numer. Anal. Meth. Geomech. 2003, 27, 1153–1185. [Google Scholar] [CrossRef]
- Guan, Z.; Jiang, Y.; Tanabasi, Y. Ground reaction analyses in conventional tunneling excavation. Tunn. Undergr. Space Technol. 2007, 22, 230–237. [Google Scholar] [CrossRef]
- Park, K.H.; Tontavanich, B.; Lee, J.G. A simple procedure for ground response curve of circular tunnel in elastic-strain softening rock masses. Tunn. Undergr. Space Technol. 2008, 23, 151–159. [Google Scholar] [CrossRef]
- Lee, Y.K.; Pietruszczak, S. A new numerical procedure for elasto-plastic analysis of a circular opening excavated in a strain-softening rock mass. Tunn. Undergr. Space Technol. 2008, 23, 588–599. [Google Scholar] [CrossRef]
- Wang, S.L.; Yin, X.T.; Tang, H.; Ge, X.R. A new approach for analyzing circular tunnel in strain-softening rock masses. Int. J. Rock Mech. Min. Sci. 2010, 47, 170–178. [Google Scholar] [CrossRef]
- Zhou, H.; Randolph, M.F. Computational techniques and shear band development for cylindrical and spherical penetrometers in strain-softening clay. Int. J. Geomech. 2007, 7, 287–295. [Google Scholar] [CrossRef]
- Chen, S.L.; Abousleiman, Y.N.; Muraleetharan, K.K. Closed-form elastoplastic solution for the wellbore problem in strain hardening/softening rock formations. Int. J. Geomech. 2012, 12, 494–507. [Google Scholar] [CrossRef]
- Reed, M.B. The influence of out-of-plane stress on a plane strain problem in rock mechanics. Int. J. Numer. Anal. Meth. Geomech. 1988, 12, 173–181. [Google Scholar] [CrossRef] [Green Version]
- Lu, A.Z.; Xu, G.S.; Sun, F.; Sun, W.Q. Elasto-plastic analysis of a circular tunnel including the effect of the axial in situ stress. Int. J. Rock Mech. Min. Sci. 2010, 47, 50–59. [Google Scholar] [CrossRef]
- Wang, S.L.; Wu, Z.J.; Guo, M.W.; Ge, X.R. Theoretical solutions of a circular tunnel with the influence of axial in situ stress in elastic-brittle-plastic rock. Tunn. Undergr. Space Technol. 2012, 30, 155–168. [Google Scholar] [CrossRef]
- Hoek, E.; Brown, E.T. Practical estimates of rock mass strength. Int. J. Rock Mech. Sci. Geomech. Abstr. 1997, 34, 1165–1187. [Google Scholar] [CrossRef]


| Rock Parameter | Value |
|---|---|
| Radius of bore, r0 (m) | 3 |
| Initial stress, σ0 (MPa) | 30 |
| Out of plane stress, q (MPa) | 30 |
| Internal pressure, pin (MPa) | 0 |
| Young’s modulus, E (GPa) | 27 |
| Poisson’s ratio, ν | 0.22 |
| cp (MPa) | 1.5 |
| φp (deg) | 50.9 |
| ψp (deg) | 15.5 |
| cr (Mpa) | 0.7 |
| φr (deg) | 39 |
| ψr (deg) | 7.5 |
| η* | 0.004 |
| 2 u G/(σ0r0) | |||
|---|---|---|---|
| q = 30 MPa | 1.754 | 1.60 | 4.35 |
| q = 60 MPa | 1.85 | 1.85 | 5.59 |
| Case 1 | Case 2 | Case 3 | |
|---|---|---|---|
| q = 30 MPa | 31.8 | 8.3 | 5.4 |
| q = 60 MPa | 59.5 | 11.7 | 7.2 |
Publisher’s Note: MDPI stays neutral with regard to jurisdictional claims in published maps and institutional affiliations. |
© 2021 by the authors. Licensee MDPI, Basel, Switzerland. This article is an open access article distributed under the terms and conditions of the Creative Commons Attribution (CC BY) license (https://creativecommons.org/licenses/by/4.0/).
Share and Cite
Dong, X.; Guo, M.; Wang, S. Strain-Softening Analyses of a Circular Bore under the Influence of Axial Stress. Appl. Sci. 2021, 11, 7937. https://doi.org/10.3390/app11177937
Dong X, Guo M, Wang S. Strain-Softening Analyses of a Circular Bore under the Influence of Axial Stress. Applied Sciences. 2021; 11(17):7937. https://doi.org/10.3390/app11177937
Chicago/Turabian StyleDong, Xuechao, Mingwei Guo, and Shuilin Wang. 2021. "Strain-Softening Analyses of a Circular Bore under the Influence of Axial Stress" Applied Sciences 11, no. 17: 7937. https://doi.org/10.3390/app11177937
APA StyleDong, X., Guo, M., & Wang, S. (2021). Strain-Softening Analyses of a Circular Bore under the Influence of Axial Stress. Applied Sciences, 11(17), 7937. https://doi.org/10.3390/app11177937