Article

Serve Ball Trajectory Characteristics of Different Volleyballs and Their Causes

1
Department of Mechanical Engineering, Graduate School of Kogakuin University, 1-24-2 NishiShinjuku, Shinjuku-ku, Tokyo 163-8677, Japan
2
Department of Mechanical Engineering, Kogakuin University, 1-24-2 NishiShinjuku, Shinjuku-ku, Tokyo 163-8677, Japan
*
Author to whom correspondence should be addressed.
Appl. Sci. 2021, 11(19), 9269; https://doi.org/10.3390/app11199269
Submission received: 13 April 2021 / Revised: 23 September 2021 / Accepted: 27 September 2021 / Published: 6 October 2021
(This article belongs to the Section Fluid Science and Technology)

Abstract

:
A floater serve in volleyball is a technique of serving a non-rotating or low-rotating ball, which is difficult to return because the flight path of the ball changes irregularly. On the other hand, the randomness of the trajectory makes it difficult for the ball to fall on the target. Players are required to serve taking into account the variability of the trajectory. In previous studies using wind tunnels, it was shown that aerodynamic characteristics such as drag force and lateral force applied to the ball vary depending on the type of ball and the orientation of the panel. Therefore, in order to control the flight trajectory, it is necessary to understand the aerodynamic characteristics of each ball. Since the velocity of the ball and the fluid force applied to the ball changes during flight, it is important to measure not only the fluid force at a steady state in the wind tunnel but also the actual flight distance of the ball. In this study, to provide valuable information for precise control of floater serves, we measured the drag force applied to the ball in a wind tunnel and the flight distance of the ball using an ejection machine, and clarified the effects of the type of ball and the panel face. In the drag force measurement, the drag force on three types of balls, V200W, MVA200, and FLISTATEC, was measured in the wind speed range of 4 m/s to 30 m/s. In the ejection measurement, the ball flight distances were measured while changing the orientation of the panel using an ejection machine. Basically, the FLISTATEC, MVA200, and V200W, in that order, were more likely to increase the distance and the variability, but it was shown that the drop point could be adjusted slightly by selecting the panel face. This result was also obtained when a human player actually served the ball, indicating the tactical importance of the player consciously controlling the direction of the panel. The tactical importance of the player’s conscious control of the direction of the panel was demonstrated. We also proposed receiver positions that would be effective based on the characteristics of each ball.

1. Introduction

Volleyball is one of the most popular sports in the world. The key factors to victory are the skills and strategies of blocking, attacking, serving and receiving. The serve is important not only for scoring points directly, but also for gaining an advantage in the match by breaking the receiver’s posture and reducing the power of the opponent’s attack [1,2]. There are two main ways to serve that are considered to be effective. The first type is the jump serve, in which the ball is hit with topspin and dropped at high speed into the opponent’s court. The second type is the floater serve, which is the subject of this study. In the floater serve, the ball is hit with no or low rotation, which causes an irregular change in the trajectory of the ball. This irregular change in trajectory has been reported to be caused by the fluid forces generated by the three-dimensional twin vortices formed behind the ball [3,4]. The irregular changes in the position of the twin vortices cause irregular changes in the trajectory of the ball.
The fluid force on the ball has been investigated in wind tunnel experiments [5,6], with a hitting robot [7], and computational calculations [8,9,10]. The drag coefficient applied to the ball is large at low velocities, and decreases drastically with the transition from laminar to turbulent flow as the speed of the ball increases. This decrease in the drag coefficient due to the change in flow is called drag crisis, and it plays an important role in volleyball because the ball decelerates in flight to a speed range where the drag crisis occurs [11,12,13,14]. The fluid force characteristics of a ball vary depending on the type of ball and the panel surface [15,16,17,18,19,20,21,22,23,24,25,26,27]. Measurements using a wind tunnel showed that the drag coefficient, the magnitude of lateral force, and the speed range at which drag crisis occurs differs depending on the type of ball and the panel surface. This indicates that the type of ball used in a game influences the tactics of the players. Similar phenomena were observed with balls used in other sports, and it is important to focus on the panel shape and orientation when discussing the fluid forces on balls. However, the drag coefficient measurements of the ball surface fixed in the wind tunnel is not sufficient to describe the trajectory of the ball, because the speed of the ball decelerates during flight and the force applied to the ball changes irregularly. For a more detailed understanding, it is necessary to serve a large number of balls under the same conditions to clarify the relationship between actual flight and wind tunnel measurements [7]. We are also interested in how much the actual trajectory of the ball is affected when a person serves the ball while paying attention to the panel surface.
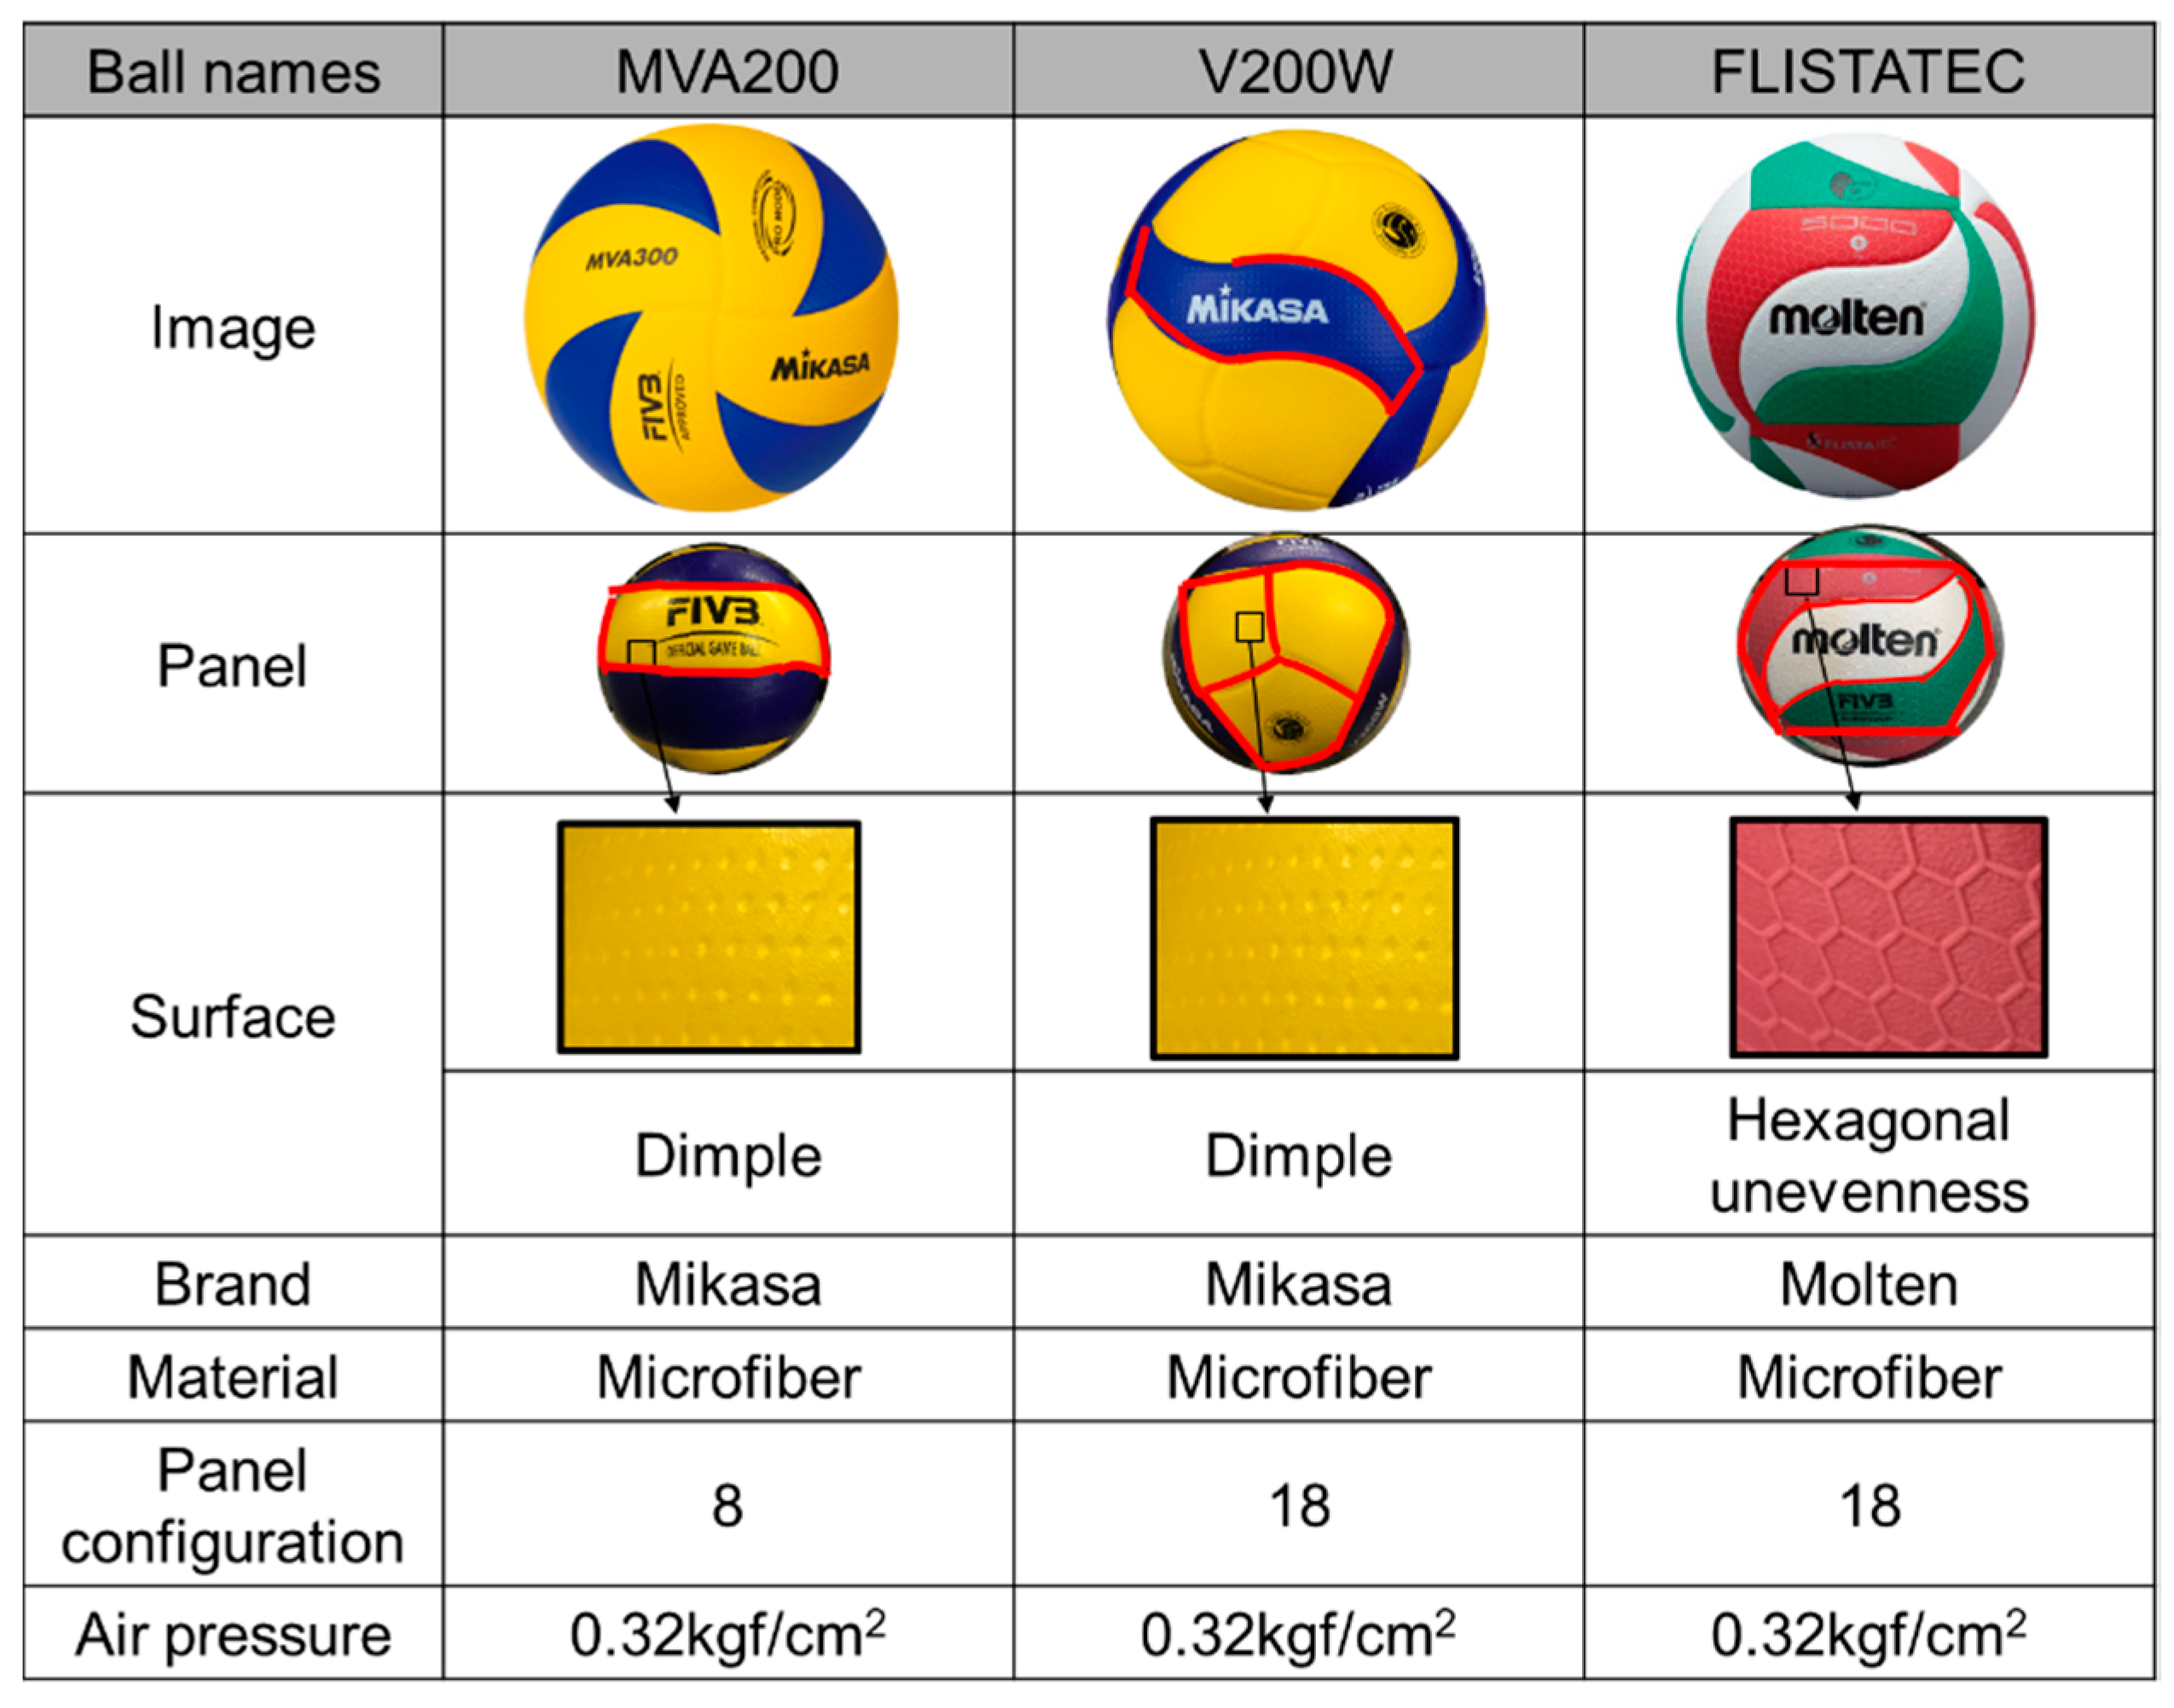
In this study, in order to clarify more directly the effects of the ball type and panel surface on the actual flight of the serve, we measured the drag coefficient using a wind tunnel and the flight distance using an ejection machine for three types of balls used in competitions: MVA200, V200W, and FLISTATEC. We also compared the human serve with the ejection machine, and measured and clarified the effect of the panel surface on the human serve. Figure 1 shows the characteristics of the three types of balls measured in this study. The MVA200, MIKASA, is the ball used in the 2012 and 2016 Olympic Games, consisting of eight panels with a dimpled surface. V200W, MIKASA, is the ball used in the 2021 Tokyo Olympic Games, consisting of 18 panels with a dimpled surface. FLISTATEC, MOLTEN, is the ball used in the NCAA. It has an uneven surface with a hexagonal honeycomb structure and consists of 18 panels. The flight distance of MVA200 was measured while changing the initial speed of the ball. In addition, the effect of selecting the panel orientation on the actual serve was clarified by comparing the ejection by the machine and the human serve.

2. Method

2.1. Drag Force Measurement in Wind Tunnel

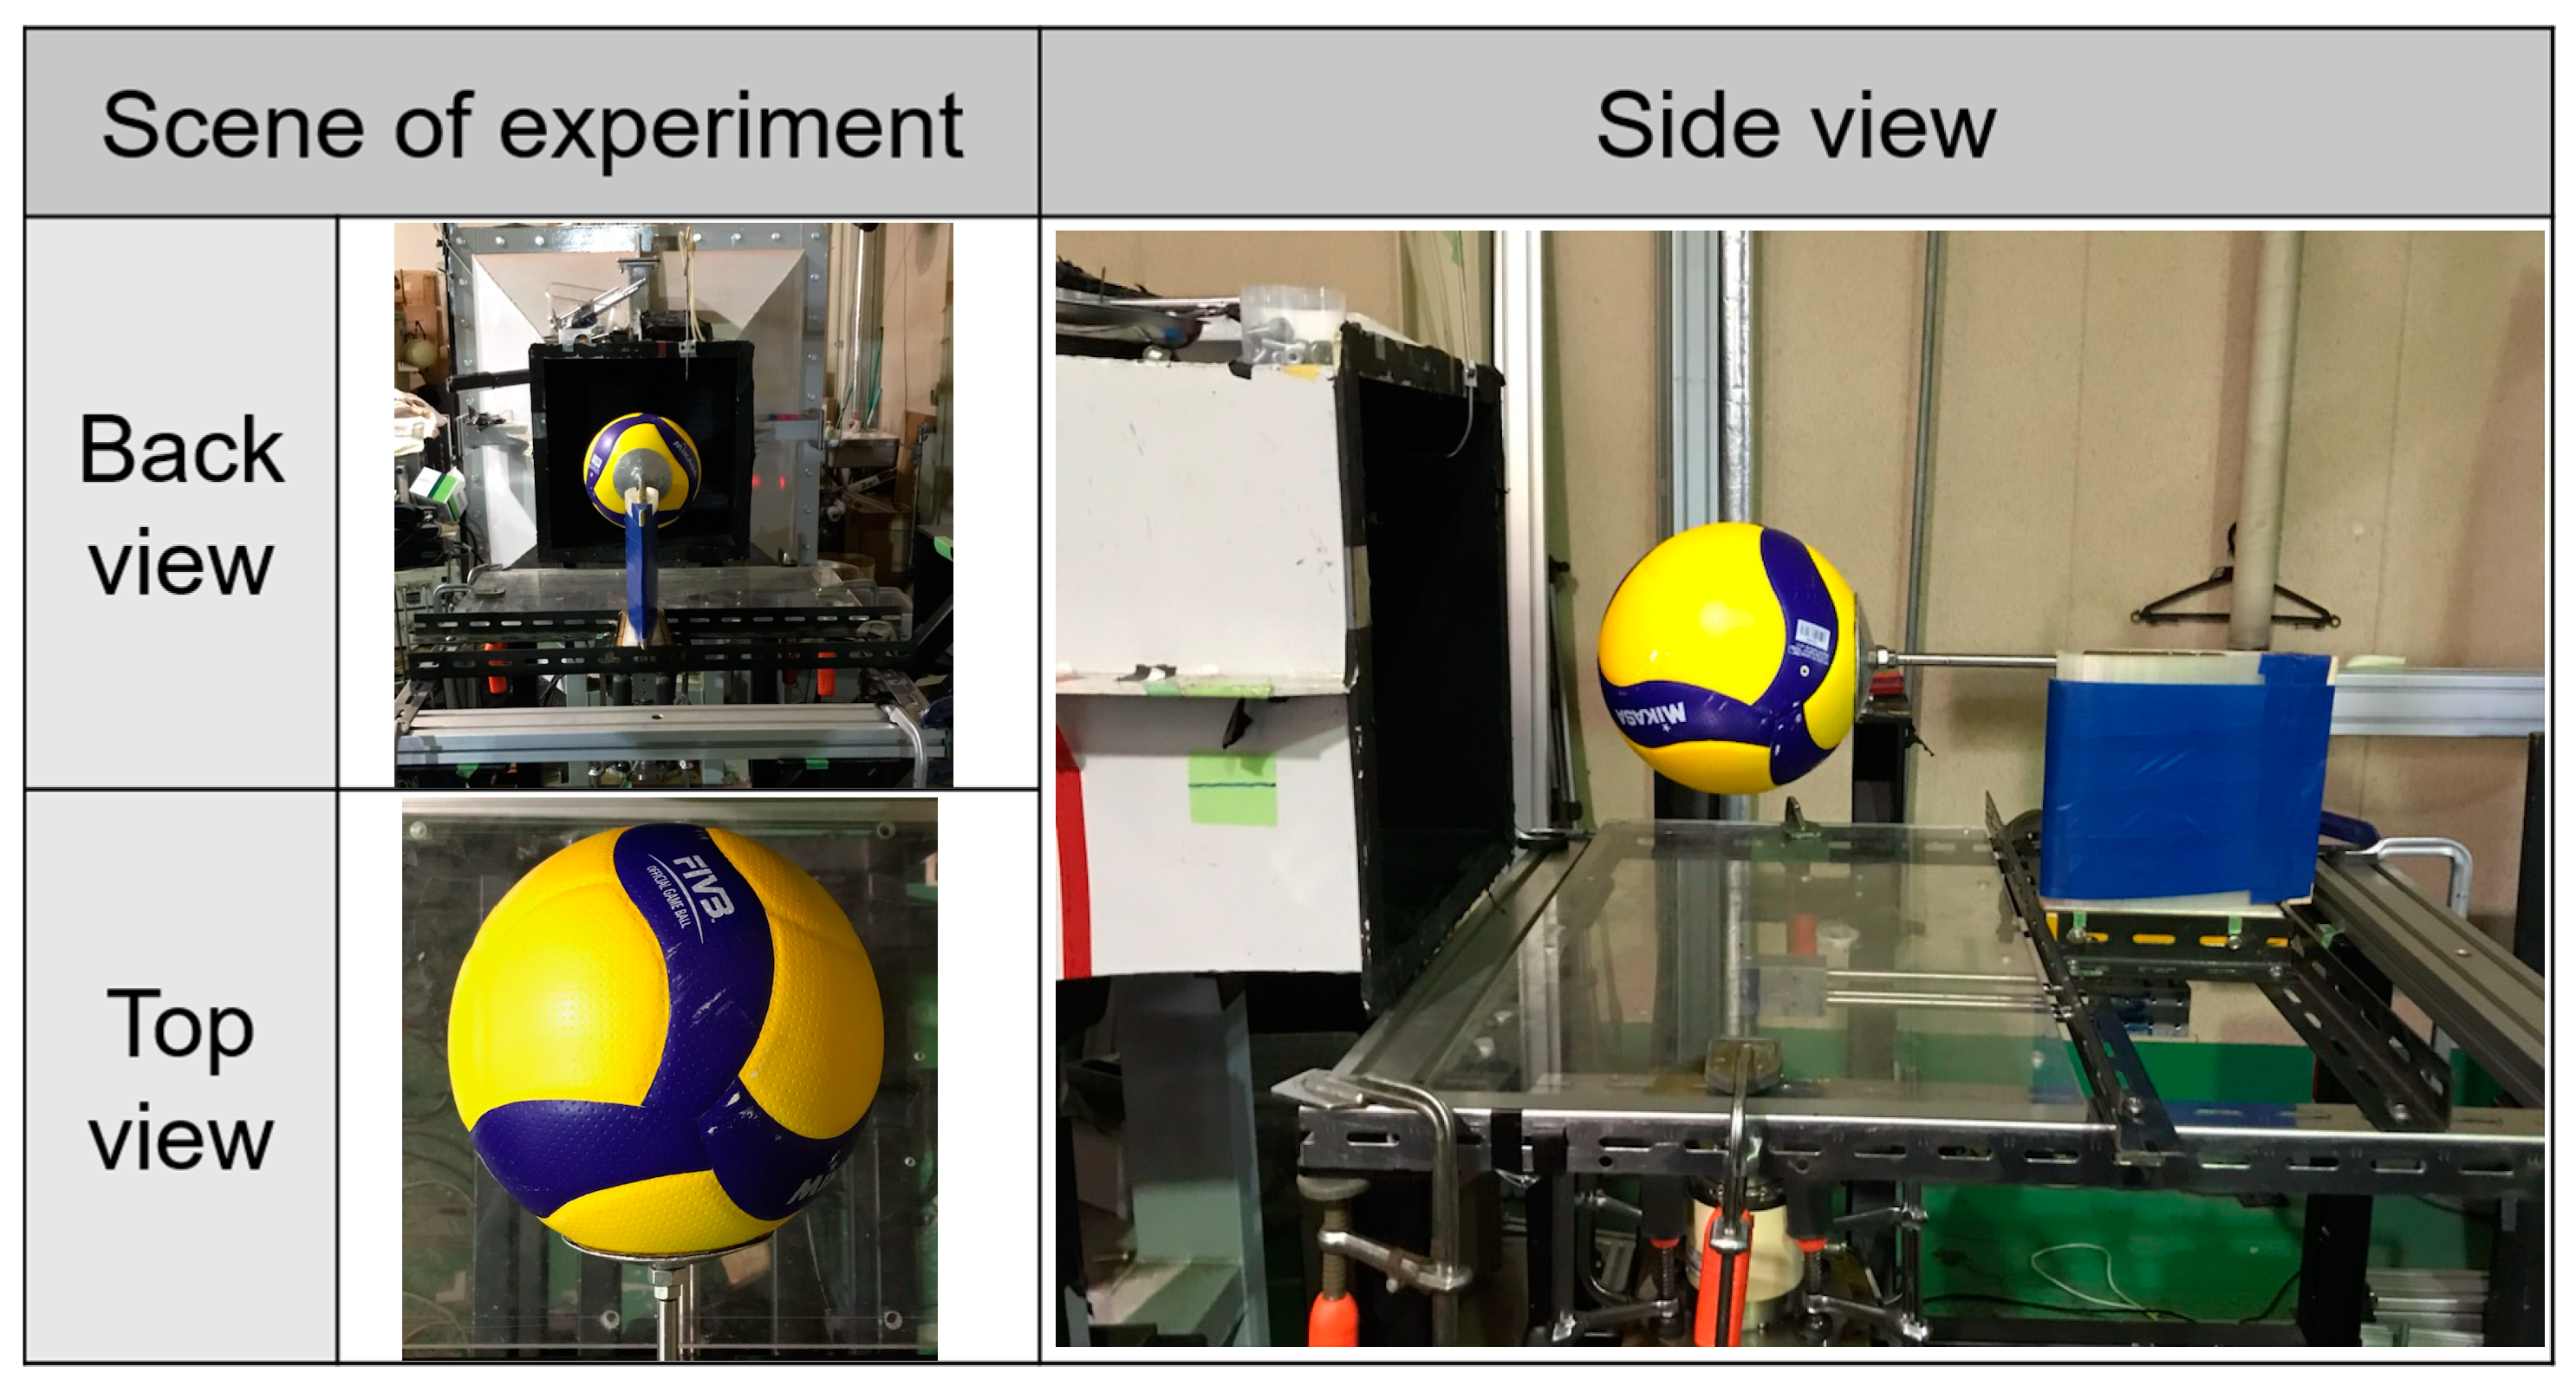
We measured the drag force on three types of balls at wind speeds ranging from 4 m/s to 30 m/s using a wind tunnel and a three-component load cell. The balls were placed in a wind tunnel with a cobra-type downwind support as shown in Figure 2. The sampling frequency of the three-component load cell was set to 1000 Hz, and the average applied force for 10 s was measured. The orientation of the panel was changed to three or four patterns for each ball to investigate the effect of not only the type of ball but also the orientation of the panel for the same ball.

2.2. Ejection Experiment

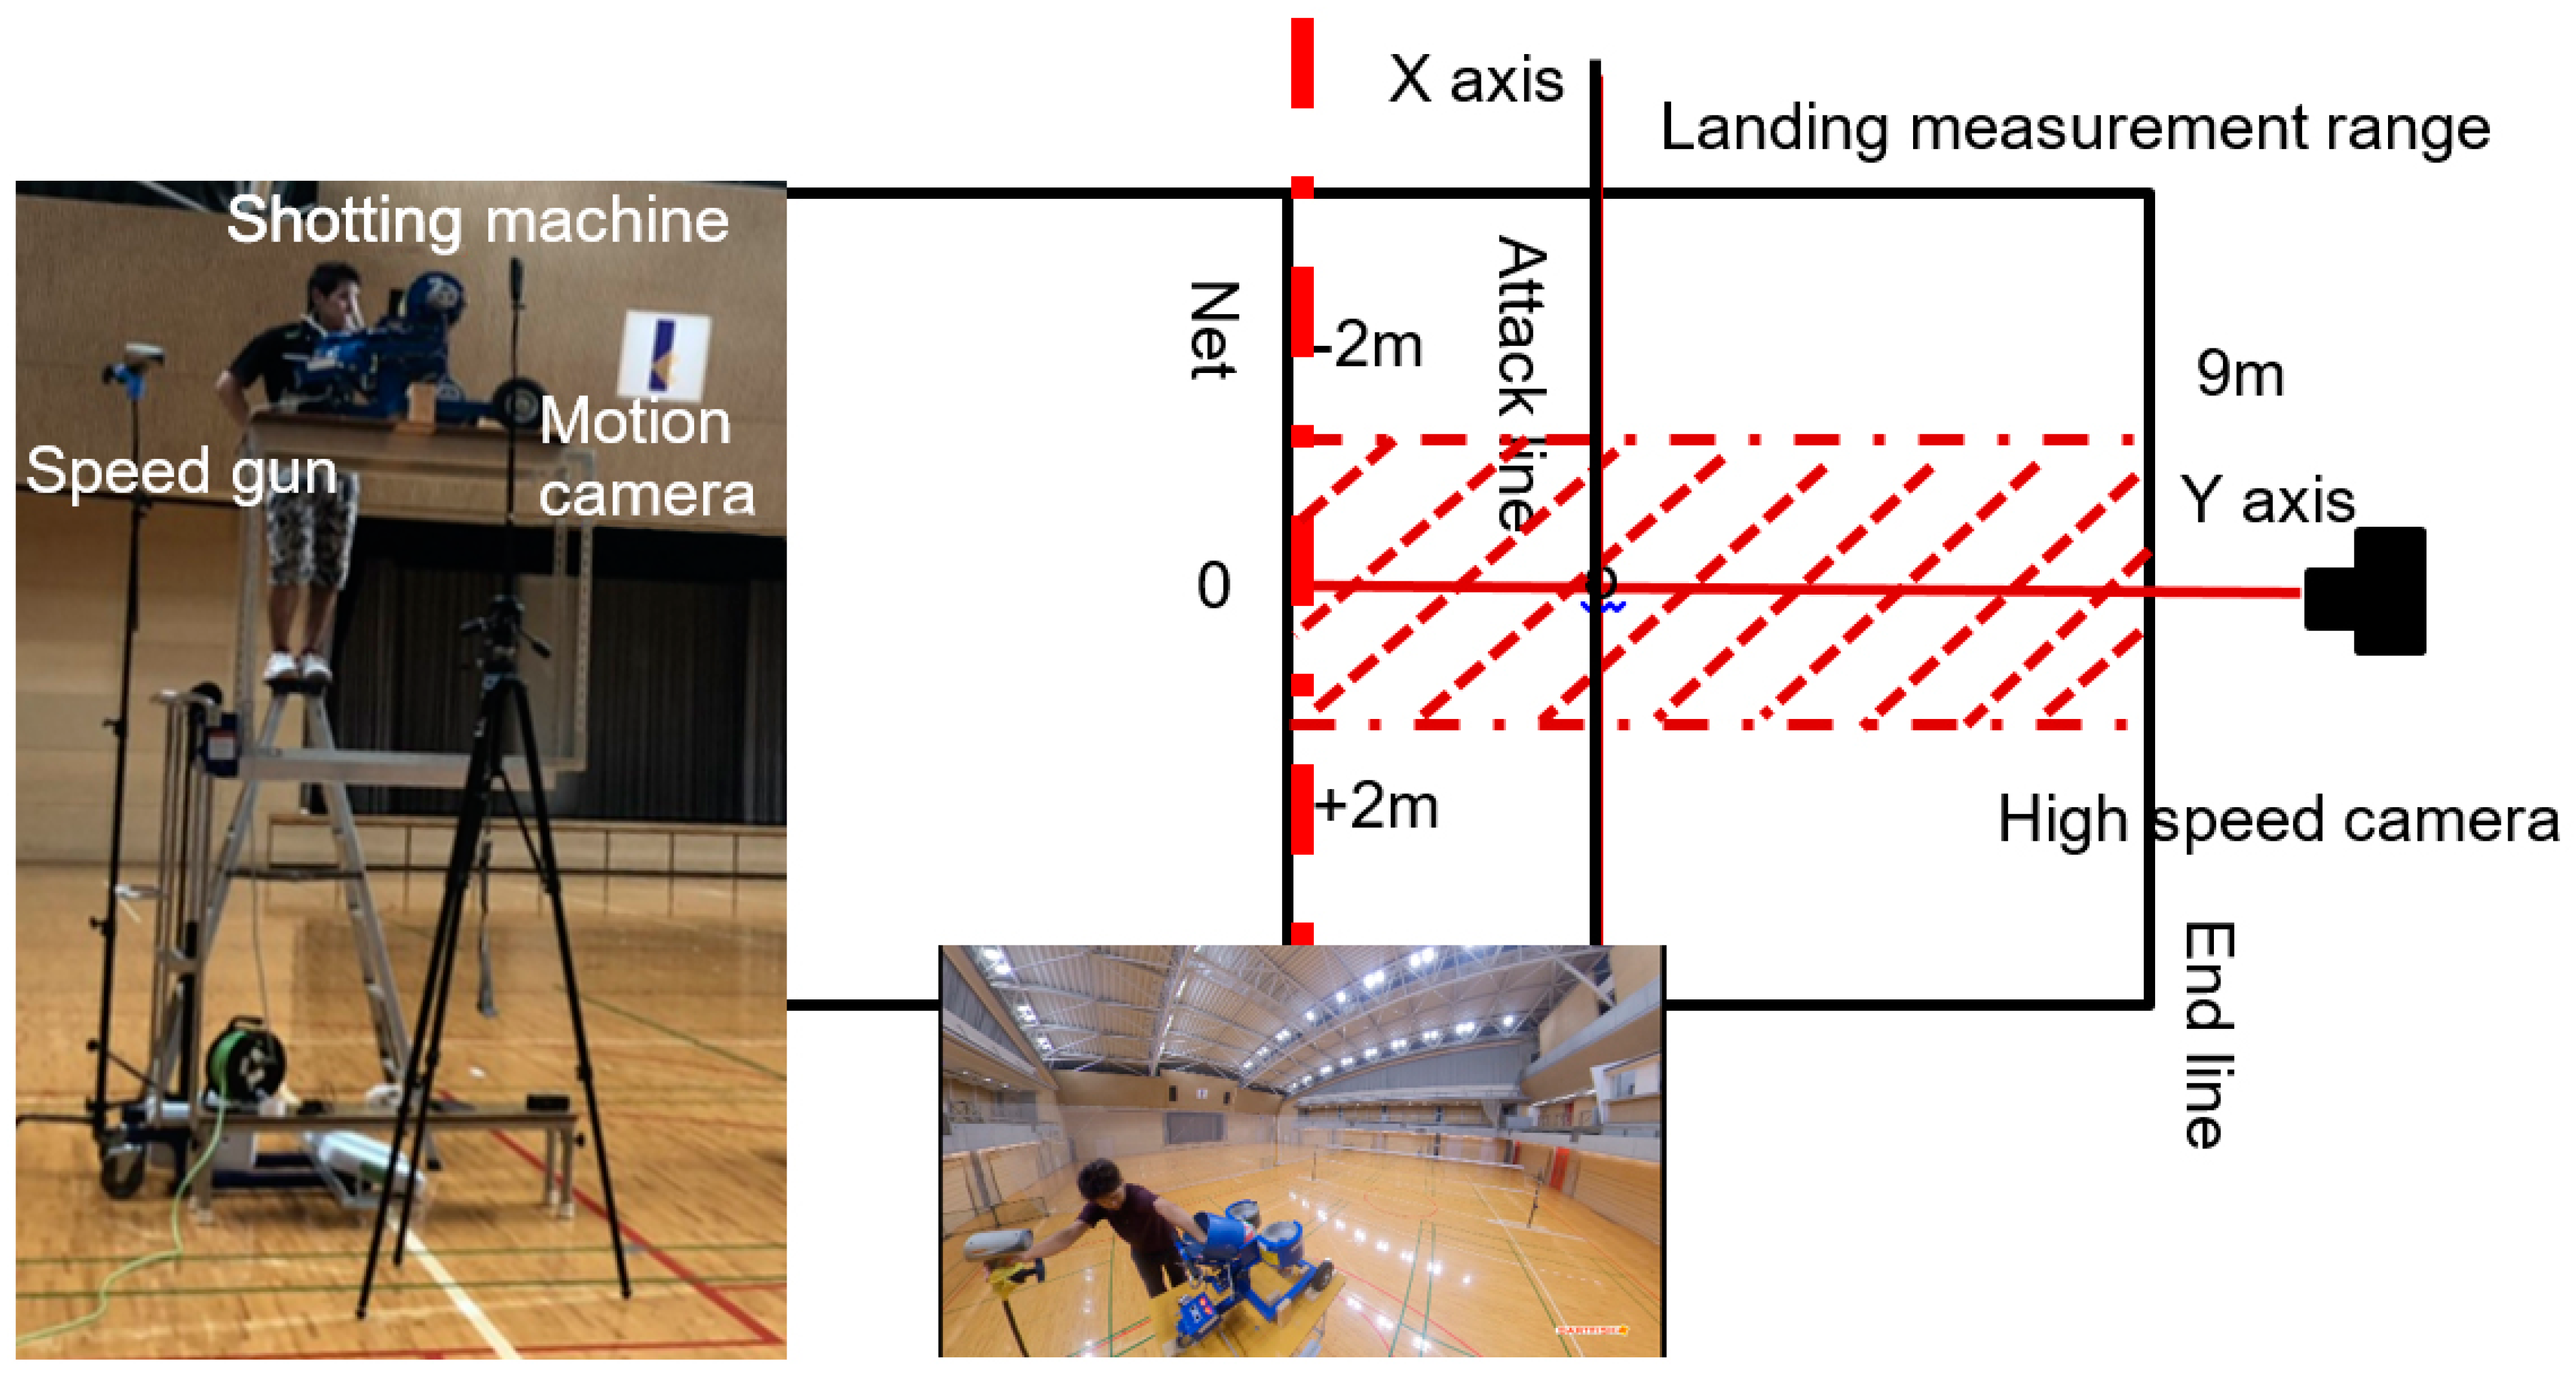
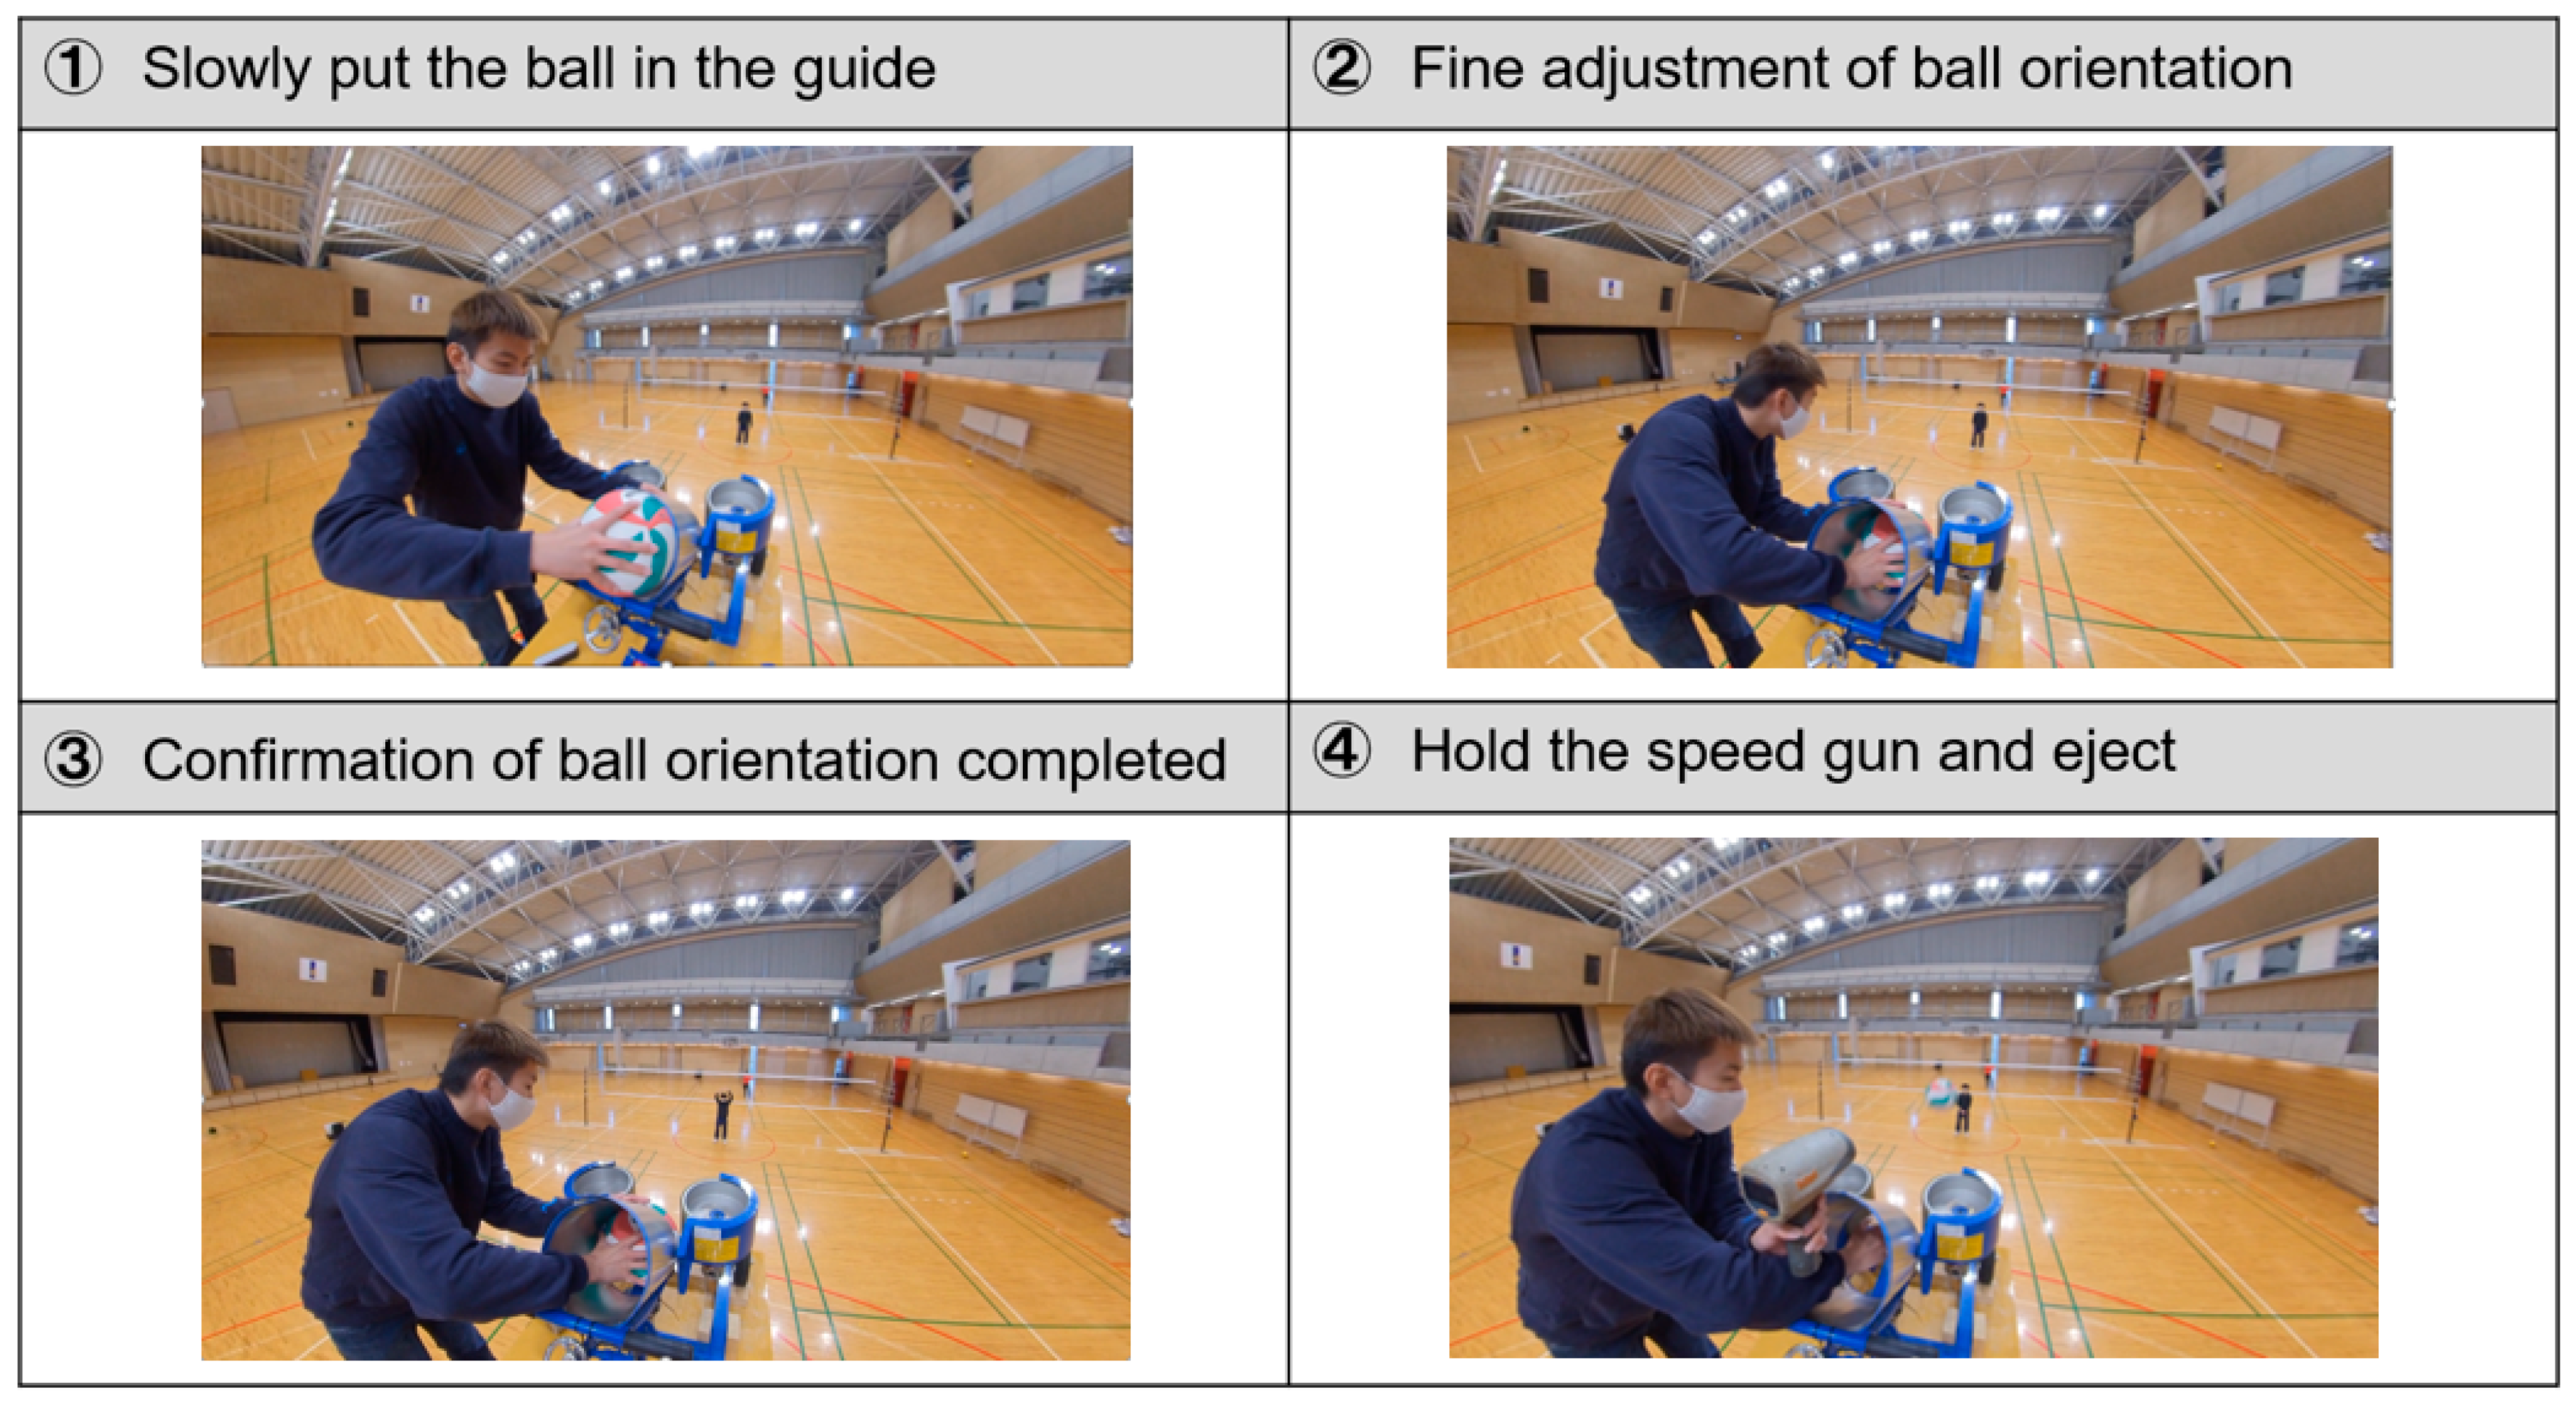
As shown in Figure 3, a ball ejector mounted on a hand-lift was set up in the service line to conduct an ejection experiment of a floater serve. Three types of balls, MVA200, V200W, and FLISTATEC, were ejected under the same conditions to compare the tendency of the landing points. The height of the ejection point was 3.0 m, the ejection speed was 60 ± 1.5 km/h, and the ejection angle was 5.5°. The landing point of the ball was measured while changing the direction of the panel face, ball valve, and ball logo. Further experiments were conducted by changing the velocity conditions of the V200W, the official ball of the Tokyo Olympics, to 60 ± 1.5 km/h, 65 ± 1.5 km/h, and 70 ± 1.5 km/h. The ball ejection experiment was performed using the procedure shown in Figure 4. First, we check the orientation of the panel face, the ball valve, and the ball logo to be ejected, and slowly insert it into the guide. The ball was ejected while checking the direction of the ball, making fine adjustments, and measuring the speed with a speed gun. If the speed deviated from the target ejection speed by more than ±1.5 km/h, the data were rejected. The landing point of the ball was visually checked and the distance was measured.

3. Result and Discussion

3.1. Drag Force Measurement in Wind Tunnel

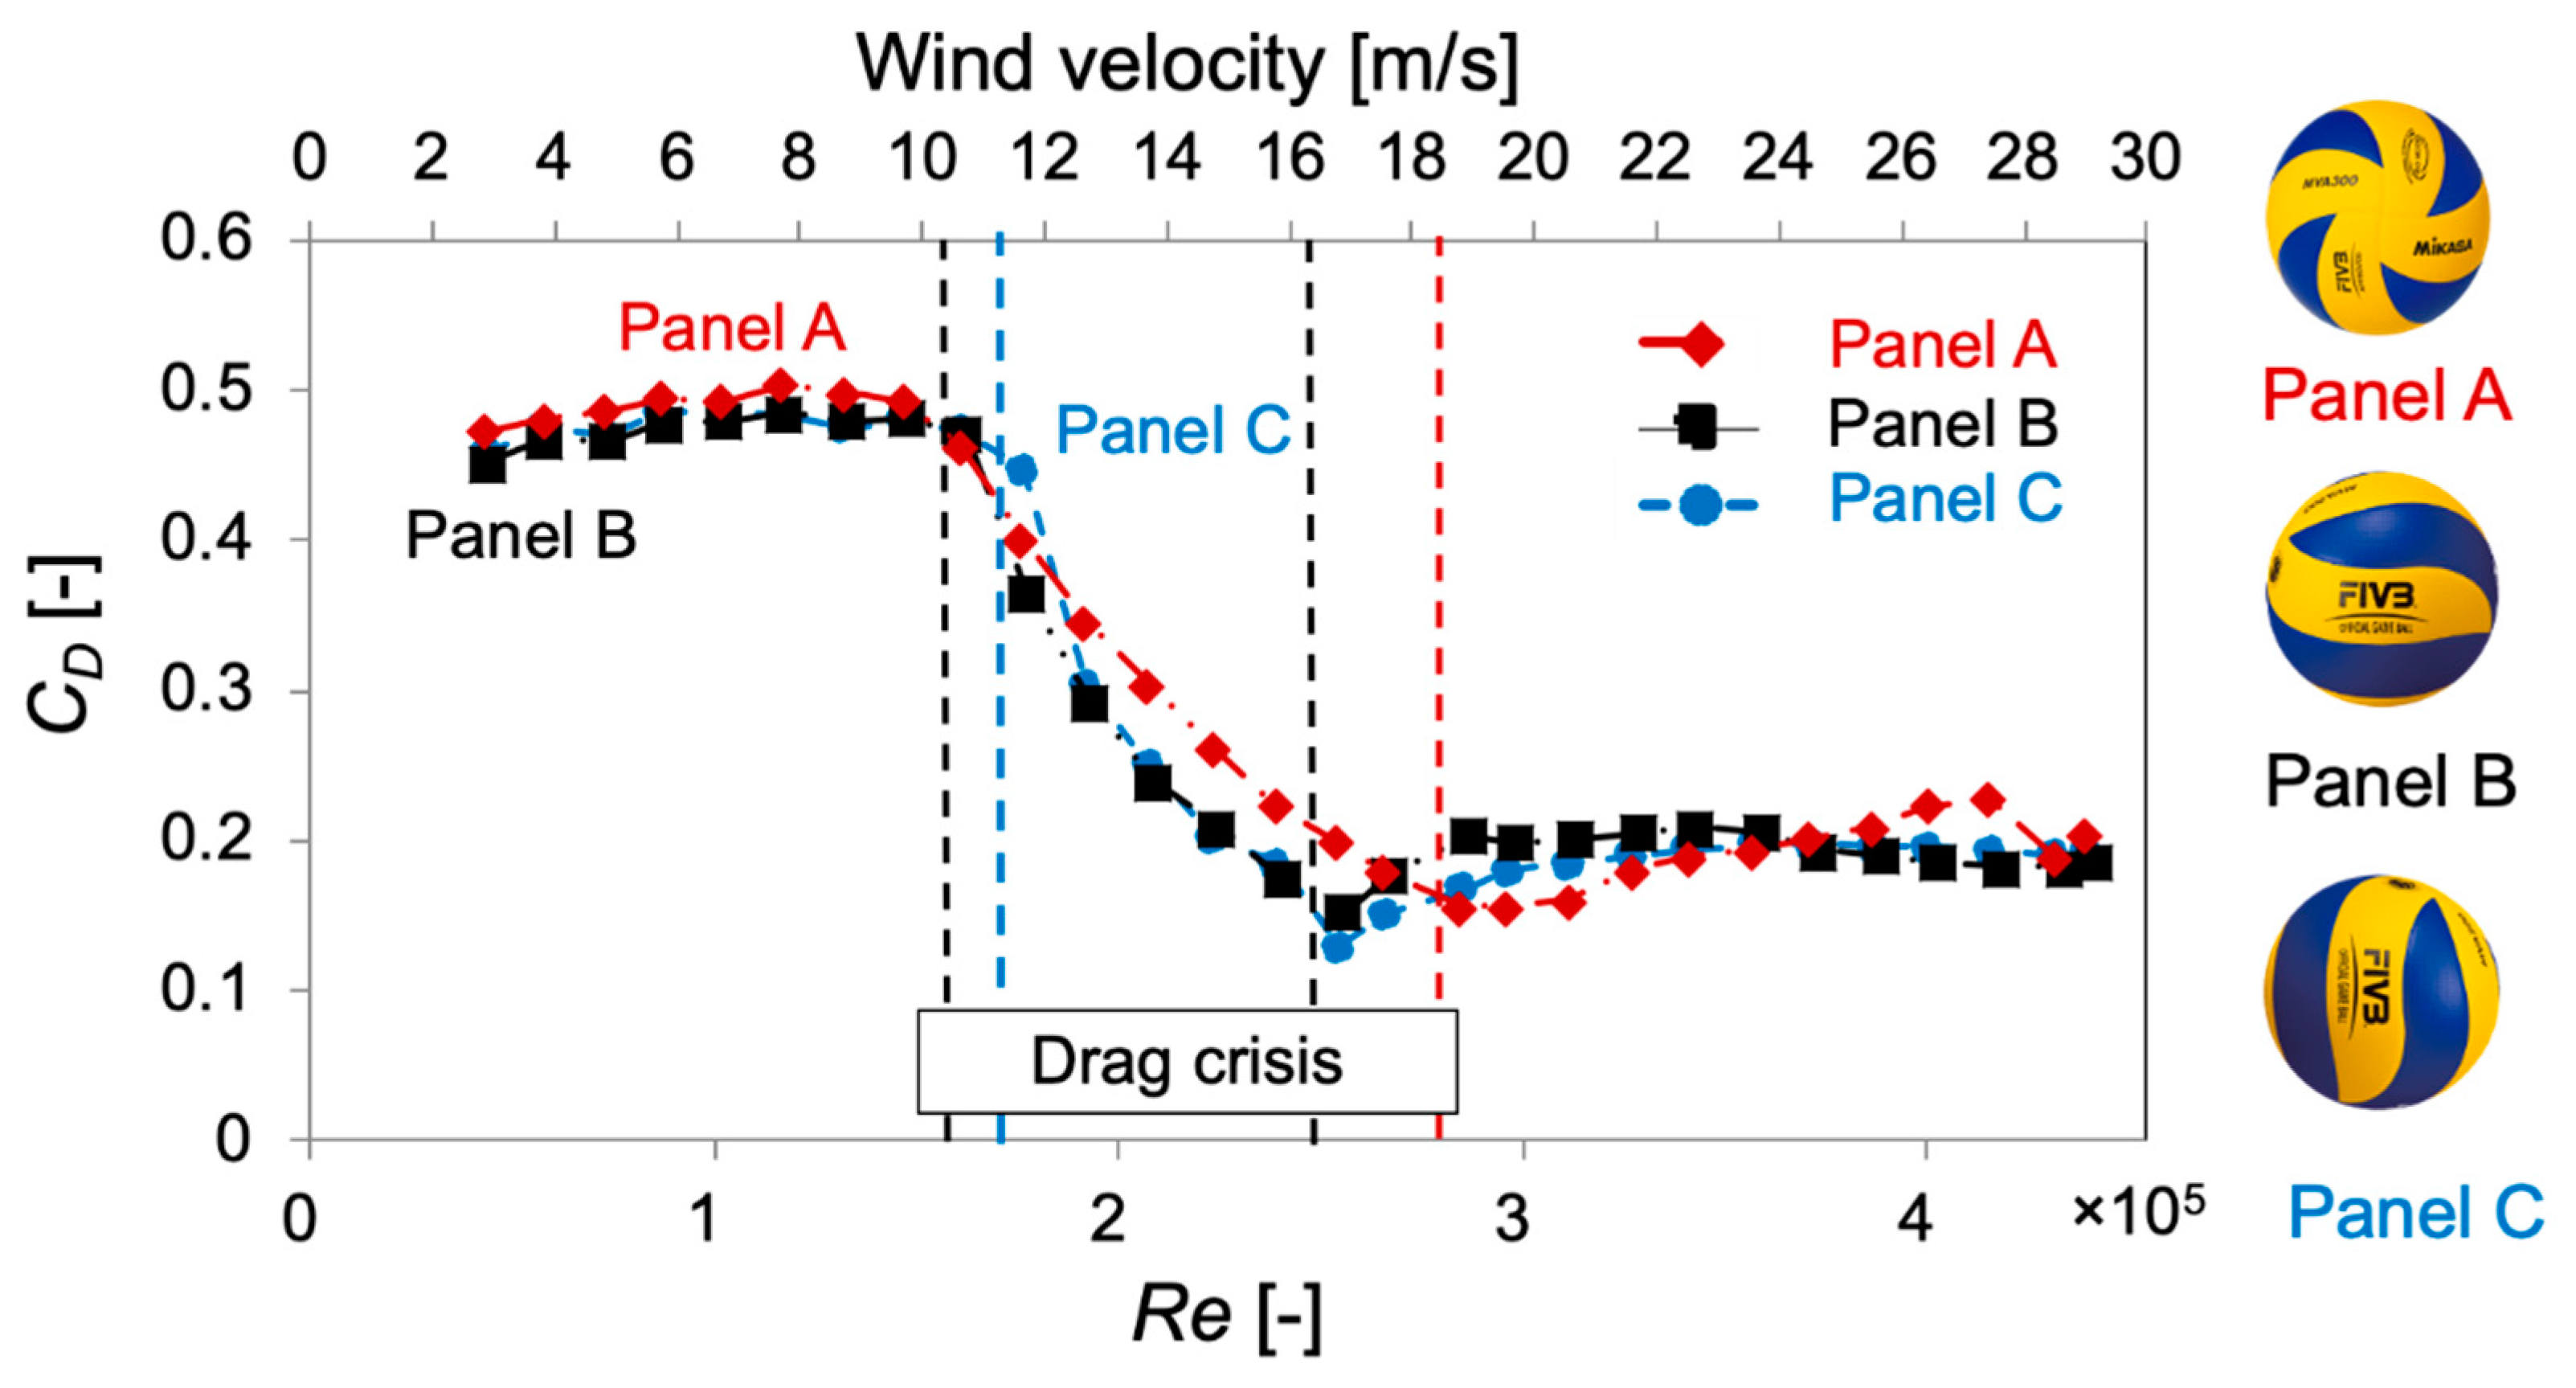
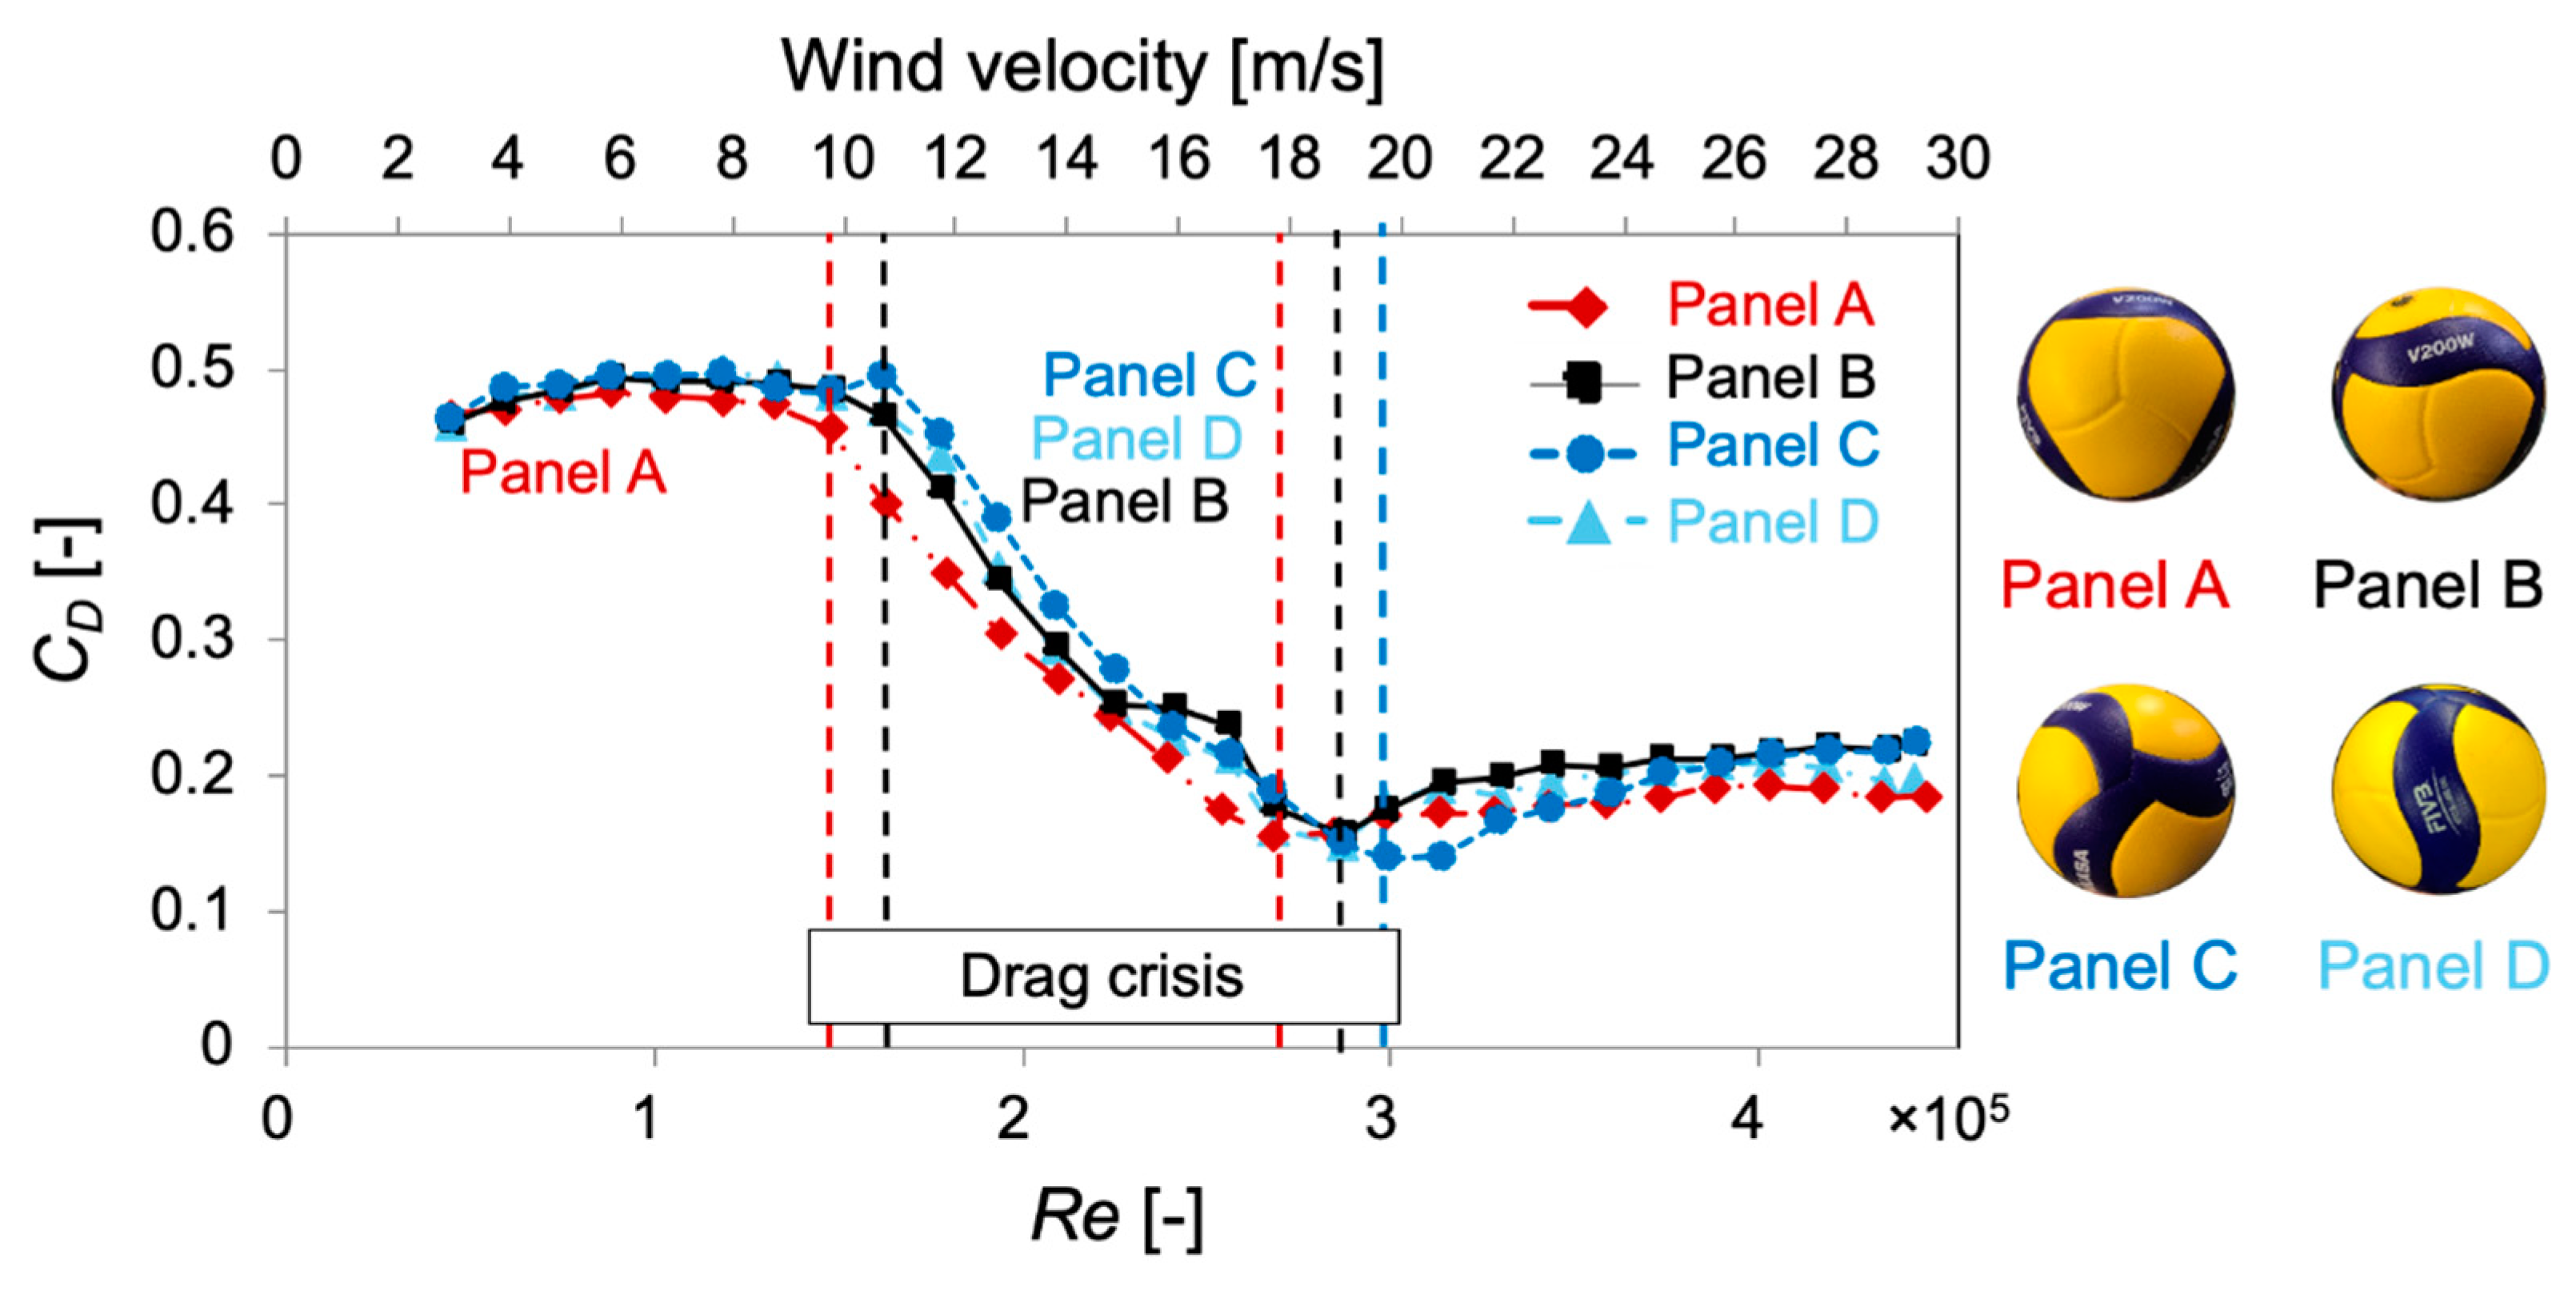
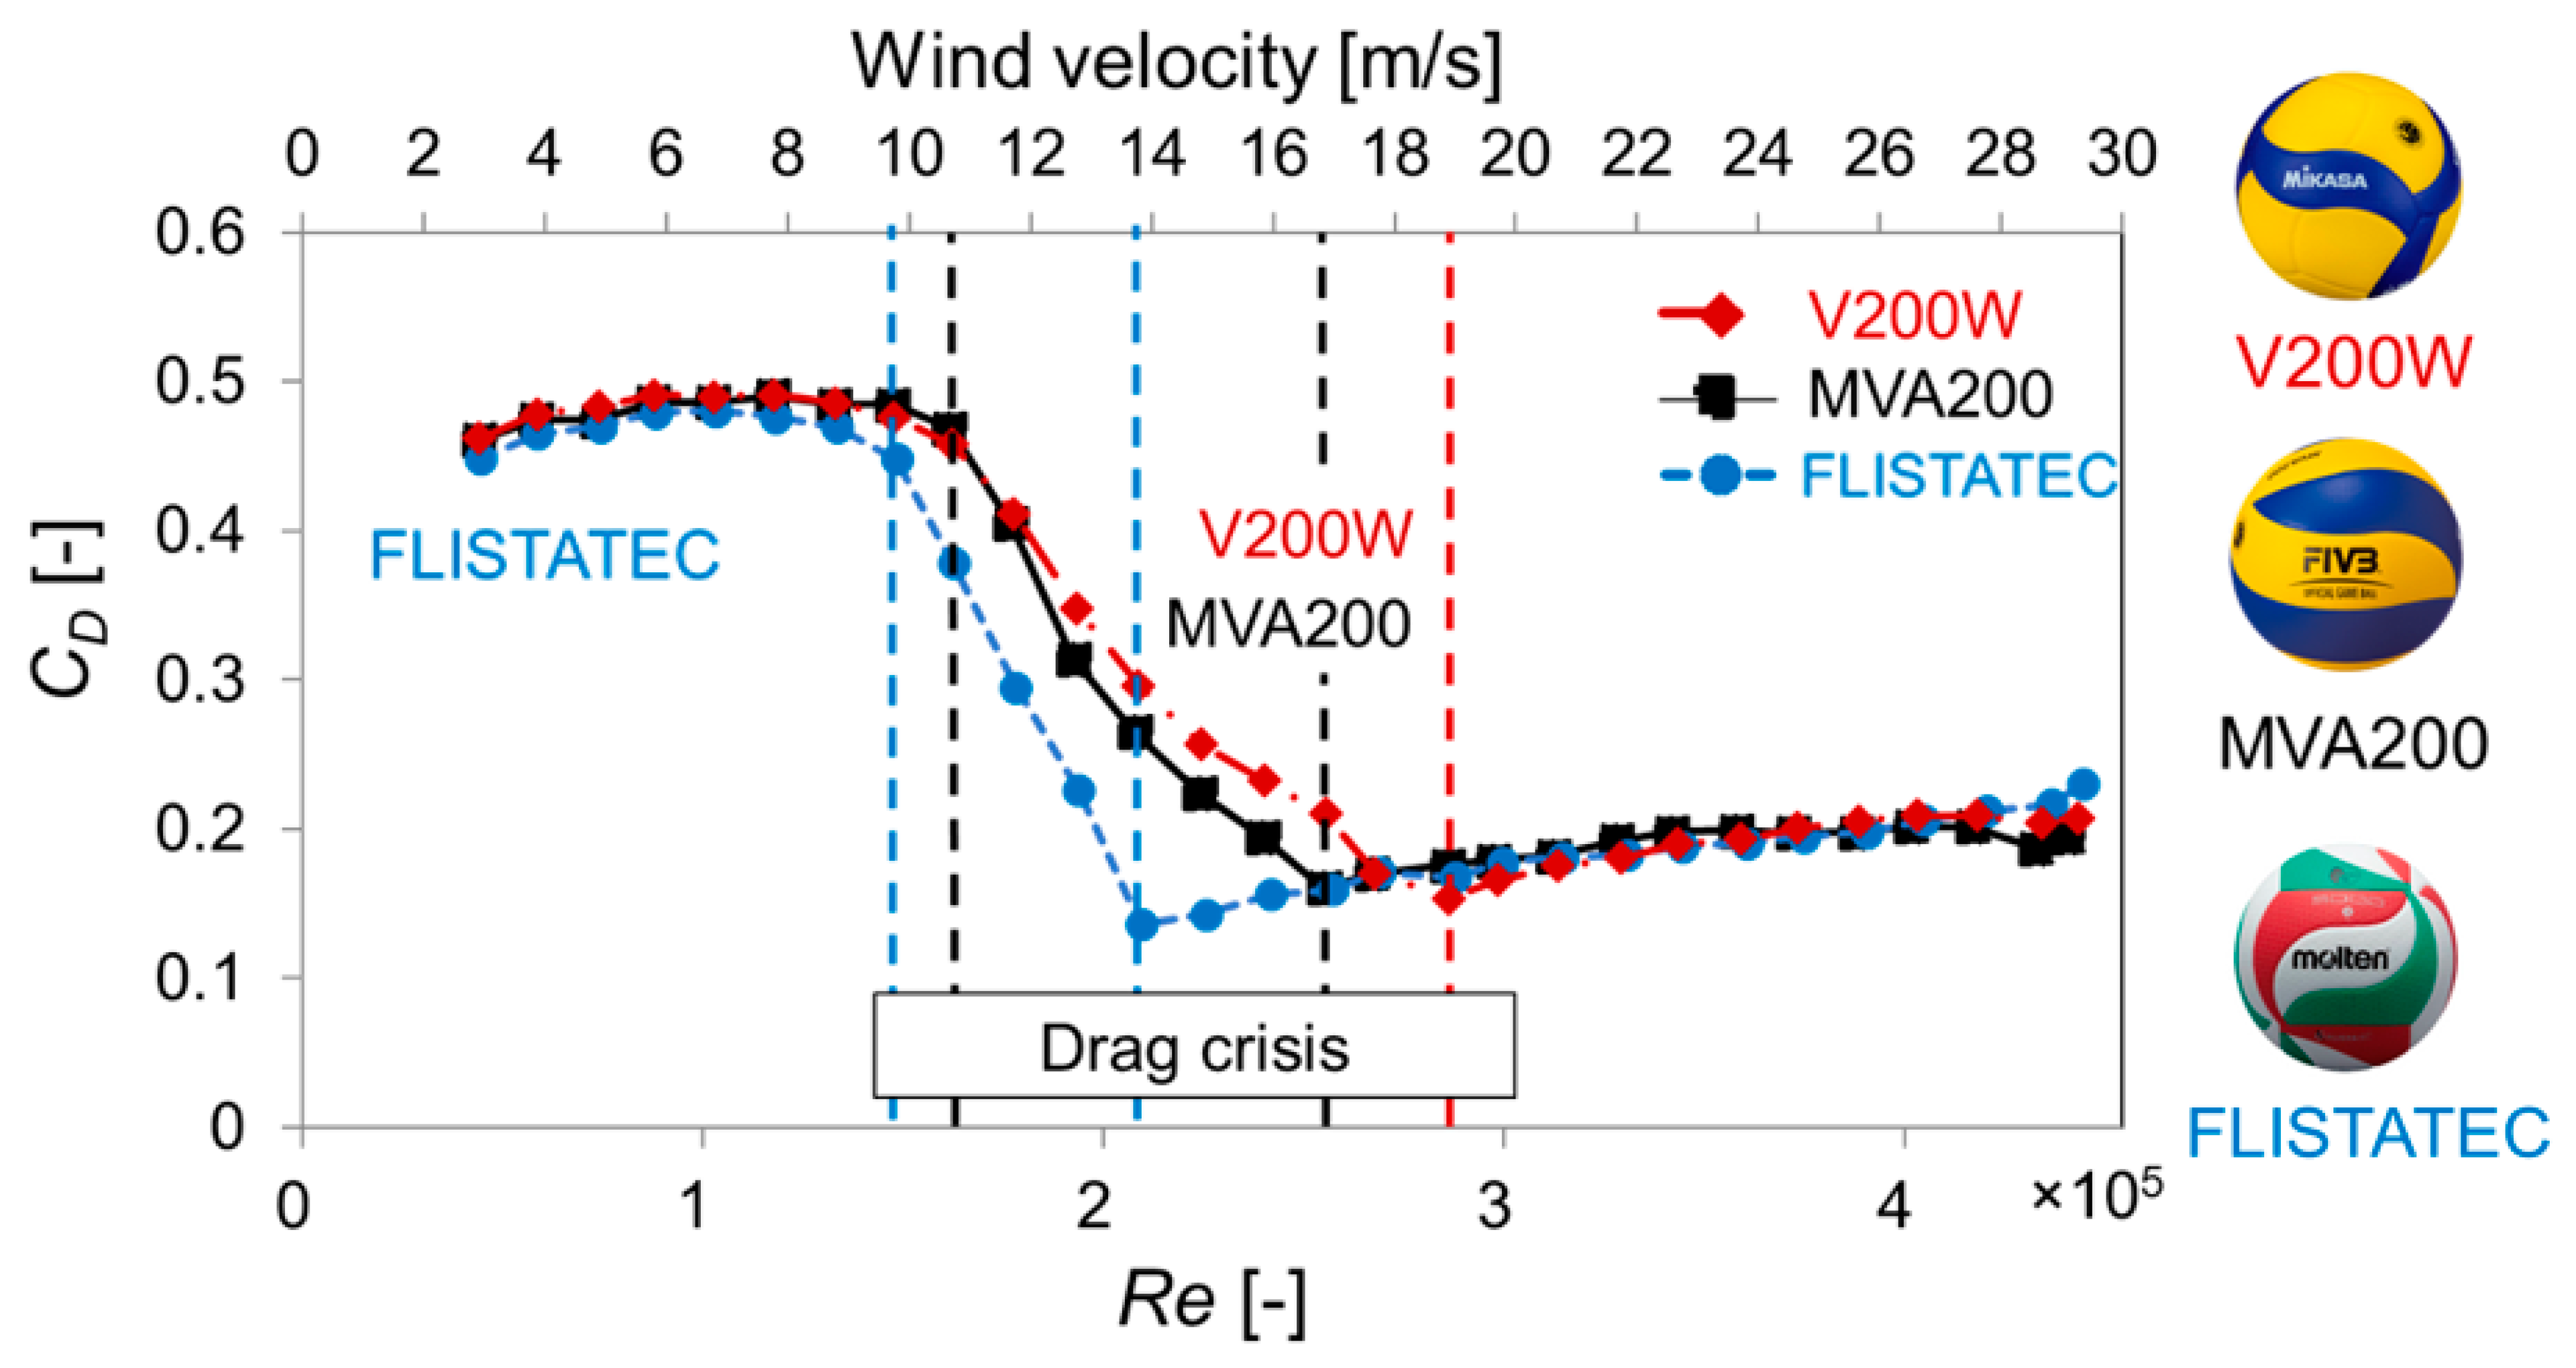
Figure 5, Figure 6 and Figure 7 show the measured drag coefficient of each ball. The horizontal axis (Re) is the Reynolds number and the vertical axis (Cd) is the drag coefficient, which is defined by the following equation: R e = d U / ν , C d = 2 D / ρ U A where d is the diameter of the volleyball d = 0.21 [m], U is the velocity of wind, ν is the kinematic viscosity of the air, D is the drag applied on the ball, ρ is the density of the air, and A is the cross-sectional area of the volleyball ( A = π d 2 / 4 0.0346 [m2]). The relationship between the flow velocity and the drag coefficient was measured while changing the direction of the panel facing the wind. For all balls, as the wind speed increased, the drag coefficient decreased drastically due to the drag crisis. This trend is similar to previous studies using various balls. The velocity at which the drag crisis begins and ends, and the magnitude of the drag coefficient, indicated by the dashed lines in the figure, varied with the orientation of the panel facing the wind. This difference in drag force depending on the orientation of the panel means that the flight path and distance of the ball changes depending on the orientation of the panel when the ball is hit. Figure 8 compares the average values of the drag coefficient of each panel surface measured with each ball. As an overall trend, it is clear that the drag crisis occurs in the region of high Reynolds number in the order of V200W, MVA200, and FLISTATEC. This result suggests that when the ball decelerates due to aerodynamic drag, FLISTATEC is slower to enter the drag crisis region, making it slower to increase the drag force of the ball and easier to increase the distance. The previous fluid drag measurements were performed on panels A and C of the MVA200, panels A and C of the V200W, and panels A and B of the FLISTATEC [11]. Our measurements of the drag force on each panel and the location of the drag crisis were generally consistent with the previous study. The relationship between the positions of drag crises for each ball was also consistent.

3.2. Ejection Experiment

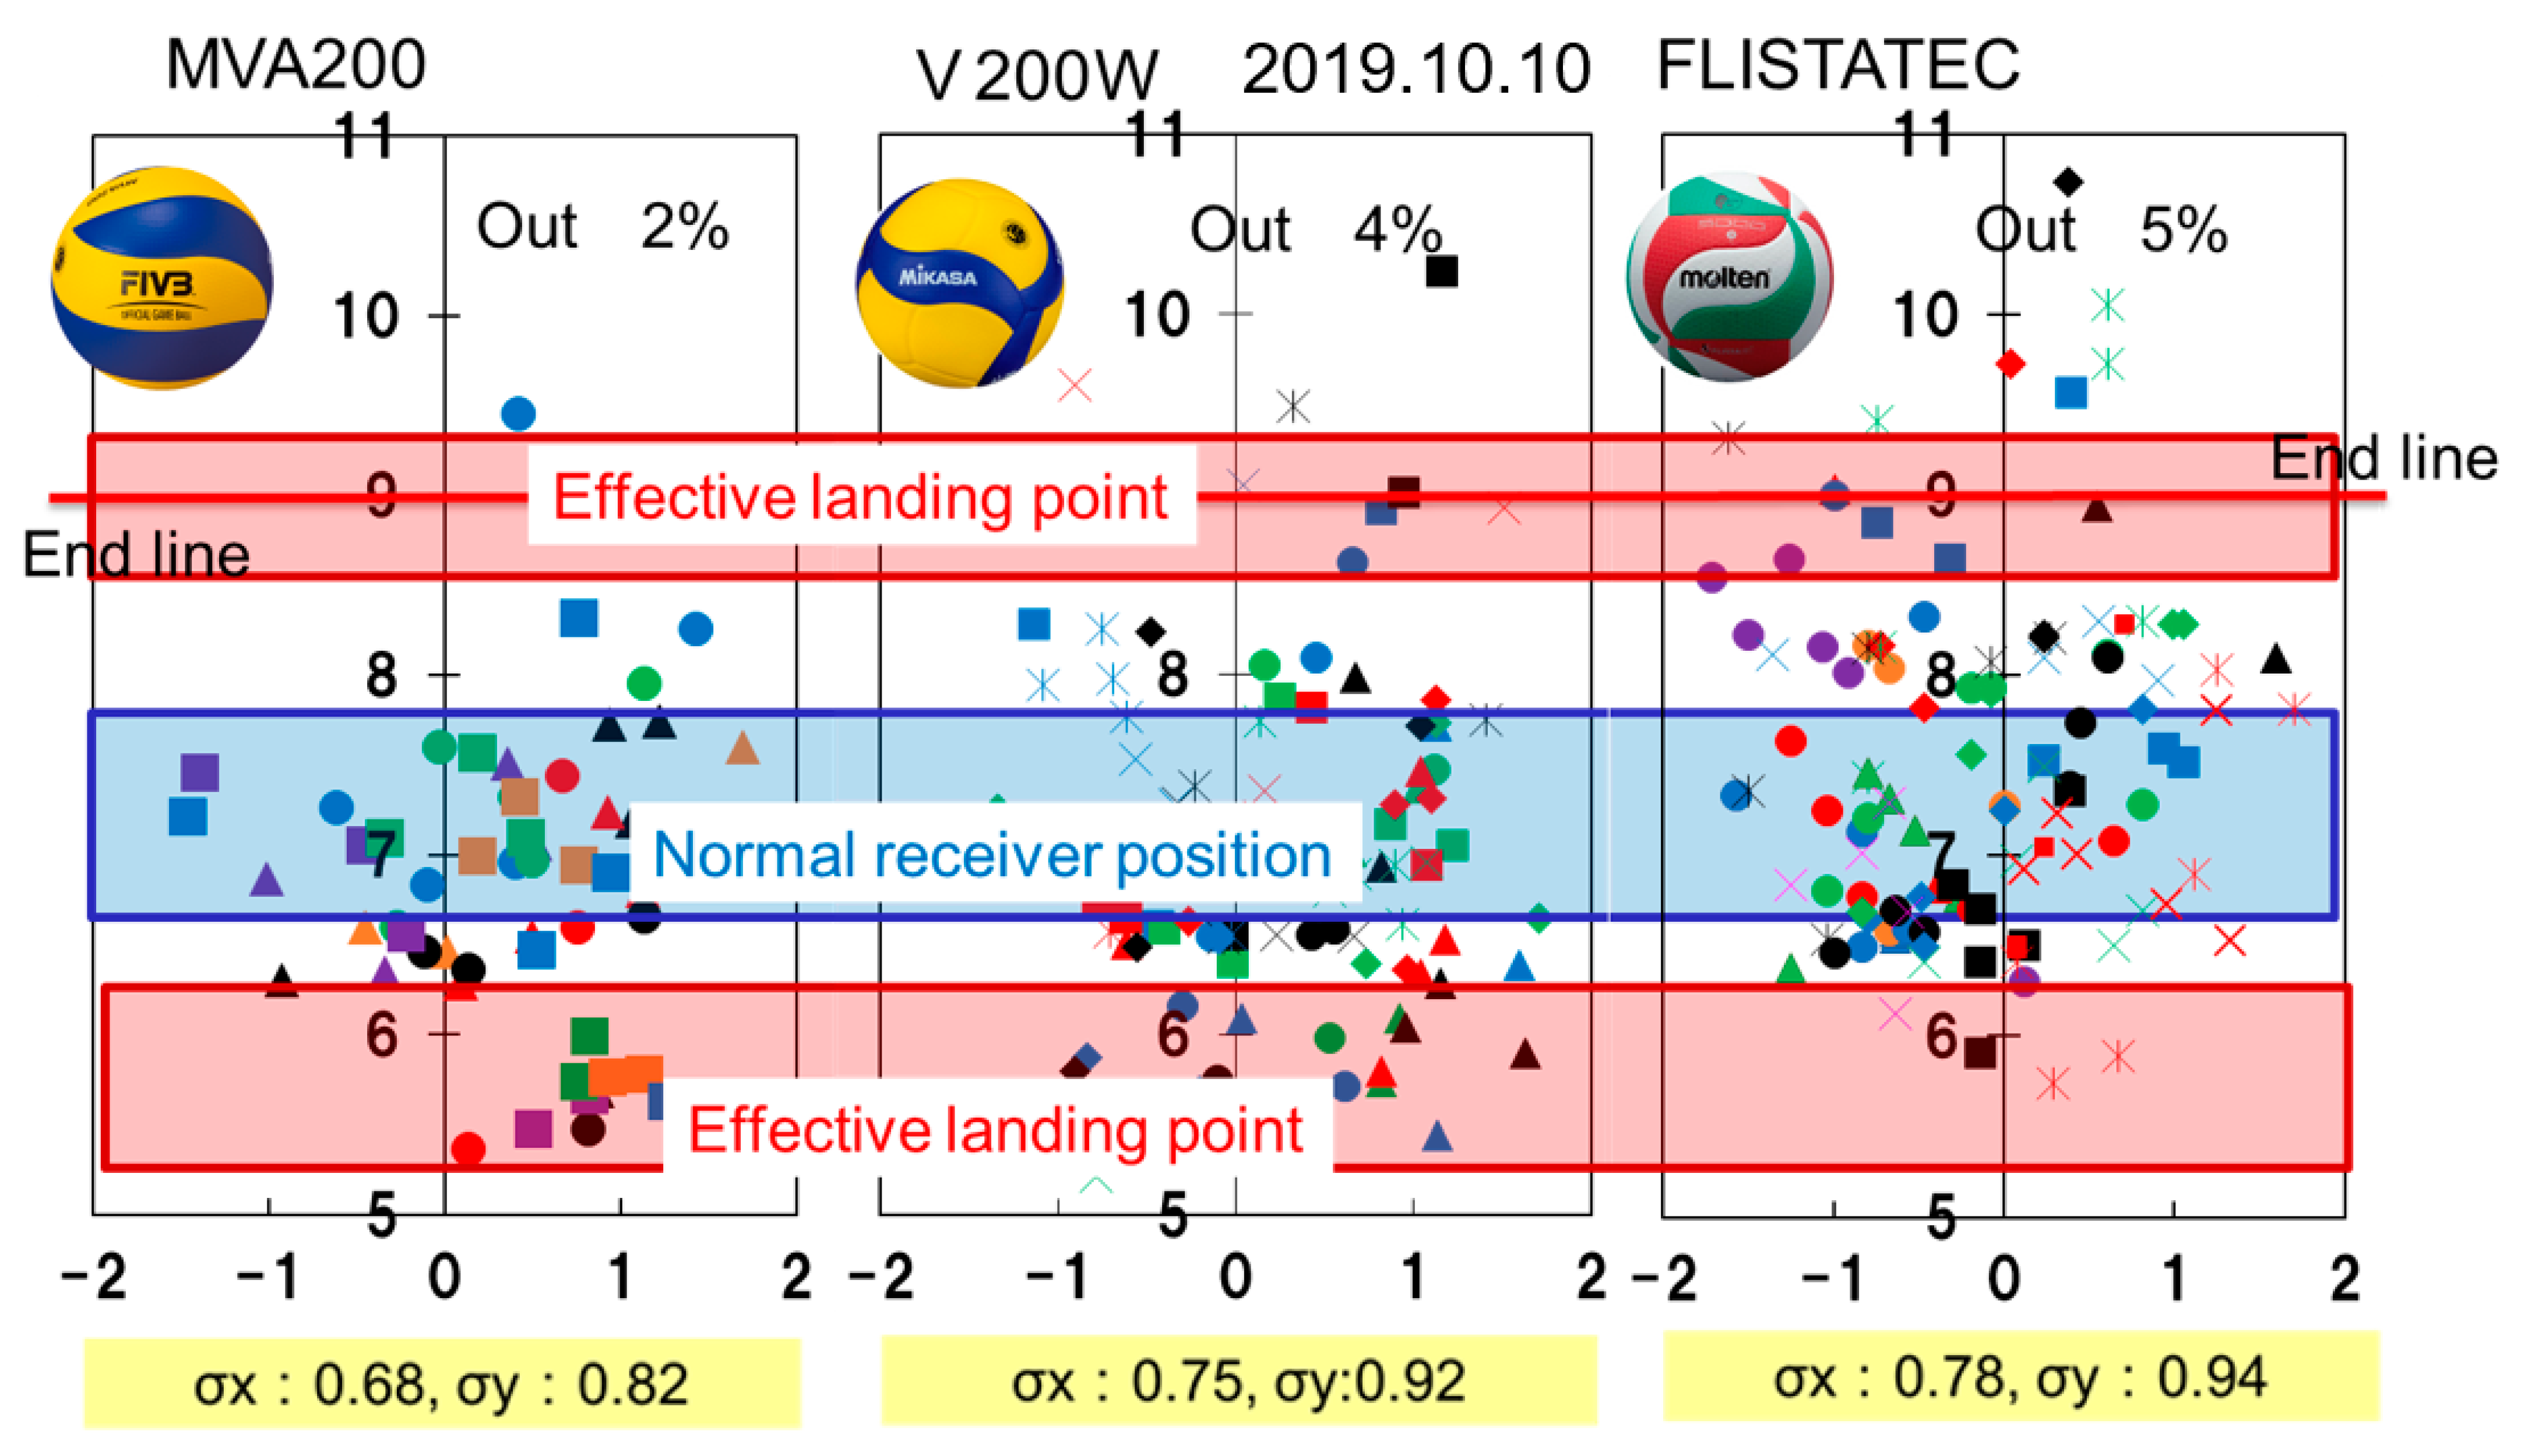
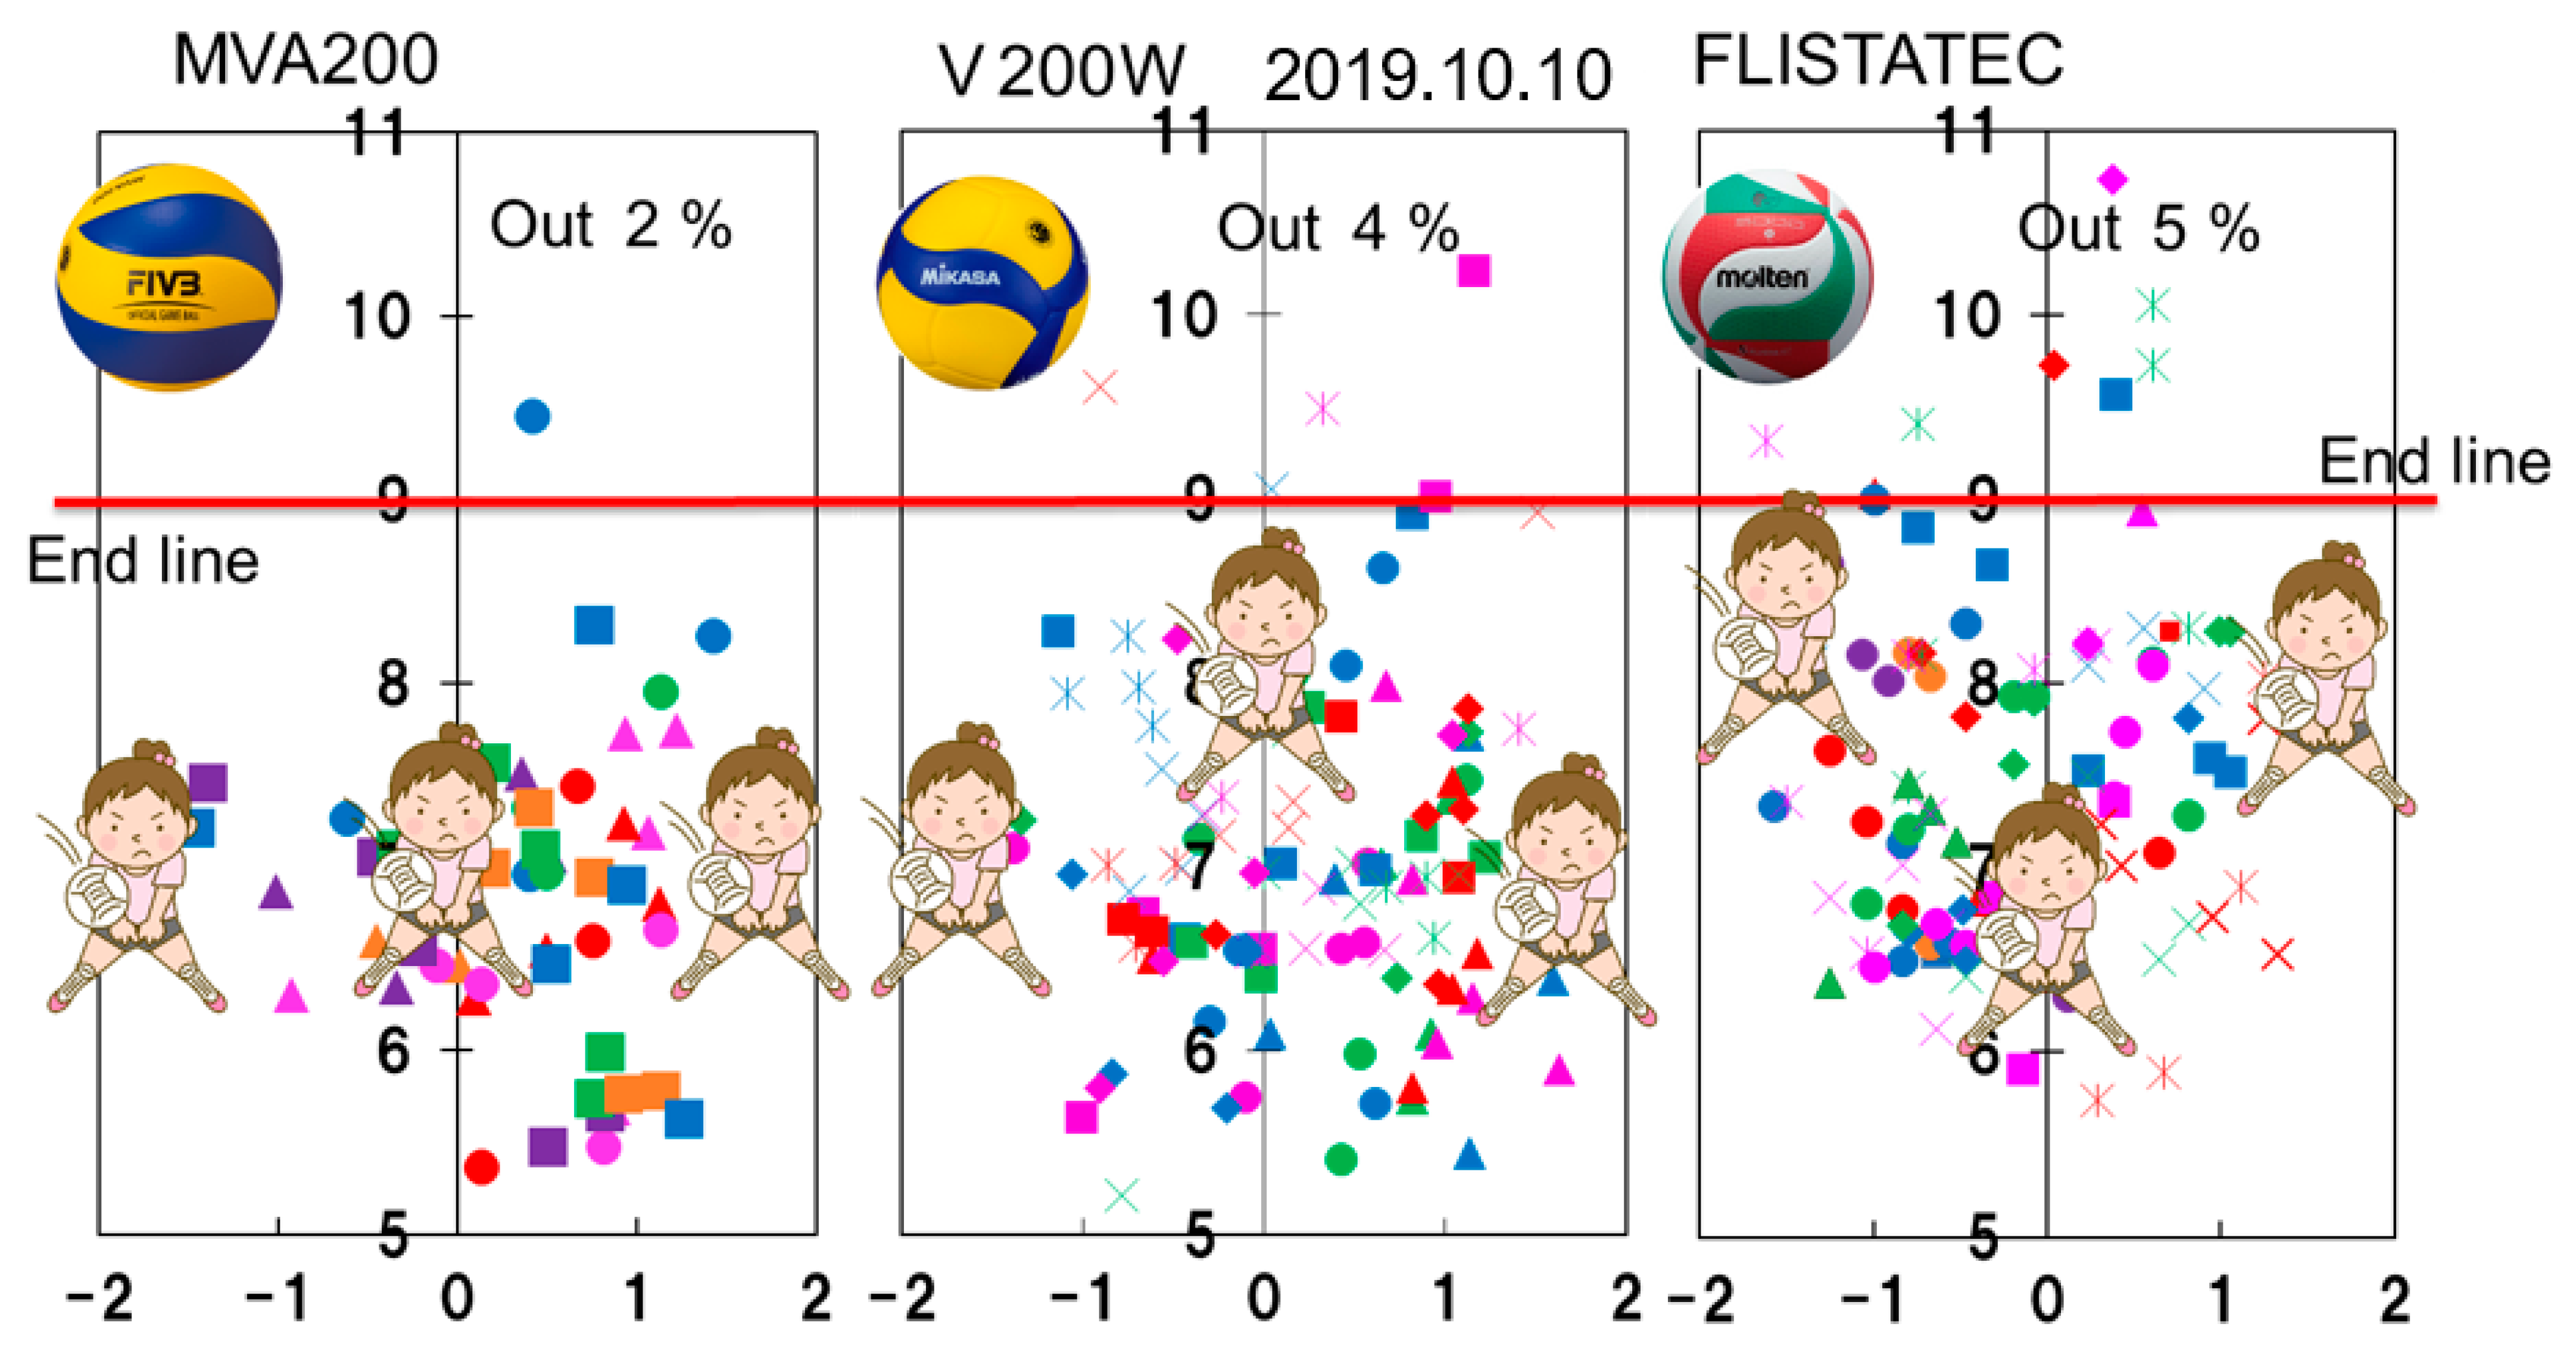
Figure 9 shows the distribution of landing points when MVA200, V200W, and FLISTATEC were ejected at a speed of 60 km/h using an ejection machine. The panel characteristics of the ball flight direction were distinguished by the panel orientation, logo position, and ball valve position. While varying these factors, 12 patterns for MVA200, 24 patterns for V200W, and 26 patterns for FLISTATEC were measured five times each. The different types of plots represent differences in the orientation of the panels, the logos, and the positions of the valves. The red line indicates the end line of the court, and any ball that flies farther than this line is an out ball. Receivers are usually placed at a range of 6.5 to 7.5 m. The area enclosed by the red square is where it is difficult to return the ball, close to the net or end line. As shown in Figure 9, the distance of the ball varies, but is characterized to some extent by the type of ball and the panel surface. The average landing point for each ball was 7.5 m for the FLISTATEC, 7 m for the V200W, and 6.8 m for the MVA200, which is consistent with the order of decreasing drag coefficient in the fluid force measurement shown in Figure 8.
In the case of FLISTATEC, the difference in distance depending on the panel surface was larger than that of MVA200 and V200W. For this reason, it is important to pay attention to the panel face of the FLISTATEC in order to make the ball fall at the target position. Figure 10 shows the standard deviations in the x and y directions for each panel of the balls. Since each panel was measured only five times, it cannot be said to be a statistically sufficient amount, but it was found that there is a difference in the variability of each ball and panel. In the previous fluid force measurement using a wind tunnel [7,11], the magnitude of the force applied to the ball varied with time, and it was reported that some panels had large amplitudes while others had small amplitudes. The results of the present study, which show that the variation in the drop point varies from panel to panel, are consistent with the previous result, indicating that the blurring of the floater serve varies from panel surface to panel surface.
Figure 11 shows the suggested effective positioning of the receivers based on the trend of the ball flight distance. It is considered better to place the receivers in a horizontal row because the MVA200 has relatively small variation in the y direction. On the other hand, V200W and FLISTATEC have a large variation in the y-axis direction, so it is desirable to protect the front and back with a zigzag receiver formation instead of a simple horizontal formation.
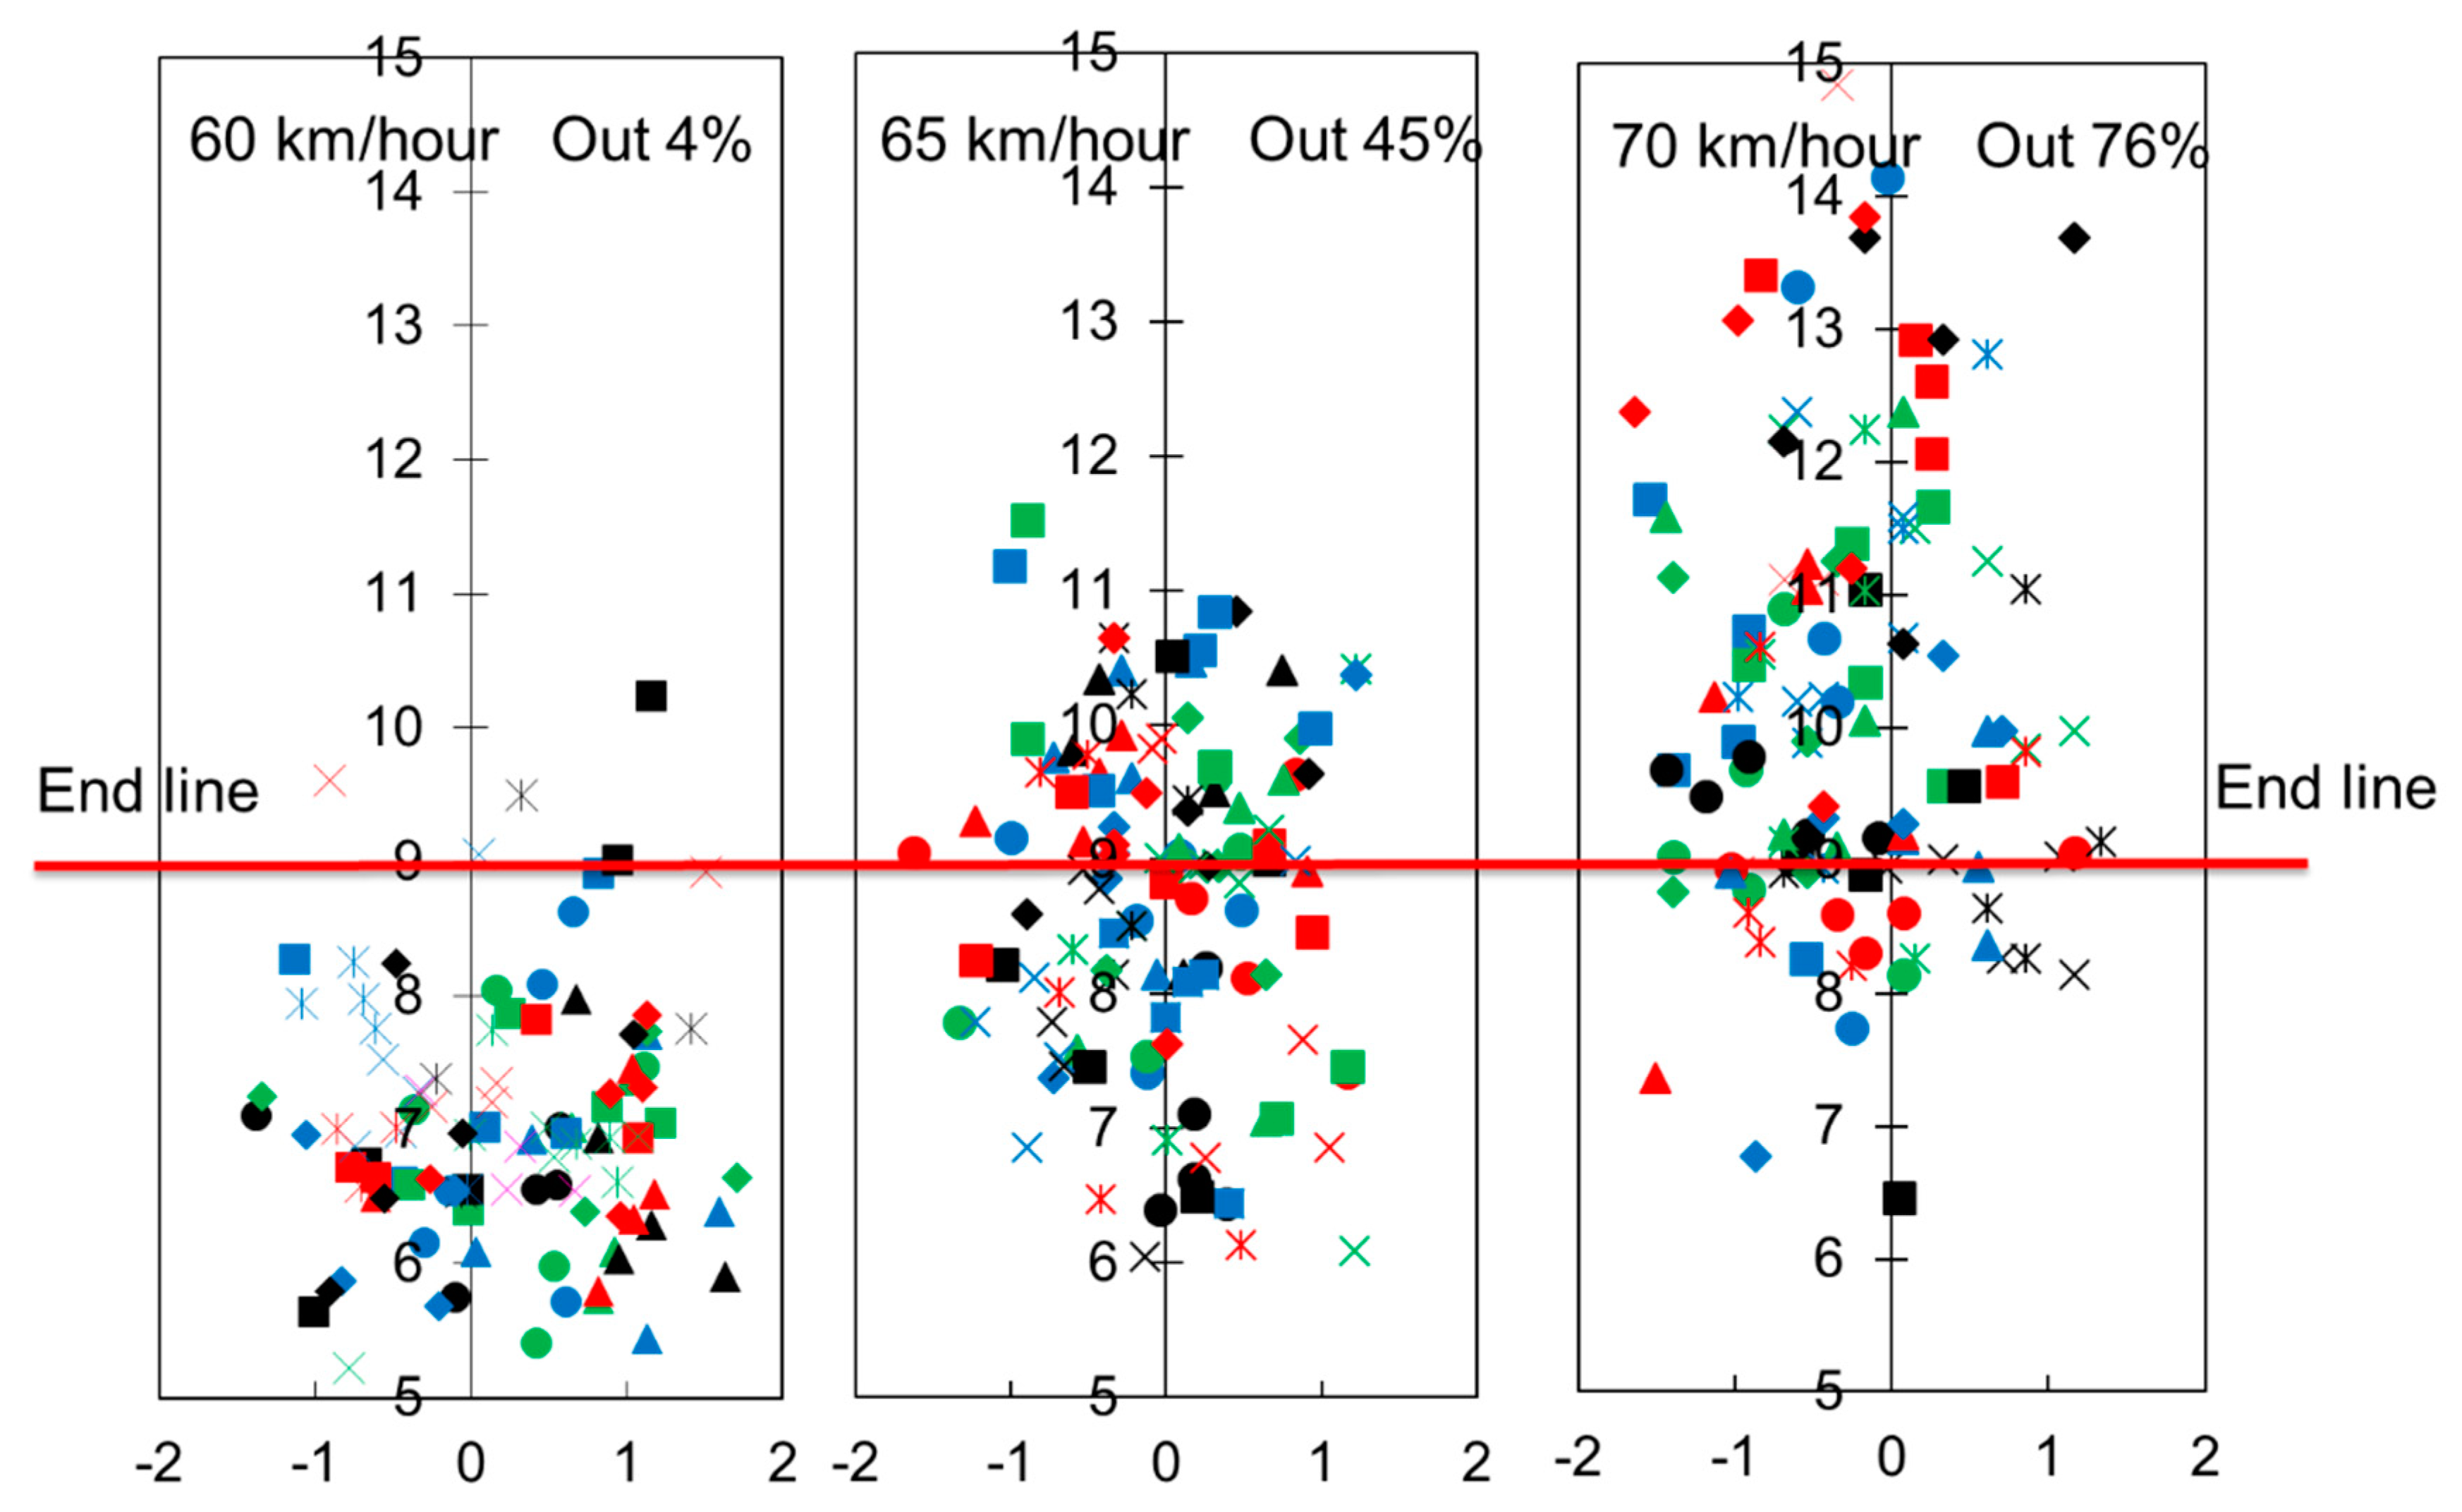
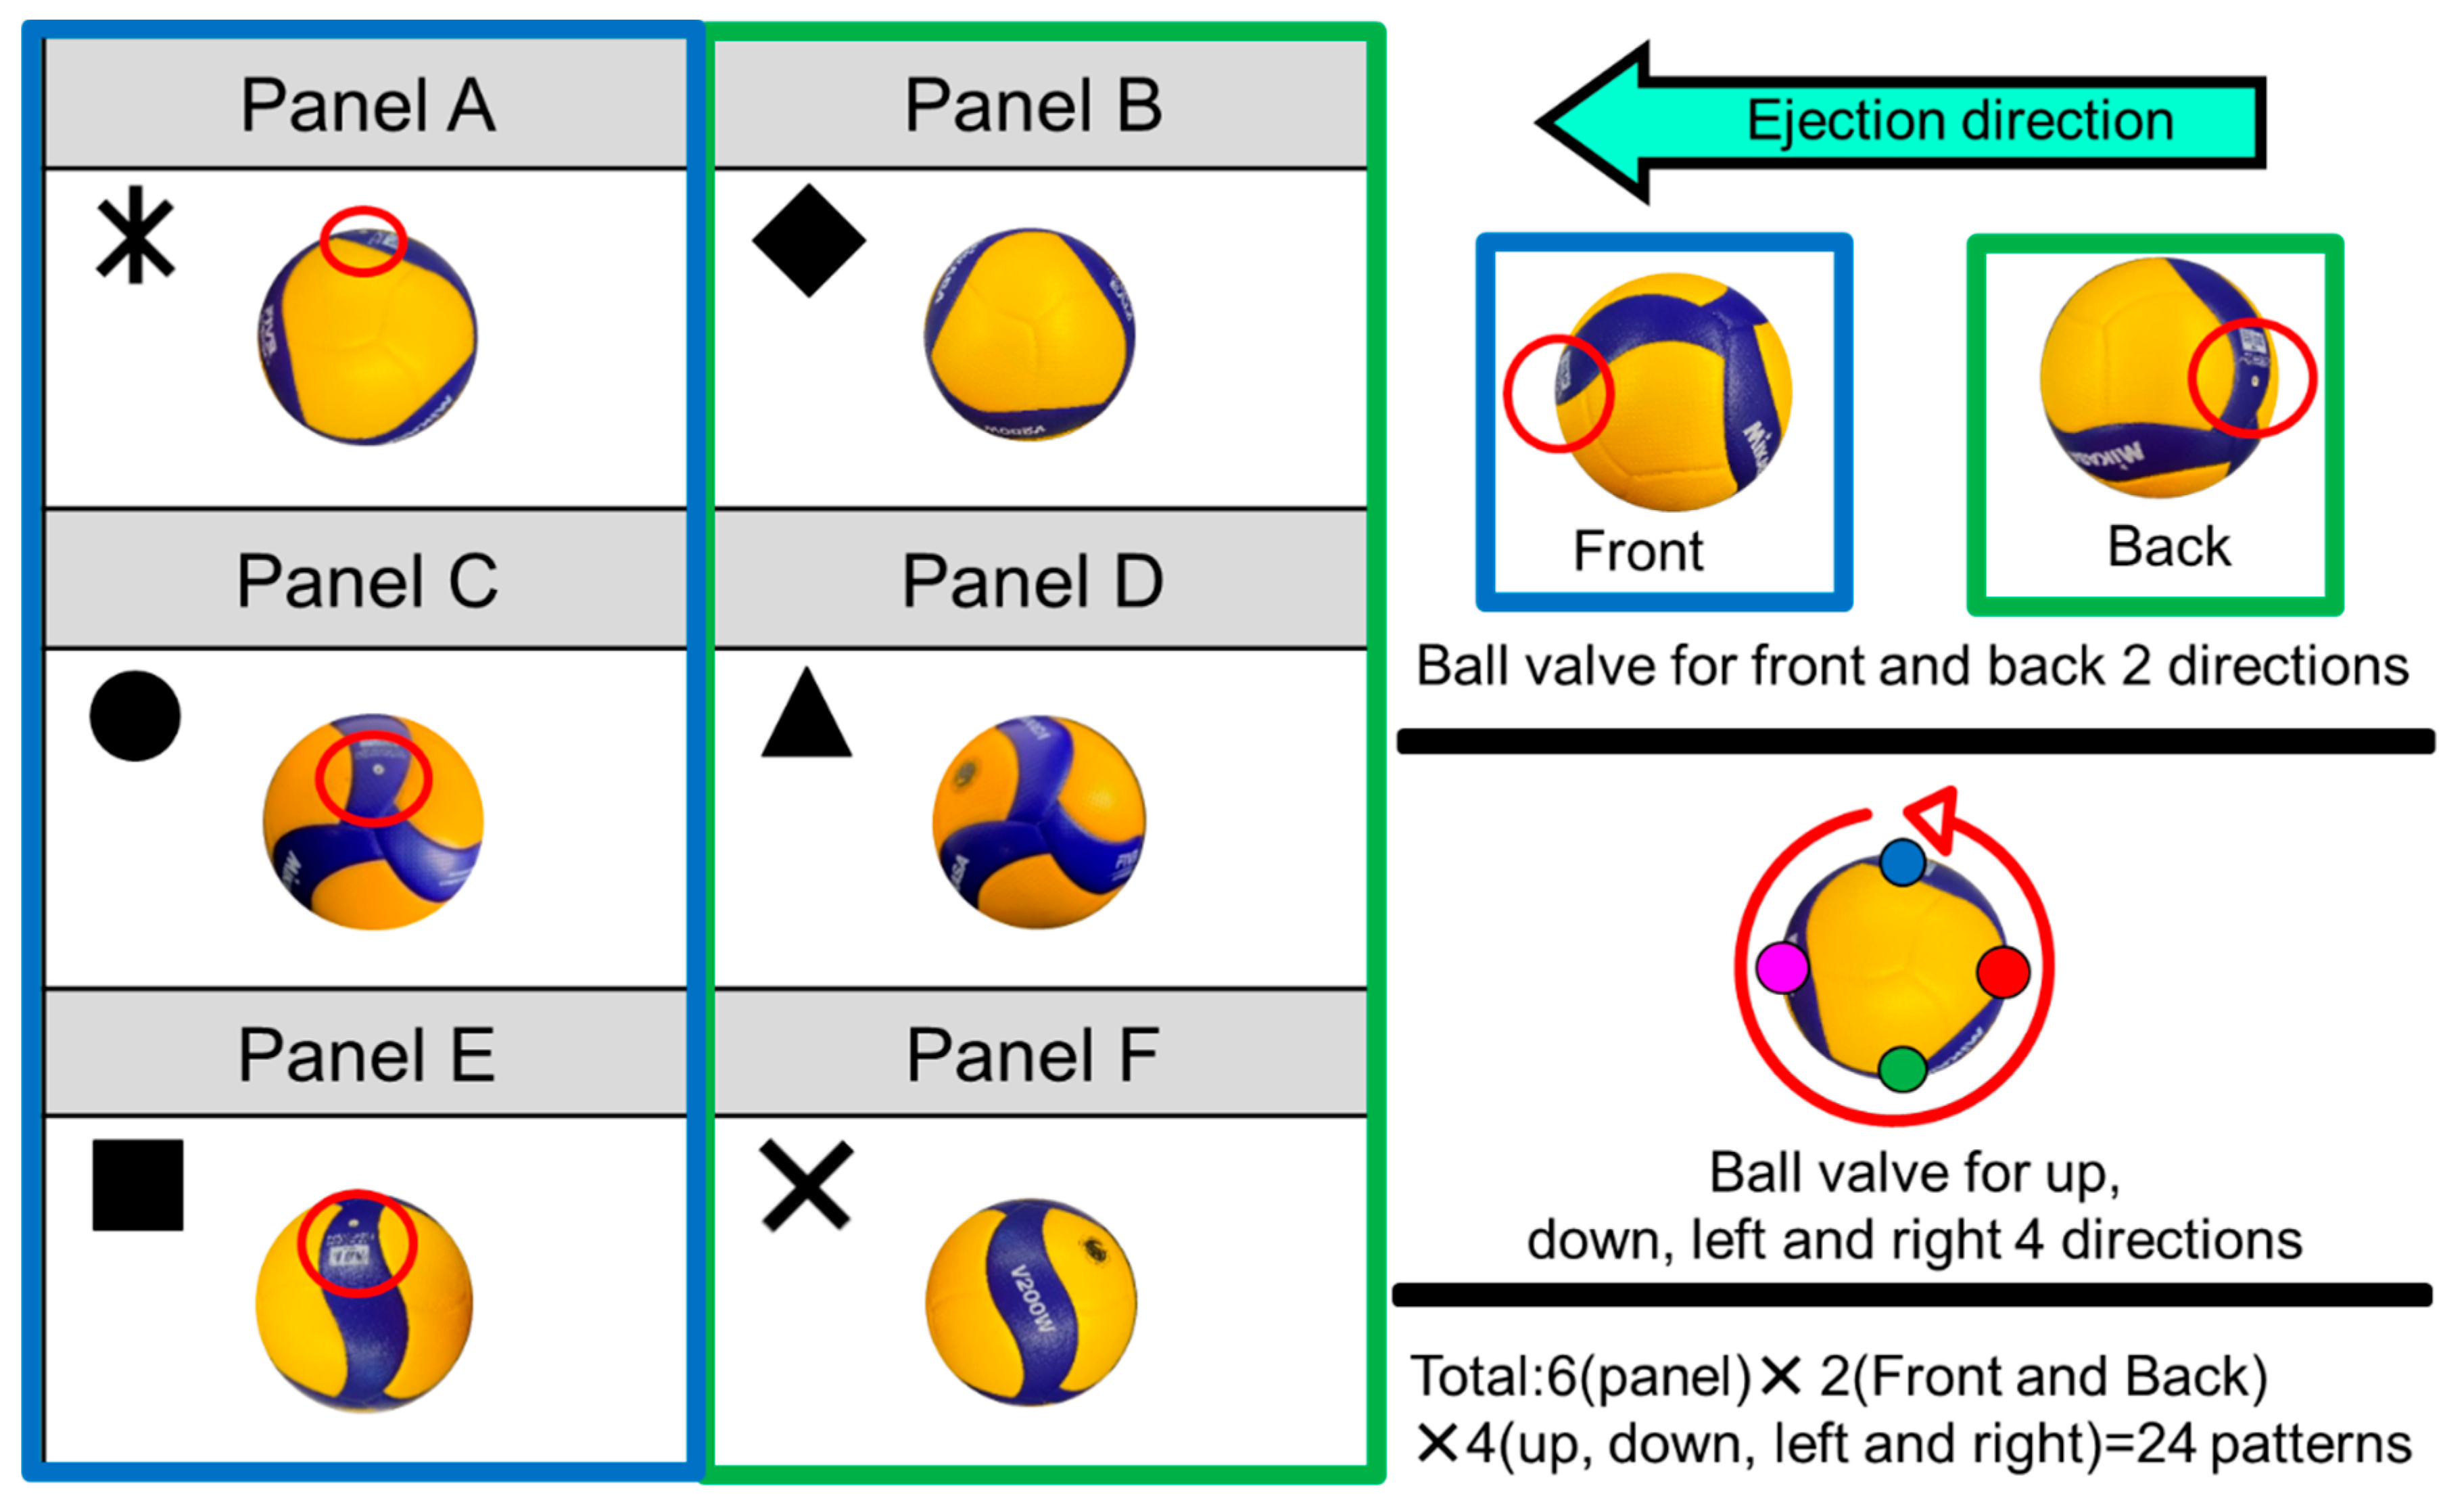
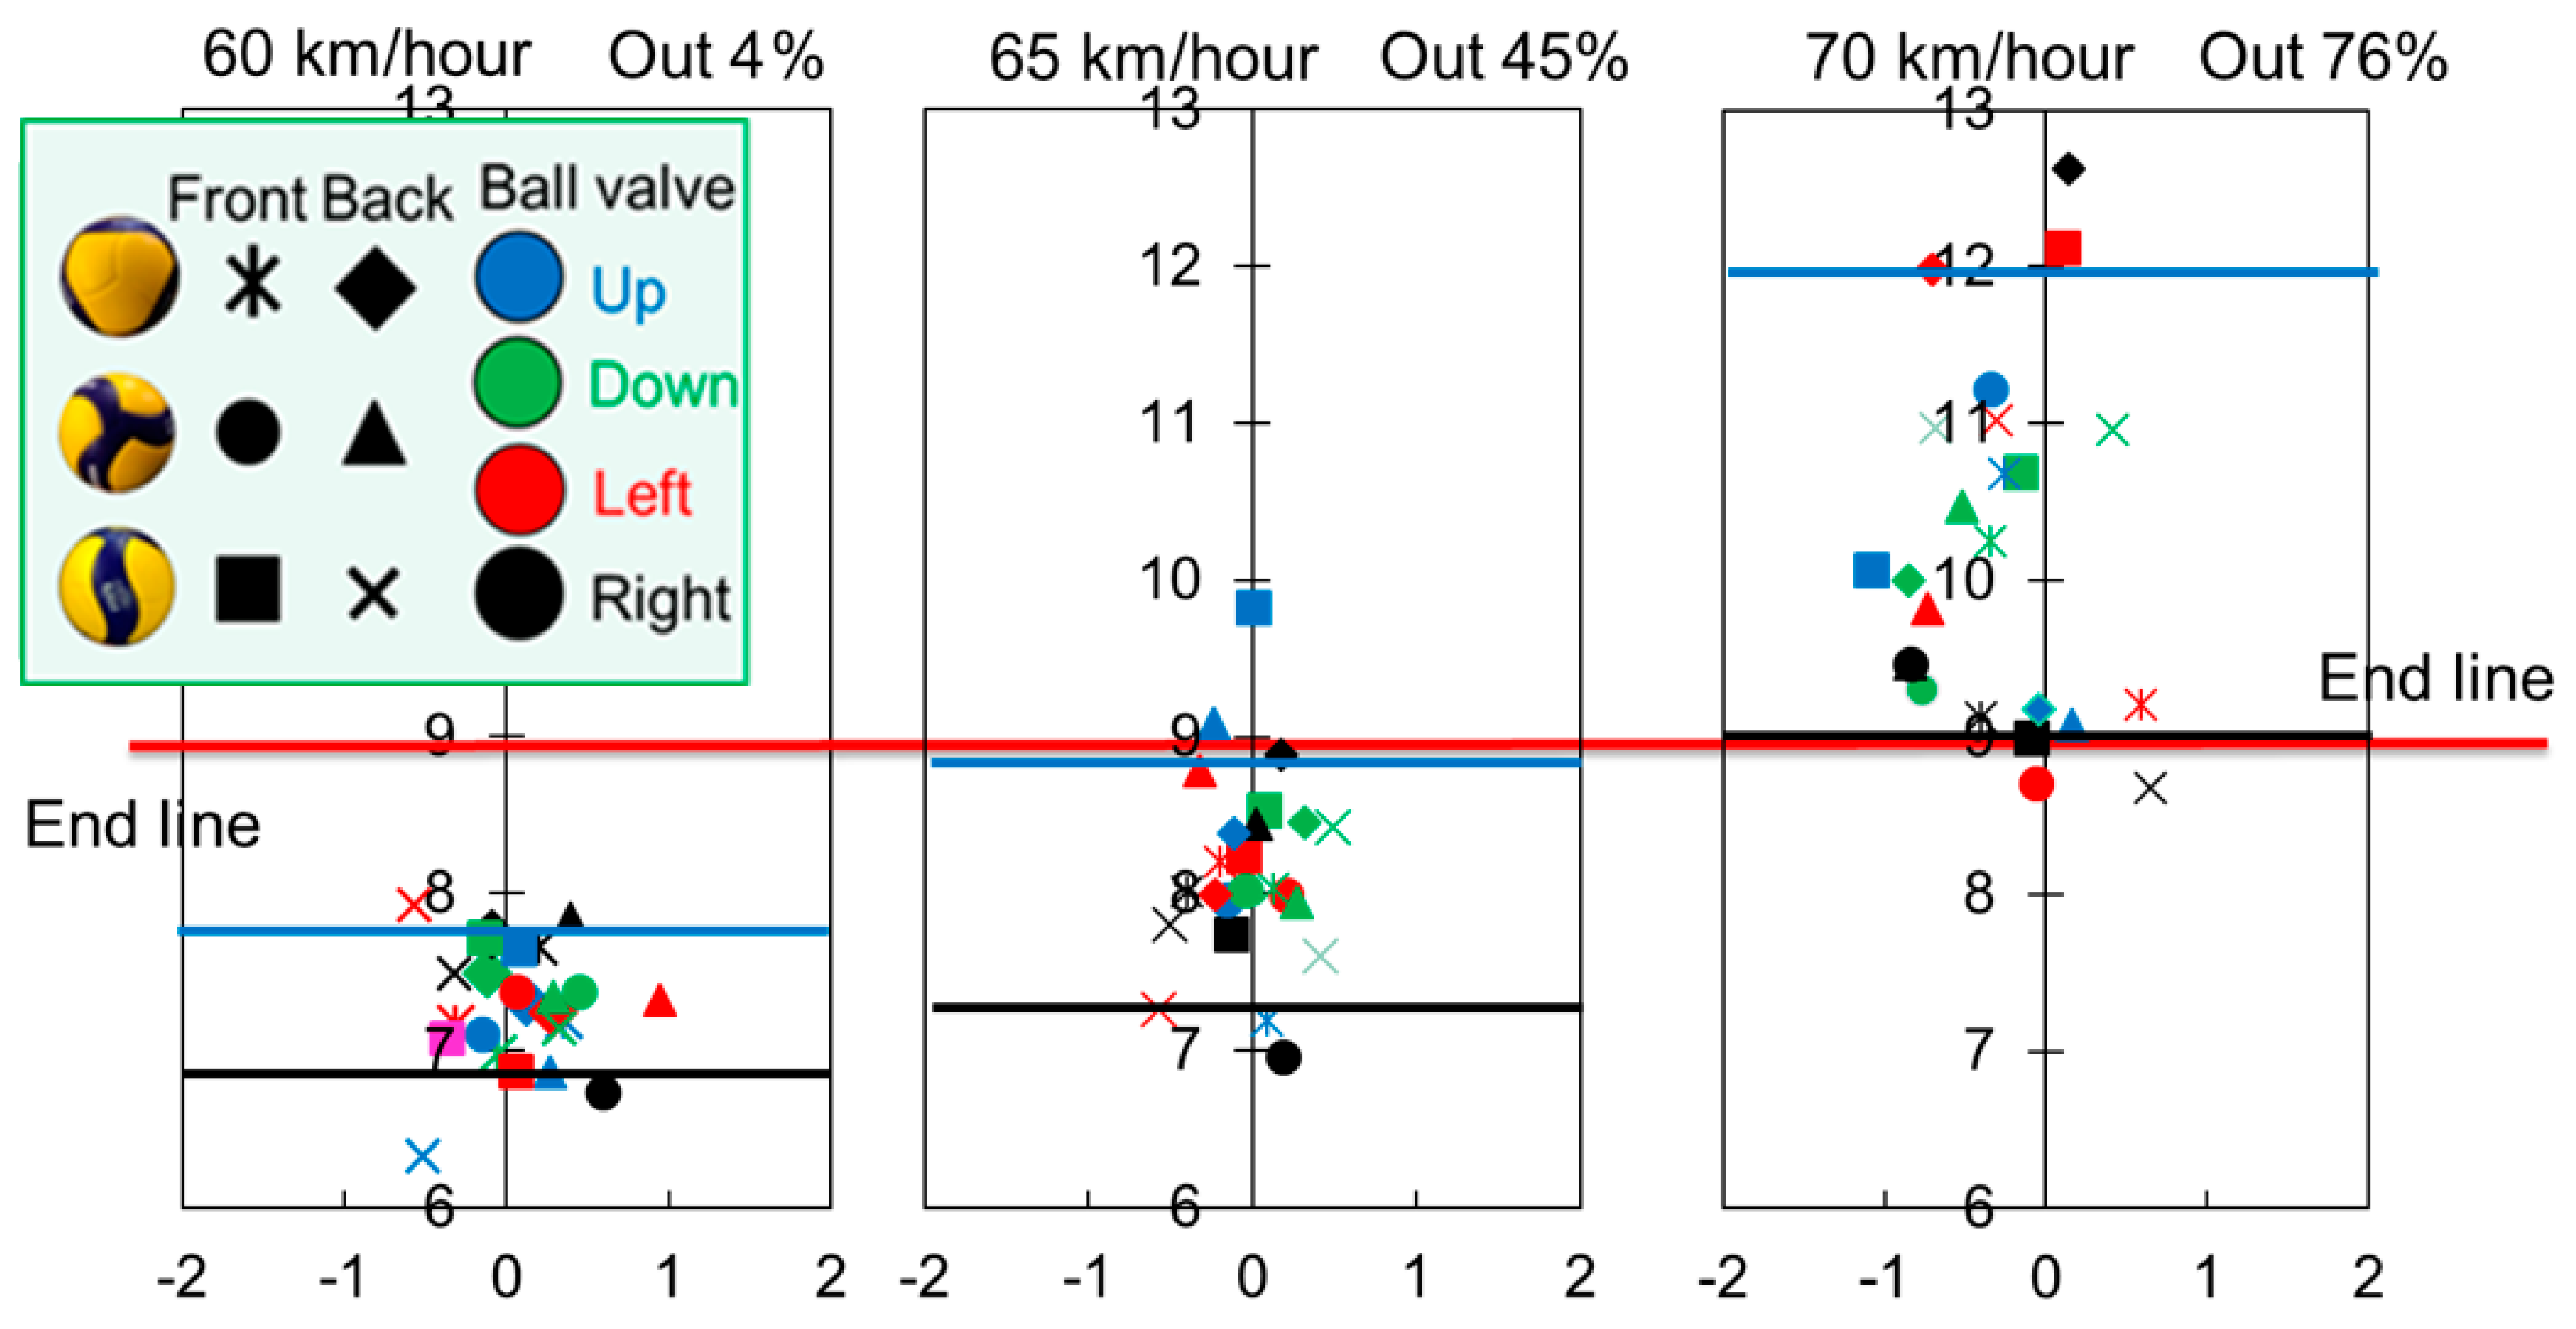
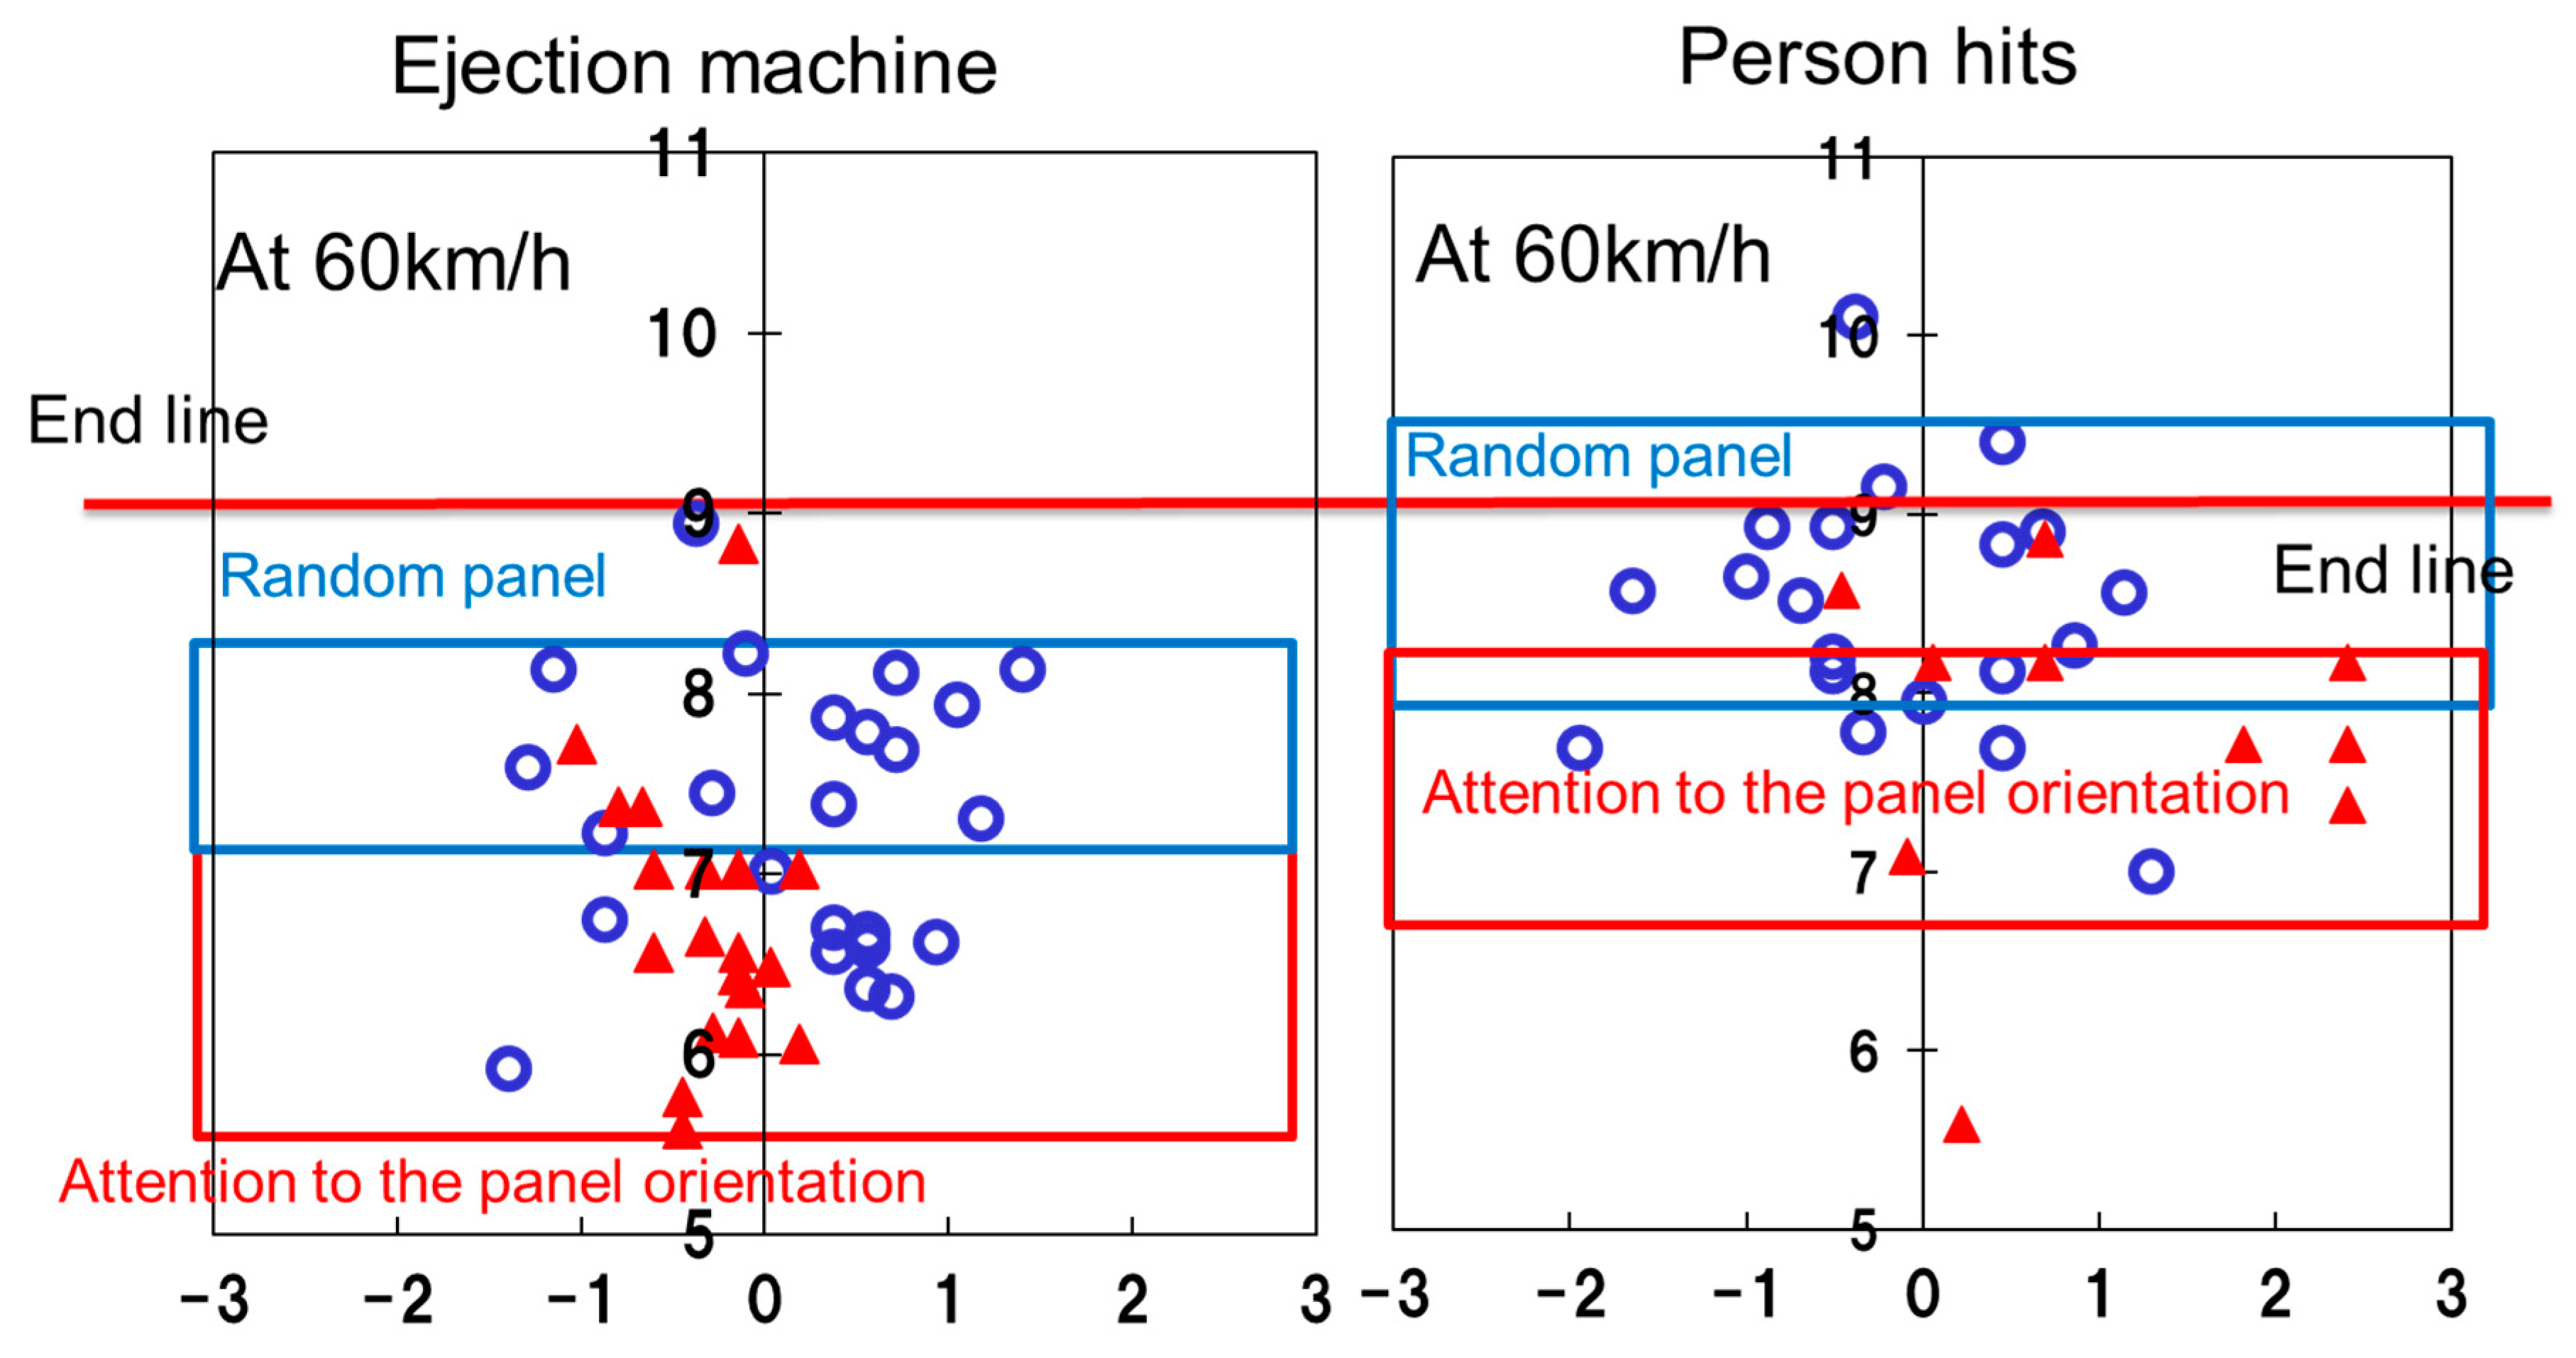
The effect of initial velocity was investigated for the V200W. Figure 12 shows the landing point of the V200W as the velocity changes. When ejected with an initial velocity of 60 km/h, the V200W landed on the court with a probability of 96%. As the initial speed is increased to 60 ± 1.5 km/h and 70 ± 1.5 km/h, the probability of landing on the court decreases to 65% and 24%, respectively. In case of the V200W serve with the hitting angle 5.5°, it is important to hit at 60 to 65 km/h while considering the panel. Details of the orientation of the surfaces represented by each marker are shown in Figure 13. Each figure shows the orientation of the ball panel as seen from the receiver’s side. Six different panel faces were defined, taking into account the front and back of the air valve placement. The position of the air valve can also be divided into four types in each panel: up, down, left and right; thus a total of 24 ejection patterns were performed. Figure 14 shows the average landing point for each panel. The graph for the initial speed of 65 km/h shows that the ball landed on the court in 22 different ball directions.
Figure 15 shows the difference between the case where the ball is ejected from the machine and the case where a person hits the ball. The triangle marks are the case of hitting the ball with panel C. The white marks are the case of hitting the ball randomly. The distance tends to be greater when the ball is hit by a person than when it is hit by a machine, but in both cases, the ball falls toward the front when it is hit with panel C facing it. Thus, with the floater serve, it is possible to control the falling position of the ball by hitting it while paying attention to the direction of the panel surface.

4. Conclusions

Drag force measurements using a wind tunnel and drop point measurements using an ejection machine were performed on three types of balls, MVA200, V200W, and FLISTATEC, to clarify the effects of ball type and panel surface orientation on the distance and variability of serve balls.
  • From the measurement of the drag coefficient in the wind tunnel, the velocity region where the drag crisis occurred shifted to the low Reynolds number side in the order of FLISTATEC, MVA200, and V200W. This trend was consistent with previous studies;
  • In the ejection experiment, the flight distance of the ball increased in the order of MVA200, V200W, and FLISTATEC. This trend was correlated with the magnitude of the drag coefficient measured in the wind tunnel. The magnitude of the drag force and the Reynolds number where the drag crisis occurs differ depending on the type of ball and orientation of the panel, and the flight distance also changes;
  • The variation in the drop point was different depending on the type of ball and panel. There was a possibility to suggest an appropriate receiver position from the distribution of the variation;
  • The same trend was obtained for the difference of distance between the ejection machine and human serve. In the case of human serve, the drop point could be controlled by paying attention to the direction of the panel.

Author Contributions

Conceptualization, S.I.; methodology, S.I.; validation, S.I. and M.H.; formal analysis, T.T. and M.H.; investigation, T.T.; resources, S.I. and M.H.; data curation, T.T.; writing—original draft preparation, T.T. and M.H.; writing—review and editing, M.H.; visualization, T.T. and M.H.; supervision, S.I. and M.H.; project administration, S.I. All authors have read and agreed to the published version of the manuscript.

Funding

This research received no external funding.

Informed Consent Statement

Not applicable.

Conflicts of Interest

The authors declare no conflict of interest.

References

  1. Zetou, E.; Tsigilis, N.; Moustakidis, A.; Komninakidou, A. Playing characteristics of men’s Olympic Volleyball teams in complex II. Int. J. Perform. Anal. Sport 2006, 6, 172–177. [Google Scholar] [CrossRef]
  2. Fernandez-Echeverria, C.; Gil, A.; Moreno, A.; Claver, F.; Moreno, M.P. Analysis of the variables that predict serve efficacy in young volleyball players. Int. J. Perform. Anal. Sport 2015, 15, 172–186. [Google Scholar] [CrossRef]
  3. Taneda, S. Visual observations of the flow past a sphere at Reynolds numbers between 104 and 106. J. Fluid Mech. 1978, 85, 187–192. [Google Scholar] [CrossRef]
  4. Hiratsuka, M.; Ito, S.; Miyasaka, K.; Konno, A. Stereo three-dimensional particle image velocimetry measurement and aerodynamic force analysis of non-spinning soccer balls. Proc. Inst. Mech. Eng. Part P J. Sports Eng. Technol. 2020, 234, 146–153. [Google Scholar] [CrossRef]
  5. Asai, T.; Ito, S.; Seo, K.; Hitotsubashi, A. Fundamental aerodynamics of a new volleyball. Sports Technol. 2010, 3, 235–239. [Google Scholar] [CrossRef] [Green Version]
  6. Asai, T.; Ito, S.; Seo, K.; Hitotsubashi, A. Aerodynamics of a new volleyball. Procedia Eng. 2010, 2, 2493–2498. [Google Scholar] [CrossRef] [Green Version]
  7. Hong, S.; Asai, T.; Weon, B.M. Surface Patterns for Drag Modification in Volleyballs. Appl. Sci. 2019, 9, 4007. [Google Scholar] [CrossRef] [Green Version]
  8. Coleman, S.; Benham, A.; Northcott, S. A three-dimensional cinematographical analysis of the volleyball spike. J. Sports Sci. 1993, 11, 295–302. [Google Scholar] [CrossRef]
  9. Jalilian, P.; Kreun, P.K.; Makhmalbaf, M.M.; Liou, W.W. Computational aerodynamics of baseball, soccer ball and volleyball. Am. J. Sports Sci. 2014, 2, 115–121. [Google Scholar] [CrossRef] [Green Version]
  10. Kao, S.S.; Sellens, R.W.; Stevenson, J.M. A Mathematical Model for the Trajectory of a Spiked Volleyball and its Coaching Application. J. Appl. Biomech. 1994, 10, 95–109. [Google Scholar] [CrossRef]
  11. Hong, S.; Ozaki, H.; Watanabe, K.; Asai, T. Aerodynamic Characteristics of New Volleyball for the 2020 Tokyo Olympics. Appl. Sci. 2020, 10, 3256. [Google Scholar] [CrossRef]
  12. Cho, A. ENGINEERING OF SPORT MEETING: In Volleyball, Crafty Players Serve Up an Aerodynamic Crisis. Science 2004, 306, 42a. [Google Scholar] [CrossRef]
  13. Frohlich, C. Aerodynamic drag crisis and its possible effect on the flight of baseballs. Am. J. Phys. 1984, 52, 325–334. [Google Scholar] [CrossRef]
  14. Asai, T.; Akatsuka, T.; Haake, S. The physics of football. Phys. World 1998, 11, 25–28. [Google Scholar] [CrossRef]
  15. Naito, K.; Hong, S.; Koido, M.; Nakayama, M.; Sakamoto, K.; Asai, T. Effect of seam characteristics on critical Reynolds number in footballs. Mech. Eng. J. 2018, 5, 17-00369. [Google Scholar] [CrossRef] [Green Version]
  16. Hong, S.; Asai, T. Effect of panel shape of soccer ball on its flight characteristics. Sci. Rep. 2014, 4, 5068. [Google Scholar] [CrossRef] [PubMed]
  17. Hong, S.; Asai, T.; Seo, K. Visualization of air flow around soccer ball using a particle image velocimetry. Sci. Rep. 2015, 5, 15108. [Google Scholar] [CrossRef] [PubMed] [Green Version]
  18. Goff, J.E.; Hong, S.; Asai, T. Effect of a soccer ball’s seam geometry on its aerodynamics and trajectory. Proc. Inst. Mech. Eng. Part P J. Sports Eng. Technol. 2019, 234, 19–29. [Google Scholar] [CrossRef]
  19. Goff, J.E.; Hong, S.; Asai, T. Aerodynamic and surface comparisons between Telstar 18 and Brazuca. Proc. Inst. Mech. Eng. Part P J. Sports Eng. Technol. 2018, 232, 342–348. [Google Scholar] [CrossRef]
  20. Goff, J.E.; Asai, T.; Hong, S. A comparison of Jabulani and Brazuca non-spin aerodynamics. Proc. Inst. Mech. Eng. Part P J. Sports Eng. Technol. 2014, 228, 188–194. [Google Scholar] [CrossRef] [Green Version]
  21. Goff, J.E.; Hobson, C.M.; Asai, T.; Hong, S. Wind-tunnel Experiments and Trajectory Analyses for Five Nonspinning Soccer Balls. Procedia Eng. 2016, 147, 32–37. [Google Scholar] [CrossRef] [Green Version]
  22. Passmore, M.; Rogers, D.; Tuplin, S.; Harland, A.; Lucas, T.; Holmes, C. The aerodynamic performance of a range of FIFA-approved footballs. Proc. Inst. Mech. Eng. Part P J. Sports Eng. Technol. 2012, 226, 61–70. [Google Scholar] [CrossRef] [Green Version]
  23. Aoki, K.; Muto, K.; Okanaga, H. Aerodynamic characteristics and flow pattern of a golf ball with rotation. Procedia Eng. 2010, 2, 2431–2436. [Google Scholar] [CrossRef] [Green Version]
  24. Djamovski, V.; Rosette, P.; Chowdhury, H.; Alam, F.; Steiner, T. A comparative study of rugby ball aerodynamics. Procedia Eng. 2012, 34, 74–79. [Google Scholar] [CrossRef] [Green Version]
  25. Price, D.S.; Jones, R.; Harland, A.R. Computational modelling of manually stitched soccer balls. Proc. Inst. Mech. Eng. Part L J. Mater. Des. Appl. 2006, 220, 259–268. [Google Scholar] [CrossRef]
  26. Sakamoto, Y.; Hiratsuka, M.; Ito, S. Effect of Soccer Ball Panels on Aerodynamic Characteristics and Flow in Drag Crisis. Appl. Sci. 2020, 11, 296. [Google Scholar] [CrossRef]
  27. Alam, F.; Chowdhury, H.; Stemmer, M.; Wang, Z.; Yang, J. Effects of surface structure on soccer ball aerodynamics. Procedia Eng. 2012, 34, 146–151. [Google Scholar] [CrossRef] [Green Version]
Figure 1. Three types of balls in the measurement.
Applsci 11 09269 g001
Figure 2. Appearance of cobra-type ball support.
Applsci 11 09269 g002
Figure 3. Outline of ejection experiment.
Applsci 11 09269 g003
Figure 4. Ejection procedure.
Applsci 11 09269 g004
Figure 5. Relationship between Reynolds number and drag coefficient on MVA200.
Applsci 11 09269 g005
Figure 6. Relationship between Reynolds number and drag coefficient on V200W.
Applsci 11 09269 g006
Figure 7. Relationship between Reynolds number and drag coefficient on FLISTATEC.
Applsci 11 09269 g007
Figure 8. Relationship between Reynolds number and averaged drag coefficient on each ball.
Applsci 11 09269 g008
Figure 9. Landing point of MVA200, V200W, and FLISTATE C that changes the orientation of the panel and eject at the initial speed of 60 km/h. The different types of plots represent differences in the orientation of the panels, the logos, and the positions of the valves.
Applsci 11 09269 g009
Figure 10. Standard deviation of the drop position by the panel in the x and y directions.
Applsci 11 09269 g010
Figure 11. Ideal receiver position and standard deviation.
Applsci 11 09269 g011
Figure 12. Landing points by different ejection speed on V200W with different panel orientation.
Applsci 11 09269 g012
Figure 13. Relationship between ball orientation and ball valve at the time of ejection.
Applsci 11 09269 g013
Figure 14. Average landing point for each panel in Figure 10.
Applsci 11 09269 g014
Figure 15. Difference in the drop position of the ball between the ejection machine and a human hitter. The triangles represent the case of serving with panel C facing, and the white circles represent the case of serving with a random panel orientation.
Applsci 11 09269 g015
Publisher’s Note: MDPI stays neutral with regard to jurisdictional claims in published maps and institutional affiliations.