Abstract
In the present study, new magnetic nanocomposites were successfully prepared by combustion method, characterized by X-ray diffraction, Fourier transform infrared spectroscopy, magnetic measurements, N2 adsorption–desorption thermal analysis, and scanning electron microscopy, and tested as adsorbents for the removal of anionic dyes (Acid Yellow 42 and Acid Red 213) from aqueous solutions. The influence of process variables solution pH, adsorbent dose, initial dye concentration and temperature on the adsorption was evaluated. The best kinetic model that fitted with experimental data was a pseudo-second order model, and the equilibrium data were correlated by Langmuir isotherm model for the investigated dyes. Maximum removal efficiencies of 98.54% and 97.58% was obtained for Acid Yellow 42 and Acid Red 213, respectively, indicating the superior adsorption capacity of the new synthesized magnetic nanocomposites. The thermodynamic parameters indicated the spontaneous and endothermic nature of the adsorption process.
1. Introduction
The intense industrialization of recent years has led to an increase in water pollution, making it one of the main environmental problems. Numerous industries, such as textiles, leather, paper, cosmetics, and food, are the main generators of huge amounts of water contaminated with dyes [1,2]. Their uncontrolled discharge into the aquatic environment, without prior treatment, has a strong negative impact on the ecosystem [3]. In addition to the unsightly appearance, the presence of dyes in the water reduces the penetration of light, which affects the photosynthetic activities of the aquatic flora; the amount of dissolved oxygen is also low, thus affecting the aquatic ecosystem [4,5].
The complex chemical structure of the dyes makes them resistant to biodegradation, light, heat and oxidizing agents, enabling their high persistence in the environment [6,7,8,9]. The presence of dyes in water has a negative impact not only on the environment, but also on human health, due to their toxic, mutagenic and carcinogenic properties [1,10,11,12]. These are a few of the factors that indicate the importance of treating these contaminated waters using the most effective methods.
In order to reduce the pollution of contaminated waters with dye content, several physical, chemical and biological methods of water treatment have been investigated, including adsorption [13,14,15,16], advanced oxidation [17], photocatalysis [18], filtration [19], catalytic degradation [20], coagulation/flocculation [21], reverse osmosis [22] and biodegradation [23]. The approaches have had different success rates. The chemical methods applied for dye removal from wastewater have some disadvantages, such as the high cost of large-scale application, the incomplete mineralization of the organic compound, and the production of toxic by-products [13,24]. In the case of biological methods, the disadvantages include the low efficiency in removing certain dyes with stable molecular structures, the appearance of sludge, and the production of harmful secondary compounds [13,25]. Among all the decontamination methods, physical adsorption proves to be unique in removing dyes from contaminated wastewater, because it consists of a simple operation process, has a high selectivity for contaminants, results in the low production of non-toxic by-products, and has low operating costs and high efficiency.
Various materials, such as activated carbon [26], zeolites [27], mesoporous silica [28], metal organic frameworks (MOF) [29], polymers [30], and by-products of agriculture [31], have been investigated as potential adsorbents for wastewater treatment. Among these materials, activated carbon (AC) has shown good adsorption performance for a wide range of pollutants, due to its porous structure and large specific surface area. However, powder-activated carbon has a major drawback: the difficulty of separating it from aqueous solutions. To overcome this problem, activated carbon-based magnetic composite powders have attracted much interest. In the recent years, magnetic nanocomposites have been proven to be highly efficient in removing dyes from wastewater because they are easy to control and can be very quickly separated from solution by applying an external magnetic field [32,33,34,35].
Different synthesis methods have been used for the preparation of magnetic nanocomposites, including sol-gel [36], solvothermal [37], hydrothermal [38], pyrolysis of organometallic compounds [39], co-precipitation [40], and the combustion method [41]. Most of these methods have disadvantages as they involve several steps in the synthesis process, the reaction is difficult to control, and they involve long reaction times and toxic raw materials. On the other hand, the combustion method used in this study has proven to be a versatile, simple and safe method. Combustion synthesis is a quick and easy process that requires simple equipment, thus it can save time and energy. At the same time, the combustion method allows the efficient synthesis of a variety of nanomaterials with high yields and high surface areas [42,43].
The aim of this study is the synthesis of a new material, which combines the adsorbent properties of activated carbon with the magnetic ones of iron oxides. This new material was further tested as an adsorbent for anionic dyes. The synthesized adsorbents were characterized in terms of structural, morphological and magnetic properties. In the adsorption studies, the effects of the experimental parameters solution pH, adsorbent dose, temperature and initial dye concentration were evaluated. Kinetics, equilibrium and thermodynamic studies were carried out in order to describe the adsorption process.
2. Materials and Methods
2.1. Materials
Iron(III) nitrate nonahydrate Fe(NO3)·9H2O from Sigma Aldrich (>98%), L-arginine C6H14N4O2 from Merck (>99%), and activated carbon with different specific surface areas (AC (1000, 1300, 1700 m2/g)) from Roth were used for the synthesis of magnetite/carbon nanocomposites.
2.2. Synthesis of Magnetic Nanocomposites
The synthesis of magnetic nanocomposites was performed by an improved combustion technique, as previously described [42,43]. In this case, iron nitrate was used as an oxidizing agent and L-arginine was used as a reducing agent or fuel (Equation (1)). The recipe was calculated in order to obtain 10 g of composite material (PM), in which the magnetite:carbon mass ratio was 1:4.
102 Fe(NO3)3 + 46 C6H14N4O2 = 34 Fe3O4 + 276 CO2 + 322 H2O + 245 N2
The influence of the specific surface area of activated carbon on the nanocomposite performance was investigated. Additionally, the effect of the thermal treatment time span on the PM properties was observed. The working conditions used in the synthesis of PM are presented in Table 1.

Table 1.
Conditions for the synthesis of magnetic nanocomposites.
Iron nitrate and L-arginine were mixed with different types of activated carbon (with specific surface areas ranging between 1000, 1300 and 1700 m2/g) in a round bottom flask, in the quantities specified in Table 1. The soluble raw materials were dissolved in 20 mL of distilled water. Afterwards, the flask was placed in a heating mantle preheated at 400 °C to ignite the combustion reaction, in the absence of air. In order to prevent air from getting inside the flask during the combustion reaction, the flask containing the reactant mixture was closed with a glass tap. The gases generated during the combustion reaction create positive pressure, so that air cannot enter the flask. During the combustion reaction, the tap was set to the open position to allow the combustion gases to exit the flask. At the end of the combustion process the tap was set to the closed position and the flask was removed from the heating mantle. The same experimental procedure was used for all samples. The sample was kept in the heating mantle for 90 min in the case of samples PM1-PM3 and 60 min in the case of sample PM4.
The obtained samples were washed with distilled water, dried at 80 °C, and ground. The final material was in all cases a black magnetic powder.
2.3. Characterization Methods
The phase composition of the powders was determined by X-ray diffraction (XRD), using a Rigaku Ultima IV instrument. X-ray diffraction patterns were recorded using CuKα radiation.
The functional surface groups were evidenced using Fourier transform infrared (FT-IR) spectroscopy. Infrared spectra were recorded on the Shimadzu IR Prestige-21, using the potassium bromide pellet method, in the range of 400 to 4000 cm−1.
The behaviors in the external magnetic field of the obtained nanocomposites were studied in low-frequency (50 Hz) AC applied magnetic fields, using a laboratory-manufactured induction hysteresigraph installation equipped with a data acquisition system [44].
The porous structure characteristics of the investigated samples were determined from the nitrogen adsorption–desorption isotherms. The N2 adsorption–desorption isotherms were recorded at 77K using a QUANTACHROME Nova 1200e device. The samples were degassed at 110 °C for 15 h. The specific surface areas were determined using the Brunauer–Emmett–Teller (BET) method and the pore size distributions were derived with the Barrett–Joyner–Halenda (BJH) method from the desorption curves.
The thermal behavior of the samples was studied in the range 25–1000 °C by thermal analysis, using a Netzsch Sta 449C device. To record The TG and DSC curves, the sample was placed in a platinum crucible and heated in an atmosphere of air with a heating rate of 10 °C/min.
Scanning electron microscopy (SEM) was used to investigate the morphology of the magnetic nanocomposites by using an Inspect-S scanning electron microscope.
2.4. Adsorption Experiments
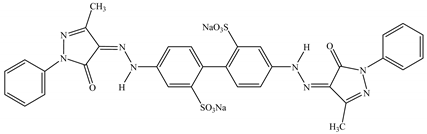
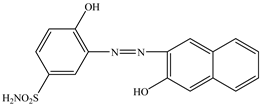
Two anionic industrial dyes, Acid Yellow 42 (AY 42; C32H24N8Na2O8S2) and Acid Red 213 (AR 213; C16H13N3O4S), obtained from Colorom Codlea, were used as adsorbates for the adsorption studies. Dye solutions at different concentrations were obtained by dilution with distilled water from a stock solution (450 g/L). The pH value of the dye solutions was adjusted using HCl or NaOH solutions (0.1 mol/L).
For the adsorption experiments, 20 mg of the PM (adsorbent) was dispersed in 20 mL of dye solution. The adsorption process was carried out in Erlenmeyer glasses, using a thermostat shaker with a constant stirring speed of 200 rpm for 240 min at 25 °C. After adsorption, the concentration of the dye solution was spectrophotometrically determined, and the absorbance at λmax (the wavelength of the maximum value of absorbance) specific to each dye (409.0 nm for AY 42 and 544.5 nm for AR 213) was recorded. The adsorption capacity (qt) and percentage of dye removal (R) were calculated using Equations (2) and (3), respectively.
where C0, Ct, and Ce are the concentrations of the dye solution at the initial time, at different periods of time, and at the equilibrium (mg/L), respectively; V is the volume of solution (L), and W is the mass of adsorbent (g).
3. Results and Discussion
3.1. Structural Characterization of the Magnetic Nanocomposites
3.1.1. X-ray Diffraction (XRD)
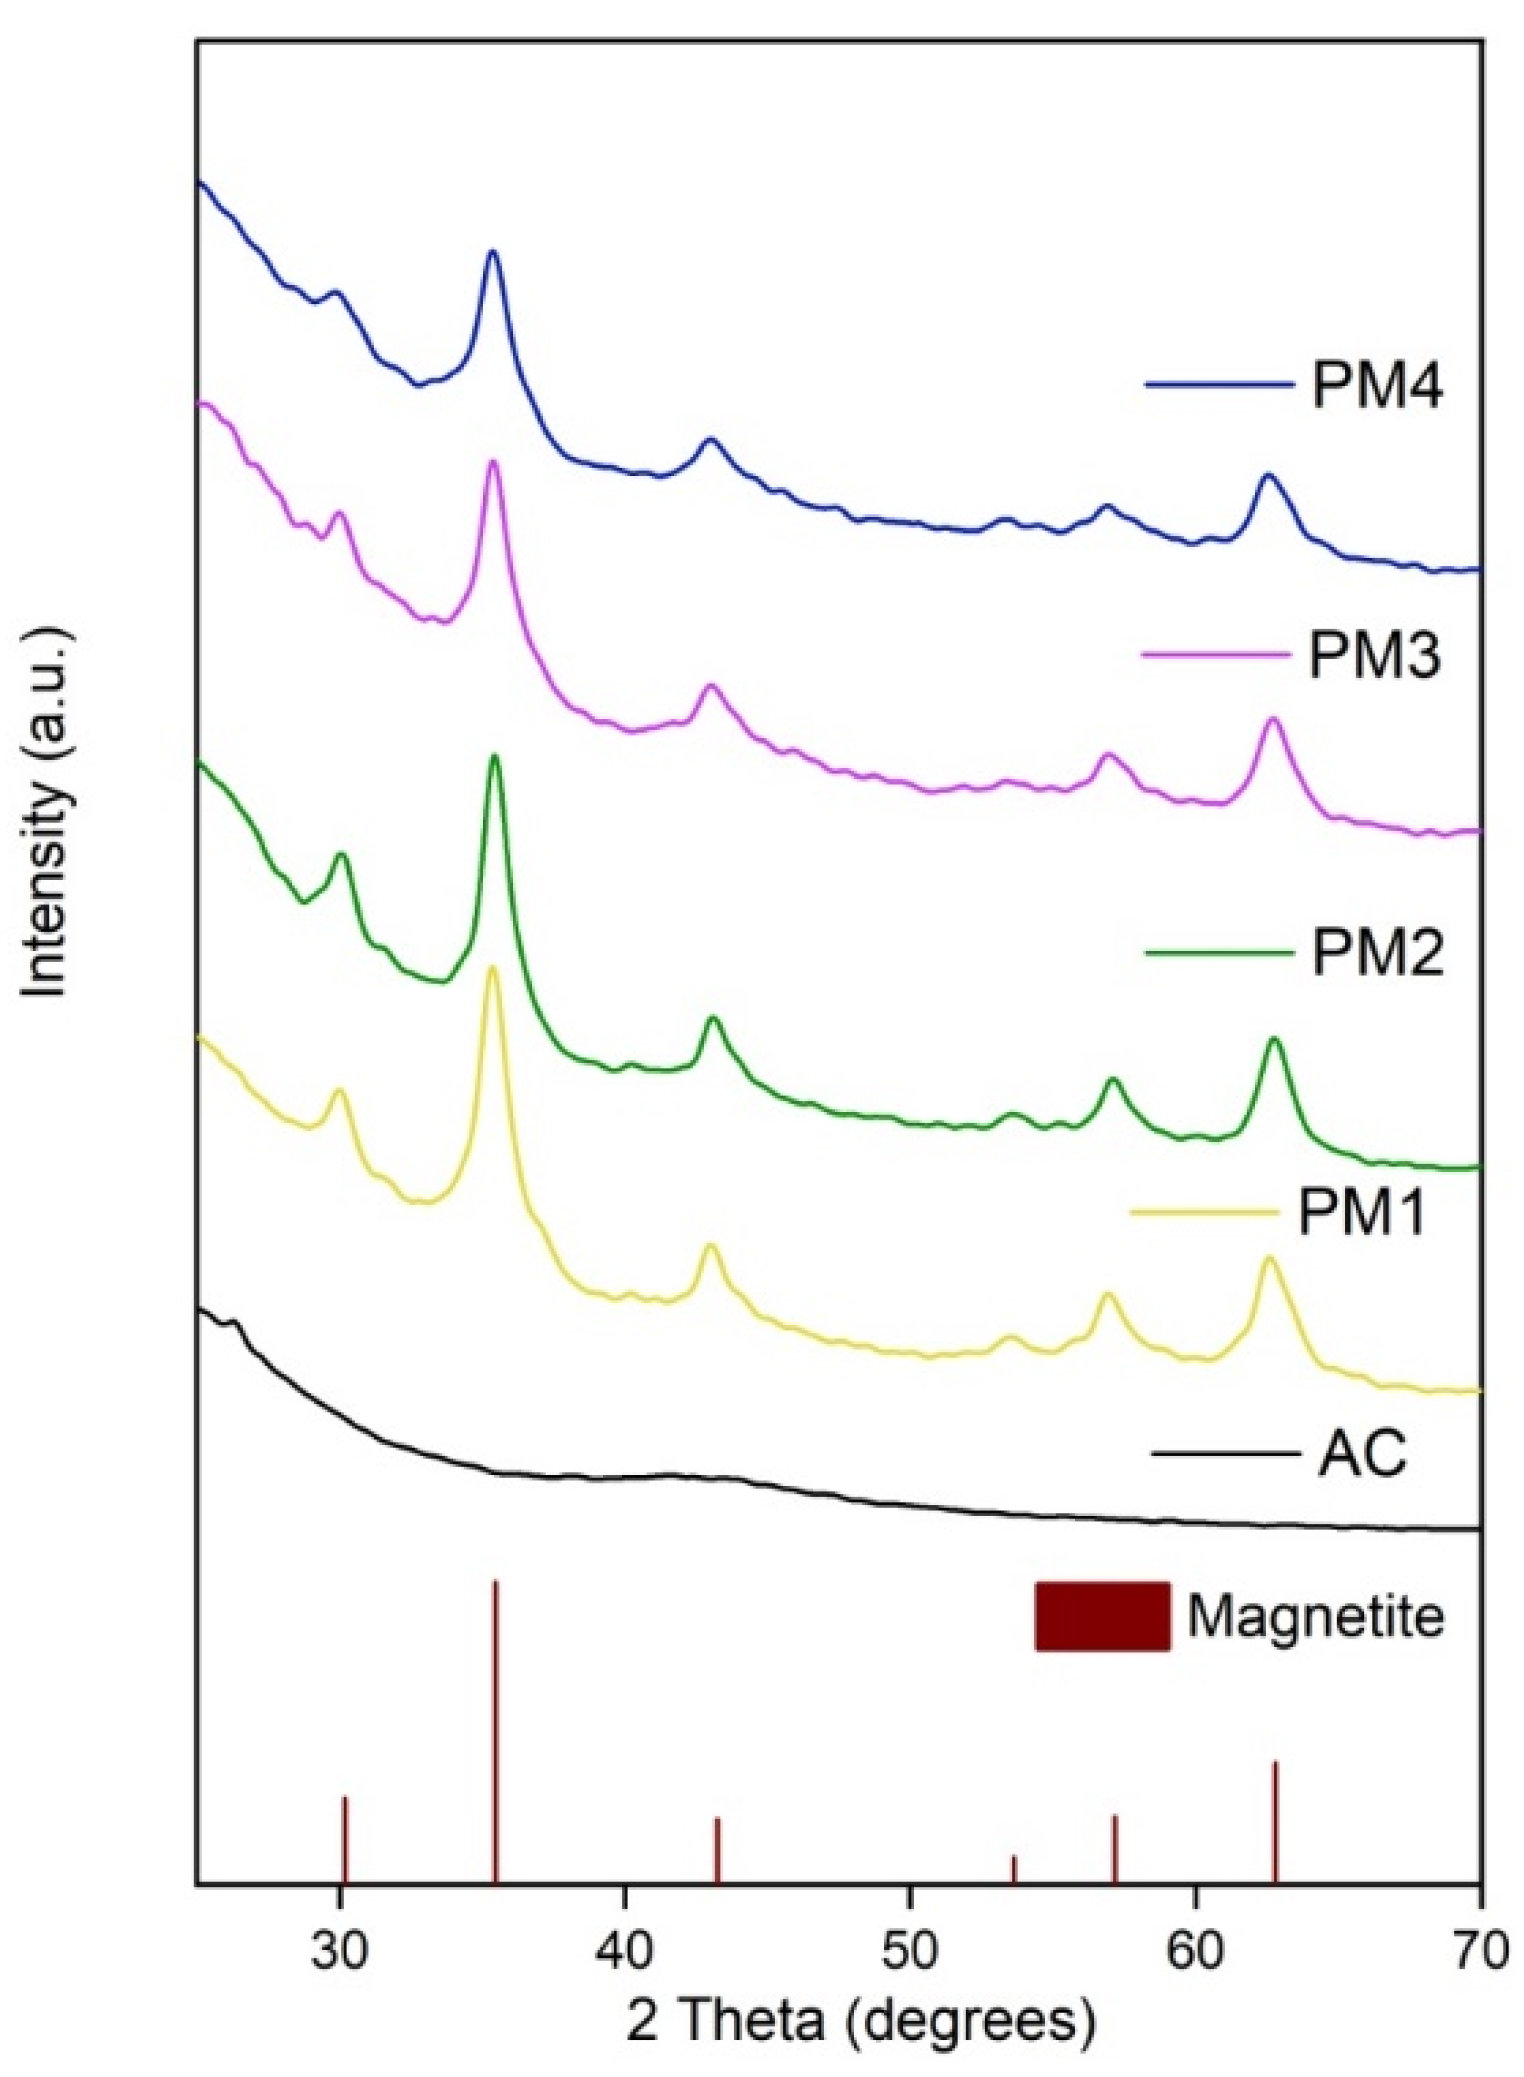
X-ray diffraction analysis was applied to determine the crystalline structure of the synthesized magnetic nanocomposites. Figure 1 illustrates the XRD pattern of the PM1, PM2, PM3 and PM4 samples compared to activated carbon.

Figure 1.
X-ray diffraction pattern of activated carbon and magnetic nanocomposites.
Figure 1 indicates that AC exhibits a very broad diffraction peak characteristic for an amorphous structure, which is in accordance with the previous studies that documented the diffraction pattern of AC [45]. The synthesized PM presented several diffraction peaks that were assigned to magnetite (Fe3O4), according to JCPDS sheet no. 190629. The well-evidenced diffraction peaks were located at 30.10, 35.42, 43.05, 53.39, 56.94 and 62.52 degrees on the 2 theta axis, corresponding to magnetite diffraction planes (220), (311), (400), (422), (511) and (440). Based on the XRD analysis, one can conclude that magnetic nanocomposites prepared by combustion synthesis consist of nanocrystalline magnetite incorporated/mixed in an amorphous matrix of activated carbon, which is in total agreement with previous studies carried out on similar themes [45,46].
The crystallite size of magnetite was determined according to the Debye–Scherrer equation (Equation (4)), using the most intense diffraction peak [47]. The obtained crystallite sizes were 6.9 nm for the PM1 sample, 7.1 nm for the PM2 sample, 6.4 nm for the PM3 sample, and 6.2 nm for the PM4 sample, which indicate that in this case, the surface area of the activated carbon and the thermal treatment time span had no influence on the magnetite crystallite size.
where D is the crystallite size, λ is the X-ray wavelength, β is the full width at half maximum (FWHM) and θ is the Bragg angle for the diffraction peak.
D = (0.9∙λ)/(β∙cos θ)
3.1.2. Fourier Transform Infrared (FT-IR) Spectroscopy
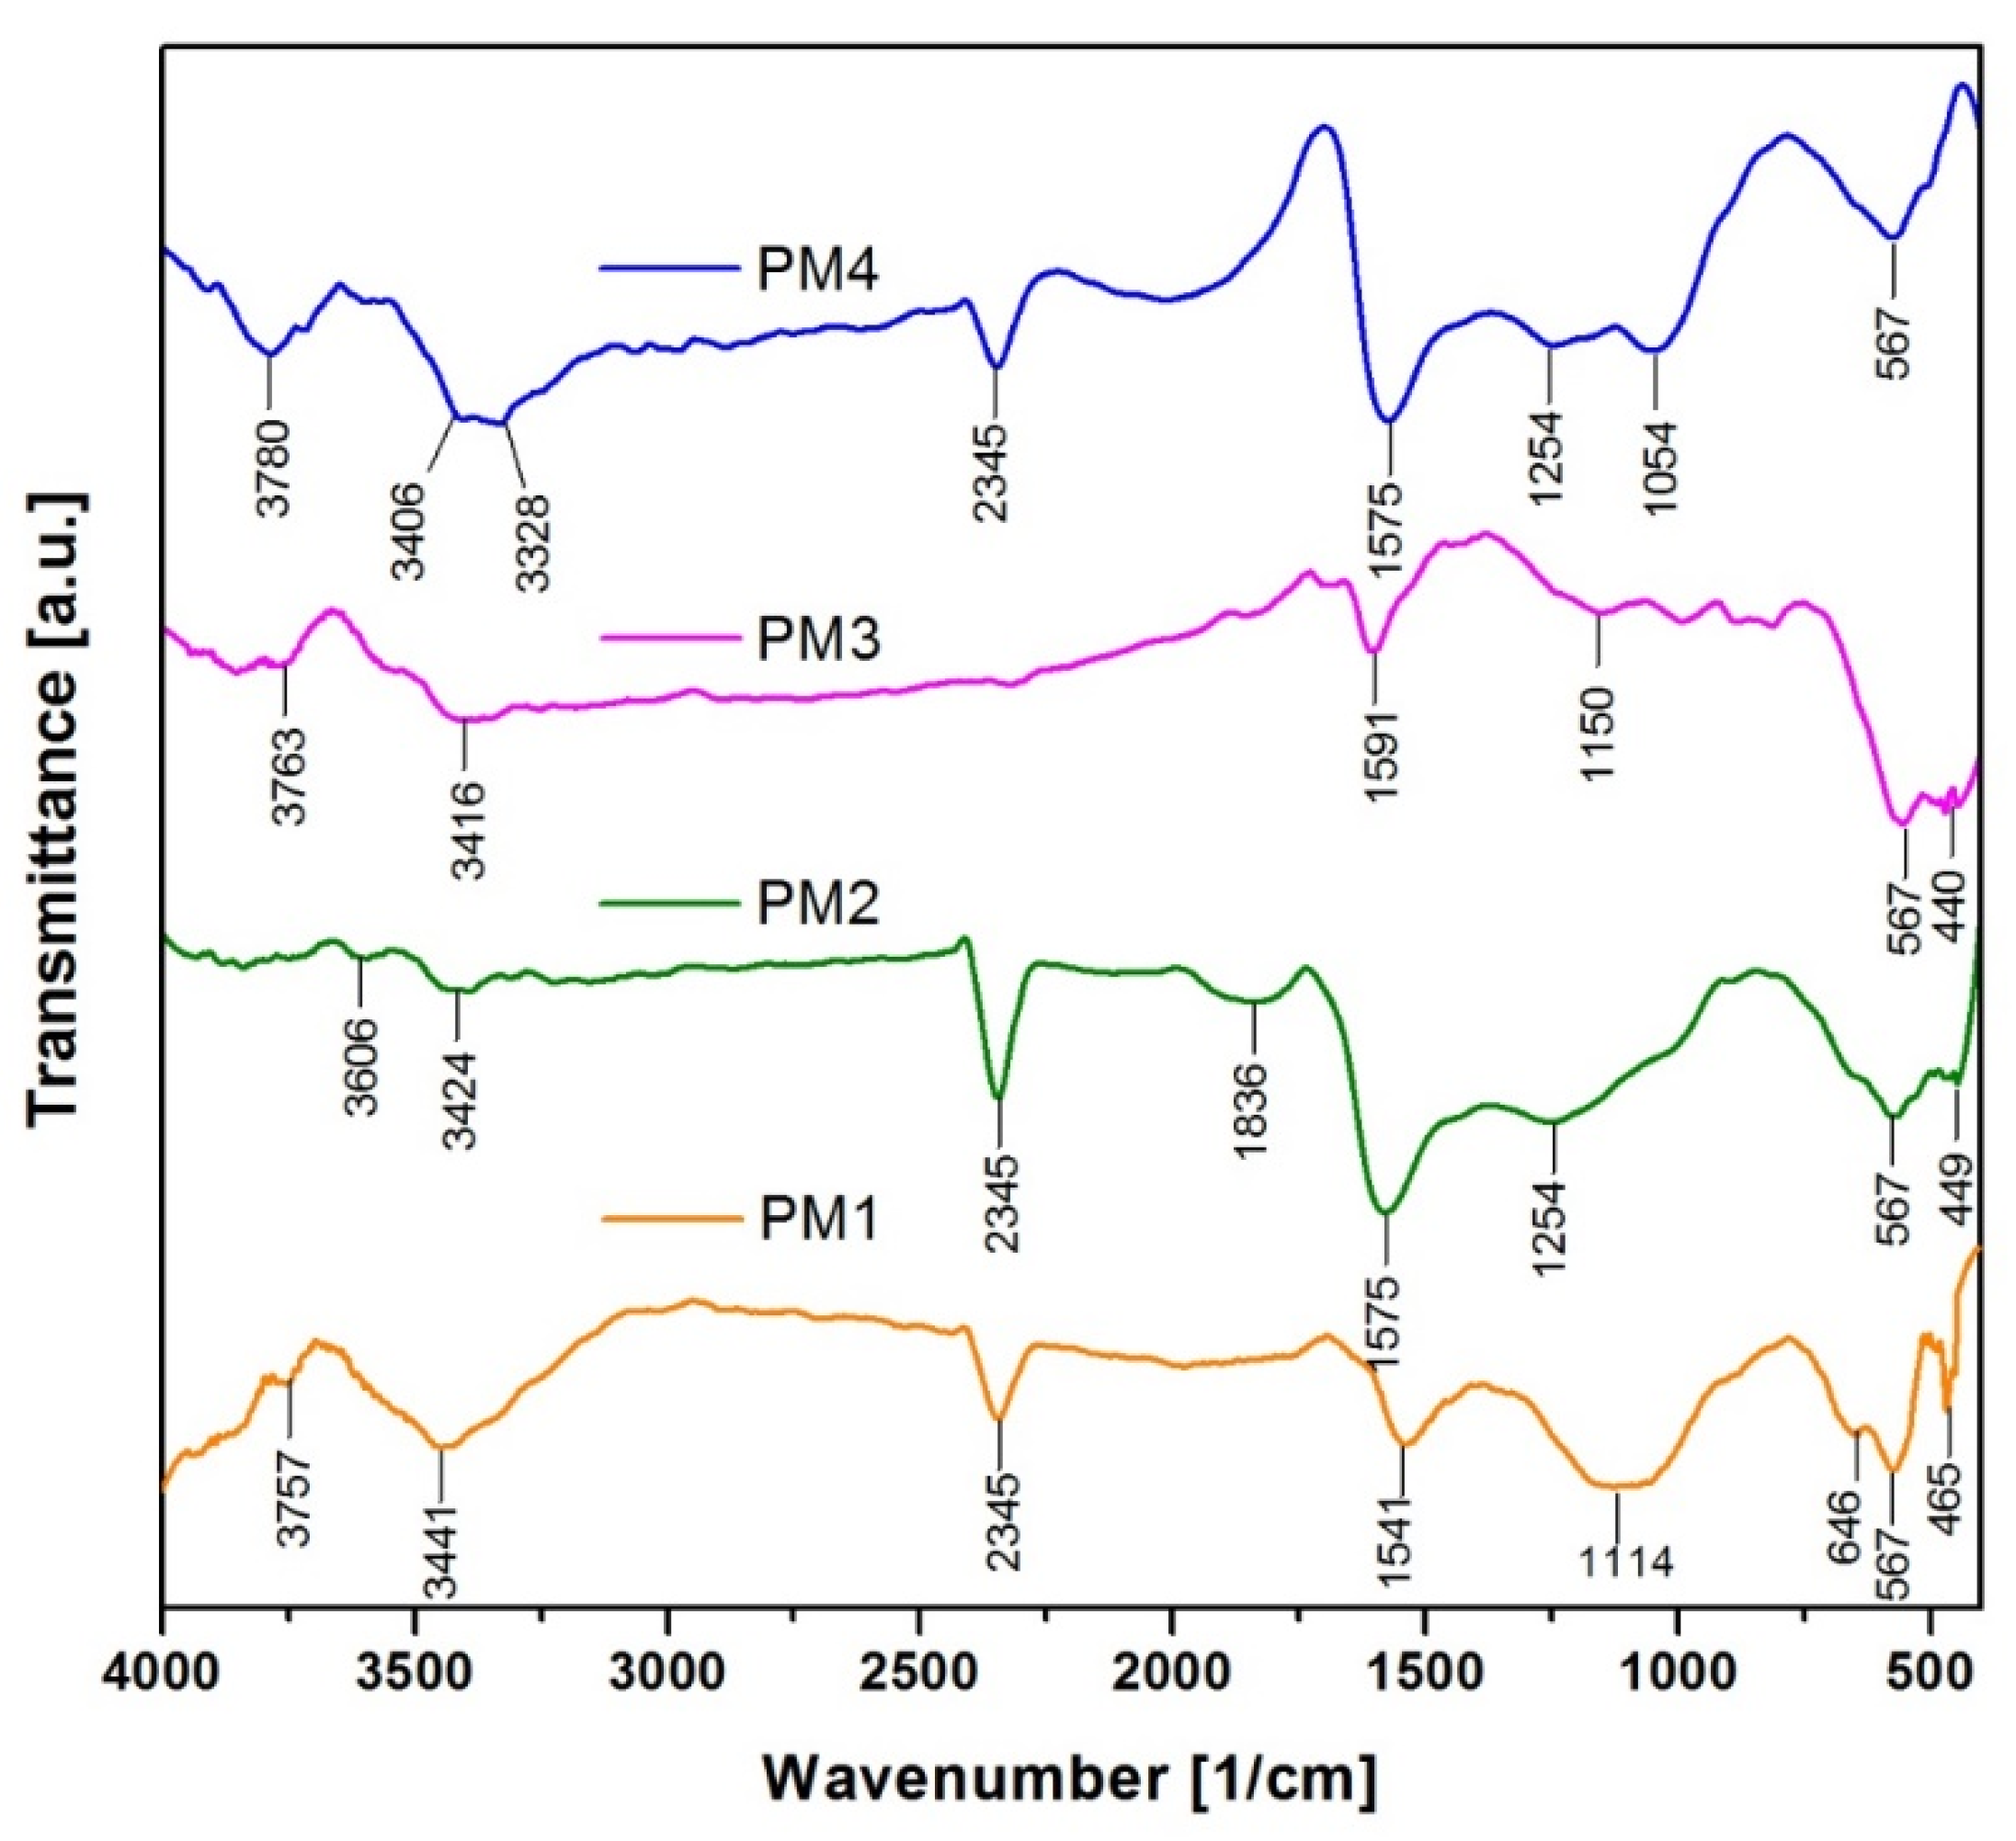
The functional groups present in the synthesized samples and their corresponding frequencies are highlighted in the FT-IR spectra, presented in Figure 2:

Figure 2.
FT-IR spectra of magnetic nanocomposites.
FT-IR analysis indicates the presence of several strong absorption bands located at 465 cm−1 and 567 cm−1 (PM1), 449 cm−1 and 567 cm−1 (PM2), 440 cm−1 and 567 cm−1 (PM3) and 567 cm−1 (PM4), which can be attributed to Fe-O vibration in Fe3O4, confirming the presence of the magnetite phase [48,49]. This is in total accordance with the results obtained from the X-ray diffraction analysis, namely, the formation of magnetite.
The FT-IR spectra also show some bands due to the organic residues resulting from the combustion reaction. The adsorption bands between 1054 cm−1 and 1254 cm−1 can be attributed to C-C and C-O stretching vibration in activated carbon [50]. An intense band can be noticed in the range of 1550–1600 cm−1, which is typically attributed to the vibration of C=C bonds [51]. The strong absorption bands observed at 2345 cm−1 correspond to chemisorbed CO2 [52]. The adsorption band at 1836 cm−1 found in PM2 is attributed to the stretching vibrations of the C=O groups [53]. Adsorption bands were observed in the range 3328–3442 cm−1 in all the spectra, which can be attributed to the stretching vibration of O-H groups coming from the adsorbed water [54]. The small bands identified around 3700 cm−1 can also be assigned to the vibrations of the free –OH groups from the surfaces of oxide nanoparticles [55].
3.1.3. Magnetic Properties of Magnetic Nanocomposites
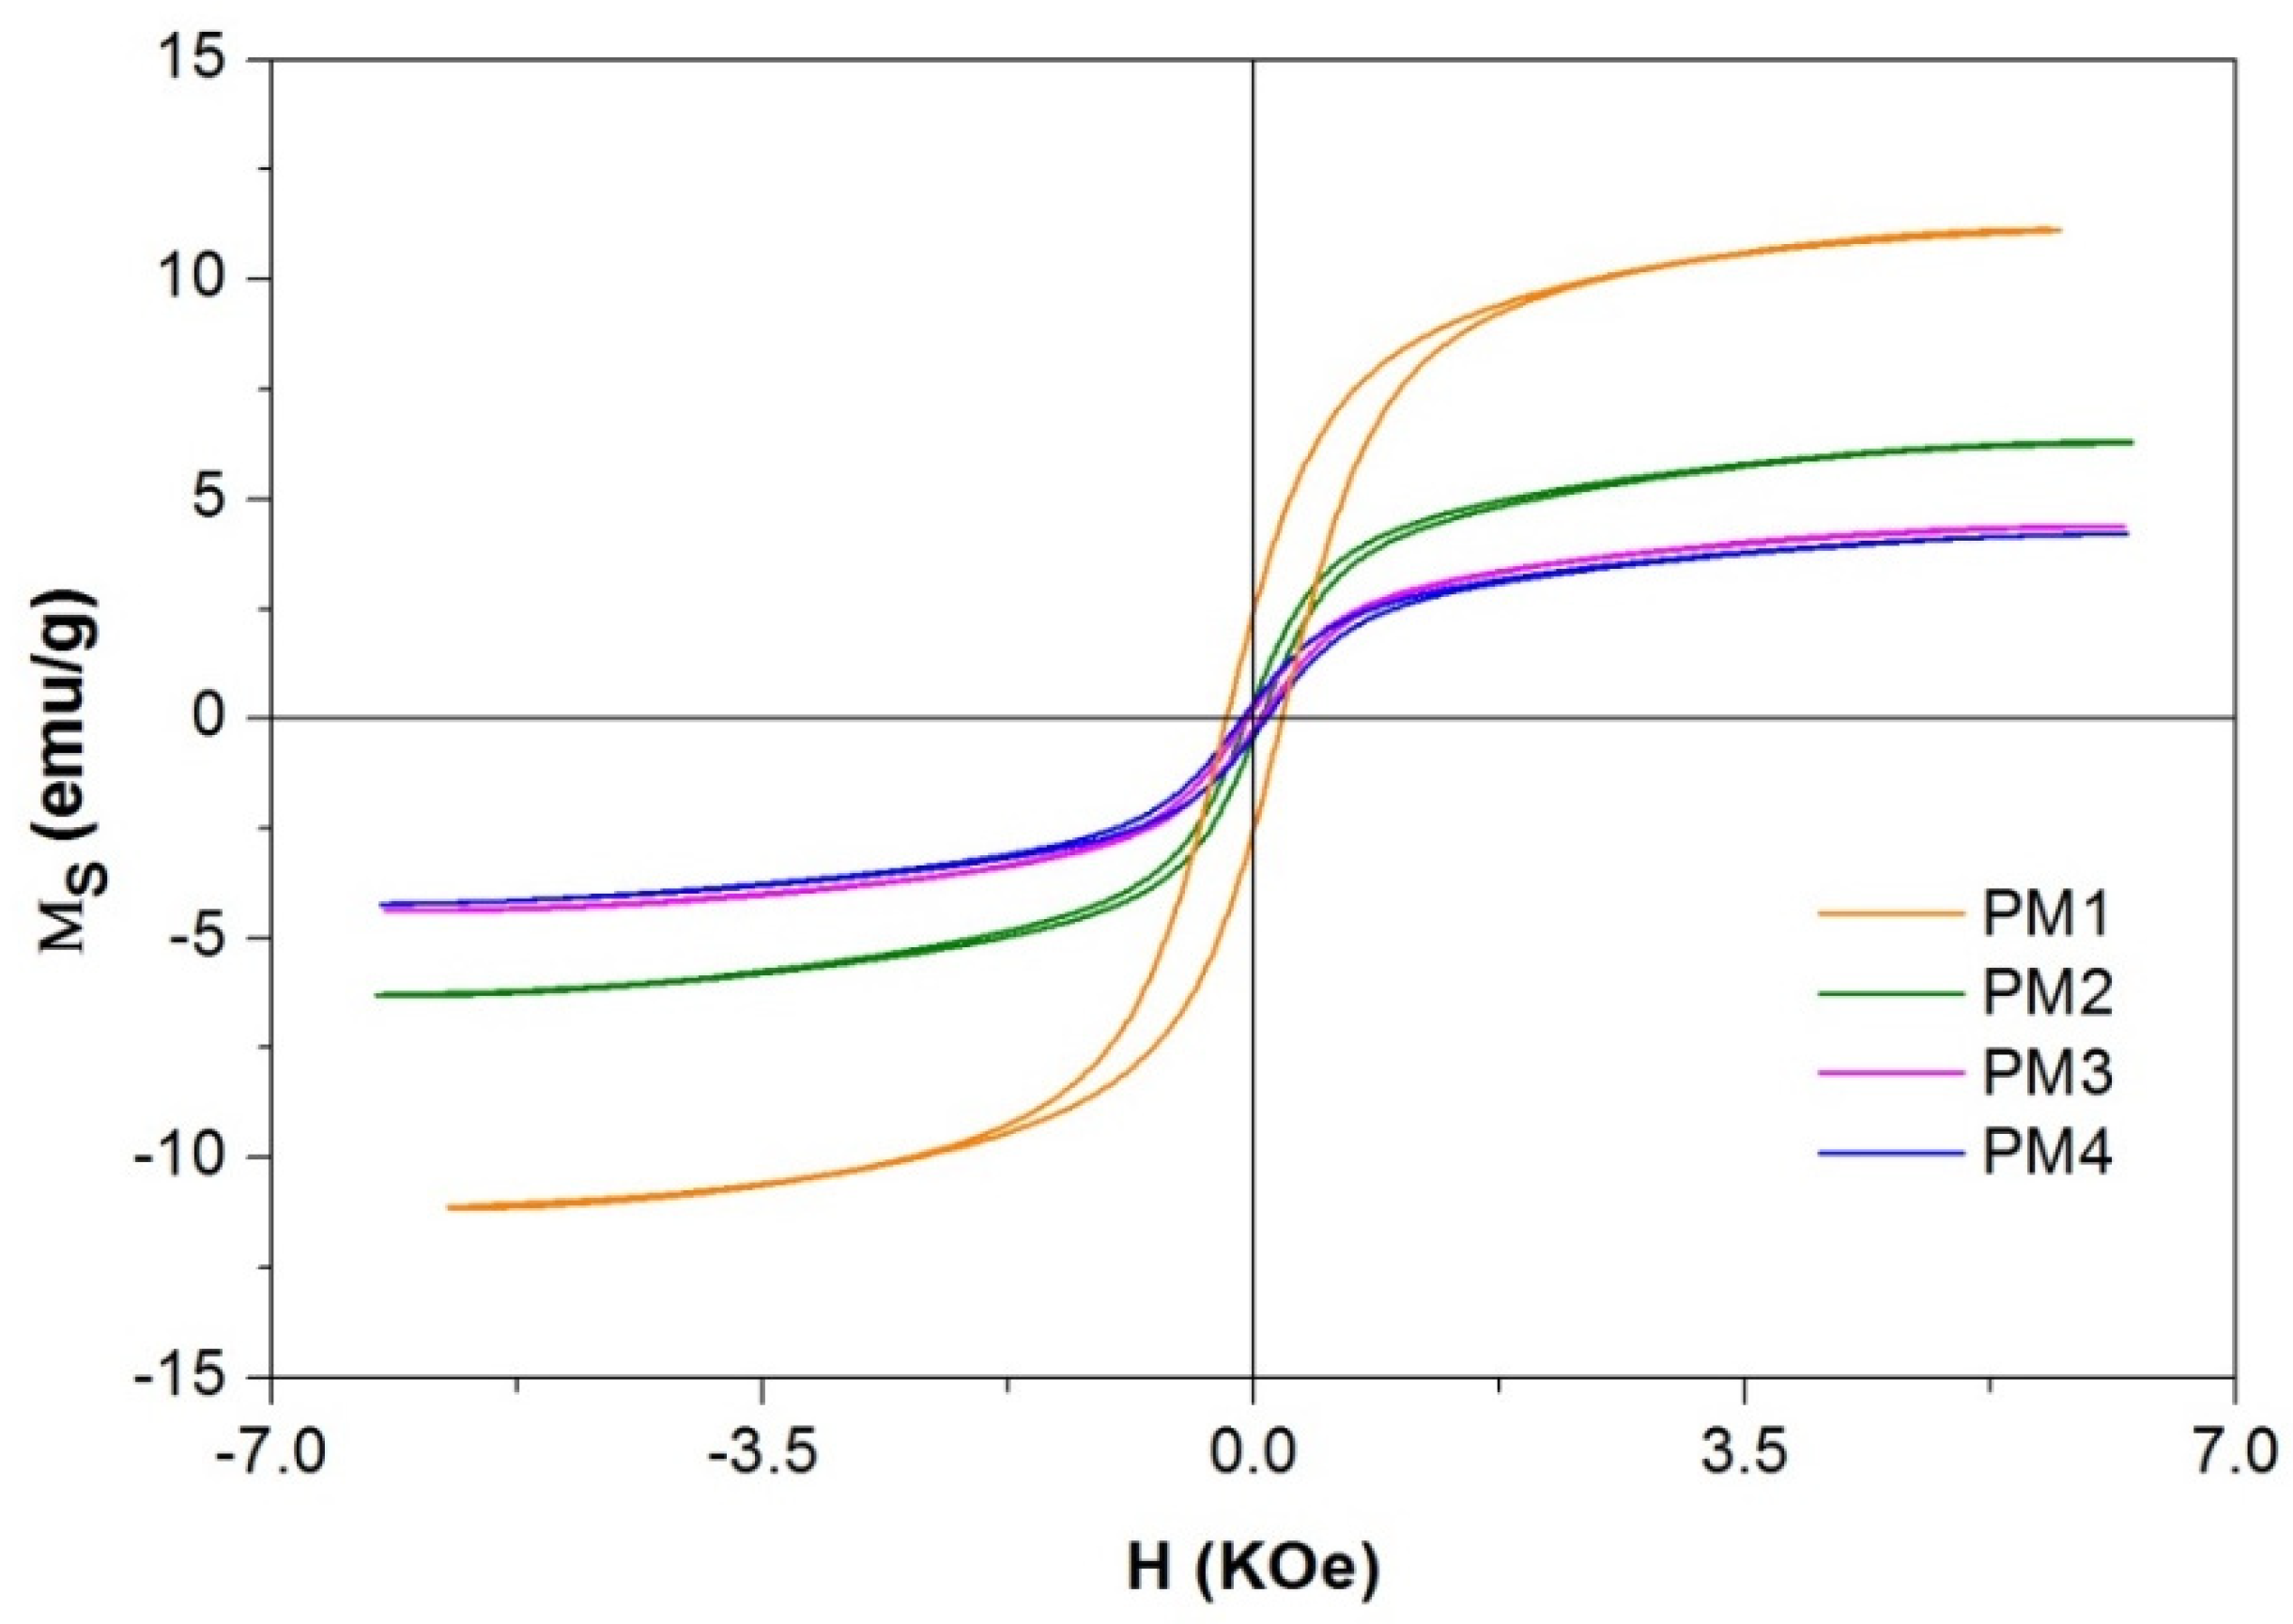
The magnetization measurements of the PM1, PM2, PM3 and PM4 nanocomposites recorded at room temperature are presented in Figure 3 and Table 2.
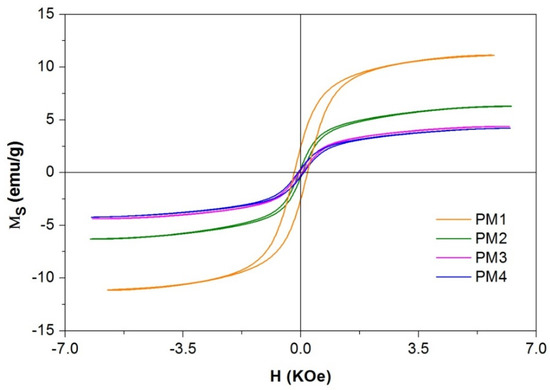
Figure 3.
Magnetization curves of magnetic nanocomposites.
Table 2.
Magnetic properties of magnetic nanocomposites.
When analyzing the data obtained from the magnetization curves presented in Table 2, one may observe that the saturation magnetization decreases from PM1 to PM3 when AC with a larger specific surface is introduced. The same decreasing trend is observed for the coercive field (Hc) and remanent magnetization (Mr) with the increase in the specific surface of the AC. The decrease in the thermal treatment time from PM3 to PM4 determines a slight decrease in saturation magnetization, but in the case of Hc and Mr, a doubling of the value can be observed.
The presence of hysteresis in PM1 with a value of coercivity field of 0.2 KOe indicates that the behavior of the material tends to be ferrimagnetic. The squarness ratio of the hysteresis loop (Mr/Ms) specific to samples PM2, PM3 and PM4 indicates a value less than 0.1, which implies that the materials present superparamagnetic behavior.
The low values of the magnetic measurements are due to the large amount of AC (non-magnetic material) present in the samples, representing 80% of the entire mass of the samples. Even at these low values of saturation magnetization, the materials still showed very good response to an external magnetic field. This magnetic behavior of the samples will contribute to the easy separation of the adsorbent from the aqueous solution.
3.1.4. N2 Adsorption–Desorption Isotherms
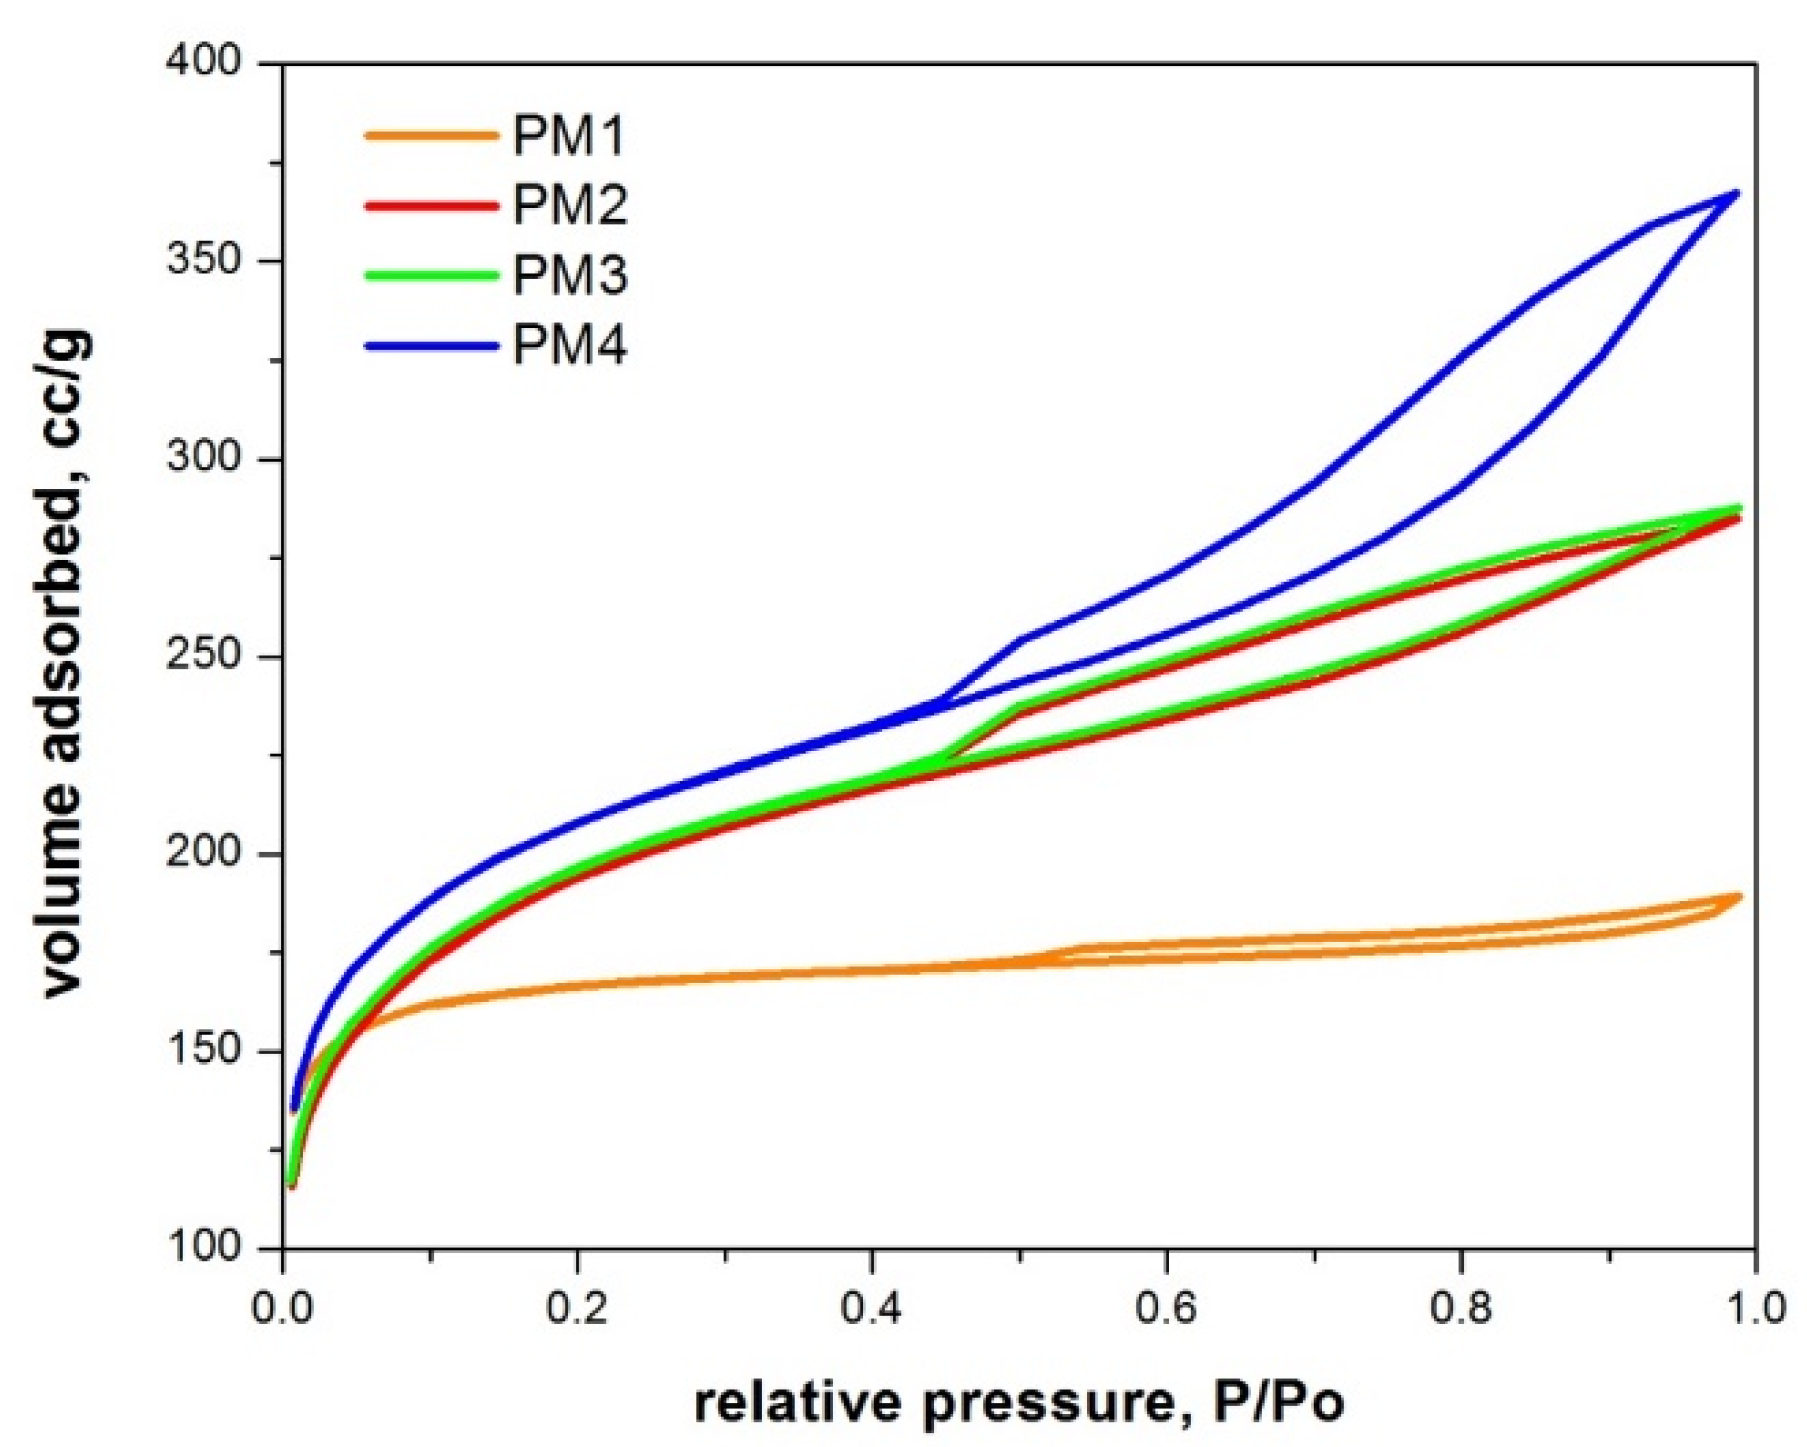
Figure 4 presents the N2 adsorption–desorption isotherms for the synthesized magnetic nanocomposites.

Figure 4.
N2 adsorption–desorption isotherms of magnetic nanocomposites.
According to IUPAC classification [56], all magnetic nanocomposites present type IVa adsorption–desorption isotherms with an H4 hysteresis, indicating that micropores are present.
The pore size distribution of the powders (Figure 5) indicates that all samples exhibit pores with diameters around 3.8 nm.
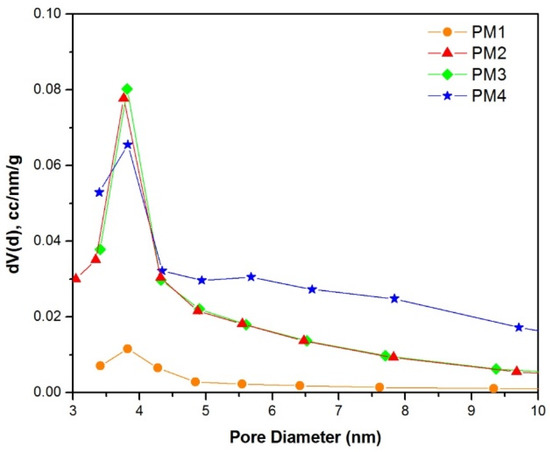
Figure 5.
Pore size distribution of magnetic nanocomposites.
Table 3 summarizes the characteristics of the porous structure of magnetic nanocomposites.
Table 3.
Characteristics of the magnetic nanocomposites.
The specific surface area of the AC used as the raw material had a positive effect on the specific surface of the synthesized powders (Table 3). The increase in the specific surface of the AC determined an increase in the specific surface and the total pore volume. At the same time, it can be observed that the time span of the thermal treatment determined a change in the specific surface. The reduction in the treatment time from 90 min (sample PM3) to 60 min (sample PM4) determined a slight increase in the specific surface area, from 715 m2/g to 761 m2/g, which could be explained by the preserving of a larger pore volume.
Due to these characteristics, it is expected that the as-synthesized powders will exhibit excellent adsorption efficiency, especially due to the large specific surface area. In addition, the powders present magnetic properties, which would be an advantage for their separation from aqueous solutions.
3.1.5. Thermal Analysis of Magnetic Nanocomposites
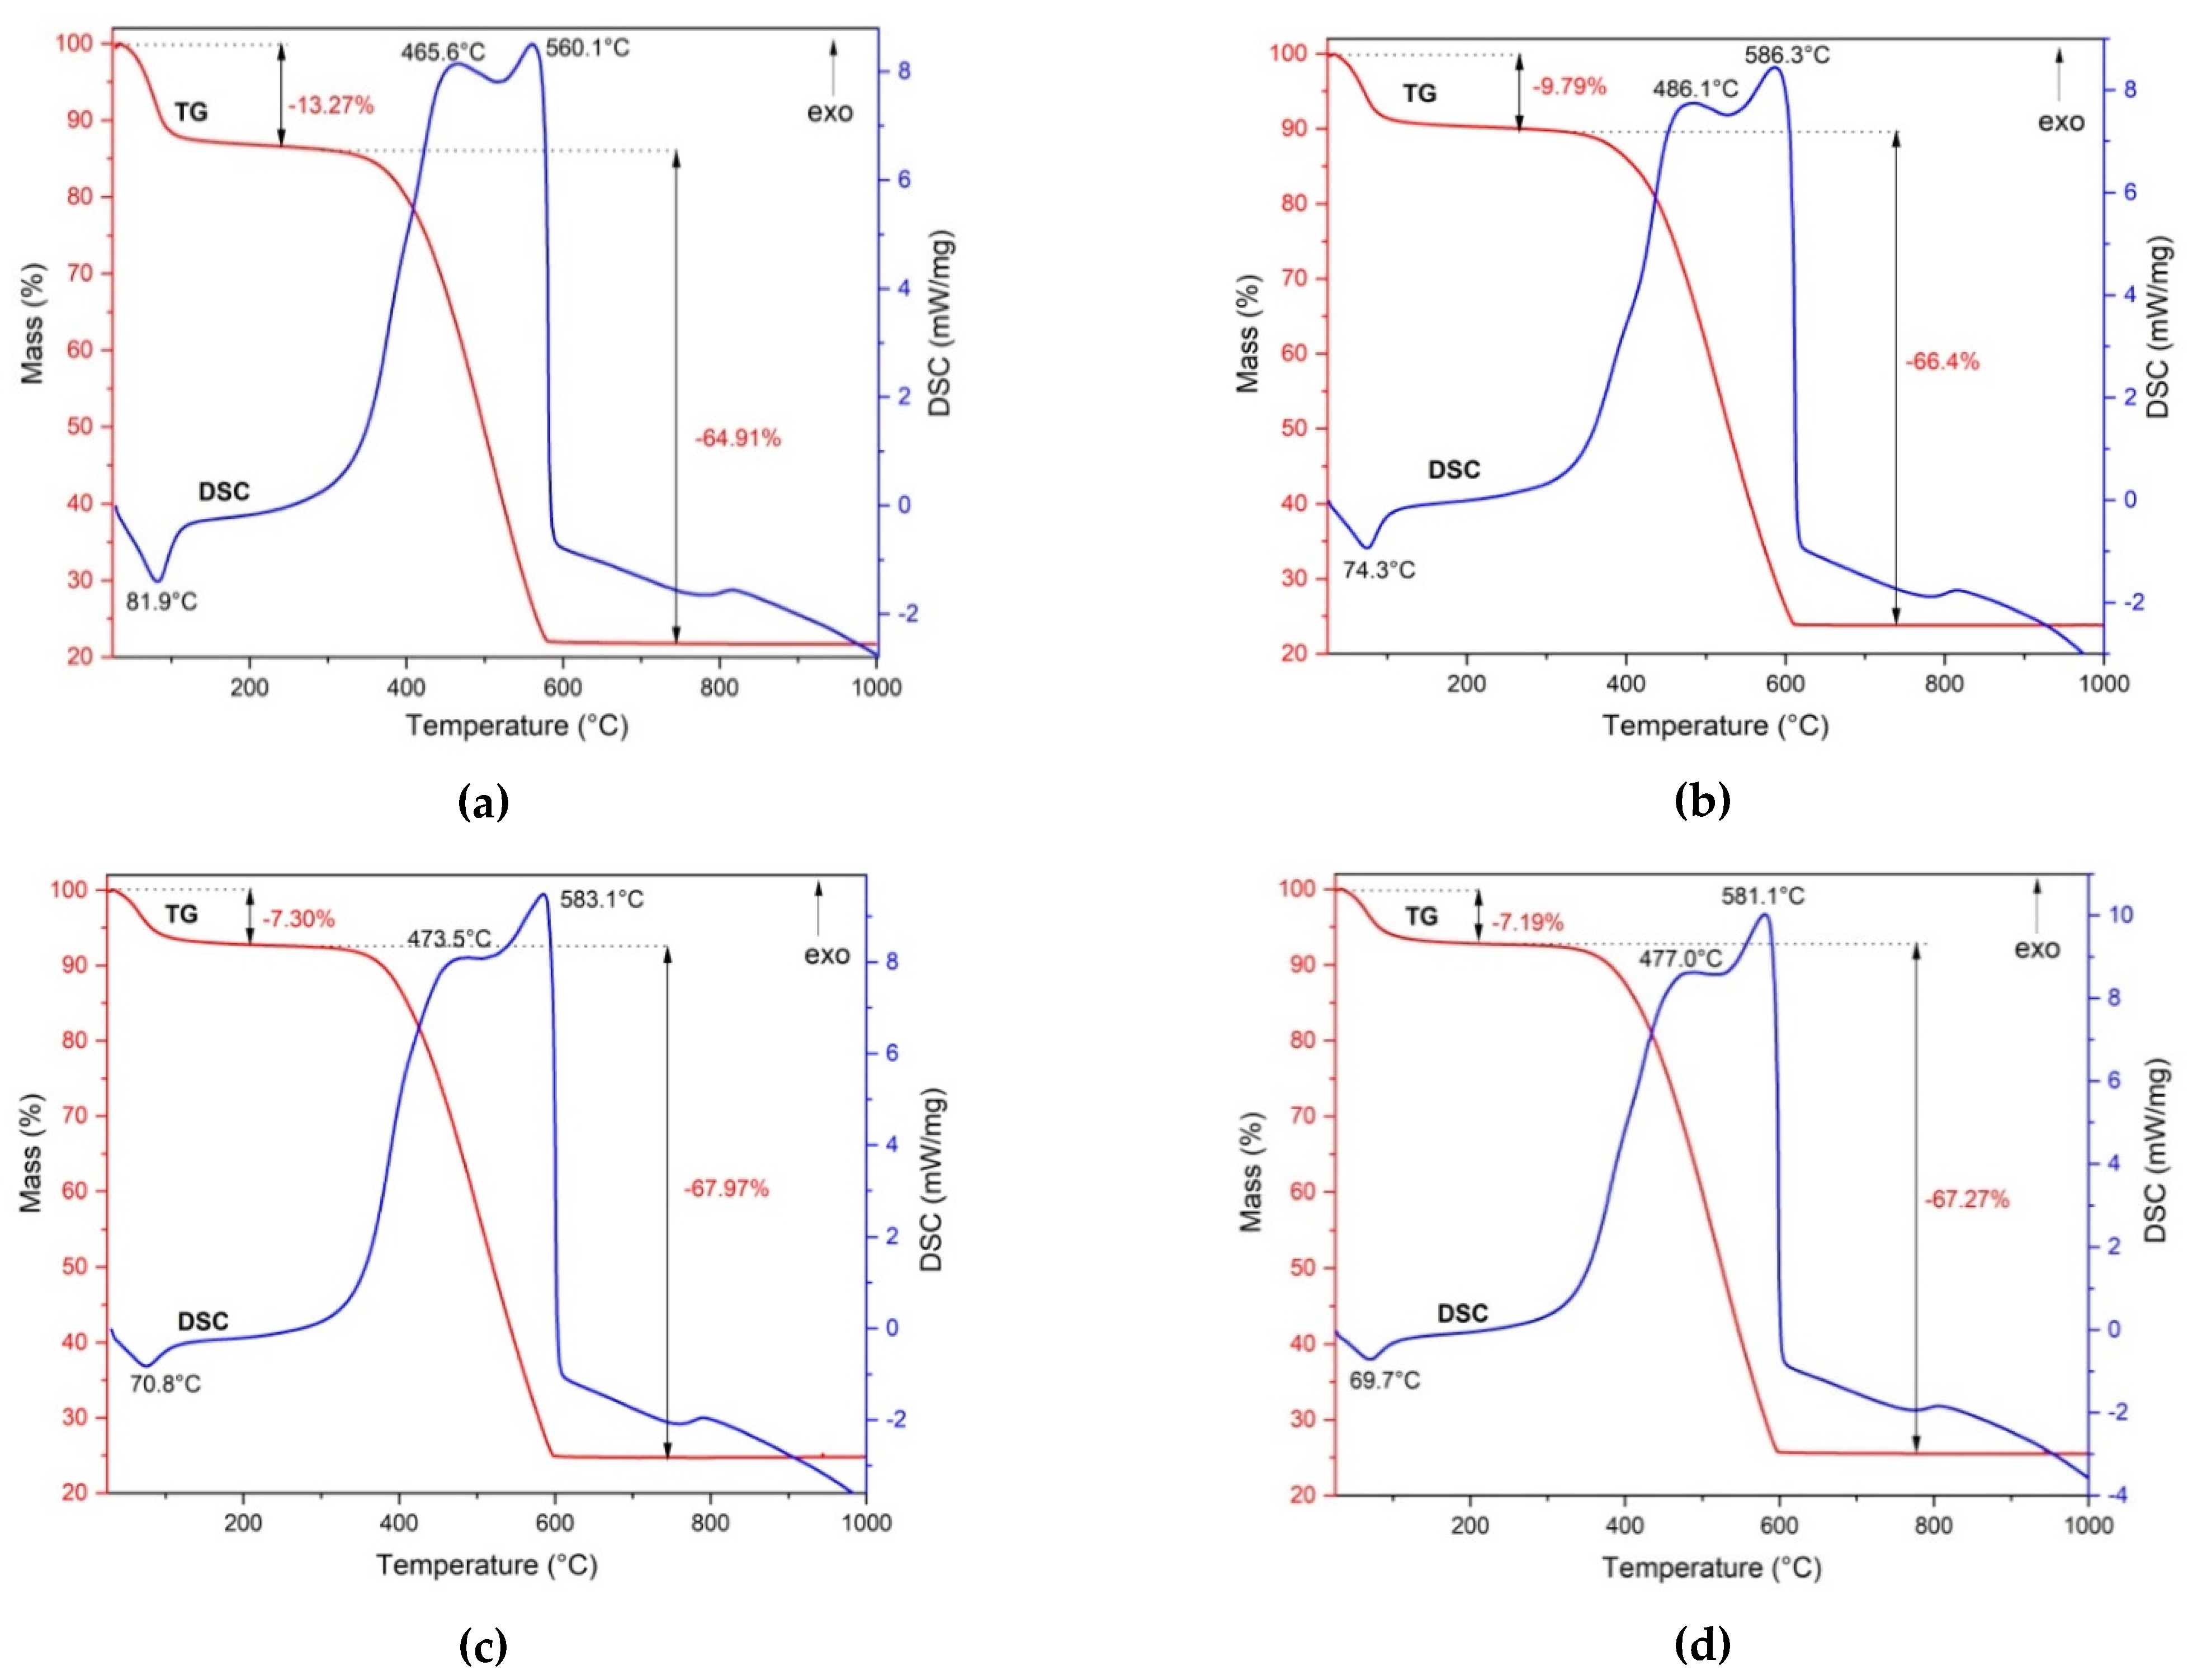
The synthesized powders have been characterized by thermal analysis. Figure 6 presents the TG and DSC curves of the prepared samples.
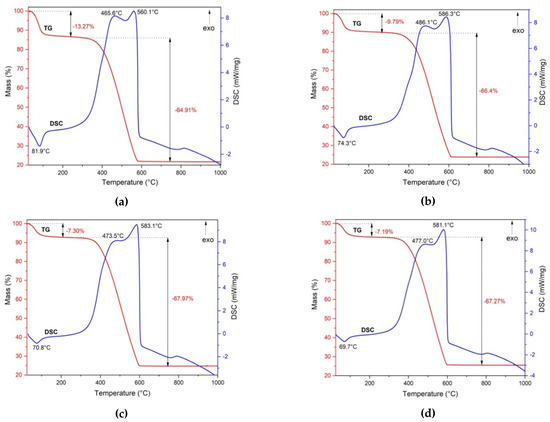
Figure 6.
The TG and DSC curves of magnetic nanocomposites: PM1 (a), PM2 (b), PM3 (c), PM4 (d).
The four samples presented similar behaviors when heated to 1000 °C. The TG curve indicates that all samples exhibited a two-step mass loss. In the first stage, up to 100 °C, the samples underwent a mass loss due to the water removal. This process was accompanied by an endothermic effect, as indicated by the DSC curves. In the first stage, PM1 showed the highest mass loss of 13.27%, followed by PM2 at 9.79%. The other samples showed slightly low losses of 7.30% for PM3 and 7.19% for PM4.
In the temperature range of 300–600 °C, the DSC curves for all the samples showed a strong exothermic effect, accompanied by a significant mass loss on the TG curve of about 65–68%. We can see an overlap of two exothermic effects on the DSC curves for all investigated samples, attributed to the combustion of the fuel residue and carbon oxidation present in the samples.
3.1.6. SEM Characterization of Magnetic Nanocomposites
In terms of morphology, the SEM investigations (Figure 7) do not indicate essential differences between the samples. This may be closely related to the large amount of carbon and the presence of magnetite in all PM samples. The SEM images of the PM evidence the presence of small particles of magnetite with an irregular shape that formed alongside AC.
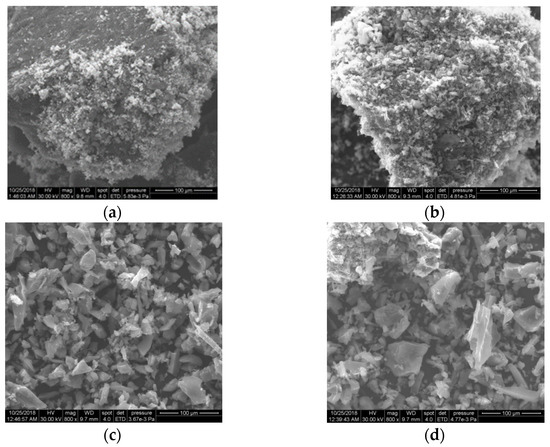
Figure 7.
The SEM images of the magnetic nanocomposites PM1 (a), PM2 (b), PM3 (c) and PM4 (d).
3.2. Adsorption Experiments
The molecular structure and characteristics of the anionic dyes Acid Yellow 42 (AY 42) and Acid Red 213 (AR 213) used as adsorbate are presented in Table 4.
Table 4.
The molecular structure and characteristics of the investigated dyes.
The synthesized PMs were tested as adsorbents for the mentioned anionic dyes. The studies were performed at an optimum solution pH (2.1 for both dyes) and a temperature of 25 °C, using 1 g/L PM and a dye concentration of 50 mg/L. Preliminary adsorption results are presented in Table 5.
Table 5.
Removal yields and adsorption capacity of magnetic nanocomposites.
The results show that the removal efficiency/adsorption capacity of the magnetic nanocomposites increased from PM1 to PM4, which can be explained by the increase in the specific surface and total pore volume (Table 3). The PM4 sample has been selected as the adsorbent in adsorption studies due to its large specific surface area, high removal efficiency/adsorption capacity, and also because it can achieve good magnetic separation from the aqueous solution.
3.2.1. Effect of pH on the Adsorption Process
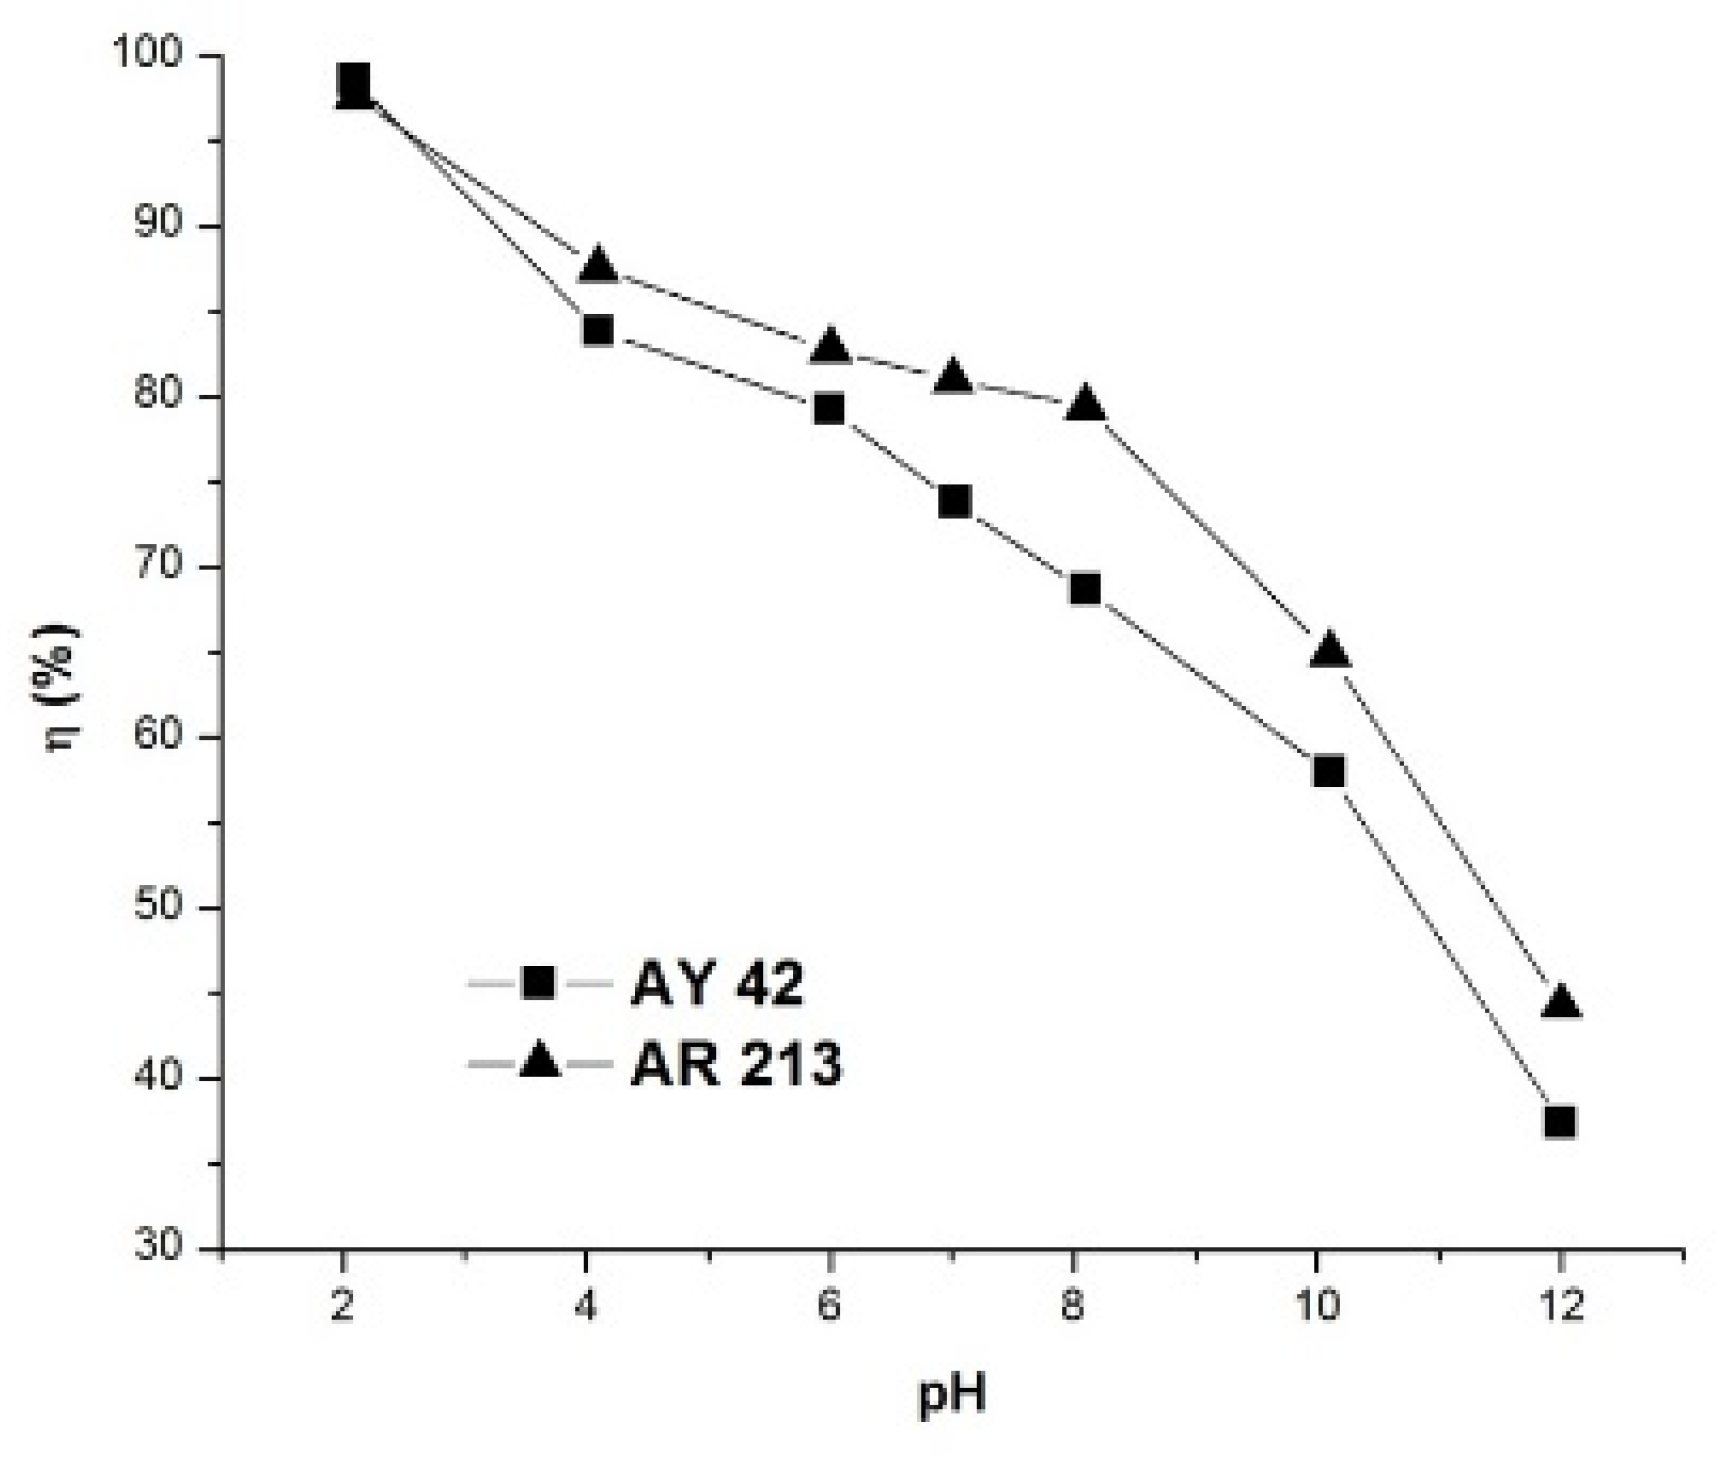
The pH of the solution is considered a very important parameter that affects the adsorption process. In order to determine the optimum pH value, the analysis was extended by varying the pH value of the solution in the range 2–12 for the investigated dyes, keeping all other variables constant. The results obtained, presented in Figure 8, indicate a direct relation between the removal efficiency and the pH of the solution.

Figure 8.
Effect of pH on dye removal efficiency using PM4; initial dye concentration 50 mg/L, 1 g/L PM4, contact time 120 min, 25 °C.
The removal efficiency of the investigated dyes was high at pH 2, and decreased with the increase in pH to 12. This can be explained by the fact that the adsorption mechanism of anionic dyes in acid solution is a result of electrostatic attraction forces between the positively charged surface of the adsorbent and the negatively charged dye molecules [57]. On the other hand, as the pH increased, the number of hydroxide anions increased, and these compete with anionic dyes for positively charged sites in the adsorbent, which determines a reduction in the removal efficiency as the pH increases.
The maximum removal yield was obtained at the optimum solution pH of ~2 as 98.54% for AY 42 and 97.58% in the case of AR 213. It should be noted that the removal efficiencies were higher than 70%, even at the natural pH of the dye solutions—6.8 for AY 42 and 6.9 for AR 213—so we decided to perform further adsorption studies at a natural pH.
3.2.2. Effect of Adsorbent Dose on the Adsorption Process
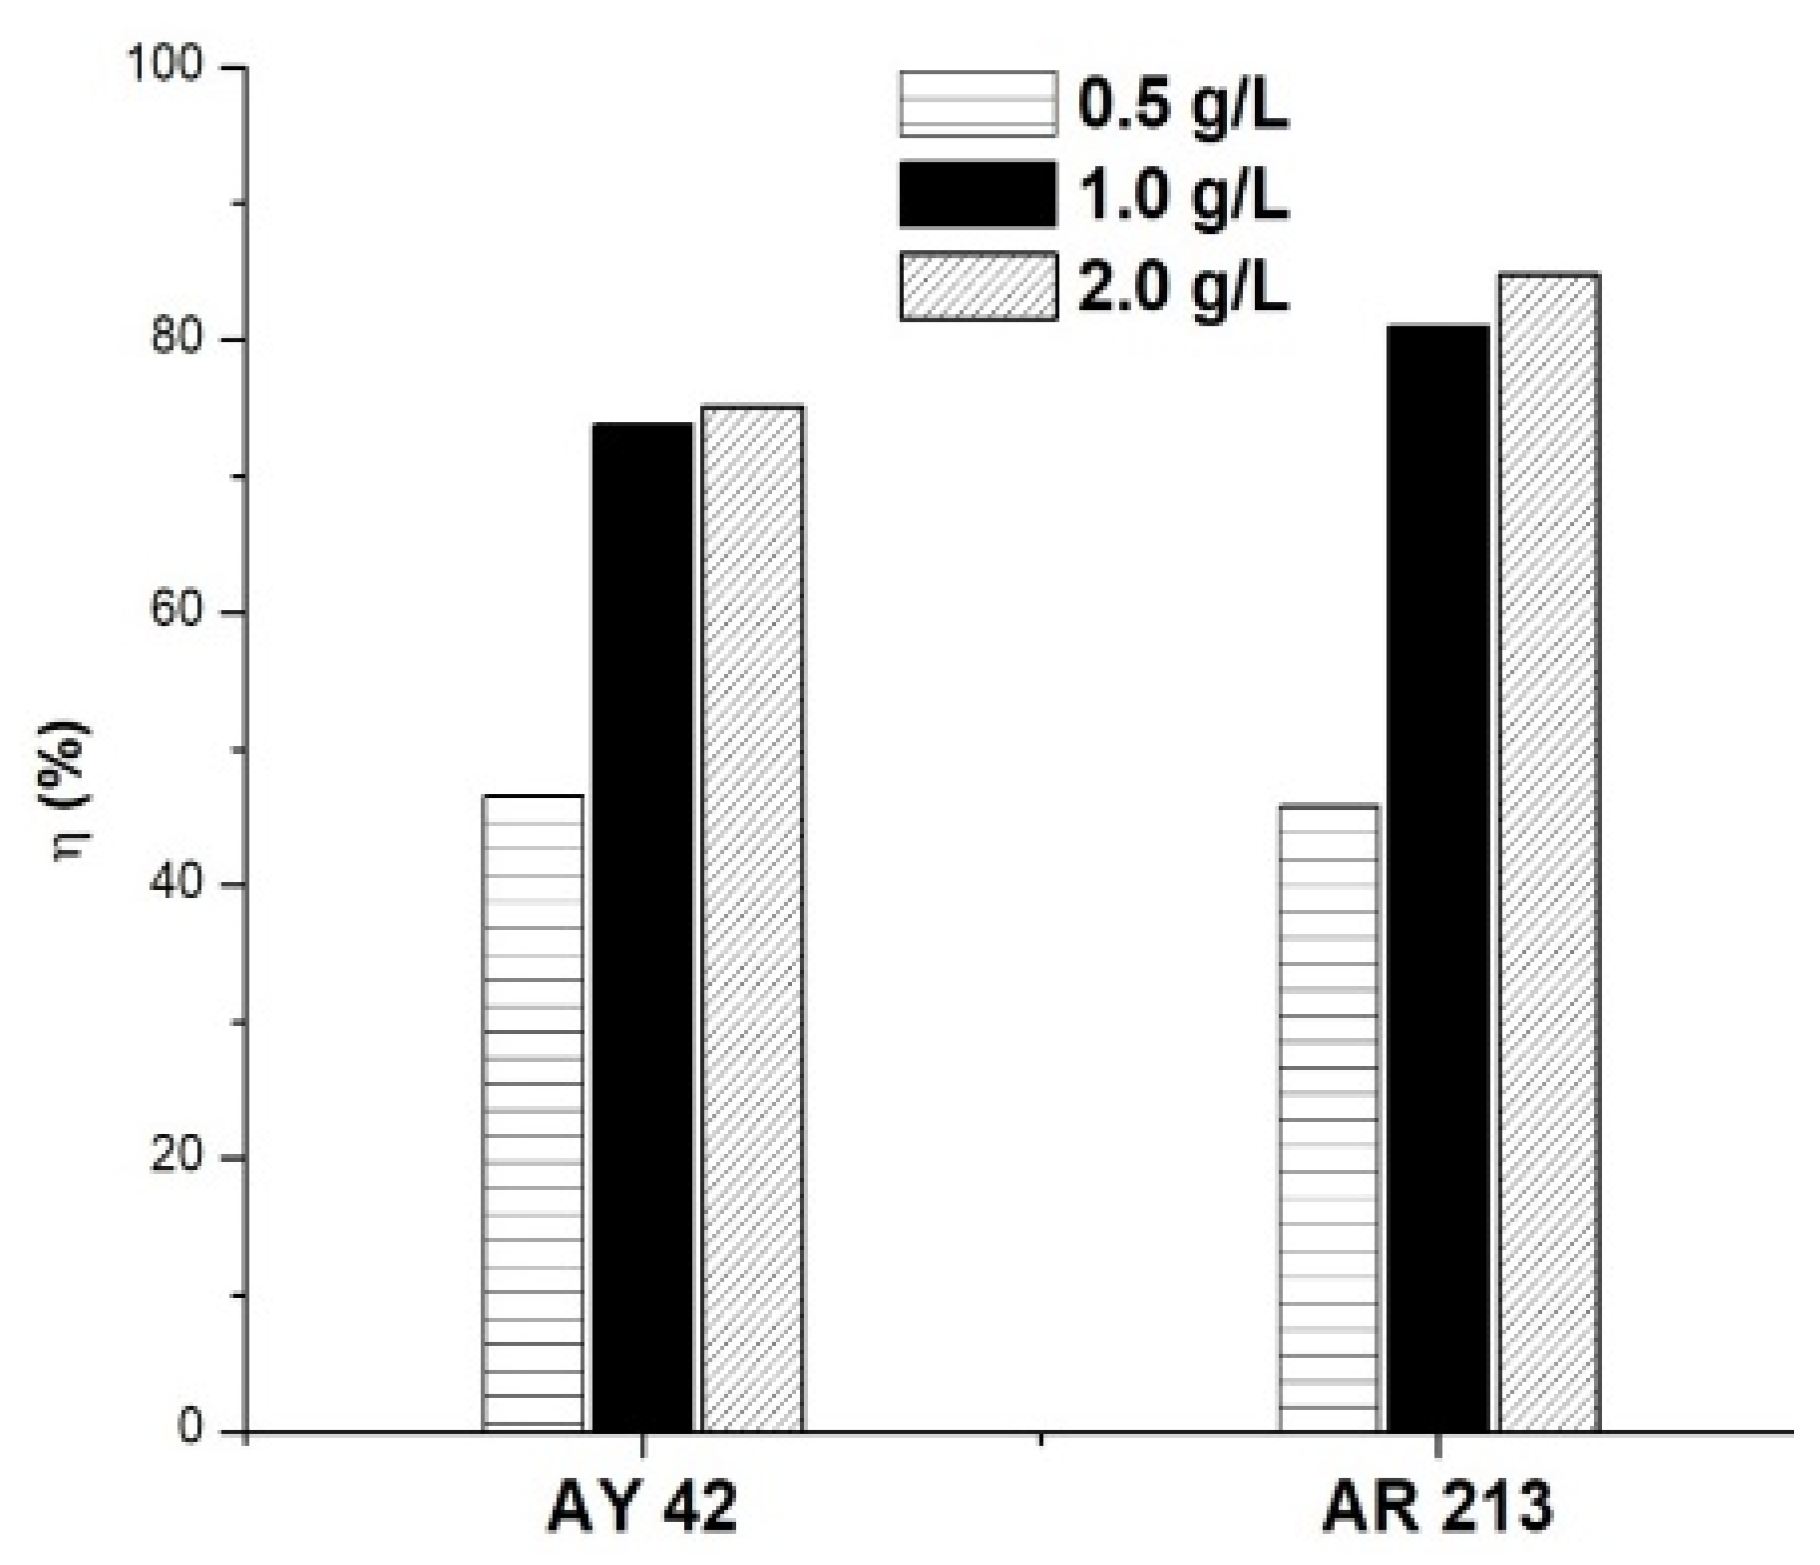
To study the influence of the amount of sorbent on the adsorption process, different amounts of PM4 were used (0.5, 1.0 and 2.0 g/L), keeping the other variables constant (50 mg/L, 25 °C, natural pH of solution: 6.8 for AY 42 and 6.9 for AR 213). The results are presented in Figure 9. As the amount of adsorbent increased, an increase in dye removal was noticed. These results can be explained by the higher number of active sites available as the adsorbent dose increased, facilitating the adsorption process [14,58].
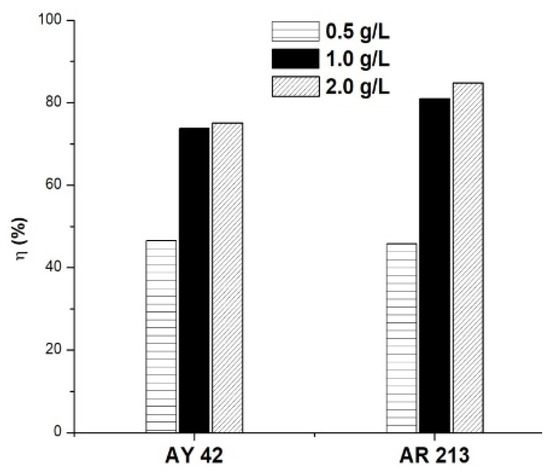
Figure 9.
Effect of adsorbent amount on dye removal efficiency using PM4; initial dye concentration 50 mg/L, 25 °C, natural pH of solution.
The removal efficiency of the investigated dyes increased rapidly as the amount of PM4 increased from 0.5 to 1.0 g/L. An increase in the amount of adsorbent above 1.0 g/L did not significantly improve the adsorption of dyes, so it has not been justified for use. In order to obtain a good removal efficiency, using less adsorbent, further studies were performed using 1.0 g/L of PM4.
3.2.3. Effect of Concentration on the Adsorption Process
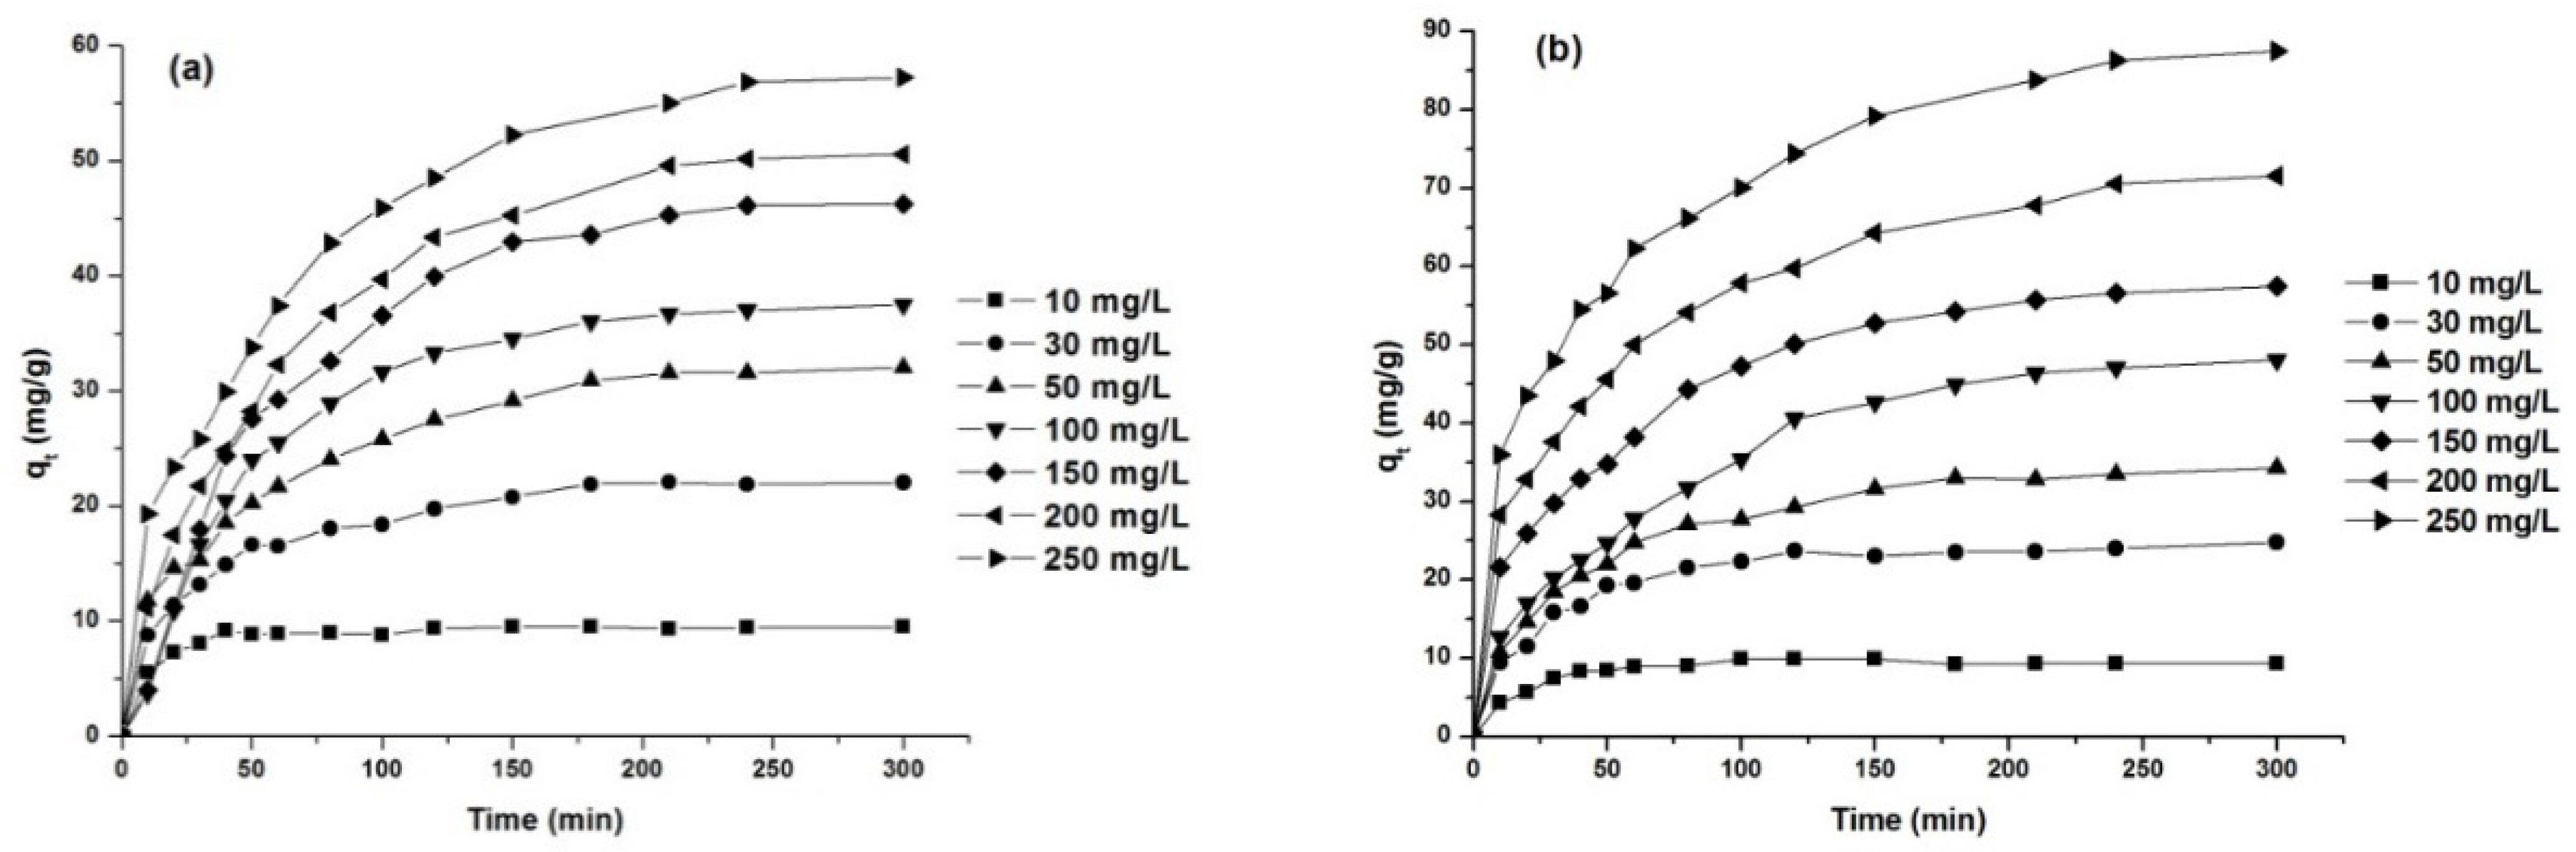
The effect of the initial dye concentration on the adsorption capacity was investigated for dye concentrations between 10 and 250 mg/L, at 25 °C and a natural pH of the solution. The obtained results are presented in Figure 10 and Table 6.
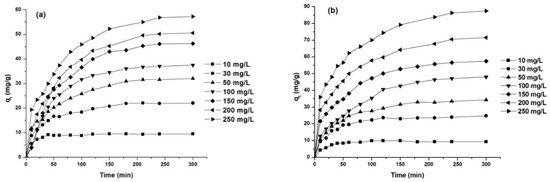
Figure 10.
Effect of initial concentration on dye removal capacity: AY 42 (a) and AR 213 (b); 1 g/L PM4, 25 °C, natural pH of solution.
Table 6.
Influence of the initial concentration of dye solutions on the adsorption capacity of PM4.
As can be seen from Figure 10, the adsorption capacity increased with the increase in initial dye concentration. The adsorption process was fast in the initial stages and remained almost constant after reaching the equilibrium time, due to the saturation of the active centers on the surface of the adsorbent available for the dye [15,59]. The time required to reach equilibrium increased with the increasing initial dye concentration (Table 6), because the diffusion in internal adsorption sites was influenced by the increase in the initial dye concentration [60].
3.2.4. Effect of Temperature on the Adsorption Process
To investigate the influence of temperature on the adsorption process, three different temperatures were studied (25 °C, 45 °C and 65 °C), working at a concentration of 50 mg/L and the natural pH of the solution. The obtained results are presented in Figure 11 and Table 7.
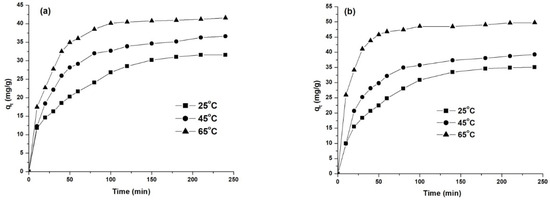
Figure 11.
Effect of temperature on dye removal capacity: AY 42 (a) and AR 213 (b); 1 g/L PM4, 25 °C, natural pH of solution.
Table 7.
Influence of temperature on the adsorption capacity of PM4.
The experimental data presented in Figure 11 show that the increase in temperature determined an increase in adsorption capacity, indicating that the adsorption of anionic dyes on PM4 is an endothermic process. This can be explained vie the reduced aggregation of the dye by the increased temperature, facilitating the diffusion of dye molecules into the pores of the adsorbent [61,62]. On the other hand, as the temperature increased from 25 to 65 °C, the time required to reach equilibrium decreased from 160 to 100 min for AY 42, and from 110 to 70 min for AR 213 (Figure 11, Table 7). High adsorption yields were obtained even at room temperature (Table 7): 73.77% for AY 24 and 87.53% for AR 213.
3.3. Kinetic Studies of Adsorption
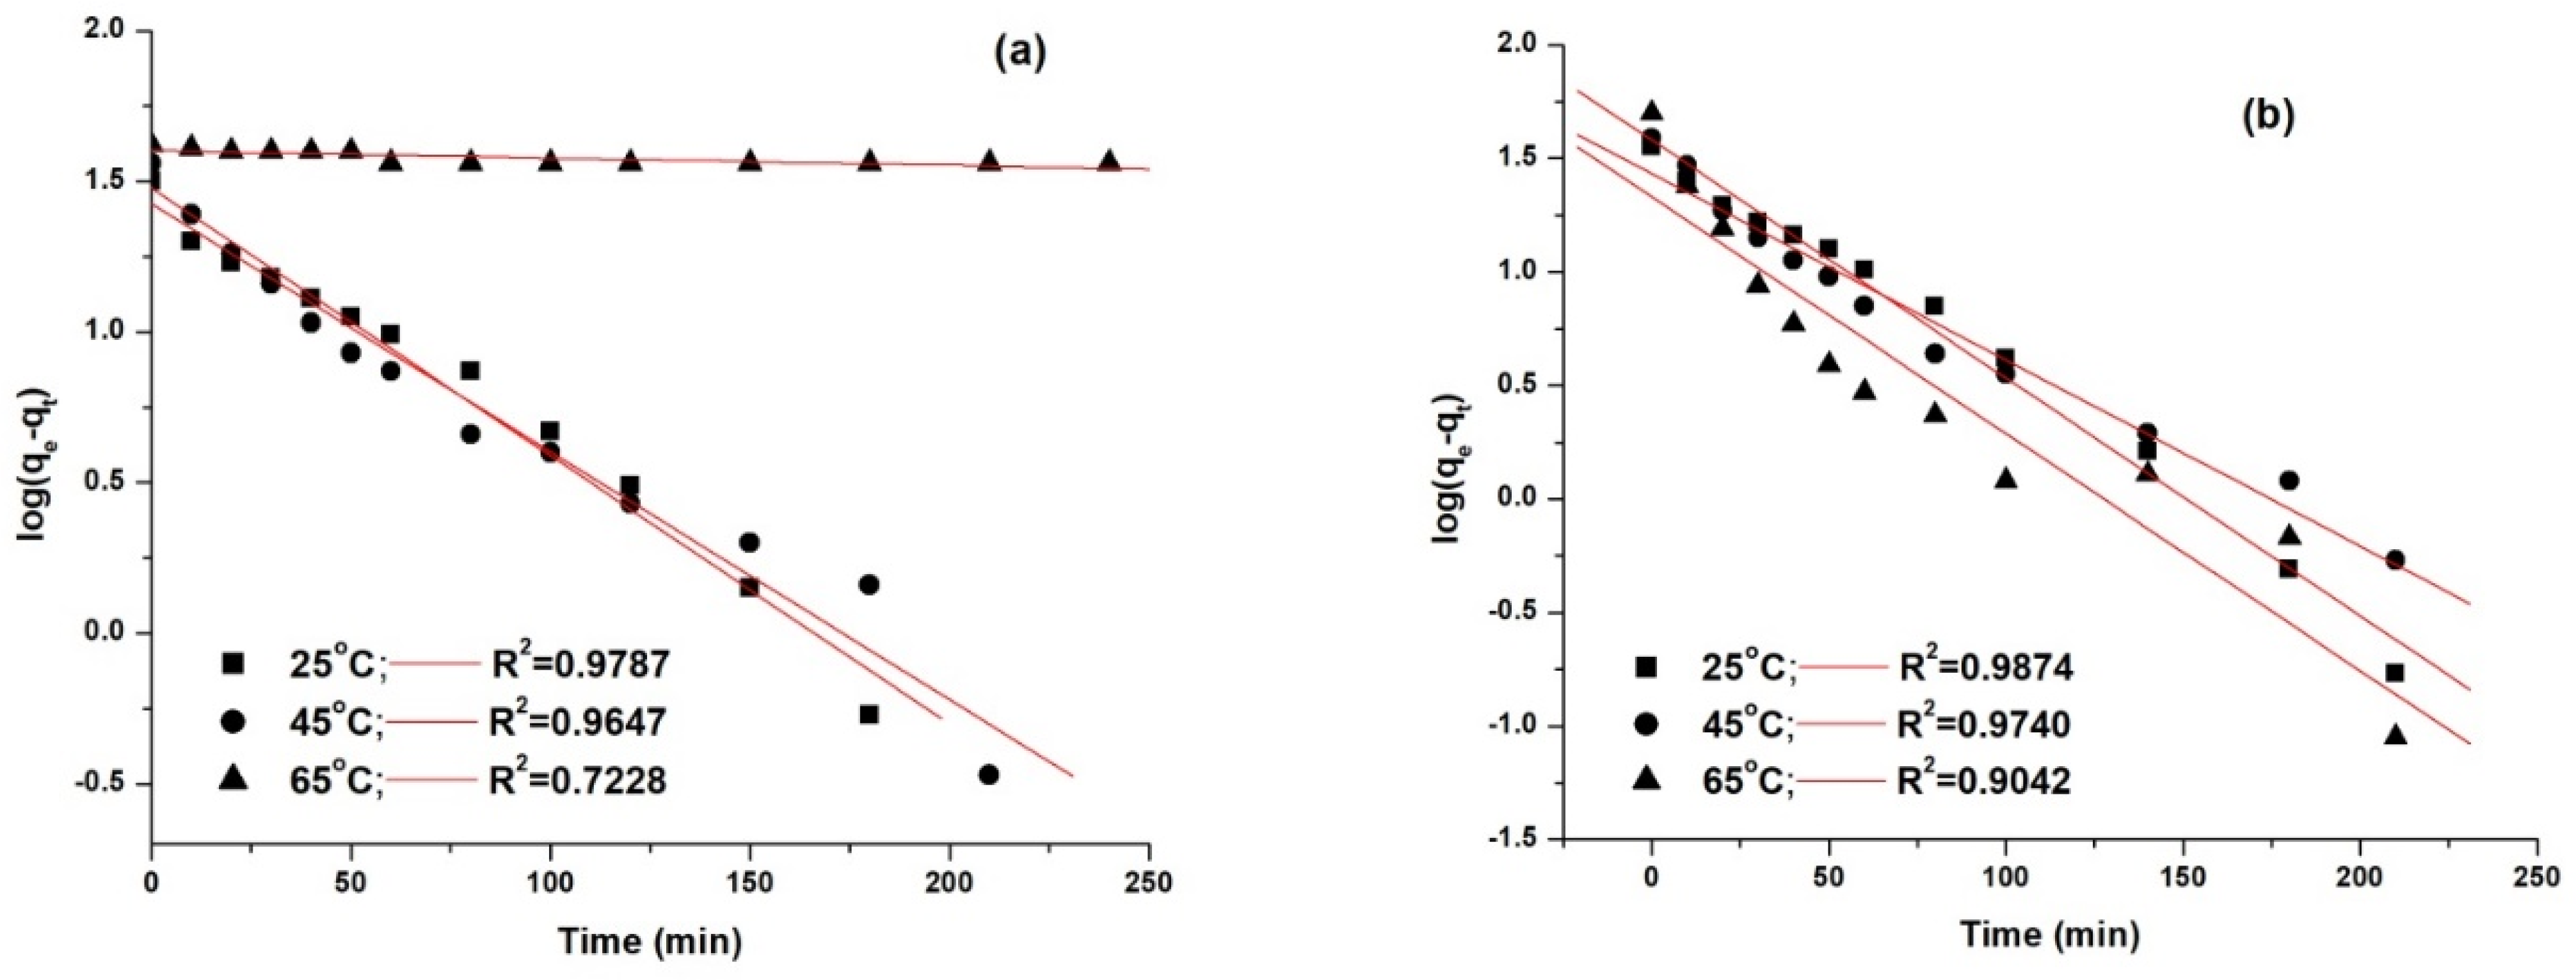
Kinetic studies provide information regarding the kinetic parameters and the mechanism of the dye adsorption process. The experimental data obtained at different periods of time for different temperatures were analyzed using the kinetic models pseudo first-order, proposed by Lagergren (Equation (5)) [63], and pseudo second-order, proposed by Ho (Equation (6)) [64].
where qe and qt are the amounts of dye adsorbed at equilibrium and at time t (mg/g), t is the contact time (min), k1 is the adsorption rate constant (min−1), and k2 is the adsorption rate constant (g/mg·min).
The kinetic models were fitted using the linear fitting method, and the obtained results are presented in Figure 12 and Figure 13.
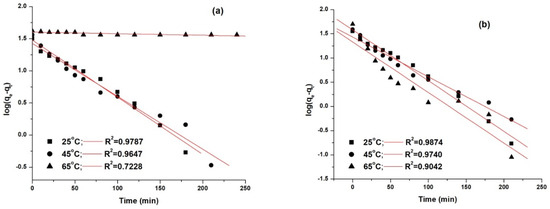
Figure 12.
Pseudo first-order kinetic model fitting for the adsorption of AY 42 (a) and AR 213 (b) onto PM4.
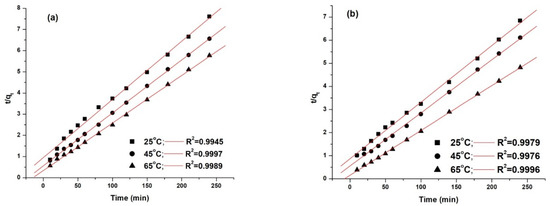
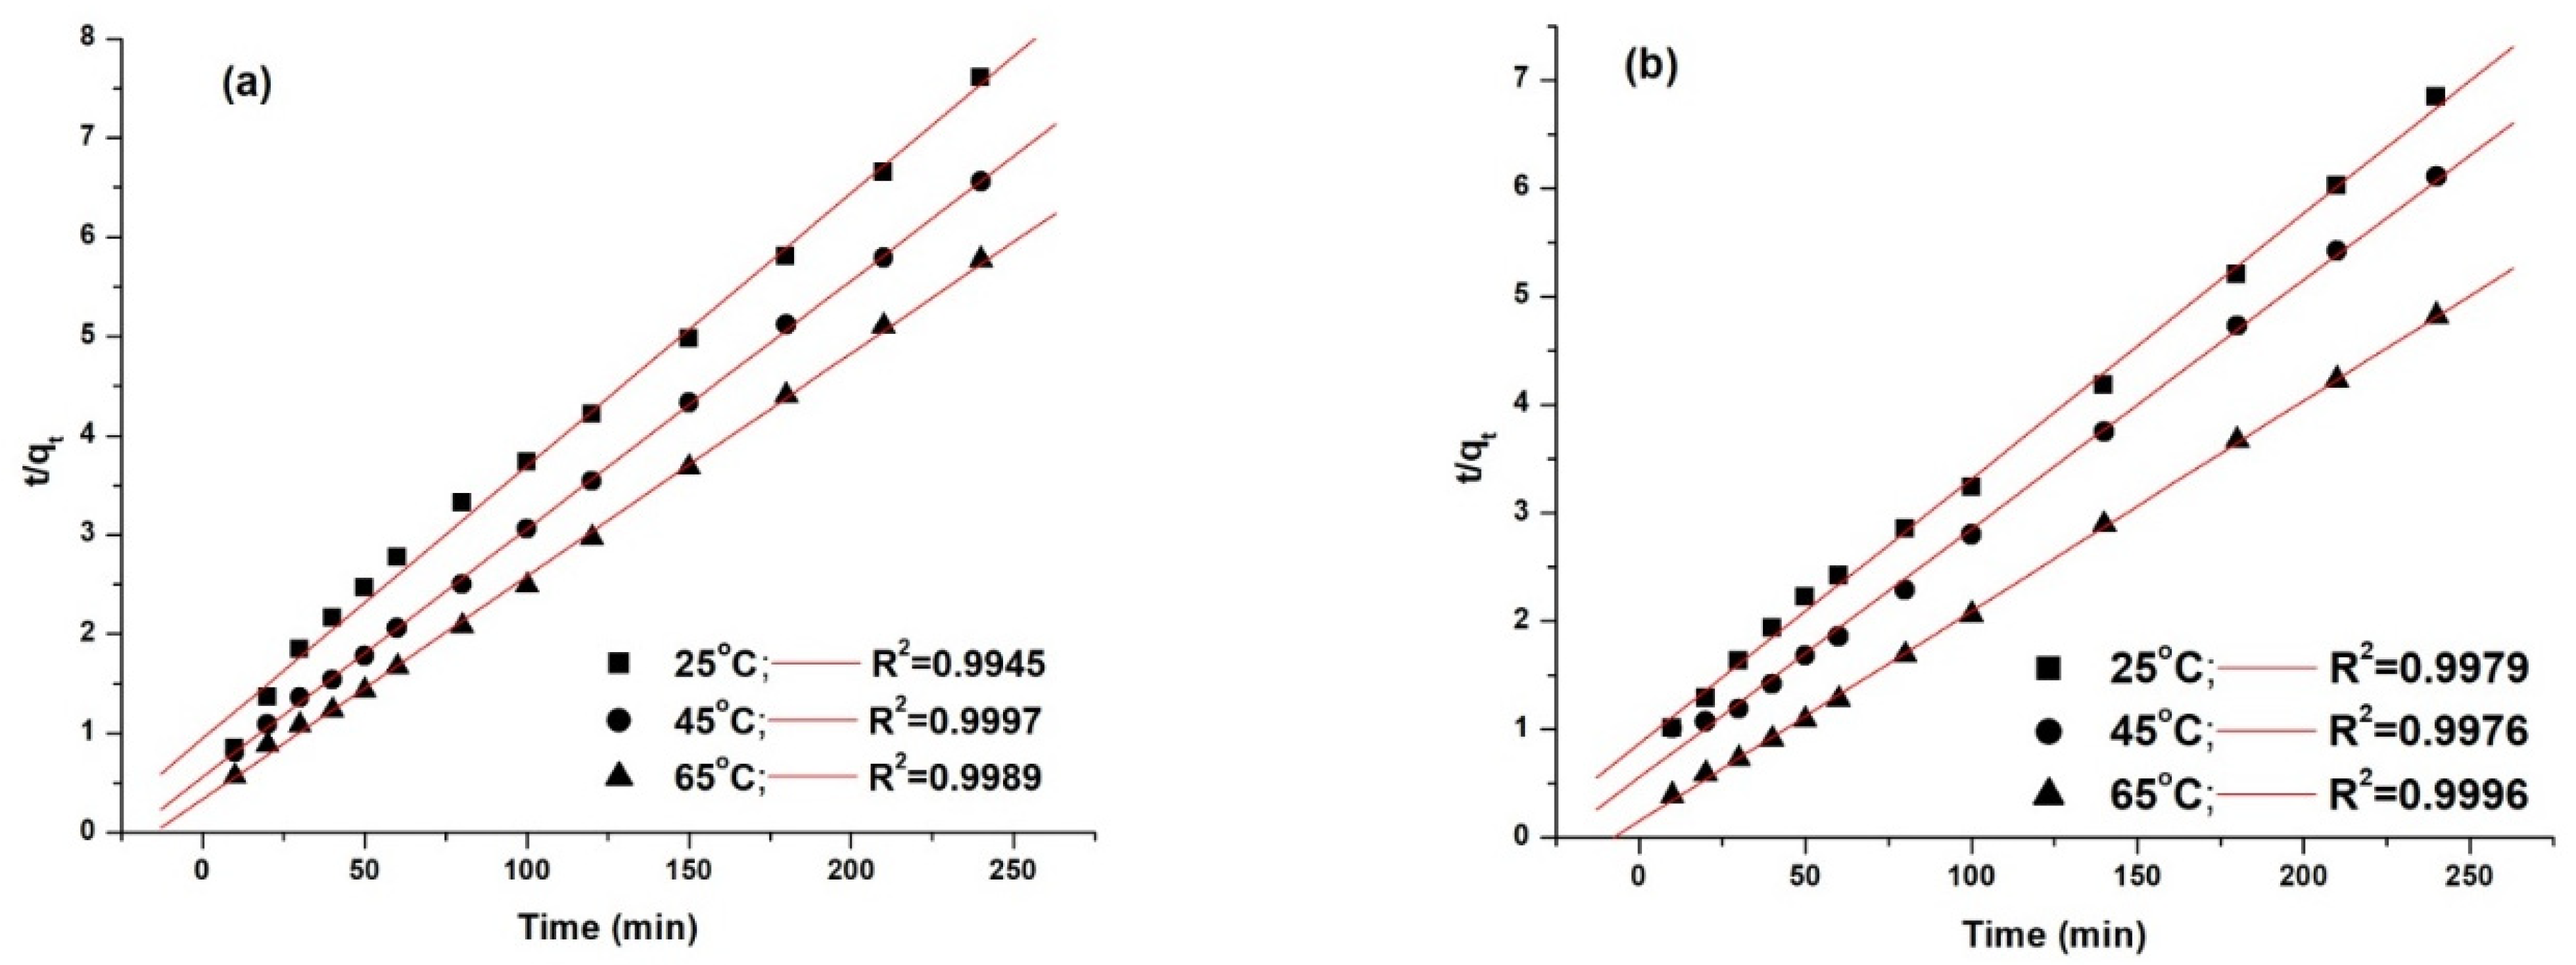
Figure 13.
Pseudo second-order kinetic model fitting for the adsorption of AY 42 (a) and AR 213 (b) onto PM4.
The statistical criteria used to determine the best fitting kinetic model were the standard deviation (SD) and the squared multiple regression coefficient (R2). The comparison of the experimental adsorption capacity values (obtained at different temperatures) with the computed results estimated from Equations (5) and (6) is presented in Table 8.
Table 8.
Kinetic parameters of studied models for adsorption of AY 42 and AR 213 onto PM4.
The best model that fitted the experimental data, as shown by the correlation coefficients (R2), was the pseudo second-order model. This was highlighted by the concordance between the values of the adsorption capacity determined experimentally (qe,exp) and the adsorption capacity calculated (qe,calc). As can be seen (Table 8), with an increasing temperature, the pseudo-second rate constant k2 increased, pointing out that the time required to reach the equilibrium decreased with increasing temperature—results that are in agreement with the experimental data.
3.4. Adsorption Isotherms
For a better understanding of the adsorption process, we carried out equilibrium adsorption studies. The experimental data obtained at equilibrium were correlated with the equations corresponding to the adsorption models—Freundlich (Equation (7)) [65] and Langmuir (Equation (8)) [66]—in order to establish the optimal model for the adsorption of the investigated dyes from the aqueous solutions.
where qe is the adsorption capacity at equilibrium (mg/g), KF is the Freundlich constant (mg/g(mg/L)−1/n), qm is the maximum adsorption capacity of the adsorbent (mg/g), KL is the Langmuir affinity constant (L/mg), Ce is the dye concentration at equilibrium (mg/L), and n is a constant (dimensionless).
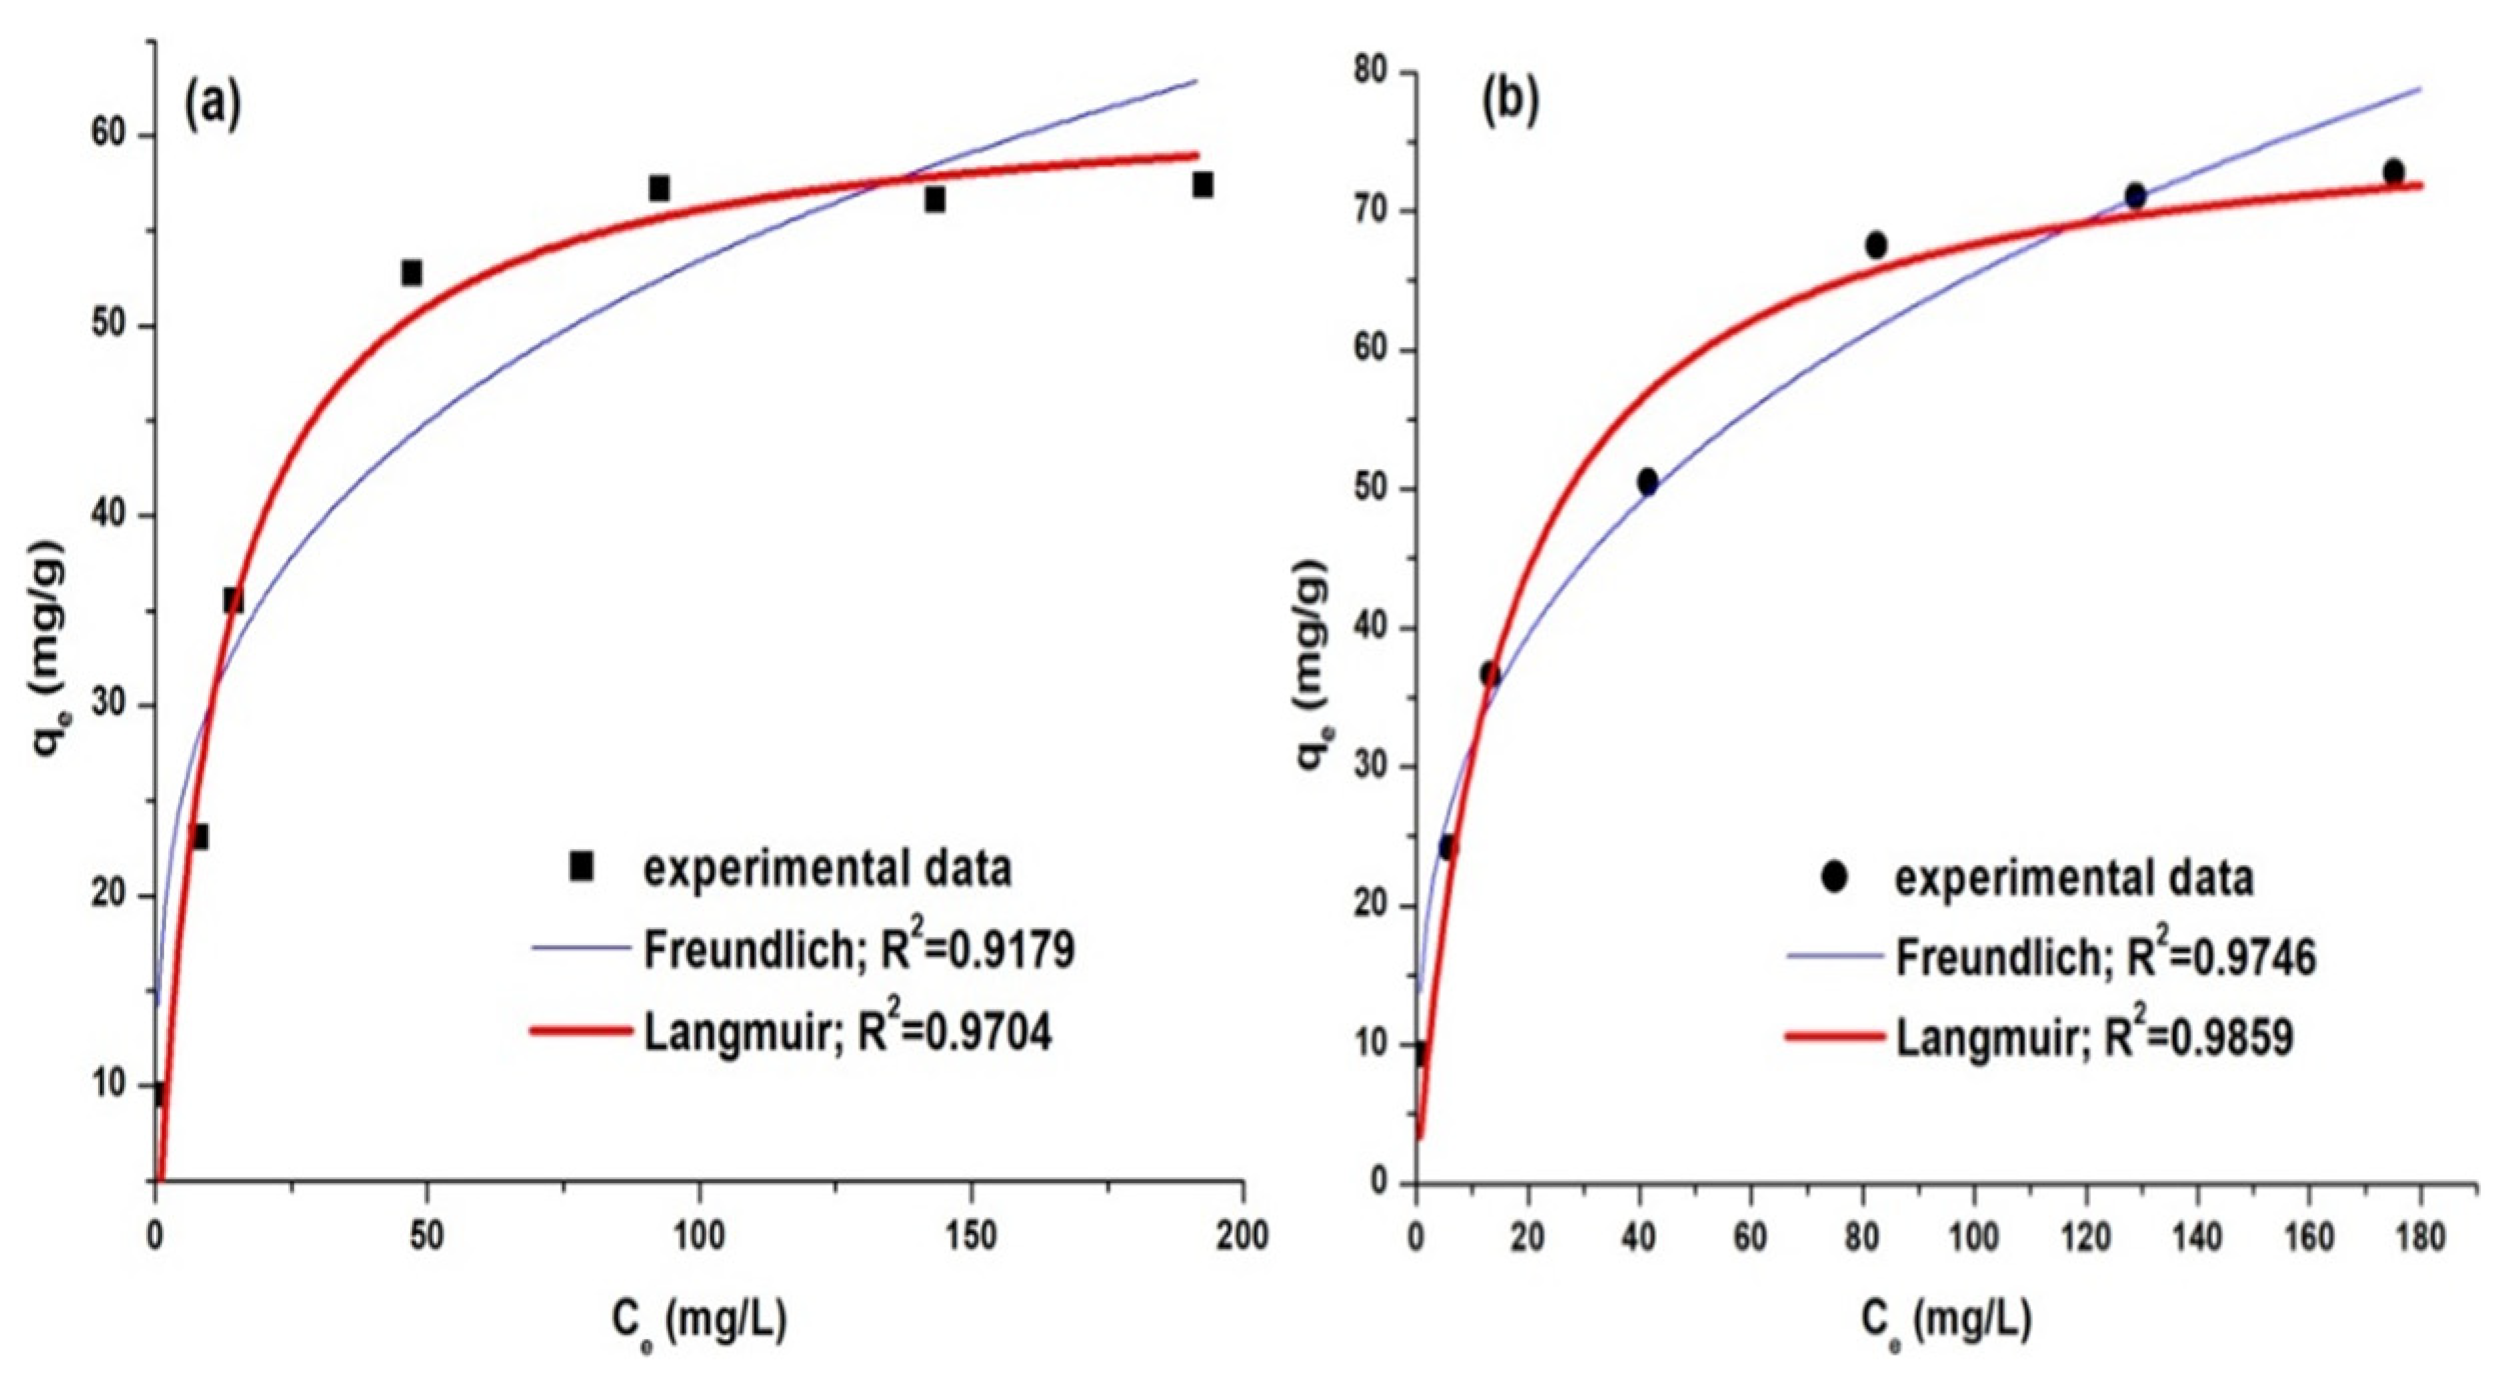
The analysis of the experimental data and the determination of the parameters from the equations that describe the theoretical models were performed by non-linear regression analysis. The statistical criteria for choosing the best model that fits with the experimental data were the chi-square analysis and the squared multiple regression coefficient (R2). The dependence qe = f(Ce) for the adsorption of anionic dyes on PM4 is presented in Figure 14.
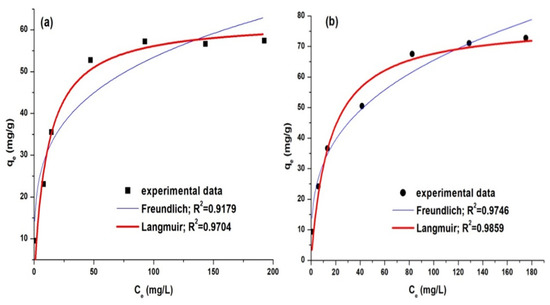
Figure 14.
Correlation of experimental data with adsorption isotherms for dye adsorption: AY 42 (a) and AR 213 (b).
The analysis of the statistical data performed on the results obtained indicates that the model that best fits the experimental data is the model described by the Langmuir isotherm. According to this model, the adsorption on PM4’s surface is localized, takes place on well-defined specific sites, and is monomolecular with a finite saturation limit. The parameters calculated for the isotherms model are presented in Table 9.
Table 9.
Isotherm coefficients for adsorption of AY 24 and AR 213 onto PM4.
From the Langmuir isotherm model, the maximum adsorption capacities of PM4 were determined to be 62.36 mg/g for AY 42 and 77.99 mg/g for AR 213. These results attest to the high adsorption capacity of the synthesized PM, an important property for the possible application of these sorbents on a large scale. The values of the maximum adsorption capacity reported in the literature for anionic dyes’ adsorption on magnetic nanocomposites are presented in Table 10. The results highlight the better performance obtained in this study.
Table 10.
Comparison of the maximum adsorption capacity of anionic dyes onto magnetic nanocomposites.
3.5. Thermodynamics of the Adsorption Process
The main thermodynamic parameters (free energy (ΔG°), enthalpy (ΔH°) and entropy (ΔS°)) for the adsorption process of AY 42 and AR 213 dyes were calculated using the results obtained for the Langmuir model.
The Gibb’s free energy (ΔG°) was calculated using the Equation (9),
and the enthalpy (ΔH°) and entropy (ΔS°) values for adsorption process were determined from the van’t Hoff Equation (10),
where R is the general gas constant (8.314 J/Kmol), T is the absolute temperature and KL is the Langmuir adsorption constant, obtained from the isotherm plots. The ΔH° and ΔS° parameters were evaluated from the slope and intercept of the linear plot of ΔG° versus T.
The results obtained for thermodynamic parameters are presented in Table 11.
Table 11.
Thermodynamic parameters for the adsorption of the investigated dyes on PM4.
The negative values of Gibb’s free energy (ΔG°) indicate that the adsorption process of the AY 42 and AR 213 dyes from aqueous solutions on PM4 was spontaneous [74]. The positive values of the enthalpy variation (ΔH°) reveal the endothermic nature of the adsorption process, and confirm the experimental results obtained from the influence of temperature study, which indicate that the adsorption capacity increases with increasing temperature [75]. The negative values of the entropy variation (ΔS°) that characterize the adsorption process suggest that the dye molecules decrease their randomness at the solid–liquid interface during the adsorption [76].
4. Conclusions
In this study, magnetic nanocomposites have been successfully prepared by a simple combustion method, confirmed by XRD, FT-IR spectroscopy, magnetic properties, N2 adsorption–desorption, TG/DSC and SEM analyses, and applied as an adsorbent for the removal of two anionic dyes (AY 42 and AR 213) from aqueous solutions. The removal efficiency of the investigated dyes decreased with an increase in the pH and increased with increasing adsorbent doses, initial dye concentrations and temperatures. The adsorption process can be performed under normal conditions (room temperature (25 °C) and natural solution pH (6.8 for AY 42 and 6.9 for AR 213)), which is important for possible large-scale applications. Kinetic studies revealed that the pseudo second-order model can better fit the experimental data, and the Langmuir isotherm model describes the adsorption process. The maximum adsorption capacity determined by the Langmuir model was 62.36 mg/g for AY 42 and 77.99 mg/g for AR 213, and the maximum removal efficiencies obtained under the optimum working conditions were 98.54% for AY 42 and 97.58% for AR 213. The thermodynamic parameters indicate that the adsorption of the anionic investigated dyes was a spontaneous and endothermic process, due to the positive ΔH° values and negative ΔG° values at the various temperatures investigated. The facile and economic synthesis method for adsorbents, which has a high adsorption capacity and magnetic separation efficiency, indicates that the as-prepared magnetic nanocomposites are promising adsorbent materials for the removal of dyes from aqueous solutions.
Author Contributions
Conceptualization, S.G.M. and L.C.; synthesis: M.-A.N. and R.I.; structural characterization: M.-A.N.; XRD: R.I.; FT-IR: R.R.; nitrogen adsorption–desorption: C.I.; adsorption studies: M.-A.N. and S.G.M.; supervision: S.G.M. and L.C.; writing—original draft preparation, M.-A.N., and R.R.; writing—review and editing, R.I. and S.G.M. All authors have read and agreed to the published version of the manuscript.
Funding
This research received no external funding.
Institutional Review Board Statement
Not applicable.
Informed Consent Statement
Not applicable.
Data Availability Statement
All the data is available within this manuscript.
Acknowledgments
This work was supported by Program No. 2 of “Coriolan Drăgulescu” Institute of Chemistry. The authors would like to thank Aurel Ercuta from West University of Timisoara, Romania for magnetic measurements, Cornelia Pacurariu from Politehnica University Timișoara for TG/DSC analysis, and Paula Sfârloagă from National Institute for Research and Development in Electrochemistry and Condensed Matter, Timisoara for the SEM analyses for investigated magnetic nanocomposite.
Conflicts of Interest
The authors declare no conflict of interest.
References
- Mani, S.; Chowdhary, P.; Bharagava, R.N. Chapter 11: Textile Wastewater Dyes: Toxicity Profile and Treatment Approaches. In Emerging and Eco-Friendly Approaches for Waste Management; Bharagava, R.N., Chowdhary, P., Eds.; Springer Nature Singapore Pte Ltd.: Singapore, 2019; pp. 219–244. [Google Scholar] [CrossRef]
- Samsami, S.; Mohamadizaniani, M.; Sarrafzadeh, M.-H.; Rene, E.R.; Firoozbahr, M. Recent advances in the treatment of dye-containing wastewater from textile industries: Overview and perspectives. Process. Saf. Environ. Prot. 2020, 143, 138–163. [Google Scholar] [CrossRef]
- Lellis, B.; Fávaro-Polonio, C.Z.; Pamphile, J.A.; Polonio, J.C. Effects of textile dyes on health and the environment and bioremediation potential of living organisms. Biotechnol. Res. Innov. 2019, 3, 275–290. [Google Scholar] [CrossRef]
- Pereira, L.; Alves, M. Chapter 4: Dyes—Environmental Impact and Remediation. In Environmental Protection Strategies for Sustainable Development, Strategies for Sustainability; Malik, A., Grohmann, E., Eds.; Springer Science + Business Media B.V.: Dordrecht, The Netherlands, 2012; pp. 111–154. [Google Scholar]
- Al Prol, A.E. Study of Environmental Concerns of Dyes and Recent Textile Effluents Treatment Technology: A Review. Asian J. Fish. Aquat. Res. 2019, 1–18. [Google Scholar] [CrossRef]
- Toprak, T.; Anis, P. Textile Industry’s Environmental Effects and Approaching Cleaner Production and Sustainability: An Overview. J. Text. Eng. Fash. Technol. 2017, 2, 1–16. [Google Scholar] [CrossRef] [Green Version]
- An, S.; Liu, X.; Yang, L.; Zhang, L. Enhancement removal of crystal violet dye using magnetic calcium ferrite nanoparticle: Study in single- and binary-solute systems. Chem. Eng. Res. Des. 2014, 94, 726–735. [Google Scholar] [CrossRef]
- Yang, S.; Wu, Z.; Huang, L.; Zhou, B.; Lei, M.; Sun, L.; Tian, Q.; Pan, J.; Wu, W.; Zhang, H. Significantly enhanced dye removal performance of hollow tin oxide nanoparticles via carbon coating in dark environment and study of its mechanism. Nanoscale Res. Lett. 2014, 9, 442. [Google Scholar] [CrossRef] [Green Version]
- Zhou, Z.; Lin, S.; Yue, T.; Lee, T.-C. Adsorption of food dyes from aqueous solution by glutaraldehyde cross-linked magnetic chitosan nanoparticles. J. Food Eng. 2014, 126, 133–141. [Google Scholar] [CrossRef]
- Mohamed, A.H.; Ahmed El, N. Health and Environmental Impacts of Dyes: Mini Review. Am. J. Environ. Sci. 2017, 1, 64–67. [Google Scholar] [CrossRef]
- Manzoor, J.; Sharma, M. Chapter 8: Impact of Textile Dyes on Human Health and Environment. In Impact of Textile Dyes on Public Health and the Environment; IGI Global: Hershey, PA, USA, 2020; pp. 162–170. [Google Scholar]
- Ismail, M.; Akhtar, K.; Khan, M.; Kamal, T.; Asiri, A.M.; Seo, J.; Khan, S.B. Pollution, Toxicity and Carcinogenicity of Organic Dyes and their Catalytic Bio-Remediation. Curr. Pharm. Des. 2019, 25, 3645–3663. [Google Scholar] [CrossRef]
- Katheresan, V.; Kansedo, J.; Lau, S.Y. Efficiency of various recent wastewater dye removal methods: A review. J. Environ. Chem. Eng. 2018, 6, 4676–4697. [Google Scholar] [CrossRef]
- Muntean, S.G.; Nistor, M.A.; Muntean, E.; Todea, A.; Ianoș, R.; Păcurariu, C. Removal of Colored Organic Pollutants from Wastewaters by Magnetite/Carbon Nanocomposites: Single and Binary Systems. J. Chem. 2018, 2018, 1–16. [Google Scholar] [CrossRef] [Green Version]
- Kuang, Y.; Zhang, X.; Zhou, S. Adsorption of Methylene Blue in Water onto Activated Carbon by Surfactant Modification. Water 2020, 12, 587. [Google Scholar] [CrossRef] [Green Version]
- Yagub, M.T.; Sen, T.K.; Afroze, S.; Ang, H. Dye and its removal from aqueous solution by adsorption: A review. Adv. Colloid Interface Sci. 2014, 209, 172–184. [Google Scholar] [CrossRef] [PubMed]
- Garrido-Cardenas, J.A.; Esteban-García, B.; Agüera, A.; Sánchez-Pérez, J.A.; Manzano-Agugliaro, F. Wastewater Treatment by Advanced Oxidation Process and Their Worldwide Research Trends. Int. J. Environ. Res. Public Health 2019, 17, 170. [Google Scholar] [CrossRef] [Green Version]
- Lin, L.; Jiang, W.; Chen, L.; Xu, P.; Wang, H. Treatment of Produced Water with Photocatalysis: Recent Advances, Affecting Factors and Future Research Prospects. Catalysts 2020, 10, 924. [Google Scholar] [CrossRef]
- Rashidi, H.R.; Sulaiman, N.M.N.; Hashim, N.A.; Hassan, C.R.C.; Ramli, M.R. Synthetic reactive dye wastewater treatment by using nano-membrane filtration. Desalin. Water Treat. 2014, 55, 86–95. [Google Scholar] [CrossRef] [Green Version]
- Das, K.C.; Das, B.; Dhar, S.S. Effective Catalytic Degradation of Organic Dyes by Nickel Supported on Hydroxyapatite-Encapsulated Cobalt Ferrite (Ni/HAP/CoFe2O4) Magnetic Novel Nanocomposite. Water Air Soil Pollut. 2020, 231, 1–13. [Google Scholar] [CrossRef]
- Gadekar, M.R.; Ahammed, M.M. Coagulation/flocculation process for dye removal using water treatment residuals: Modelling through artificial neural networks. Desalin. Water Treat. 2016, 57, 26392–26400. [Google Scholar] [CrossRef]
- Abid, M.F.; Zablouk, M.A.; Abid-Alameer, A.M. Experimental study of dye removal from industrial wastewater by membrane technologies of reverse osmosis and nanofiltration. Iran. J. Environ. Health Sci. Eng. 2012, 9, 17. [Google Scholar] [CrossRef] [PubMed] [Green Version]
- Jamee, R.; Siddique, R. Biodegradation of synthetic dyes of textile effluent by microorganisms: An environmentally and economically sustainable approach. Eur. J. Microbiol. Immunol. 2019, 9, 114–118. [Google Scholar] [CrossRef]
- Crini, G.; Lichtfouse, E. Advantages and disadvantages of techniques used for wastewater treatment. Environ. Chem. Lett. 2018, 17, 145–155. [Google Scholar] [CrossRef]
- Crini, G.; Lichtfouse, E. Chapter1: Wastewater Treatment: An Overview. In Green Adsorbents for Pollutant Removal, Environmental Chemistry for a Sustainable World; Springer Nature: Cham, Switzerland, 2018; Volume 18, pp. 1–21. [Google Scholar] [CrossRef]
- Corda, N.C.; Kini, M.S. A Review on Adsorption of Cationic Dyes using Activated Carbon. MATEC Web Conf. 2018, 144, 02022. [Google Scholar] [CrossRef]
- Abukhadra, M.R.; Mohamed, A.S. Adsorption Removal of Safranin Dye Contaminants from Water Using Various Types of Natural Zeolite. Silicon 2018, 11, 1635–1647. [Google Scholar] [CrossRef]
- Nicola, R.; Costişor, O.; Muntean, S.G.; Nistor, M.-A.; Putz, A.-M.; Ianăşi, C.; Lazău, R.; Almasy, L.; Săcărescu, L. Mesoporous magnetic nanocomposites: A promising adsorbent for the removal of dyes from aqueous solutions. J. Porous Mater. 2019, 27, 413–428. [Google Scholar] [CrossRef]
- Nistor, M.A.; Muntean, S.G.; Maranescu, B.; Visa, A. Phosphonate metal–organic frameworks used as dye removal materials from wastewaters. Appl. Organomet. Chem. 2020, 34. [Google Scholar] [CrossRef]
- Şen, F.; Demirbaş, Ö.; Çalımlı, M.H.; Aygun, A.; Alma, M.H.; Nas, M.S. The dye removal from aqueous solution using polymer composite films. Appl. Water Sci. 2018, 8, 206. [Google Scholar] [CrossRef] [Green Version]
- Adegoke, K.A.; Bello, O.S. Dye sequestration using agricultural wastes as adsorbents. Water Resour. Ind. 2015, 12, 8–24. [Google Scholar] [CrossRef] [Green Version]
- Ge, M.; Xi, Z.; Zhu, C.; Liang, G.; Hu, G.; Jamal, L.; Alam, S.M.J. Preparation and Characterization of Magadiite–Magnetite Nanocomposite with Its Sorption Performance Analyses on Removal of Methylene Blue from Aqueous Solutions. Polymers 2019, 11, 607. [Google Scholar] [CrossRef] [PubMed] [Green Version]
- Ianos, R.; Păcurariu, C.; Muntean, S.G.; Muntean, E.; Nistor, M.A.; Nižňanský, D. Combustion synthesis of iron oxide/carbon nanocomposites, efficient adsorbents for anionic and cationic dyes removal from wastewaters. J. Alloy. Compd. 2018, 741, 1235–1246. [Google Scholar] [CrossRef]
- Liu, Y.; Huang, Y.; Xiao, A.; Qiu, H.; Liu, L. Preparation of Magnetic Fe3O4/MIL-88A Nanocomposite and Its Adsorption Properties for Bromophenol Blue Dye in Aqueous Solution. Nanomaterials 2019, 9, 51. [Google Scholar] [CrossRef] [Green Version]
- Muntean, S.G.; Nistor, M.A.; Ianos, R.; Păcurariu, C.; Căpraru, A.; Surdu, V.-A. Combustion synthesis of Fe3O4/Ag/C nanocomposite and application for dyes removal from multicomponent systems. Appl. Surf. Sci. 2019, 481, 825–837. [Google Scholar] [CrossRef]
- Parashar, M.; Shukla, V.K.; Singh, R. Metal oxides nanoparticles via sol–gel method: A review on synthesis, characterization and applications. J. Mater. Sci. Mater. Electron. 2020, 31, 3729–3749. [Google Scholar] [CrossRef]
- Luo, S.; Wang, R.; Yin, J.; Jiao, T.; Chen, K.; Zou, G.; Zhang, L.; Zhou, J.; Zhang, L.; Peng, Q. Preparation and Dye Degradation Performances of Self-Assembled MXene-Co3O4 Nanocomposites Synthesized via Solvothermal Approach. ACS Omega 2019, 4, 3946–3953. [Google Scholar] [CrossRef] [Green Version]
- Chen, M.; Shao, L.-L.; Li, J.-J.; Pei, W.-J.; Chen, M.-K.; Xie, X.-H. One-step hydrothermal synthesis of hydrophilic Fe3O4/carbon composites and their application in removing toxic chemicals. RSC Adv. 2016, 6, 35228–35238. [Google Scholar] [CrossRef]
- Alotaibi, N.; Hammud, H.H.; Karnati, R.K.; Hussain, S.G.; Mazher, J.; Prakasam, T. Cobalt–carbon/silica nanocomposites prepared by pyrolysis of a cobalt 2,2′-bipyridine terephthalate complex for remediation of cationic dyes. RSC Adv. 2020, 10, 17660–17672. [Google Scholar] [CrossRef]
- Yazdani, F.; Seddigh, M. Magnetite nanoparticles synthesized by co-precipitation method: The effects of various iron anions on specifications. Mater. Chem. Phys. 2016, 184, 318–323. [Google Scholar] [CrossRef]
- Păcurariu, C.; Paşka, O.; Ianoş, R.; Muntean, S.G. Effective removal of methylene blue from aqueous solution using a new magnetic iron oxide nanosorbent prepared by combustion synthesis. Clean Technol. Environ. Policy 2015, 18, 705–715. [Google Scholar] [CrossRef]
- Ianos̗, R.; Păcurariu, C.; Mihoc, G. Magnetite/carbon nanocomposites prepared by an innovative combustion synthesis technique—Excellent adsorbent materials. Ceram. Int. 2014, 40, 13649–13657. [Google Scholar] [CrossRef]
- Mihoc, G.; Ianos, R.; Păcurariu, C.; Lazău, I. Combustion synthesis of some iron oxides used as adsorbents for phenol and p-chlorophenol removal from wastewater. J. Therm. Anal. Calorim. 2012, 112, 391–397. [Google Scholar] [CrossRef]
- Ercuta, A.; Chirita, M. Highly crystalline porous magnetite and vacancy-ordered maghemite microcrystals of rhombohedral habit. J. Cryst. Growth 2013, 380, 182–186. [Google Scholar] [CrossRef]
- Rodrigues, S.C.; Silva, M.C.; Torres, J.A.; Bianchi, M.L. Use of Magnetic Activated Carbon in a Solid Phase Extraction Procedure for Analysis of 2,4-dichlorophenol in Water Samples. Water Air Soil Pollut. 2020, 231, 1–13. [Google Scholar] [CrossRef]
- Torres, J.; Silva, M.; Lopes, J.H.; Nogueira, A.; Nogueira, F.; Corrêa, A. Development of a reusable and sustainable biocatalyst by immobilization of soybean peroxidase onto magnetic adsorbent. Int. J. Biol. Macromol. 2018, 114, 1279–1287. [Google Scholar] [CrossRef]
- Amargeetha, A.; Velavan, S. X-ray Diffraction (XRD) and Energy Dispersive Spectroscopy (EDS) Analysis of Silver Nanoparticles Synthesized from Erythrina Indica Flowers. Nanosci. Technol. Open Access 2018, 5, 1–5. [Google Scholar] [CrossRef]
- Liese, H.C. Mineralogical notes. An infrared absorption analysis of magnetite. Am. Mineral. 1967, 52, 1198–1205. [Google Scholar]
- Kim, K.D.; Kim, S.S.; Choa, Y.H.; Kim, H.T. Formation and surface modification of Fe3O4 nanoparticles by co-precipitation and sol–gel method. J. Ind. Eng. Chem. 2007, 13, 1137–1141. [Google Scholar]
- Kahani, S.A.; Hamadanian, M.; Vandadi, O. Deposition of Magnetite Nanoparticles in Activated Carbons and Preparation of Magnetic Activated Carbons. AIP Conf. Proc. 2007, 929, 183–188. [Google Scholar] [CrossRef] [Green Version]
- Fuente, E.; Menéndez, J.A.; Diez, M.A.; Suarez, D.; Montes-Moran, M.A. Infrared Spectroscopy of Carbon Materials: A Quantum Chemical Study of Model Compounds. J. Phys. Chem. B 2003, 107, 6350–6359. [Google Scholar] [CrossRef]
- Yang, C.; Wöll, C. IR spectroscopy applied to metal oxide surfaces: Adsorbate vibrations and beyond. Adv. Phy. X 2017, 2, 373–408. [Google Scholar] [CrossRef]
- Li, Y.-S.; Church, J.S.; Woodhead, A. Infrared and Raman spectroscopic studies on iron oxide magnetic nano-particles and their surface modifications. J. Magn. Magn. Mater. 2012, 324, 1543–1550. [Google Scholar] [CrossRef]
- Shepel, D.; Goreacioc, T.; Lupascu, T.; Filippov, M.; Rusu, M. Method of Infrared Spectra Registration of Activated Carbons in Potassium Bromide Pellets. Chem. J. Mold. 2015, 10, 113–115. [Google Scholar] [CrossRef]
- Zawadzki, J. Infrared spectroscopy in surface chemistry of carbons. In Chemistry and Physics of Carbon; Thrower, P.A., Ed.; Marcel Dekker: New York, NY, USA, 1989; Volume 21, pp. 147–380. [Google Scholar]
- Thommes, M.; Kaneko, K.; Neimark, A.V.; Olivier, J.P.; Rodriguez-Reinoso, F.; Rouquerol, J.; Sing, K.S. Physisorption of gases, with special reference to the evaluation of surface area and pore size distribution (IUPAC Technical Report). Pure Appl. Chem. 2015, 87, 1051–1069. [Google Scholar] [CrossRef] [Green Version]
- Alhujaily, A.; Yu, H.; Zhang, X.; Ma, F. Adsorptive removal of anionic dyes from aqueous solutions using spent mushroom waste. Appl. Water Sci. 2020, 10, 1–12. [Google Scholar] [CrossRef]
- Nazir, R.; Khan, M.; Rehman, R.U.; Shujah, S.; Khan, M.; Ullah, M.; Zada, A.; Mahmood, N.; Ahmad, I. Adsorption of selected azo dyes from an aqueous solution by activated carbon derived from Monotheca buxifolia waste seeds. Soil Water Res. 2020, 15, 166–172. [Google Scholar] [CrossRef]
- Muntean, S.G.; Rădulescu-Grad, M.E.; Sfarloaga, P. Dye adsorbed on copolymer, possible specific sorbent for metal ions removal. RSC Adv. 2014, 4, 27354–27362. [Google Scholar] [CrossRef]
- Muntean, S.G.; Paska, O.; Coseri, S.; Simu, G.M.; Grad, M.E.; Ilia, G. Evaluation of a functionalized copolymer as adsorbent on direct dyes removal process: Kinetics and equilibrium studies. J. Appl. Polym. Sci. 2012, 127, 4409–4421. [Google Scholar] [CrossRef]
- Muntean, S.G.; Szabadai, Z.; Halip, L. Investigation of aggregation behavior using computational methods and absorption spectra for trisazo direct dyes. Struct. Chem. 2015, 27, 1049–1059. [Google Scholar] [CrossRef]
- Muntean, S.G.; Simu, G.M.; Kurunczi, L.; Szabadai, Z. Investigation of the aggregation of three disazo direct dyes by UV-Vis Spectroscopy and mathematical analysis. Rev. Chim. (Buchar.) 2009, 60, 152–156. [Google Scholar]
- Lagergren, S. Zur theorie der sogenannten adsorption geloster stoffe. K.-Sven. Vetenskapsakademiens Handl. 1898, 24, 1–39. [Google Scholar]
- Ho, Y.; McKay, G. Pseudo-second order model for sorption processes. Process. Biochem. 1999, 34, 451–465. [Google Scholar] [CrossRef]
- Freundlich, H.M.F. Over the Adsorption in Solution. J. Phys. Chem. 1906, 57, 385–471. [Google Scholar]
- Langmuir, I. The Adsorption of Gases on Plane Surfaces of Glass, Mica and Platinum. J. Am. Chem. Soc. 1918, 40, 1361–1403. [Google Scholar] [CrossRef] [Green Version]
- Moeinpour, F.; Alimoradi, A.; Kazemi, M. Efficient removal of Eriochrome black-T from aqueous solution using NiFe2O4 magnetic nanoparticles. J. Environ. Health Sci. Eng. 2014, 12, 1–7. [Google Scholar] [CrossRef] [Green Version]
- Konicki, W.; Hełminiak, A.; Arabczyk, W.; Mijowska, E. Removal of anionic dyes using magnetic Fe@graphite core-shell nanocomposite as an adsorbent from aqueous solutions. J. Colloid Interface Sci. 2017, 497, 155–164. [Google Scholar] [CrossRef] [PubMed]
- Gul, K.; Sohni, S.; Waqar, M.; Ahmad, F.; Norulaini, N.N.; Omar, A.K.M. Functionalization of magnetic chitosan with graphene oxide for removal of cationic and anionic dyes from aqueous solution. Carbohydr. Polym. 2016, 152, 520–531. [Google Scholar] [CrossRef]
- Yao, Y.; Miao, S.; Liu, S.; Ma, L.P.; Sun, P.H.; Wang, S. Synthesis, characterization, and adsorption properties of magnetic Fe3O4@graphene nanocomposite. Chem. Eng. J. 2011, 184, 326–332. [Google Scholar] [CrossRef]
- Nourmoradi, H.; Ghiasvand, A.; Noorimotlagh, Z. Removal of methylene blue and acid orange 7 from aqueous solutions by activated carbon coated with zinc oxide (ZnO) nanoparticles: Equilibrium, kinetic, and thermodynamic study. DESALINATION Water Treat. 2014, 55, 252–262. [Google Scholar] [CrossRef]
- Mahmoodi, N.M.; Abdi, J.; Bastani, D. Direct dyes removal using modified magnetic ferrite nanoparticle. J. Environ. Health Sci. Eng. 2014, 12, 96. [Google Scholar] [CrossRef] [PubMed] [Green Version]
- Paşka, O.; Ianos, R.; Păcurariu, C.; Brădeanu, A. Magnetic nanopowder as effective adsorbent for the removal of Congo Red from aqueous solution. Water Sci. Technol. 2013, 69, 1234–1240. [Google Scholar] [CrossRef]
- Gao, S.; Zhang, W.; An, Z.; Kong, S.; Chen, D. Adsorption of anionic dye onto magnetic Fe3O4/CeO2 nanocomposite: Equilibrium, kinetics, and thermodynamics. Adsorpt. Sci. Technol. 2019, 37, 185–204. [Google Scholar] [CrossRef] [Green Version]
- Idan, I.J.; Abdullah, L.C.; Choong, T.S.; Jamil, S.N.A.B.M. Equilibrium, kinetics and thermodynamic adsorption studies of acid dyes on adsorbent developed from kenaf core fiber. Adsorpt. Sci. Technol. 2017, 36, 694–712. [Google Scholar] [CrossRef]
- Kakavandi, B.; Jonidi, A.; Rezaei, R.; Nasseri, S.; Ameri, A.; Esrafily, A. Synthesis and properties of Fe3O4-activated carbon magnetic nanoparticles for removal of aniline from aqueous solution: Equilibrium, kinetic and thermodynamic studies. Iran. J. Environ. Health Sci. Eng. 2013, 10, 19. [Google Scholar] [CrossRef] [PubMed] [Green Version]


Publisher’s Note: MDPI stays neutral with regard to jurisdictional claims in published maps and institutional affiliations. |
© 2021 by the authors. Licensee MDPI, Basel, Switzerland. This article is an open access article distributed under the terms and conditions of the Creative Commons Attribution (CC BY) license (https://creativecommons.org/licenses/by/4.0/).