1. Introduction
The energy sector is undergoing a profound change aimed at drastically reducing CO
2 emissions. Changes are concentrated on research into new methods of energy generation, modernisation, and digitisation of conventional supply networks, as well as concentrated on the development of systems that enable consumer participation. In this transition to a distributed generation system, digitalisation at scale plays a key role. This transformation will allow for the intelligent optimisation of energy production; the rapid detection of energy supply problems; and the reduction of losses with permanent perimeter management and operation. Edge-Cloud Computing [
1] techniques combined with fibre-optic communications are commonly used for the instantaneous detection of disturbances, ensuring early responses in restoring power supplies. This paper proposes a hybrid Edge-Cloud Computing framework that satisfies the delay requirements associated with time-critical applications based primarily on phasor measurement unit (PMU) measurements, establishing a framework that allows for the minimisation of delays associated with the transfer of information. In this proposal, the capabilities of the PMU are extended to the synchronisation and simultaneous capture of other magnitudes measured inside the plants and not only in the power distribution lines.
PMUs play an essential role in this process. More specifically, micro-phasor measurement units (µPMU) [
2] allow for an analysis with a much higher time resolution, revealing voltage fluctuations in great detail. In addition, they allow the transmission of up to 120 phasors per second. A paper published in 2018 [
2] explained the importance of maintaining a balance between the temporal resolution of the measurements and the volume of data that can be stored to detect and analyse the propagation of transients in the distribution network; however, it did not include a technological solution. It is necessary to apply Edge-Cloud computing techniques to detect events with Edge-Signal processing and to store only the required information when each event occurs, as proposed in a publication in 2021 [
1]. Keeping a history with such a high resolution is a problem because of the need to manage massive databases.
In this context, there is a need for technologies that allow for a digitisation of energy based on quality standards considering the need for very high-quality synchronisation. The various monitoring systems for the management of energy generation and consumption in a given geographical area must be able to detect the origin of a disturbance, analyse its propagation, and determine the areas with supplies that may be affected [
3,
4]. The aim is to ensure accurate control of the bi-directional flow of energy by allowing different generation systems to cooperate and compensate for imbalances due to intermittent generation or fluctuating demand. These two publications highlight the importance of the instantaneous detection of disturbances in the grid as well as the need to know the origin of these disturbances. The current scenario of the insertion of renewable resources into the electricity grid, such as through photovoltaics (PV) plants, can cause electricity disturbances. Extending the capabilities of a µPMU to coordinate the capture of events inside the plant would facilitate the detection of the origin of each disturbance.
IEEE bus models contribute to the study of load flows [
5] and the Time-Sensitive Networking (TSN) standard allows for the synchronisation of the capture of critical events with equipment connected to a conventional Ethernet infrastructure. In this context, this research is justified to establish a reference framework of such high quality that allows it to work simultaneously with models of the distribution network and with real data from various installations [
6]. The aim is to facilitate fault diagnosis and to analyse the propagation of faults in distribution networks. The future objective of this research is to maintain a data flow between the physical and the synthetic installation in both a deterministic way and in real-time. Using Hardware-In-the-Loop (HIL), models can evolve with latencies in line with the installation. This type of technology is becoming increasingly relevant for the development of digital twins [
7]. It is in a constant process of development in the energy sector [
8].
With the Network Time Protocol (NTP), it is possible to synchronise the clocks of any monitoring system with one of the many existing NTP servers based on the Coordinated Universal Time (UTC). Currently, with NTP v4, it is possible to achieve synchronisation levels close to 10 ms. Conversely, with the PTP v2 protocol, uncertainty levels of less than 1 ms are achieved and it is specially designed for distributed synchronisation in industrial applications [
9]. Despite these improvements, with these uncertainty levels, it is not feasible to coordinate a simultaneous capture for distributed acquisition systems. In contrast, with the TSN standard, simultaneous sampling in distributed systems is possible since the clocks would be synchronised with uncertainty levels below 100 ns.
This paper evaluates a new alternative to the various existing proposals [
10,
11] to extend very high-quality synchronism from µPMUs to other equipment to correlate events inside the generation facility, with disturbances propagating in the network. To achieve this objective, a technological improvement of µPMUs is proposed with the integration of synchronism based on TSN. It is an alternative to other proposals that use other options such as Multi-level Time-Sensitive Networking (mTSN) [
12].
Subsequently, storage in a local database to facilitate Edge-Cloud Computing is proposed [
1]. Furthermore, this method can contribute to the coordinated management of small “power plants” so these can cooperate, acting as a single generation system.
With these expectations, the µPMU [
13,
14] will serve to maintain a single high-quality time reference frame. The µPMU will act as a TSN master to extend the synchronism to the rest of the measurement systems. The technical feasibility of this method must be assessed according to the specifications of IEEE C37.118.1a-2014 [
15], which relaxes the requirements concerning the general specifications for phasor monitoring [
16], as included in IEEE C37.118.1-2011 [
16]. There is a methodology in the µPMU System Calibration and Test Guide for Power System Protection and Control [
17] that allows for the verification of the feasibility of the proposed distributed synchronisation system. This guide is based on the IEEE Std C37.238™2011 standard that focuses on defining the specifications of the IEEE 1588–2008 standard [
18] for use in power systems. It is an appropriate guideline for this work considering that the IEEE 802.1AS-2011 [
19] standard is based on the previous one.
As a solution for the digitisation of PV plants with distributed synchronism, the PV installations would be managed by a TSN master integrated as part of the µPMU. The monitoring of the PV plant could be managed as a stand-alone system in a local area sub-network. For example, when running the IEEE 802.1AS profile in one of the subsystems, the devices that carry out the measurements and critical control take advantage of the TSN synchronisation, while the subsystems with non-critical tasks do not work with this synchronisation but share the same gateways.
National Instrument (NI) compactDAQ devices are suitable for building high-quality distributed measurement systems with in-line topology. They are not only compatible with the standard but they also include a switch with two TSN Ethernet ports for easy connection. Furthermore, the TSN standard is evaluated for its ability to achieve the accuracy required by µPMUs for phase measurements.
In this new scenario, it is common to see PV plants constituted by the aggregation of micro-plants with the participation of several owners. Based on this, the distributed metering system would be deployed in an existing PV plant, located in the town of Pozoblanco (Córdoba, Spain) [
20]. It is a plant with a total generation of 4 MW, with four transformation centres (CT) connected to the distribution network. Each sector has a nominal power capacity of 1 MW, which are each further partly divided into 50 or 100 kW sectors. The objective is to measure the entire production with a multi-bus metering system. Simultaneous capture of three-phase voltages and currents at the four CTs located at distances of 15 m from CT1 to CT2, 15 m from CT3 to CT4, and 150 m from CT1 to CT3 are required.
Figure 1 shows the distribution of the four cDAQ acquisition systems that carry out the irradiance measurements, with a mesh distribution to cover the whole plant.
In short, the architecture of the system under evaluation is divided into three operation areas: the area dedicated to irradiance measurements located in strategic positions along the surface of the plant, with connections (4–20 mA) to minimize losses associated with the length of the conductors; the area associated with power quality (PQ) measurements located in each of the CT distribution centres; and the area where the µPMUs that carry out the system synchronisation would be located. TSN synchronism would be essential to guarantee the simultaneous capture of all samples deriving from the four cDAQs. Each cDAQ would capture the samples from the eight pyranometers in its sector and would act as a PQ in each CT sector. The distributed measurements in each 1 MW sector with TSN technology would allow for the aligning of samples, with the quality analysed in the following sections of this work. In addition to the three areas described above, there would be an area dedicated to data collection in a local database. It is an important task to decide which resolution is the most appropriate to store the time series based on the needs of the research. This storage would be done locally at a higher resolution and then would be transmitted to a global database in the cloud.
The rest of the article is organised as follows.
Section 2 presents the methodology used for the analysis of the improved µPMU architecture and the experimental procedure for the estimation of the synchronism level achieved with the TSN standard in an in-line topology with two and four distributed capture systems.
Section 3 shows and discusses the statistical results obtained, while
Section 4 presents the conclusions.
2. Materials and Methods
Basically, based on the infrastructure explained in the previous section, two types of tests with different settings were carried out.
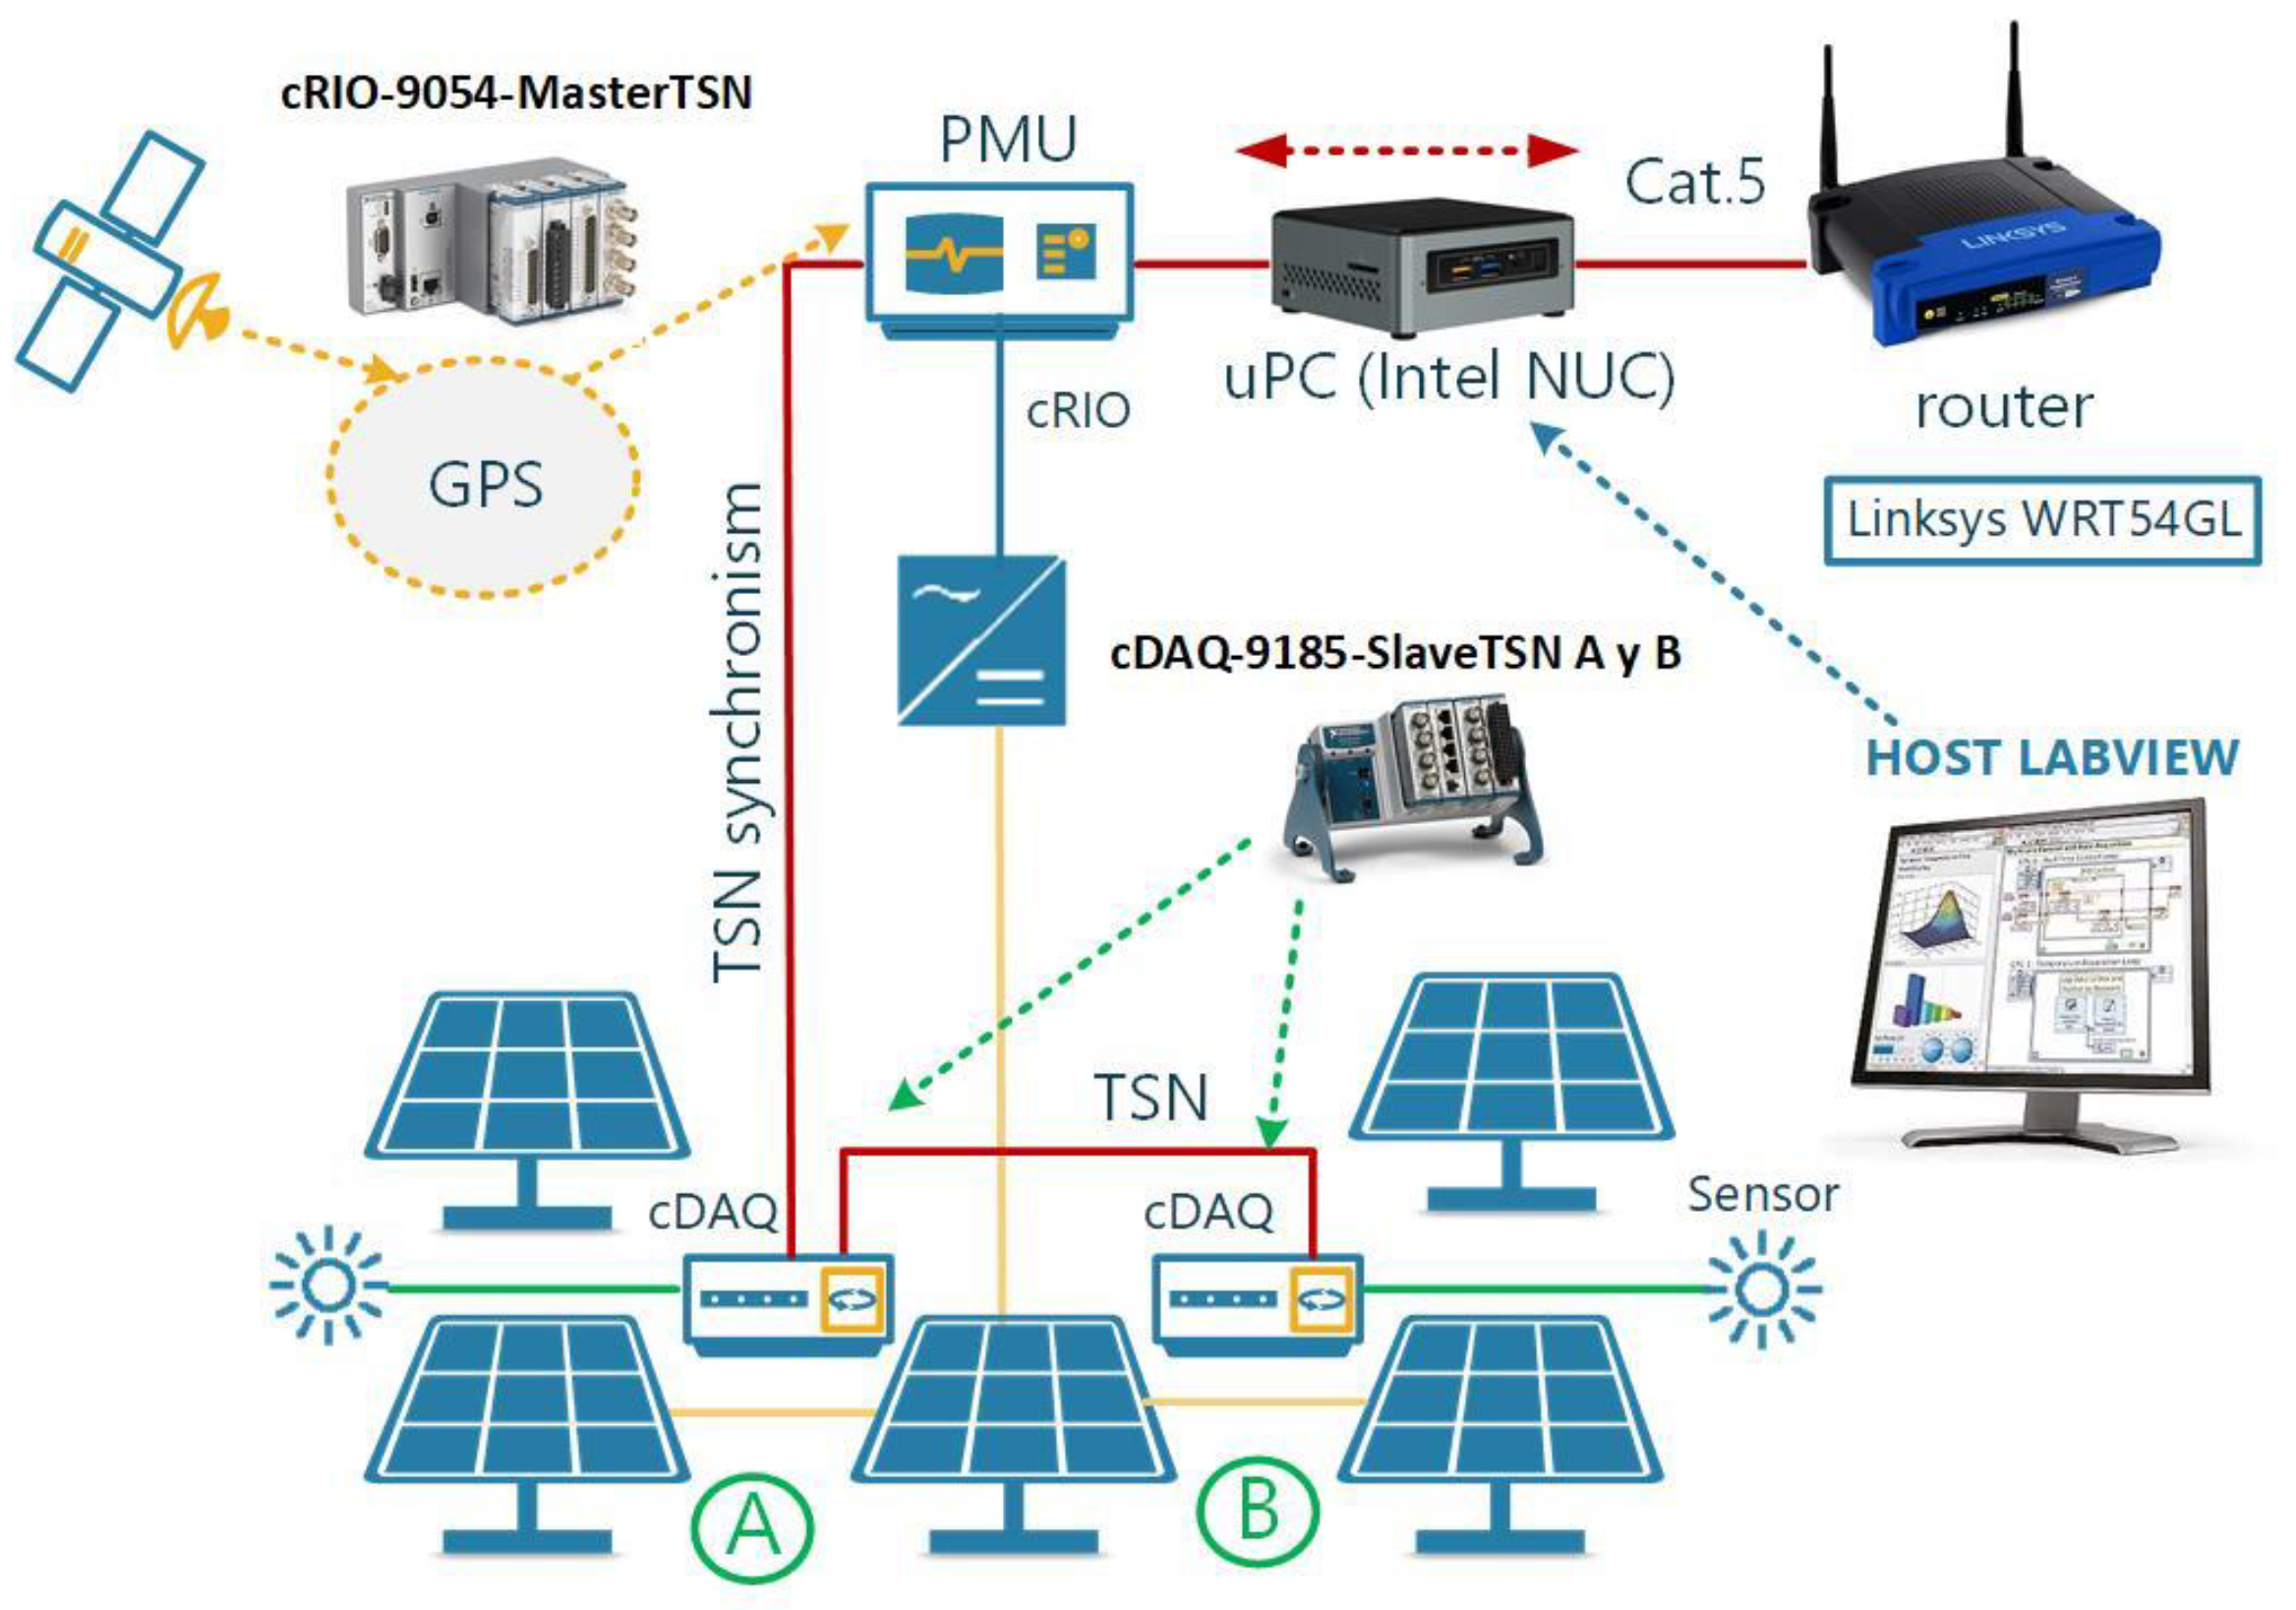
The first configuration, which can be seen in
Figure 2, was suitable for the deployment of sensors in two PV CTs with a moderate distance between them. It used cDAQs that were both synchronised with TSN on an Ethernet local area network. In both cases, two capture methods were used with the modules inserted into the cDAQ-9185 chassis:
- -
NI-9242 modules integrating the Texas Instruments ADS1274 Sigma-Delta (SD) converter with 24-Bit, 144 kS/s, and 4-Ch Simultaneous-Sampling Delta-Sigma ADC; and
- -
NI-9215 modules integrating Analog Device’s AD7655 Successive Approximation Register (SAR) converter with 16-Bit, 500 kS/s, and 4-Ch Simultaneous-Sampling Successive Approximation Register ADC.
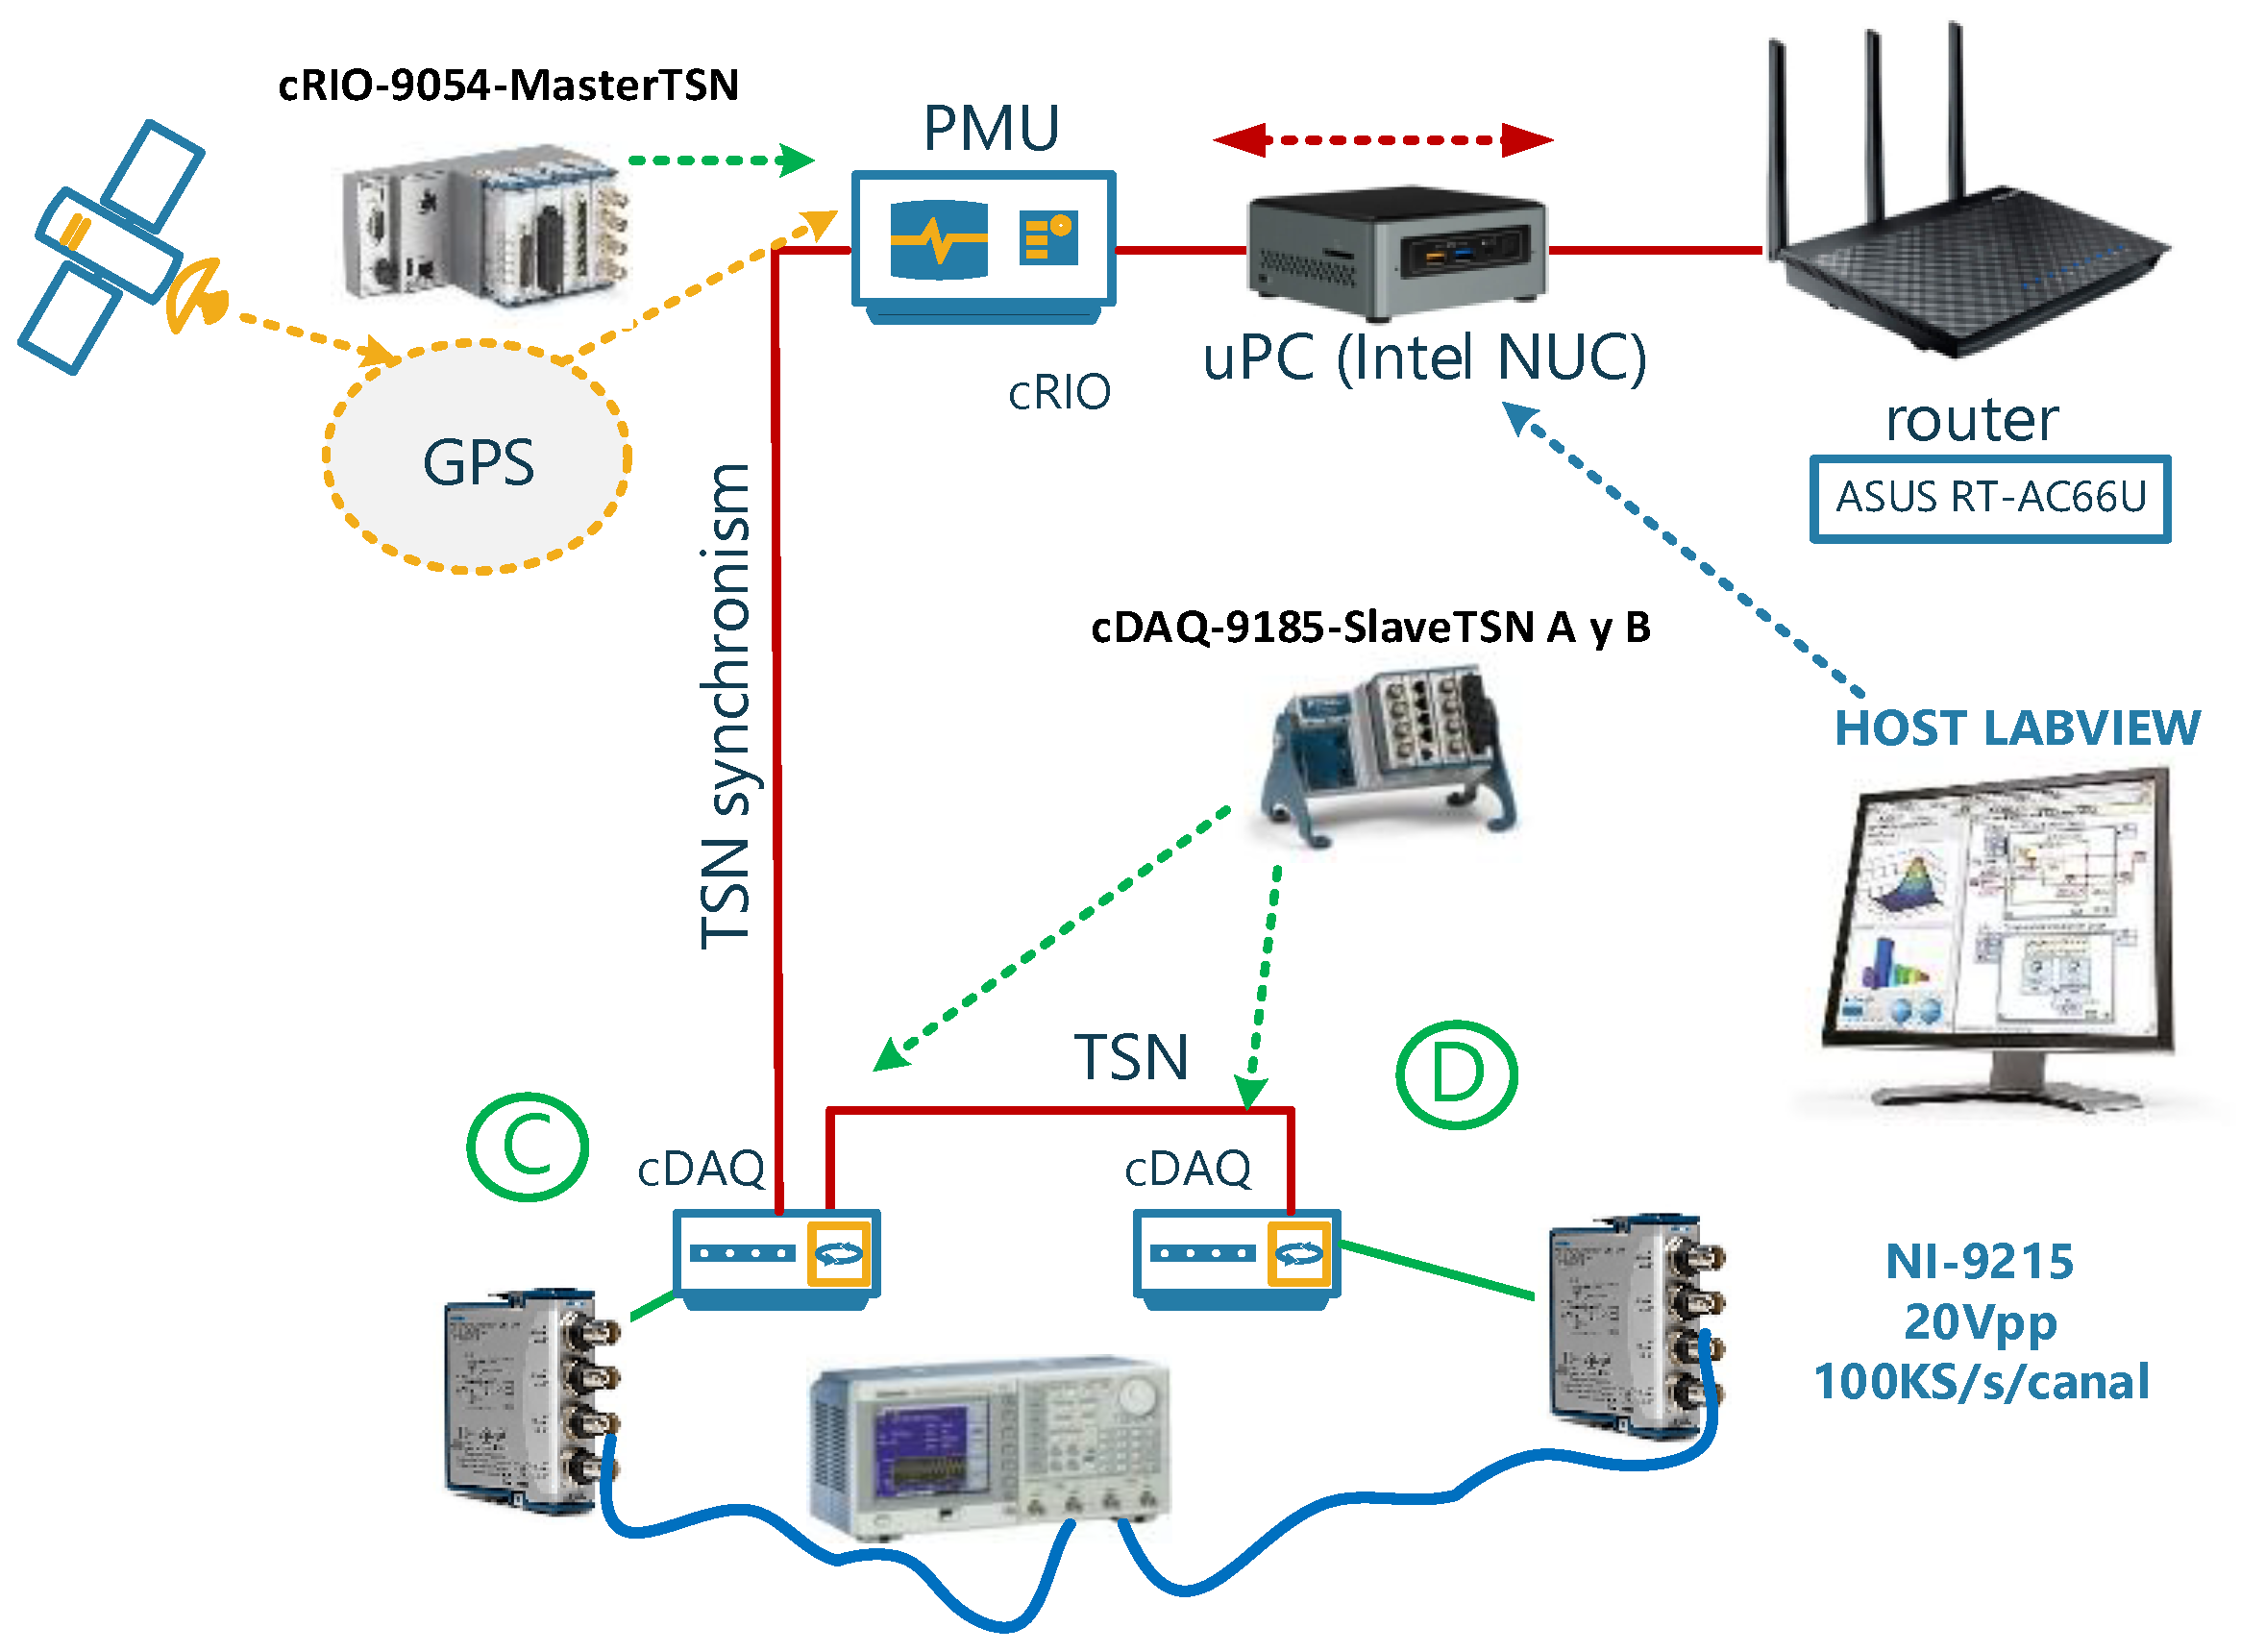
Figure 3 shows the information provided by the cRIO web server. Type-C modules inserted in the cRIO slots for the management of the µPMU can be seen. From the cRIO-9054, it is possible to start the capture process with the Type-C Modules housed in the cDAQ-9185 as well as to process the information. The PLLs of the cDAQs were synchronised as TSN slaves for simultaneous capture. The tests and analyses included in this work are concerned with observing the alignment of the samples with the phase measurements of the waveforms deriving from the channels housed in the four cDAQs under different working conditions. The time series allows the effect on production to be analysed.
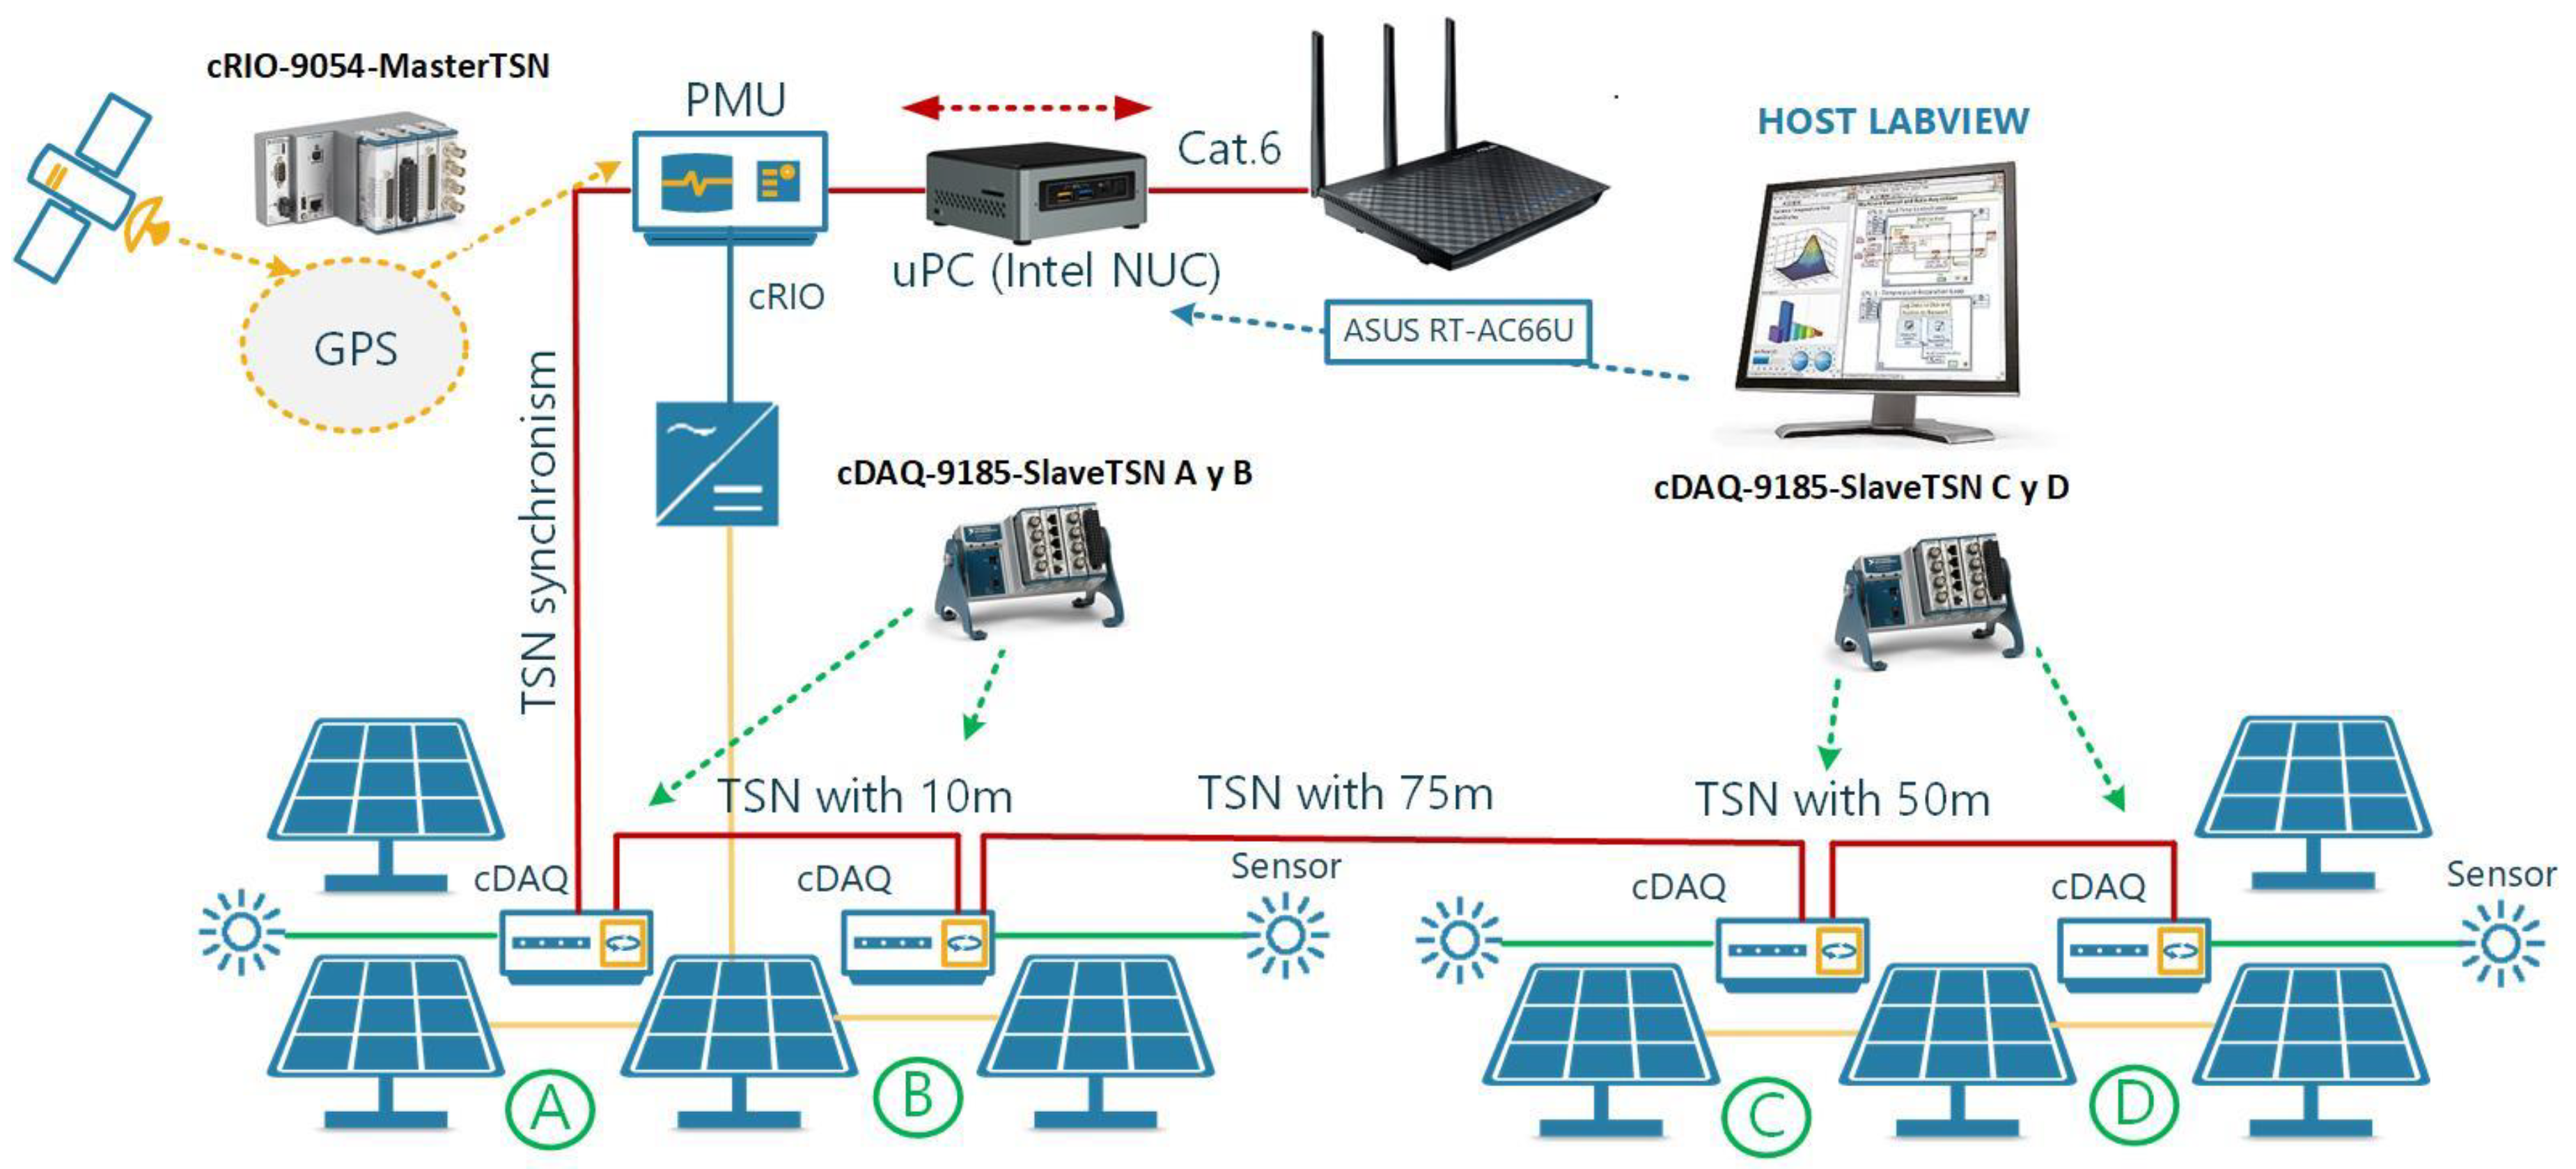
The second configuration (
Figure 4) is an evolution of the previous one by adding two more devices to the in-line Ethernet topology. The objective was to analyse the level of the synchronisation of the captures when the new devices were 50 or 75 m apart. The process will be analysed in steps with two, three, and four devices.
2.1. Experimental Process
In the tests, the converters worked at a sampling frequency of Fs = 50 kS/s. This was the sampling frequency necessary for the frequency estimation algorithm to work instantaneously. With this sampling, exactly 1000 samples per cycle of the fundamental were obtained. The phase measurements were carried out with a sliding window of L = 4000 samples, which is equivalent to 4 cycles of the fundamental. The tests were extended to a total of 200 s. For each of the time series, a statistical analysis showing the central tendency, dispersion, histograms, box-and-whisker plot, and non-parametric distribution density was performed.
Table 1 lists all of the test types according to the location of the four Type-C modules. Modules A and B were NI-9242 with SD converters, and C and D modules were NI-9215 with SAR converters.
Table 2 shows the types of tests according to the location of the modules in each of the four chassis. In this case, the chassis are identified with numbers and the modules are identified with letters. In the first test, they were all SD converters (A to D), and in the second test, they were all SAR converters (A to D).
2.2. Equipment for Testing
cRIO: The cRIO-9054 model acted as a µPMU and oversaw the maintenance of the reference as a TSN master for all the captures in an area distributed throughout the plant. It integrated a GPS module to maintain a universal UTC reference.
This equipment oversaw the capture, the processing of the measurements, and the temporary storage of the TDMS files which contained the time series. It was possible to carry out this operation with real-time processing techniques. The operating system running this equipment was Linux Real Time (LRT).
cDAQ: Specifically, the cDAQ-9185 models were automatically synchronised with the reference deriving from the cRIO-9054 located in the same local network. The cDAQs integrated a 100 MHz oscillator and could be synchronised on a subnetwork with the TSN standard. With this method, analogue inputs integrated in C-Series modules that were inserted into the cDAQs could be synchronised for simultaneous sampling.
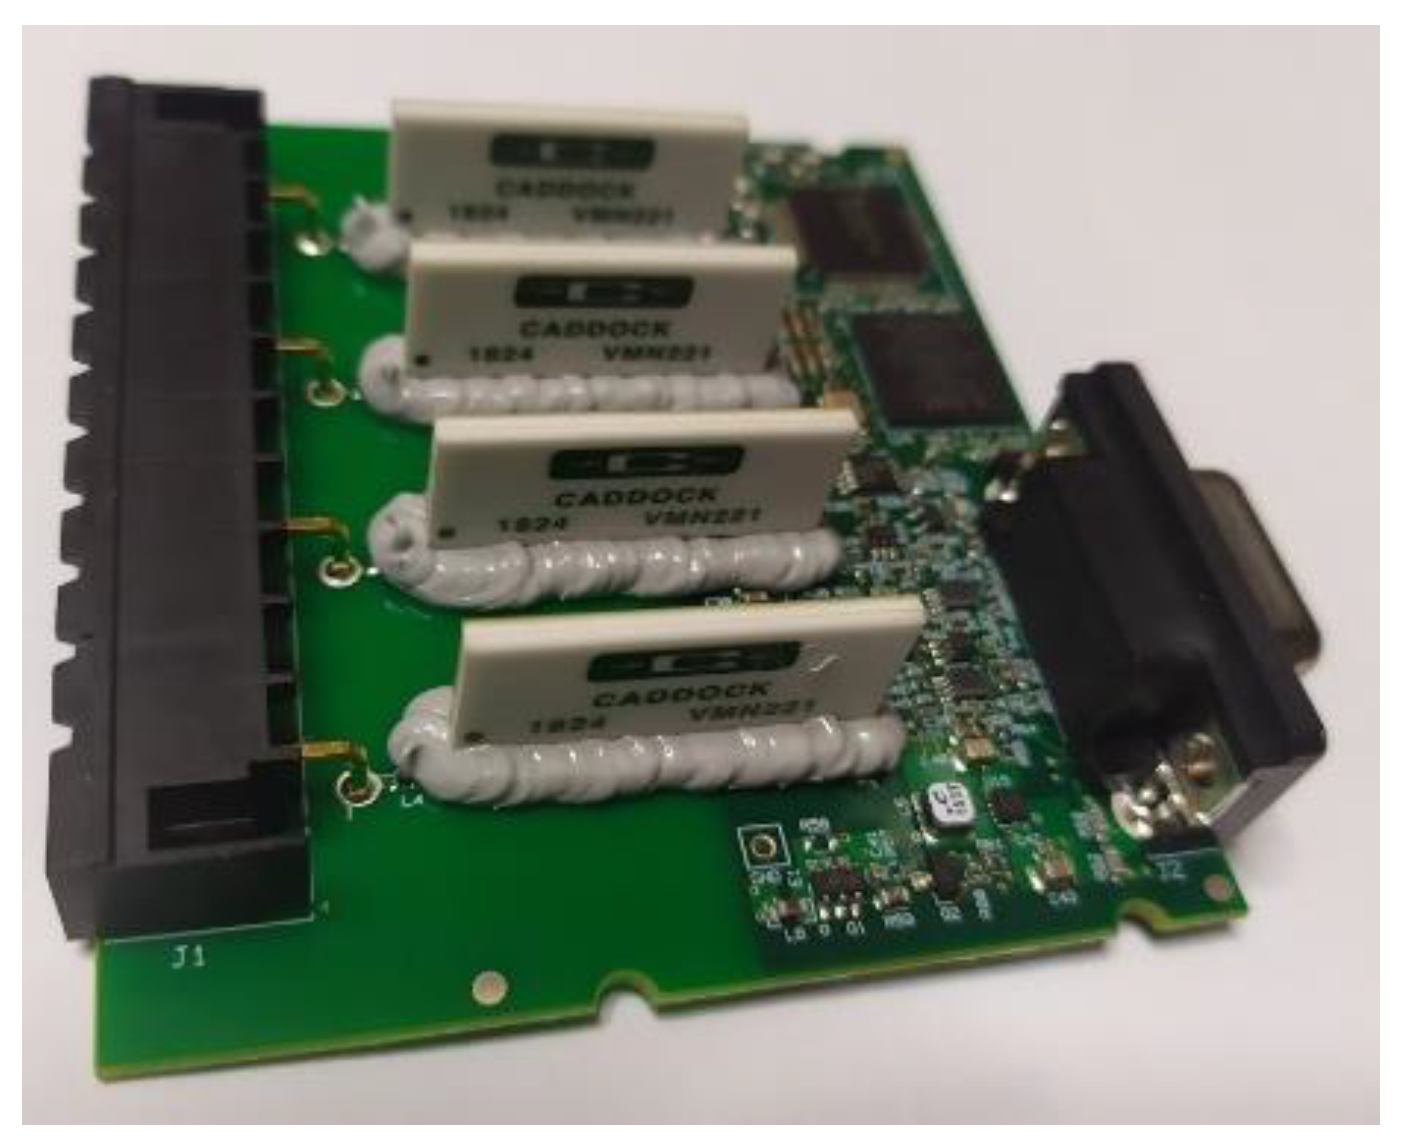
Analogue inputs: Two types of C-Series modules were used for data acquisition. The NI-9215 with four 16-bit inputs, Successive Approximation Recording, and simultaneous capture had ±10 V voltage input and a maximum sampling of 100 kS/s per channel, while the NI-9242 and NI-9246 modules had channels for three-phase voltage and current measurements. They included Sigma Delta converters with a maximum sampling of 50 kS/s, equivalent to 51,200 samples per channel, and a resolution of 24 bits. Specifically, NI-9242 modules were used for the tests, which did not require an external reference but did measure with respect to the neutral. These modules used high-precision resistors for the internal dividers, specifically the VMN family “high voltage monitoring resistor networks” (from Caddock Electronics Inc., Glide, OR, USA). They feature tolerances of up to 0.02% and temperature coefficients of up to 5 ppm/ºC. They are high impedance resistive dividers with very low power consumption from the network.
Voltage transducer: Three active LEM LV-25 transducers were used to capture mains voltages with the NI-9215 modules. These modules provide galvanic isolation between the primary and secondary circuits, and require a ±15 V symmetrical power supply.
The output voltage can be adjusted with a precision resistor to achieve maximum output sensitivity. In these tests, it was calibrated with a Fluke 5522 A multi-product calibrator, which provides a waveform equivalent to the mains voltage. Since the maximum peak voltage allowed by the NI-9215 modules was Vp = 10 V, there was a 20% margin for measuring overvoltages.
Routers: In the first phase, the tests were carried out by connecting the equipment to a local area network with a Linksys WRT54G router, with speeds of 10/100 MB, which could work with the free DD-WRT firmware [
21]. This software runs on a reduced operating system based on GNU Linux. With this method, standardised test conditions could be defined to facilitate traffic control, the emulation of different data flow levels, and the collection of the activity of the connected equipment with the “RFlowCollector” tool. Moreover, it was possible to establish Quality of Service (QoS) rules to prioritize the traffic of the equipment of interest.
For the second phase tests, the ASUS RT-AC66U router was used with speeds of 100/1000 MB and worked with the ASUSWRT native firmware, which allows for securely managing access with OpenVPN clients to any server of the University of Córdoba. Additionally, it was possible to establish QoS rules to prioritise the traffic of the equipment of interest.
The tests analysed the level of stability achieved when the devices were synchronised with continuous UDP packet transfer according to the IEEE 802.1AS standard and when connected to a local area network with a controlled flow.
Ethernet cable: The type of Ethernet cable chosen was suitable for the transfer capacity of the two router models. In the first phase, a Category 5 cable was used, which supports a speed of 100 Mbps/frequency of 100 MHz/download speed of 150.5 MB/s.
In the second phase, a Category 6 Ethernet cable was used, which supports a speed of 1000 Mbps/frequency of 250 MHz/download speed of 150.5 MB/s.
2.3. Justification of the Topology Used for Synchronism
This work focuses on the simultaneous capture of waveforms for the measurement of voltages and currents in a distributed manner. A decisive step in the design of a distributed measurement system based on TSN concerns the choice of a topology tailored to the type of application. The IEEE 802.1AS profile compensated for the cable length between devices so that the advantages of an in-line topology for PV plants could be analysed.
With the in-line topology, the host (TSN master) communicated directly with all of the devices in the system via a bus. The in-line topology is the simplest topology but is only possible with devices that have an integrated Ethernet switch compatible with IEEE 802.1Q to support Rapid Spanning Tree Protocol (RSTP) [
22] and IEEE 802.1AS to support TSN synchronisation. The RSTP specification guarantees the best path for data, but if a link is broken between two of the IEEE 802.1AS compliant devices, data communication for synchronisation is interrupted. With this method, each device could be within 100 m, allowing for long distances to be reached with a single Ethernet cable.
Synchronisation of multiple devices was based on packets that were transmitted over long distances with no delay in the signal propagation. Synchronisation of inputs and outputs using this profile was less than 1μs. The IEEE 1588–2008 standard’s capability for distributed device synchronisation in smart grids can be enhanced with TSN in the range of tens of nanoseconds, depending on the selected topology. For two devices to synchronise, a common IEEE 802.1AS compliant path must exist. If such a route exists, it is automatically detected and used.
The IEEE 802.1AS-2011 standard [
19] builds on IEEE 1588–2008 [
18] to maintain the synchronisation of all nodes within the IEEE 802.1AS subnetwork. The standard defines so-called generic Precision Time Protocol (gPTP) domains [
23], consisting of one or more systems that take into account the same time base and comply with the requirements of the standard.
Some authors have devoted a line of research to evaluating the latency that can be achieved using TSN in a network with various levels of data transfer and they have compared these results with the UDP and TCP protocols [
24]. In addition, they have analysed the possibility of generating waveforms for microgrid inverter synchronisation with TSN-synchronised clocks.
2.4. TVE Quality Parameter
The tests were defined based on the requirements of the IEEE C37.118.1a-2014 synchro-phasor standard [
13], which includes a number of modifications to lower the technological requirements of the classic IEEE Std C37.118.1™-2011 [
16]. The standard defines the concept of total vector error (TVE) as a quality parameter that determines the measurement of the error between the theoretical phasor value of the signal under study and the actual value measured periodically. This standard has been widely accepted as the method that defines synchronised phasor measurements in power applications and provides methods that allow these measurements to be quantified, representing the tests that guarantee the measurements and error limits for these tests.
Subsequently, the specifications that determine the quality of measurements with PMUs (set out in section “4.3 Measurement time synchronisation” of the standard [
16]) are analysed to establish an uncertainty level for distributed measurement systems.
The standard specifies two performance classes: Class P and Class M. Class P is proposed for applications requiring fast response without strict accuracy criteria. Class M is defined for those applications that require precise measurements (with high bandwidth) and where speed of response is not a critical factor. As far as the present work is concerned, since we are dealing with medium-access protocols, the timing specifications should be the most restrictive ones that guarantee the two performance classes.
The standard details a time error of 1 μs, corresponding to a phase error in the synchro-phasor of 0.018 degrees for a 50 Hz system. It is stated that a phase error of 0.57 degrees (0.01 radians) will cause an error of 1 % TVE (the maximum allowed), corresponding in the time scale to an error of ± 31 μs for a 50 Hz system. A time source with a frequency error (FE) of 0.1 MHz in a 50 Hz system will cause the maximum allowed steady state FE of 0.005 Hz. For a TSN master type time source that reliably provides a reference, it is recommended that the frequency and frequency stability be at least 10 times better than the values corresponding to 1% TVE. This implies a temporal error of less than ±3.1 μs for 50 Hz systems. In this work, ±3.1 μs is taken as a reference to ensure that the quality of the TSN synchronising system is at the same level as that required for the design of a PMU.
3. Results and Discussion
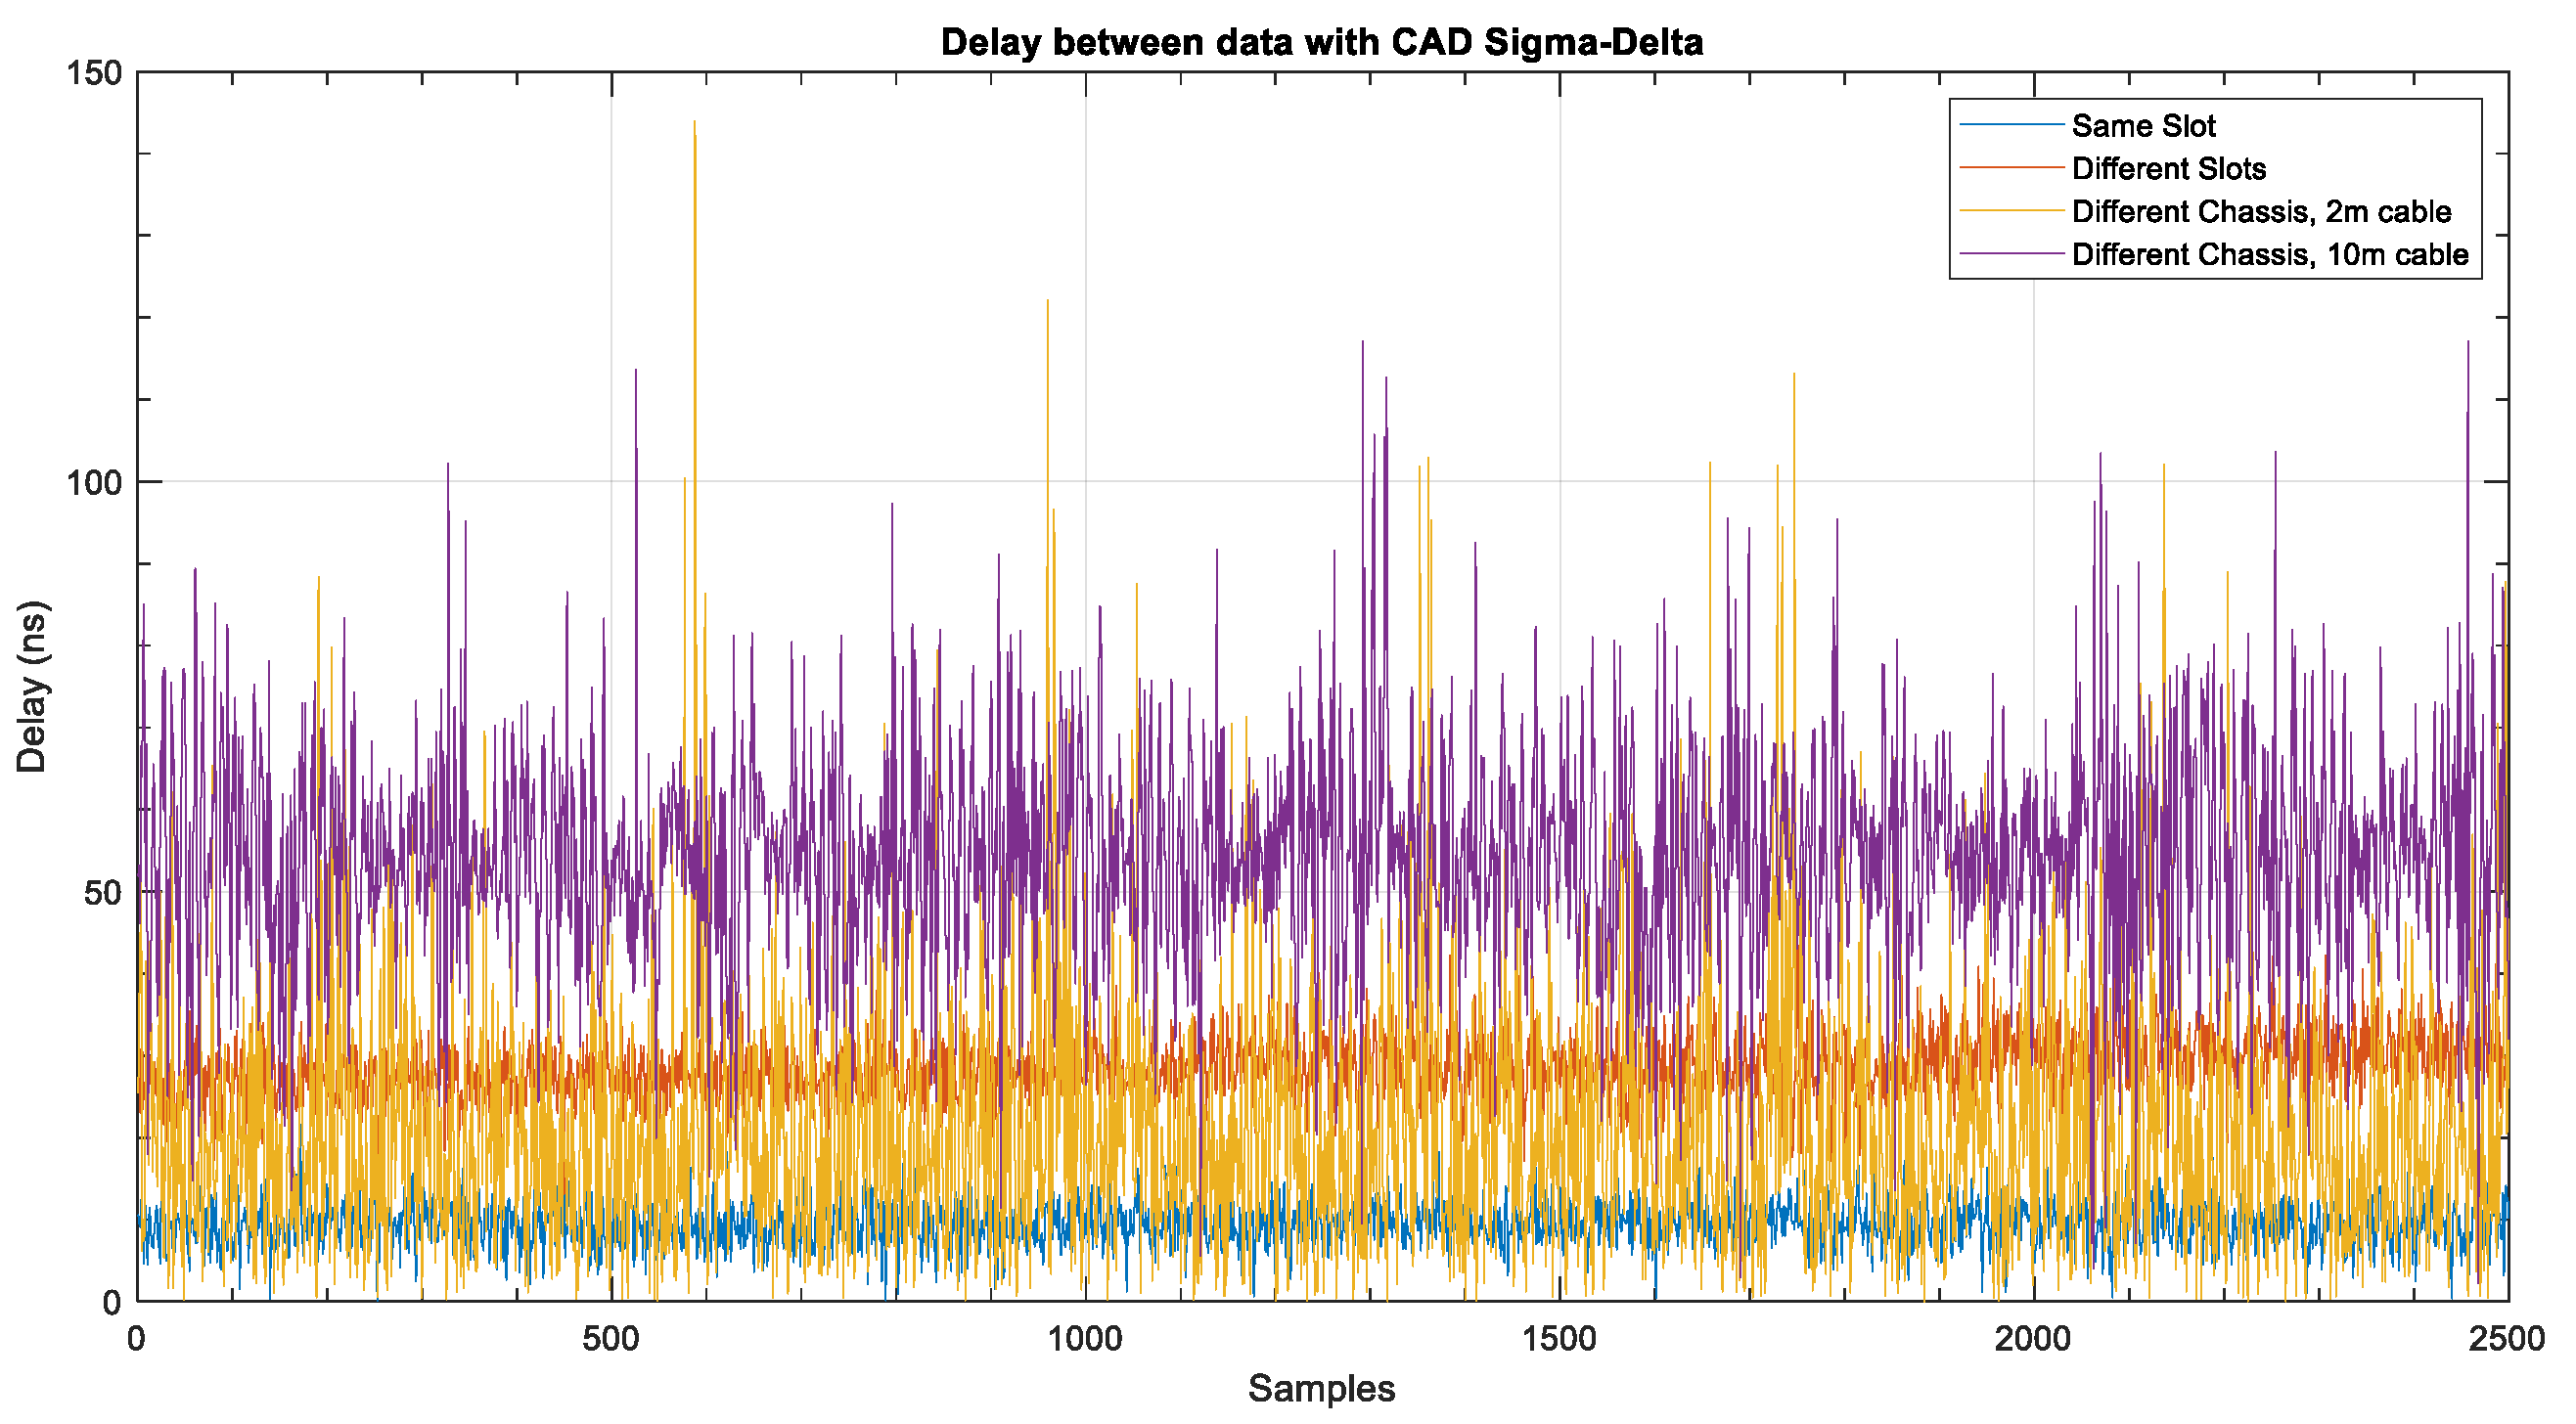
3.1. Tests with Two Modules with 24-bit Sigma-Delta Converters and Two Chassis
For the Sigma-Delta converters, the single-phase mains voltage was used. The input for both modules was a single-phase voltage at 50 Hz and Vrms = 230 V.
Firstly, a test was performed to determine the phase error of each of the modules under testing. The phase difference between two consecutive channels of the same module was measured.
Secondly, a test was carried out to determine the phase error between two channels of modules A and B. The phase shifts Channel-A0 and Channel-B0 were measured. The two modules were inserted into the same cDAQ-9185 chassis and placed in two consecutive slots.
In a third test, captures were made with different cDAQ-9185s. Modules A and B were connected in slot 1 and the two chassis were synchronised with the TSN standard. The test allowed for verifying the synchronism for simultaneous single-phase voltage sampling. The tests were repeated with 2 m and 10 m Ethernet cables.
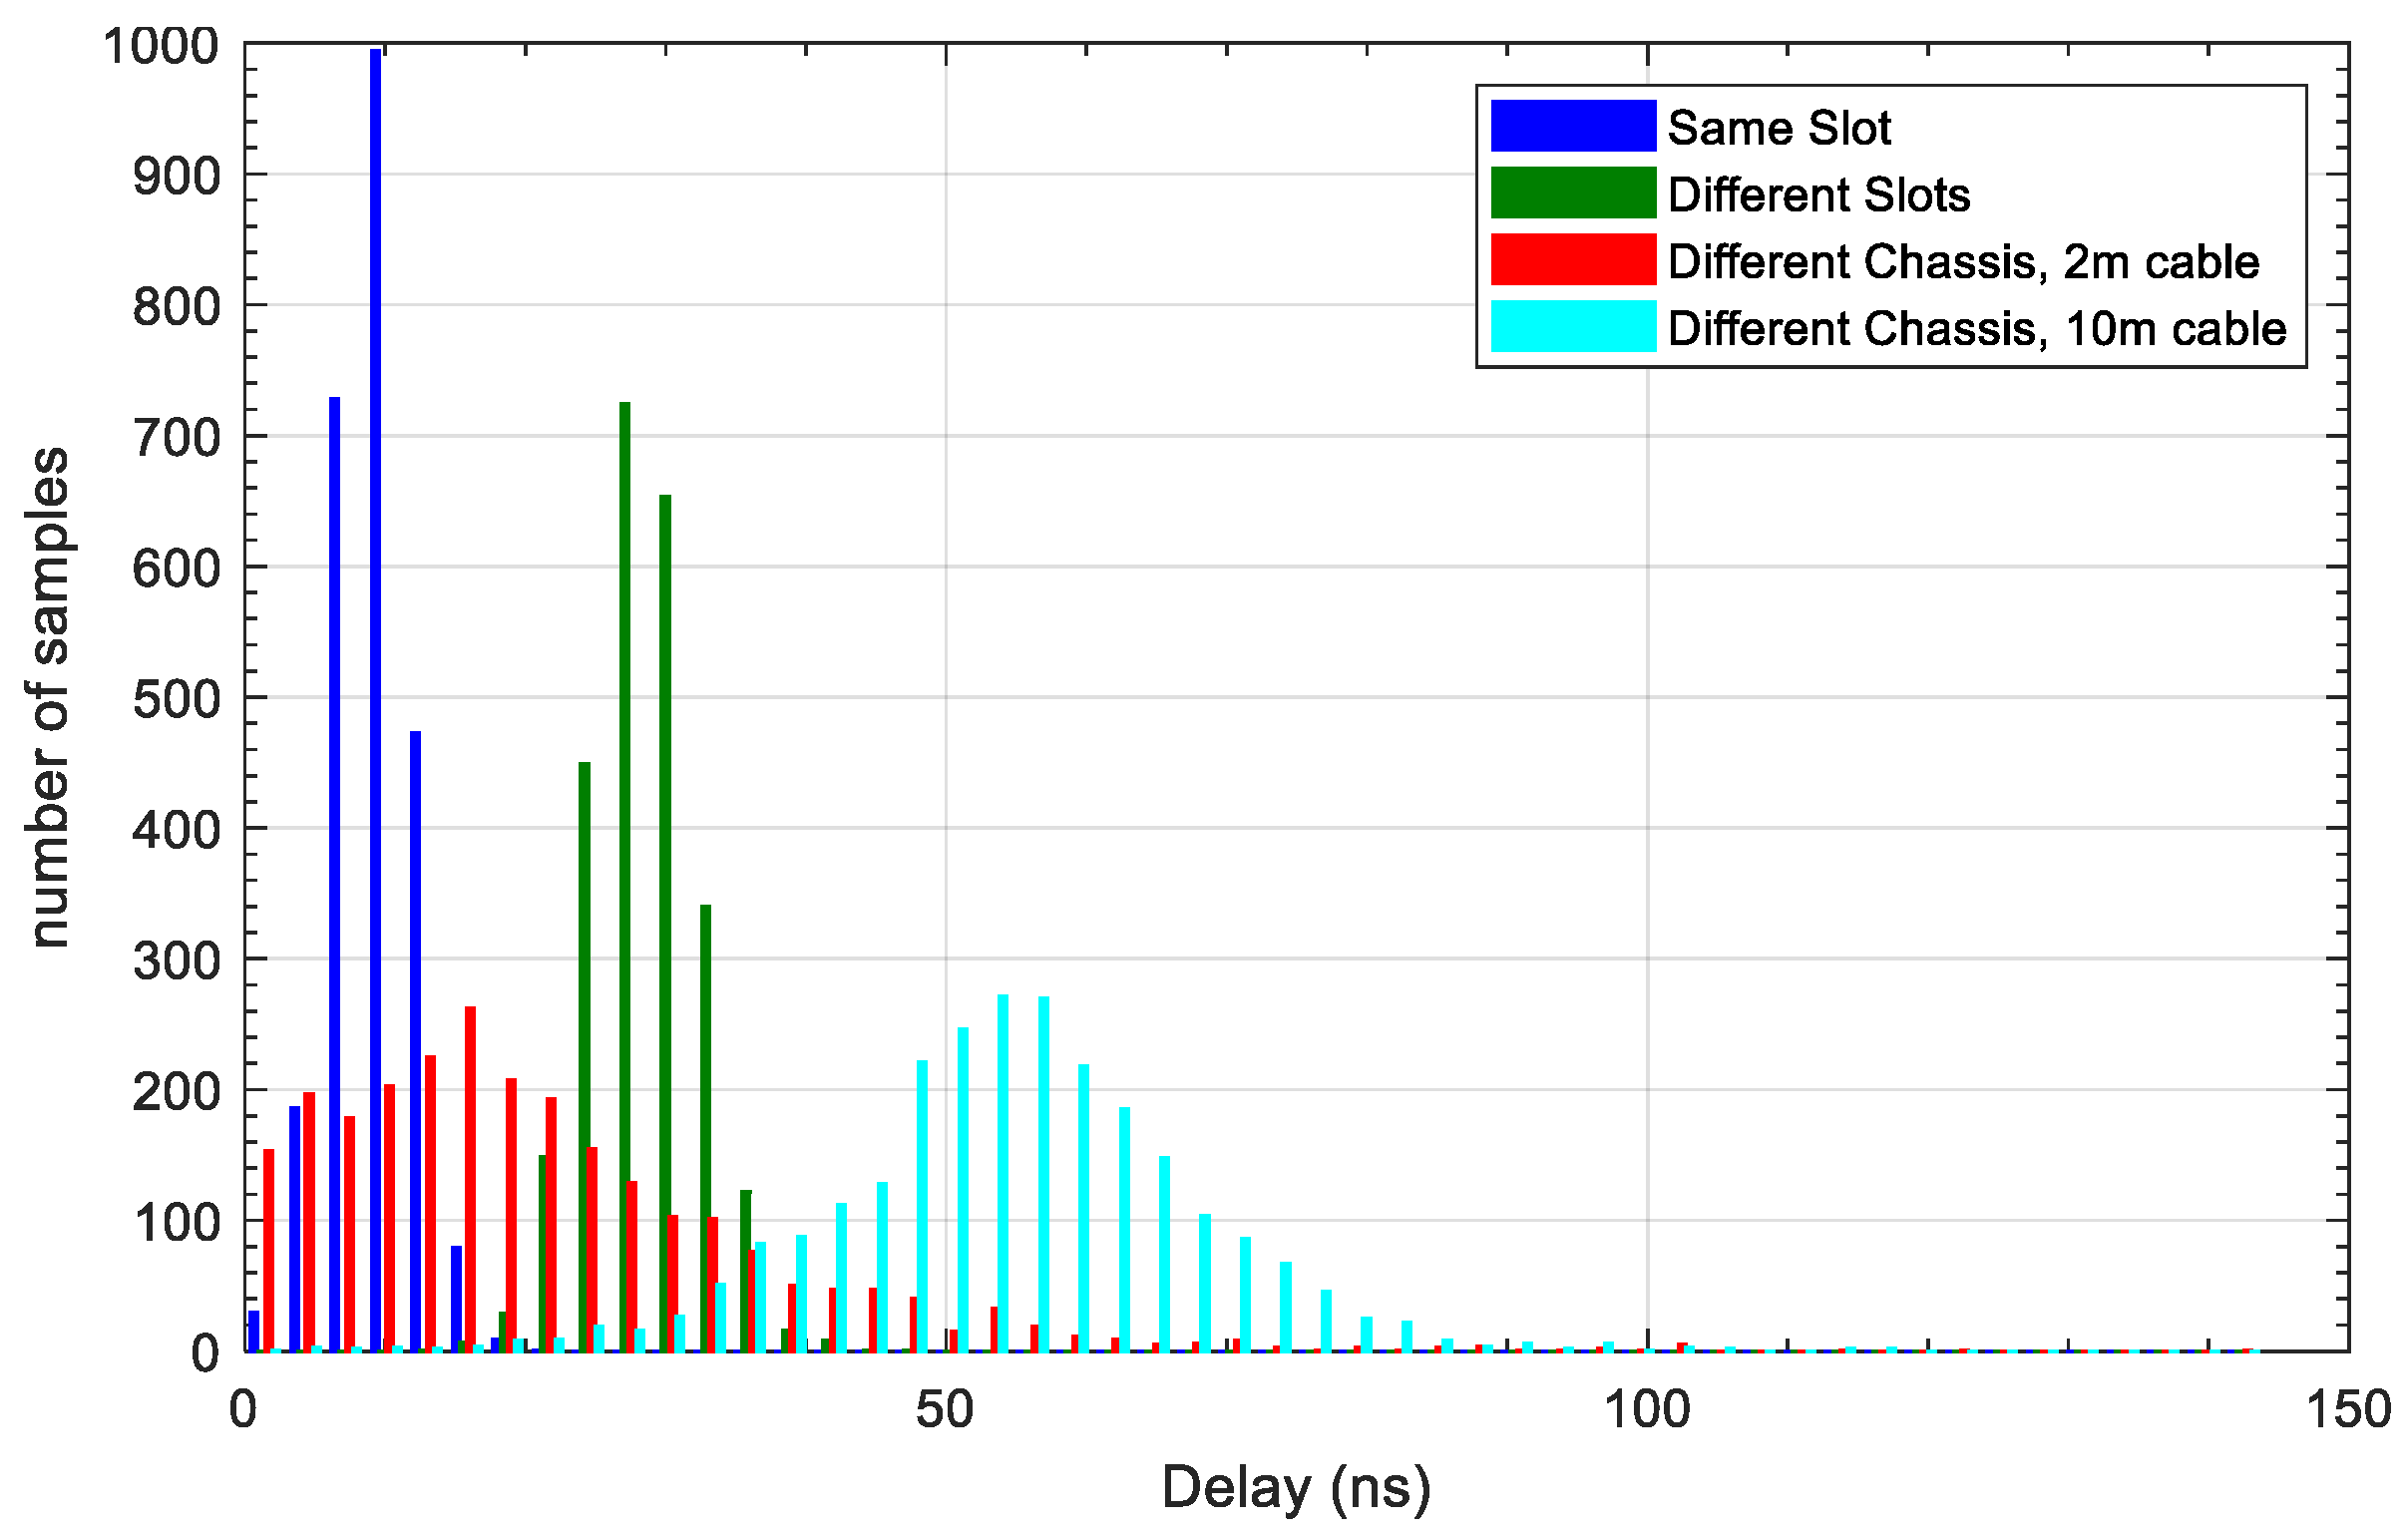
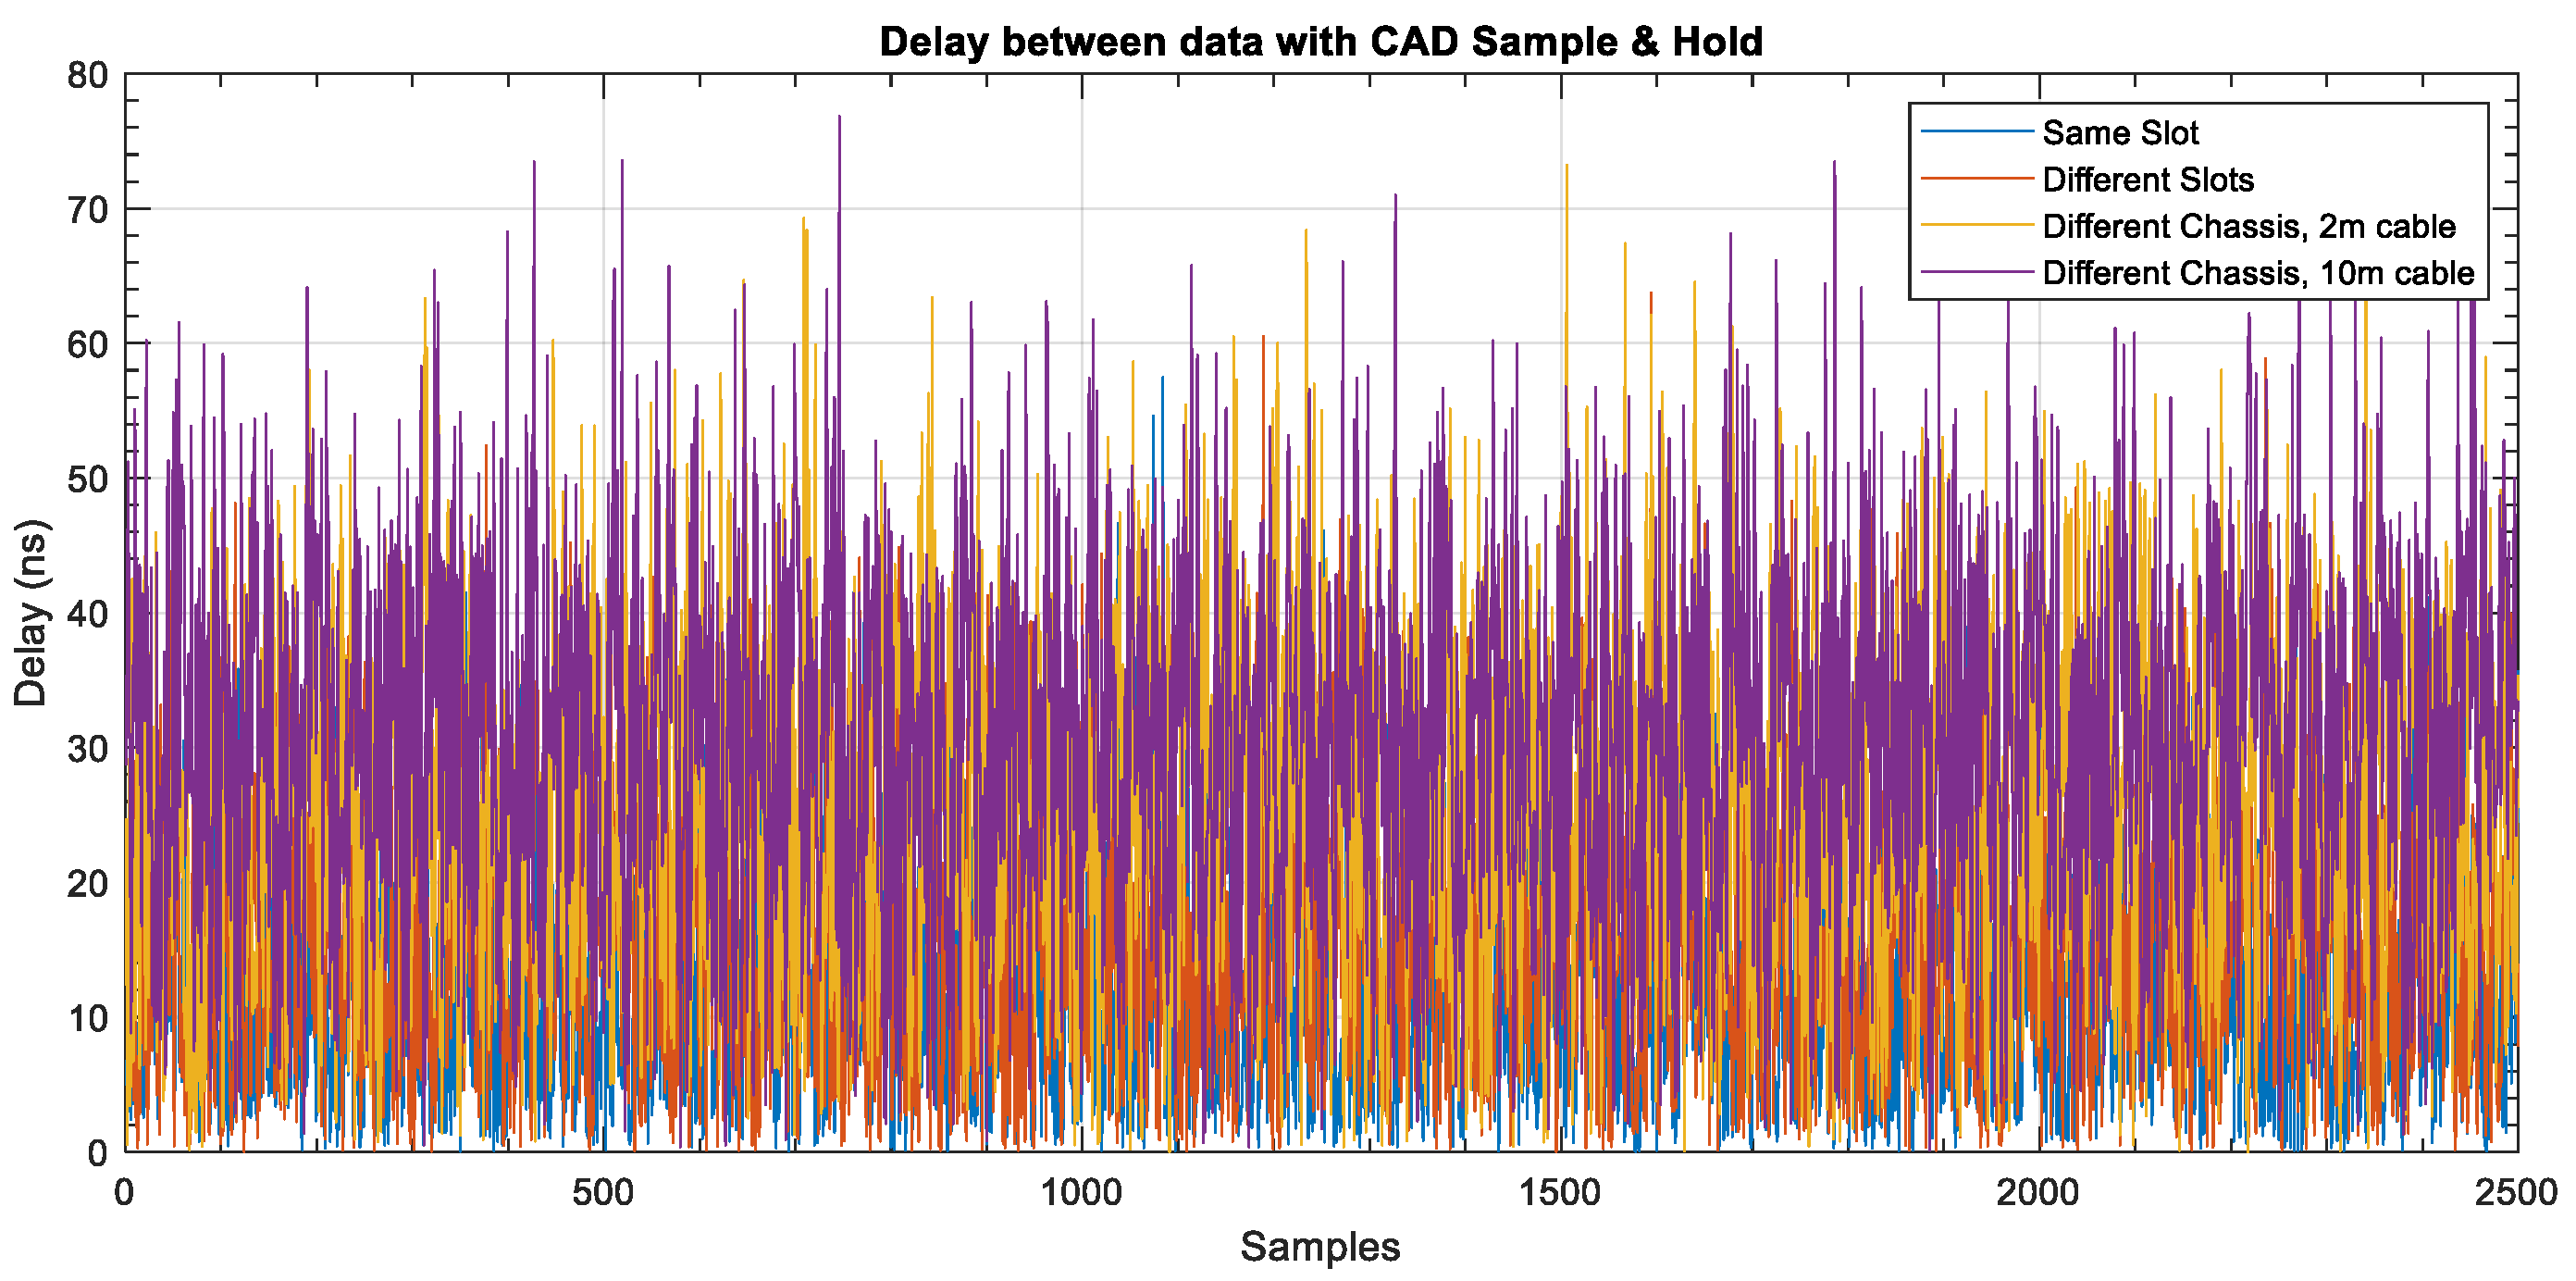
Figure 5 shows that almost all the time series data were below 100 ns and
Figure 6 shows that the distribution type of the TSN synchronous tests had a higher dispersion than the two reference tests on the same chassis, but the central position of the distributions (medians) were below 60 ns.
Table 3 shows the statistical results for the four trials. On the one hand, the accuracy was observed with a median of Me = 9.5 ns and a very low variance of σ
2 = 7.7 ns for the Sigma-Delta channels integrated into the same module A was seen. When they are in different modules of A and B, the average errors of Me = 28.31 ns and the variance of σ
2 = 14.9 ns were obtained.
With a 2 m cable, a median Me = 17.7 ns was obtained, which was very close to the best reference of Me = 9.52 ns, but with a very high dispersion identified with a variance of σ2 = 250.6 ns. For a 10 m cable, the median was Me = 54.3 ns but with a somewhat smaller variance.
These results with NI-9242 modules and 24-bit Sigma-Delta converters represent the highest level of quality available with the current technology and serve as a reference for estimating the quality of 16-bit SAR converters. In a first assessment, it can be said that the phase errors for simultaneous captures and TSN synchronism comply with the specifications established in the IEEE 802.1AS-2011 standard. This is a technology that manages to maintain synchronisation 10 times higher than that indicated as optimal by the standard, which is 1 µs.
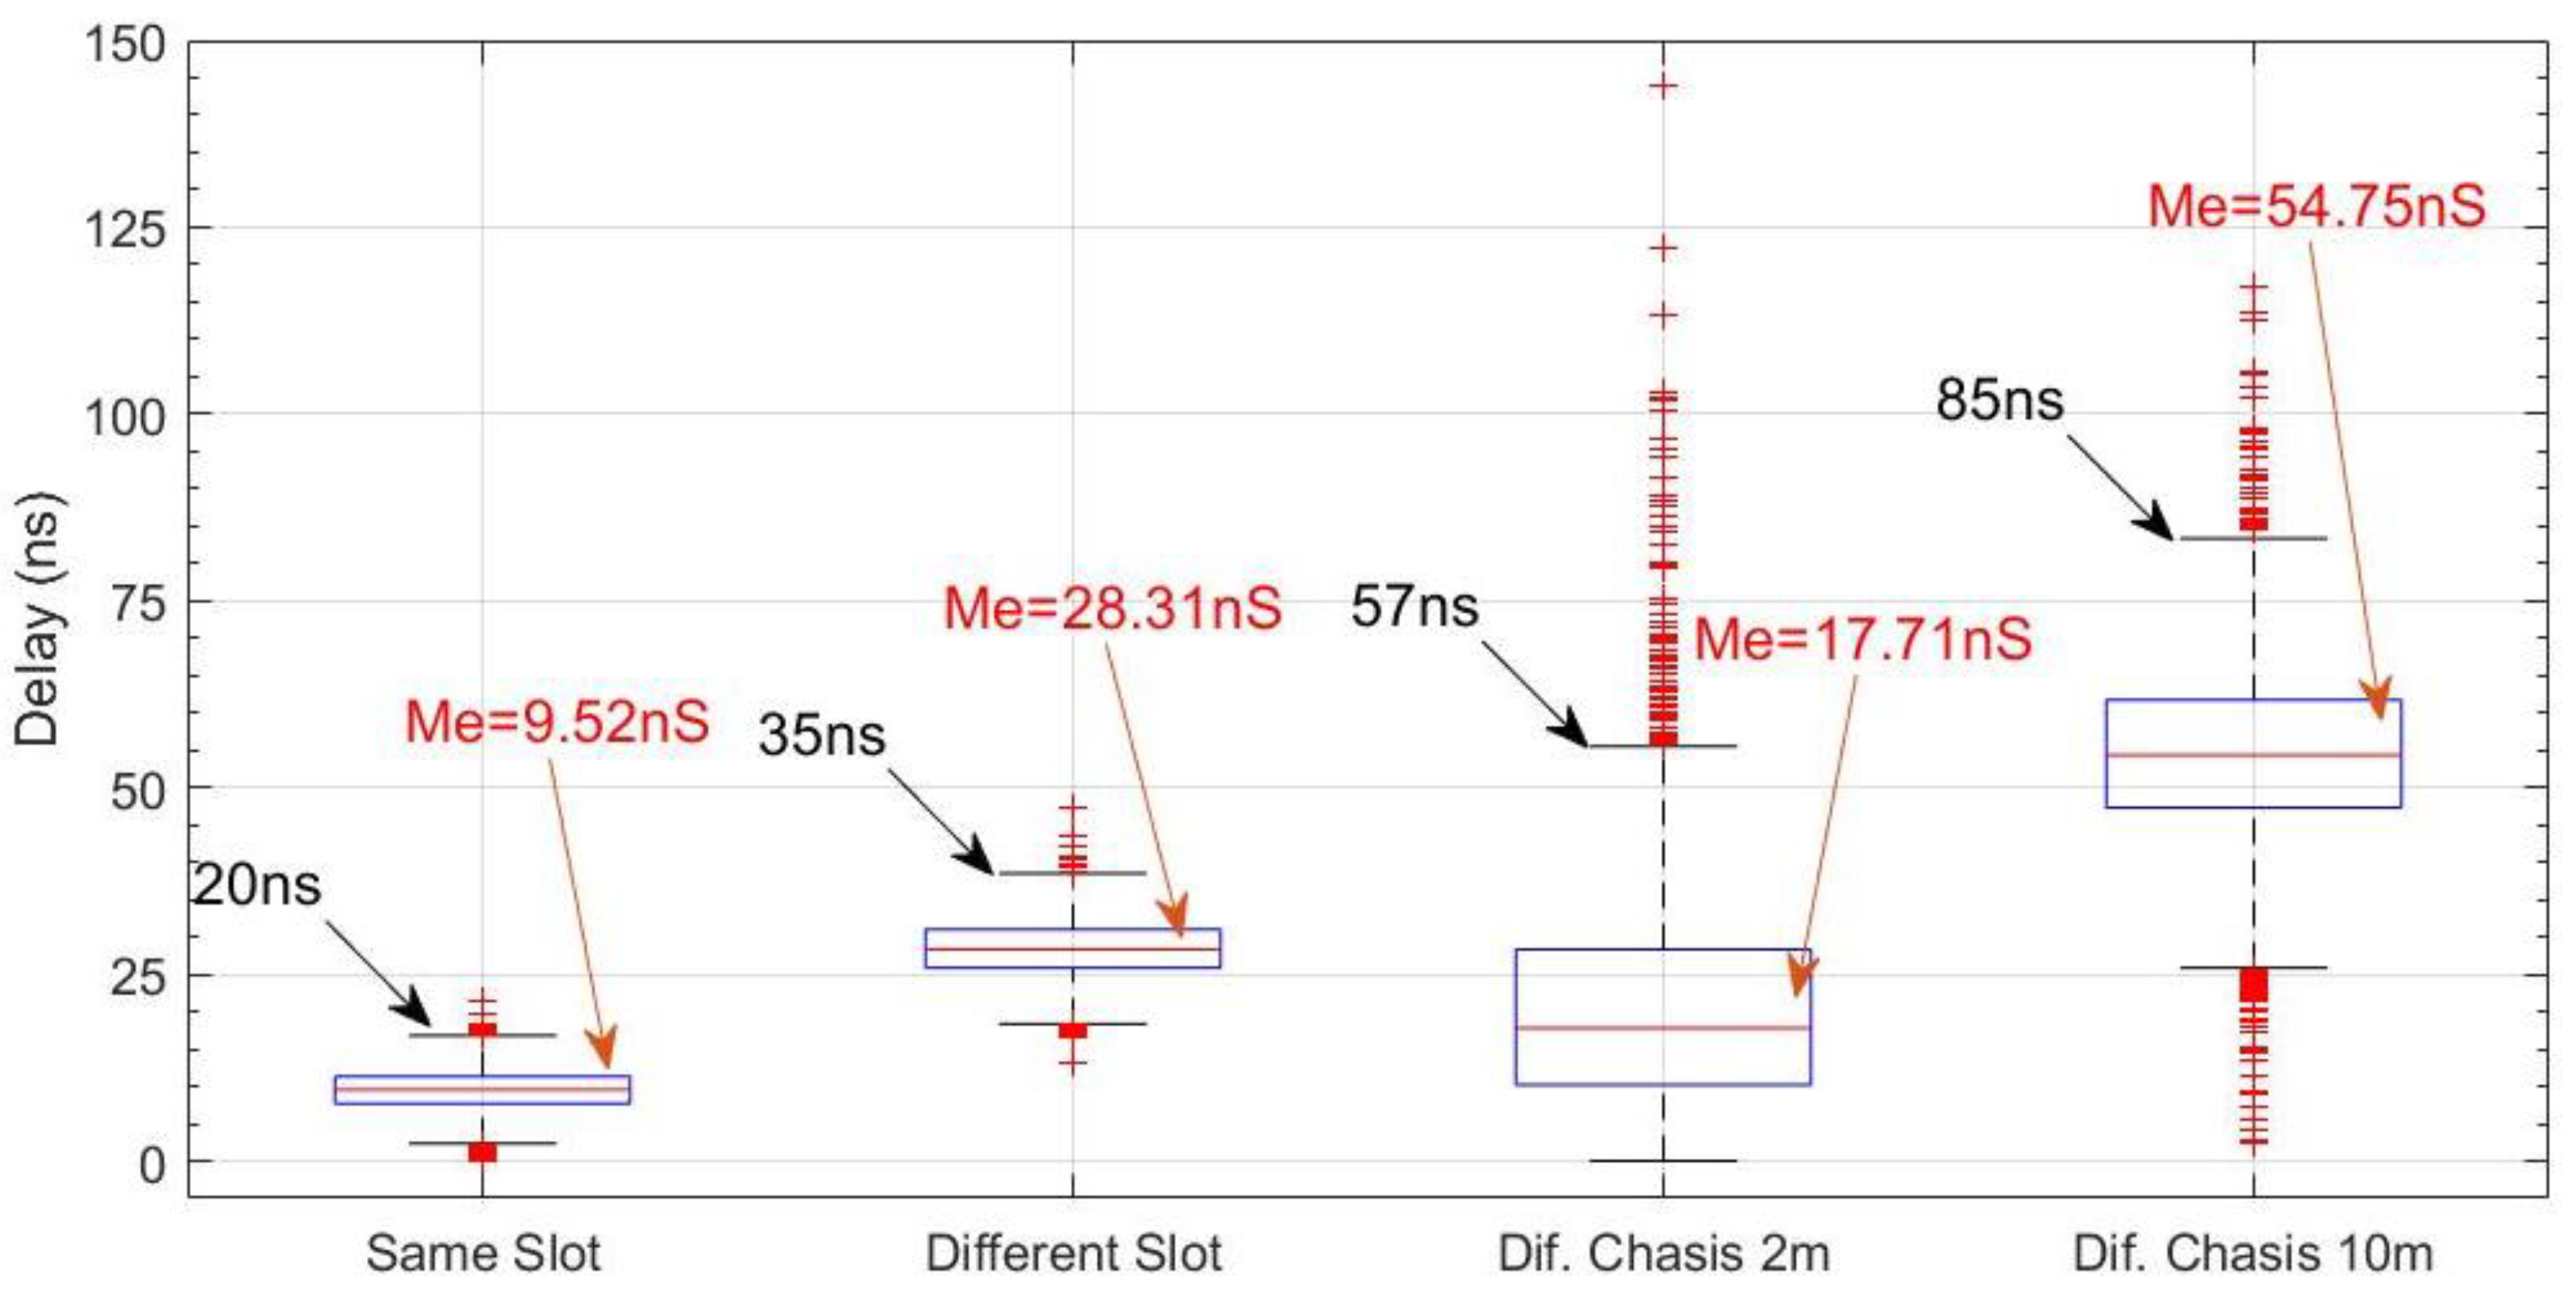
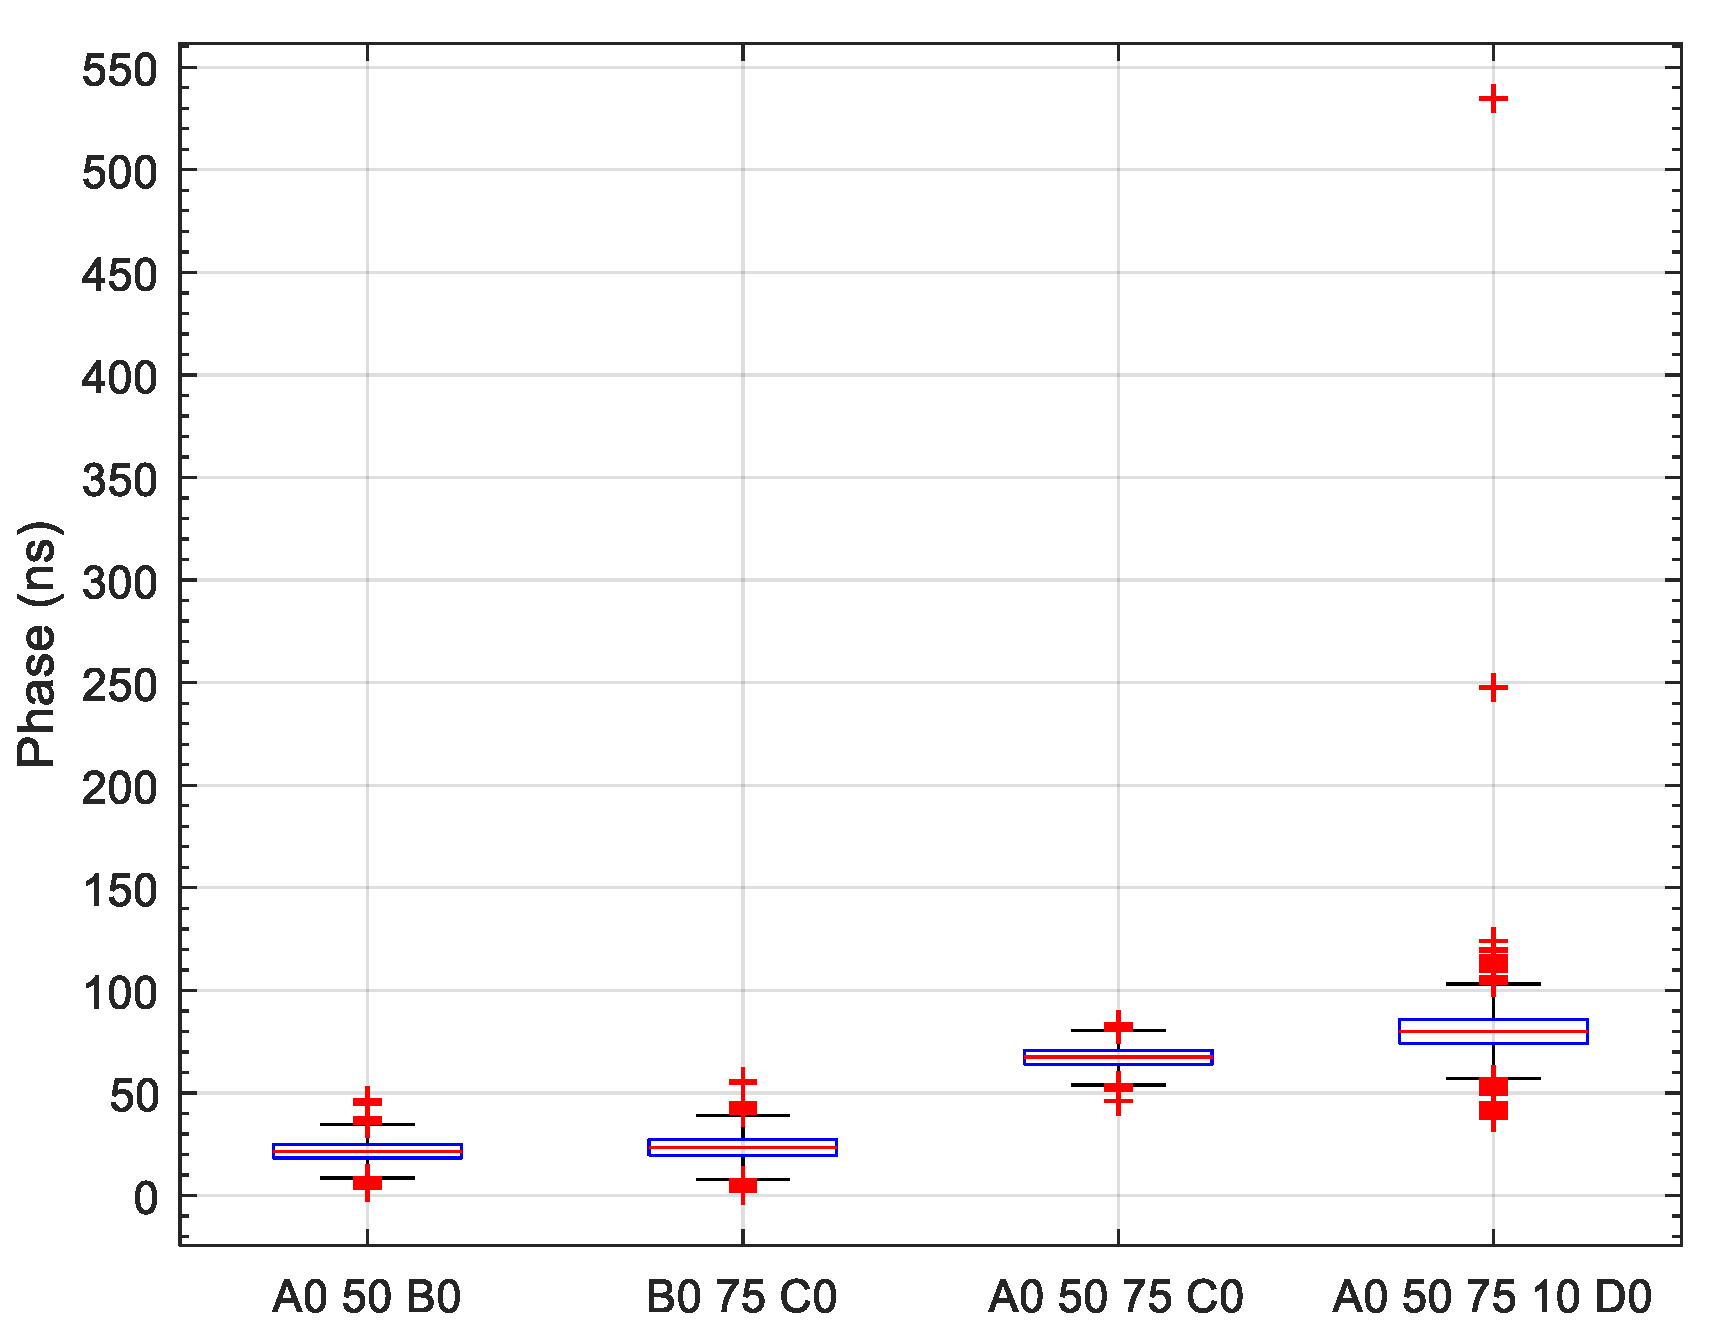
Conversely, it is necessary to estimate the uncertainty of the method based on the results obtained. The box-and-whiskers diagram allows for comparing the results of the four types of tests, as well as for estimating the uncertainty of the instrumentation system that integrates the TSN synchronism. It is necessary to remember that in a box plot, the black lines mark the upper value and lower value positions where 95% of the samples were concentrated. Therefore, the upper end, identified with a black arrow, marks an uncertainty level with a 5% error in the phase measurements for each of the cases. The red lines represent the position of the median for the whole time series, while the blue box marks the lower and upper quartile limits.
Figure 7 shows the box plots for the Sigma-Delta converter tests.
In total, 95% of the measurements were below 20 ns and 100% were below 25 ns. This analysis serves as a basis for test type assurance. The results corroborate the manufacturer’s specifications concerning the phase error between channels. The TSN tests show two limits at 95% depending on the cable length. For 2 m, ±57 ns was obtained and for 10 m, ±85 ns. In both cases, 100% of the measurements were below 125 ns.
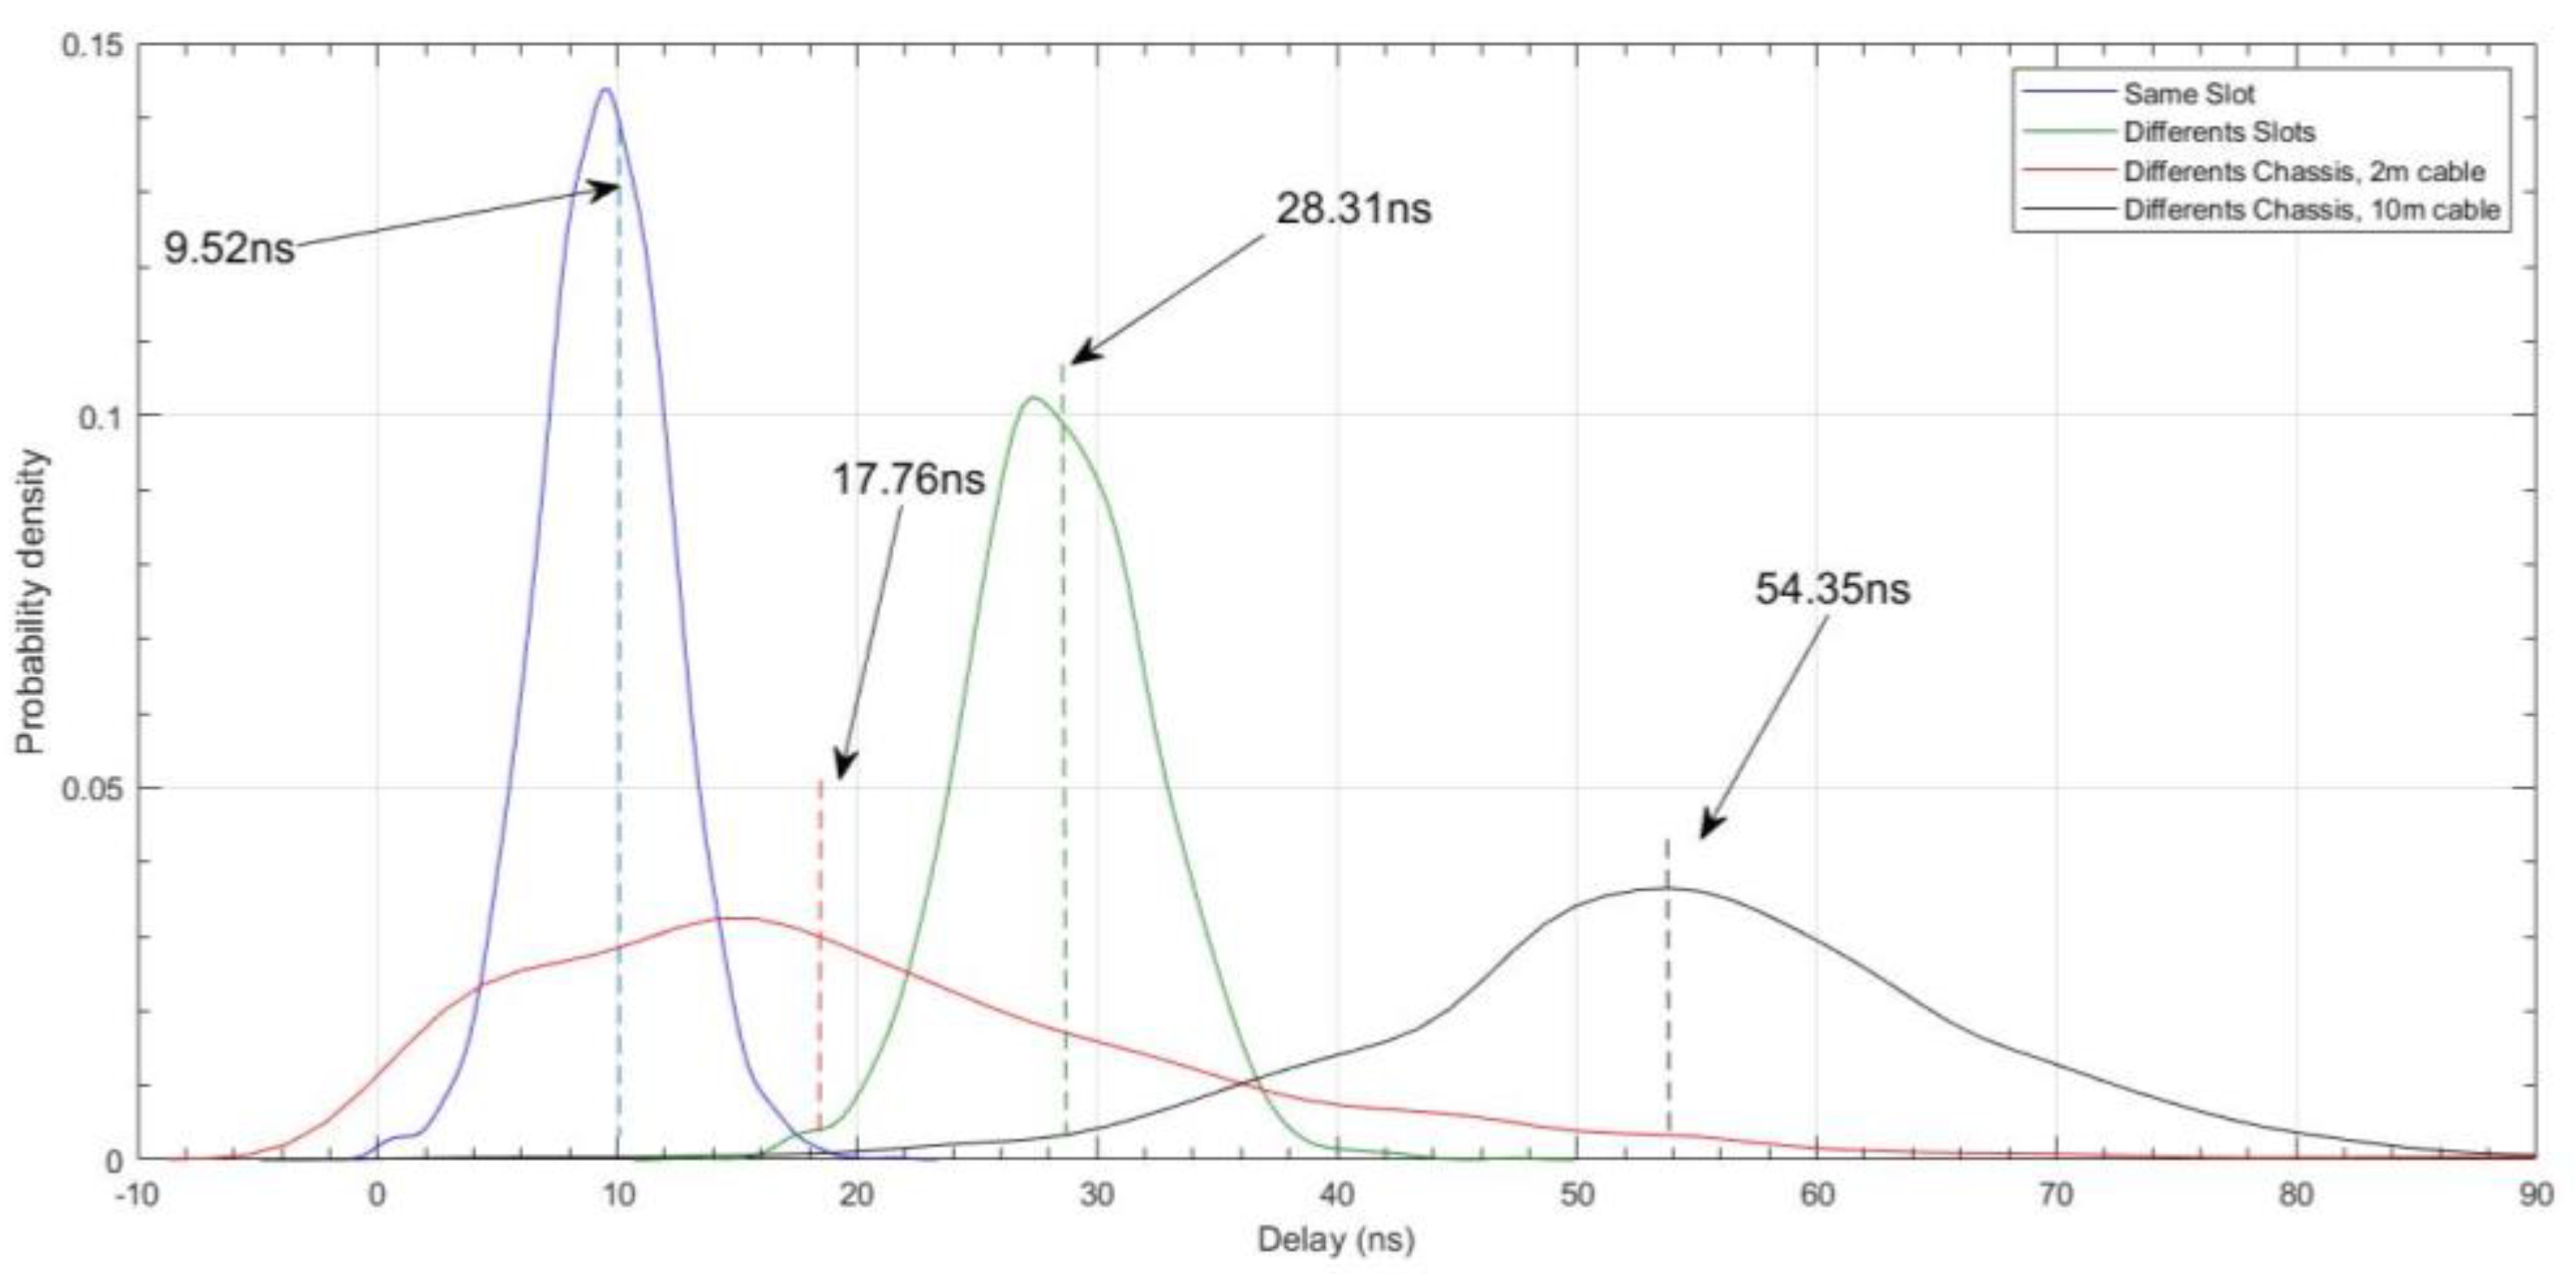
Figure 8 shows the non-parametric probability density (PD) for the four-time series, which allows us to estimate the degree of symmetry of the hypothetical distribution curve and also allows us to rule out behaviours with a bimodal distribution, but it can be seen that the series obtained did not have a behaviour with a normal distribution.
In both cases, the median had been included to observe the degree of symmetry. If the distribution is normal, the median should be at the centre of the curve and should coincide with the mode. In all cases, the distribution is not Gaussian, but for the Sigma-Delta converters capturing with two chassis and connected with a 2 m Ethernet cable, a very asymmetric distribution was obtained and in some cases with null values. This fact may demonstrate a certain level of error in the data capture process but similar results were obtained in consecutive tests.
3.2. Tests with Two Modules with 16-bit SAR Converters and Two Chassis
This set of tests were carried out to demonstrate that it is possible to use a 16-bit SAR converter type to replace the 24-bit Sigma-Delta converters while maintaining accuracy and precision in accordance with the requirements of the synchro-phasor standard. It is very important to note that in this case, no voltage transducers were used to estimate the quality of the synchro-phasor. A high-quality signal from a Tektronix AFG3022B was used to generate a waveform similar to that obtained from a transducer with an appropriate transformer ratio. The choice of external transducers is a topic that will be studied in the second part of this paper.
Figure 9 shows the equipment involved in the tests for the SAR-type converters. A 50 Hz, 20 Vpp sine wave signal was applied simultaneously from a signal generator. This signal was connected to the input of each of the devices and the deviation in the phase measurements of both the C0 and D0 inputs of the modules under test was calculated.
In the same way as in the previous tests, the phase difference between two consecutive channels of the same C-module was measured. Secondly, a test was carried out to determine the phase error between two channels of the C and D modules under test. The two modules were inserted into the same cDAQ-9185 chassis. The phase shifts from Channel-C0 and Channel-D0 were measured.
In the third test, captures were made with different cDAQ-9185s. Modules C and D were plugged into Slot1. The two chassis were synchronised with the TSN standard. The test allowed for verifying the synchronism for the simultaneous sampling of 20 Vpp voltages with 2 and 10 m Ethernet cables.
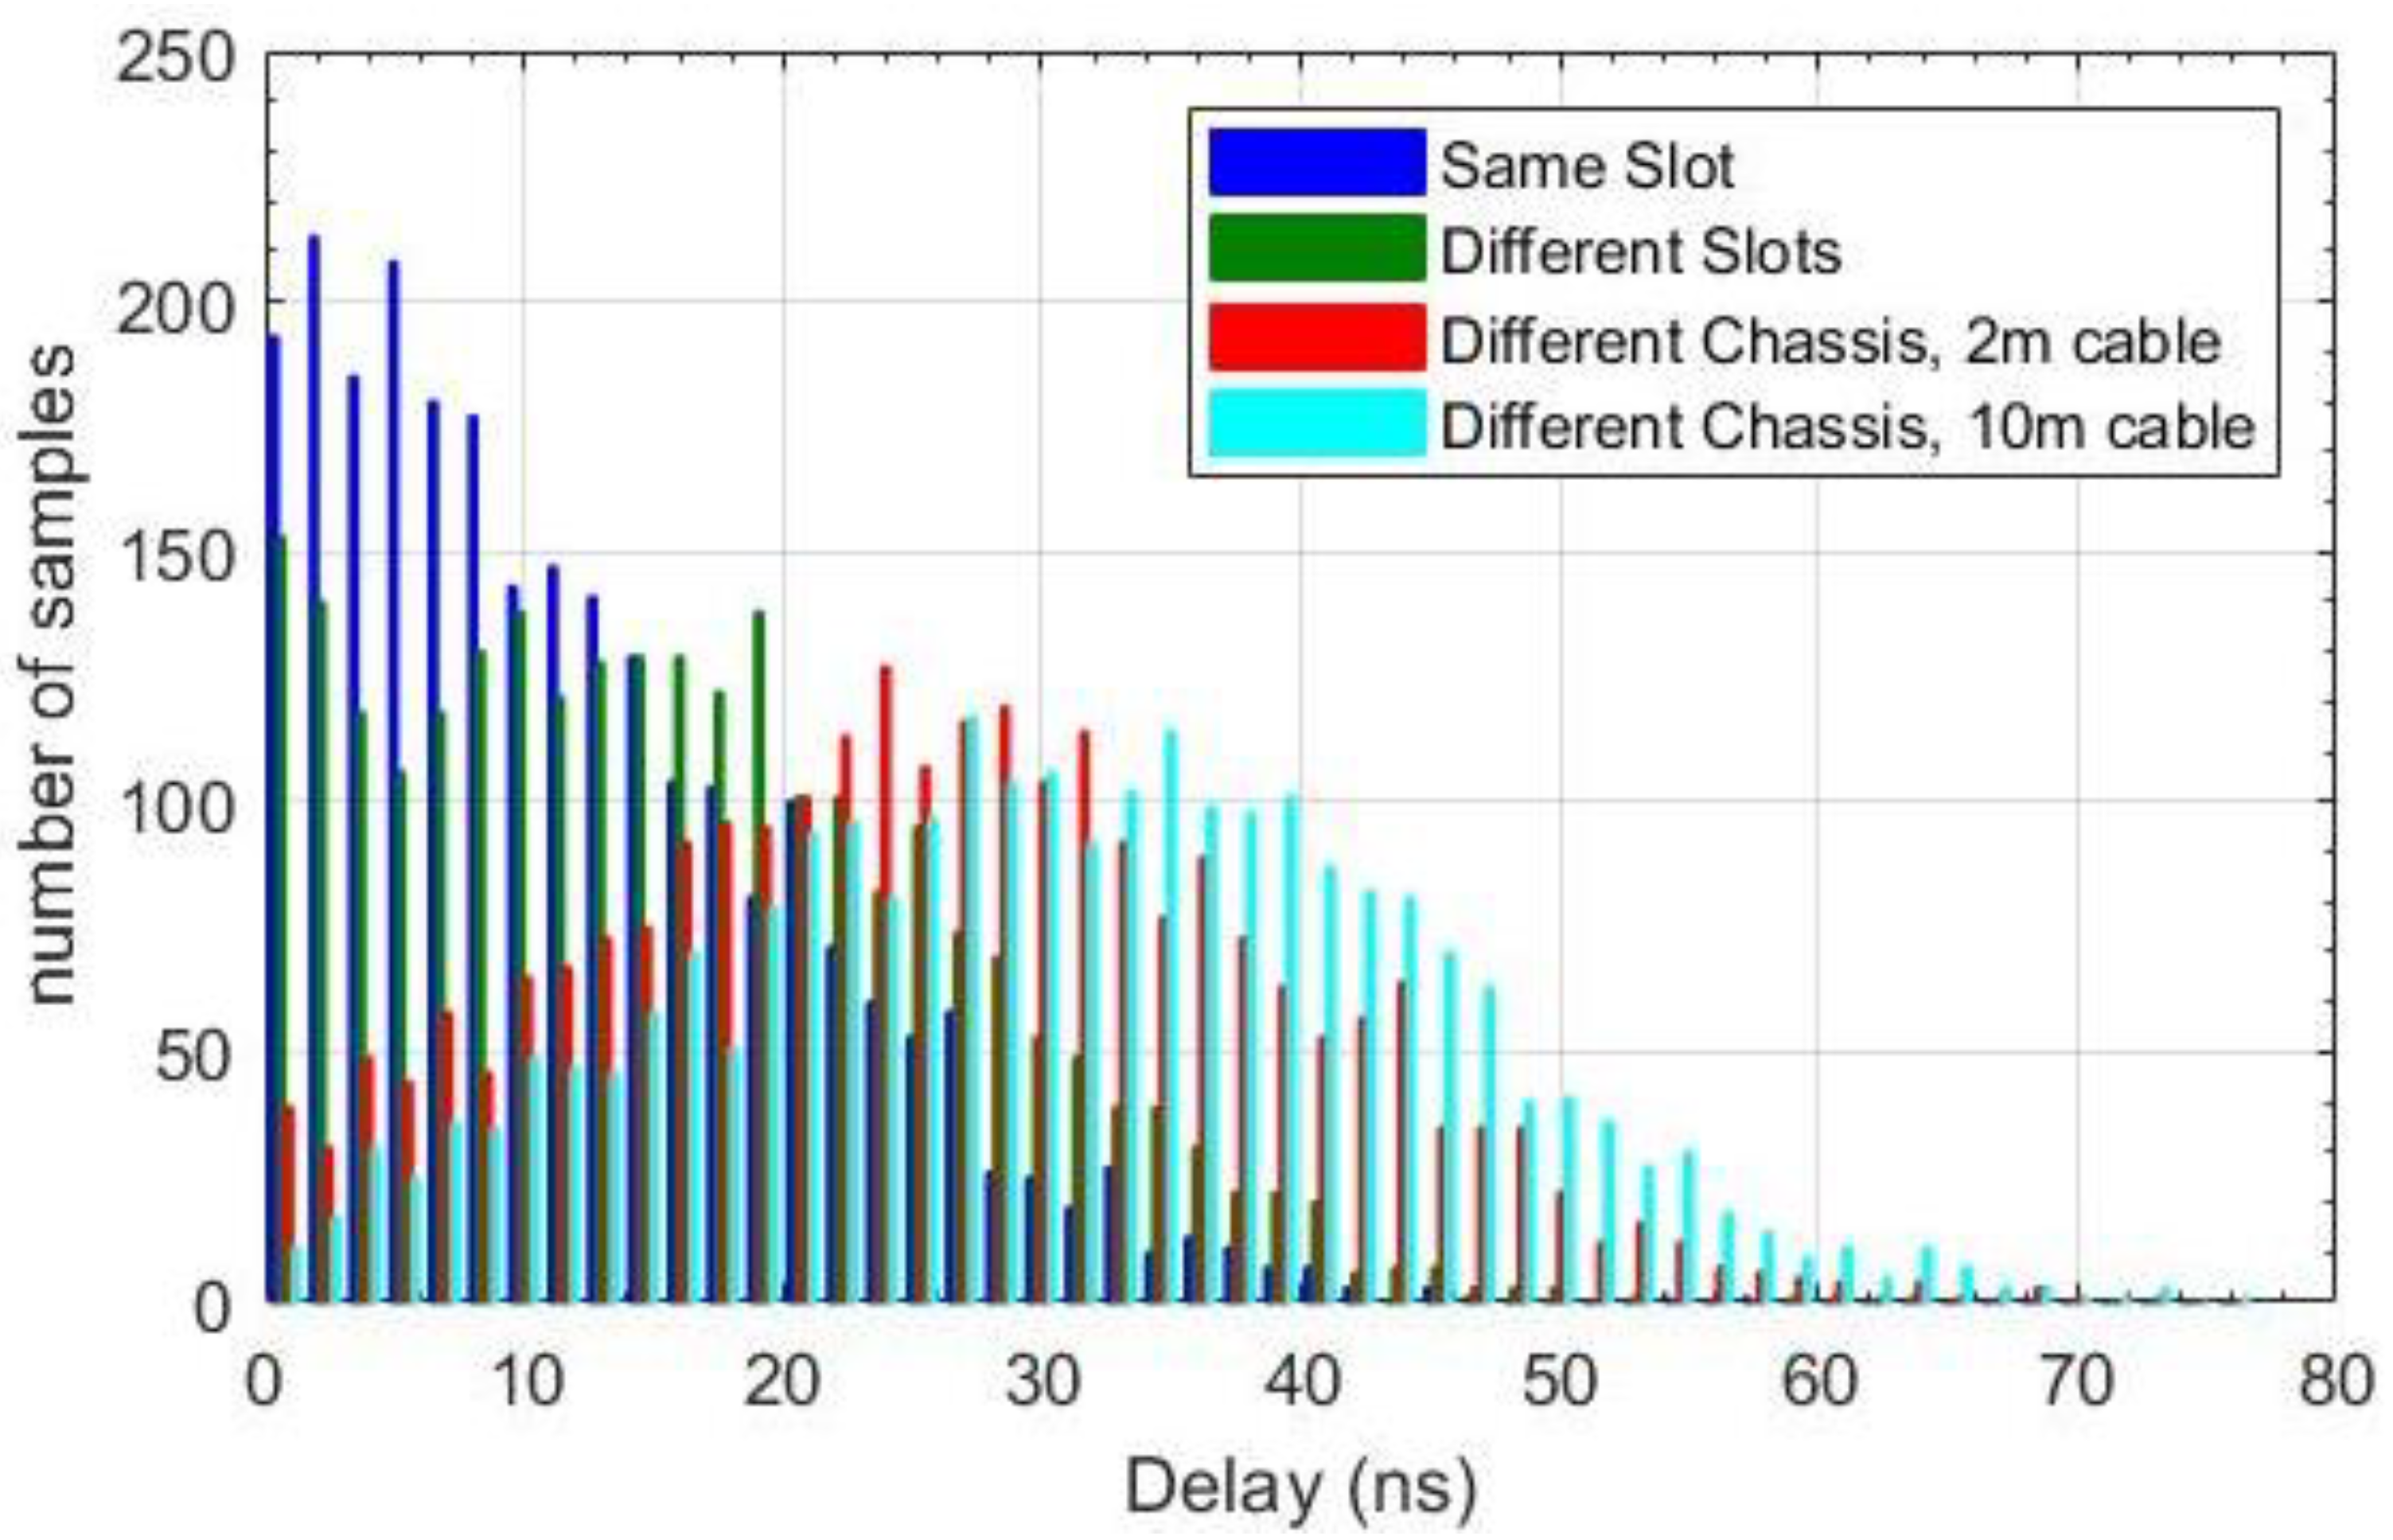
Figure 10 shows how almost all the time series data were below 80 ns, while
Figure 11 shows the types of distribution of the tests with TSN synchronisms concerning the reference tests in the same chassis. As can be seen in both figures, there is a larger dispersion, but the central positions of the distributions (medians) were below 50 ns.
Table 4 shows the accuracy of SARs integrated in a module with four channels, which is equivalent to a median of Me = 10.3 ns with a variance of σ
2 = 82.3 ns, notably much higher than that of the Sigma-Delta modules. When the channels were in different slots and in modules C and D, average errors of Me = 14.95 ns and a variance of σ
2 = 113.71 ns were obtained. The same table shows the responses when capturing with different chassis and Ethernet cable lengths of 2 and 10 m. The medians obtained were of very high quality, with values of 25.63 ns and 30.72 ns, but with a dispersion represented by variances of σ
2 = 168.43 ns and σ
2 = 185.66 ns. These are very good results with a consistent response depending on the length of the conductors.
The results with the Sigma-Delta converters in the previous section served as a reference to estimate whether the phase measurements of the 16-bit SAR converters met the requirements of the synchro-phasor standard. The results in
Table 4 were very similar to those obtained with the 24-bit Sigma-Delta converters in the previous section, but it is necessary to estimate the uncertainty levels for their integration in a distributed instrumentation system. Again, we used the box-and-whisker plot to identify where 95% of the samples were concentrated.
As depicted in
Figure 12, when measuring with two consecutive channels, the measurements were below 38 ns for 95% and below 60 ns for 100%. The results corroborate the manufacturer’s specifications concerning the phase error between channels. The TSN tests showed two limits at 95% depending on the length of the cable. For 2 m and 10m lengths, ±63 ns and ±68 ns were obtained, respectively. In both cases, 100% of the measurements were below 80 ns.
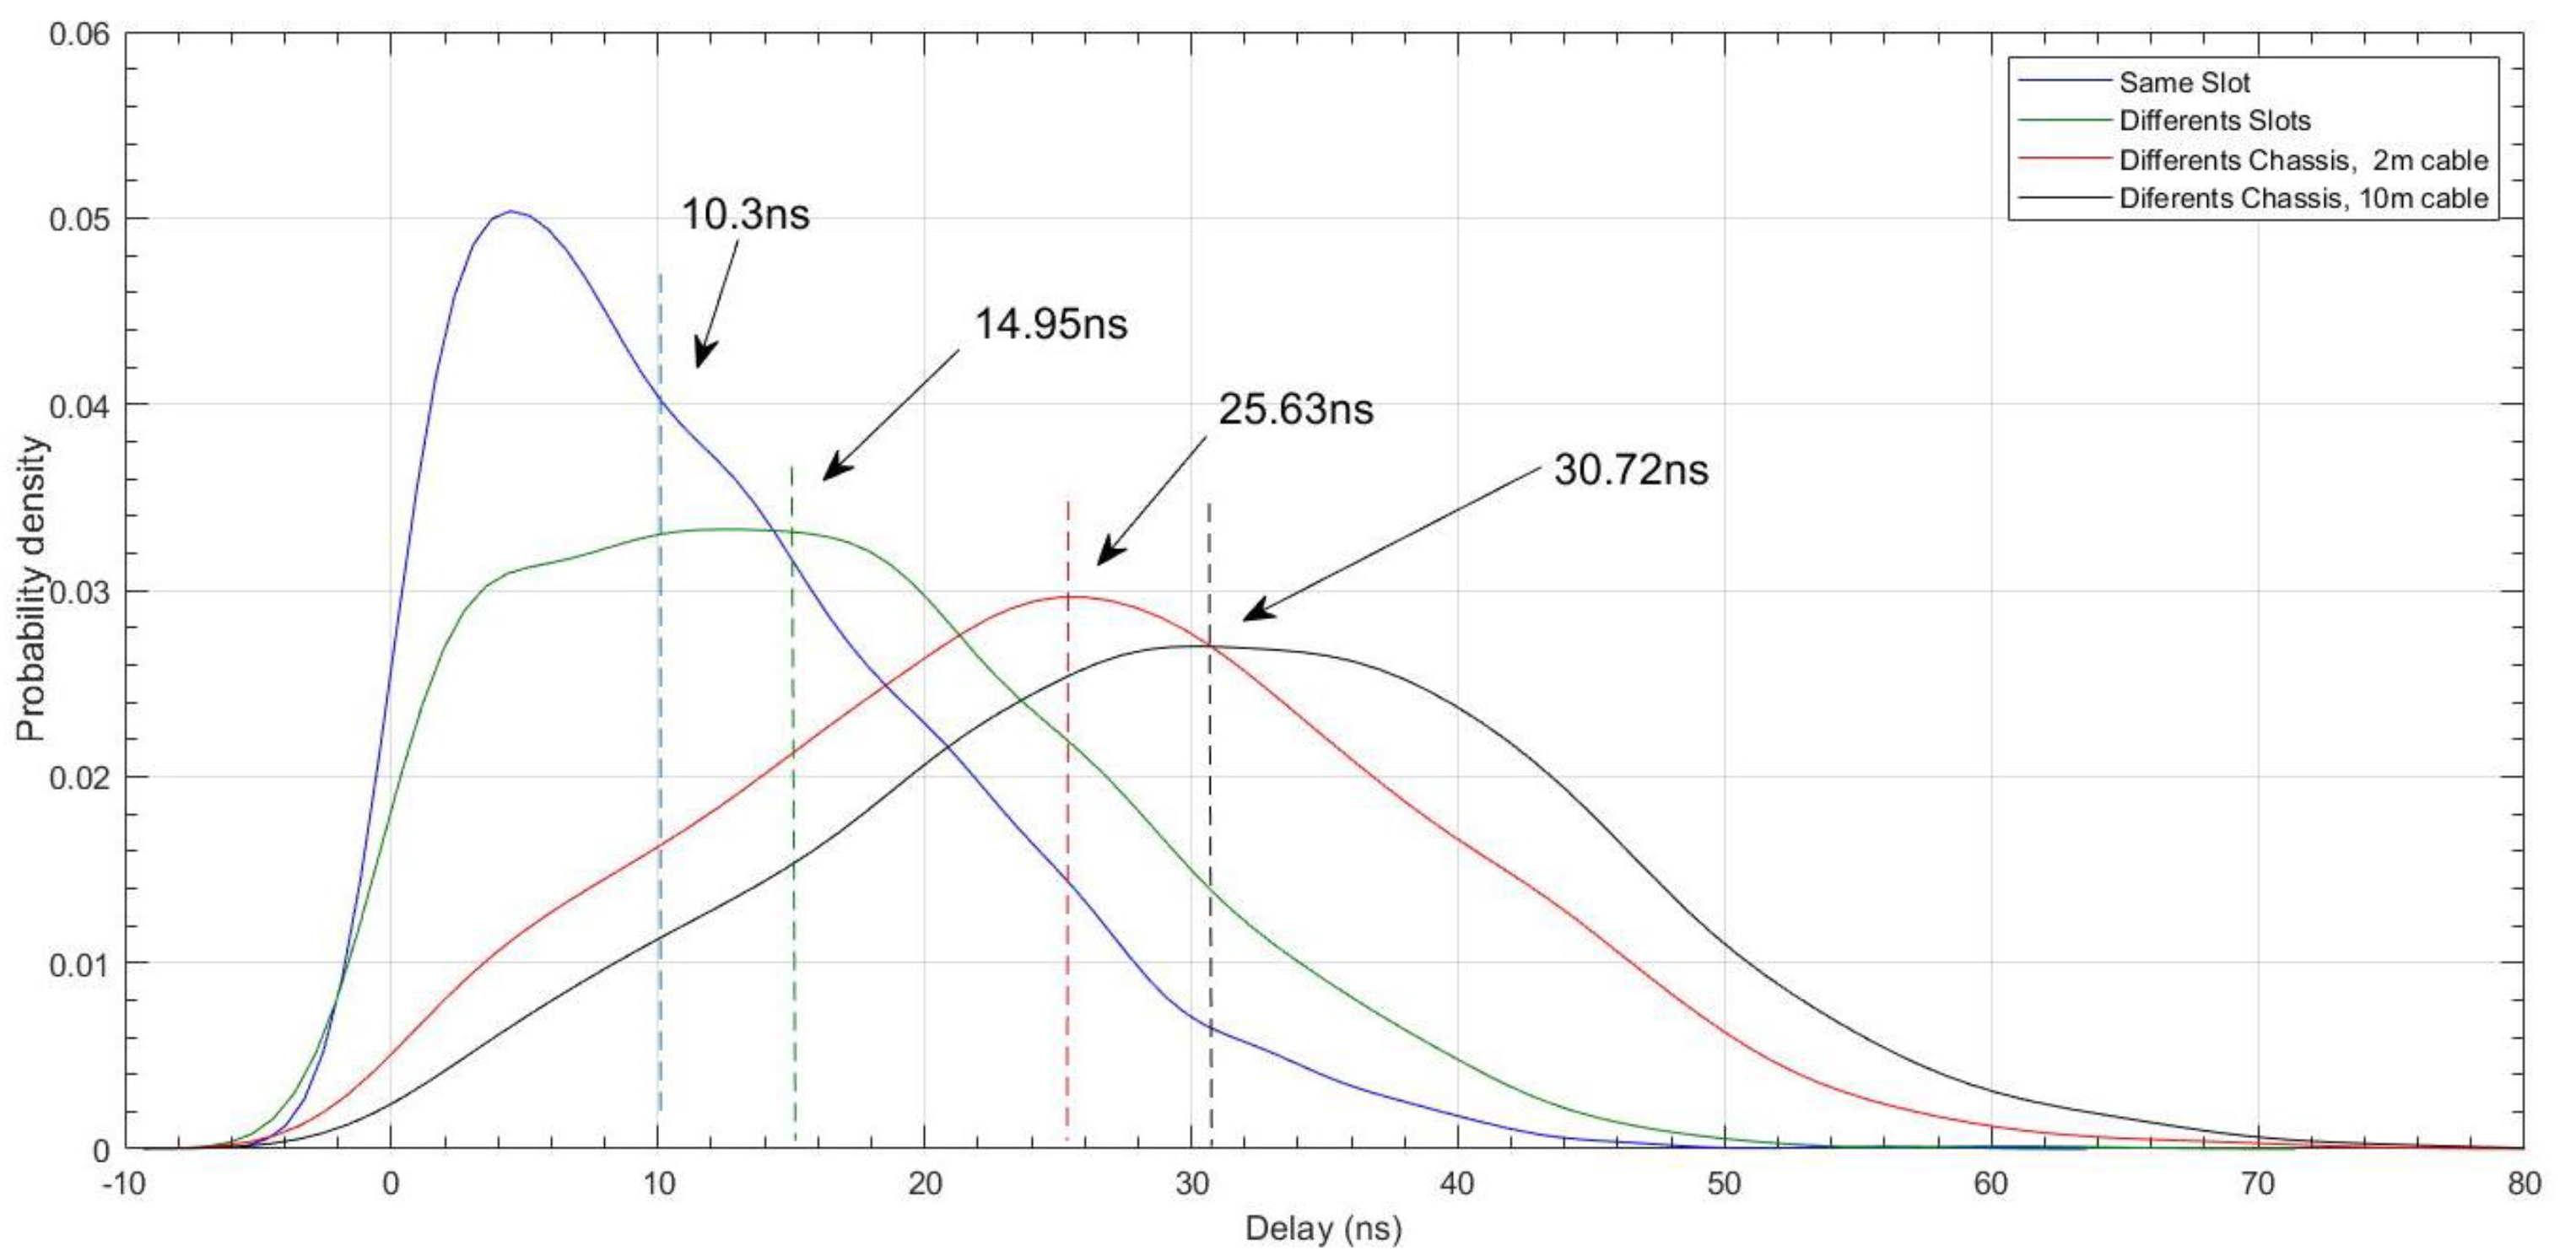
Using the probability density plotted in
Figure 13, it was observed that the time series obtained did not correspond to a normal distribution. This occurred mainly in the tests carried out with two consecutive channels for the same module with SAR converters. The tests with TSN synchronism did evolve with a curve very close to a Gaussian bell. The mode in both cases was close to the median.
In
Table 5, all results with an uncertainty equal to 5% for the two types of architectures under equivalent test conditions have been grouped. Simultaneous sampling with cDAQ-9185 chassis was achieved for the SAR architecture with average values of 25 to 31 ns, and for the Sigma-Delta with average values of 20 to 55 ns.
As a conclusion, a comparison with the phase errors for a 95% confidence interval has been included in
Table 5 and it was observed that it rigorously complies with the specifications for the synchro-phasor standard. It achieved a degree of accuracy well above the specifications for a distributed measurement system with equipment that is synchronised to the TSN standard and that can be separated by 10 m.
3.3. Equipment and Procedure for the Analysis with Four Chassis
In the tests of the previous phase, the quality of a distributed capture system with cDAQ was analysed when the TSN standard was used as the synchronisation medium. The response of two of the four channels of the same Sigma-Delta converter of the ADS1274 24-bit chip integrated into the NI-9242 modules was taken as a reference. This converter was analysed in detail by “Yu et al. [
25]” as a proposal for a distributed measurement system. With the reference of this high-precision capture system, the results were analysed with the AD7655 16-bit converter integrated into the NI-9215 modules. In the first phase, the level of synchronism was analysed with equipment located at a maximum distance of 10 m.
In the second phase, the tests were carried out in two consecutive stages with the distribution shown in
Figure 4 and the two types of Sigma-Delta and SAR converters, as indicated, were integrated in the NI-9242 and NI-9215 modules. The study was carried out with the aim of observing the behaviour of the distributed capture system in conditions very similar to those that will be found in the photovoltaic plant; the results were compared to assess whether it is acceptable to use the lower-cost NI-9215s, guaranteeing the level of synchronism required of the capture system in the synchro-phasor standard, instead of the NI-9242s with TSN synchronism and with an Ethernet cable length of up to 75 m. Category 6 Ethernet cables and an ASUS RT-AC66U router with access speeds of 100/1000 MB were used.
In these tests, measurements were carried out in three different configurations with four chassis, as shown in
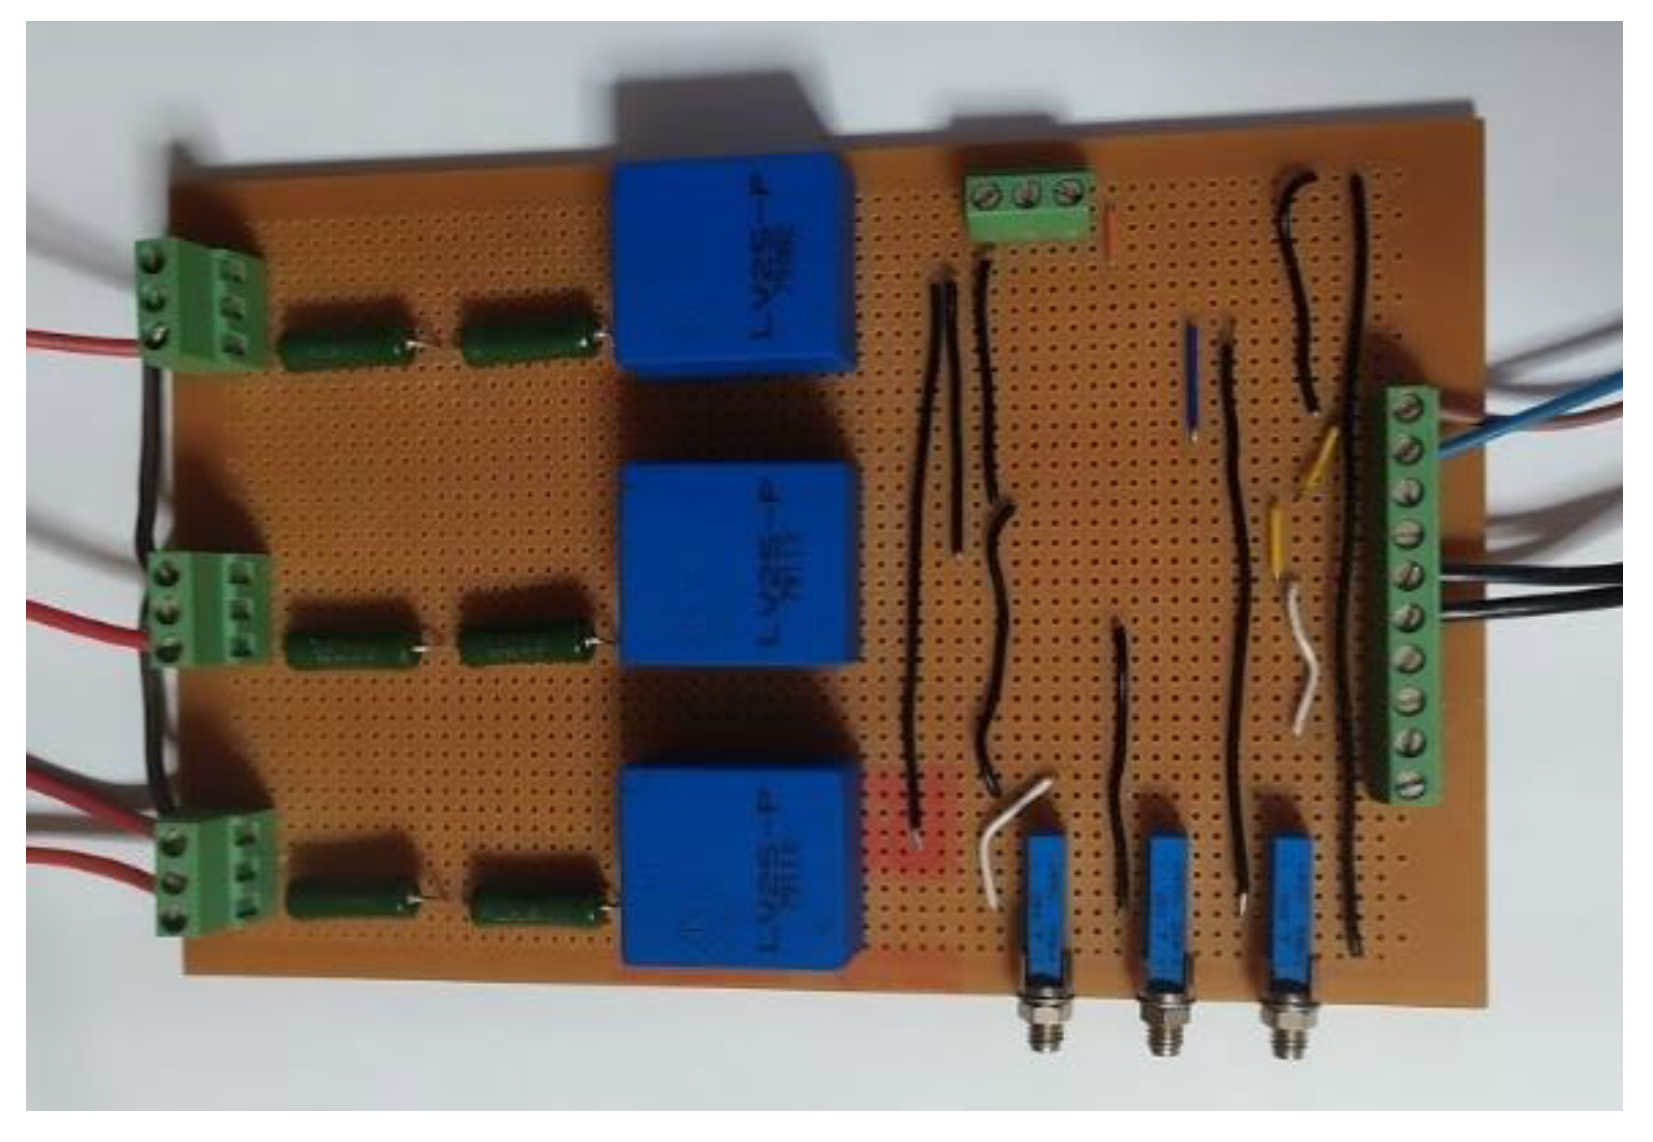
Table 2. In all cases, they were connected to a mains supply with a Vrms = 230 V and a frequency of 50 Hz. The NI-9215 modules used LEM LV-25 active transducers and the tests were carried out in two stages. In the first stage, the analogue channels were connected to two LV-25 transducers to observe the possible delays associated with the sensors, and in the second stage, the two inputs were connected to a single LV-25 LEM output.
This set of tests will be compared with the results obtained in
Section 3.4, which was dedicated to Sigma-Delta converters under the same test conditions but without using the LV-25 LEMs because they integrate the high precision VMN221 dividers from CADDOKC inc.
Figure 14 and
Figure 15 show a picture of LV-25 LEMs and VMN221 high-precision resistor networks integrated into a NI-9242 module.
The tests were performed consecutively with two, three, and four cDAQ-9185 chassis, and an in-line topology with 50 m, 75 m, and 10 m. Ethernet connection was chosen, as shown in
Figure 16, at one end connected to the ASUS RT-AC66U router and at the other end connected to the cRIO-9054, acting as the TSN master.
3.4. Tests with Sigma-Delta Converters with Four Chassis
In the first stage of this phase, the tests focused on the analysis of the Sigma-Delta converters with the distribution shown in
Figure 4. The study was carried out to observe the behaviour of the distributed capture system under the same conditions as the tests with the NI-9215 modules. As mentioned above, these tests served as a reference to determine whether this conversion technology could be replaced by SAR converters.
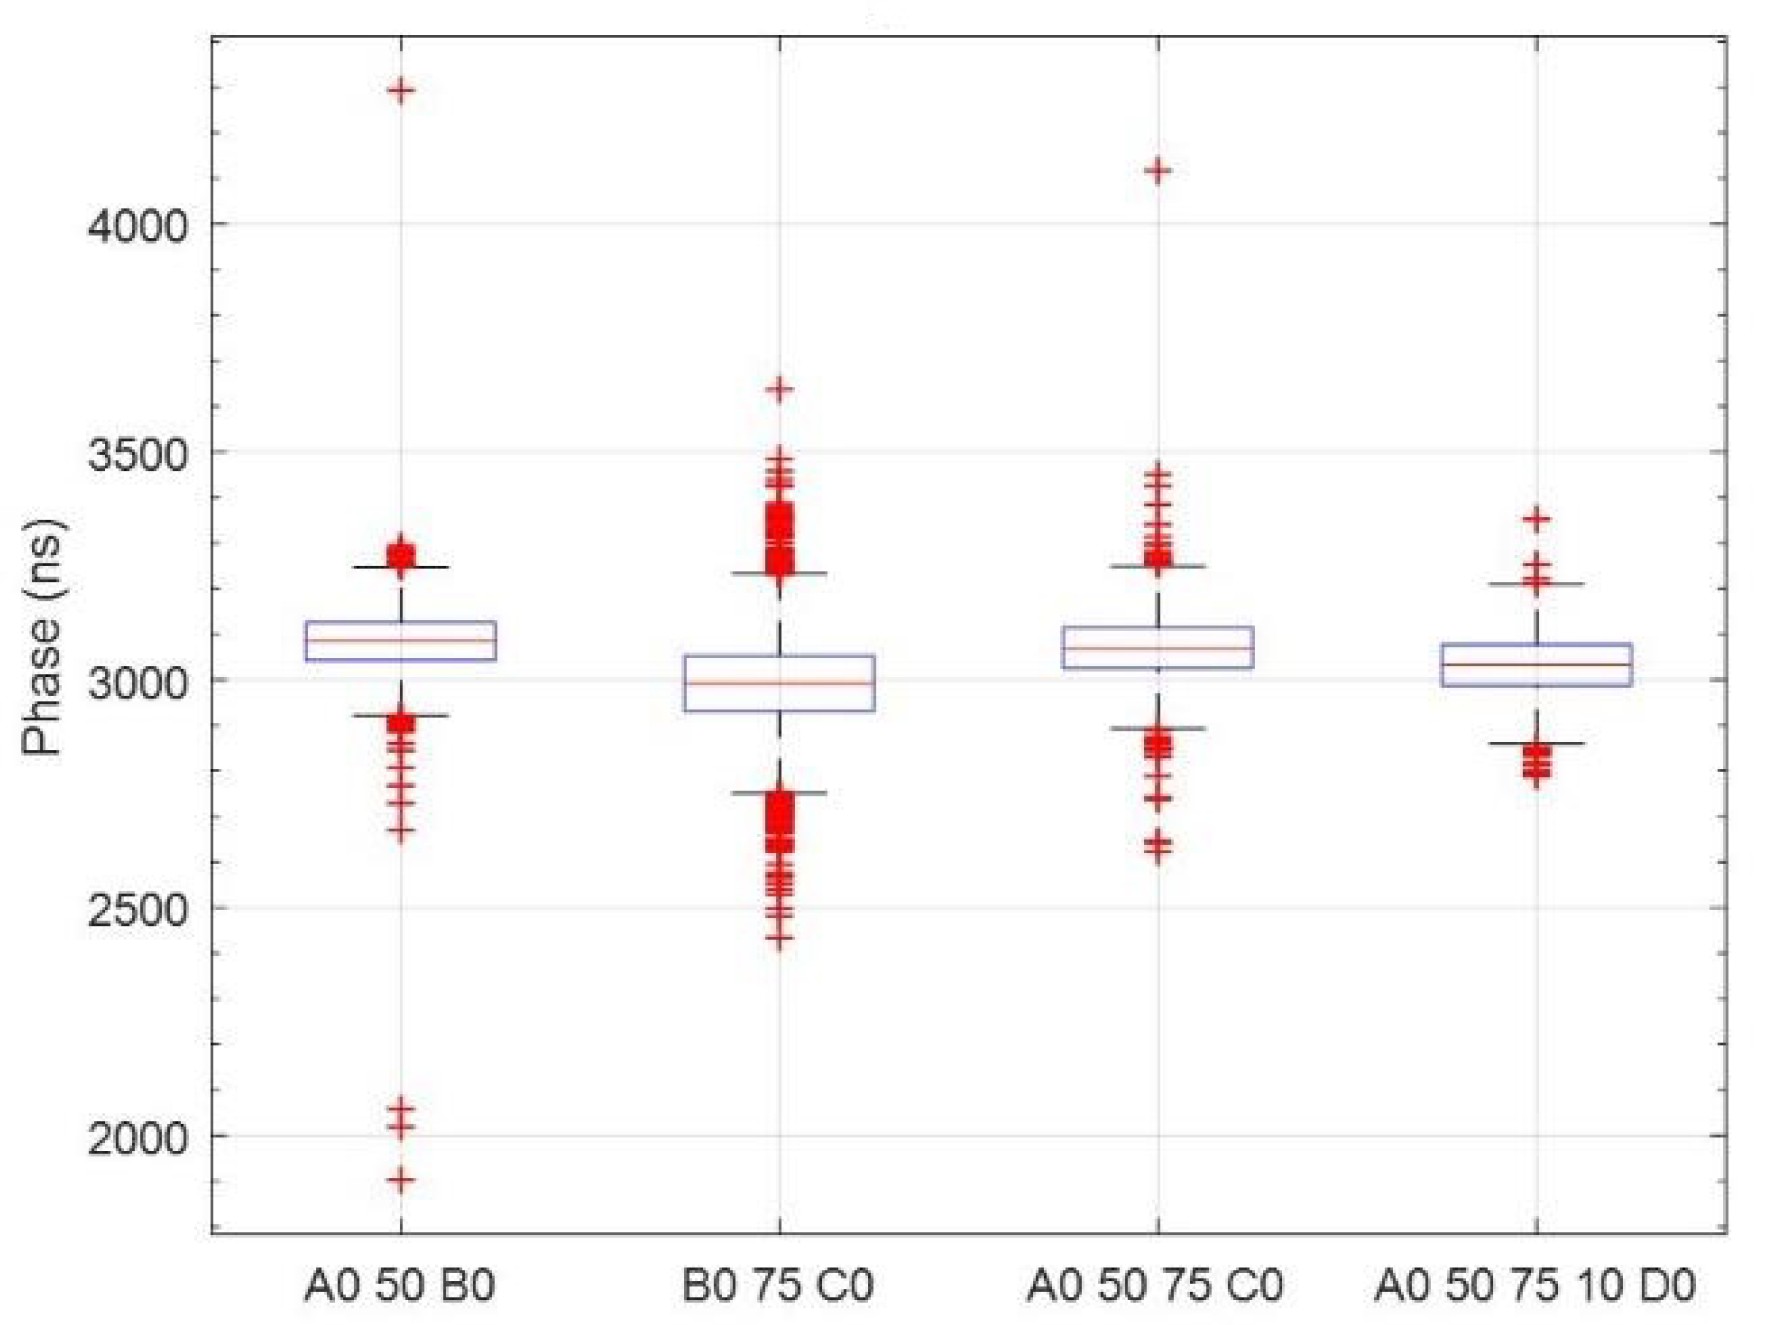
The box plot in
Figure 17 shows that the results were below 50 ns for a 95% distribution of the samples with two chassis and with both 50 m and 75 m cabling. These are undoubtedly the highest quality results, guaranteeing an uncertainty of 5%. Conversely, this quality was progressively reduced when three and four chassis were used. In no case did 95% of the samples exceed 110 ns.
Figure 18 shows a response with an almost Gaussian distribution for the four tests, with a dispersion level of less than 40 ns for the first three tests and less than 190 ns when using four chassis.
The results in
Table 6 show a median that increases progressively from values of 21.5 ns to 80 ns. This is a very high-quality response that facilitates the comparative study with lower resolution 16-bit converters with a lower time response.
3.5. Tests with SAR Converters with Four Chassis
In the second stage of this phase, the tests focused on the analysis of the SAR type converters with the distribution as presented in
Figure 4.
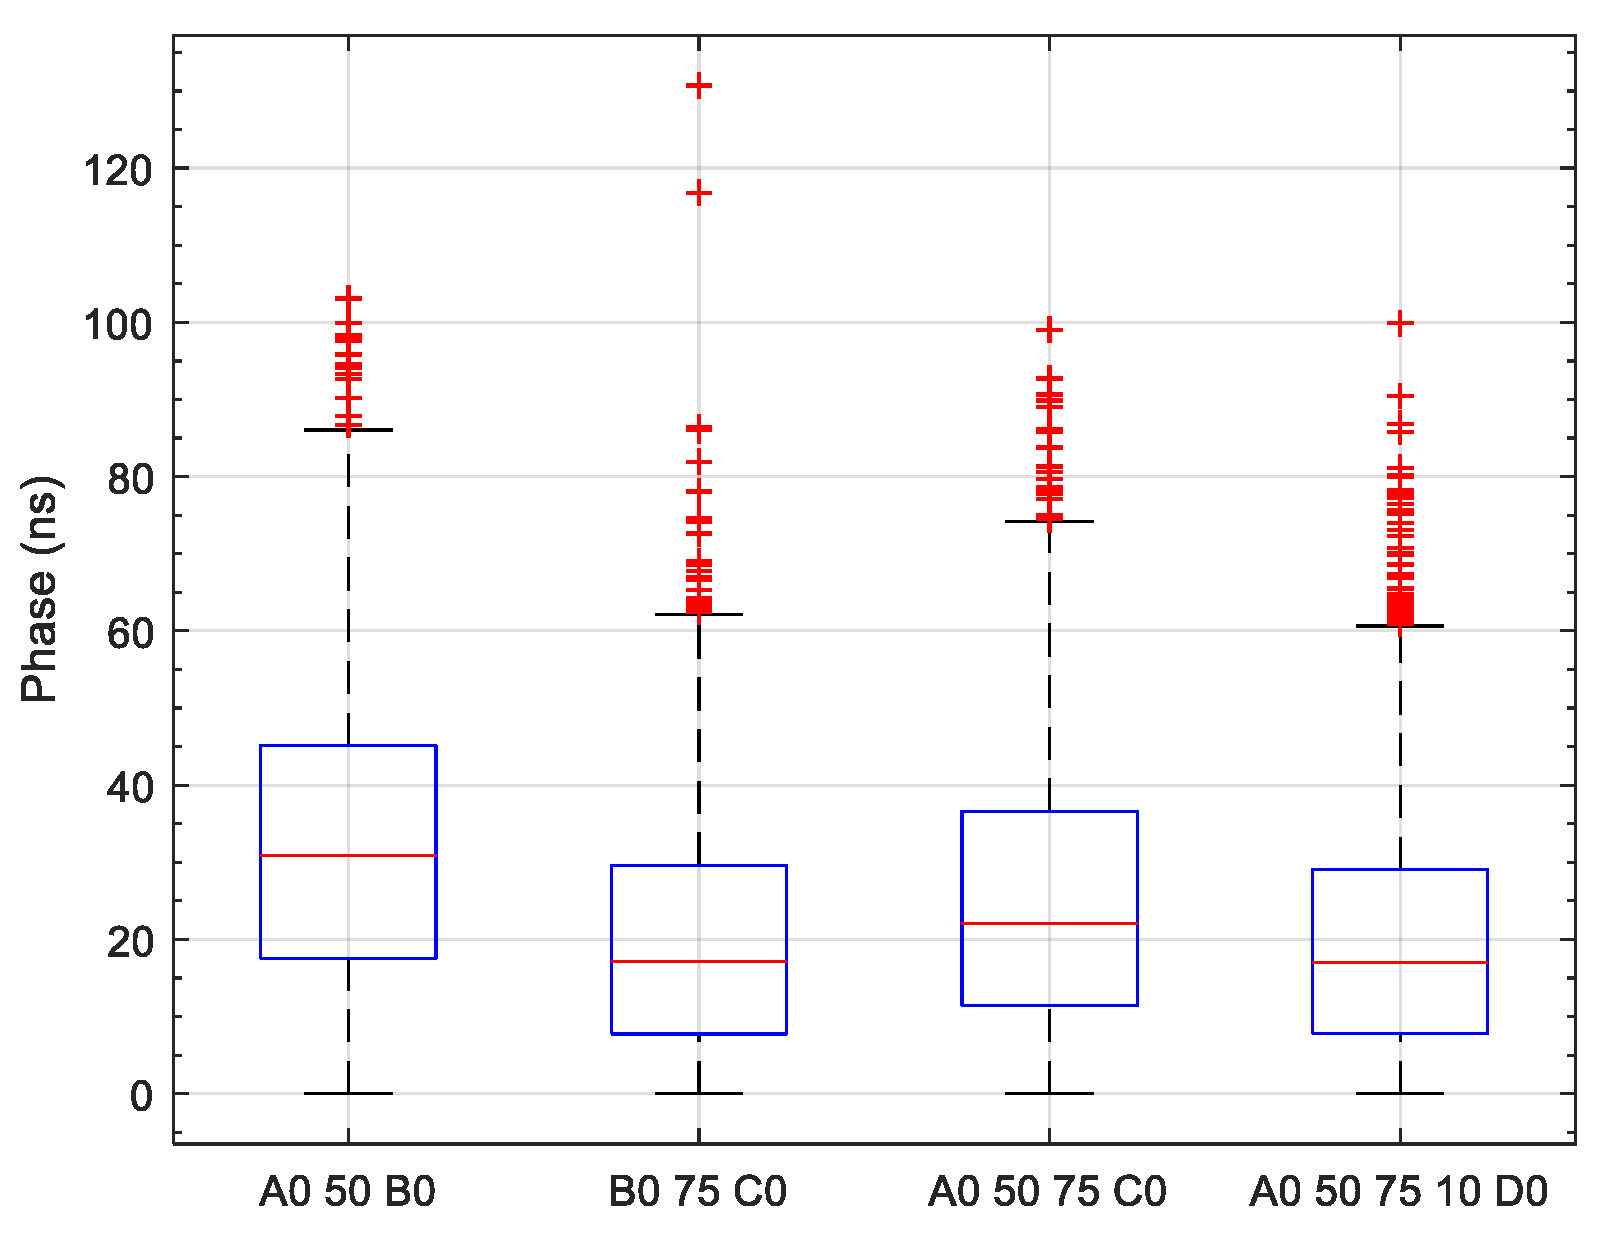
In this phase, we analysed the results obtained with the box-and-whisker plots (
Figure 19) as well as the type of distribution with the non-parametric probability density (
Figure 20). For the measurements with three and four chassis, a sequence of 50–75 m and 50–75–10 m was chosen. With two chassis, the results with 50 m and 75 m conductors were compared.
It was observed that the average errors were approximately 3 μs. This was primarily due to the externally connected LEM LV-25 voltage transducers at each of the NI-9215 inputs.
In this second test, it was observed that the phase errors were only attributable to the SAR converters and to the synchronisation technique with TSN. The input signal for the two channels derived from the same transducer output.
Figure 21 compares the tests with two chassis for two different configurations. With 50 m and 75 m Ethernet cables, the length of the conductor had very little influence. In total, 95% of the measurements were below 100 ns and 100% were below 140 ns. In both cases, optimal results were obtained. In total, 95% were below 80 ns and 100% were below 100 ns.
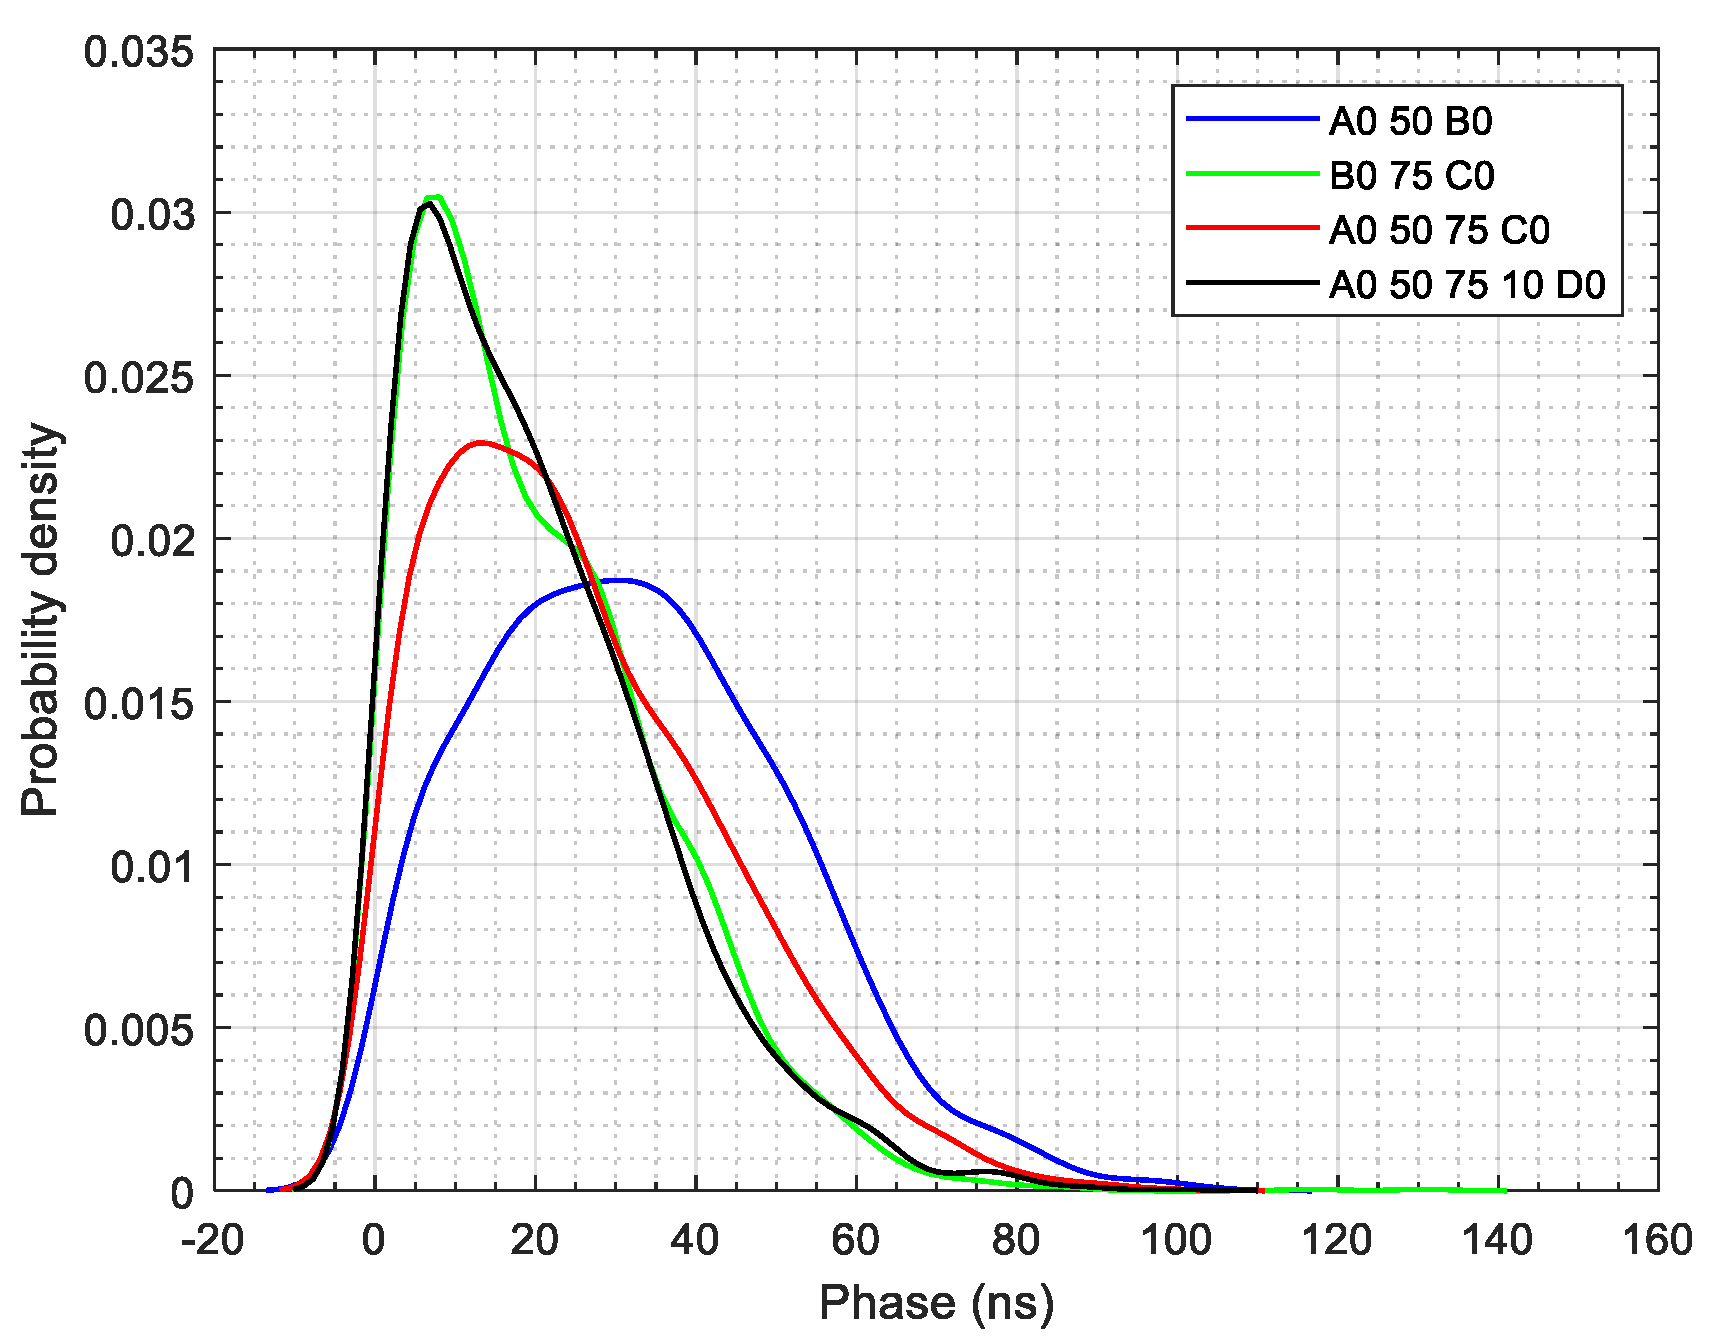
With the probability density curves, we still observed that the distributions were not Gaussian, but all four curves for the test type in
Figure 22 shared the same type of symmetry. Again, anomalous behaviour was observed. The estimator approximated the response to a curve with values less than zero. It is considered very likely that some values in the time series were erroneous.
In comparing the results in
Table 7 and
Table 8, the time response of the LV25 LEMs can be perfectly appreciated, which is around 3 μs. It is very reasonable to use CADDOCK Electronic’s high-precision resistor divider technology to guarantee uncertainty levels very close to those obtained in
Table 8. This technique to attenuate the voltage deriving from the supply network is the one used by the NI-9242 modules.
A comparison of the results in
Table 6 for the Sigma-Delta converters with those obtained for the SAR converters in
Table 8 shows that the latter had a lower variance and standard deviation. The data were more clustered around the mean but this degree of dispersion did not affect the quality of the timing system because 95% of the values were below 100 ns. They were adequate for the objective set from the beginning. Moreover, the response of the LV-25 LEMs was within the admissible tolerance range for a timing system that is required to meet the µPMU standard.
This set of results guarantees compliance with the specifications of the synchro-phasor standard and ratifies the expectations of the TSN standard, which includes among its specifications a guaranteed resolution of at least 1 µs for the synchronisation of multiple devices connected to a conventional Ethernet network. Tests with National Instruments’ technology not only guarantee this level of synchronism but can also claim that values in the order of 200 ns can be achieved. The data obtained were very similar to those published by the research work of “Agarwal et al. [
26]”. However, in this case, a different NI technology has been used. In this research study, we chose the cRIO as the TSN master and the cDAQs as the TSN slave because of their design compatibility with industrial applications. Moreover, these results guarantee synchronism levels below 1 µs for distributed captures. It is conceivable that this architecture could be part of a cyber–physical system for high-quality data exchange with digital twins that can contribute to the optimisation of the energy produced in photovoltaic plants [
7]. We are currently in a continuous process of digitisation of industrial sectors and digital twins are making a very decisive contribution to sectors such as energy [
27].
4. Conclusions
In this work, a novel distributed synchronism system based on the Time-Sensitive Networking (TSN) standard has been validated for its integration in an architecture oriented towards the high-resolution digitisation of photovoltaic generation systems.
Experimental results and statistical analysis show that it is possible to deploy a distributed acquisition system with a synchronism level lower than 1 µs. The system was specially designed for a photovoltaic plant with a modified µPMU that would act as a TSN master and as a centralised capture system based on DAQmx technology.
To compare the 2012 technology with the current one, the results obtained with the PTP technology applied to smart grids can be analysed [
9]; it is a publication of the (PAIDI-TIC-240) research group of the University of Cordoba in 2013. With PTP synchronism technology for cRIOs, the manufacturer guaranteed a distributed synchronism of up to 1 ms. The tests published by the group estimated levels close to 75 µs. This paper analysed the results with different levels of network traffic. The current methodology was not analysed with this type of conditioning because the standard establishes a traffic-independent method as a basis. It is currently possible to combine PTP and TSN in the same cRIO-9054 chassis to synchronise devices with both technologies independently. This is an alternative that will be explored to combine critical systems that need a higher level, such as PMUs and other ancillary capture systems with less stringent standards but that require at least 1 ms of a clock coordination level. Such lower-cost capture systems would ensure much better time-stamping than NTP.
The results obtained in the laboratory with a configuration similar to the one to be used in photovoltaics were of very good quality. With the NI-9215 with four chassis, a guaranteed response of 100 ns was obtained for an uncertainty of 5%. In the plant, the separation between the transformation centres CT1 and CT2, and the transformation centres CT3 and CT4 was 150 m. The IEEE 802.3 standard for structured UTP Category 6 cabling recommends a maximum link length of 100 m. The ideal solution to obtain very similar results is to add a TSN compatible switch at an intermediate point to link two 75 m conductors. Future work will compare this alternative with the use of a 150 m cable, which is at the permitted limit but not recommended.
In comparing the test results in
Table 5 with those in
Table 8, the response with 75 m and 50 m cables in some of the configurations outperforms the results with cable lengths of 2 m and 10 m. This is because three factors played a role: a more advanced ASUS 100/1000 MB router with a higher transfer rate, category 6 cables with higher bandwidth, and a firmware upgrade of the cDAQs were used in the second phase.
Additionally, it has been verified according to the results in
Table 7 and
Table 8 that for the measurements of distribution network voltages, it is essential to use high-quality resistive dividers instead of active transducers such as the LEM LV-25. Dividers with very low-temperature coefficients and very high impedances guarantee measurement quality and long-term stability.
Future work will analyse the level of synchronism that can be achieved for simultaneous measurements of power quality parameters with measurements from a grid of 32 irradiance sensors distributed throughout the PV plant and connected to the cDAQs with four NI-9203 modules with eight current loop inputs.
Another major challenge concerns the creation of a local database with a time resolution of at least 3 s to allow for a predictive analysis of the evolution of the power generation of the plant depending on the passage of clouds. The same database would include the phasor information from the µPMU, which acts as the main source of synchronism and collects data on both the quality of the supply and the 32 irradiance measurements.
The tests included in this work have made it possible to verify that the same cRIO can act as a µPMU and as a receiver of data from the rest of the transformation centres. This part of the research will be carried out jointly within the framework of a coordinated project called “Strategies for Aggregated Generation of PhotoVoltaic plants” (SAGPV), led by the Research Group on Computational Instrumentation and Industrial Electronics (PAIDI-TIC-168) of the University of Cadiz. Specifically, the main contribution of the group (PAIDI-TIC-240) will be framed in the subproject called “Monitoring and Integration of energy data with Seamless Temporal Accuracy for photoVoltaic plants” (MISTA). This project addresses the monitoring and integration of data from energy systems with high-quality synchronism in photovoltaic plants.
Finally, it can be stated that the evaluated architecture can meet new challenges with the integration of data from the capture system. A monitoring system of this quality can exchange data in real-time with digital twins for the optimisation of the energy produced in the plants.


 ,
, 


