Article

Out-of-Plane Experimental Study of Strengthening Slender Non-Structural Masonry Walls

Faculty of Civil and Geodetic Engineering, University of Ljubljana, Jamova 2, SI-1000 Ljubljana, Slovenia
*
Author to whom correspondence should be addressed.
Appl. Sci. 2021, 11(19), 9098; https://doi.org/10.3390/app11199098
Submission received: 18 August 2021 / Revised: 24 September 2021 / Accepted: 27 September 2021 / Published: 29 September 2021

Abstract

:
Non-structural masonry partition walls, which are mainly designed to functionally separate spaces in the buildings and provide physical barriers between rooms, were traditionally built from either solid or hollow clay units or autoclaved aerated concrete blocks. Recent earthquakes have revealed the high vulnerability of these elements, even in the case of low to moderate seismic events. Public buildings (e.g., hospitals and schools) are particularly vulnerable. Due to their greater floor-to-floor heights and the response spectra of floors, the dynamic response of primary structure may provoke significantly higher seismic loads on partition walls. The main goal of the presented experimental study was to investigate the behavior of slender partition walls loaded out-of-plane with a simple and cost-effective approach that may be applied through routine refurbishment works. Eleven full-scale slender non-structural masonry partition walls were built with brickwork and cement–lime mortar. Eight of them were additionally strengthened with different techniques, including glass fiber-reinforcing fabric and low-cost glass fiber-rendering mesh. To evaluate the efficiency of the applied strengthening solutions, out-of-plane quasi-static cyclic experiments were conducted. By applying meshes over the entire surfaces, the resistance was significantly improved with the low-cost approach reaching half of the resistance of the commercially available strengthening system preserving the same displacement capacity.

1. Introduction

Seismic activity has been a driver of widespread damage and destruction in numerous locations around the globe. In urban areas, the collapse of structural or non-structural elements of buildings (e.g., masonry partition walls, chimneys, parapet walls, etc.) in the event of a strong or even moderate earthquake is often the main cause of a large number of injuries or even fatalities. Many researchers [1,2] have previously reported that losses caused by the damage of non-structural elements in public buildings can considerably exceed losses caused by the damage of structural elements. From the recent post-earthquake reports following L’Aquila (2009) [3] and Central Italy (2016) [4] earthquakes in Italy, as well as earthquakes in Croatia (Zagreb and Petrinja 2020), it can also be concluded that the collapse of non-structural elements represents a significant share in the sum total of economic losses. Both Italy and Croatia have similar architectural heritage and geotectonic characteristics. A large number of damaged and collapsed non-structural masonry elements have been reported following earthquakes affecting Italian buildings built before 1970 when there were no modern earthquake-safe structural design requirements [4]. Non-structural partition walls built of solid or hollow clay bricks are common in existing buildings. In post-earthquake reports from Petrinja [5,6] and Zagreb [7], the damage or collapse of such non-structural elements was frequently observed. The main culprits for this kind of collapse are great wall heights, a high specific mass of solid brick masonry, and low out-of-plane seismic resistance. Damage to non-structural elements can already occur at lower earthquake intensities due to their high vulnerability and the influence of primary structure dynamic floor response. This can result in an increased seismic load on non-structural elements on upper floors, depending on the local resonance impact [8]. Therefore, special attention needs to be given to the non-structural masonry elements where their dynamic properties, such as natural frequencies and damping, should be considered in the process of design.
In recent decades, there has been an increasing number of investigations focusing on the out-of-plane behavior (e.g., [9,10,11,12]) or a combination of in-plane and out-of-plane behavior (e.g., [13,14,15]) of masonry infills. Despite the fact that masonry partition walls made of horizontal hollow bricks are widely used in Europe’s existing buildings, there is only a limited number of experimental studies addressing the behavior of slender non-structural masonry partition walls [16]. Thus, the knowledge of their behavior and design provisions is limited. Recently, a group of researchers [17] conducted in situ out-of-plane experiments on partition walls made of solid and hollow bricks, where the seismic load was simulated with airbags. In general, unreinforced masonry (URM) walls exposed to horizontal loads perpendicular to their plane are the most vulnerable elements in terms of failure mechanisms, as evidenced by post-earthquake damage observations of both public and private buildings [18]. Due to the out-of-plane vulnerability of URM walls and the need to understand their behavior, a few experimental studies have been conducted in the past (e.g., [19,20,21,22,23,24]). Nearly all of this research refers to structural masonry walls—particularly to the traditionally built brick or concrete block walls. Only a few out-of-plane experimental studies featuring modern construction walls have been conducted.
Initially, a steel reinforcing mesh was used for the out-of-plane anti-seismic strengthening of existing walls using various techniques. High-strength mortar or shotcrete is usually used to attach the steel reinforcing mesh to the existing masonry wall. This type of traditional strengthening is a time-consuming and highly invasive procedure with a further disadvantage of adding mass to the existing structure. The development of more advanced FRP materials with better mechanical properties in recent decades has enabled these materials to become one of the main strengthening materials nowadays. Increasingly, various composite materials are used, such as carbon fiber-reinforced polymers (CFRP) [25,26,27,28], glass fiber-reinforced polymers (GFRP) [29,30,31,32], basalt fiber-reinforced polymers (BFRP) [26,33], and others. They are externally attached (e.g., [34]) or near surface mounted (e.g., [35]) to existing walls in various ways, commonly using epoxy resins. Such polymerized composites are more durable and resistant and have superior mechanical characteristics. The first research group that studied the bending behavior of masonry strengthened with FRP systems was Ehsani et al. [36]. Additional researchers who worked on various FRP systems [26,34,37,38,39,40] have proven that both out-of-plane flexural resistance and ductility of the wall increase with the external application of FRP composites to the wall surface. A significant increase in mid-span displacement was obtained when applying near surface-mounted CFRP strips using flexible adhesive [41]. Based on the experimental investigations involving masonry walls strengthened with glass and carbon fiber composites that adhere to their surface through an epoxy adhesive [25], it has been shown that compression crushing of the wall and the debonding of the strengthening composite from the wall represent typical failure mechanisms. The main disadvantages of FRP systems are the high cost of epoxy resins and their poor performance at high temperatures. Additionally, working with epoxy resins indoors is a potential hazard for the respiratory system.
In addition to FRP systems, there are other strengthening methods to improve out-of-plane wall behavior, such as FRCM—fiber-reinforced cement matrix, which shows similar results to FRP systems [42,43,44,45]. Numerous research contributions analyzing different types of FRCM-strengthening systems are available in the literature [22,26,46,47,48,49,50]. Three [44,51] and four-point [26,43,46,52,53,54,55] bending tests have been conducted on different types of masonry walls strengthened with FRCM systems. Furthermore, an extensive review [56] of experimental studies involving various FRCM systems of out-of-plane strengthening has recently been published. However, these methods are still time consuming, as it is necessary to wait for the cement to set and harden before the surface can be further processed. Another disadvantage is the additional mass applied to the primary structure.
Despite a number of existing wall-strengthening systems, there are not much data available on the strengthening of non-structural masonry walls. The only out-of-plane experimental research on non-structural masonry walls’ strengthening was performed by Stempniewski et al. [57]; glass fiber composite fabric was applied to existing non-structural masonry walls with flexible polyurethane adhesive. Due to the lack of experimental studies and data on non-structural partition walls’ out-of-plane behavior and possibilities for its strengthening, it was decided to conduct an experimental campaign to identify the failure mechanisms as well as the best strengthening solution. The focus was set to be on preventing an out-of-plane collapse and consequently protecting the occupants of existing buildings from life-threatening hazards.

2. Experimental Program

The core of this research is the experimental investigation of the out-of-plane behavior of slender non-structural masonry partition walls under quasi-static cyclic displacement-controlled load. Slender non-structural walls made of regular solid brickwork and cement–lime mortar characteristic for the historical masonry buildings were prepared. After the mortar set, the strengthening of built walls was applied with four different systems using glass fiber mesh.

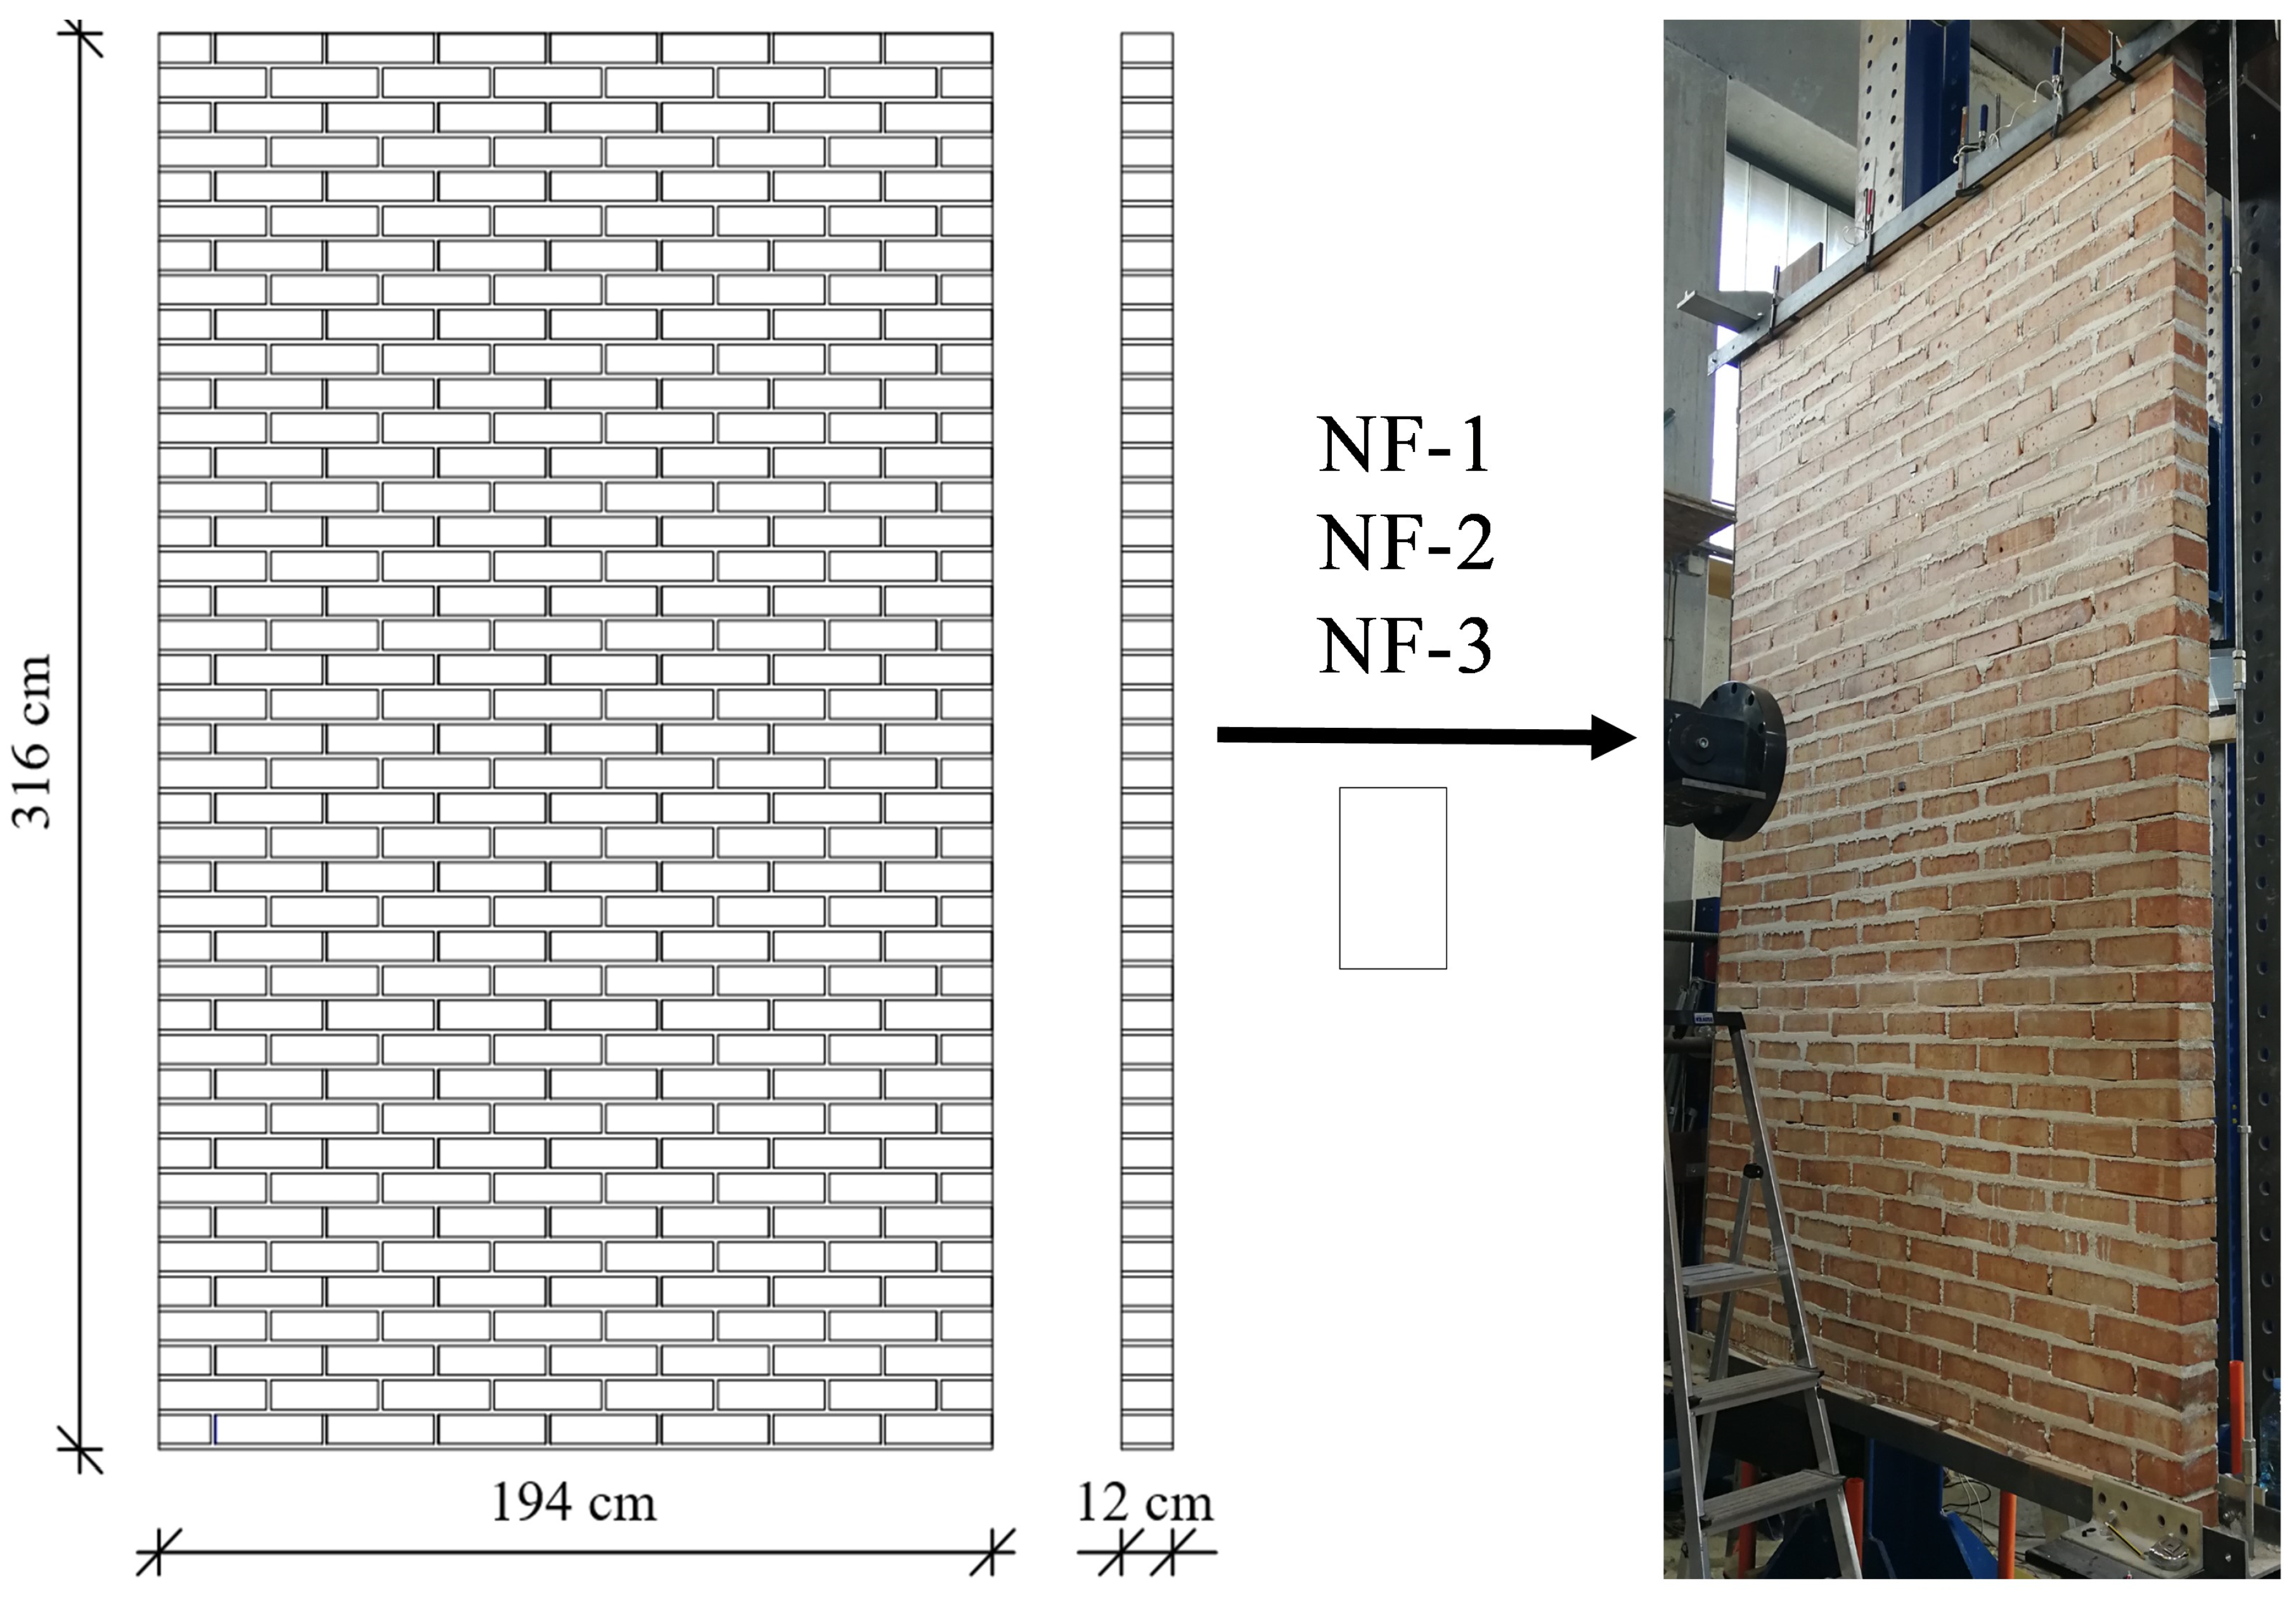
2.1. Non-Structural Wall Test Specimens

As part of the main experimental investigations of the slender non-structural partition walls under out-of-plane seismic loading, 11 full-scale test specimens were built with solid regular solid bricks (250/120/65 mm) laid in cement–lime mortar type and using a half-bond pattern. The thickness of the NF non-structural wall specimens was 12 cm, and their slenderness was 26. The constructed specimens were 194 cm long, 316 cm high, and with a brick width of 12 cm, as shown in the Figure 1. Prior to the construction of NF specimens, bricks were properly prepared by prewetting them to prevent the brick capillary suction of water from fresh mortar during construction. The average thickness of horizontal joints was 12 mm, and the average thickness of vertical joints was 10 mm. Three out of the eleven specimens (labeled NF-1, NF-2, and NF-3) were tested as-built.
Compressive strength tests of 10 masonry units were conducted according to the standard EN 772-1 [58]. It was found that an average compression strength of brick reached 36.3 MPa with a coefficient of variation of 15.5%. Additionally, flexural and compressive strength tests of 66 mortar prisms (40 mm × 40 mm × 160 mm), collected during the construction of non-structural wall specimens, were conducted according to the standard EN 1015-11 [59]. The mixing ratio of cement–lime mortar was made at ratios 1:3:9 (cement/lime/sand) by volume, which is adequate to the mortar traditionally used in masonry structures from the late 19th century onwards. The average flexural strength was equal to 1.08 MPa, with a coefficient of variation of 23.3%. The average compressive strength was 5.02 MPa, with a coefficient of variation of 9.6%. Moreover, the bond wrench tests were conducted according to EN 1052-5 [60] to evaluate an average bond strength of 61 specimens. An average flexural bond strength of 0.22 MPa with a coefficient of variation of 36% was observed.

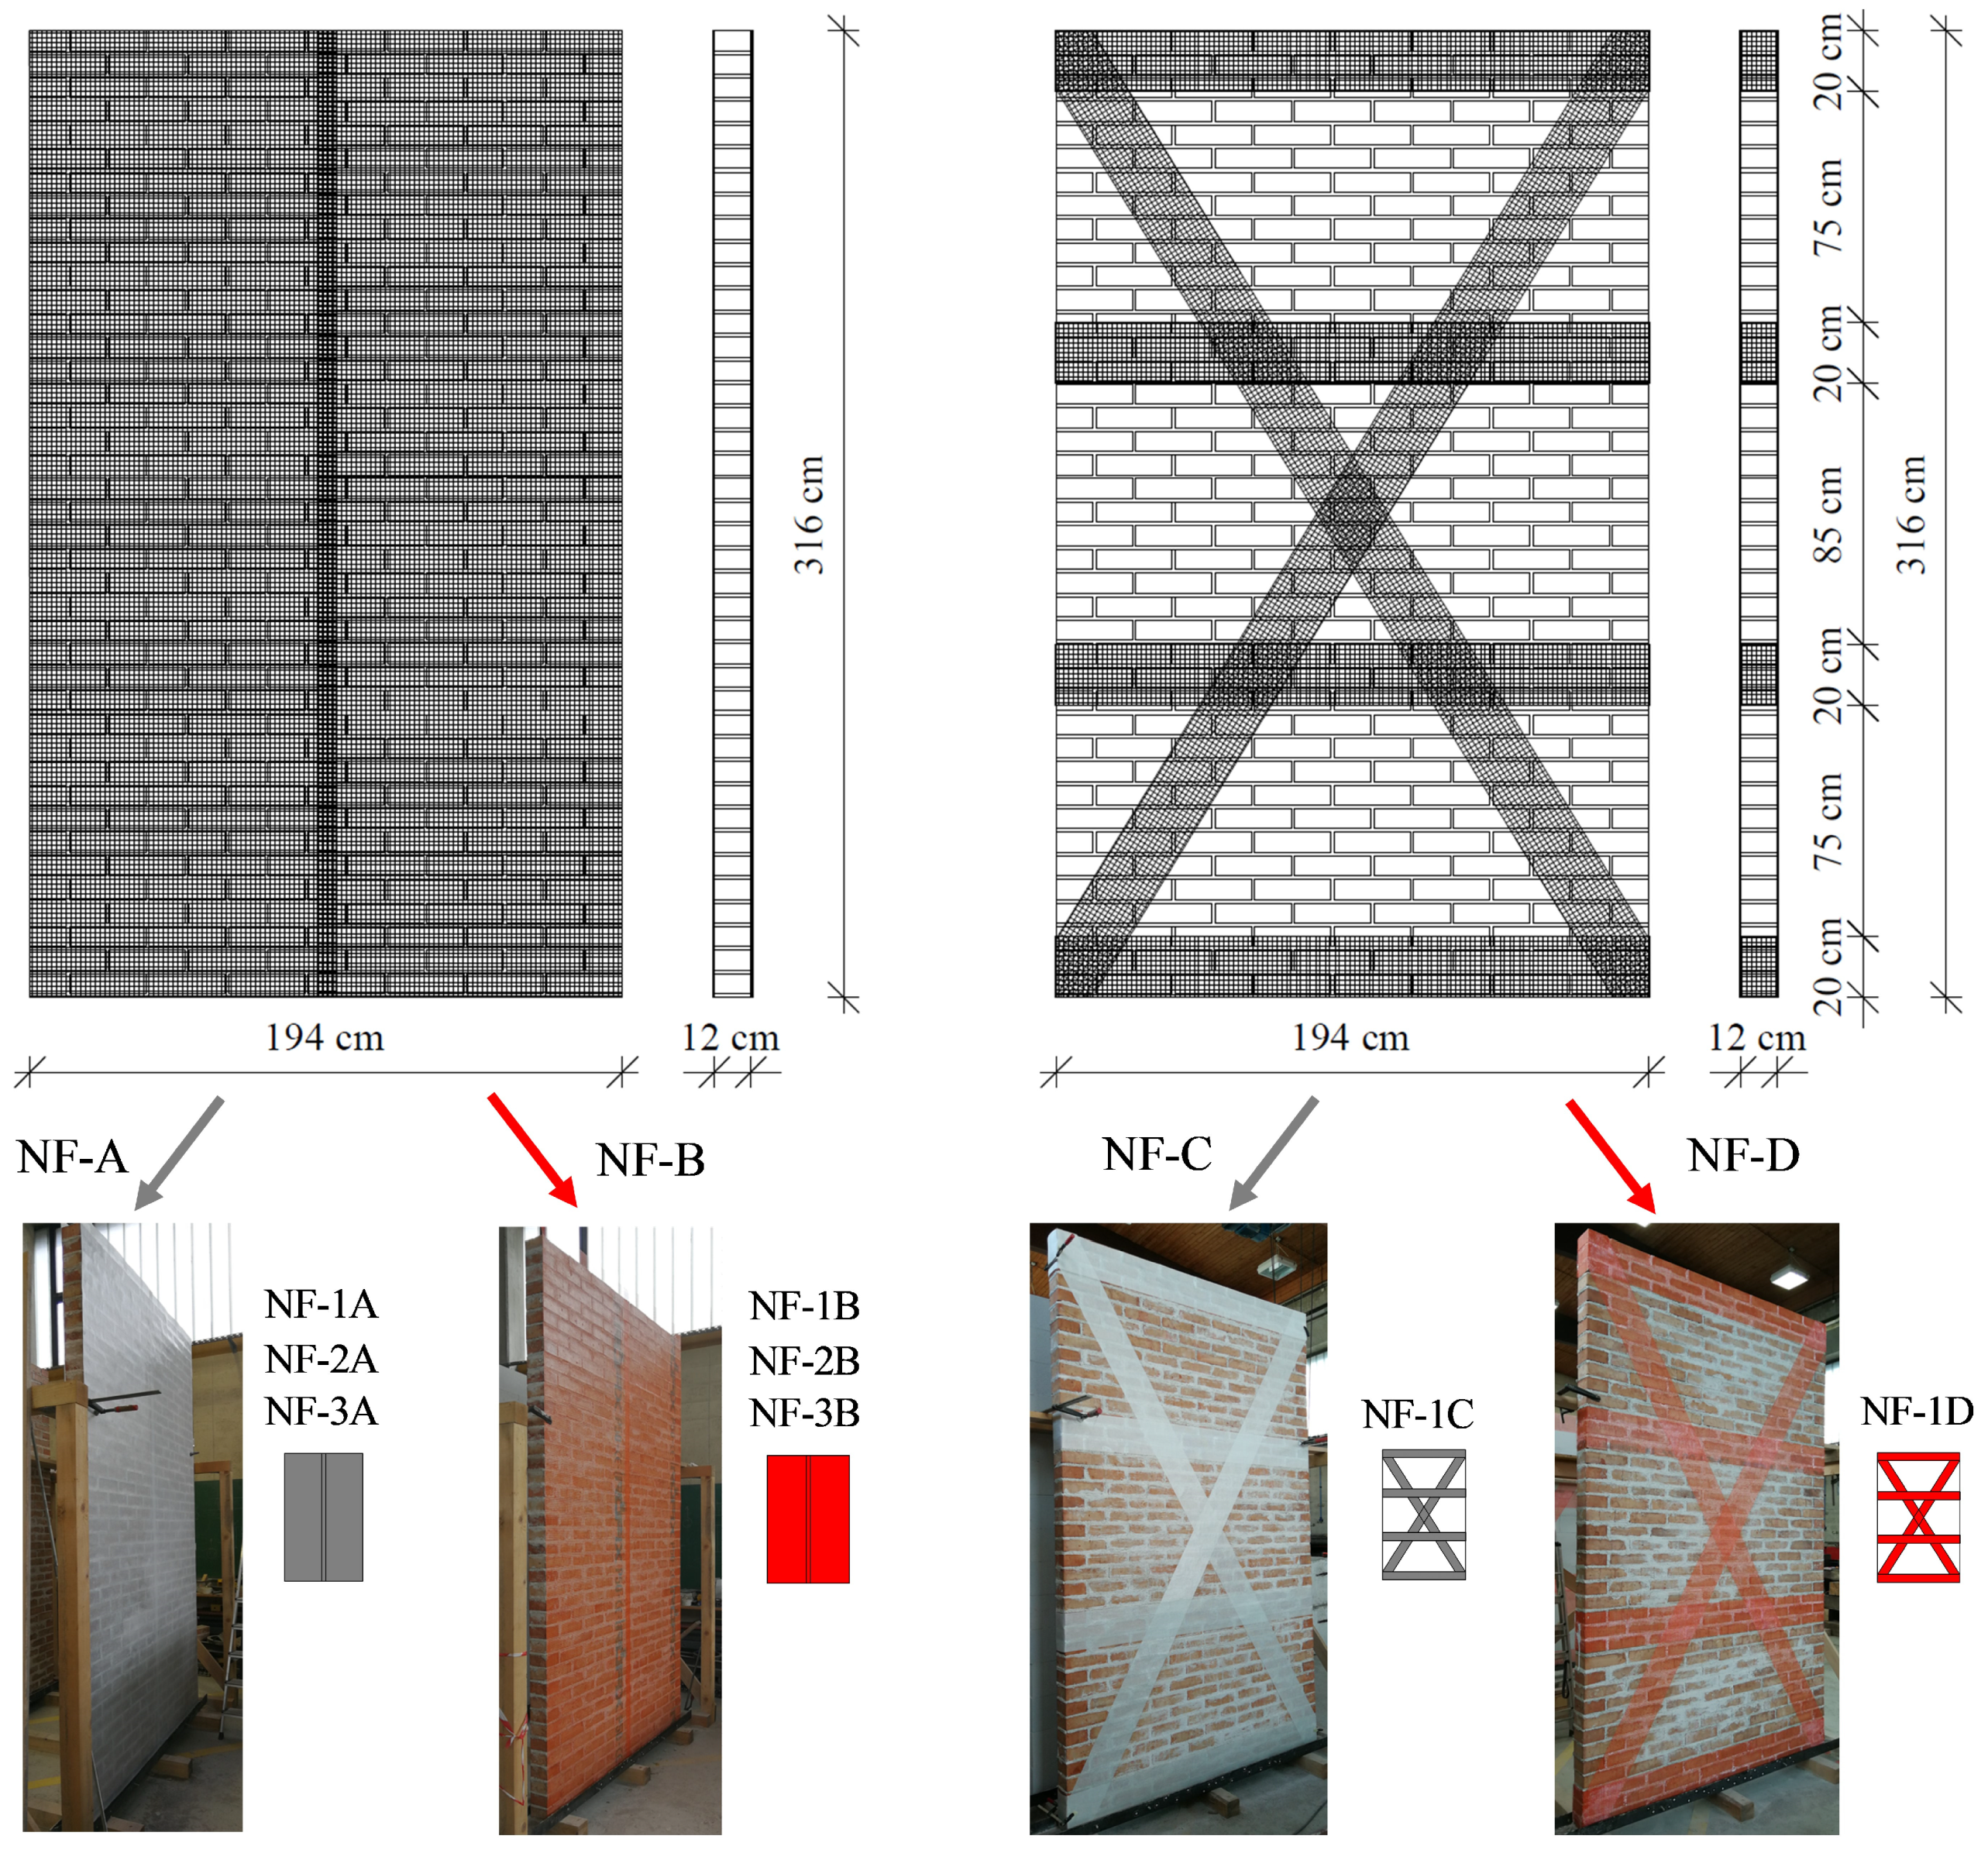
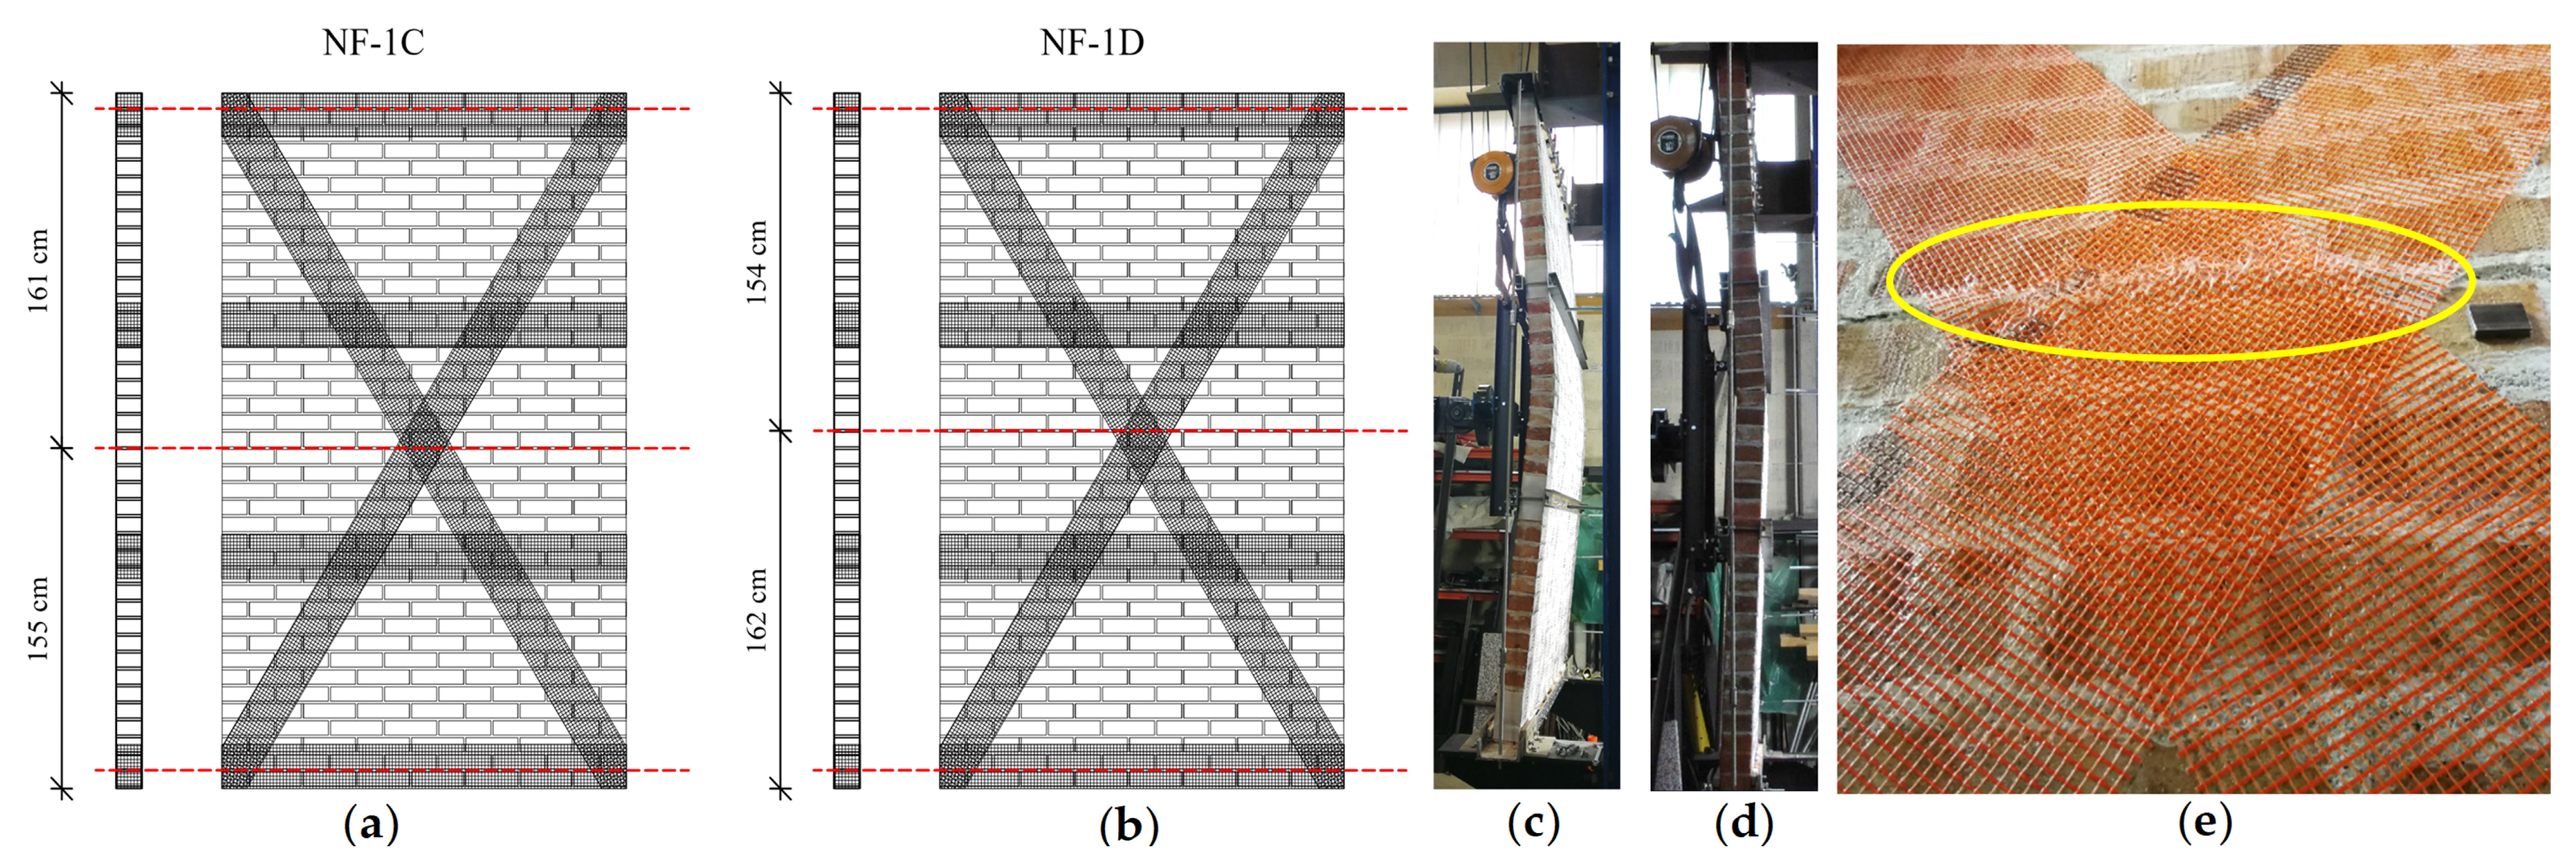
2.2. Strengthening Systems

Eight out of eleven prepared wall specimens were strengthened using four strengthening methods (strengthening systems A, B, C, and D) with different geometry patterns, as shown in Figure 2. A glass fiber-reinforcing fabric (RF) with a density equal to 286 g/m2 or a glass fiber-rendering mesh (RM) with a density equal to 145 g/m2 was applied as the reinforcing material, either on the entire plane surface of the wall specimens or locally with reinforcement strips. The glass fiber-reinforcing fabric is part of a commercially available system for reinforcing masonry partition walls, whereas the glass fiber-rendering mesh is ordinarily used for reinforcement of thin coat façade plaster. The tensile strength of RF and RM is equal to 92 kN/m and 34 kN/m, respectively. The RF is a bidirectional textile with a maximum elongation at rupture equal to 4%, while the RM is a bidirectional mesh with a square size equal to 4 mm x 4 mm and has a maximum elongation at failure equal to 2%. Nevertheless, the RM appears to be more economical, with its price being up to 20 times lower in comparison to the RF.
Both strengthening materials were applied to cleaned and leveled surfaces of the wall through the use of one-component, ready-to-use flexible polyurethane-based adhesive in watery dispersion. In the first two methods, a glass fiber-reinforcing fabric (strengthening system A) or a glass fiber-rendering mesh (strengthening system B) was applied to both sides of the wall over the entire wall surface. The glass fiber fabric or rendering mesh ran continuously from the lower to the upper edge of the test specimen with 10 cm of excess fabric anchored at the top and bottom edge of the wall. The third strengthening method (strengthening system C) was performed locally with strips of glass fiber-reinforcing fabric, using two wide diagonal strips as tension reinforcements combined with horizontal reinforcement strips at the levels of load application. In the fourth strengthening method (strengthening system D), the geometry of local reinforcement strips was the same as in system C, but strips of glass fiber-rendering mesh were used instead of reinforcing fabric. The width of the diagonal and horizontal reinforcement strips was 20 cm. All strengthening systems were applied on both sides of the specimens. Systems A and B were implemented on three specimens, whereas methods C and D were implemented on a single specimen. In further discussion within the present paper, the following labels will be used: NF-1A, NF-2A, and NF-3A for specimens with applied strengthening system A, labels NF-1B, NF-2B, and NF-3B for specimens with strengthening system B, NF-1C for specimen with strengthening system C, and NF-1D for specimen with strengthening system D. All details about specimens’ labels, symbols, and applied strengthening systems are summarized in Table 1.

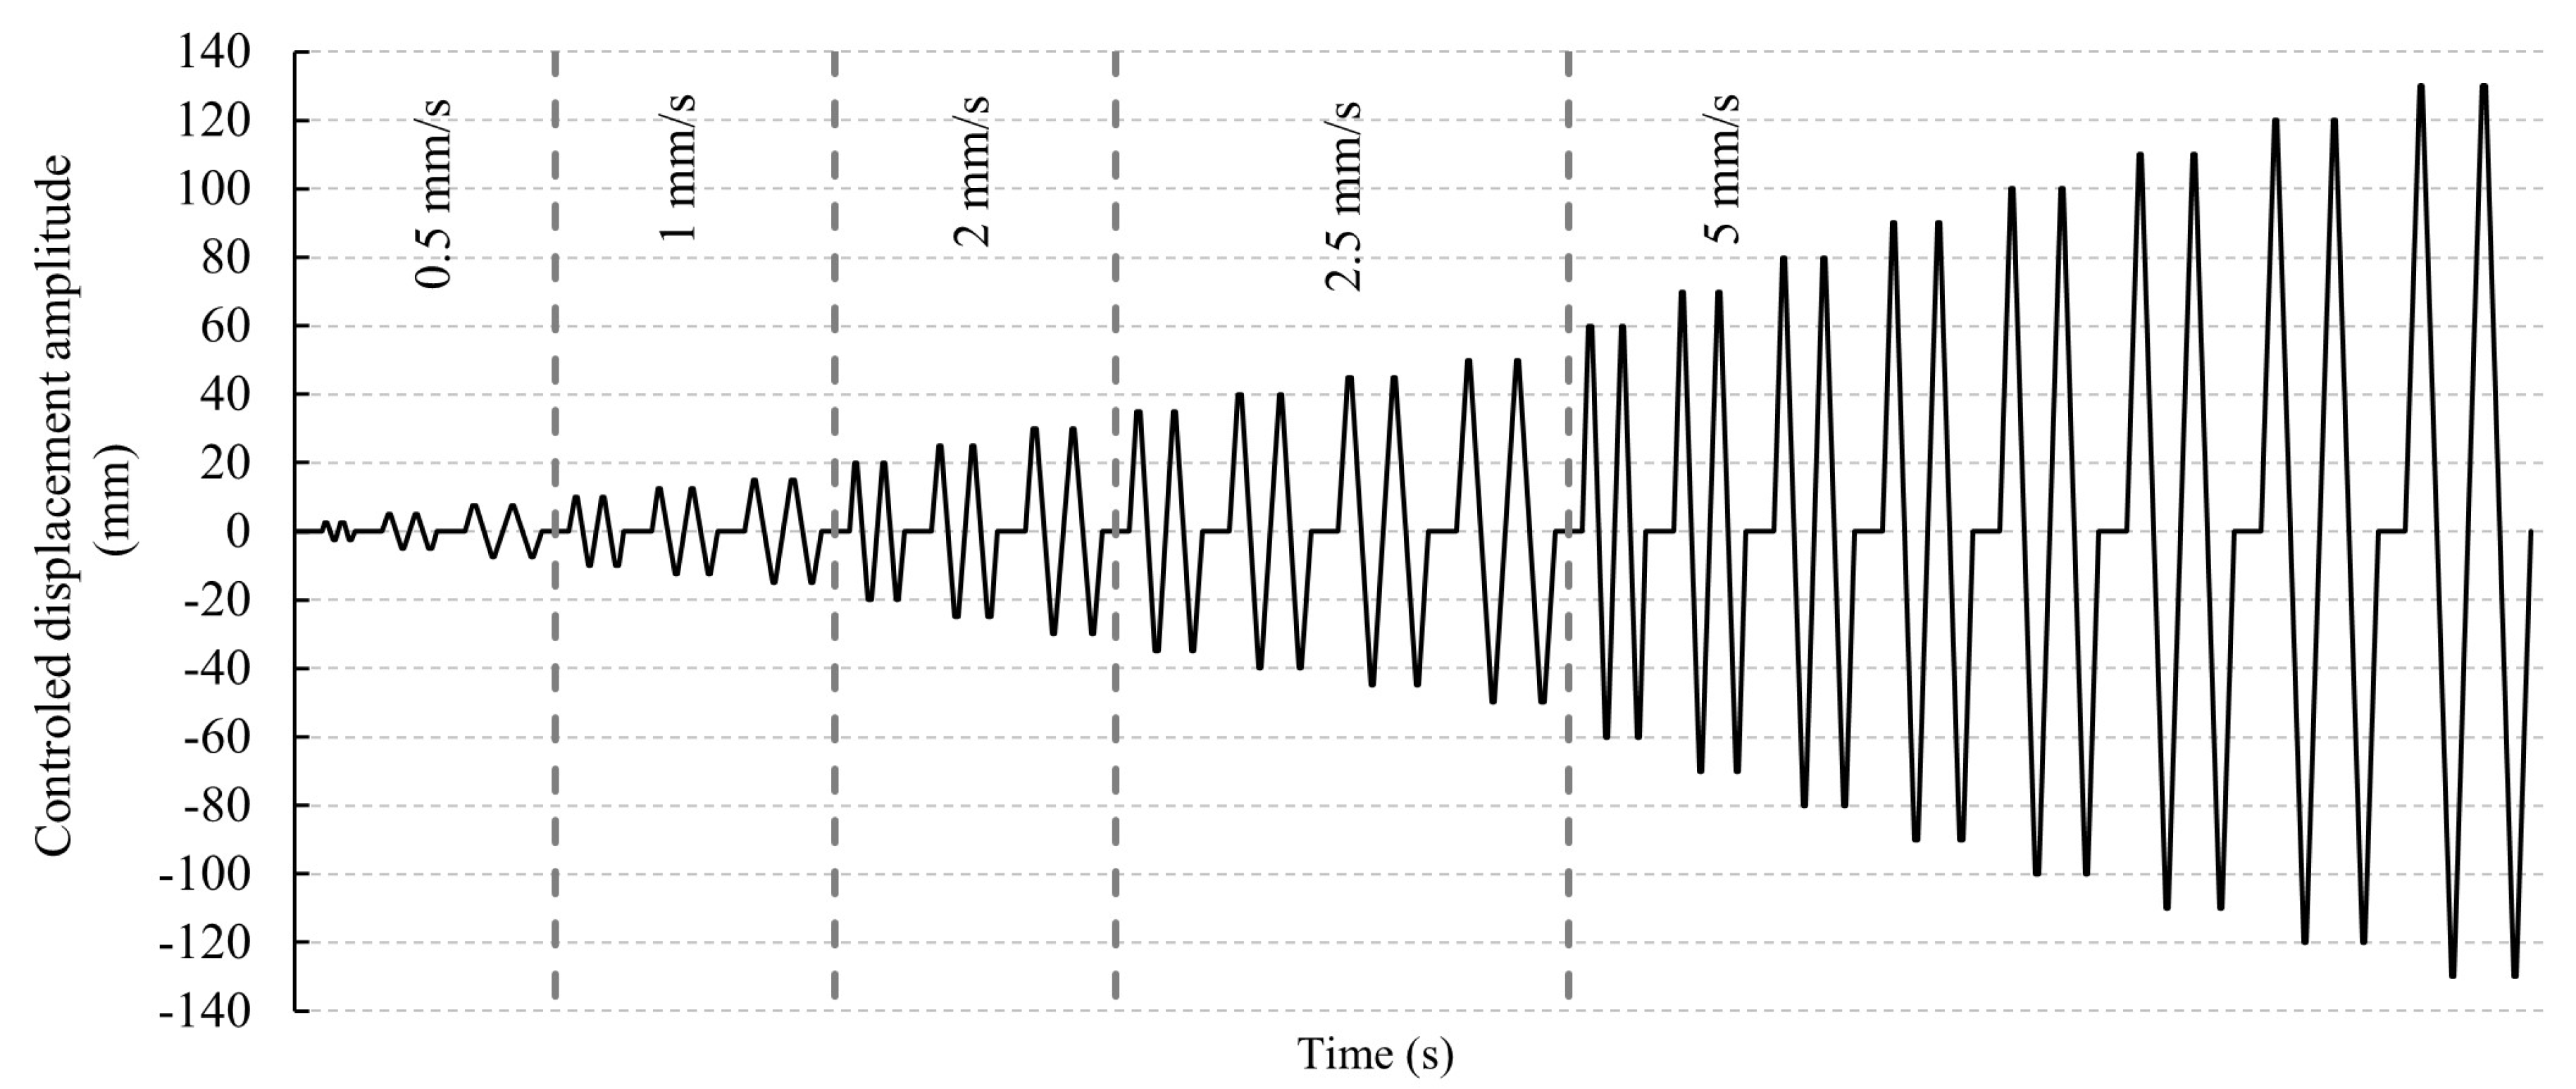
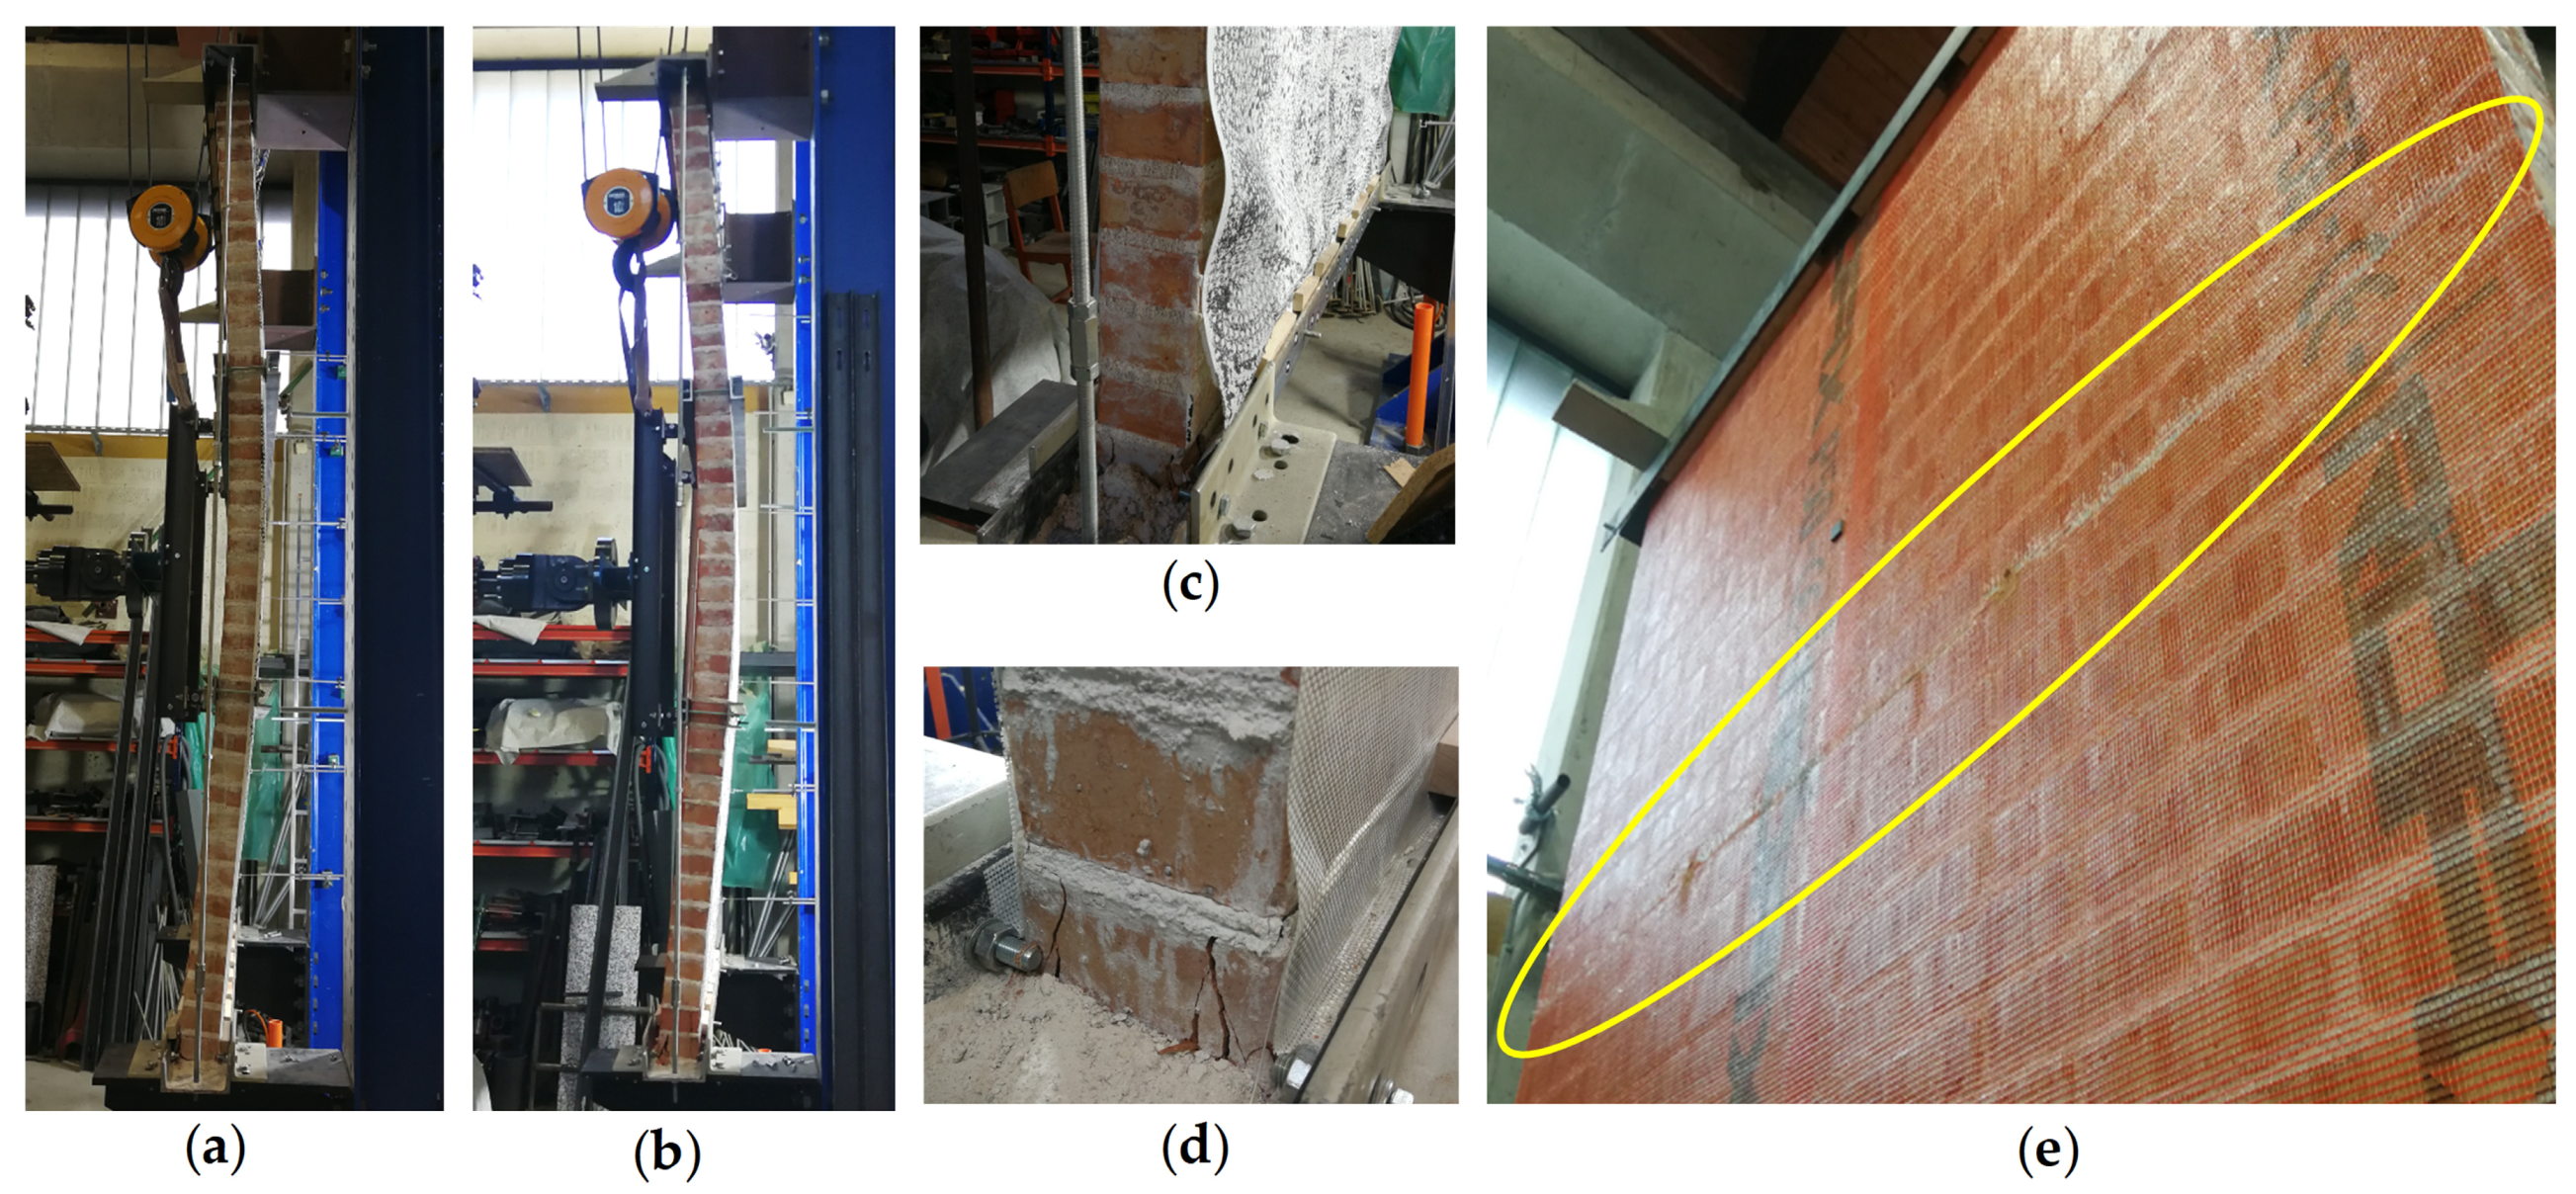
2.3. Test Setup and Loading Protocol

The out-of-plane cyclic quasi-static experimental investigations of slender non-structural walls were carried out at the Faculty of Civil and Geodetic Engineering of the University of Ljubljana in Slovenia. As shown in Figure 3, the test setup was prepared on a strong floor where the specimen was clamped into the rigid steel supporting frame, with the actuator mounted on the reaction wall. On two parallel frame columns, the top and bottom support of the wall specimen is provided by rigid steel elements and a U-shaped profile. As the experiment was a simulation of non-structural partition walls, the upper steel profile was placed on the top edge of the wall, without applying additional vertical loading.
In order to prevent horizontal relative displacements and allow rotations at the supports i.e., at the contact between the specimens along the steel rail, wooden wedges were inserted in the spacing between them. The supports are shown in details A and B in Figure 3. The displacements of a specimen were recorded with seven LVDTs, which were placed along the specimen height.
The main objective of the present study was to identify the behavior of non-structural URM walls under seismic out-of-plane loading and the efficiency of different remedial actions. Therefore, quasi-static cyclic out-of-plane tests were conducted by applying the horizontal displacement-controlled load at one-third and two-thirds of the specimen’s height, as shown in Figure 3. The applied out-of-plane horizontal cyclic loading protocol shown in Figure 4 was performed with a stepwise horizontal displacement, increasing up to the limit state of failure of an individual specimen. Each loading step consisted of two load cycles in a positive and negative direction. In the extreme positions, at the maximum amplitude of the forced displacement, the specimen was held for 5 s. A similar protocol has been used in experiments conducted by other researchers [61].
At the start of each individual experiment, the maximum displacement amplitude was increased by 2.5 mm in each step, up to a displacement amplitude of 15 mm. In the subsequent steps, the displacement amplitude was increased by 5 mm until the maximum amplitude of 50 mm was reached. For the last sequence of steps, the amplitude was increased for 10 mm until the limit state of failure of a specimen was reached. The load rate also increased stepwise from 0.5 mm/s at the beginning up to 5 mm/s at the end, when an amplitude of 60 mm (at a minimum) displacement was reached.

3. Experimental Results Analysis with Discussion

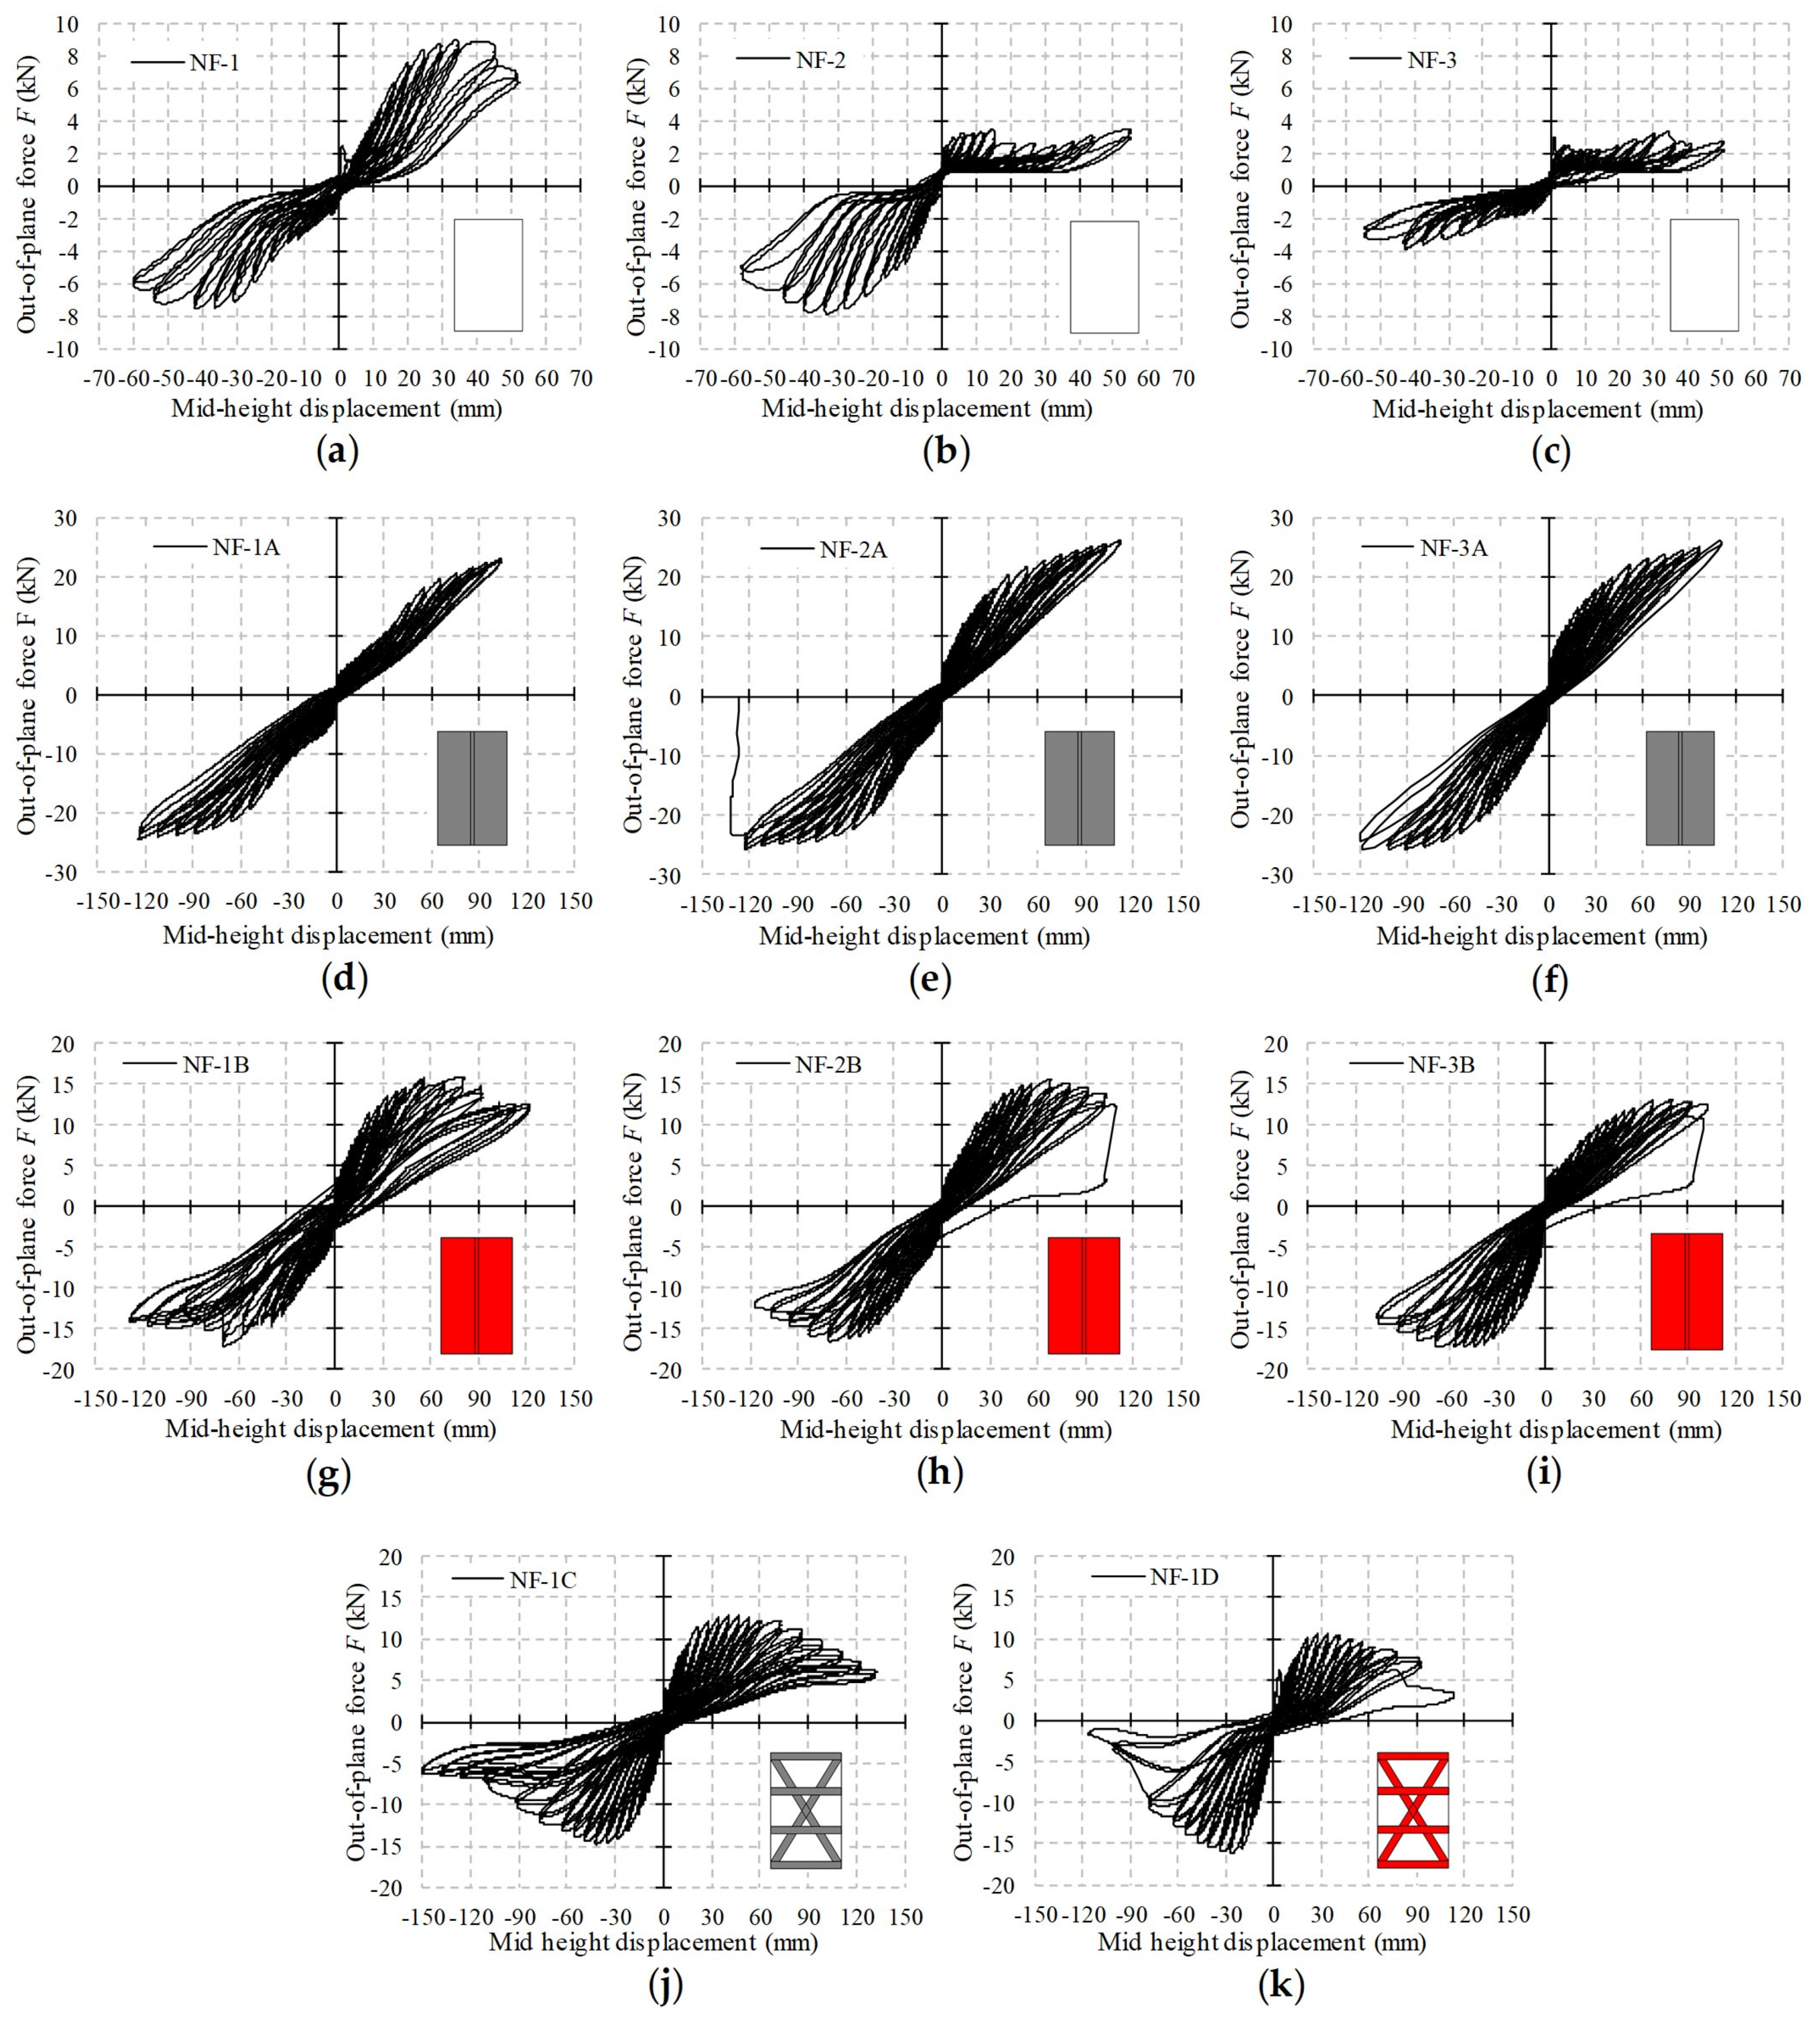
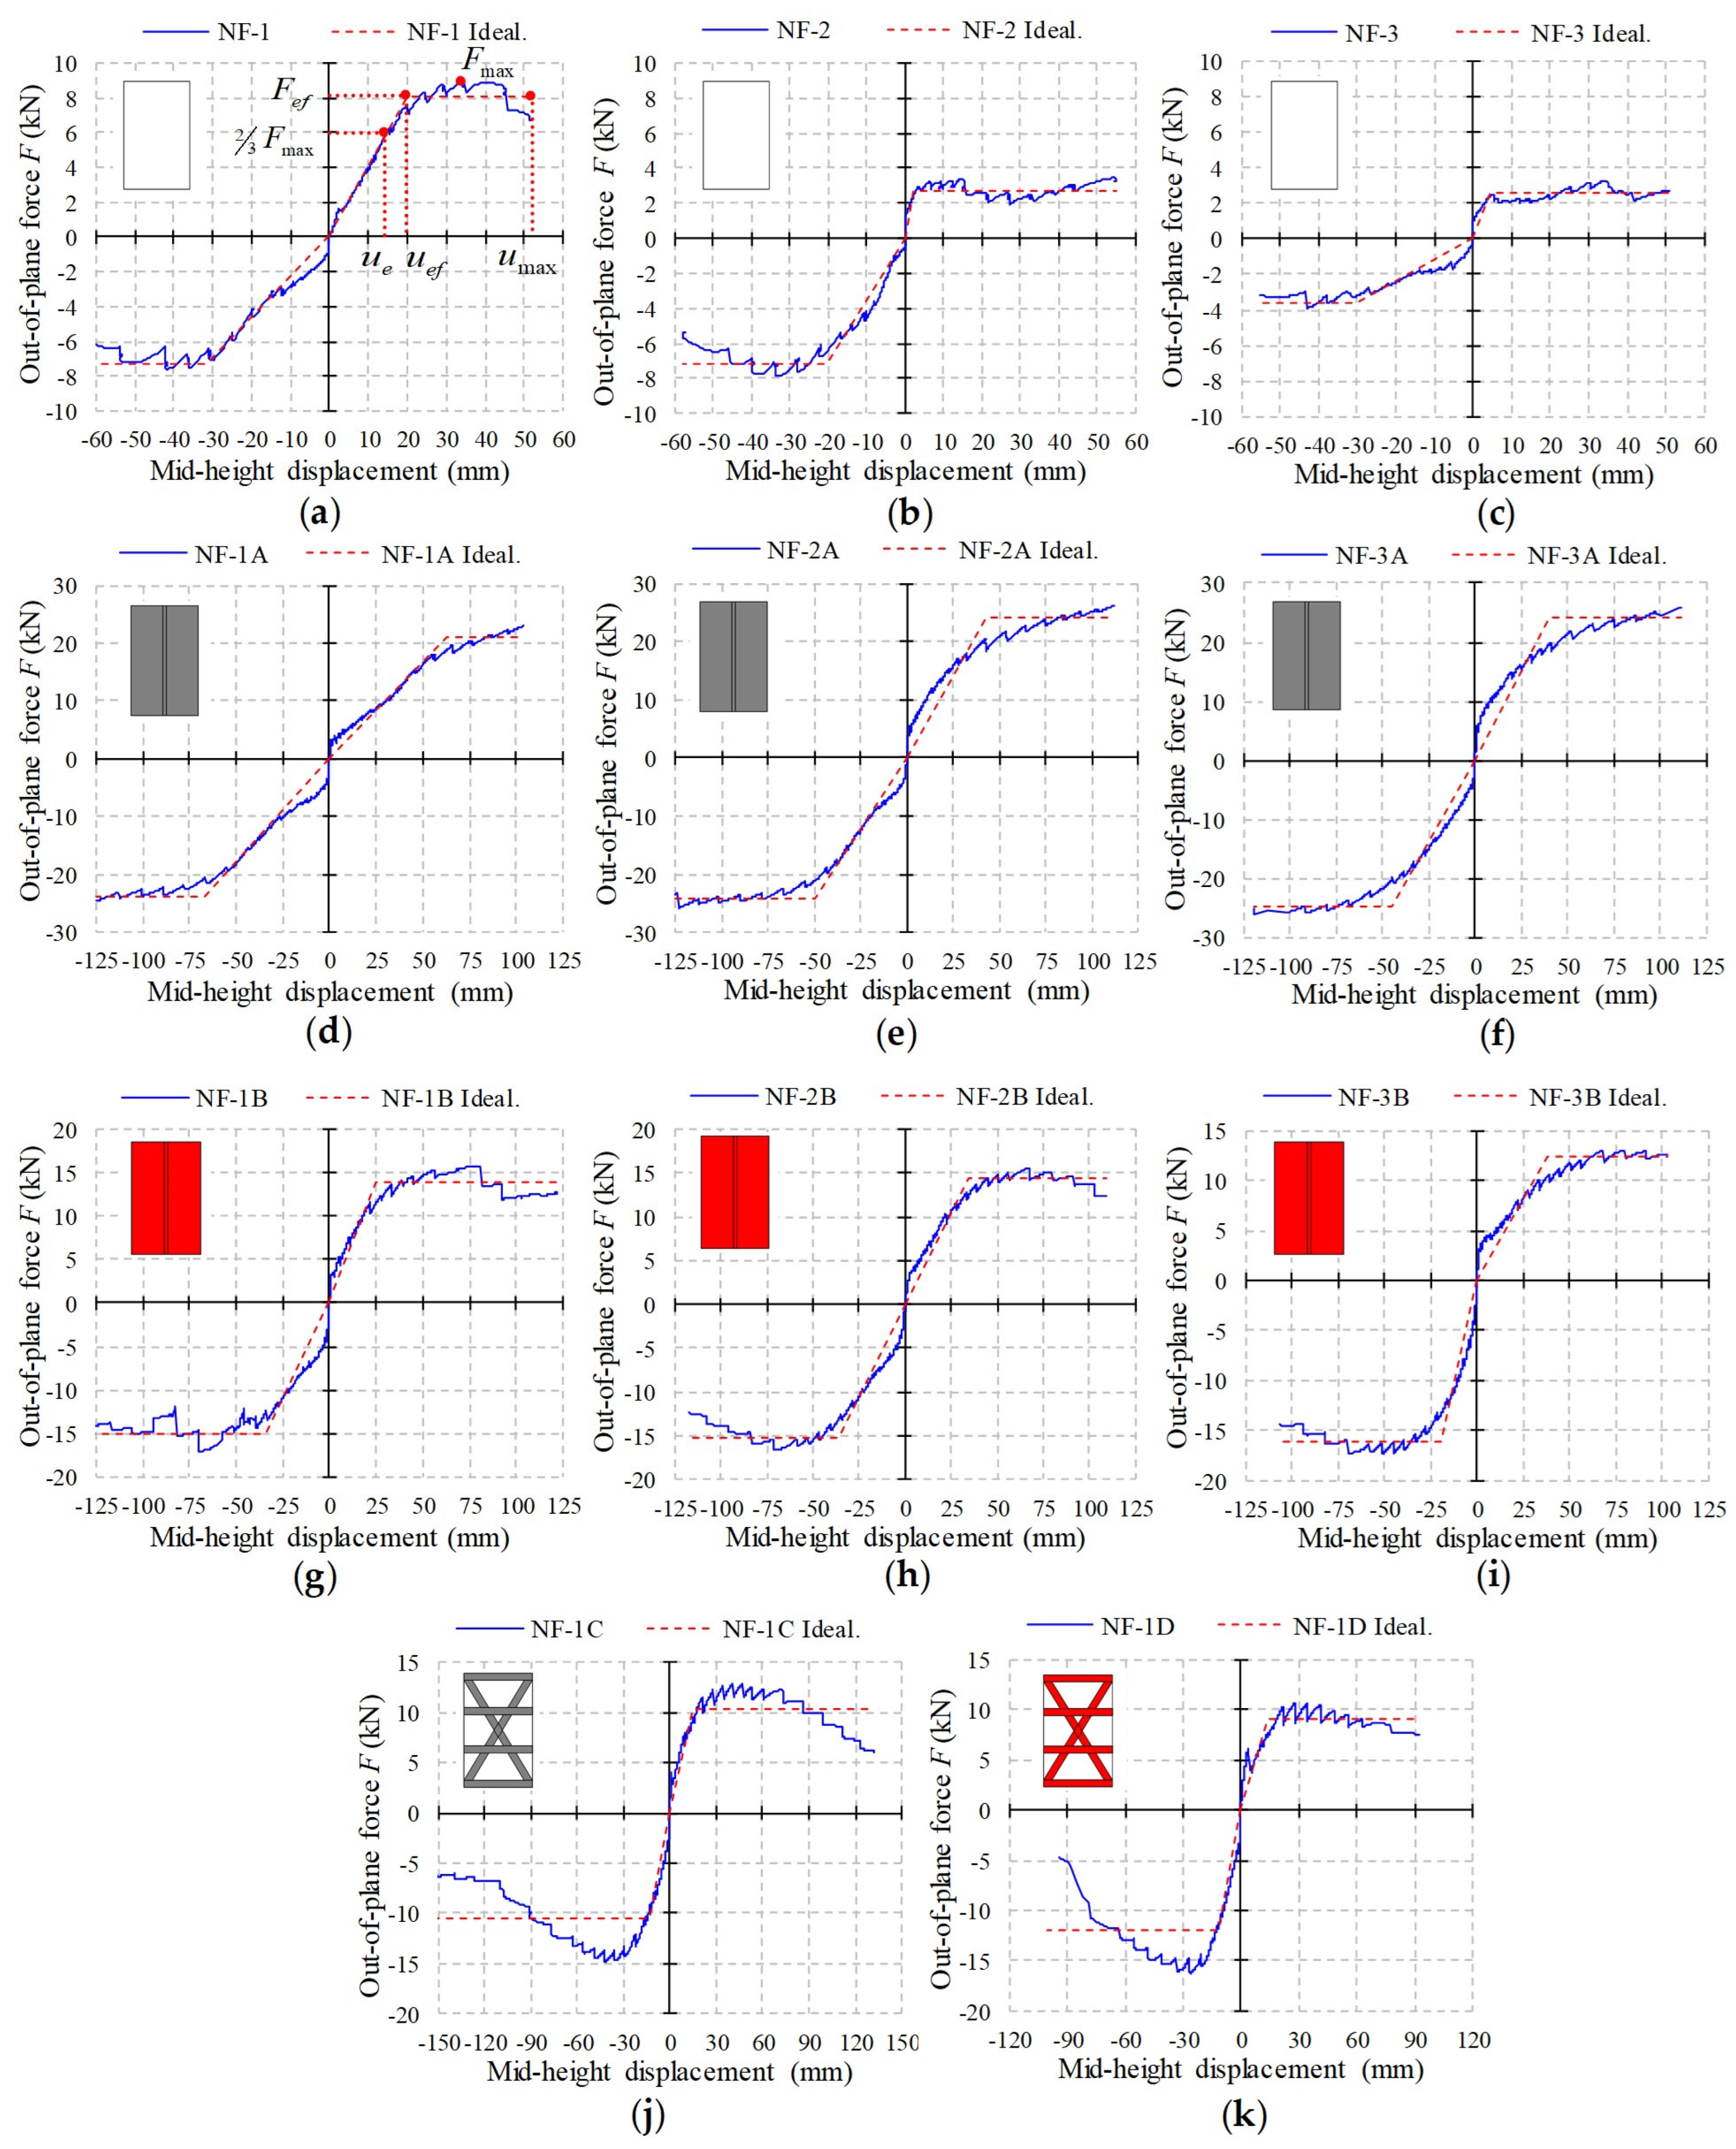
3.1. Out-of-Plane Force-Displacement Response and Failure Mechanisms

The rocking mechanism of as-built non-strengthened specimens develops after the cracking occurs at the top of the wall, which was closely followed by cracking at the bottom and mid-height of the wall, as a consequence of the exceeded masonry bond strength in bed joints along the whole specimen. With all three first specimens, NF-1, NF-2, and NF-3, the cracking pattern occurred at the first cycle of loading in a positive direction. The mid-height cracking as shown in Figure 5e appeared at bed joint heights of 208 cm, 193 cm, and 200 cm for the NF-1, NF-2, and NF-3 specimens, respectively (see Figure 5a–c). These values represent approximately two-thirds of the specimens’ heights. Similar locations of mid-height cracks were obtained in separate experimental studies by other researchers [20,62,63]. With the increase in displacement amplitude, further crushing of the mortar in cracked bed joints was observed. A representative out-of-plane deformation shape of the as-built specimens is shown in Figure 5d.
In specimens with applied full surface strengthening systems A and B (NF-A and NF-B specimens), multiple bed joint cracks were detected in the mid-height area with the constant bending moment. By covering the full surface of the specimen with the strengthening system on both sides, the precise determination of the exact location of the first crack at mid-height was prevented. The representative parabolic deformation line was observed in testing NF-A (see Figure 6a) and NF-B (see Figure 6b). After the cracking mechanism developed, the crushing of mortar in bed joints over the first and under the last row of units was observed in all strengthened specimens. When the displacement amplitude increased, reaching the maximum out-of-plane load-bearing resistance, the compressive failure of bricks in the first and the last rows was clearly observed in NF-A and NF-B specimens, as shown in Figure 6d. The complete failure of NF-A specimens was reached with the debonding of RF, as shown in Figure 6c. The typical failure of NF-B specimens occurred, as shown in Figure 6e, when the tensile strength of RM was exceeded along the whole width of the specimens.
In the case of NF-1C and NF-1D specimens strengthened with diagonal and horizontal strips, the surface of the wall was not fully covered. Therefore, the formation of the first mid-height crack was possible to observe. The locations of first mid-height cracks were detected at the heights of 155 cm and 162 cm for NF-1C and NF-1D, respectively (see Figure 7a,b). After the development of cracking mechanisms, similar to NF-A and NF-B specimens, the crushing of mortar in bed joints over the first and under the last row of units was observed. The complete failure of the specimen NF-1D was reached after the tensile strength of diagonal RM strips was exceeded at the specimen’s mid-height, at the diagonal RM strips’ intersection (see Figure 7e).
Hysteretic load–displacement responses for each specimen are presented in Figure 8, where mid-height displacement was measured with LVDT4 at the precise mid-height location. Cyclic tests were generally conducted up to the out-of-plane displacement amplitude where the near collapse state of the specimen was reached.
In the case of non-strengthened as-built specimens (see Figure 8a–c), the test was terminated when the resistance of the walls dropped by 30% in comparison to its maximum value. From the hysteresis of as-built specimens, it was observed that the quality of workmanship has a significant impact on the out-of-plane behavior. Specimen NF-1 had a properly filled bed joint over the first row; therefore, its hysteresis shows the highest out-of-plane resistance in both loading directions. In the case of specimen NF-2, the bed joint layer of mortar over the first row was incompletely filled on one side of the specimen, which led to the asymmetrical out-of-plane behavior. With specimen NF-3, the mortar layers in the bed joint over the first row were not fully filled with the mortar layer on both sides of the specimen. Since there was less mortar in the compression zone of the horizontal wall section in incompletely filled bed joints, lower out-of-plane resistance was achieved in a positive loading direction when testing specimen NF-2 and in both loading directions when testing specimen NF-3. Incompletely filled bed joints can be found in existing masonry structures, therefore, all of the as-built specimens were included in the analysis. Based on the force–displacement hysteresis analysis, the hysteretic loops can be separated into two groups, representing out-of-plane behavior for good (NF-good) and poor (NF-poor) workmanship. Whole hysteresis of the specimen NF-1 and the negative loops of the specimen NF-2 represent the out-of-plane behavior of walls built with good workmanship, while the positive loops of NF-2 and whole hysteresis of specimen NF-3 reflects the poor workmanship.
After the development of plastic hinges, the out-of-plane resistance of NF-good specimens’ loops reaches about 2.5–2.7 times higher values in comparison to NF-poor specimens’ loops. This significant deviation between NF-good and NF-poor hysteretic response can be covered by the partial factor for materials according to the standard EN 1996-1-1 [64]. For the masonry units of category I and by using prescribed mortar by volume, the values of the factor are 1.7, 2.0, 2.2, 2.5, and 2.7 for classes 1, 2, 3, 4, and 5, respectively. The NF-good hysteretic loops obtained from the NF specimens are used as the control and serve as the basis for the strengthening systems’ efficiency analysis.
The out-of-plane resistances of the specimens strengthened with system A (NF-1A, NF-2A, and NF-3A) were similar, and the shapes of hysteresis were symmetric (see Figure 8d–f). The ultimate displacement was determined with the NF-2A specimen, where the instantaneous collapse occurred with debonding of the reinforcing glass fabric (RF) from the lower rows of the wall specimen (see Figure 6c). As it can be seen in Figure 8e, the out-of-plane resistance increased until failure.
When testing strengthening system B, the complete collapse was achieved with the NF-2B and NF-3B specimens (see Figure 8g–i). As a characteristic failure for this type of strengthening system, a tearing of the rendering mesh occurred along the width of the specimen, which is a consequence of exceeded tensile strength of the rendering mesh (RM). Specimens NF-1B and NF-2B reach similar values of the maximum out-of-plane resistance, while the values in a positive direction for the specimen NF-3B are slightly lower.
When testing the specimens NF-1C and NF-1D, a complete collapse of the specimens was not reached. After reaching its maximum value, the resistance gradually decreased down to approximately 30% of its maximum value (see Figure 8j,k). At that point, the experiment was halted to prevent complete disintegration of the specimen up on its collapse that may jeopardize attached devices and delay the testing of other specimens. In the last two loading cycles of the NF-1D specimen, the partial tensile failure of the RM occurred (see Figure 7e), which caused a substantial out-of-plane resistance reduction of the whole wall.
The strengthened specimens’ out-of-plane behavior is more symmetrical in comparison to the behavior of as-built specimens, even though the quality of bricklaying for all of them was the same. Therefore, it can be concluded that bed joint filling has no influence on the out-of-plane behavior when strengthening systems as presented in this study are applied.

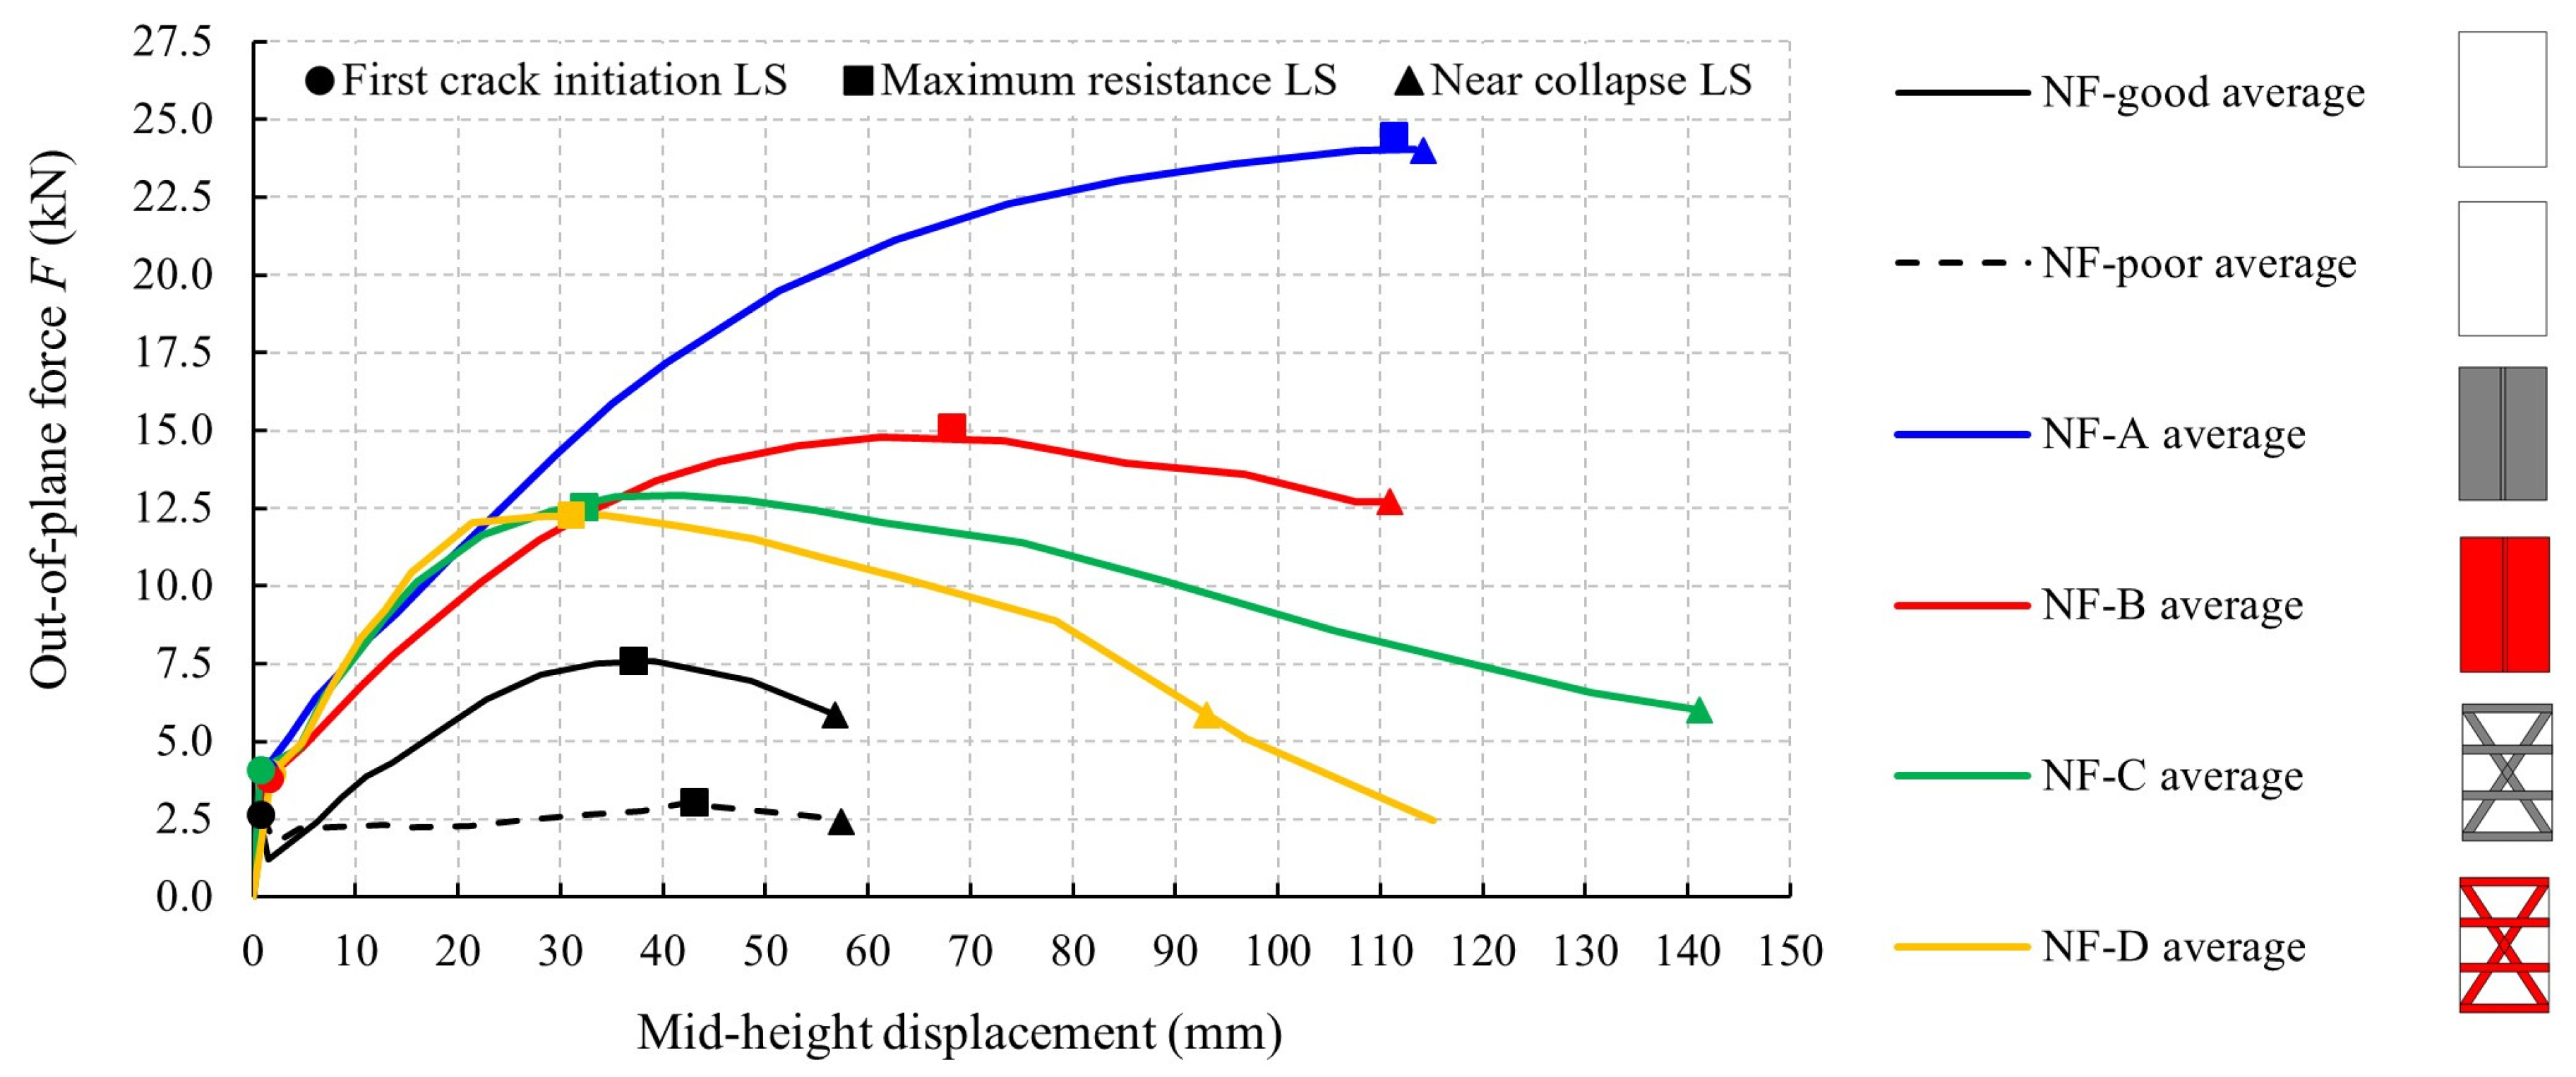
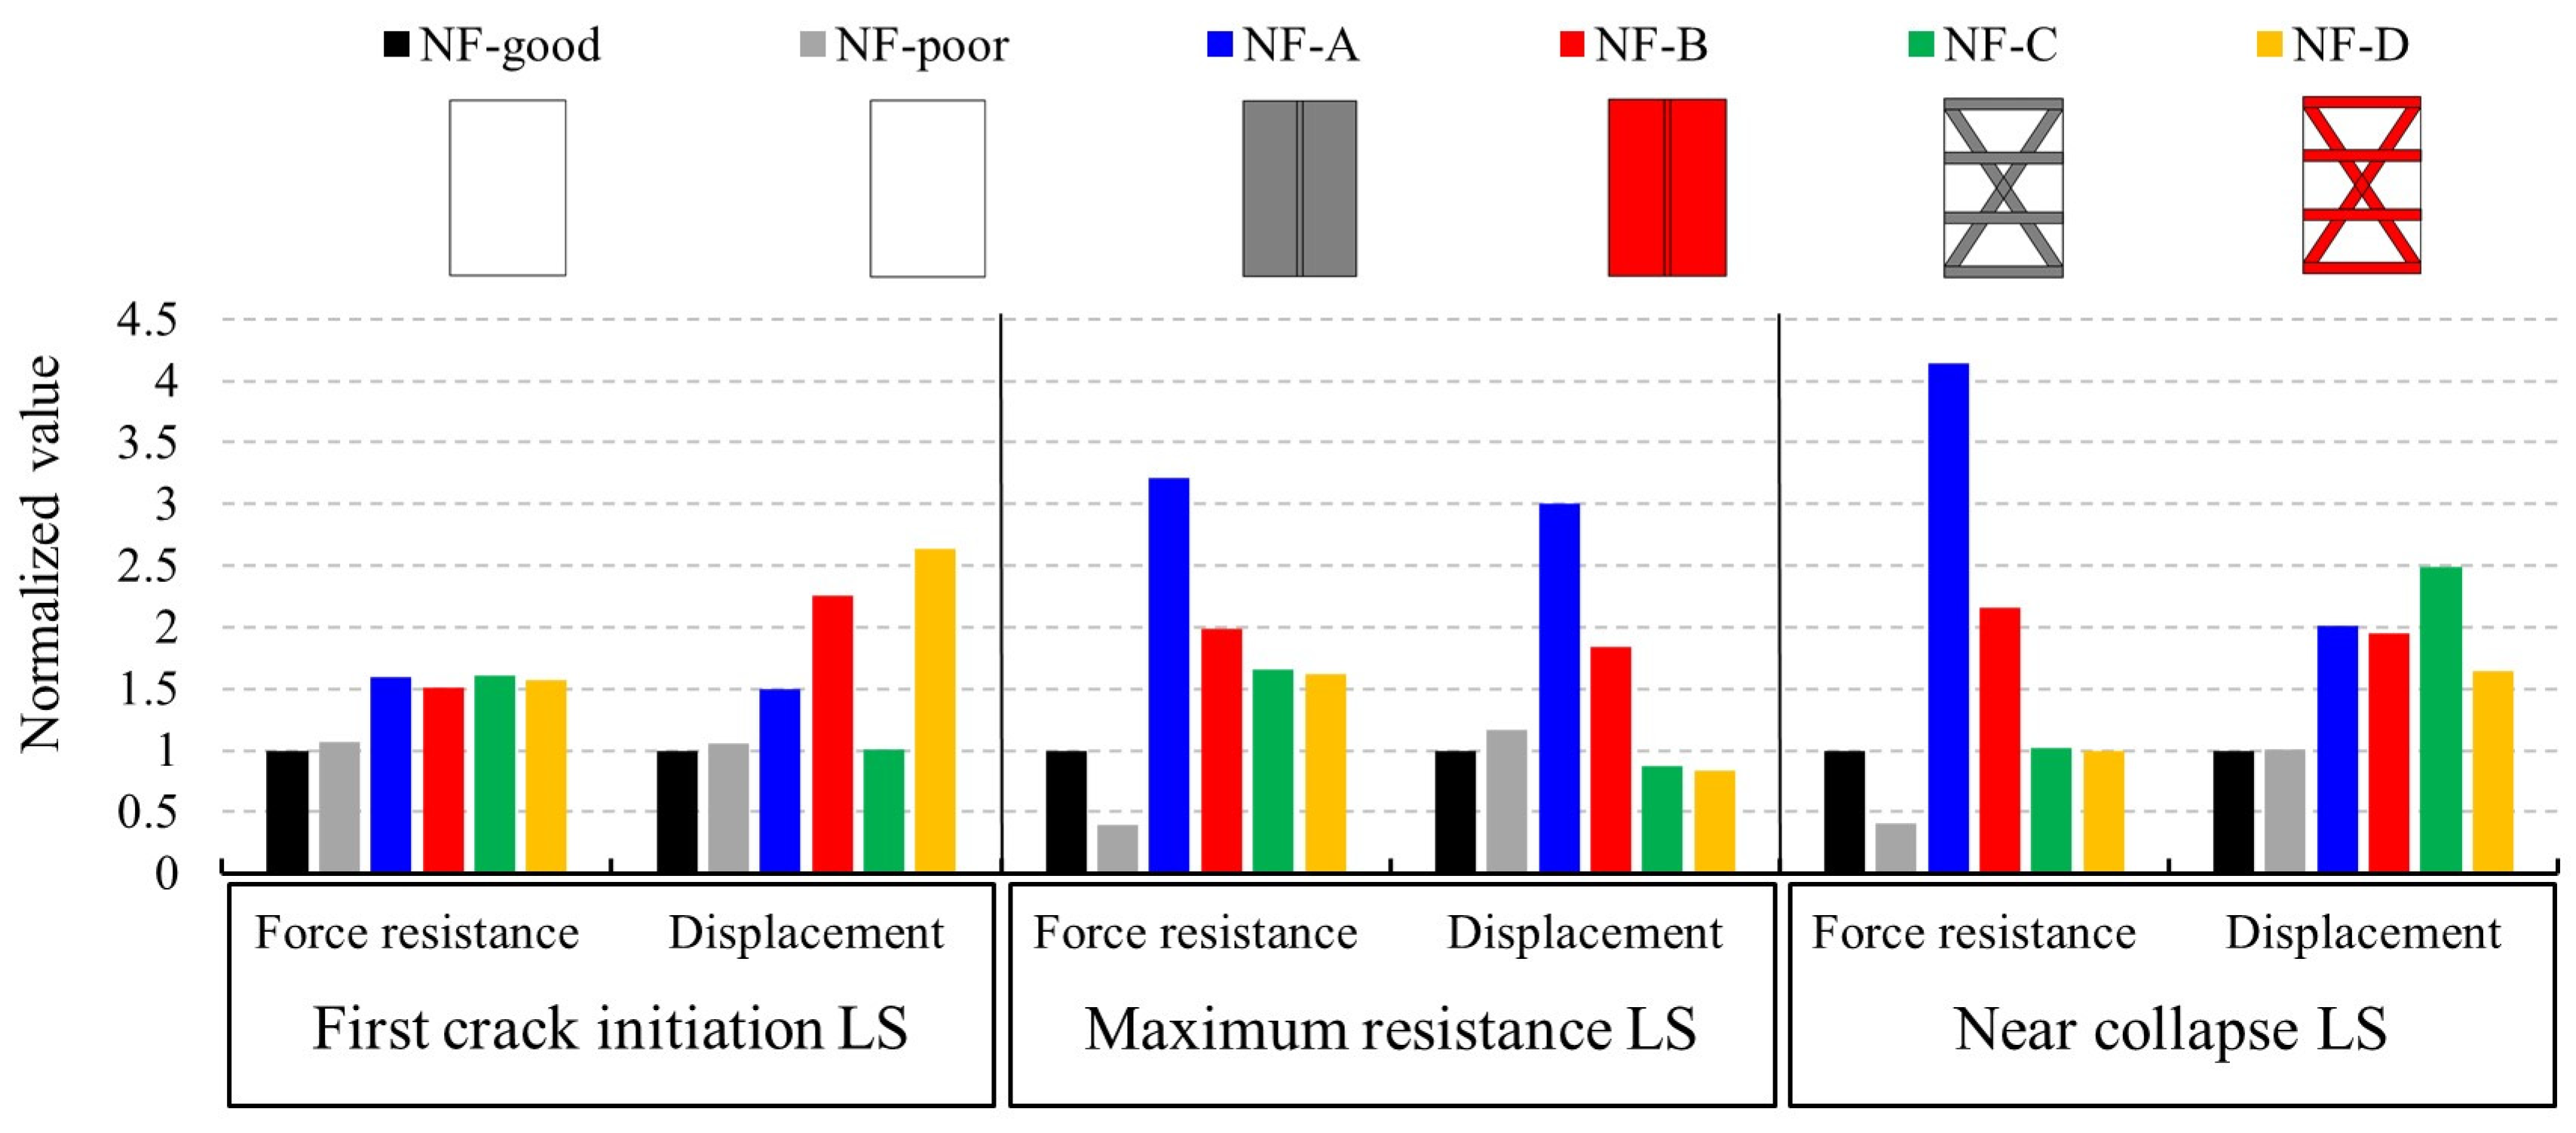
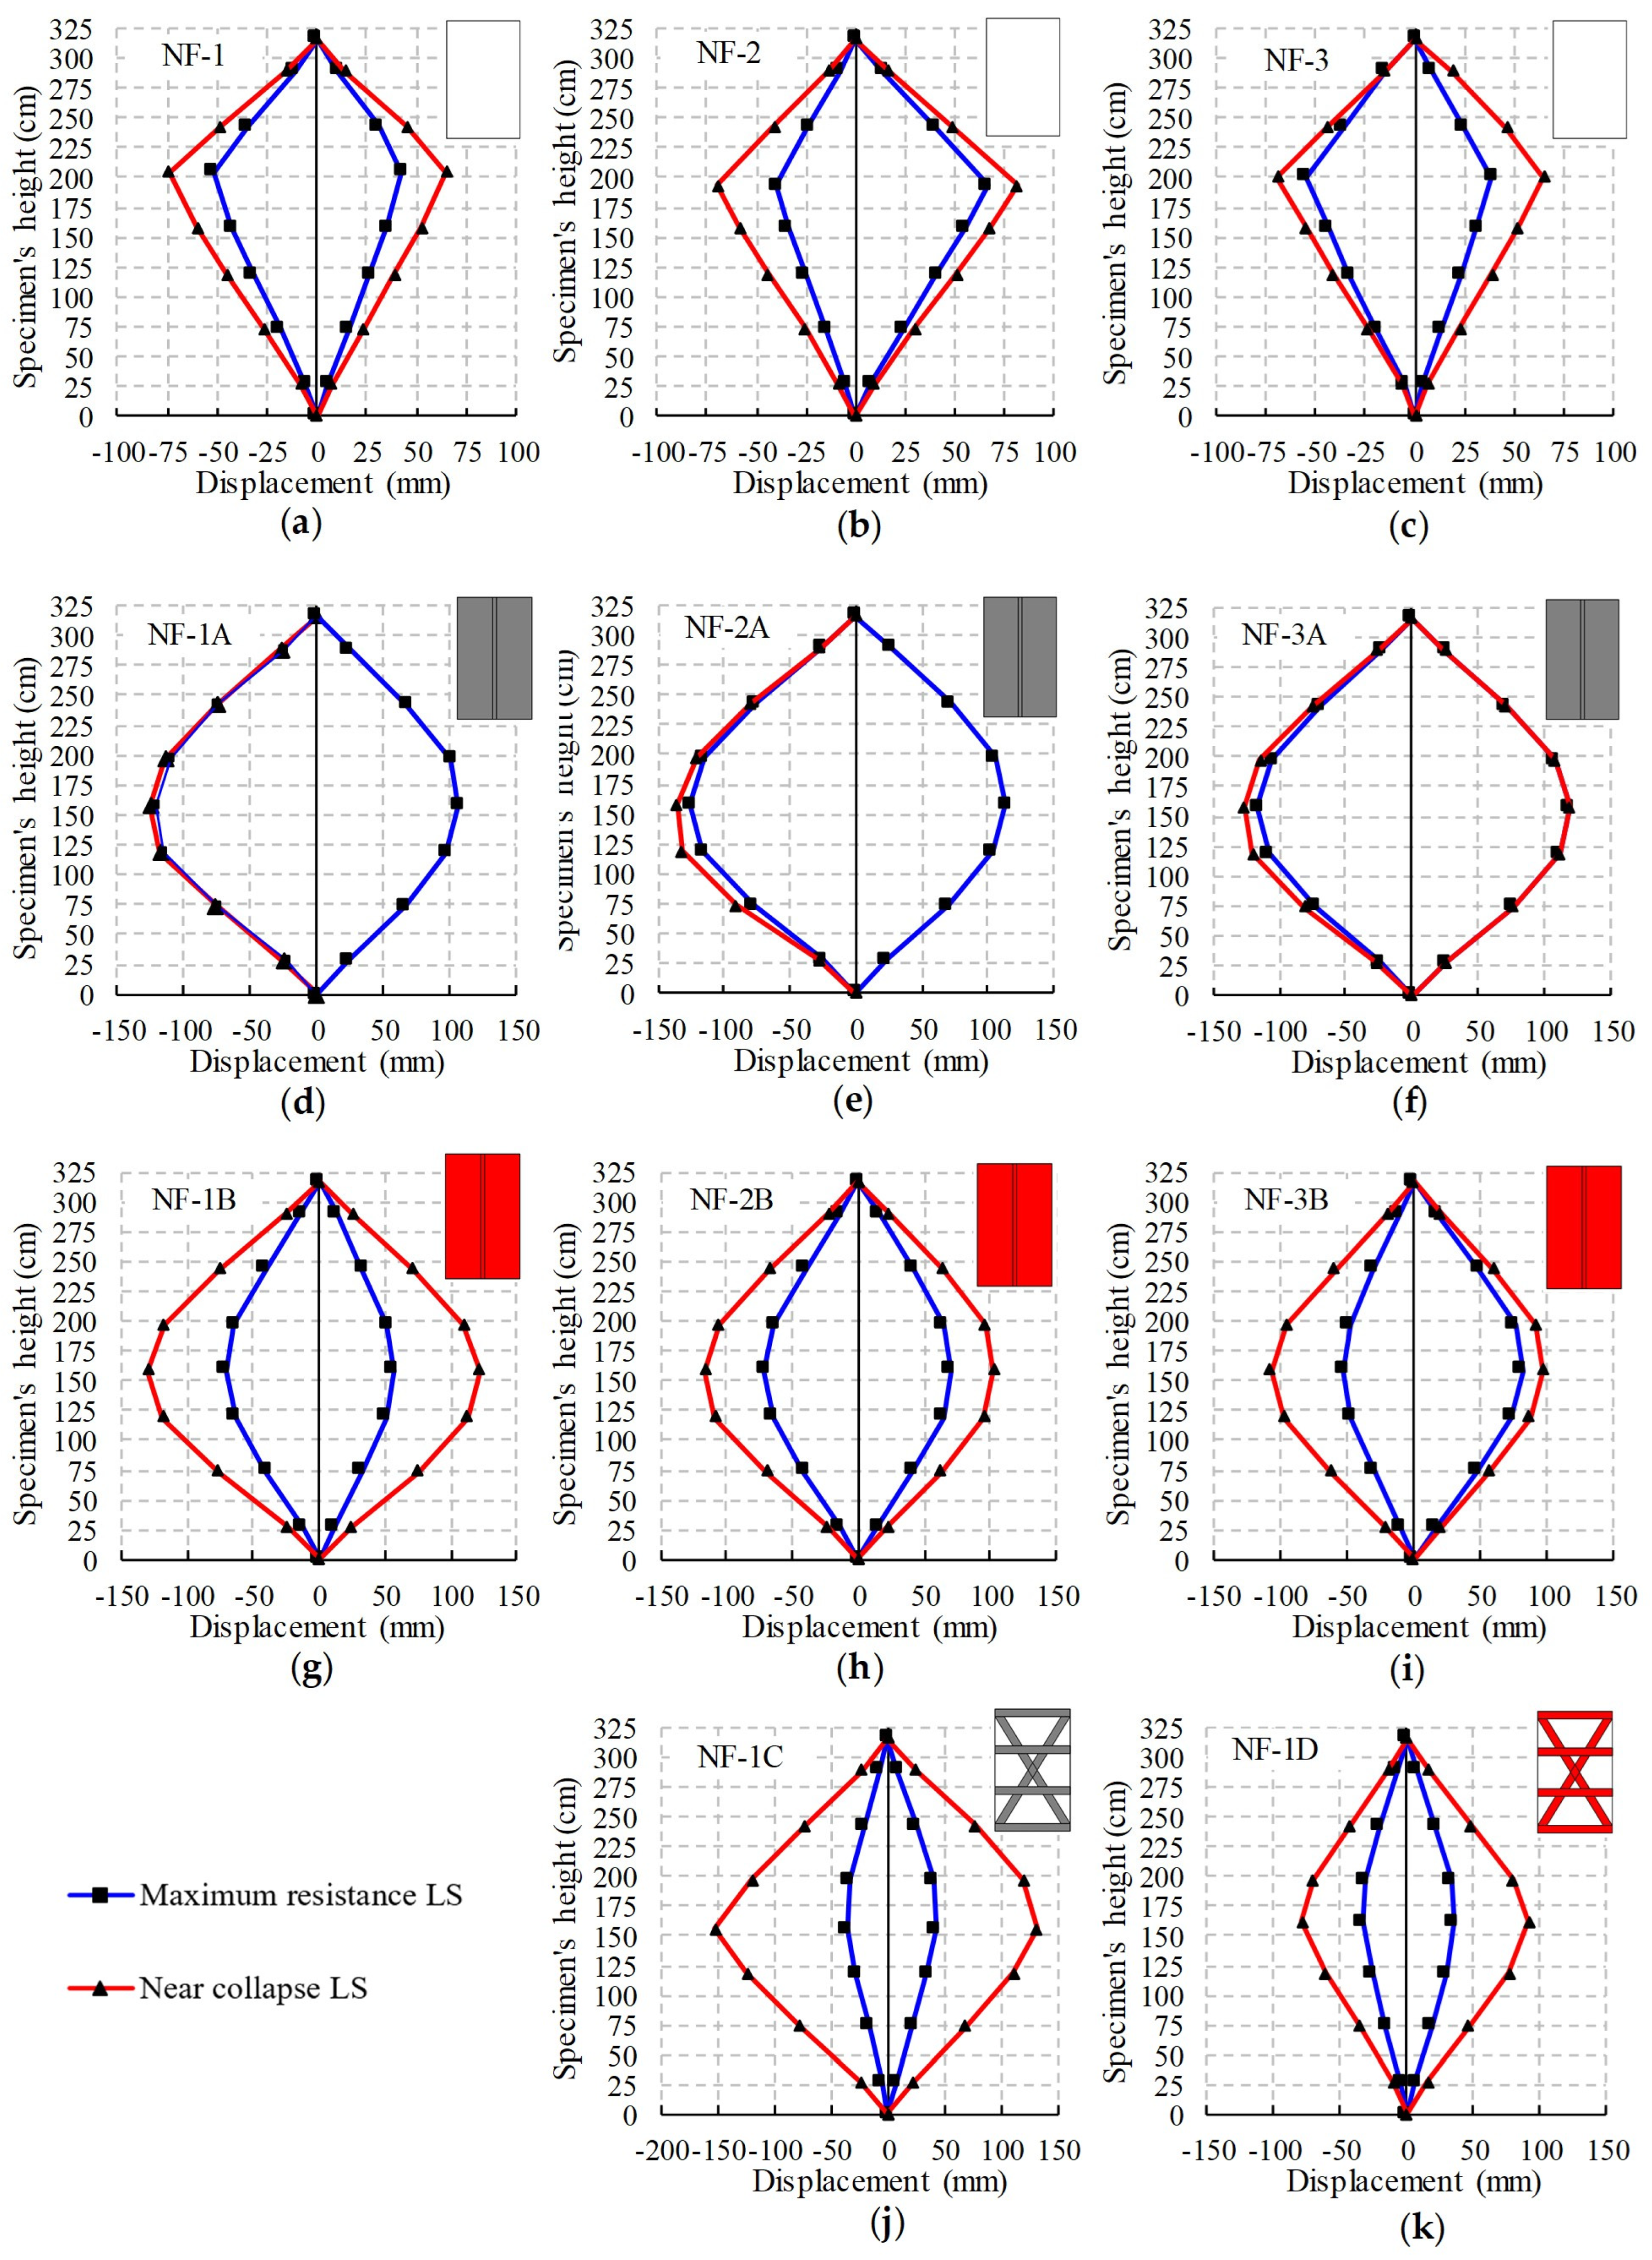
3.2. Response Envelope Curves and Limit States

The limit states are determined based on the force–displacement response hysteresis envelopes for the positive and negative loading direction. The following limit states (LS) were determined.
  • First crack initiation LS: Reduction in stiffness is observed and a mechanism of plastic hinges in upper, mid-height, and bottom bed joint is formed.
  • Maximum resistance LS: The specimen achieves the maximum out-of-plane resistance force Fmax at the corresponding mid-height out-of-plane displacement.
  • Near collapse LS: The test specimen is severely damaged or in the next amplitude cycle; a collapse is likely to occur.
To analyze the effectiveness of different strengthening systems, a comparison of the average second-cycle hysteresis envelopes in the positive and negative loading direction was performed for individual sets of test specimens. A comparison of the specimens’ average envelope curves (averaged all positive and negative envelopes) is shown in Figure 9. For each LS, the average values of out-of-plane force resistance and the corresponding average displacements are presented in Table 2 for all specimens’ groups.
In the case of the strengthening system A, the maximum resistance LS and the near collapse LS are remarkably close, both in terms of the limit displacements value and the out-of-plane resistance. This is not the case with other NF specimens, where the curve slightly decreases to the near collapse LS after reaching the maximum out-of-plane capacity. A comparison of the average envelopes shows that the strengthening system A has the greatest impact on the maximum out-of-plane resistance. The ratios between displacements at near collapse LS and maximum resistance LS are 1.53, 1.03, 1.63, 4.37, and 2.52 for specimens’ groups NF-good, NF-A, NF-B, NF-C, and NF-D, respectively. The comparison of these ratios correlates to the damage capacity after the maximum resistance LS is reached, where NF-A and NF-B exhibit limited damage capacity before total failure of strengthening systems. On the other hand, the NF-C and NF-D systems have a higher damage capacity after exceeding the maximum resistance LS, which can be explained by observing the diagonal strengthening strips’ orientation, where different tensile stress distribution occurs.
For a more detailed comparison, the average load capacities and limit displacements of individual test specimens’ groups for each of the limit states were normalized in respect to average values of as-built (NF-good) specimens. A relative comparison of different strengthening systems’ efficiency at all three limit states for out-of-plane force resistance is shown in Figure 10.
When comparing the out-of-plane force resistance of strengthened and non-strengthened (NF-good) specimens, it can be seen that by applying the strengthening system A, the resistance at first crack initiation LS is increased by 60%, the maximum resistance LS is increased by 221%, and the near collapse LS is increased by 315%. For system B, the out-of-plane resistance improvement was approximately halved namely, 51%, 98%, and 116% for each of the limit states, respectively. The first crack initiation LS resistance increased by 61% and by 56% for the C and D systems, respectively. Systems C (by 65%) and D (by 61%) have a similar effect on increasing the capacity of maximum resistance LS and have a negligible effect on the out-of-plane force resistance at near collapse LS. However, the out-of-plane force resistance value at near collapse LS is similar to the as-built (NF-good) specimens, the corresponding displacements are much higher than the displacements of the as-built specimens at near collapse LS.
At maximum resistance LS, the corresponding limit mid-height displacements for specimens with strengthening system A and system B increase by 200% and 84%, respectively. The remaining systems exhibit a negative effect. The corresponding displacement at the near collapse LS increases the most (by 149%) when using the strengthening system C, systems A (by 101%) and B (by 95%) have a similar effect on displacements’ capacity at the near collapse state.
A comparison between out-of-plane displacement deformed shapes at maximum resistance LS and near collapse LS can be seen in Figure 11. From the displacement profiles of the NF-1, NF-2, and NF-3 (see Figure 11a–c) specimens, it is evident that the maximum out-of-plane displacement appears at two-thirds of the specimen’s height, where the mid-height cracking has occurred. Strengthening systems A (see Figure 11d–f) and B (see Figure 11g–i) provide a significantly better connection of masonry components compared to non-strengthened specimens. This explains the specimens’ highly regular and symmetric recorded horizontal displacement profile with the maximum out-of-plane displacement appearing at the exact mid-height of the wall. Similarly, in the case of the strengthening systems C (see Figure 11j) and D (see Figure 11k), the displacement profiles show a relatively regular and symmetric behavior of the specimens, but it is not as favorable as for systems A and B.

3.3. Stiffness Degradation

With each new cycle and increased applied mid-height displacement amplitude, the damage of the specimen accumulates. Consequently, the stiffness degradation of the tested specimen is inevitable and is one of the main parameters in the characterization of the specimen’s hysteretic response. The displacement amplitudes ui at the mid-height of the specimen and the corresponding horizontal force Fi define the secant stiffness values of each hysteresis response loop Ki, as given by Equation (1). From the experimentally obtained discrete values of stiffness and displacements of all cycles for an individual specimen, it is evident that the decrement of stiffness can be approximated by a hyperbolic curve using the least squares method. Based on the hysteresis response, the characteristic stiffness degradation parameters (C and n) were determined for each specimen. The parameters define the interpolation hyperbolic function with Equation (2) to obtain the best fit to the experimentally obtained stiffness degradation values for each loading direction.
K i = F i u i
y ( x ) = C x n y ( x ) = K i , x = u i
The coefficient C defines the overall vertical position of the curve, which indicates the global stiffness degradation, while the coefficient n dictates the shape of the curve and indicates the initial stiffness degradation slope. The higher the value of the coefficient n, the steeper the initial stiffness degradation. Increasing of the coefficient C results in a higher remaining stiffness over the entire testing out-of-plane displacement amplitude range.
In order to compare the strengthening systems’ efficiencies according to stiffness degradation, the average factors of the interpolation functions n and C were determined from the positive and negative loading direction for each group of tested specimens, depending on their type and strengthening system. The average stiffness degradation interpolation functions of all groups of specimens are presented in Figure 12. The NF-poor curve has a lower position in comparison to the NF-good curve, as a consequence of the incompletely filled bed joint in the bottom location of the plastic hinge formation. From the average stiffness degradation curves’ progress, it can be observed that all strengthening systems reduce the stiffness degradation rate. Expectedly, the application of strengthening systems A displays the greatest behavior improvement, which is followed by the application of the strengthening systems B, C, and D. The curves of NF-B and NF-D specimens have similar progress until reaching the 15 mm of mid-height displacement amplitude. After exceeding it, the NF-D curve gets closer to the NF-C curve. The progress of both becomes practically equal above the mid-height displacement amplitude of 45 mm.
Since the coefficient n governs the initial stiffness degradation and is strongly connected with the first crack initiation LS for which the results are scattered due to the quality of workmanship, it is difficult to draw any conclusion. The coefficient C governs the global secant stiffness degradation over the entire range of applied displacement amplitudes, after the plastic hinges development. In order to compare strengthening systems’ efficiencies according to global stiffness degradation, the values of the average coefficients C were normalized with the average value of non-strengthened (NF-good) specimens. A comparison of the normalized coefficients Cnorm is shown in Figure 13. The improvement is the most significant when applying strengthening system A, which increases the coefficient by 171%. It is followed by system D with an increase of 168%. Systems B and C increase the coefficient by 103% and 117%, respectively.

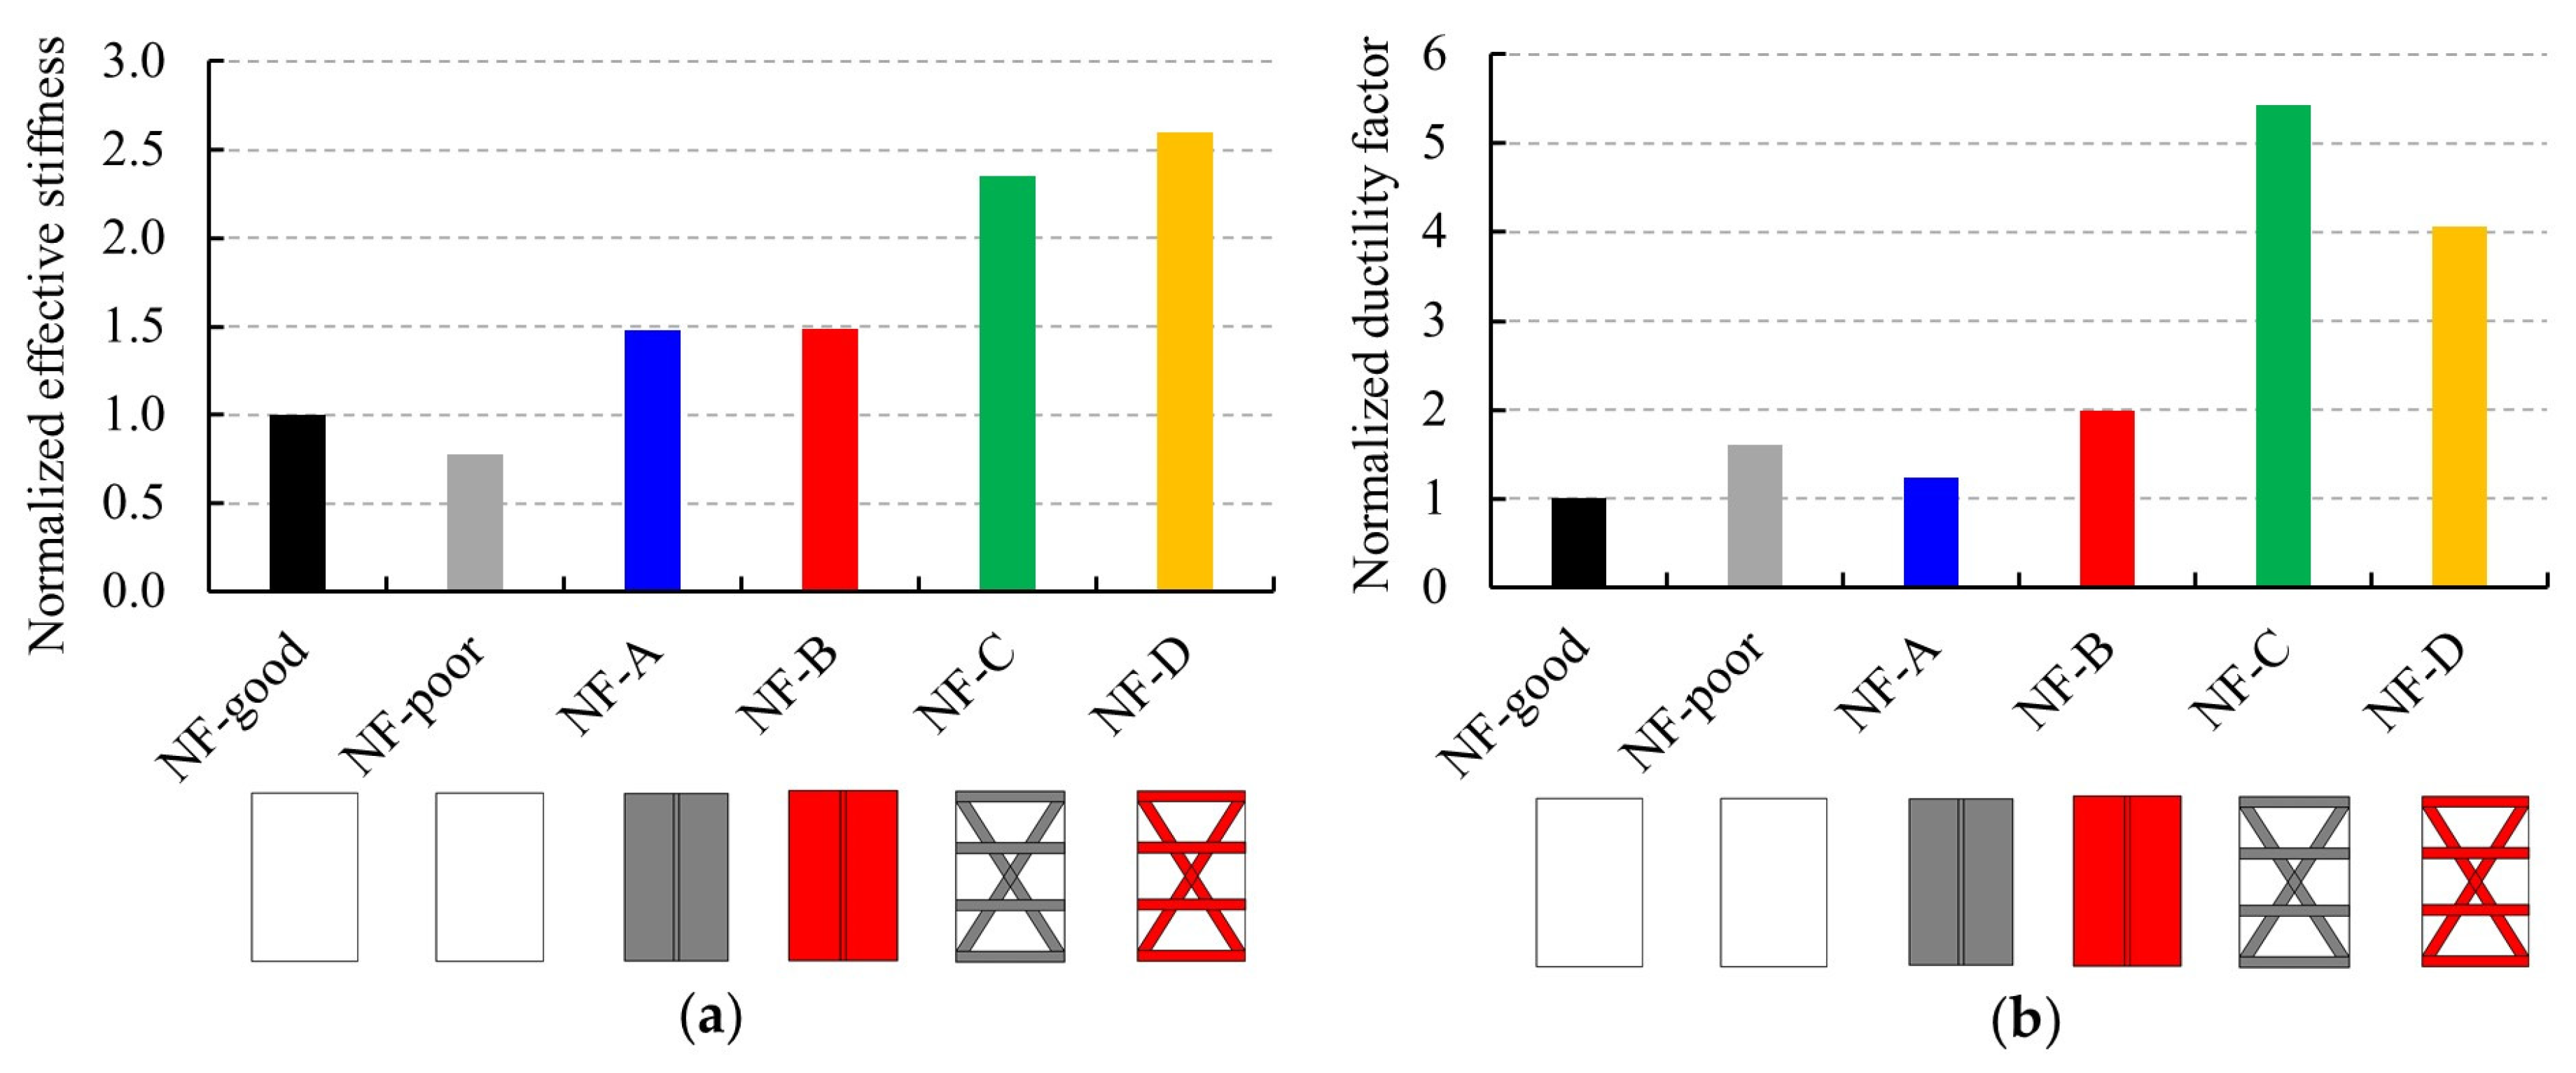
3.4. Ductility and Effective Stiffness

To compare the effective stiffness and ductility of non-strengthened and strengthened specimens, an idealization of hysteresis envelopes was performed with an equivalent bilinear diagram, which is defined by the energy equality principle [65,66,67]. The effective stiffness Kef, which governs the slope of the first part of the idealized equivalent bilinear diagram, is obtained as a ratio between 2/3 of the maximum experimentally achieved force Fmax and the corresponding horizontal displacement ue. Equation (3) was used to calculate the effective stiffness Kef for each loading direction. Similarly, the ductility factor μ was determined by Equation (4), which is defined as the ratio between the maximum displacement umax and the displacement at the elastic limit of the idealized diagram uef. All idealizations were made up to the specimens’ near collapse LS. An example of characteristic points and idealization are schematically presented in the case of the NF-1 specimen’s hysteresis envelope in the positive direction (see Figure 14a).
K e f = 2 3 F m a x u e
μ = u m a x u e f
Idealization curves, together with the corresponding hysteresis envelopes, are presented for all tested specimens in Figure 14. Even though the idealization is adopted from the in-plane shear tests of masonry walls, the idealized diagrams fit well when compared to the experimental hysteresis envelopes from the presented out-of-plane tests. The deviation can only be noticed at specimens NF-1C and NF-1D (see Figure 14j,k).
For the assessment of tested wall strengthening systems’ efficiency and the comparison of the results, the values of displacements and idealized resistance at the characteristic points were averaged for each specimen group, including positive and negative loading directions. Based on the average values at the characteristic points, the parameters of the effective stiffness Kef and ductility μ, which represent the average idealized curve of an individual group of specimens, were also evaluated and are presented in Table 3.
The comparison of the effective stiffness Kef and ductility μ, normalized with the average values for non-strengthened NF-good specimens’ response, is presented in Figure 15. Specimens’ NF-good responses show stiffer behavior against NF-poor, whereas the ductility is lower for NF-good specimens’ response. Applying the strengthening system A or B increases the effective stiffness by about 50% compared to the non-strengthened (NF-good) specimens. Systems A and B increase the ductility factor μ by 25% and 20%, respectively. By applying strengthening systems C and D, the greatest improvements regarding the effective stiffness and ductility can be observed. Using the strengthening system C, the effective stiffness is increased by up to 135% and the ductility by as much as 442%. With system D, these two values increase by 160% and 306%, respectively.
The ductility factor is superseded with displacement-based methods in the majority of modern seismic design codes that consider performance-based design [68,69]. The LS analysis made it clear that the A and B systems have superior resistance and displacement capacity improvement at maximum resistance LS in comparison to the C and D systems. Therefore, the displacements at near collapse LS have direct practical value in comparison to the ductility factor for the design practice.

3.5. Eigenfrequencies and Damping

The dynamic response of non-strengthened and strengthened specimens was assessed with the forced vibration method using attached accelerometers ACC1, ACC2, and ACC3 (see Figure 3) on the specimen before and after the quasi-static cyclic testing. Thus, the first natural frequency f and damping ratio ξ were evaluated on the intact state of an individual specimen and again after test termination, when the specimen was returned back to its neutral position. With fast Fourier transformation, the time response spectrum was converted to the amplitude response spectrum in the frequency domain, where amplitude peaks represent the natural oscillating frequencies. The natural frequency of the first mode shape was determined by comparing the amplitude peaks of the spectra for three accelerometers placed at 1/4 (ACC1), 1/2 (ACC2), and 3/4 (ACC3) of the wall specimen height. At first mode shape, the amplitude peaks of the accelerometers ACC1 and ACC3 exhibit a similar value which is, at the same time, significantly smaller compared to the value of accelerometer ACC2 at mid-height. From the amplitude spectrum using the half-power bandwidth method [70], the proportion of the critical damping ratio for the first oscillating shape was determined. The results of the dynamic properties of all tested non-structural walls specimens are summarized in Table 4.
By applying strengthening systems, the natural time period T is reduced by 7% to 12% compared to the non-strengthened NF specimens in the undamaged state prior to testing. The critical damping ratio of strengthened specimens is also, to some degree, lower, except in the case of the strengthening system D. The results of non-strengthened specimens show that the natural time period T of undamaged slender non-structural walls built of regular solid bricks nears 0.07 s and can increase up to 0.2 s (at the least) by damage caused during an earthquake. The critical damping ratio of undamaged non-strengthened specimens is about 2.9% and can increase up to 7.3% in the case of damaged specimens. The comparison of strengthened systems after the tests is not applicable, since the failures were not the same for all specimens. These parameters are important in the process of out-of-plane design load definition when performing the structural analysis of a building.
Another way to determine equivalent viscous damping is based on the hysteretic responses of specimens and was calculated using Equation (5). When processing the experimental results of the hysteresis, energy dissipation in both directions of loading is taken into account in the analysis of each cycle [66,71].
ξ H = E D 2 π ( E E + + E E ) = E D 2 π ( 1 2 K i + u m a x , i + + 1 2 K i u m i n , i )
The parameter ED stands for the dissipated energy in a hysteresis loop, EE stands for the elastic deformation energy (sum of the elastic deformation energy of the positive and negative direction), Ki+ and Ki- represent the secant stiffness of the loop in the positive and negative direction and u+max,i and u-min,i stand for the maximum and minimum displacements of the considered hysteresis loop [66].
The development of the equivalent viscous damping coefficient ξH, with respect to the mid-height amplitude displacement, is presented in Figure 16. Additionally, the values of the critical damping ratio ξ obtained with the forced vibration method are shown with the black dashed horizontal lines along the entire range of amplitudes. The linearization between the initial value of the critical damping ratio (at an amplitude of 0 mm) and the final damping value (at the maximum displacement amplitude) is presented with a red dotted line.
The values of equivalent viscous damping coefficients ξH are within the range of 3.2% to 4.4% at the first crack initiation LS for all test specimens. It can be concluded that the presented strengthening systems do not have a substantial impact on the viscous damping coefficient up to the first crack initiation LS. The damping ratios ξ determined from the forced vibrations before cyclic testing have slightly lower values (2.8–3.1%) due to the intact state of the specimens. This comparison confirms that the forced vibration method could be used for the conservative in situ assessment of initial dynamic parameters.
After reaching the first crack initiation LS, a similar initial peak value of viscous damping ξH is also observed in all specimens, as a consequence of the extensive energy dissipation caused by the development of plastic hinges and masonry flexural cracking. Following the complete development of plastic hinges, the value of equivalent viscous damping ξH stabilizes at a lower level.
After reaching the maximum resistance LS for non-strengthened specimens, the value ξH begins to increase up to 7% (see Figure 16a). For the groups of specimens NF-A and NF-B, the beginning of increasing ξH appears slightly before the maximum resistance LS and further increases until the near collapse LS (see Figure 16b,c). The values obtained for NF-A and NF-B at near collapse LS are 6.9% and 8.6%, respectively. From the curves’ shape of the NF-1C and NF-1D specimens, a more extended range of increasing damping can be observed after exceeding the displacement amplitudes at maximum resistance LS (see Figure 16d,e). The viscous damping coefficients for specimens NF-1C and NF-1D at near collapse LS achieve 13.3% and 8.7%, respectively.

4. Final Remarks and Conclusions

This study investigated new strengthening techniques to prevent the out-of-plane collapse of non-structural masonry partition walls in future earthquakes by using flexible adhesives and glass fiber reinforcement. An experimental investigation was carried out to assess the strengthening systems’ efficiency regarding the out-of-plane behavior. Quasi-static cyclic tests were performed on eleven full-scale non-structural wall specimens. Three of them were non-strengthened, three were fully surface strengthened with reinforcing fabric (strengthening system A), three were fully surface strengthened with rendering mesh (strengthening system B), one was strengthened with diagonal and horizontal strips of reinforcing fabric (strengthening system C), and one was strengthened with diagonal and horizontal strips of rendering mesh (strengthening system D). A flexible polyurethane-based adhesive in watery dispersion was used for the application of all strengthening systems. The main conclusions can be summarized as follows:
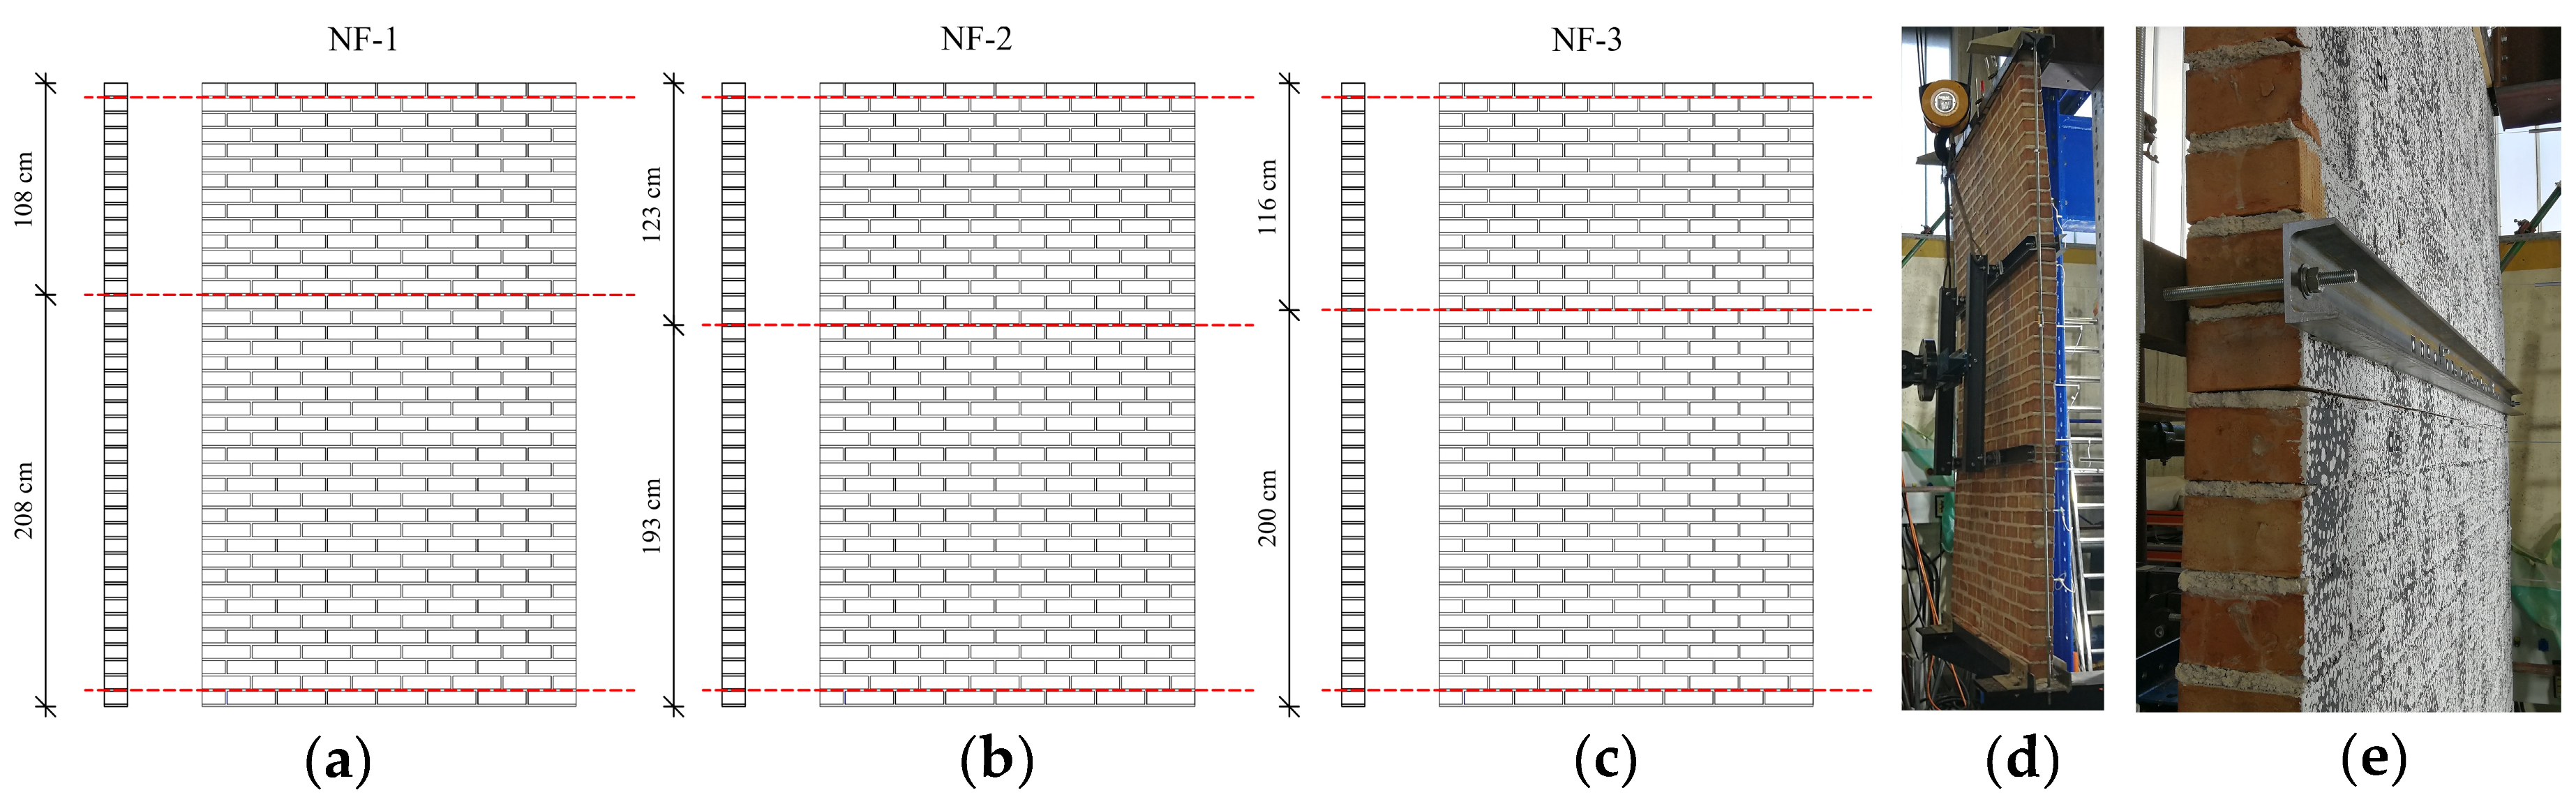
  • The out-of-plane displacement deformed shape was more continuous when strengthening systems were applied compared to non-strengthened specimens. This is due to a more uniform response of strengthened masonry along the height of a wall. Non-strengthened specimens exposed the composite character of masonry where mortar joints are the plane of weakness. There, the failure was due to the formation of a plastic hinge in the bed joint at about 2/3 of the specimens’ height. The strengthened specimens, on the other hand, developed multiple bed joint cracks in the mid-height area with the constant bending moment.
  • From the cyclic response of tested specimens, an asymmetrical out-of-plane behavior of non-strengthened specimens was obtained, in dependence on the quality of the workmanship, while the behavior of strengthened specimens was close to the symmetrical one.
  • The quality of workmanship (the difference of results for NF-good and NF-poor) can be anticipated in the design practice by considering appropriate partial factors for materials as proposed in EN 1996-1-1 [64].
  • The out-of-plane load-bearing resistance of non-structural walls, strengthened with systems A, B, C, and D, was increased by 221%, 98%, 65%, and 61%, respectively. Although twice lower, the low-cost system applied on the whole surface of the masonry significantly improved its resistance (A vs. B). For other dispositions of strengthening systems, this influence was negligible (C vs. D).
  • The maximum mid-height out-of-plane horizontal displacement was increased with strengthening systems A, B, C, and D by 101%, 95%, 149%, and 64%, respectively.
  • Strengthening systems A and D had the greatest impact on the global secant stiffness of the considered wall over the entire range of applied displacement amplitudes. The improvements of 171% and 168%, respectively, were observed. Comparison of hysteresis envelopes with the idealized one reveals that the methodology for idealization adopted from the in-plane shear tests could be used for the approximation of obtained results from cyclic out-of-plane testing.
Based on the obtained experimental results, it can be concluded that simple and cost-effective strengthening systems (systems B and D) can easily be applied during regular refurbishment works on slender non-structural masonry partition walls of existing buildings. They act as effective remedial measures and reduce life-threatening risks and economic losses.
Further experimental research is needed in order to determine the efficiency of the strengthening systems on other types of non-structural masonry walls and walls with different geometry aspect ratios and applied boundary conditions. In addition, the combination of out-of-plane and in-plane seismic performance should be investigated. For the assessment of the effect of improper bed joints filling to the out-of-plane behavior of as-built or strengthened non-structural masonry partition walls, additional experiments are needed.

Author Contributions

Conceptualization, M.K., D.A. and V.B.; methodology, M.K., D.A. and V.B.; validation, D.A. and V.B.; formal analysis, M.K. and D.A.; investigation, M.K. and V.B.; resources, V.B.; data curation, M.K.; writing—original draft preparation, M.K.; writing—review and editing, M.K., D.A and V.B..; visualization, M.K. and D.A.; supervision, D.A. and V.B.; project administration, V.B.; funding acquisition, V.B. All authors have read and agreed to the published version of the manuscript.

Funding

This research was funded by the Slovenian Research Agency (research core funding No. P2-0185) within Young Researcher program.

Institutional Review Board Statement

Not applicable.

Informed Consent Statement

Not applicable.

Data Availability Statement

All data appear in the submitted article.

Acknowledgments

The authors acknowledge the financial support from the Slovenian Research agency. The help of Franci Čepon with specimens’ preparation and test executions is also gratefully acknowledged.

Conflicts of Interest

The authors declare no conflict of interest.

References

  1. Filiatrault, A.; Sullivan, T. Performance-Based Seismic Design of Nonstructural Building Components: The next Frontier of Earthquake Engineering. Earthq. Eng. Eng. Vib. 2014, 13, 17–46. [Google Scholar] [CrossRef]
  2. Taghavi, S.; Miranda, E. Response Assessment of Nonstructural Building Elements; Stanford University: Stanford, CA, USA, 2003; p. 96. [Google Scholar]
  3. Braga, F.; Manfredi, V.; Masi, A.; Salvatori, A.; Vona, M. Performance of Non-Structural Elements in RC Buildings during the L’Aquila, 2009 Earthquake. Bull. Earthq. Eng. 2011, 9, 307–324. [Google Scholar] [CrossRef]
  4. Perrone, D.; Calvi, P.M.; Nascimbene, R.; Fischer, E.C.; Magliulo, G. Seismic Performance of Non-Structural Elements during the 2016 Central Italy Earthquake. Bull. Earthq. Eng. 2019, 17, 5655–5677. [Google Scholar] [CrossRef]
  5. Ian, R.; Selim, G.; Armando, M.; Giulia, S.; Ting, L.; Nikola, B.; Dimitrios, L.; Jorge, A.; Igor, T.; Katerina, Z.; et al. Joint Reconnaissance Report (JRR) in StEER-EERI: Petrinja, Croatia December 29, 2020, Mw 6.4 Earthquake, Report No. PRJ-2959; Natural Hazards Engineering Research Infrastructure: West Lafayette, IN, USA, 2021. [CrossRef]
  6. Lulić, L.; Ožić, K.; Kišiček, T.; Hafner, I.; Stepinac, M. Post-Earthquake Damage Assessment—Case Study of the Educational Building after the Zagreb Earthquake. Sustainability 2021, 13, 6353. [Google Scholar] [CrossRef]
  7. Stepinac, M.; Lourenço, P.B.; Atalić, J.; Kišiček, T.; Uroš, M.; Baniček, M.; Šavor Novak, M. Damage Classification of Residential Buildings in Historical Downtown after the ML5.5 Earthquake in Zagreb, Croatia in 2020. Int. J. Disaster Risk Reduct. 2021, 56, 102140. [Google Scholar] [CrossRef]
  8. Menon, A.; Magenes, G. Definition of Seismic Input for Out-of-Plane Response of Masonry Walls: I. Parametric Study. J. Earthq. Eng. 2011, 15, 165–194. [Google Scholar] [CrossRef]
  9. Akhoundi, F.; Vasconcelos, G.; Lourenco, P.; Silva, L.C. Out-of-Plane Response of Masonry Infilled RC Frames: Effect of Workmanship and Opening. In Proceedings of the 16th International Brick and Block Masonry Conference, Padova, Italy, 23 June 2016. [Google Scholar]
  10. Angel, R.; Abrams, D.P.; Shapiro, D.; Uzarski, J.; Webster, M. Behavior of Reinforced Concrete Frames with Masonry Infills; Department of Civil Engineering, University of Illinois at Urbana-Champaign: Champaign, IL, USA, 1994. [Google Scholar]
  11. Dizhur, D.; Walsh, K.; Giongo, I.; Derakhshan, H.; Ingham, J. Out-of-Plane Proof Testing of Masonry Infill Walls. Structures 2018, 15, 244–258. [Google Scholar] [CrossRef]
  12. Hashemi, A.; Mosalam, K.M. Shake-Table Experiment on Reinforced Concrete Structure Containing Masonry Infill Wall. Earthq. Eng. Struct. Dyn. 2006, 35, 1827–1852. [Google Scholar] [CrossRef]
  13. da Porto, F.; Guidi, G.; Dalla Benetta, M.; Verlato, N. Combined In-Plane/Out-of-Plane Experimental Behaviour of Reinforced and Strengthened Infill Masonry Walls. In Proceedings of the 12th Canadian Masonry Symposium, Vancouver, BC, Canada, 2–5 June 2013; p. 11. [Google Scholar]
  14. Di Domenico, M.; De Risi, M.T.; Ricci, P.; Verderame, G.M.; Manfredi, G. Empirical Prediction of the In-Plane/out-of-Plane Interaction Effects in Clay Brick Unreinforced Masonry Infill Walls. Eng. Struct. 2021, 227, 111438. [Google Scholar] [CrossRef]
  15. Flanagan, R.D.; Bennett, R.M. Bidirectional Behavior of Structural Clay Tile Infilled Frames. J. Struct. Eng. 1999, 125, 236–244. [Google Scholar] [CrossRef]
  16. Petrone, C.; Magliulo, G.; Manfredi, G. Shake Table Tests for the Seismic Assessment of Hollow Brick Internal Partitions. Eng. Struct. 2014, 72, 203–214. [Google Scholar] [CrossRef]
  17. Derakhshan, H.; Dizhur, D.; Griffith, M.C.; Ingham, J.M. In Situ Out-of-Plane Testing of As-Built and Retrofitted Unreinforced Masonry Walls. J. Struct. Eng. 2014, 140, 04014022. [Google Scholar] [CrossRef] [Green Version]
  18. Giaretton, M.; Dizhur, D.; da Porto, F.; Ingham, J.M. Construction Details and Observed Earthquake Performance of Unreinforced Clay Brick Masonry Cavity-Walls. Structures 2016, 6, 159–169. [Google Scholar] [CrossRef]
  19. Damiola, M.; Esposito, R.; Messali, F.; Rots, J.G. Quasi-Static Cyclic Two-Way out-of-Plane Bending Tests and Analytical Models Comparison for URM Walls. In Proceedings of the 10th International Masonry Conference, Milan, Italy, 9–11 July 2018. [Google Scholar]
  20. Doherty, K. An Investigation of the Weak Links in the Seismic Load Path of Unreinforced Masonry Buildings. Ph.D. Thesis, Adelaide University, Department of CIvil and Environmental Engineering, Adelaide, Australia, 2000. [Google Scholar]
  21. Drysdale, R.G.; Essawy, A.S. Out-of-Plane Bending of Concrete Block Walls. J. Struct. Eng. 1988, 114, 121–133. [Google Scholar] [CrossRef]
  22. Gattesco, N.; Boem, I. Out-of-Plane Behavior of Reinforced Masonry Walls: Experimental and Numerical Study. Compos. Part B Eng. 2017, 128, 39–52. [Google Scholar] [CrossRef] [Green Version]
  23. Graziotti, F.; Tomassetti, U.; Sharma, S.; Grottoli, L.; Magenes, G. Experimental Response of URM Single Leaf and Cavity Walls in Out-of-Plane Two-Way Bending Generated by Seismic Excitation. Constr. Build. Mater. 2019, 195, 650–670. [Google Scholar] [CrossRef]
  24. Griffith, M.C.; Vaculik, J.; Lam, N.T.K.; Wilson, J.; Lumantarna, E. Cyclic Testing of Unreinforced Masonry Walls in Two-Way Bending. Earthq. Eng. Struct. Dyn. 2007, 36, 801–821. [Google Scholar] [CrossRef]
  25. Mosallam, A.S. Out-of-Plane Flexural Behavior of Unreinforced Red Brick Walls Strengthened with FRP Composites. Compos. Part B Eng. 2007, 38, 559–574. [Google Scholar] [CrossRef]
  26. Valluzzi, M.R.; da Porto, F.; Garbin, E.; Panizza, M. Out-of-Plane Behaviour of Infill Masonry Panels Strengthened with Composite Materials. Mater. Struct. 2014, 47, 2131–2145. [Google Scholar] [CrossRef]
  27. Triantafillou, T.C. Strengthening of Masonry Structures Using Epoxy-Bonded FRP Laminates. J. Compos. Constr. 1998, 2, 96–104. [Google Scholar] [CrossRef]
  28. Anil, Ö.; Tatayoğlu, M.; Demirhan, M. Out-of-Plane Behavior of Unreinforced Masonry Brick Walls Strengthened with CFRP Strips. Constr. Build. Mater. 2012, 35, 614–624. [Google Scholar] [CrossRef]
  29. Tumialan, J.G.; Galati, N.; Nanni, A. Field Assessment of Unreinforced Masonry Walls Strengthened with Fiber Reinforced Polymer Laminates. J. Struct. Eng. 2003, 129, 1047–1056. [Google Scholar] [CrossRef]
  30. Elsanadedy, H.M.; Al-Salloum, Y.A.; Al-Zaheri, Z.M.; Alsayed, S.H.; Abbas, H. Behavior and Design Aspects of FRP-Strengthened URM Walls under Out-of-Plane Loading. J. Compos. Constr. 2016, 20, 04016048. [Google Scholar] [CrossRef]
  31. Al-Salloum, Y.A.; Almusallam, T.H. Load Capacity of Concrete Masonry Block Walls Strengthened with Epoxy-Bonded GFRP Sheets. J. Compos. Mater. 2005, 39, 1719–1745. [Google Scholar] [CrossRef]
  32. Hamoush, S.; McGinley, M.; Mlakar, P.; Terro, M.J. Out-of-Plane Behavior of Surface-Reinforced Masonry Walls. Constr. Build. Mater. 2002, 16, 341–351. [Google Scholar] [CrossRef]
  33. Padalu, P.K.V.R.; Singh, Y.; Das, S. Out-of-Plane Flexural Behaviour of Masonry Wallettes Strengthened Using FRP Composites and Externally Bonded Grids: Comparative Study. Compos. Part B Eng. 2019, 176, 107302. [Google Scholar] [CrossRef]
  34. Al-Jaberi, Z.; Myers, J.; ElGawady, M. Flexural Capacity of Out-of-Plane Reinforced Masonry Walls Strengthened with Externally Bonded (EB) FRP. In Proceedings of the 7th International Conference on Advanced Composite Materials in Bridges and Structures, Vancouver, BC, Canada, 24–26 August 2016. [Google Scholar]
  35. Petersen, R.B.; Masia, M.J.; Seracino, R. Bond Behavior of Near-Surface Mounted FRP Strips Bonded to Modern Clay Brick Masonry Prisms: Influence of Strip Orientation and Compression Perpendicular to the Strip. J. Compos. Constr. 2009, 13, 169–178. [Google Scholar] [CrossRef]
  36. Ehsani, M.R.; Saadatmanesh, H.; Abdelghany, I.H.; Elkafrawy, W. Flexural Behavior of Masonry Walls Strengthened with Composite Fabrics. Spec. Publ. 1993, 138, 497–508. [Google Scholar]
  37. Ehsani, M.R.; Saadatmanesh, H. Seismic Retrofit of URM Walls with Fibre Composites. Mason. Soc. J. 1996, 14, 63–72. [Google Scholar]
  38. Galati, N.; Tumialan, G.; Nanni, A. Strengthening with FRP Bars of URM Walls Subject to Out-of-Plane Loads. Constr. Build. Mater. 2006, 20, 101–110. [Google Scholar] [CrossRef]
  39. Kuzik, M.D.; Elwi, A.E.; Cheng, J.J.R. Cyclic Flexure Tests of Masonry Walls Reinforced with Glass Fiber Reinforced Polymer Sheets. J. Compos. Constr. 2003, 7, 20–30. [Google Scholar] [CrossRef]
  40. Velazquez-Dimas, J.I.; Ehsani, M.R.; Saadatmanesh, H. Out-of-Plane Behavior of Brick Masonry Walls Strengthened with Fiber Composites. ACI Struct. J. 2000, 97, 377–387. [Google Scholar]
  41. Türkmen, Ö.S.; Wijte, S.N.M.; De Vries, B.T.; Ingham, J.M. Out-of-Plane Behavior of Clay Brick Masonry Walls Retrofitted with Flexible Deep Mounted CFRP Strips. Eng. Struct. 2021, 228, 111448. [Google Scholar] [CrossRef]
  42. De Santis, S.; De Canio, G.; de Felice, G.; Meriggi, P.; Roselli, I. Out-of-Plane Seismic Retrofitting of Masonry Walls with Textile Reinforced Mortar Composites. Bull. Earthq. Eng. 2019, 17, 6265–6300. [Google Scholar] [CrossRef]
  43. Harajli, M.; ElKhatib, H.; San-Jose, J.T. Static and Cyclic Out-of-Plane Response of Masonry Walls Strengthened Using Textile-Mortar System. J. Mater. Civ. Eng. 2010, 22, 1171–1180. [Google Scholar] [CrossRef]
  44. Papanicolaou, C.G.; Triantafillou, T.C.; Papathanasiou, M.; Karlos, K. Textile Reinforced Mortar (TRM) versus FRP as Strengthening Material of URM Walls: Out-of-Plane Cyclic Loading. Mater. Struct. 2008, 41, 143–157. [Google Scholar] [CrossRef]
  45. Furtado, A.; Rodrigues, H.; Arêde, A.; Varum, H. Impact of the Textile Mesh on the Efficiency of TRM Strengthening Solutions to Improve the Infill Walls Out-of-Plane Behaviour. Appl. Sci. 2020, 10, 8745. [Google Scholar] [CrossRef]
  46. Babaeidarabad, S.; Caso, F.D.; Nanni, A. Out-of-Plane Behavior of URM Walls Strengthened with Fabric-Reinforced Cementitious Matrix Composite. J. Compos. Constr. 2014, 18, 04013057. [Google Scholar] [CrossRef]
  47. Bellini, A.; Incerti, A.; Bovo, M.; Mazzotti, C. Effectiveness of FRCM Reinforcement Applied to Masonry Walls Subject to Axial Force and Out-Of-Plane Loads Evaluated by Experimental and Numerical Studies. Int. J. Archit. Herit. 2018, 12, 376–394. [Google Scholar] [CrossRef]
  48. Bernat-Maso, E.; Escrig, C.; Aranha, C.A.; Gil, L. Experimental Assessment of Textile Reinforced Sprayed Mortar Strengthening System for Brickwork Wallettes. Constr. Build. Mater. 2014, 50, 226–236. [Google Scholar] [CrossRef] [Green Version]
  49. D’Antino, T.; Carozzi, F.G.; Colombi, P.; Poggi, C. Out-of-Plane Maximum Resisting Bending Moment of Masonry Walls Strengthened with FRCM Composites. Compos. Struct. 2018, 202, 881–896. [Google Scholar] [CrossRef]
  50. D’Ambra, C.; Lignola, G.P.; Prota, A.; Fabbrocino, F.; Sacco, E. FRCM Strengthening of Clay Brick Walls for out of Plane Loads. Compos. Part B Eng. 2019, 174, 107050. [Google Scholar] [CrossRef]
  51. Donnini, J.; Maracchini, G.; Lenci, S.; Corinaldesi, V.; Quagliarini, E. TRM Reinforced Tuff and Fired Clay Brick Masonry: Experimental and Analytical Investigation on Their in-Plane and out-of-Plane Behavior. Constr. Build. Mater. 2021, 272, 121643. [Google Scholar] [CrossRef]
  52. Martins, A.; Vasconcelos, G.; Fangueiro, R.; Cunha, F. Experimental Assessment of an Innovative Strengthening Material for Brick Masonry Infills. Compos. Part B Eng. 2015, 80, 328–342. [Google Scholar] [CrossRef] [Green Version]
  53. Sagar, S.L.; Singhal, V.; Rai, D.C.; Gudur, P. Diagonal Shear and Out-of-Plane Flexural Strength of Fabric-Reinforced Cementitious Matrix–Strengthened Masonry Walletes. J. Compos. Constr. 2017, 21, 04017016. [Google Scholar] [CrossRef]
  54. Kadam, S.B.; Singh, Y.; Li, B. Out-of-Plane Behaviour of Unreinforced Masonry Strengthened Using Ferrocement Overlay. Mater. Struct. 2015, 48, 3187–3203. [Google Scholar] [CrossRef]
  55. Al-Jaberi, Z.; Myers, J.J.; ElGawady, M.A. Pseudo-Static Cyclic Loading Comparison of Reinforced Masonry Walls Strengthened with FRCM or NSM FRP. Constr. Build. Mater. 2018, 167, 482–495. [Google Scholar] [CrossRef]
  56. Kouris, L.A.S.; Triantafillou, T.C. State-of-the-Art on Strengthening of Masonry Structures with Textile Reinforced Mortar (TRM). Constr. Build. Mater. 2018, 188, 1221–1233. [Google Scholar] [CrossRef]
  57. Stempniewski, L.; Mowrtage, W.; Urban, M. Seismic Collapse Prevention of Non-Structural Infill Masonry Using Eq-Top: An Easy Earthquake Fibre Retrofitting System. Arab. J. Sci. Eng. 2014, 39, 1599–1605. [Google Scholar] [CrossRef]
  58. The European Committee for Standardization. EN 772-1. Methods of Test for Masonry Units, Part 1: Determination of Compressive Strength; CEN: Brussels, Belgium, 2015. [Google Scholar]
  59. The European Committee for Standardization. EN 1015-11. Methods of Test for Mortar for Masonry, Part 11: Determination of Flexural and Compressive Strength of Hardened Mortar; CEN: Brussels, Belgium, 2019. [Google Scholar]
  60. The European Committee for Standardization. EN 1052-5. Methods of Test for Masonry, Part 5: Determination of Bond Strength by the Bond Wrench Method; CEN: Brussels, Belgium, 2005. [Google Scholar]
  61. Griffith, M.C.; Kashyap, J.; Mohamed Ali, M.S. Flexural Displacement Response of NSM FRP Retrofitted Masonry Walls. Constr. Build. Mater. 2013, 49, 1032–1040. [Google Scholar] [CrossRef]
  62. Graziotti, F.; Tomassetti, U.; Penna, A.; Magenes, G. Out-of-Plane Shaking Table Tests on URM Single Leaf and Cavity Walls. Eng. Struct. 2016, 125, 455–470. [Google Scholar] [CrossRef]
  63. Derakhshan, H.; Griffith, M.C.; Ingham, J.M. Airbag Testing of Multi-Leaf Unreinforced Masonry Walls Subjected to One-Way Bending. Eng. Struct. 2013, 57, 512–522. [Google Scholar] [CrossRef] [Green Version]
  64. The European Committee for Standardization. EN 1996-1-1:2005+A1:2012. Eurocode 6: Design of Masonry Structures, Part 1-1: General Rules for Reinforced and Unreinforced Masonry Structures; CEN: Brussels, Belgium, 2013. [Google Scholar]
  65. Tomaževič, M. Earthquake-Resistant Design of Masonry Buildings; Series on Innovation in Structures and Construction; Imperial College Press: London, UK, 1999; Volume 1. [Google Scholar]
  66. Antolinc, D.; Rajčić, V.; Žarnić, R. Analysis of Hysteretic Response of Glass Infilled Wooden Frames. J. Civ. Eng. Manag. 2014, 20, 600–608. [Google Scholar] [CrossRef]
  67. Bosiljkov, V.Z.; Totoev, Y.Z.; Nichols, J.M. Shear Modulus and Stiffness of Brickwork Masonry: An Experimental Perspective. Struct. Eng. Mech. 2005, 20, 21–43. [Google Scholar] [CrossRef] [Green Version]
  68. PrEN 1998-3: Draft. Eurocode 8: Design of Structures for Earthquake Resistance—Part 3: Assessment and Retrofitting of Buildings and Bridges; CEN: Brussels, Belgium, 2019. [Google Scholar]
  69. Sorrentino, L.; D’Ayala, D.; de Felice, G.; Griffith, M.C.; Lagomarsino, S.; Magenes, G. Review of Out-of-Plane Seismic Assessment Techniques Applied To Existing Masonry Buildings. Int. J. Archit. Herit. 2017, 11, 2–21. [Google Scholar] [CrossRef]
  70. Chopra, A.K. Dynamics of Structures: Theory and Applications to Earthquake Engineering, 3rd ed.; Prentice Hall College: Hoboken, NJ, USA, 2007. [Google Scholar]
  71. Priestley, M.J.N.; Seible, F.; Calvi, G.M. Seismic Design and Retrofit of Bridges; John Wiley & Sons, Inc.: New York, NY, USA.
Figure 1. Geometry of a non-strengthened NF specimen.
Applsci 11 09098 g001
Figure 2. Geometry of applied strengthening systems.
Applsci 11 09098 g002
Figure 3. Quasi-static cycling test setup for out-of-plane testing of non-structural wall specimens.
Applsci 11 09098 g003
Figure 4. Applied general loading protocol for out-of-plane testing of non-structural wall specimens.
Applsci 11 09098 g004
Figure 5. Crack development locations (red dashed lines) of as-built specimens (a) NF-1, (b) NF-2, and (c) NF-3; (d) deformation shape of NF-1 and (e) mid-height crack opening of specimen NF-3.
Applsci 11 09098 g005
Figure 6. Deformation shapes of full surface strengthened specimens (a) NF-A and (b) NF-B; characteristic failure modes: (c) debonding of RF in NF-2A, (d) compressive failure of bricks in NF-1A, and (e) tension failure of RM in NF-2B.
Applsci 11 09098 g006
Figure 7. Crack development locations (red dashed lines) of specimens with diagonal and horizontal strips strengthening systems (a) NF-1C and (b) NF-1D; deformation shape of specimens (c) NF-1C and (d) NF-1D; (e) tension failure of RM diagonal strips at intersection in NF-1D.
Applsci 11 09098 g007
Figure 8. Force–displacement hysteretic responses of: (ac) specimens without strengthening, (df) with RF stretched over the entire panel, (gi) with RM stretched over the entire panel, (j) with reinforcement in the form of RF stripes, and (k) with reinforcement in the form of RM stripes.
Applsci 11 09098 g008
Figure 9. Average hysteresis envelopes of 2nd cycles.
Applsci 11 09098 g009
Figure 10. Efficiency of tested strengthening systems in respect to observed limit states considering both out-of-plane force resistance and corresponding displacements.
Applsci 11 09098 g010
Figure 11. Horizontal displacement profiles along the heights of the specimens at maximum resistance LS (blue line) and near collapse LS (red line): (a) NF-1, (b) NF-2, (c) NF-3, (d) NF-1A, (e) NF-2A, (f) NF-3A, (g) NF-1B, (h) NF-2B, (i) NF-3B, (j) NF-C, and (k) NF-D.
Applsci 11 09098 g011
Figure 12. Comparison of stiffness degradation curves.
Applsci 11 09098 g012
Figure 13. Comparison of normalized coefficients Cnorm describing the global stiffness degradation.
Applsci 11 09098 g013
Figure 14. Bilinear idealization of specimens’ hysteresis envelopes: (a) NF-1, (b) NF-2, (c) NF-3, (d) NF-1A, (e) NF-2A, (f) NF-3A, (g) NF-1B, (h) NF-2B, (i) NF-3B, (j) NF-C, and (k) NF-D.
Applsci 11 09098 g014
Figure 15. Comparison of: (a) average normalized effective stiffness and (b) ductility for different strengthening systems.
Applsci 11 09098 g015
Figure 16. Development of equivalent viscous damping coefficients ξH in comparison to the critical damping ratio ξ obtained from the dynamic forced vibration method: (a) Specimens NF-1, NF-2, and NF-3, (b) Specimens NF-1A, NF-2A, and NF-3A, (c) Specimens NF-1B, NF-2B, and NF-3B, (d) Specimen NF-1C, and (e) Specimen NF-1D.
Applsci 11 09098 g016
Table 1. Matrix of specimens and applied strengthening systems.
Specimen’s LabelSpecimens’ Group LabelStrengthening System LabelStrengthening System DetailsSymbol
NF-1NF\As-built
(without strengthening system)
Applsci 11 09098 i001
NF-2
NF-3
NF-1ANF-AAGlass fiber-reinforcing fabric (RF) applied to both sides of the specimen over the entire surface Applsci 11 09098 i002
NF-2A
NF-3A
NF-1BNF-BBGlass fiber-rendering mesh (RM) applied to both sides of the specimen over the entire surface Applsci 11 09098 i003
NF-2B
NF-3B
NF-1CNF-CCGlass fiber-reinforcing fabric (RF) diagonal strips combined with horizontal strips applied to the both sides of the specimen Applsci 11 09098 i004
NF-1DNF-DDGlass fiber-rendering mesh (RM) diagonal strips combined with horizontal strips applied to the both sides of the specimen Applsci 11 09098 i005
Table 2. Average values of out-of-plane force resistance F and corresponding mid-height displacements for each LS.
Specimens’ GroupFirst Crack Initiation LSMaximum Resistance LSNear Collapse LS
FCOVuCOVFCOVuCOVFCOVuCOV
(kN)(%)(mm) (%)(kN)(%)(mm) (%)(kN)(%)(mm) (%)
NF-good2.5\0.7\7.69.837.112.15.912.556.77.4
NF-poor2.7\0.7\3.09.943.128.22.48.057.314.5
NF-A4.119.01.028.624.54.6111.38.824.34.4114.18.2
NF-B3.89.81.514.515.110.168.120.612.79.6110.910.2
NF-C4.1\0.7\12.6\32.3\6.0\141.2\
NF-D4.0\1.8\12.3\31.1\5.9\93.1\
Table 3. Values of average idealized bilinear curves at the characteristic points (Fef, uef, umax) and effective stiffness Kef and ductility μ.
Specimens’ GroupFef (kN)uef (mm)uu (mm)Kef (kN/mm)μ (/)
NF-good7.4923.844.10.311.8
NF-poor2.9512.236.160.243.0
NF-A23.7151.1117.00.462.3
NF-B14.4831.1114.20.473.7
NF-C10.4414.1141.60.7410.0
NF-D10.5112.996.70.827.5
Table 4. Natural frequencies f, corresponding time period T, and damping ratios ξ of tested non-structural walls in the out-of-plane direction obtained with the forced vibration method.
Before TestingAfter Testing
Specimenf [Hz]T [s]ξ [%]f [Hz]T [s]ξ [%]
NF-113.610.0732.814.640.226.74
NF-214.200.0703.214.600.228.16
NF-313.800.0722.604.410.236.97
Average13.870.0722.874.550.227.29
COV2.2%2.2%10.9%2.7%2.7%10.4%
NF-1A14.940.0672.574.830.216.16
NF-2A15.300.0652.894.920.206.51
NF-3A15.830.0632.664.230.246.52
Average15.360.0652.714.660.226.40
COV2.9%2.9%6.1%8.0%8.4%3.2%
NF-1B14.340.0702.583.610.288.74
NF-2B15.080.0662.604.830.218.00
NF-3B15.390.0652.754.600.226.54
Average14.940.0672.644.350.237.76
COV3.6%3.7%3.5%14.9%16.2%14.4%
NF-1C16.370.0612.803.850.268.93
NF-1D16.090.0623.124.230.248.76
Publisher’s Note: MDPI stays neutral with regard to jurisdictional claims in published maps and institutional affiliations.

