
Effects of Electrolyte Supplements on Body Water Homeostasis and Exercise Performance during Exhaustive Exercise


Abstract
1. Introduction
2. Materials and Methods
2.1. Participants
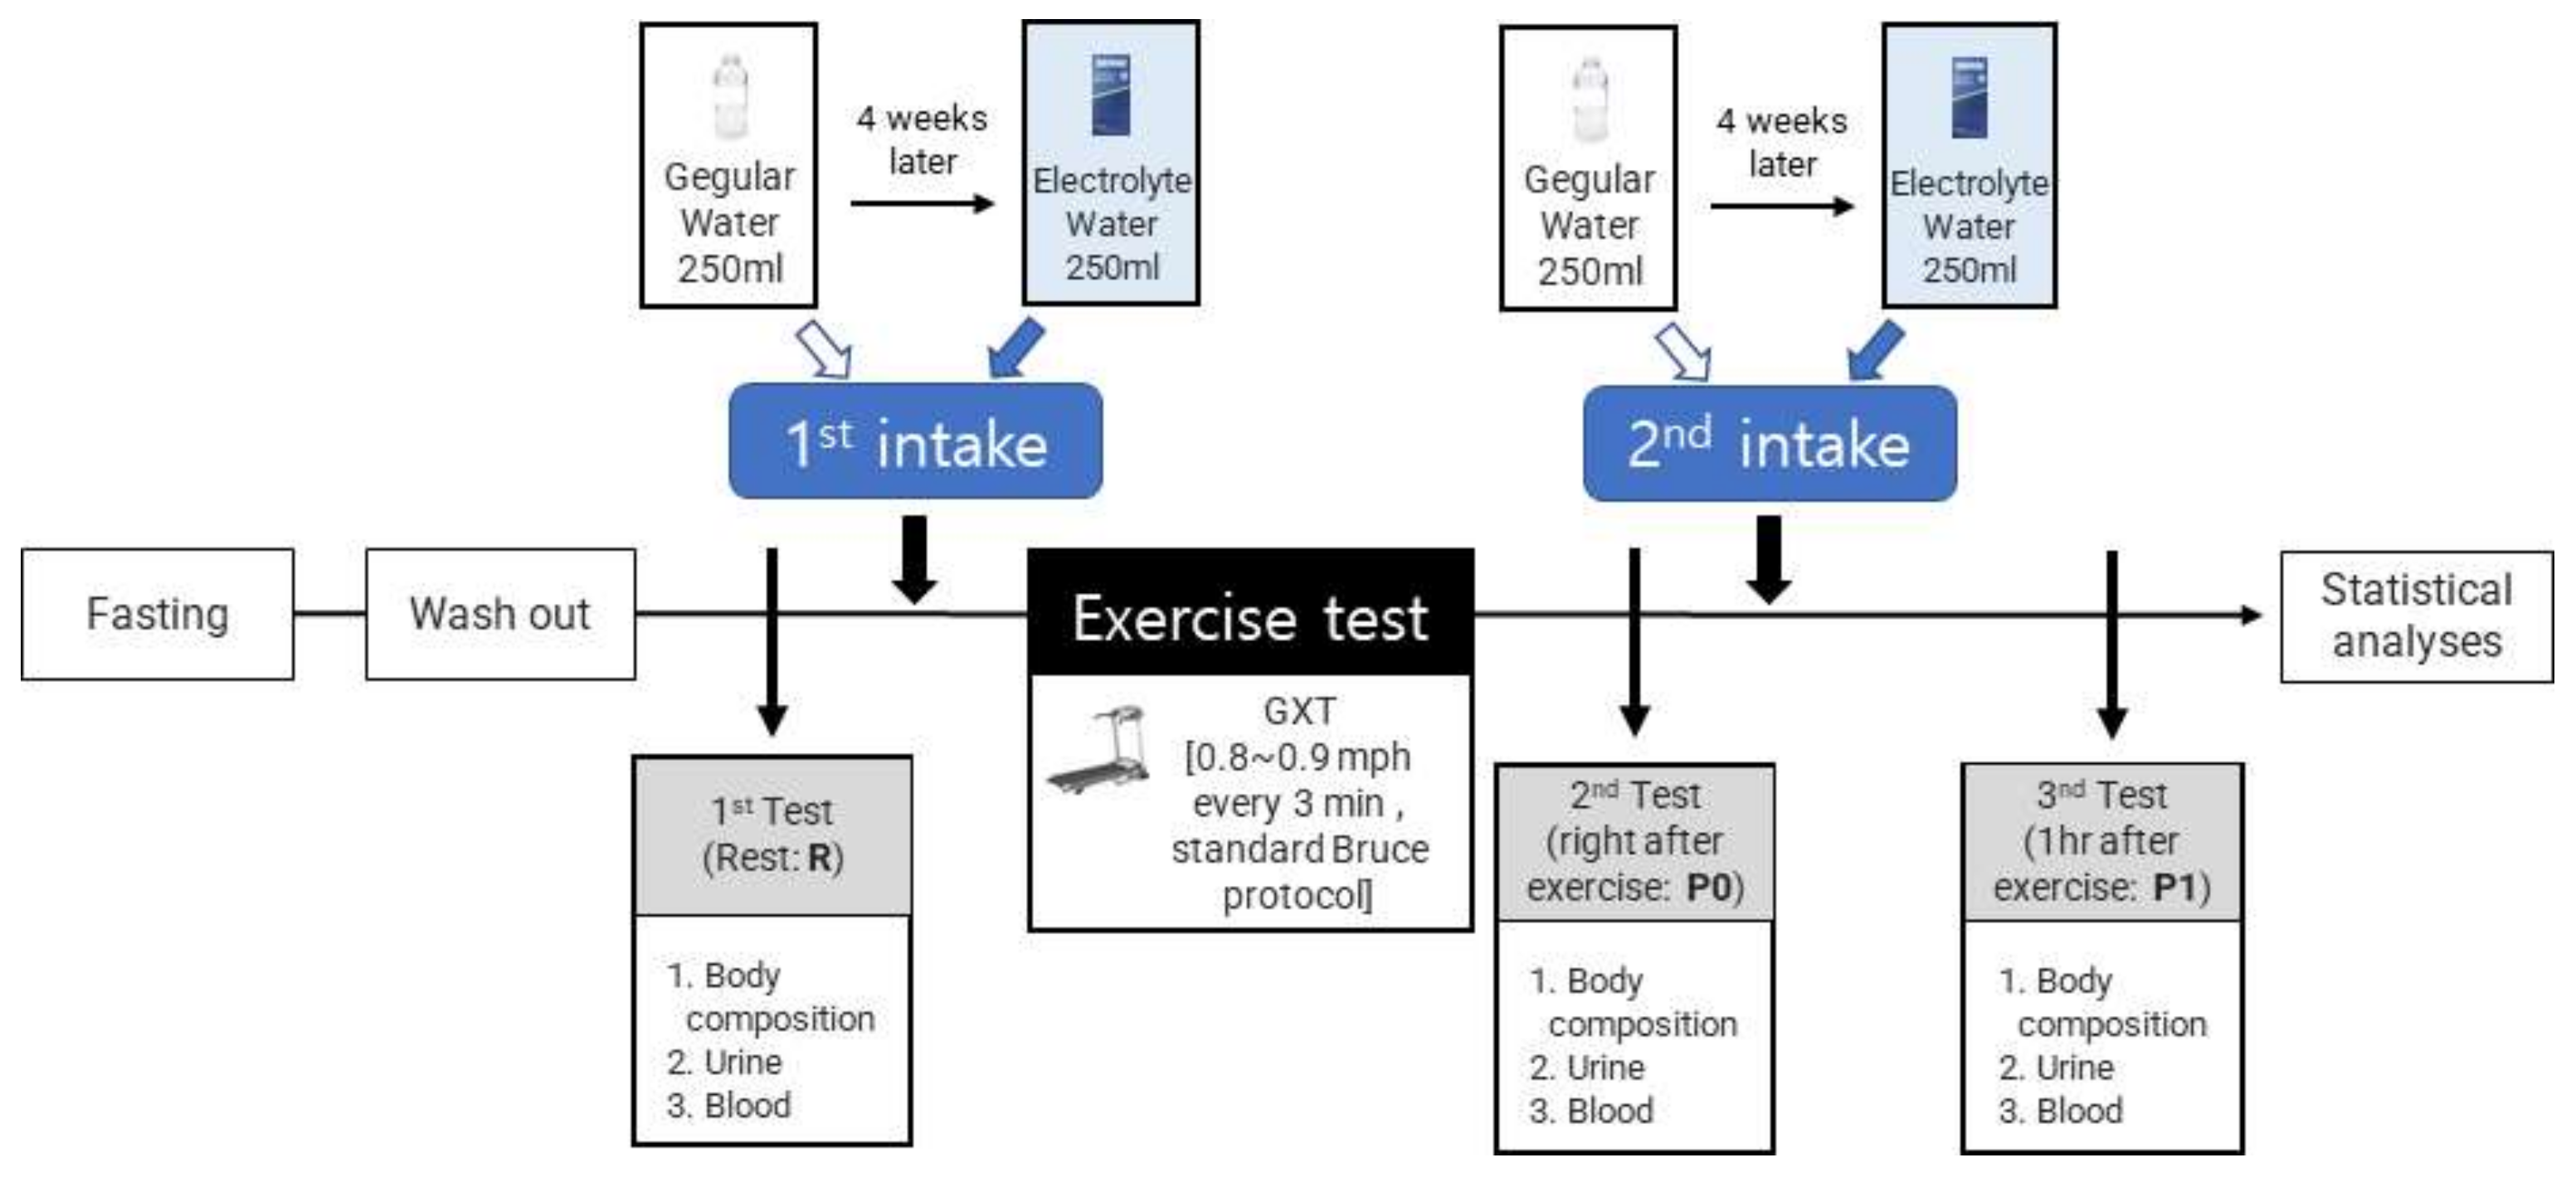
2.2. Study Design
2.3. Hydration Treatment
2.4. Body Composition
2.5. Urine and Blood
2.6. Exercise Test
2.7. Hypothesis and Study Limits
2.8. Statistical Analyses
3. Results
3.1. Differences in Body Composition According to the Type of Fluid and Intake Period
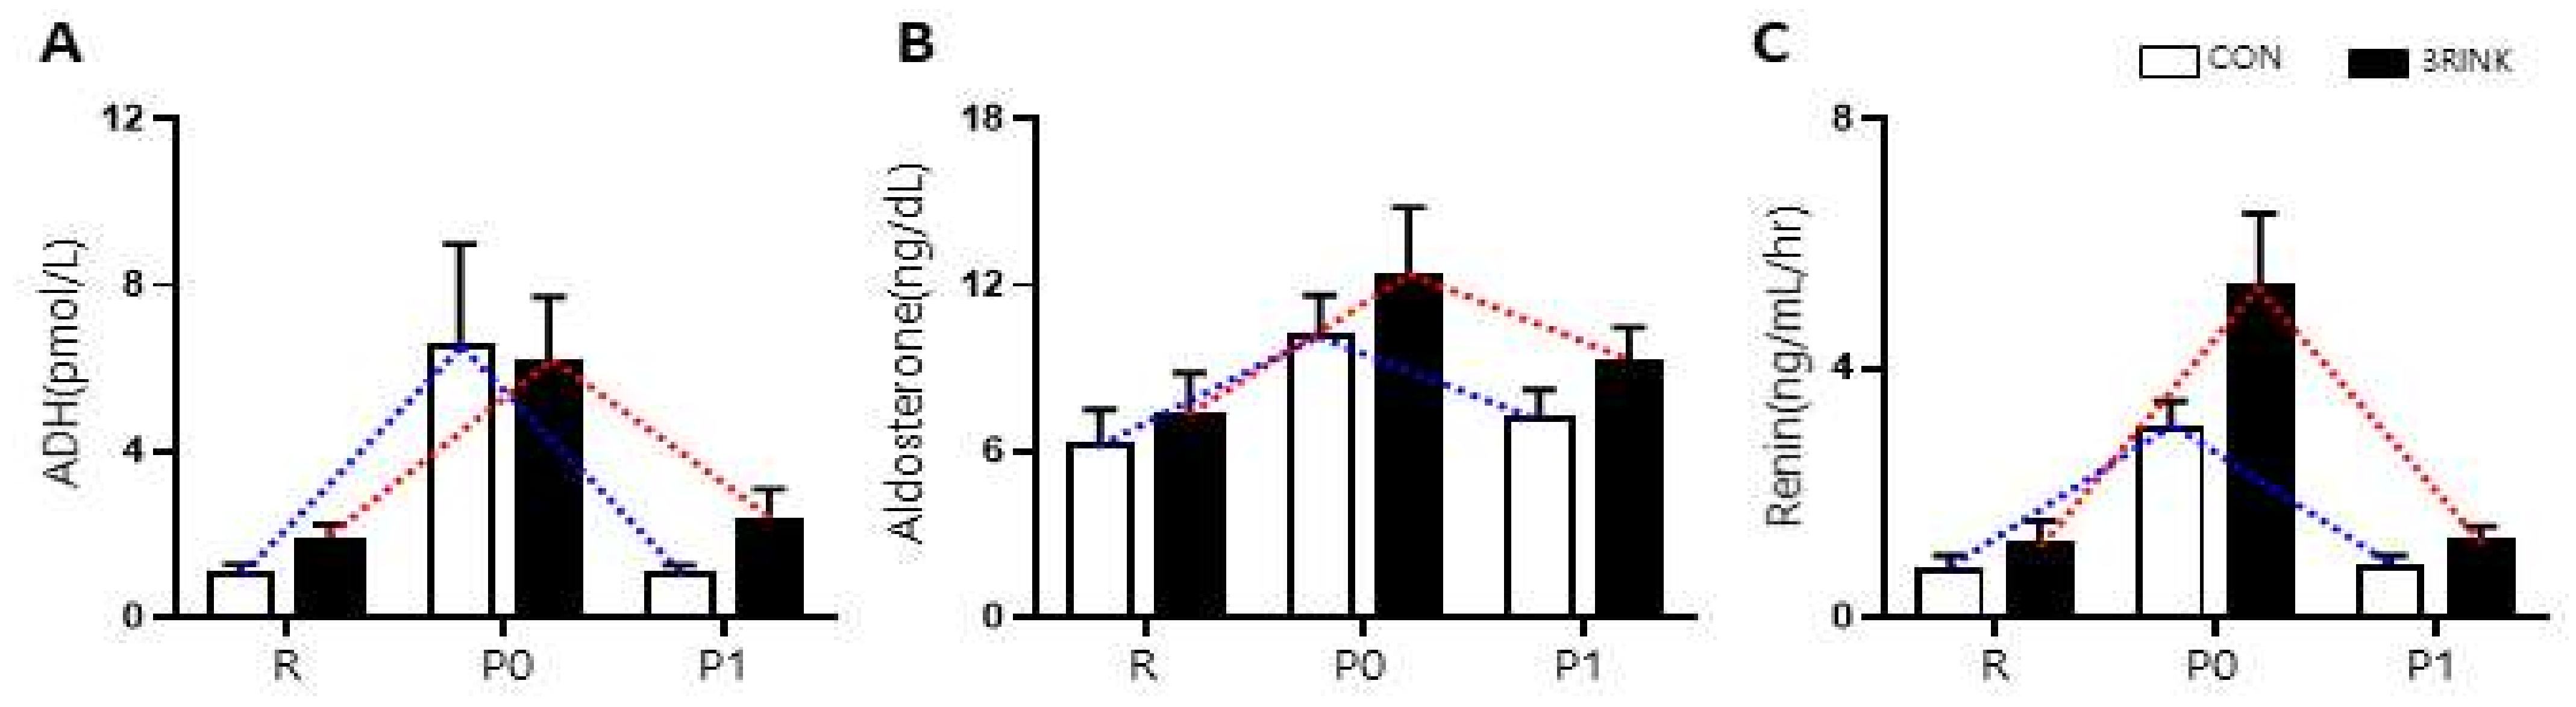
3.2. Differences in Water-Regulating Hormones According to the Timing of Fluid Intake
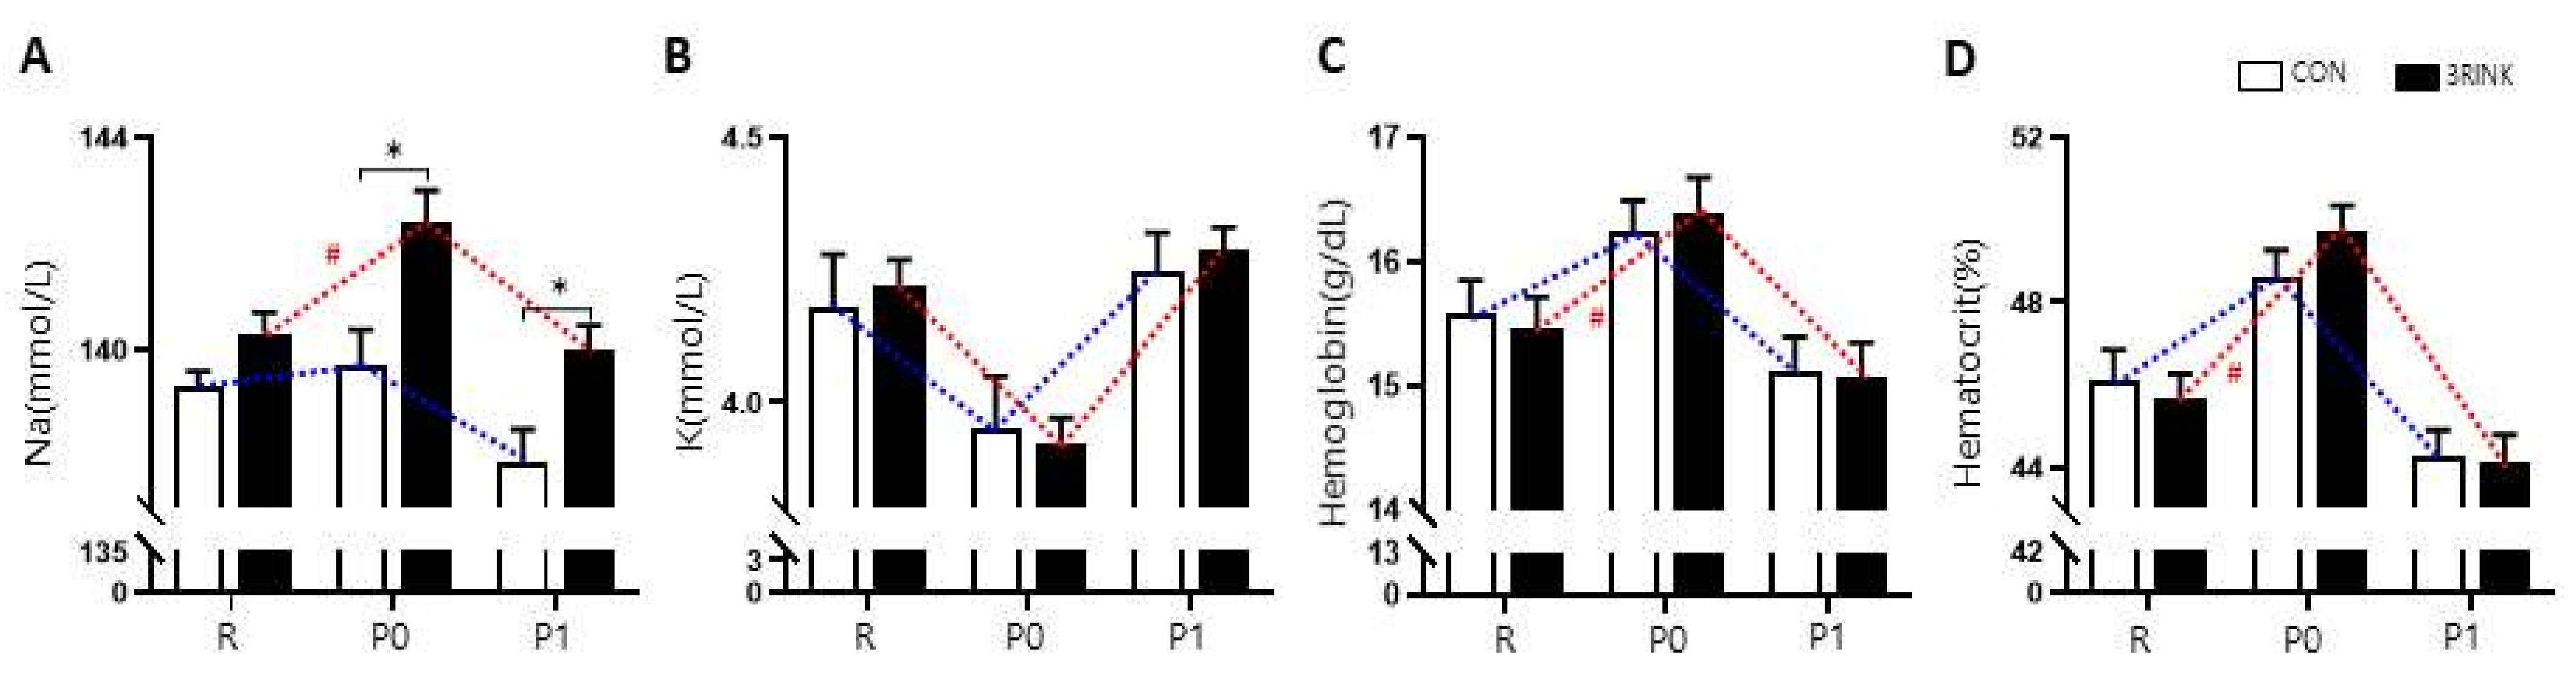
3.3. Differences in Body Electrolyte Composition According to the Type of Fluid and Time of Intake
3.4. The Difference in Aerobic Exercise Ability According to the Type of Fluid and Intake Period
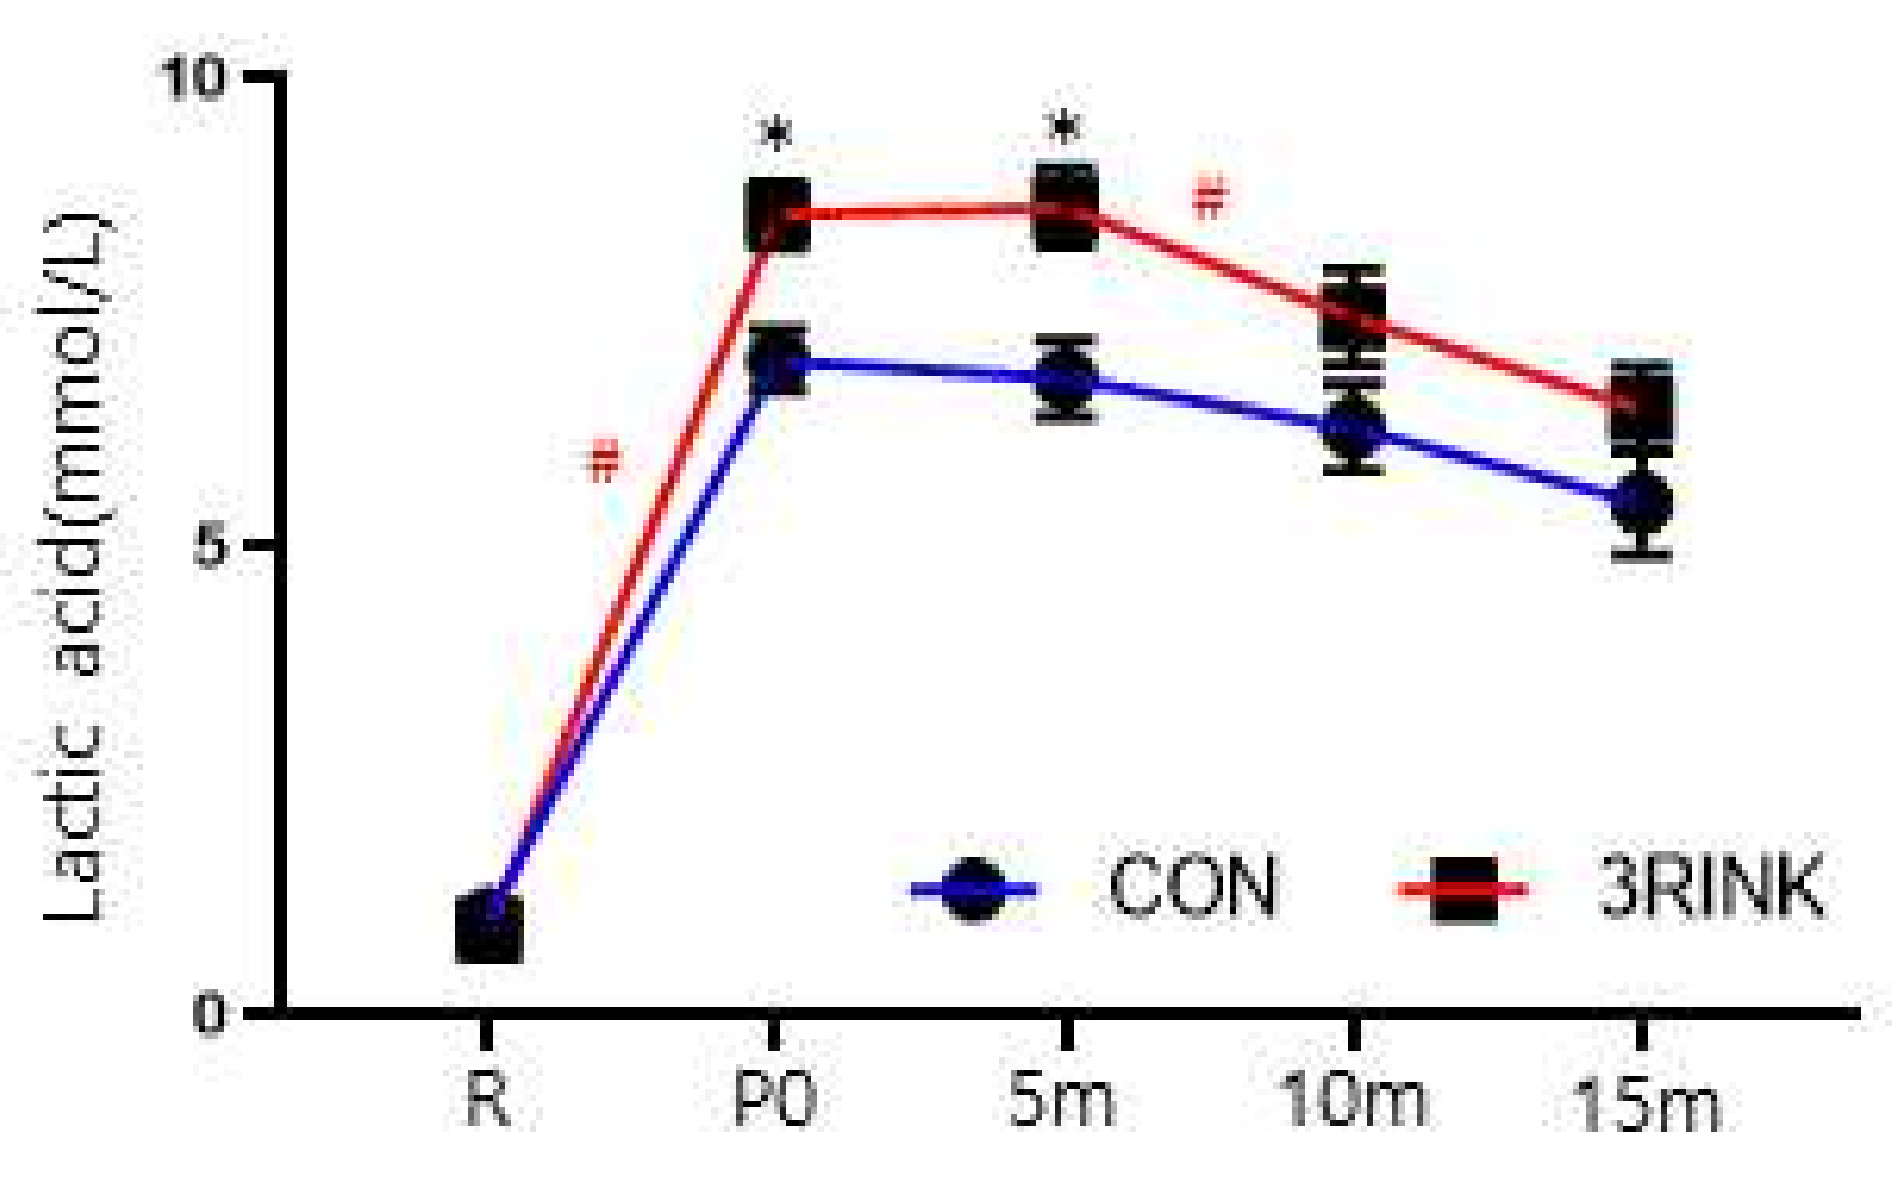
3.5. The Difference in Recovery Ability According to the Type of Fluid and Time of Intake
4. Discussion
5. Conclusions
Author Contributions
Funding
Institutional Review Board Statement
Informed Consent Statement
Conflicts of Interest
References
- Kelley, G.A.; Kelley, K.S. Progressive resistance exercise and resting blood pressure : A meta-analysis of randomized controlled trials. Hypertension (Dallas, TX: 1979) 2000, 35, 838–843. [Google Scholar] [CrossRef] [PubMed]
- Armstrong, L.E.; Johnson, E.C. Water Intake, Water Balance, and the Elusive Daily Water Requirement. Nutrients 2018, 10, 1928. [Google Scholar] [CrossRef]
- Sawka, M.N.; Cheuvront, S.N.; Kenefick, R.W. Hypohydration and Human Performance: Impact of Environment and Physiological Mechanisms. Sports Med. (Auckl., N. Z.) 2015, 45 (Suppl. 1), S51–S60. [Google Scholar] [CrossRef]
- Hew, T.D.; Chorley, J.N.; Cianca, J.C.; Divine, J.G. The incidence, risk factors, and clinical manifestations of hyponatremia in marathon runners. Clin. J. Sport Med. Off. J. Can. Acad. Sport Med. 2003, 13, 41–47. [Google Scholar] [CrossRef] [PubMed]
- Rehrer, N.J. Fluid and electrolyte balance in ultra-endurance sport. Sports Med. (Auckl., N. Z.) 2001, 31, 701–715. [Google Scholar] [CrossRef]
- Casa, D.J.; Ganio, M.S.; Lopez, R.M.; McDermott, B.P.; Armstrong, L.E.; Maresh, C.M. Intravenous versus Oral Rehydration Physiological, Performance, and Legal Considerations. Curr. Sports Med. Rep. 2008, 7, 541–549. [Google Scholar] [CrossRef]
- Glace, B.W.; Murphy, C.A.; McHugh, M.P. Food intake and electrolyte status of ultramarathoners competing in extreme heat. J. Am. Coll. Nutr. 2002, 21, 553–559. [Google Scholar] [CrossRef] [PubMed]
- Bürge, J.; Knechtle, B.; Knechtle, P.; Gnädinger, M.; Rüst, C.A.; Rosemann, T. Maintained serum sodium in male ultra-marathoners--the role of fluid intake, vasopressin, and aldosterone in fluid and electrolyte regulation. Horm. Metab. Res. 2011, 43, 646–652. [Google Scholar] [CrossRef]
- Wemple, R.D.; Morocco, T.S.; Mack, G.W. Influence of sodium replacement on fluid ingestion following exercise-induced dehydration. Int. J. Sport Nutr. 1997, 7, 104–116. [Google Scholar] [CrossRef]
- Montain, S.J.; Sawka, M.N.; Wenger, C.B. Hyponatremia associated with exercise: Risk factors and pathogenesis. Exerc. Sport Sci. Rev. 2001, 29, 113–117. [Google Scholar] [CrossRef]
- Lim, I.S. The changes of electrolyte and fluid-regulating hormones concentration in the collapsed runners during marathon race. Korean J. Phys. Educ. 2006, 45, 489–499. [Google Scholar]
- Shirreffs, S.M. Conference on “Multidisciplinary approaches to nutritional problems”. Symposium on “Performance, exercise and health”. Hydration, fluids and performance. Proc. Nutr. Soc. 2009, 68, 17–22. [Google Scholar] [CrossRef]
- Park, S.H.; Jeon, B.Y.; Kim, Y.H.; Yoon, J.H. The Effects of 5-weeks Electrolyte Beverage Ingestion on Blood Electrolyte Concentration, Cardiac Muscle Damage Index and Exercise Performance during Acute Exercise in Hot Environment. J. Korean Soc. Living Environ. Syst. 2017, 24, 608–615. [Google Scholar] [CrossRef]
- Sims, S.T.; Rehrer, N.J.; Bell, M.L.; Cotter, J.D. Preexercise sodium loading aids fluid balance and endurance for women exercising in the heat. J. Appl. Physiol. (Bethesda, Md.: 1985) 2007, 103, 534–541. [Google Scholar] [CrossRef]
- Petróczi, A.; Naughton, D.P. Supplement use in sport: Is there a potentially dangerous incongruence between rationale and practice? J. Occup. Med. Toxicol. (Lond., Engl.) 2007, 2, 4. [Google Scholar] [CrossRef]
- Hamouti, N.; Fernández-Elías, V.E.; Ortega, J.F.; Mora-Rodriguez, R. Ingestion of sodium plus water improves cardiovascular function and performance during dehydrating cycling in the heat. Scand. J. Med. Sci. Sports 2014, 24, 507–518. [Google Scholar] [CrossRef] [PubMed]
- Kim, T.Y.; Kim, K.S. The effects of supplementary fluid ingestion on lactate and electrolytes after maximal exercise. J. Kwangju Health Coll. 2000, 25, 279–294. [Google Scholar]
- Hoffman, M.D.; Stuempfle, K.J. Is Sodium Supplementation Necessary to Avoid Dehydration During Prolonged Exercise in the Heat? J. Strength Cond. Res. 2016, 30, 615–620. [Google Scholar] [CrossRef]
- James, L.J.; Mears, S.A.; Shirreffs, S.M. Electrolyte supplementation during severe energy restriction increases exercise capacity in the heat. Eur. J. Appl. Physiol. 2015, 115, 2621–2629. [Google Scholar] [CrossRef][Green Version]
- Fortney, S.M.; Wenger, C.B.; Bove, J.R.; Nadel, E.R. Effect of hyperosmolality on control of blood flow and sweating. J. Appl. Physiol. Respir. Environ. Exerc. Physiol. 1984, 57, 1688–1695. [Google Scholar] [CrossRef] [PubMed]
- Murray, R.; Paul, G.L.; Seifert, J.G.; Eddy, D.E. Responses to varying rates of carbohydrate ingestion during exercise. Med. Sci. Sports Exerc. 1991, 23, 713–718. [Google Scholar] [CrossRef] [PubMed]
- Nielsen, B.; Sjøgaard, G.; Ugelvig, J.; Knudsen, B.; Dohlmann, B. Fluid balance in exercise dehydration and rehydration with different glucose-electrolyte drinks. Eur. J. Appl. Physiol. Occup. Physiol. 1986, 55, 318–325. [Google Scholar] [CrossRef] [PubMed]
- Maughan, R.J.; Owen, J.H.; Shirreffs, S.M.; Leiper, J.B. Post-exercise rehydration in man: Effects of electrolyte addition to ingested fluids. Eur. J. Appl. Physiol. Occup. Physiol. 1994, 69, 209–215. [Google Scholar] [CrossRef] [PubMed]
- Noakes, T. Hyponatremia in distance runners: Fluid and sodium balance during exercise. Curr. Sports Med. Rep. 2002, 1, 197–207. [Google Scholar] [CrossRef]
- Smith, M.S.; Dyson, R.; Hale, T.; Harrison, J.H.; McManus, P. The effects in humans of rapid loss of body mass on a boxing-related task. Eur. J. Appl. Physiol. 2000, 83, 34–39. [Google Scholar] [CrossRef]
- Maresh, C.M.; Gabaree-Boulant, C.L.; Armstrong, L.E.; Judelson, D.A.; Hoffman, J.R.; Castellani, J.W.; Kenefick, R.W.; Bergeron, M.F.; Casa, D.J. Effect of hydration status on thirst, drinking, and related hormonal responses during low-intensity exercise in the heat. J. Appl. Physiol. (Bethesda, Md.: 1985) 2004, 97, 39–44. [Google Scholar] [CrossRef]
- Woo, J.H.; Paik, I.Y. Different Sodium Concentration Fluid Supplement on Fluid Regulation Hormone Changes During Exercise. Korean J. Phys. Educ. 1999, 38, 551–561. [Google Scholar]
- Park, S.H.; Jeon, B.Y.; Kim, Y.H.; Yoon, J.H. Effects of Deep-sea Water Electrolyte Supplement on Blood Electrolyte Concentration and Exercise Performance during Acute Exercise in Hot Environment. Korean Soc. Living Environ. Syst. 2016, 23, 835–842. [Google Scholar] [CrossRef]
- Anderson, R.A.; Guttman, H.N. Trace Minerals and Exercise. In Exercise, Nutrition, and Energy Metabolism; Macmillan: New York, NY, USA, 1988. [Google Scholar]
- Lee, S.B. The effects of ingestion of water or glycerol on renin activity, rectum temperature, blood electrolytes concentration in exercise. J. Life Sci. 2008, 18, 187–192. [Google Scholar] [CrossRef]
- Nose, H.; Mack, G.W.; Shi, X.R.; Nadel, E.R. Role of osmolality and plasma volume during rehydration in humans. J. Appl. Physiol. (Bethesda, Md.: 1985) 1988, 65, 325–331. [Google Scholar] [CrossRef]
- Dill, D.B.; Costill, D.L. Calculation of percentage changes in volumes of blood, plasma, and red cells in dehydration. J. Appl. Physiol. 1974, 37, 247–248. [Google Scholar] [CrossRef] [PubMed]
- Brotherhood, J.; Brozović, B.; Pugh, L.G. Haematological status of middle- and long-distance runners. Clin. Sci. Mol. Med. 1975, 48, 139–145. [Google Scholar] [CrossRef] [PubMed]
- Kim, K.J.; Ahn, N.Y.; Shin, Y.J. Effects of ambient temperature and exercise duration on hematocrit value and rectal temperature during submaximal exercise in obese. J. Coach. Dev. 2005, 22, 79–86. [Google Scholar]
- Berger, N.J.; Campbell, I.T.; Wilkerson, D.P.; Jones, A.M. Influence of acute plasma volume expansion on VO2 kinetics, VO2 peak, and performance during high-intensity cycle exercise. J. Appl. Physiol. (Bethesda, Md.: 1985) 2006, 101, 707–714. [Google Scholar] [CrossRef]
- Zhang, Q. Effect of Electrolyte Beverage on Exercise Ability of Human Body. Food Ind. 2018, 39. [Google Scholar]
- Paik, I.Y.; Suh, S.H.; Jin, H.E.; Kim, Y.I.; Woo, J.H. Effects of different fluid supplement following dehydration on sleep efficiency and consequent exercise performance. Korean J. Phys. Educ. 2007, 46, 427–436. [Google Scholar]
- Hubbard, R.W. Influence of thirst and fluid palatability on fluid ingestion during exercise. Perspect. Exerc. Sci. Sports Med. 1990, 3, 39–95. [Google Scholar]


| Variable | Sodium (Na+) | Potassium (K+) | Magnesium (Mg++) | Carbohydrates | Sugar | Vitamin C |
|---|---|---|---|---|---|---|
| Amount | 350 mg | 190 mg | 40 mg | 8.2 g | 5.8 g | 100 mg |
| CON (n = 10) | 3RINK (n = 10) | CON (n = 10) | 3RINK (n = 10) | |||||
|---|---|---|---|---|---|---|---|---|
| P0-R | P0-R | t | p | P1-P0 | P1-P0 | t | p | |
| BW (kg) | −0.40 ± 0.14 | −0.27 ± 0.13 | −0.667 | 0.513 | 0.07 ± 0.08 | 0.17 ± 0.08 | −0.896 | 0.382 |
| SMM (kg) | −0.40 ± 0.37 | −0.21 ± 0.15 | −0.473 | 0.642 | 0.20 ± 0.37 | 0.55 ± 0.18 | −0.842 | 0.411 |
| BFM (kg) | 0.66 ± 0.22 | −0.17 ± 0.29 | 2.280 | 0.035 * | −0.68 ± 0.25 | −0.53 ± 0.26 | −0.411 | 0.686 |
| PBF (%) | 0.93 ± 0.28 | 1.15 ± 1.30 | −0.165 | 0.871 | −0.90 ± 0.30 | −0.71 ± 0.32 | −0.428 | 0.673 |
| TBW (L) | −0.76 ± 0.17 | −0.08 ± 0.15 | −2.944 | 0.009 | 0.52 ± 0.18 | 0.5 ± 0.19 | −0.154 | 0.880 |
| ICW (L) | −0.53 ± 0.13 | −0.09 ± 0.10 | −2.656 | 0.016 * | 0.38 ± 0.13 | 0.33 ± 0.12 | 0.283 | 0.781 |
| ECW (L) | −0.23 ± 0.05 | 0.01 ± 0.06 | −2.964 | 0.008 * | −0.86 ± 0.96 | 0.18 ± 0.07 | −1.079 | 0.295 |
| ECW/ICW ratio | 0.53 ± 0.08 | 0.06 ± 0.43 | 1.072 | 0.298 | −0.71 ± 0.98 | 0.38 ± 0.16 | −1.094 | 0.288 |
| Urine (mL) | −74.00 ± 32.05 | −85.50 ± 14.38 | 0.327 | 0.747 | 10.00 ± 13.19 | −1.00 ± 6.62 | 0.746 | 0.466 |
| Group | CON (n = 10) | 3RINK (n = 10) | t | p |
|---|---|---|---|---|
| Variables | ||||
| Time (s) | 767.00 ± 109.75 | 790.00 ± 113.14 | −0.461 | 0.650 |
| VE (L/min) | 123.16 ± 20.96 | 129.92 ± 15.95 | −0.812 | 0.428 |
| VO2max (mL·min·kg) | 47.28 ± 7.74 | 48.28 ± 8.25 | −0.280 | 0.783 |
| RER | 1.20 ± 0.08 | 1.19 ± 0.05 | 0.103 | 0.919 |
| HRmax (bpm) | 185.50 ± 9.99 | 190.50 ± 5.35 | −1.393 | 0.180 |
| Group | R | P0 # | 5 m # | 10 m | 15 m | F | p | |||
|---|---|---|---|---|---|---|---|---|---|---|
| Variables | ||||||||||
| Lactic acid (mmol/L) | CON (n = 10) | 1.03 ± 0.42 | 6.98 ± 1.03 $ | 6.78 ± 1.30 | 6.26 ± 1.44 † | 5.46 ± 1.76 @ | T | 263.360 | 0.001 * | |
| G | 5.550 | 0.030 * | ||||||||
| 3RINK (n = 10) | 0.91 ± 0.32 | 8.53 ± 1.07 $ | 8.61 ± 1.28 | 7.44 ± 1.60 † | 6.46 ± 1.42 @ | |||||
| T × G | 4.612 | 0.013 * |
Publisher’s Note: MDPI stays neutral with regard to jurisdictional claims in published maps and institutional affiliations. |
© 2021 by the authors. Licensee MDPI, Basel, Switzerland. This article is an open access article distributed under the terms and conditions of the Creative Commons Attribution (CC BY) license (https://creativecommons.org/licenses/by/4.0/).
Share and Cite
Choi, D.-H.; Cho, J.-Y.; Koo, J.-H.; Kim, T.-K. Effects of Electrolyte Supplements on Body Water Homeostasis and Exercise Performance during Exhaustive Exercise. Appl. Sci. 2021, 11, 9093. https://doi.org/10.3390/app11199093
Choi D-H, Cho J-Y, Koo J-H, Kim T-K. Effects of Electrolyte Supplements on Body Water Homeostasis and Exercise Performance during Exhaustive Exercise. Applied Sciences. 2021; 11(19):9093. https://doi.org/10.3390/app11199093
Chicago/Turabian StyleChoi, Dong-Hun, Joon-Yong Cho, Jung-Hoon Koo, and Tae-Kyung Kim. 2021. "Effects of Electrolyte Supplements on Body Water Homeostasis and Exercise Performance during Exhaustive Exercise" Applied Sciences 11, no. 19: 9093. https://doi.org/10.3390/app11199093
APA StyleChoi, D.-H., Cho, J.-Y., Koo, J.-H., & Kim, T.-K. (2021). Effects of Electrolyte Supplements on Body Water Homeostasis and Exercise Performance during Exhaustive Exercise. Applied Sciences, 11(19), 9093. https://doi.org/10.3390/app11199093