Article

Sustainability-Based Analysis of Conventional to High-Speed Machining of Al 6061-T6 Alloy

1
Department of Mechanical Engineering, Capital University of Science and Technology, Islamabad 44000, Pakistan
2
Nust Business School, National University of Science & Technology, Islamabad 44000, Pakistan
3
Department of Mechanical and Aerospace Engineering, Sapienza University of Rome, 00185 Rome, Italy
4
Department of Materials Science and Engineering, Pak-Austria Fachhochschule Institute of Applied Sciences and Technology, Haripur 22620, Pakistan
5
Department of Mechanical Engineering and Technology, Government College University, Faisalabad 38000, Pakistan
6
Department of Mechanical Engineering, Institute of Space Technology, Islamabad 44000, Pakistan
*
Authors to whom correspondence should be addressed.
These have equal contribution as second author.
Appl. Sci. 2021, 11(19), 9032; https://doi.org/10.3390/app11199032
Submission received: 25 August 2021 / Revised: 23 September 2021 / Accepted: 24 September 2021 / Published: 28 September 2021
(This article belongs to the Special Issue Advanced Manufacturing of Metals)

Abstract

:
High-speed machining is considered to be a promising machining technique due to its advantages, such as high productivity and better product quality. With a paradigm shift towards sustainable machining practices, the energy consumption analysis of high-speed machining is also gaining ever-increasing importance. The current article addresses this issue and presents a detailed analysis of specific cutting energy (SCE) consumption and product surface finish (Ra) during conventional to high-speed machining of Al 6061-T6. A Taguchi-based L16 orthogonal array experimental design was developed for the conventional to high-speed machining range of an Al 6061-T6 alloy. The analysis of the results revealed that SCE consumption and Ra improve when the cutting speed is increased from conventional to high-speed machining. In particular, SCE was observed to reduce linearly in conventional and transitional speed machining, whereas it followed a parabolic trend in high-speed machining. This parabolic trend indicates the existence of an optimal cutting speed that may lead to minimum SCE consumption. Chip morphology was performed to further investigate the parabolic trend of SCE in high-speed machining. Chip morphology revealed that the serration of chips initiates when the cutting speed is increased beyond 1750 m/min at a feed rate of 0.4 mm/rev.

1. Introduction

Sustainability in manufacturing is the creation of products through processes that have minimum environmental impact, are economically viable, and pose no threats to workers [1]. From the viewpoint of machining processes, sustainability largely depends upon machining parameters, workpiece materials, and lubrication techniques [2]. The selection of machining parameters plays a significant role in the efficient utilization of cutting tools and machine tools during a machining operation. The significance of cutting parameters becomes more pivotal when machining is performed on CNC machines, which usually involve high initial and operating costs. An important component of the operational cost of CNC machines is energy cost, which has a substantial share (around 17%) in the total cost of a production machine tool [3]. This cost of energy consumption is expected to grow further in coming years due to an increase in fuel prices. In addition to the financial burden, the environmental aspect of machining processes is also of great concern [4]. Studies suggest that electrical energy consumption during a machining process is the single largest source of environmental burden [5]. Therefore, reduction in electrical energy consumption is highly relevant from the viewpoint of enhancing the sustainability of machining operations.
The electrical energy supplied to a machine tool is partly consumed in operating its main components (spindle, hydraulic system, etc.) and partly consumed in the actual machining process [6], as shown in Figure 1. Therefore, the optimal use of electrical energy consumption in a machining process can be achieved by developing energy efficient machine tool components and/or by optimizing the actual machining process [7]. The design of energy efficient machine tools is also supported by international regulations (ECODESIGN Directive 2009/125/EC, Energy Labelling Regulation (Regulation (EU) 2017/1369), CECIMO Self-Regulatory Initiative) and standards (ISO 14955-1:2017, ISO/TR 14062:2002) [8]. Despite these regulations and standards, the development of new energy-efficient machine tool technology and the replacement of existing technology represent a gradual and cost intensive process. Therefore, the alternative approach of improving the energy consumption in the actual machining process is also of paramount importance.
The efforts to improve energy consumption in machining processes greatly depend upon the methods used to define and collect primary energy consumption data from machine tools [9]. Different studies present in the literature have used different responses such as total/cutting power (P), total/cutting energy (E), power factor (PF), specific cutting energy (SCE), etc. Of the various responses used, SCE is considered as the most robust response to depict efficiency of a machining process because it incorporates both the cutting power and volume of material removed [10]. Furthermore, previous studies have also shown that SCE only takes into account energy consumed in the actual cutting process and disregards the effects of the make, type, size, and efficiency of machine tools [11].
An extensive amount of literature exists that analyzes the energy consumption in machining processes. Sihag and Sangwan [12] have provided an excellent up-to-date review of such efforts, and interested readers are directed to consult their work. For the purposes of brevity, only key studies relevant to SCE have been discussed in this paper. The approaches used by past researchers to analyze SCE can be broadly classified into three categories, namely SCE modelling, optimization of machining process parameters, and SCE process maps.
Draganescu et al. [13] did pioneering work in the modelling of SCE and expressed it as the ratio of cutting power and the removed amount of material. Their results showed that specific energy reduces as the cutting speed, feed, and depth of the cut are increased. Li and Kara [5] proposed experimental models of specific energy at the process level on steel and aluminum alloys. They concluded that since the machine tool is a complex system, empirical models are expected to provide more accurate results. Mechanistic and empirical modellings were hybridized in the work of Li et al. [14] who developed an improved specific energy model for milling machines. Balogun et al. [10] employed specific energy to evaluate the efficiency of the machining process. Their results highlighted that lower undeformed chip thickness initiates plowing and results in higher specific energy consumption. Liu et al. [15] investigated the effect of tool wear on specific energy at the machine level, spindle level, and cutting level in the hard milling process. The results showed that specific energy increased with the increase in tool wear.
In order to achieve energy savings at the process level, the optimization of cutting parameters has often been used by past researchers. Camposeco-Negrete [16,17] used Taguchi methods and response surface methodology (RSM) to analyze surface finish and power consumption along with SCE in the low-speed turning of Al 6061 T6 alloys. Their findings revealed cutting feed to be the most significant cutting parameter affecting surface finish and SCE. Paul et al. [18] analyzed recoil force and SCE in the turning operation of AISI 1060 steel. Their results showed that the simultaneous minimization of SCE and recoil force results in the selection of conflicting machining parameters. Warsi et al. [19] employed a grey-relational analysis (GRA) technique along with an analytic hierarchy process (AHP) in the multi-objective optimization of Al 6061 alloys. Their results showed that the proposed machining strategy can result in the simultaneous improvement of SCE and the material removal rate (MRR). Inspired by this work, Younas et al. [20] extended the proposed methodology in the turning of Ti-6Al-4V.
Khan et al. [21] analyzed SCE consumption, tool wear, and surface roughness in the dry, wet, and cryogenic turning of Ti-6Al-4V. Their results showed that surface roughness and tool wear substantially improved in wet and cryogenic cutting conditions as compared to dry cutting conditions. SCE consumption was observed to be less in the dry cutting condition as compared to the wet cutting condition because of the thermal softening gain at higher temperatures. However, cryogenic cooling reduces the work hardening of titanium alloys; therefore, SCE was reported to be the lowest in the cryogenic environment as compared to dry and wet cutting conditions. Similarly, Khan et al. [22] and Jamil et al. [23] modelled and analyzed the specific cutting energy demand for the cryogenic and minimum quantity lubrication (MQL)-assisted machining of Ti-6Al-4V alloys. Their results also demonstrated that cryogenic cutting conditions reduce SCE consumption. The importance of cutting fluids has been widely reported in the machining of difficult-to-cut alloys (such as Ti and Ni alloys) due to their positive effect on the machined surface quality, cooling, lubrication, chip removal, and tool life [24]. In spite of these benefits, the environmental hazards associated with the coolants make them undesirable for sustainable machining practices [25]. Furthermore, in the case of relatively soft materials such as aluminum alloys that have a high machinability rating, a cutting distance in the order of kilometers has been reported before measurable tool wear could be observed [26,27]. Therefore, several past studies have employed dry cutting conditions for the evaluation of SCE in the machining of aluminum alloys [19,28,29].
The authors pioneered the concept of presenting SCE consumption as process maps [11,30,31]. The developed energy maps categorized SCE consumption in five distinct regions with respect to various machining parameters. Further examinations led to a conclusion concerning the significant relation of these distinct SCE regions to the mechanics of the cutting process. The results of the study demonstrated that substantial energy savings can be achieved by selecting optimal cutting parameters. The energy map approach was further extended by Younas et al. [32] who developed SCE-based process maps for Ti-6Al-4V and related them to tool wear maps. Their results showed that there exists a strong correlation between SCE consumption and tool wear.
A detailed review of the literature revealed that although sustainability analyses of the machining process have been investigated by past researchers, there exists no study that measures and compares different sustainability factors in conventional, transitional, and high-speed machining. The present work is aimed at this research gap, and it presents a detailed sustainability analysis for the conventional, transitional, and high-speed turning of Al 6061. Statistical tools such as Taguchi’s DOE, main effect plots, and ANOVA have been utilized to assess the effect of machining parameters on SCE and Ra. Finally, the results have been compiled to provide a holistic picture of SCE consumption in different cutting speed regimes. As discussed earlier, the sustainability of the machining process depends upon environmental, economic, and social factors. The present study utilizes SCE as a measure to express the environmental impact of the machining process. The economic aspect of the machining process has been covered by considering the surface quality of the finished product. Finally, dry cutting conditions have been used for all experiments, which have multidimensional effects. High-speed machining with a dry cutting condition not only results in better surface quality, but it also eliminates the requirement of coolants, which are unsustainable from the viewpoint of their hazardous effect on the environment and workers.

2. Materials and Methods

Despite the development of new materials in the last decade, the global consumption map of metals is dominated by steel and aluminum [33]. Low energy requirement in secondary production, abundance, and recyclability makes aluminum and its alloys the most environmental friendly metals [34]. Aluminum alloy 6xxx series has excellent mechanical properties and is widely used in manufacturing of various components in automotive, aerospace, and other high-tech applications; therefore, aluminum alloy Al 6061-T6 has been employed as workpiece material in the current work.
Turning operation of solid Al 6061-T6 shafts having diameter of 280 mm was performed on YIDA ML-300 CNC machine as shown in Figure 2. Cutting tests were performed with H 13 grade uncoated plain inserts without chip breaker (CCMW 09 T3 04-H13A) and tool holder (SCACL 1616 K 09-S). The cutting tool had 0o rake angle, 90o entry angle, nose radius of 0.4 mm, and a cutting edge length of 9 mm. In order to eliminate the effect of tool wear on energy consumption, fresh cutting edge was used in each experiment. Power measurements were done using Yokogawa CW-240 power analyzer. Specific cutting energy was measured as the ratio of the difference of power consumed in actual cut ( P a c t u a l ) and air cut ( P c u t ) to the material removal rate ( M R R ), using the methodology described in previous research [11]. Surface roughness was measured using surface roughness tester TR 110. Three readings were taken around the circumference of aluminum shaft for each experimental run to minimize experimental error. The mean of the three values was taken as the final value, using the methodology described in the literature [35].
Several factors affect turning operation such as machining parameters (cutting speed, feed, and depth of cut), tool geometry, cutting fluids, and workpiece material. Since energy analysis was the focal point of this research, screening of factors was conducted based on detailed literature review. Tool geometry is highly significant for surface roughness, but its effect on power and energy consumption has been reported to be negligible [5,36,37]. Therefore, tool geometry was not varied during experimentation. A fresh cutting tool was used in every experiment to eliminate the effect of tool wear. Dry machining conditions were used for each experiment in order to realize the aspect of cleaner machining practices [19]. A detailed review of published literature revealed that cutting parameters such as cutting speed (v), feed (f), and depth of cut (d) have significant effect on power and energy consumption [16,17,38]. These three cutting parameters are also important because of their significant effect on cutting temperatures, production time, surface roughness, tool life, etc. [32,39]. Therefore, cutting speed (v), feed (f), and depth of cut (d) were used in present work. Cutting speeds for different alloys can be generally divided in three regions: conventional, transition, and high-speed machining, as shown in Figure 3 [40]. For aluminum alloys, conventional speed machining (CSM) range is approximately equal to 10~500 m/min. Transition speed machining (TSM) range, which is considered as a transition region between conventional and high-speed machining (HSM), is approximately equal to 500~1500 m/min. The HSM range for aluminum-based alloys can be described between 1600 and 10,000 m/min, with the upper bound dictated by tooling and machine tool limitations [41]. However, HSM is not just about increased cutting speeds; the feed and depth of cut are also required to be set at values higher than the usual practices [41,42]. Feed ( f ) and depth of cut ( d ) are generally set at 0.05 mm/rev~0.3 mm/rev and 0.5~3 mm, respectively, during machining of Al 6061-T6 [16,17,43,44]. In order to match for HSM, these two parameters were also set at values higher than the usual practice.
Taguchi methodology was used for design of experiment, and an L16 orthogonal array was used that could accommodate four levels of two to five factors. In order to address the requirements of three different cutting speed regions (CSM, TSM, and HSM), three different experimental plans were developed, as shown in Table 1, Table 2 and Table 3.
It can be seen from the tables that the levels of feed and depth of cut have been kept constant for the three experimental designs, whereas the levels of cutting speed have been varied. Furthermore, the levels of cutting speed have been kept equally spaced (a difference of 250 m/min) within TSM and HSM range. In the case of CSM, the range of cutting speed was small (10~500 m/min); therefore, the levels of cutting speed were set at an interval of 125 m/min. As Al 6061-T6 has high machinability rating [45], the setting of cutting speed at intervals of 200~250 m/min in DOE is common [43] and is not expected to result in loss of information. All the experiments were performed three times to minimize experimental errors. The average results along with their standard deviation are presented in the next sections, and the detailed results can be accessed in Supplementary Data. Furthermore, cutting inserts were periodically analyzed under optical microscope as per ISO standard [46]. Generally, no or negligible tool wear was observed during these examinations.

3. Analysis of Experimental Data: Conventional Speed Machining (CSM)

Table 4 presents the complete experimental plan and the results for SCE and Ra for conventional speed machining.

3.1. Specific Cutting Energy (SCE)

SCE values obtained for CSM experiments were observed to be in good agreement with the values published in the literature [31]. Analysis of variance (ANOVA) was used to assess the significance of machining parameters for SCE. Table 5 presents the ANOVA table for SCE. Additionally, the contribution ratio (CR) of each machining parameter was also calculated. The results displayed in Table 5 reveal that all machining parameters have statistical significance for SCE (having p-value less than 0.05). However, feed has been observed to have the highest effect (in terms of % of CR) on SCE. A better understanding of the impact of the machining parameters on SCE can be gained by developing a main effect plot as shown in Figure 4. Given the relationship of SCE with MRR, the trends observed in the main effect plot are expected. Setting the machining parameters at their respective highest values (level 4 for cutting speed, feed, and depth of cut) would result in a high material removal rate, and this in turn would yield a lower SCE consumption. This further corroborated the finding reported in the literature that maximizing the material removal rate reduced the specific energy consumption [5,13,16].

3.2. Surface Finish

The surface finish data obtained for the CSM experiments were investigated using ANOVA to determine the significance of cutting variables as shown in Table 6. It can be seen from ANOVA results that feed is the most significant factor for surface finish, followed by depth of cut. Cutting speed has been observed to be insignificant for surface finish. In terms of CR (%), feed has the highest contribution ratio, followed by depth of cut. The high significance of feed on the surface finish is an expected outcome and is well aligned with the published literature. A better insight into the impact of machining variables on surface properties can be obtained by developing a main effect plot as shown in Figure 5. The main effect plot shows that feed should be kept at a minimum level to attain the best surface finish. This is because a high feed increases heat generation, which can increase tool wear and hence surface roughness [47]. With regard to cutting speed, surface finish has been found to be best at 250 m/min. Since the impact of the cutting speed on Ra was seen to be negligible in conventional speed machining, its value can be set at any level that is appropriate from the viewpoint of the machine tool and cutting tool, etc.

3.3. Confirmatory Experiments

The best and worst setting of cutting parameters was identified on the basis of the main effect plots developed for SCE and Ra (Figure 4 and Figure 5). The results of the confirmatory experiments performed for conventional speed machining are presented in Table 7. It can be seen that the requirements of cutting parameters for SCE and Ra in the CSM range are entirely conflicting, as the best value of SCE and the worst value of SR are achieved at exactly the same level of cutting parameters. These observations establish the case of the multi-objective optimization model.

4. Analysis of Experimental Data: Transitional Speed Machining (TSM)

The results of the L16 experimental plan developed for transitional speed machining (TSM) experiments are presented in Table 8.

4.1. Specific Cutting Energy (SCE)

The impact of machining parameters on SCE in TSM has been analyzed with ANOVA (Table 9). ANOVA results reveal the statistical significance of all machining parameters for SCE (all having a p-value less than 0.05). However, in terms of percentage contribution, feed has the highest influence, followed by depth of cut and cutting speed. This order of influence of cutting parameters on SCE in TSM is slightly different than that observed for CSM, in which cutting speed was observed to be more significant than depth of cut. In order to further probe the effect of cutting parameters on SCE, main effect plots for TSM were developed as shown in Figure 6.
The main effect plot shows that SCE decreases when the cutting parameters are set at their respective highest values. From the slope of the main effect plots, a steep drop in SCE is observed when feed is increased from 0.1 mm/rev to 0.2 mm/rev. From 0.2 mm/rev to 0.4 mm/rev, a gradual drop in SCE is observed. A similar gradual drop is observed in the case of depth of cut. However, a trivial drop in SCE value was seen when cutting speed was increased. The relatively smaller drop in SCE with higher speed can be the result of increased power requirements at high speeds. The enhanced power requirements offset the gain in MRR, and as a result, the net value of SCE is little affected by the increasing cutting speed [19].

4.2. Surface Finish

The effect of cutting parameters on Ra in TSM was analyzed using ANOVA and main effect plots. The results of ANOVA are presented in Table 10. The R2 value of the ANOVA model is 92.78%, which is sufficiently high and shows that all relevant process parameters have been included in the analysis. The results from ANOVA establish the strong statistical contribution of every parameter. From the viewpoint of percentage contribution, feed has the highest influence, followed by cutting speed and depth of cut. The high effect of feed on Ra is an expected outcome and has been discussed in the previous section. Cutting speed has been observed to be slightly more significant than depth of cut. The main effect plots developed to analyze the effect of cutting parameters on Ra are shown in Figure 7. As expected, feed has to be set at the lowest possible level to achieve minimum surface roughness. Ra has been observed to first decrease with an increase in cutting speed and depth of cut and then to increase. The optimal value of Ra is observed at 1000 m/min and a depth of cut of 3 mm.

4.3. Confirmatory Experiments

Confirmatory experiments were performed based on the findings of main effect plots (Figure 6 and Figure 7), and the results are presented in Table 11. As with the case of conventional speed machining, the setting of the machining parameters required to obtain optimal values of SCE and Ra were observed to be entirely different, further strengthening the requirement of a multi-objective model for cutting parameters.

5. Analysis of Experimental Data: High-Speed Machining (HSM)

The investigation results of L16 performed at a high speed of machining are presented in Table 12.

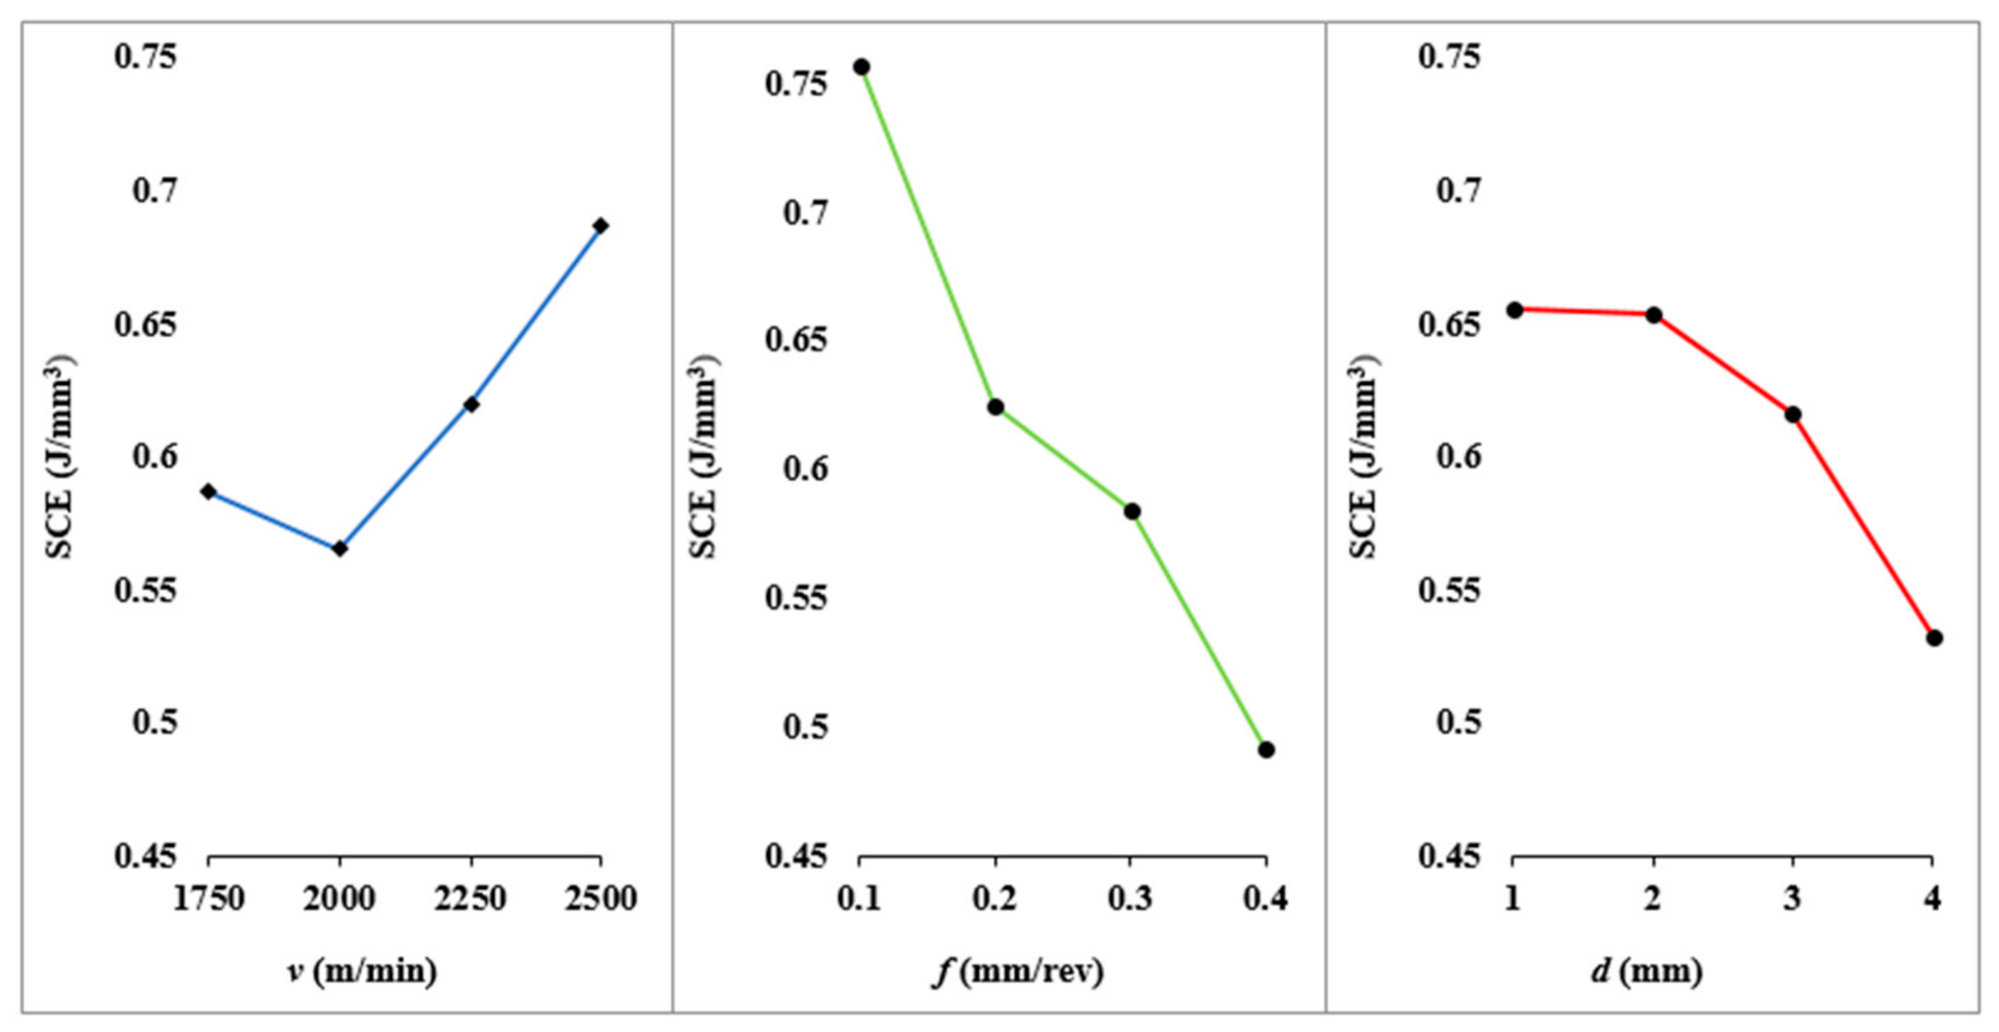
5.1. Specific Cutting Energy (SCE)

A general trend of reduced SCE values was observed for HSM. In order to assess the effect of cutting parameters on SCE, analysis of variance has been performed (results shown in Table 13). ANOVA results depict a trend similar to CSM and TSM. Feed has been observed to be the most significant cutting parameter affecting SCE. Depth of cut and cutting speed have been observed to have a lesser effect (around 14~17%) on SCE. A holistic picture of the impact of cutting parameters on SCE in HSM can be obtained by main effect plots as shown in Figure 8.
The impact of cutting speed on SCE in HSM was seen to be fairly different as compared to CSM and TSM (Figure 8). SCE consumption was seen to reduce initially, but it increased after the cutting speed exceeded 2000 m/min. The initial drop in SCE can be attributed to the high plastic strain associated with HSM [48]. This high strain generates heat in the primary shear zone that is not completely dissipated through the formed chip due to less contact time in HSM. This leads to a quasi-adiabatic condition, resulting in the thermal softening of the workpiece. Thermal softening is the major reason for reduced cutting forces and specific cutting energy in high-speed machining [42].
The cutting forces gradually decrease in HSM with increase in cutting speed. This gradual reduction in cutting forces continues up to a certain cutting speed. Beyond that cutting speed, cutting forces tend to increase [42,49,50]. The rise in SCE beyond the cutting speed of 2000 m/min can be attributed to the increase in cutting forces beyond this speed. Thus, the SCE consumption trend presents a parabolic curve in HSM, signifying the presence of an optimal cutting speed at which SCE consumption is minimum. Chip morphology was also studied to investigate any change in the form of the chips with an increase in cutting speed. Figure 9 shows microscopic images of chips at different cutting speeds, with feed fixed at 0.4 mm/rev.
A noticeable change in the form of the chips can be observed when cutting speed is increased beyond 1750 m/min. The saw-tooth form of the chip starts disappearing at 2000 m/min, and when the cutting speed is further increased to 2250 m/min, serration in the chips appears. Though completely serrated chips are not produced even at the cutting speed of 2500 m/min, it is expected that complete serration might occur if the cutting speed is further increased. High feed rates combined with high cutting speeds promote serration in chips [51]. It can be deduced from the chip morphology study (Figure 9) that serration in chips initiates during the turning of Al 6061-T6 alloys when the cutting speed is increased beyond 1750 m/min at a feed rate of 0.4 mm/rev. Overall, the chip morphology study revealed no plausible justification for high SCE at cutting speeds greater than 2000 m/min.

5.2. Surface Finish

The ANOVA results of Ra observed in HSM experiments are presented in Table 14. All the cutting parameters have been observed to be statistically significant. In terms of percentage contribution, feed has the highest effect (91.86%), followed by depth of cut and cutting speed. Figure 10 presents the main effect plot of Ra with respect to cutting parameters. An overall improvement in surface roughness can be observed with the increase in cutting speed, and the lowest surface roughness has been achieved at the highest cutting speed (2500 m/min). This improvement in surface finish can be attributed to the fact that the tendency of built-up-edge (BUE) formation diminishes with the increase in cutting speed, which consequently improves surface finish [47]. In the case of the effect of feed, an expected deterioration of surface finish with an increase in feed has been observed. This relationship of feed and Ra was observed to prevail in all types of machining (CSM, TSM, and HSM). Ra has shown an erratic behavior with respect to the depth of cut. However, the minimum value of Ra was generally observed at the lowest level of depth of cut.

5.3. Confirmatory Experiments

The cutting parameters identified in the main effect plots (Figure 8 and Figure 10) were used to perform confirmatory experiments (results presented in Table 15). A very low SCE value (0.33 J/mm3) was observed at = 2000   m / min ,   f = 0.4   mm / rev , and d = 4   mm . Such low values of SCE were also reported in authors’ earlier work on orthogonal machining [11,30]. Owing to the high significance of feed for SCE and Ra, a conflicting setting of cutting parameters was observed, with the best value of Ra and worst value of SCE being achieved at exactly the same level of cutting parameters.

6. Consolidated Results

The primary objective of this research was to perform a comprehensive sustainability analysis of the turning of Al 6061-T6 alloys at varying cutting conditions. As surface roughness (Ra) has been extensively studied by past researchers for many decades, a special emphasis was given to SCE. Therefore, to obtain a holistic picture of the evolution of SCE consumption within the three machining regions (conventional, transitional, and high-speed machining), the results have been consolidated (Figure 11, Figure 12, Figure 13, Figure 14 and Figure 15).
A general trend of drop in SCE can be observed within the conventional speed machining (CSM) region and the transitional speed machining (TSM) region (Figure 11). However, the drop in SCE is observed to be highest in the CSM region (11.8%), followed by the TSM region (6.7%). The trend followed by SCE in the high-speed machining (HSM) region is parabolic in nature. SCE first dropped by 3.8% when cutting speed was increased to 2000 m/min. Beyond this point, a sharp increase (about 17%) in SCE was observed. The parabolic trend signifies the presence of an optimum value of cutting speed over which the SCE is minimum. In the present study, the maximum value of SCE was observed at 125 m/min and the minimum value at 2000 m/min.
In the case of the effect of feed on SCE (Figure 12), a drastic reduction in SCE is observed in all three machining regions. In the CSM region, the drop in SCE from feed of 0.1 mm/rev to 0.4 mm/rev has been observed to be about 36%, whereas in the TSM region, the drop in SCE with an increase in feed has been observed to be 30%. The maximum drop in SCE has been observed in the HSM region, where a reduction of around 54% in SCE is observed when feed is increased from 0.1 to 0.4 mm/rev. The high significance of feed on SCE can be explained with the help of chip mechanics and the cutting process mechanism. An increase in feed while keeping the cutting speed at a constant value results in an increase in chip thickness, chip thickness ratio, and, consequently, high shear plane angle [43]. Additionally, with the increase in feed, the cutting process mechanism gradually shifts from the rubbing/ploughing dominated zone to a more efficient shearing zone [52]. The energy required to remove material at the shear plane (specific shearing energy) decreases, and the overall efficiency of the cutting process increases in the shearing-process-dominated cutting zone [10]. The high significance of feed for specific energy consumption has been reported in the literature for turning operations [16,17]. Similarly, Balogun and Mativenga [53] reported a high significance of feed for specific energy in milling operations and recommended the bulk removal of material at high feed rates. Thus, the outcomes of this study further corroborated the findings reported in the literature and established the high significance of feed in reducing SCE consumption during the turning of Al 6061 alloys in all three machining regions (CSM, TSM, and HSM).
The combined effect of cutting speed and feed on SCE in all three cutting speed regions is shown in the form of a surface plot in Figure 13. It can be seen from the plot that a minimum SCE is observed at the cutting speed of 1750 m/min and feed of 0.4 mm/rev. Furthermore, as discussed in Figure 11, the value of SCE increases when the cutting speed is further increased.
With regard to the effect of the depth of cut on SCE (Figure 14), a general trend of reduction in SCE prevails in all three machining regions with the increase in the depth of cut. The ANOVA results of SCE also demonstrated that the depth of cut is statistically significant for SCE, although its percentage contribution was generally less than 17%. The relationship between SCE and the depth of cut can be explained with the help of MRR. An increase in the depth of cut increases MRR, and this consequently leads to a reduction in SCE. For this reason, the depth of cut should be kept at its highest permissible level in order to reduce SCE consumption in a machining process.
The combined effect of cutting speed and the depth of cut on SCE in all three cutting speed regions is shown in the form of a surface plot in Figure 15. As compared to the surface plot developed for the cutting speed-feed, the surface plot of the cutting speed-depth of cut shows abrupt SCE regions. It can be seen from the plot that a minimum SCE is observed at the cutting speed of 1750 m/min and the depth of cut of 4 mm. Moreover, the combination of a low cutting speed and low depth of cut can be observed to result in high SCE consumption.

7. Conclusions

An in-depth analysis of the evolution of SCE along with Ra in three different machining regions (conventional, transitional, and high-speed machining) has been performed in this research. The following general conclusions can be drawn from the analysis of these three machining regions:
  • All cutting parameters have been found to be statistically significant for SCE in the three studied machining regions.
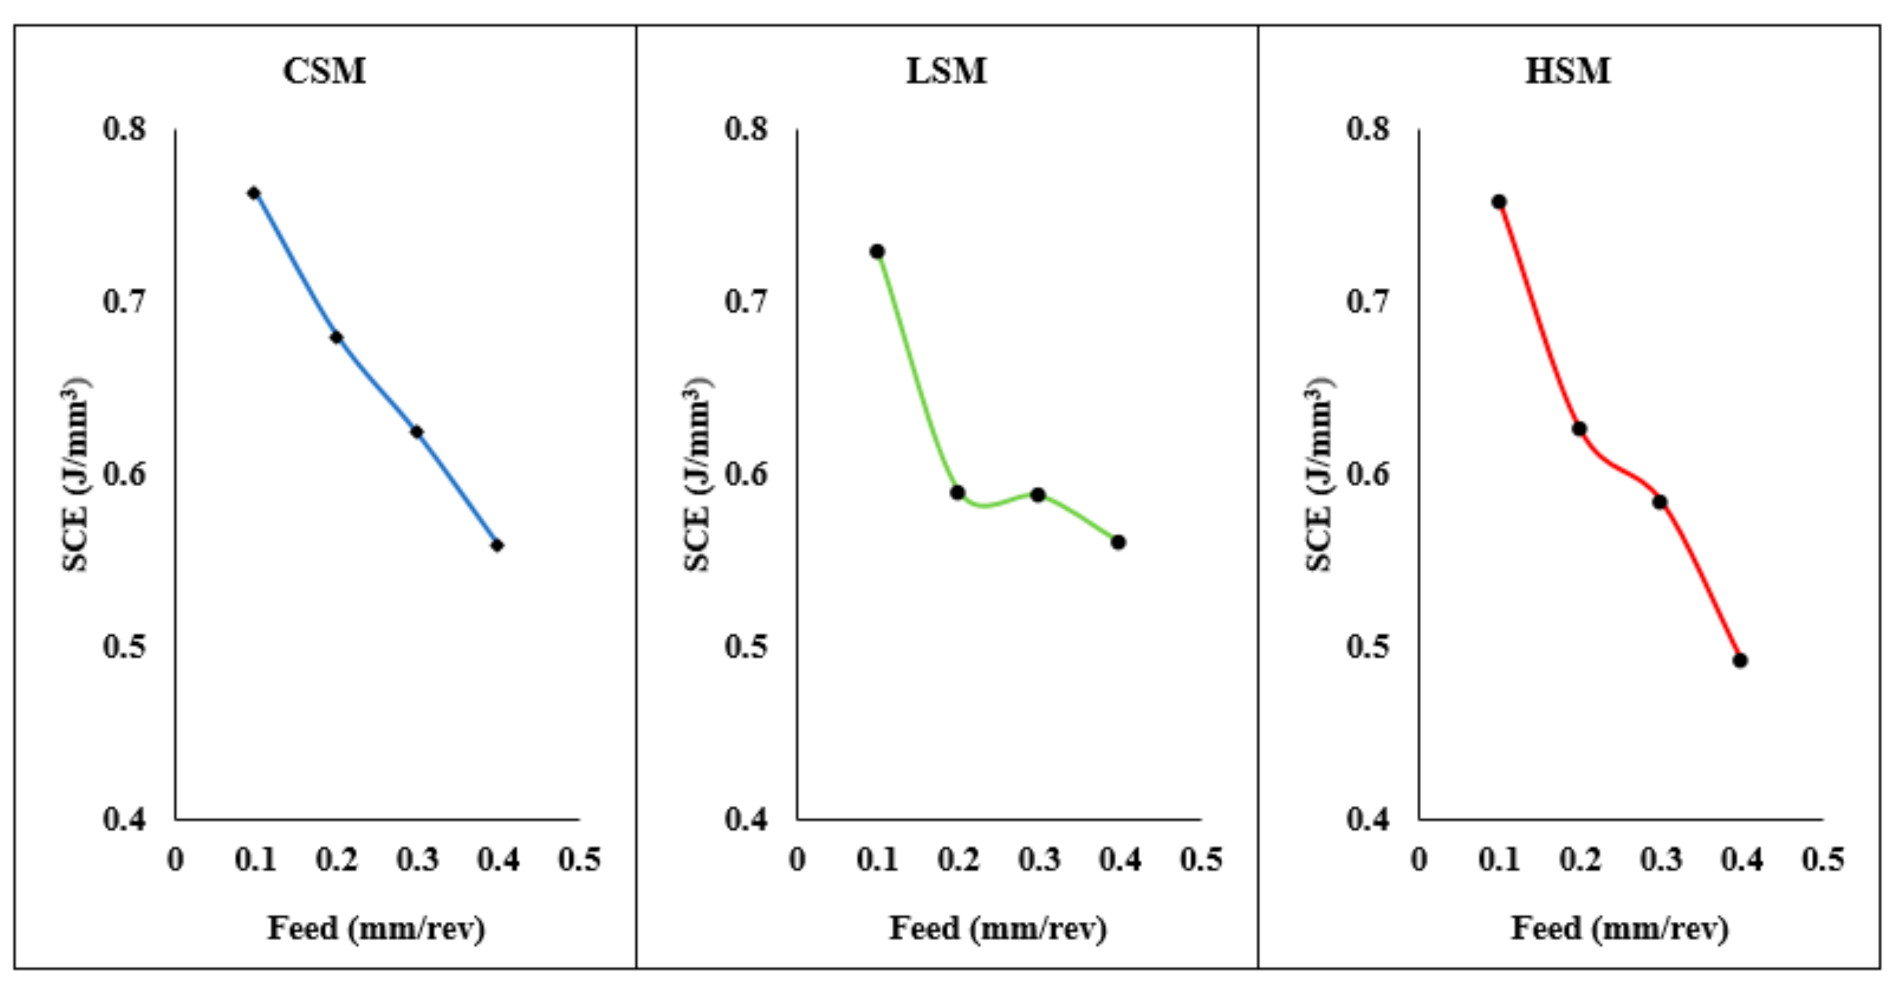
  • Cutting feed is the most significant cutting parameter affecting SCE (having a CR% > 60%) in all the three machining regions.
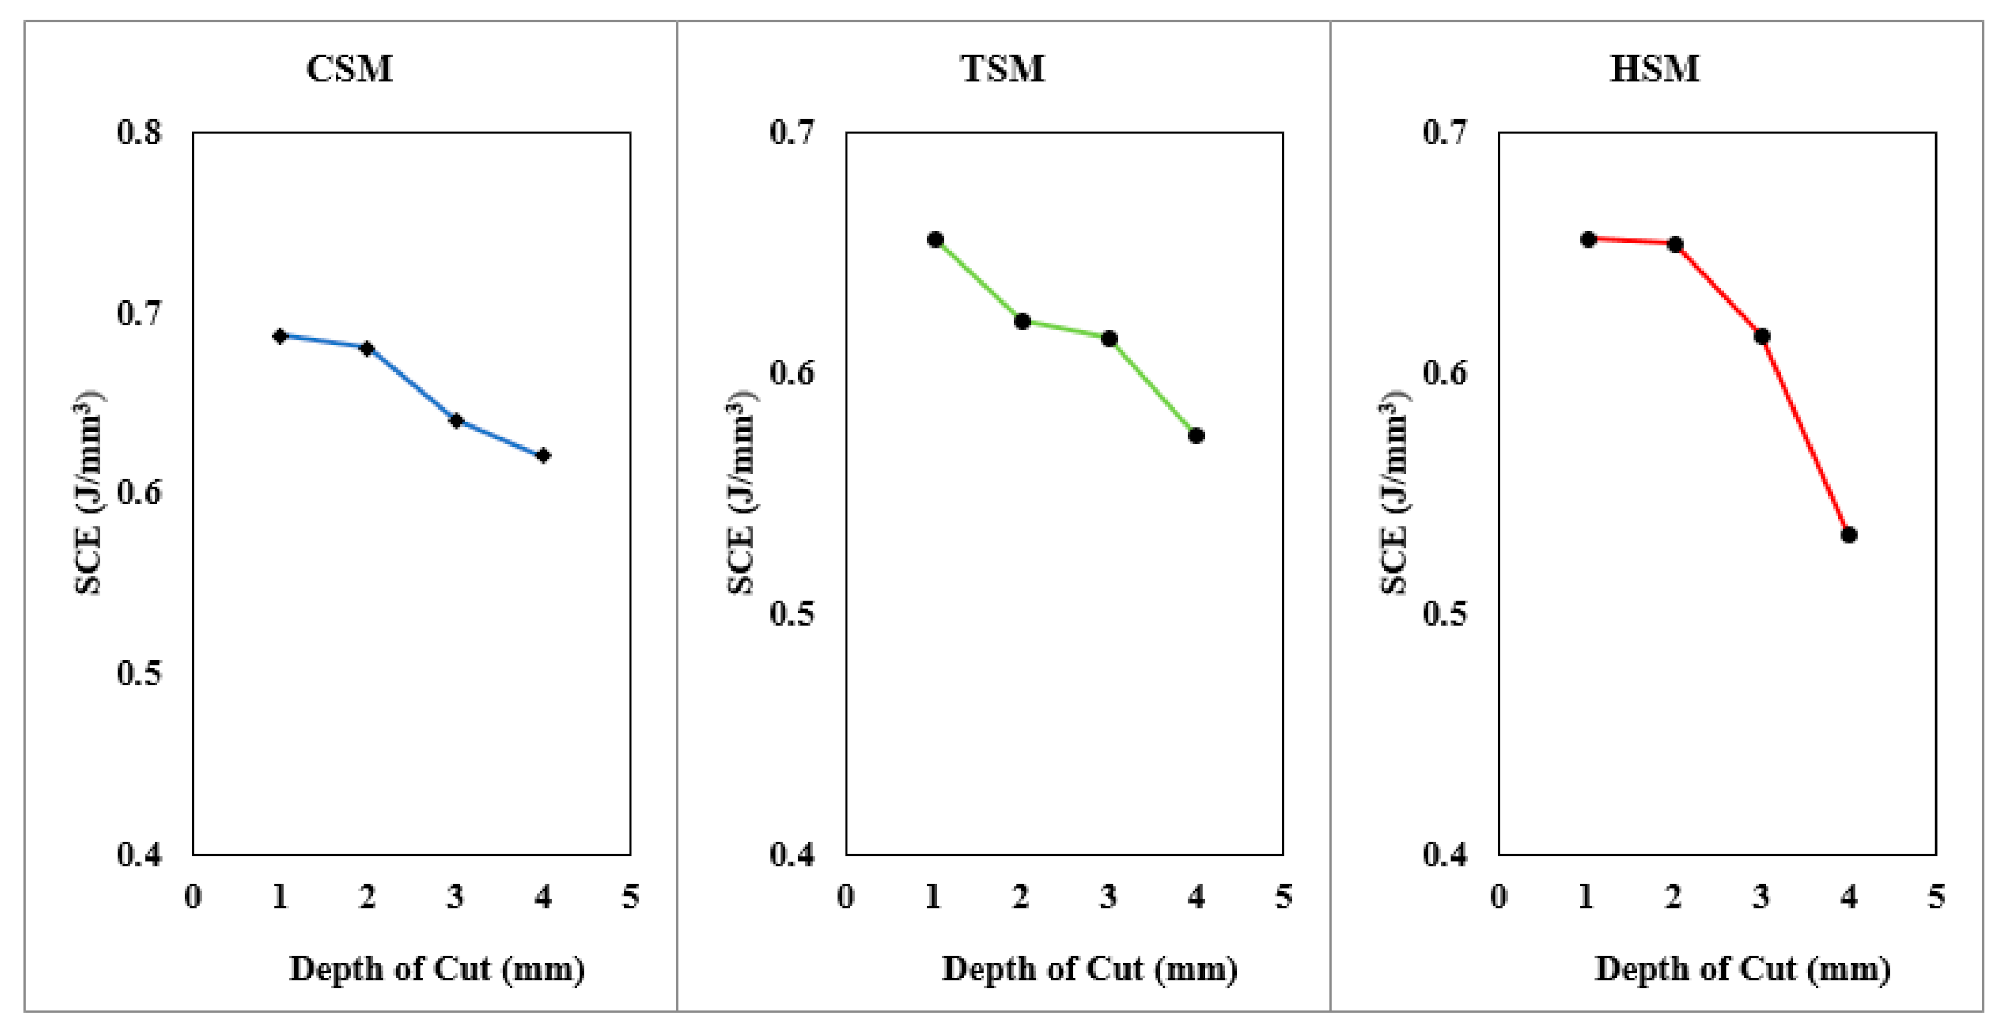
  • Cutting speed and depth of cut have an almost similar effect and CR% in the conventional and HSM region.
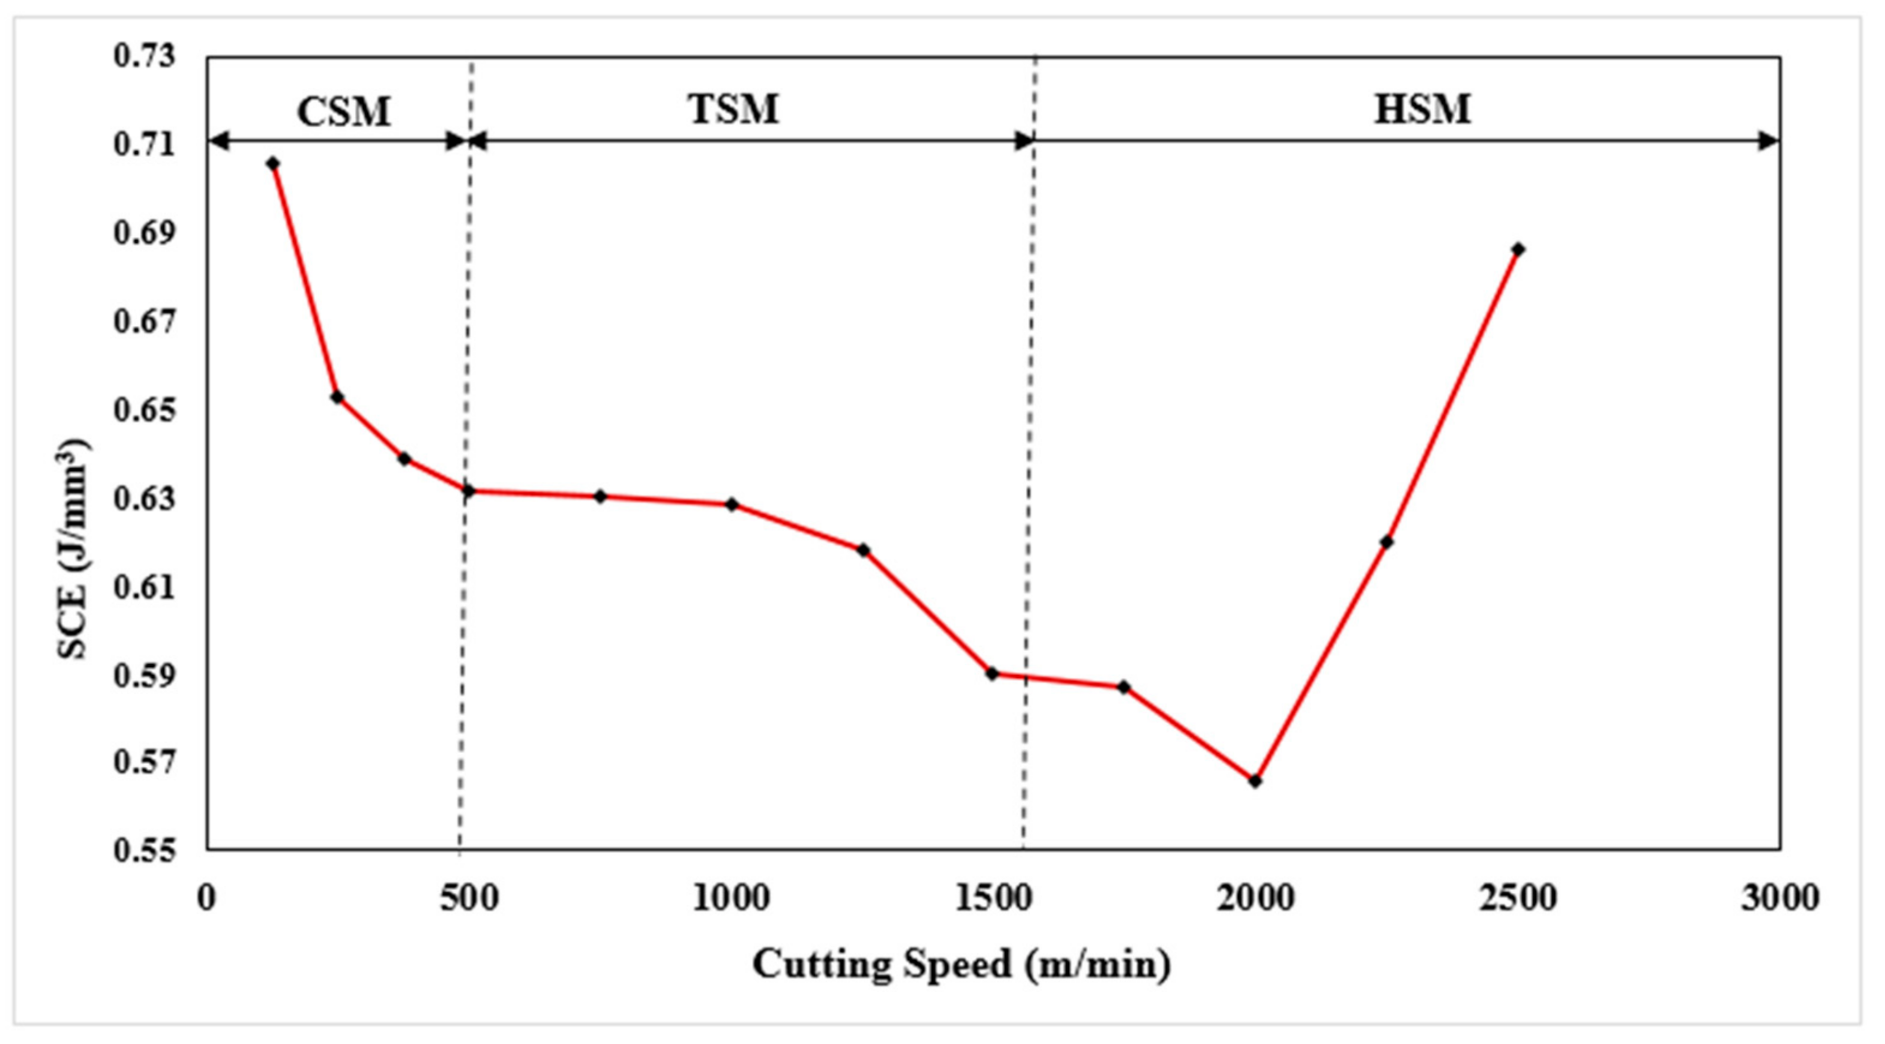
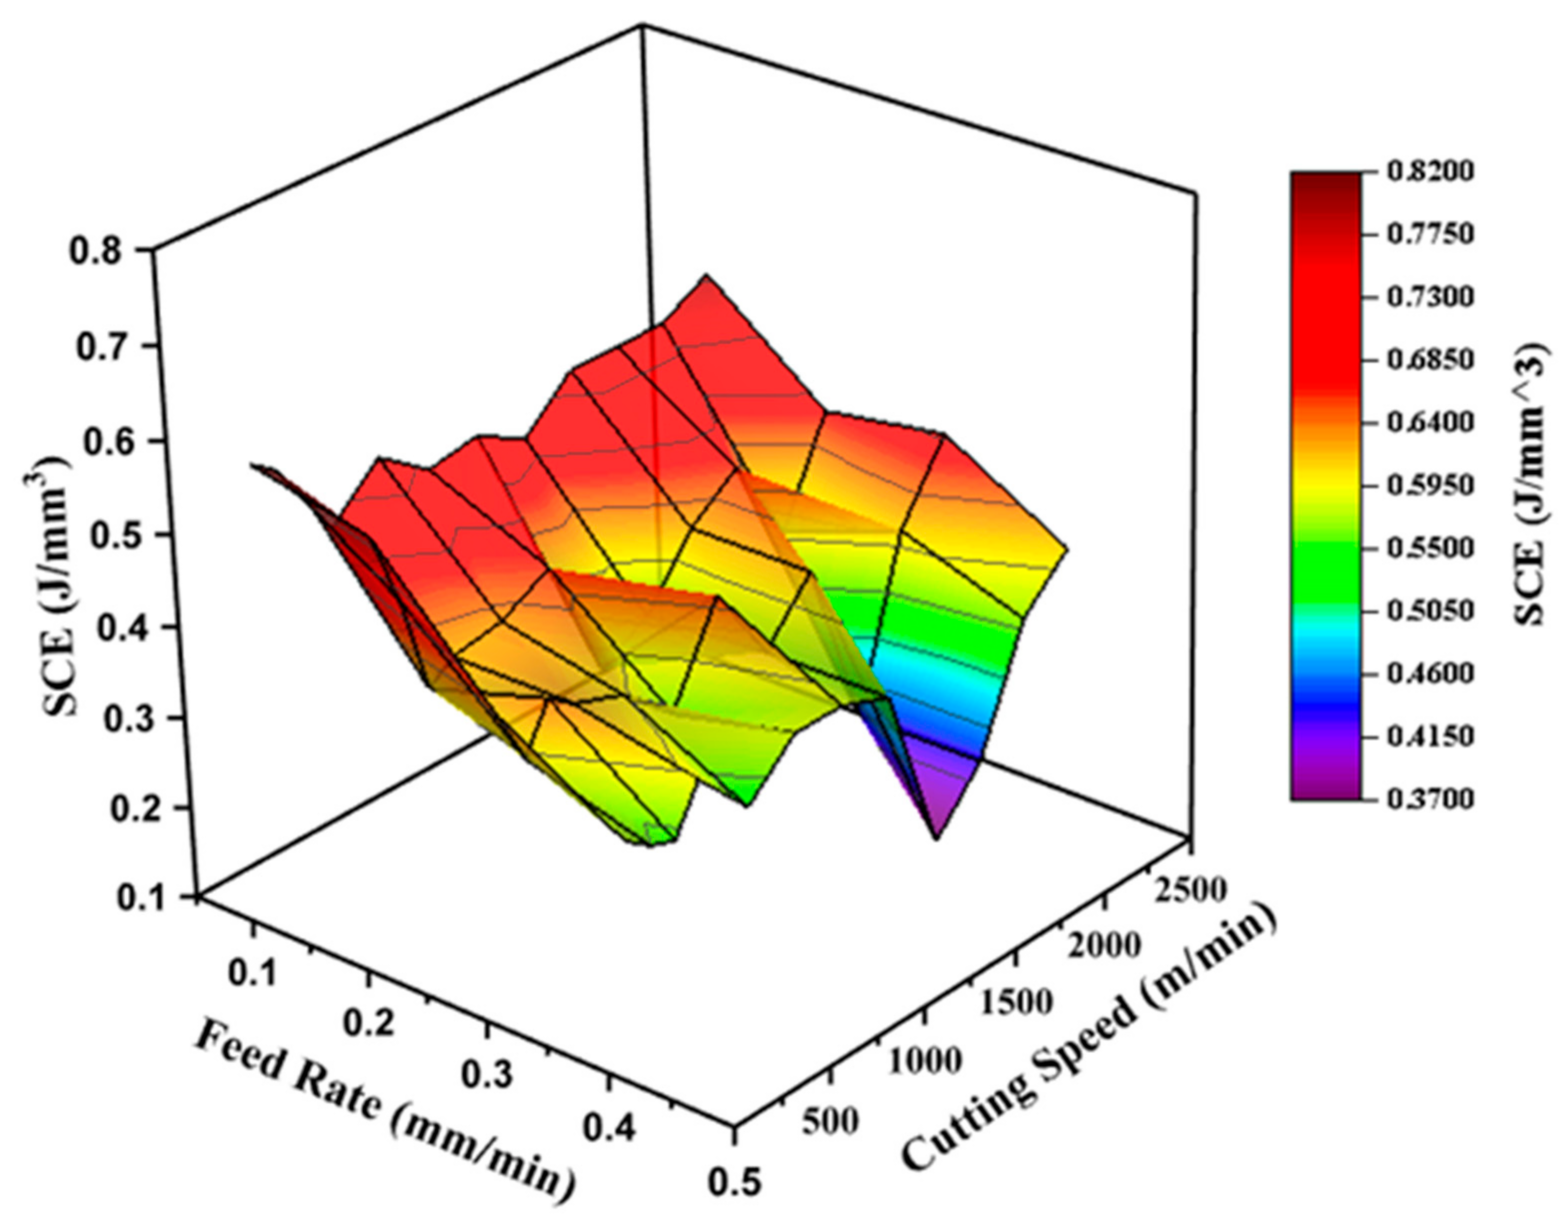
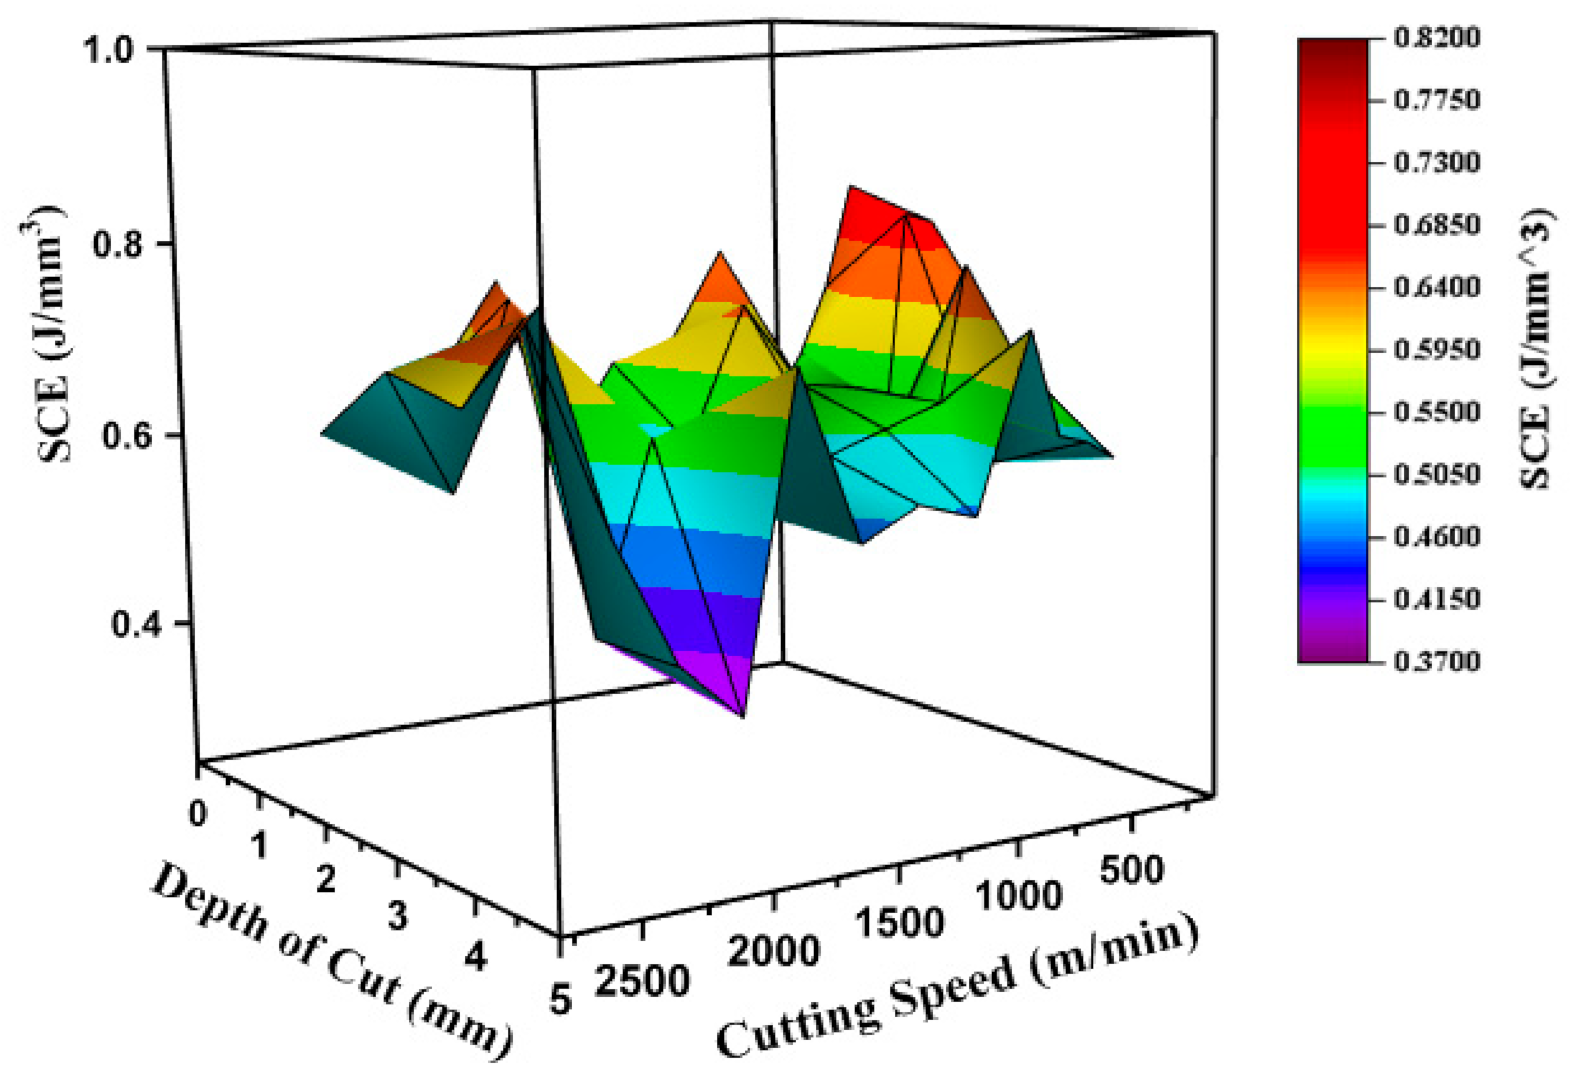
  • SCE has been observed to follow a parabolic trend in the HSM region, signifying the presence of an optimum cutting speed at which SCE is minimum.
  • The chip morphology study revealed no plausible cause for an increase in SCE above the cutting speed of 2000 m/min.
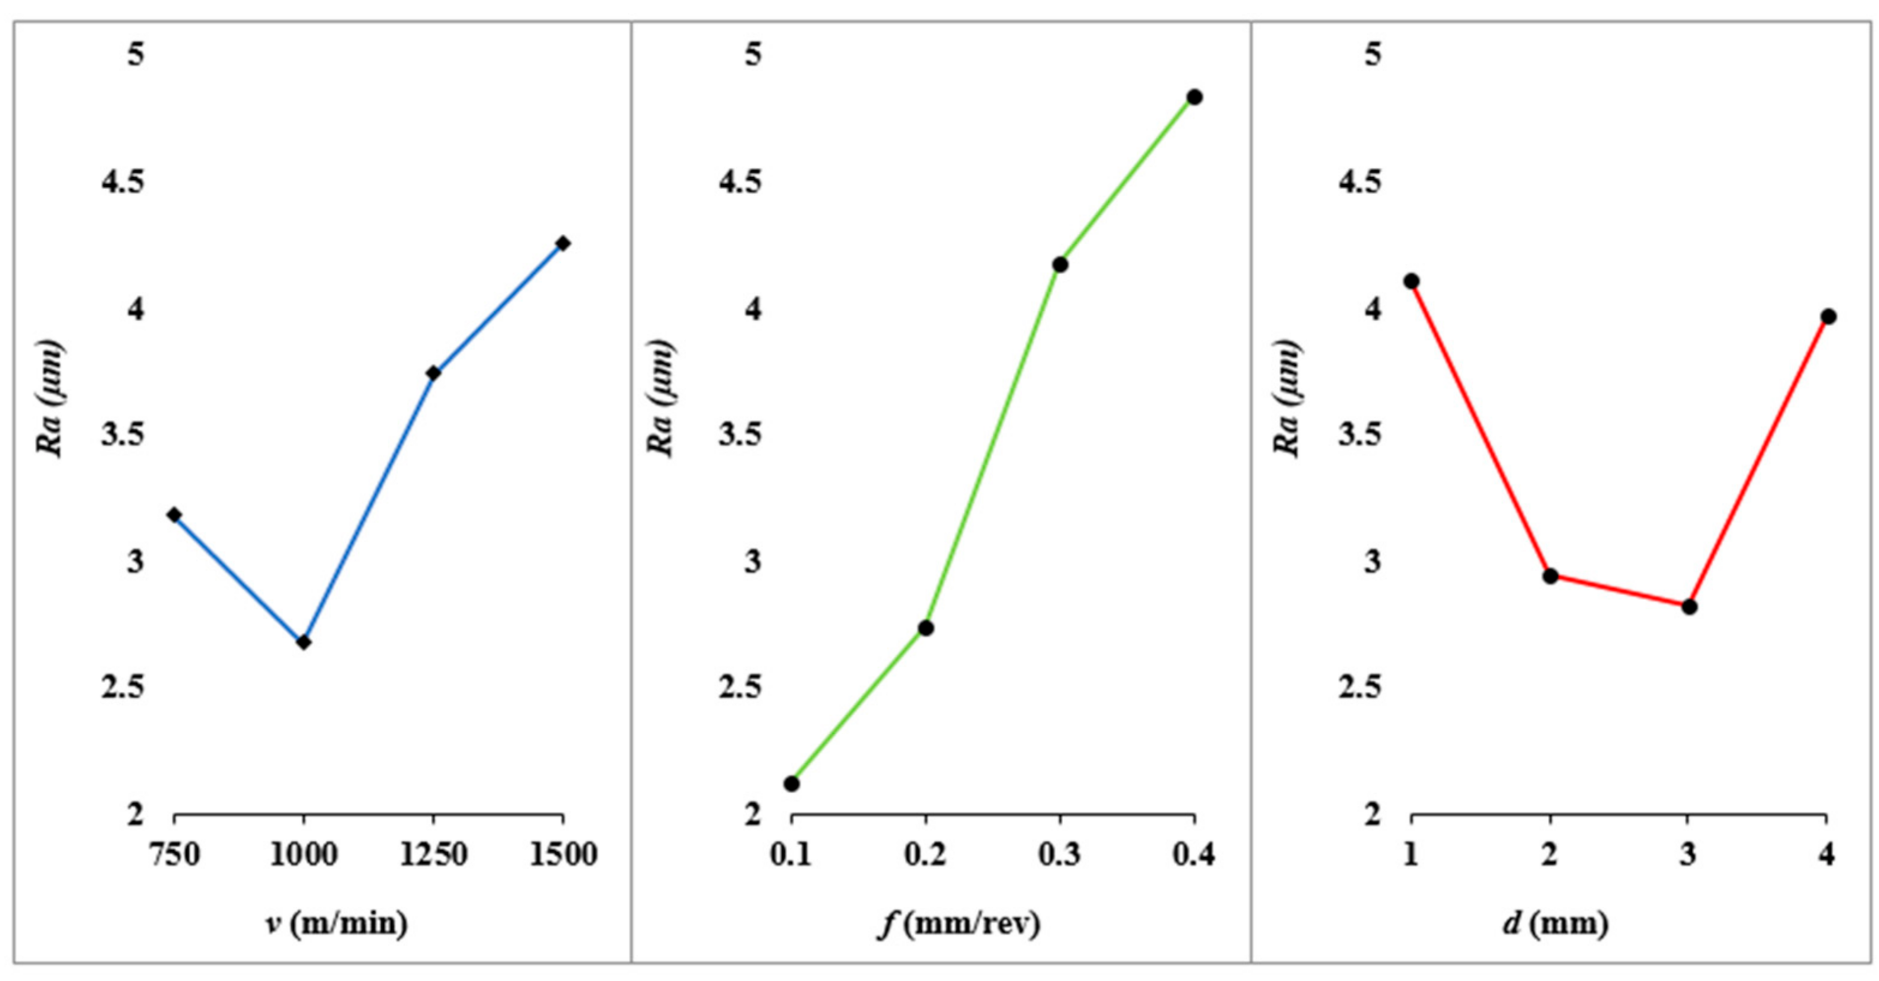
  • Ra has been observed to be highly affected by feed in all three machining regions.
  • SCE and Ra are two competing responses, and the settings of cutting parameters required to achieve a minimum SCE and Ra are almost opposite and contrary in nature. These conflicting requirements of SCE and Ra build the case for the multi-objective optimization of cutting parameters.
A comprehensive sustainability analysis of other alloys (especially difficult-to-cut super alloys) is envisioned in future research. Furthermore, full factorial-based experiments in the three cutting speed regions (CSM, TSM, and HSM), an analysis of machining parameters and their interactions, and the subsequent development of regression-based models of SCE and Ra are also other potential areas of future research. Such analyses are expected to provide valuable insight regarding SCE consumption at varied cutting parameters and speed regions.

Supplementary Materials

The following are available online at https://www.mdpi.com/article/10.3390/app11199032/s1, Supplementary data.

Author Contributions

S.S.W.: Conceptualization, Methodology, Formal Analysis, Investigation, and Writing—Original Draft; T.Z.: Conceptualization, Methodology, Resources, and Supervision; H.E. and F.G.: Methodology, Formal Analysis, Investigation, and Writing—Original Draft; R.A.L. and F.G.: Methodology and Formal Analysis; S.B.: Project Administration, Reviewing, and Funding Acquisition; U.G.: Writing—Review and Editing and Funding Acquisition. All authors have read and agreed to the published version of the manuscript.

Funding

This research received no external funding.

Institutional Review Board Statement

Not applicable.

Informed Consent Statement

Not applicable.

Data Availability Statement

Data are available from Supplementary Materials.

Conflicts of Interest

The authors declare that there is no conflict of interest in the subject matter or materials discussed in this manuscript.

List of Abbreviations

ANOVAAnalysis of Variance
CRPercentage Contribution Ratio
DOEDesign of Experiments
DOFDegrees of Freedom
RaArithmetic Average of Surface Heights (for expressing surface finish)
SCESpecific Cutting Energy ( J / mm 3 )
SSSum of Squares

References

  1. Haapala, K.R.; Zhao, F.; Camelio, J.; Sutherland, J.W.; Skerlos, S.J.; Dornfeld, D.A.; Jawahir, I.S.; Clarens, A.F.; Rickli, J.L. A Review of Engineering Research in Sustainable Manufacturing. J. Manuf. Sci. Eng. 2013, 135, 041013. [Google Scholar] [CrossRef] [Green Version]
  2. Gupta, M.K.; Song, Q.; Liu, Z.; Sarikaya, M.; Jamil, M.; Mia, M.; Kushvaha, V.; Singla, A.K.; Li, Z. Ecological, Economical and Technological Perspectives Based Sustainability Assessment in Hybrid-Cooling Assisted Machining of Ti-6Al-4V Alloy. Sustain. Mater. Technol. 2020, 26, e00218. [Google Scholar]
  3. Yoon, H.S.; Kim, E.S.; Kim, M.S.; Lee, J.Y.; Lee, G.B.; Ahn, S.H. Towards Greener Machine Tools—A Review on Energy Saving Strategies and Technologies. Renew. Sustain. Energy Rev. 2015, 48, 870–891. [Google Scholar] [CrossRef]
  4. Renna, P.; Materi, S. A Literature Review of Energy Efficiency and Sustainability in Manufacturing Systems. Appl. Mech. Mater. 2021, 11, 7366. [Google Scholar]
  5. Li, W.; Kara, S. An Empirical Model for Predicting Energy Consumption of Manufacturing Processes: A Case of Turning Process. Proc. Inst. Mech. Eng. Part B J. Eng. Manuf. 2011, 225, 1636–1646. [Google Scholar] [CrossRef]
  6. Gutowski, T.; Dahmus, J.; Thiriez, A. Electrical Energy Requirements for Manufacturing Processes. In Proceedings of the 13th CIRP International Conference On Life Cycle Engineering, Leuven, Belguim, 31 May–2 June 2006; pp. 623–628. [Google Scholar]
  7. Duflou, J.R.; Sutherland, J.W.; Dornfeld, D.; Herrmann, C.; Jeswiet, J.; Kara, S.; Hauschild, M.; Kellens, K. Towards Energy and Resource Efficient Manufacturing: A Processes and Systems Approach. CIRP Ann.-Manuf. Technol. 2012, 61, 587–609. [Google Scholar] [CrossRef] [Green Version]
  8. Feng, C.; Huang, S. The Analysis of Key Technologies for Sustainable Machine Tools Design. Appl. Sci. 2020, 10, 731. [Google Scholar] [CrossRef] [Green Version]
  9. Liu, F.; Xie, J.; Liu, S. A Method for Predicting the Energy Consumption of the Main Driving System of a Machine Tool in a Machining Process. J. Clean. Prod. 2014, 105, 171–177. [Google Scholar] [CrossRef]
  10. Balogun, V.A.; Edem, I.F.; Adekunle, A.A.; Mativenga, P.T. Specific Energy Based Evaluation of Machining Efficiency. J. Clean. Prod. 2016, 116, 187–197. [Google Scholar] [CrossRef]
  11. Warsi, S.S.; Ahmad, R.; Jaffery, S.H.I.; Agha, M.H.; Khan, M. Development of Specific Cutting Energy Map for Sustainable Turning: A Study of Al 6061 T6 from Conventional to High Cutting Speeds. Int. J. Adv. Manuf. Technol. 2020, 106, 2949–2960. [Google Scholar] [CrossRef]
  12. Sihag, N.; Sangwan, K.S. A Systematic Literature Review on Machine Tool Energy Consumption. J. Clean. Prod. 2020, 275, 123125. [Google Scholar] [CrossRef]
  13. Draganescu, F.; Gheorghe, M.; Doicin, C. Models of Machine Tool Efficiency and Specific Consumed Energy. J. Mater. Process. Technol. 2003, 141, 9–15. [Google Scholar] [CrossRef]
  14. Li, L.; Yan, J.; Xing, Z. Energy Requirements Evaluation of Milling Machines Based on Thermal Equilibrium and Empirical Modelling. J. Clean. Prod. 2013, 52, 113–121. [Google Scholar] [CrossRef]
  15. Liu, Z.Y.; Guo, Y.B.; Sealy, M.P.; Liu, Z.Q. Energy Consumption and Process Sustainability of Hard Milling with Tool Wear Progression. J. Mater. Process. Technol. 2016, 229, 305–312. [Google Scholar] [CrossRef]
  16. Camposeco-Negrete, C. Optimization of Cutting Parameters Using Response Surface Method for Minimizing Energy Consumption and Maximizing Cutting Quality in Turning of AISI 6061 T6 Aluminum. J. Clean. Prod. 2015, 91, 109–117. [Google Scholar] [CrossRef]
  17. Camposeco-Negrete, C. Optimization of Cutting Parameters for Minimizing Energy Consumption in Turning of AISI 6061 T6 Using Taguchi Methodology and ANOVA. J. Clean. Prod. 2013, 53, 195–203. [Google Scholar] [CrossRef]
  18. Paul, S.; Bandyopadhyay, P.P.; Paul, S. Minimisation of Specific Cutting Energy and Back Force in Turning of AISI 1060 Steel. Proc. Inst. Mech. Eng. Part B J. Eng. Manuf. 2018, 232, 2019–2029. [Google Scholar] [CrossRef]
  19. Warsi, S.S.; Agha, M.H.; Ahmad, R.; Jaffery, S.H.I.; Khan, M. Sustainable Turning Using Multi-Objective Optimization: A Study of Al 6061 T6 at High Cutting Speeds. Int. J. Adv. Manuf. Technol. 2018, 100, 843–855. [Google Scholar] [CrossRef]
  20. Younas, M.; Jaffery, S.H.I.; Khan, M.; Khan, M.A.; Ahmad, R.; Mubashar, A.; Ali, L. Multi-Objective Optimization for Sustainable Turning Ti6Al4V Alloy Using Grey Relational Analysis (GRA) Based on Analytic Hierarchy Process (AHP). Int. J. Adv. Manuf. Technol. 2019, 105, 1175–1188. [Google Scholar] [CrossRef]
  21. Khan, M.A.; Jaffery, S.H.I.; Khan, M.; Younas, M.; Butt, S.I.; Ahmad, R.; Warsi, S.S. Multi-Objective Optimization of Turning Titanium-Based Alloy Ti-6Al-4V under Dry, Wet, and Cryogenic Conditions Using Gray Relational Analysis (GRA). Int. J. Adv. Manuf. Technol. 2020, 106, 3897–3911. [Google Scholar] [CrossRef]
  22. Khan, A.M.; Zhao, W.; Li, L.; Alkahtan, M.; Hasnain, S.; Jamil, M.; He, N. Assessment of Cumulative Energy Demand, Production Cost, and CO2 Emission from Hybrid CryoMQL Assisted Machining. J. Clean. Prod. 2021, 292, 125952. [Google Scholar] [CrossRef]
  23. Jamil, M.; Zhao, W.; He, N.; Kumar, M.; Sarikaya, M.; Mashood, A.; Sanjay, M.R.; Siengchin, S.; Yu, D. Sustainable Milling of Ti-6Al-4V: A Trade-off between Energy Efficiency, Carbon Emissions and Machining Characteristics under MQL and Cryogenic Environment. J. Clean. Prod. 2021, 281, 125374. [Google Scholar] [CrossRef]
  24. Cetin, M.H.; Ozcelik, B.; Kuram, E.; Demirbas, E. Evaluation of Vegetable Based Cutting Fluids with Extreme Pressure and Cutting Parameters in Turning of AISI 304L by Taguchi Method. J. Clean. Prod. 2011, 19, 2049–2056. [Google Scholar] [CrossRef]
  25. Fratila, D.; Caizar, C. Application of Taguchi Method to Selection of Optimal Lubrication and Cutting Conditions in Face Milling of AlMg3. J. Clean. Prod. 2011, 19, 640–645. [Google Scholar] [CrossRef]
  26. Arcona, C.; Dow, T.A. An Empirical Tool Force Model for Precision Machining. J. Manuf. Sci. Eng. 1998, 120, 700. [Google Scholar] [CrossRef]
  27. Sreejith, P.S. Machining of 6061 Aluminium Alloy with MQL, Dry and Flooded Lubricant Conditions. Mater. Lett. 2008, 62, 276–278. [Google Scholar] [CrossRef]
  28. Warsi, S.S.; Jaffery, H.I.; Ahmad, R.; Khan, M.; Akram, S. Analysis of Power and Specific Cutting Energy Consumption in Orthogonal Machining of Al 6061-T6 Alloys at Transitional Cutting Speeds. In Volume 2B: Advanced Manufacturing; ASME: New York, NY, USA, 2015; p. V02BT02A057. [Google Scholar] [CrossRef]
  29. Akram, S.; Jaffery, S.H.I.; Khan, M.; Fahad, M.; Mubashar, A.; Ali, L. Numerical and Experimental Investigation of Johnson–Cook Material Models for Aluminum (AL 6061-T6) Alloy Using Orthogonal Machining Approach. Adv. Mech. Eng. 2018, 10, 1–14. [Google Scholar] [CrossRef] [Green Version]
  30. Warsi, S.S.; Jaffery, S.H.I.; Ahmad, R.; Khan, M.; Agha, M.H.; Ali, L. Development and Analysis of Energy Consumption Map for High-Speed Machining of Al 6061-T6 Alloy. Int. J. Adv. Manuf. Technol. 2018, 96, 91–102. [Google Scholar] [CrossRef]
  31. Warsi, S.S.; Jaffery, S.H.I.; Ahmad, R.; Khan, M.; Ali, L.; Agha, M.H.; Akram, S. Development of Energy Consumption Map for Orthogonal Machining of Al 6061-T6 Alloy. Proc. Inst. Mech. Eng. Part B J. Eng. Manuf. 2017, 232, 2510–2522. [Google Scholar] [CrossRef]
  32. Younas, M.; Jaffery, S.H.I.; Khan, A.; Khan, M. Development and Analysis of Tool Wear and Energy Consumption Maps for Turning of Titanium Alloy (Ti6Al4V). J. Manuf. Process. 2021, 62, 613–622. [Google Scholar] [CrossRef]
  33. Gutowski, T.G.; Sahni, S.; Allwood, J.M.; Ashby, M.F.; Worrell, E. The Energy Required to Produce Materials: Constraints on Energy-Intensity Improvements, Parameters of Demand. Philos. Trans. R. Soc. A Math. Phys. Eng. Sci. 2013, 371, 20120003. [Google Scholar] [CrossRef]
  34. Pusavec, F.; Kramar, D.; Krajnik, P.; Kopac, J. Transitioning to Sustainable Production—Part II: Evaluation of Sustainable Machining Technologies. J. Clean. Prod. 2010, 18, 1211–1221. [Google Scholar] [CrossRef]
  35. Garg, A.; Lam, J.S.L. Improving Environmental Sustainability by Formulation of Generalized Power Consumption Models Using an Ensemble Based Multi-Gene Genetic Programming Approach. J. Clean. Prod. 2015, 102, 246–263. [Google Scholar] [CrossRef]
  36. Bhushan, R.K. Optimization of Cutting Parameters for Minimizing Power Consumption and Maximizing Tool Life during Machining of Al Alloy SiC Particle Composites. J. Clean. Prod. 2013, 39, 242–254. [Google Scholar] [CrossRef]
  37. Aggarwal, A.; Singh, H.; Kumar, P.; Singh, M. Optimizing Power Consumption for CNC Turned Parts Using Response Surface Methodology and Taguchi’s Technique—A Comparative Analysis. J. Mater. Process. Technol. 2008, 200, 373–384. [Google Scholar] [CrossRef]
  38. Bagaber, S.A.; Yusoff, A.R. Multi-Responses Optimization in Dry Turning of a Stainless Steel as a Key Factor in Minimum Energy. Int. J. Adv. Manuf. Technol. 2018, 96, 1109–1122. [Google Scholar] [CrossRef]
  39. Kosaraju, S.; Chandraker, S. Taguchi Analysis on Cutting Force and Surface Roughness in Turning MDN350 Steel. Mater. Today Proc. 2015, 2, 3388–3393. [Google Scholar] [CrossRef]
  40. Schulz, H.; Moriwaki, T. High-Speed Machining. CIRP Ann.—Manuf. Technol. 1992, 41, 637–643. [Google Scholar] [CrossRef]
  41. Mativenga, P.T.; Abukhshim, N.A.; Sheikh, M.A.; Hon, B.K.K. An Investigation of Tool Chip Contact Phenomena in High-Speed Turning Using Coated Tools. Proc. Inst. Mech. Eng. Part B J. Eng. Manuf. 2006, 220, 657–667. [Google Scholar] [CrossRef]
  42. Flom, D.G.; Komanduri, R.; Lee, M. High-speed machining of metals. Annu. Rev. Mater. Sci. 1984, 14, 231–278. [Google Scholar] [CrossRef]
  43. Xu, D.; Feng, P.; Li, W.; Ma, Y.; Liu, B. Research on Chip Formation Parameters of Aluminum Alloy 6061-T6 Based on High-Speed Orthogonal Cutting Model. Int. J. Adv. Manuf. Technol. 2014, 72, 955–962. [Google Scholar] [CrossRef]
  44. Santos, M.C.; Machado, A.R.; Sales, W.F.; Barrozo, M.A.S.; Ezugwu, E.O. Machining of Aluminum Alloys: A Review. Int. J. Adv. Manuf. Technol. 2016, 86, 3067–3080. [Google Scholar] [CrossRef]
  45. Demir, H.; Gunduz, S. The Effects of Aging on Machinability of 6061 Aluminium Alloy. Mater. Des. 2009, 30, 1480–1483. [Google Scholar] [CrossRef]
  46. ISO 3685. ISO 3685: Tool-Life Testing with Single-Point Turning Tools; ISO: Geneva, Switzerland, 1993. [Google Scholar]
  47. Hanafi, I.; Khamlichi, A.; Cabrera, F.M.; Almansa, E.; Jabbouri, A. Optimization of Cutting Conditions for Sustainable Machining of PEEK-CF30 Using TiN Tools. J. Clean. Prod. 2012, 33, 1–9. [Google Scholar] [CrossRef]
  48. Daoud, M.; Chatelain, J.-F.; Bouzid, H.A. On the Effect of Johnson Cook Material Constants to Simulate Al2024-T3 Machining Using Finite Element Modeling. In Proceedings of the ASME 2014 International Mechanical Engineering Congress and Exposition, Montreal, QC, Canada, 14–20 November 2014. [Google Scholar] [CrossRef]
  49. Flom, D.G. High-Speed Machining. In Innovations in Materials Processing; Bruggeman, G., Weiss, V., Eds.; Plenum Press: New York, NY, USA; London, UK, 1985; pp. 417–439. [Google Scholar]
  50. Akram, S.; Jaffery, S.; Khan, M.; Mubashar, A.; Warsi, S.S.; Riaz, U. A Numerical Investigation and Experimental Validation on Chip Morphology of Aluminum Alloy 6061 during Orthogonal Machining. In Proceedings of the 2016 Moratuwa Engineering Research Conference (MERCon), Moratuwa, Sri Lanka, 5–6 April 2016. [Google Scholar]
  51. Wang, B.; Liu, Z.; Song, Q.; Wan, Y.; Ren, X.; Wang, B. An Approach for Reducing Cutting Energy Consumption with Ultra—High Speed Machining of Super Alloy Inconel 718. Int. J. Precis. Eng. Manuf. Technol. 2019, 7, 35–51. [Google Scholar] [CrossRef]
  52. Balogun, V.A.; Gu, H.; Mativenga, P.T. Improving the Integrity of Specific Cutting Energy Coefficients for Energy Demand Modelling. Proc. Inst. Mech. Eng. Part B J. Eng. Manuf. 2014, 12, 1–9. [Google Scholar] [CrossRef]
  53. Balogun, V.A.; Mativenga, P.T. Impact of Un-Deformed Chip Thickness on Specific Energy in Mechanical Machining Processes. J. Clean. Prod. 2014, 69, 260–268. [Google Scholar] [CrossRef]
Figure 1. Energy consumed in a machining process.
Applsci 11 09032 g001
Figure 2. Turning setup used in present research.
Applsci 11 09032 g002
Figure 3. Ranges of cutting speeds for various materials (adopted from [40]).
Applsci 11 09032 g003
Figure 4. Main effect plot showing the influence of cutting parameters on SCE in CSM.
Applsci 11 09032 g004
Figure 5. Main effect plot showing the influence of cutting parameters on Ra in CSM.
Applsci 11 09032 g005
Figure 6. Main effect plots showing the influence of cutting parameters on SCE in TSM.
Applsci 11 09032 g006
Figure 7. Main effect plot showing the influence of cutting parameters on Ra in TSM.
Applsci 11 09032 g007
Figure 8. Main effect plots showing the influence of cutting parameters on SCE in HSM.
Applsci 11 09032 g008
Figure 9. Photomicrographs of chips formed at (a) v = 1750 m/min, f = 0.4, d = 4 mm; (b) v = 2000 m/min, f = 0.4, d = 3 mm; (c) v = 2250 m/min, f = 0.4, d = 2 mm; (d) v = 2500 m/min, f = 0.4, d = 1 mm.
Applsci 11 09032 g009
Figure 10. Main effect plot showing the influence of cutting parameters on Ra in HSM.
Applsci 11 09032 g010
Figure 11. Effect of cutting speed on SCE.
Applsci 11 09032 g011
Figure 12. Effect of feed on SCE in three machining regions.
Applsci 11 09032 g012
Figure 13. Effect of cutting speed-feed on SCE in three machining regions.
Applsci 11 09032 g013
Figure 14. Effect of depth of cut on SCE in three machining regions.
Applsci 11 09032 g014
Figure 15. Effect of cutting speed-depth of cut on SCE in three machining regions.
Applsci 11 09032 g015
Table 1. L16 experimental plan for conventional speed machining (CSM).
Machining ParametersLevel 1Level 2Level 3Level 4
Cutting Speed (m/min)125250375500
Feed (mm/rev)0.10.20.30.4
Depth of Cut (mm)1234
Table 2. L16 experimental plan for transitional speed machining (TSM).
Machining ParametersLevel 1Level 2Level 3Level 4
Cutting Speed (m/min)750100012501500
Feed (mm/rev)0.10.20.30.4
Depth of Cut (mm)1234
Table 3. L16 experimental plan for high-speed machining (HSM).
Machining ParametersLevel 1Level 2Level 3Level 4
Cutting Speed (m/min)1750200022502500
Feed (mm/rev)0.10.20.30.4
Depth of Cut (mm)1234
Table 4. Results of L16 experimental plan for conventional machining range.
Experiment. No.v
(m/min)
f
(mm/rev)
d
(mm)
SCE (J/mm3)Ra (µm)
AveStd. Dev.AveStd. Dev.
11250.110.820.0050.900.02
21250.220.790.0051.910.02
31250.330.650.0053.290.06
41250.440.570.0054.080.02
52500.120.800.0311.360.01
62500.210.710.0080.680.02
72500.340.590.0083.340.04
82500.430.550.0084.250.02
93750.130.760.0081.010.01
103750.240.600.0172.490.14
113750.310.640.0083.030.11
123750.420.540.0083.590.20
135000.140.710.0081.550.04
145000.230.620.0262.920.60
155000.320.620.0082.730.03
165000.410.590.0083.350.04
Table 5. Analysis of variance and percentage contribution results for SCE.
VariableDOFSeq. SSAdj. MSF-Valuep-ValueCR (%)
v (m/min)30.0409460.01364866724.770.00010.74%
f (mm/rev)30.2678510.089283667162.060.00072.75%
d (mm)30.0361770.01205921.890.0009.44%
Error380.0209360.00055094724.77 7.08%
Total470.36591 100.00%
Std. deviation = 0.0234722; R2 = 94.28%; R2 predicted = 90.87%.
Table 6. Analysis of variance and percentage contribution results for Ra.
VariableDOFSeq. SSAdj. MSF-Valuep-ValueCR (%)
v (m/min)30.34040.1134670.690.5630.24%
f (mm/rev)348.099316.033197.610.00077.95%
d (mm)36.38952.12983312.970.0009.66%
Error386.24190.1642610.69 12.15%
Total4761.0711 100.00%
Std. deviation = 0.405292; R2 = 89.78%; R2 predicted = 83.69%.
Table 7. Results of confirmatory experiments for conventional speed machining.
Levels of Machining Parameters
Responses Average Valuev
(m/min)
f
(mm/rev)
d
(mm)
Specific cutting energy (J/mm3)Best0.515000.44
Worst0.821250.11
Surface roughness (µm)Best0.652500.11
Worst4.495000.44
Table 8. Results of L16 experimental plan for transitional speed machining range.
Experiment. No.v
(m/min)
f
(mm/rev)
d
(mm)
SCE (J/mm3)Ra (µm)
AveStd. Dev.AveStd. Dev.
17500.110.760.0082.540.042
27500.220.630.0081.930.372
37500.330.600.0053.170.041
47500.440.530.0085.090.049
510000.120.720.0171.360.012
610000.210.660.0082.040.069
710000.340.550.0053.890.196
810000.430.580.0083.470.464
912500.130.730.0081.020.290
1012500.240.520.0053.980.051
1112500.310.650.0055.170.351
1212500.420.580.0054.120.319
1315000.140.700.0082.930.051
1415000.230.550.0053.010.186
1515000.320.560.0054.410.341
1615000.410.560.0056.710.102
Table 9. Analysis of variance and percentage contribution results for SCE.
VariableDOFSeq. SSAdj. MSF-Valuep-ValueCR (%)
v (m/min)30.0121890.0040637.830.0003.82%
f (mm/rev)30.2058190.068606333132.170.00073.36%
d (mm)30.0407140.01357133326.140.00014.06%
Error380.0197250.000519079 8.76%
Total470.278447 100.00%
Std. dev = 0.0227835; R2 = 92.92%; R2 predicted = 88.7%.
Table 10. Analysis of variance and percentage contribution results for Ra.
VariableDOFSeq. SSAdj. MSF-Valuep-ValueCR (%)
v (m/min)316.7745.59133333330.650.00016.90%
f (mm/rev)356.34418.78133333102.970.00058.10%
d (mm)315.9815.32729.210.00016.07%
Error386.9310.182394737 8.93%
Total4796.03 100.00%
Std. dev = 0.427076; R2 = 92.78%; R2 predicted = 88.48%.
Table 11. Results of confirmatory experiments for transitional speed machining.
Levels of Machining Parameters
Responses Averagev
(m/min)
f
(mm/rev)
d
(mm)
Specific cutting energy (J/mm3)Best0.4515000.44
Worst0.767500.11
Surface Roughness (µm)Best1.5410000.13
Worst6.715000.41
Table 12. Results of L16 experimental plan for HSM.
Experiment. No.v
(m/min)
f
(mm/rev)
d
(mm)
SCE (J/mm3)Ra (µm)
AveStd. Dev.AveStd. Dev.
117500.110.750.0051.990.12
217500.220.620.0052.860.04
317500.330.620.0055.220.08
417500.440.370.0057.890.95
520000.120.750.0052.000.02
620000.210.660.0052.960.23
720000.340.430.0055.190.07
820000.430.430.0057.100.10
922500.130.750.0121.610.00
1022500.240.560.0052.930.27
1122500.310.610.0123.530.38
1222500.420.560.0057.530.09
1325000.140.780.0052.030.29
1425000.230.670.0082.280.04
1525000.320.690.0054.710.12
1625000.410.610.0126.050.11
Table 13. Analysis of variance and percentage contribution results for SCE in HSM.
VariableDOFSeq. SSAdj. MSF-Valuep-ValueCR (%)
v (m/min)30.1003910.03346366735.720.00014.09%
f (mm/rev)30.43750.145833333155.670.00062.77%
d (mm)30.1190320.03967733342.350.00016.78%
Error380.0355980.000936789 6.36%
Total470.692521 100.00%
Std. dev = 0.0306070; R2 = 94.86%; R2 predicted = 91.8%.
Table 14. Analysis of variance and percentage contribution results for Ra.
VariableDOFSeq. SSAdj. MSF-Valuep-ValueCR (%)
v (m/min)34.1661.3886666677.090.0011.70%
f (mm/rev)3194.3264.77333333330.910.00091.86%
d (mm)34.9681.6568.460.0002.08%
Error387.4380.195736842 4.36%
Total47210.892 100.00%
Std. dev = 0.442426; R2 = 96.47%; R2 predicted = 94.37%.
Table 15. Results of confirmatory experiments for high-speed machining.
Levels of Machining Variables
Responses Ave. ValueSpeed
(m/min)
Feed
(mm/rev)
Depth of Cut (mm)
Specific cutting energy (J/mm3)Best0.3320000.44
Worst0.7825000.11
Surface roughness (µm)Best1.2825000.11
Worst7.9617500.44
Publisher’s Note: MDPI stays neutral with regard to jurisdictional claims in published maps and institutional affiliations.

