Article

Estimating Specific Patient Organ Dose for Chest CT Examinations with Monte Carlo Method

1
Institute of Radiation Medicine, Fudan University, Shanghai 200032, China
2
Division of Nuclear Medicine and Molecular Imaging, Geneva University Hospital, CH-1211 Geneva, Switzerland
*
Author to whom correspondence should be addressed.
Appl. Sci. 2021, 11(19), 8961; https://doi.org/10.3390/app11198961
Submission received: 13 July 2021 / Revised: 16 September 2021 / Accepted: 18 September 2021 / Published: 26 September 2021
(This article belongs to the Special Issue Monte Carlo Simulation in Quantum Science and Applied Physics)

Abstract

:
Purpose: The purpose of this study was to preliminarily estimate patient-specific organ doses in chest CT examinations for Chinese adults, and to investigate the effect of patient size on organ doses. Methods: By considering the body-size and body-build effects on the organ doses and taking the mid-chest water equivalent diameter (WED) as a body-size indicator, the chest scan images of 18 Chinese adults were acquired on a multi-detector CT to generate the regional voxel models. For each patient, the lungs, heart, and breasts (glandular breast tissues for both breasts) were segmented, and other organs were semi-automated segmented based on their HU values. The CT scanner and patient models simulated by MCNPX 2.4.0 software (Los Alamos National LaboratoryLos Alamos, USA) were used to calculate lung, breast, and heart doses. CTDIvol values were used to normalize simulated organ doses, and the exponential estimation model between the normalized organ dose and WED was investigated. Results: Among the 18 patients in this study, the simulated doses of lung, heart, and breast were 18.15 ± 2.69 mGy, 18.68 ± 2.87 mGy, and 16.11 ± 3.08 mGy, respectively. Larger patients received higher organ doses than smaller ones due to the higher tube current used. The ratios of lung, heart, and breast doses to the CTDIvol were 1.48 ± 0.22, 1.54 ± 0.20, and 1.41 ± 0.13, respectively. The normalized organ doses of all the three organs decreased with the increase in WED, and the normalized doses decreased more obviously in the lung and the heart than that in the breasts. Conclusions: The output of CT scanner under ATCM is positively related to the attenuation of patients, larger-size patients receive higher organ doses. The organ dose normalized by CTDIvol was negatively correlated with patient size. The organ doses could be estimated by using the indicated CTDIvol combined with the estimated WED.

1. Introduction

X-ray computed tomography (CT) has become a widely used technique in medical imaging, but there is a trade-off between patient benefit and radiation risk [1,2,3]. CT scans contribute a large portion of overall exposure currently received during medical diagnostic procedures [4]. The increasing number of CT examinations and the relatively higher dose than other X-ray-based diagnostic modalities has become a matter of wide concern [5].
Currently, CT scanners display a Computed Tomography Dose Index (CTDIvol) and Dose Length Product (DLP) to indicate the dose output of the machine. These indicators are useful for comparing different CT units or scan protocols, but are unable to show the dose distribution in the human body [6] because they do not take into account the patient’s body size, shape, and composition. For this reason, the size-specific dose estimate (SSDE) was proposed by AAPM Task Group 204 [7] as an improved approach to characterize the CT radiation dose to the center of the scan volume with a conversion factor of patient size. In 2019, IEC [8] recommended that SSDE should be used as a dose reference indicator displayed on a CT scanner. Eventually, the organ dose became the important indicator for radiation risk assessment, as suggested by the International Commission on Radiological Protection (ICRP), but the organ dose is not readily available in scan records or images [9]. Moreover, CT dose indicators, such as CTDIvol and DLP (i.e., quantities assessed in a standard water body phantom), do not take into account a patient’s anatomy and composition, thus they do not provide information on an individual patient’s organ doses. SSDE is considered to be the most straightforward approach that could be used to estimate patient dose from CT examinations [8]. However, SSDE could not represent radiation doses of a specific organ, and SSDE was primarily determined from fixed tube current (FTC) scans.
Direct measurement of organ dose is limited by practical obstacles and ethical issues, and organ dose measurement using anthropomorphic phantom is both time and labor consuming. The current related research mainly relies on an MC simulation or organ dose estimation software [10,11,12]. Most of the above-mentioned methods for organ dose estimation are based on patient anatomy models representing average patient anatomy, called patient reference computational phantoms. These computational phantoms have tried to match the anatomy of patients who have different ages, genders, and body sizes, even including pregnancy. However, there are still gaps between computational phantoms and patient-specific anatomy. Moreover, most organ dose estimation software did not consider the individual tube current curve when the CT scan was performed with tube current modulation (TCM). Therefore, to improve the accuracy in the analysis of cancer risk after CT scans, further investigations of the doses administered to individual organs with patient-specific phantom and a corresponding tube current curve using CT images are preferable.
In the past few years, several researchers have made many attempts to establish patient-specific models through retrospective research and to estimate patient organ doses based on patient size metrics for CT scan with ATCM [13,14,15,16,17,18,19]. Angel et al. [13] directly measured the circumference of patients at the skin–air boundary as a size metric, and compared a linear relationship between organ dose and patient size under ATCM and FTC. Khatonabadi et al. [14] used an exponential model to discuss the relationship between normalized organ dose and effective diameter under ATCM conditions. Since the publication of AAPM Report No. 220 [20], some researchers have begun to pay attention to the relationship between WED and organ dose, and have proposed an exponential model to provide the possibility of individualized organ dose estimations. Bostani et al. [16,17] and Abuhaimed et al. [18] respectively used patient CT images and computational human phantoms to study the influence of WED to organ doses. However, to the best of our knowledge, no relevant studies have been reported to estimate patient-specific organ doses with Chinese populations. In fact, the Chinese population has a relatively smaller size compared with that of Europe and America [21,22,23], and there is currently no relevant research showing whether the difference in patient size affects the accuracy of the existing models.
As chest regions, with a relatively greater tube current reduction for ATCM [24], represent one of the most frequently scanned body regions in clinical application [25,26], and as lung and breast are the most radiosensitive organs fully exposed in the imaged region, we further investigated chest CT imaging for more accurate organ dose estimations in this study. A set of exponential models were preliminarily established to estimate the organ doses of Chinese adults undergoing thorax CT scans with an ATCM system. The established model was based on the Monte Carlo calculation of the 18 investigated Chinese adults with a variety of sizes, and the model could be improved with more patient samples. We compared the organ doses in this study with developed dose evaluation parameters and models, and discussed their applicability to the Chinese population.

2. Materials and Methods

2.1. Patient Selection and Patient Size Calculation

Voxelized patient models of different sizes used in the Monte Carlo simulations were developed from the actual CT examinations. A total of 567 sets of chest diagnostic CT for Chinese adult patients were acquired on the same scanner (NeuViz 16, NMD, China) at Zhongye Hospital (Shanghai) from October to December 2017. The institutional review board approved and a waiver of informed consent was obtained. By considering the body-size effects on the organ doses and, taking the water equivalent diameter (WED) as a body-size indicator, CT image sequences from 18 adult patients (9 females and 9 males) with different body sizes were screened to create patient-specific voxelized chest models in this work. Each CT examination was performed with 120 kVp (HVL = 8.27 cm), 0.8631 pitch factor and 16 × 1.25 mm collimation and 3 mm reconstructed image thickness with ATCM. All images were reconstructed under a relatively large field of view (FOV) to make the anatomical structure as complete as possible within the image coverage. The WED was used as a patient size metric for dose estimates in the chest. It represented the diameter of a water cylinder in which the attenuation of X-rays was equivalent to that in the patient body. In this study, the DICOM of mid-chest, with the lowest portion of the sternum present, or the simultaneous view of all four heart chambers, was used to obtain the average CT number in the region of the entire patient cross-section without irrelevant objects. According to the definition in the AAPM 220 report, WED can be calculated as follows:
W E D = 2 [ 1 1000 C T ( x , y ) R O I ¯ + 1 ] A R O I π
where C T ( x , y ) R O I ¯ is the mean CT number in the region of interest (ROI), A R O I is the total area of the ROI.

2.2. Development of Voxelized Phantom Model for Individual Patients

Lungs and bones were automatically contoured in all patient image slices, and the other five main organs/tissues, including the heart wall, muscle, glandular breast tissues, fat, and skin, were semi-automatically segmented by the 3D Slicer software. As shown in Figure 1, different organs were divided by choosing the range of CT values. Typically, the CT value ranges of lungs and bones are selected as −960~−340 HU and 144~931 HU, respectively. The CT values of glandular breast tissues and hearts are close to the surrounding soft tissues. Their boundaries were manually segmented by experienced physicists in addition to the CT value identification. The 3D Slicer software then exported a new DICOM file sequence after all the organ boundaries were segmented. An in-house software was used to generate individualized chest voxelized models from the new sequence that can be used for MCNP calculations. The size of each voxel was 3 mm × 3 mm × 1.5 mm.

2.3. Organ Dose Simulations for Individual Patients

Based on the CT scanner model developed by Huang et al. [27,28] and the individually voxelized phantoms built above, the organ doses for each patient were simulated by using MCNPX 2.4.0. In the CT model, 16 X-ray sources uniformly distributed along the rack were set to simulate the helical CT scanning. The X-ray spectrum, with an energy resolution of 1.0 keV, was generated by SPEKTR3.0®, and it was proved to be accurate enough in our previous study [29]. In X-ray diagnosis, the photon transport model assumes that electrons propagate in the direction of the initial photon, and that the charged particle equilibrium (CPE) occurs when the electrons deposit energy during the interaction, and the collision kerma is equal to the absorbed dose. Therefore, the results (MeV per gram per particle) recorded in the F6 tally of MCNPX can be taken as the absorbed doses of the tissue or organ. For practical use, it usually requires a conversion factor (CF) to convert the output of MCNP into an absorbed dose per 100 mAs. The conversion factor is the ratio of the CTDI100 in the air measured at the isocenter of the CT gantry to the result simulated by the MCNP in the same situation.
In this study, the number of particles used in each simulation was set to be 1 × 10⁸, and the statistical deviation of the organ dose was generally less than 2.5%. For each patient, the tube current and other scanning parameters were extracted from the DICOM header, and the dose deposited in each organ (DT) can be calculated as:
D T = i k D S × C F × I i 100
D S is the simulation result in the F6 tally for each slice of CT scan, I i is the tube charge per rotation (mAs) used for each slice.

3. Results

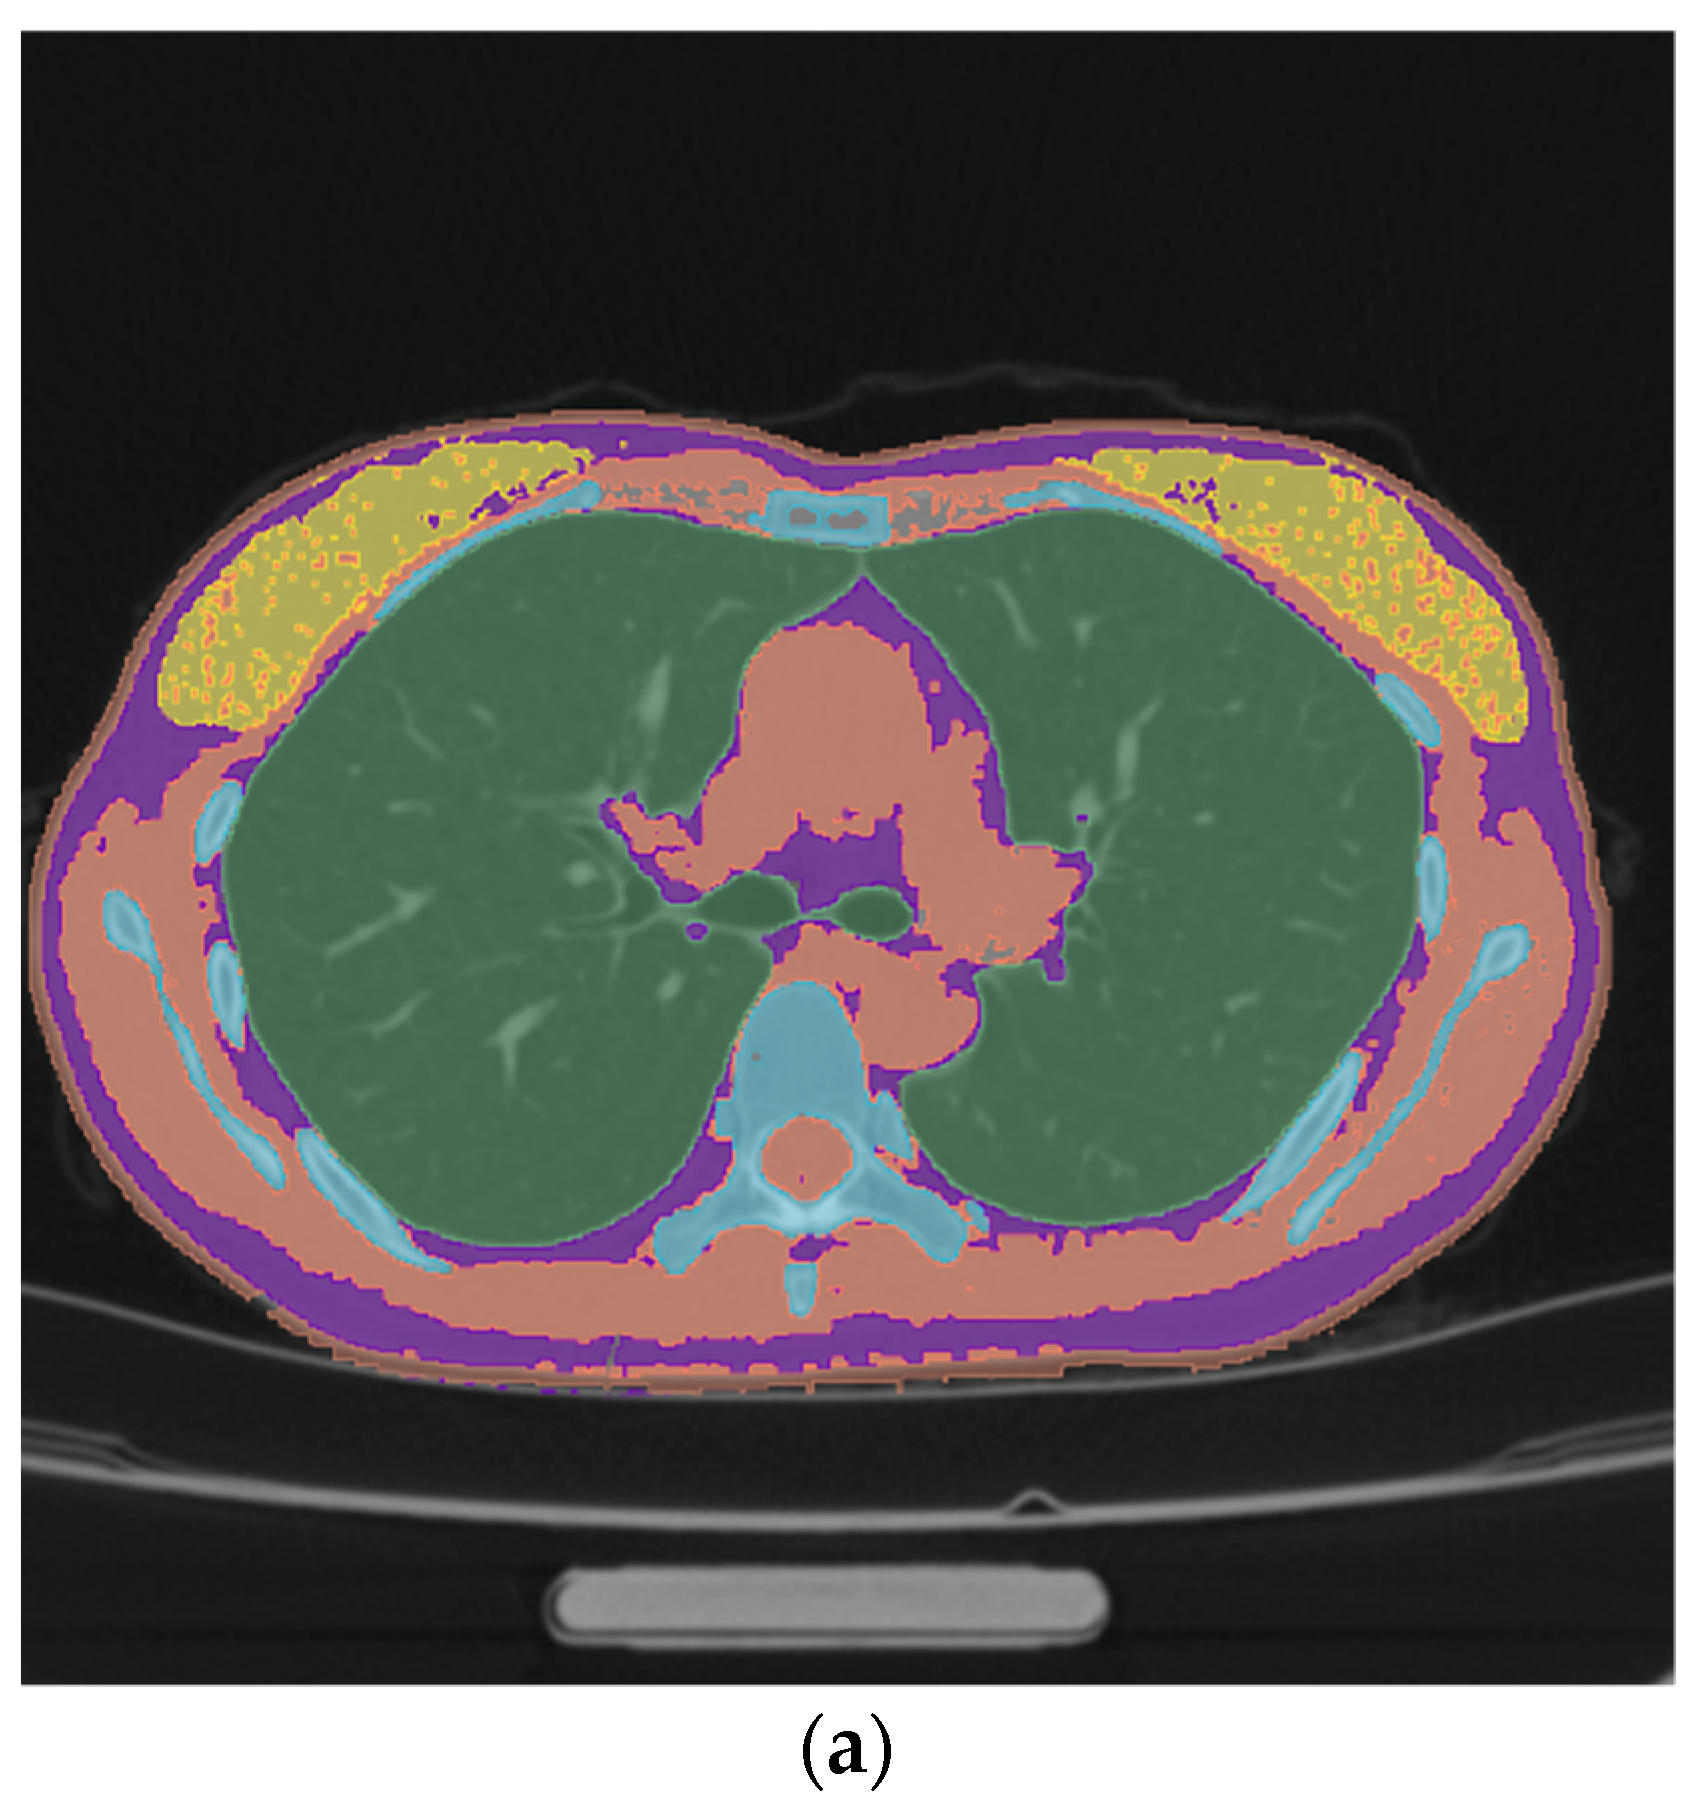
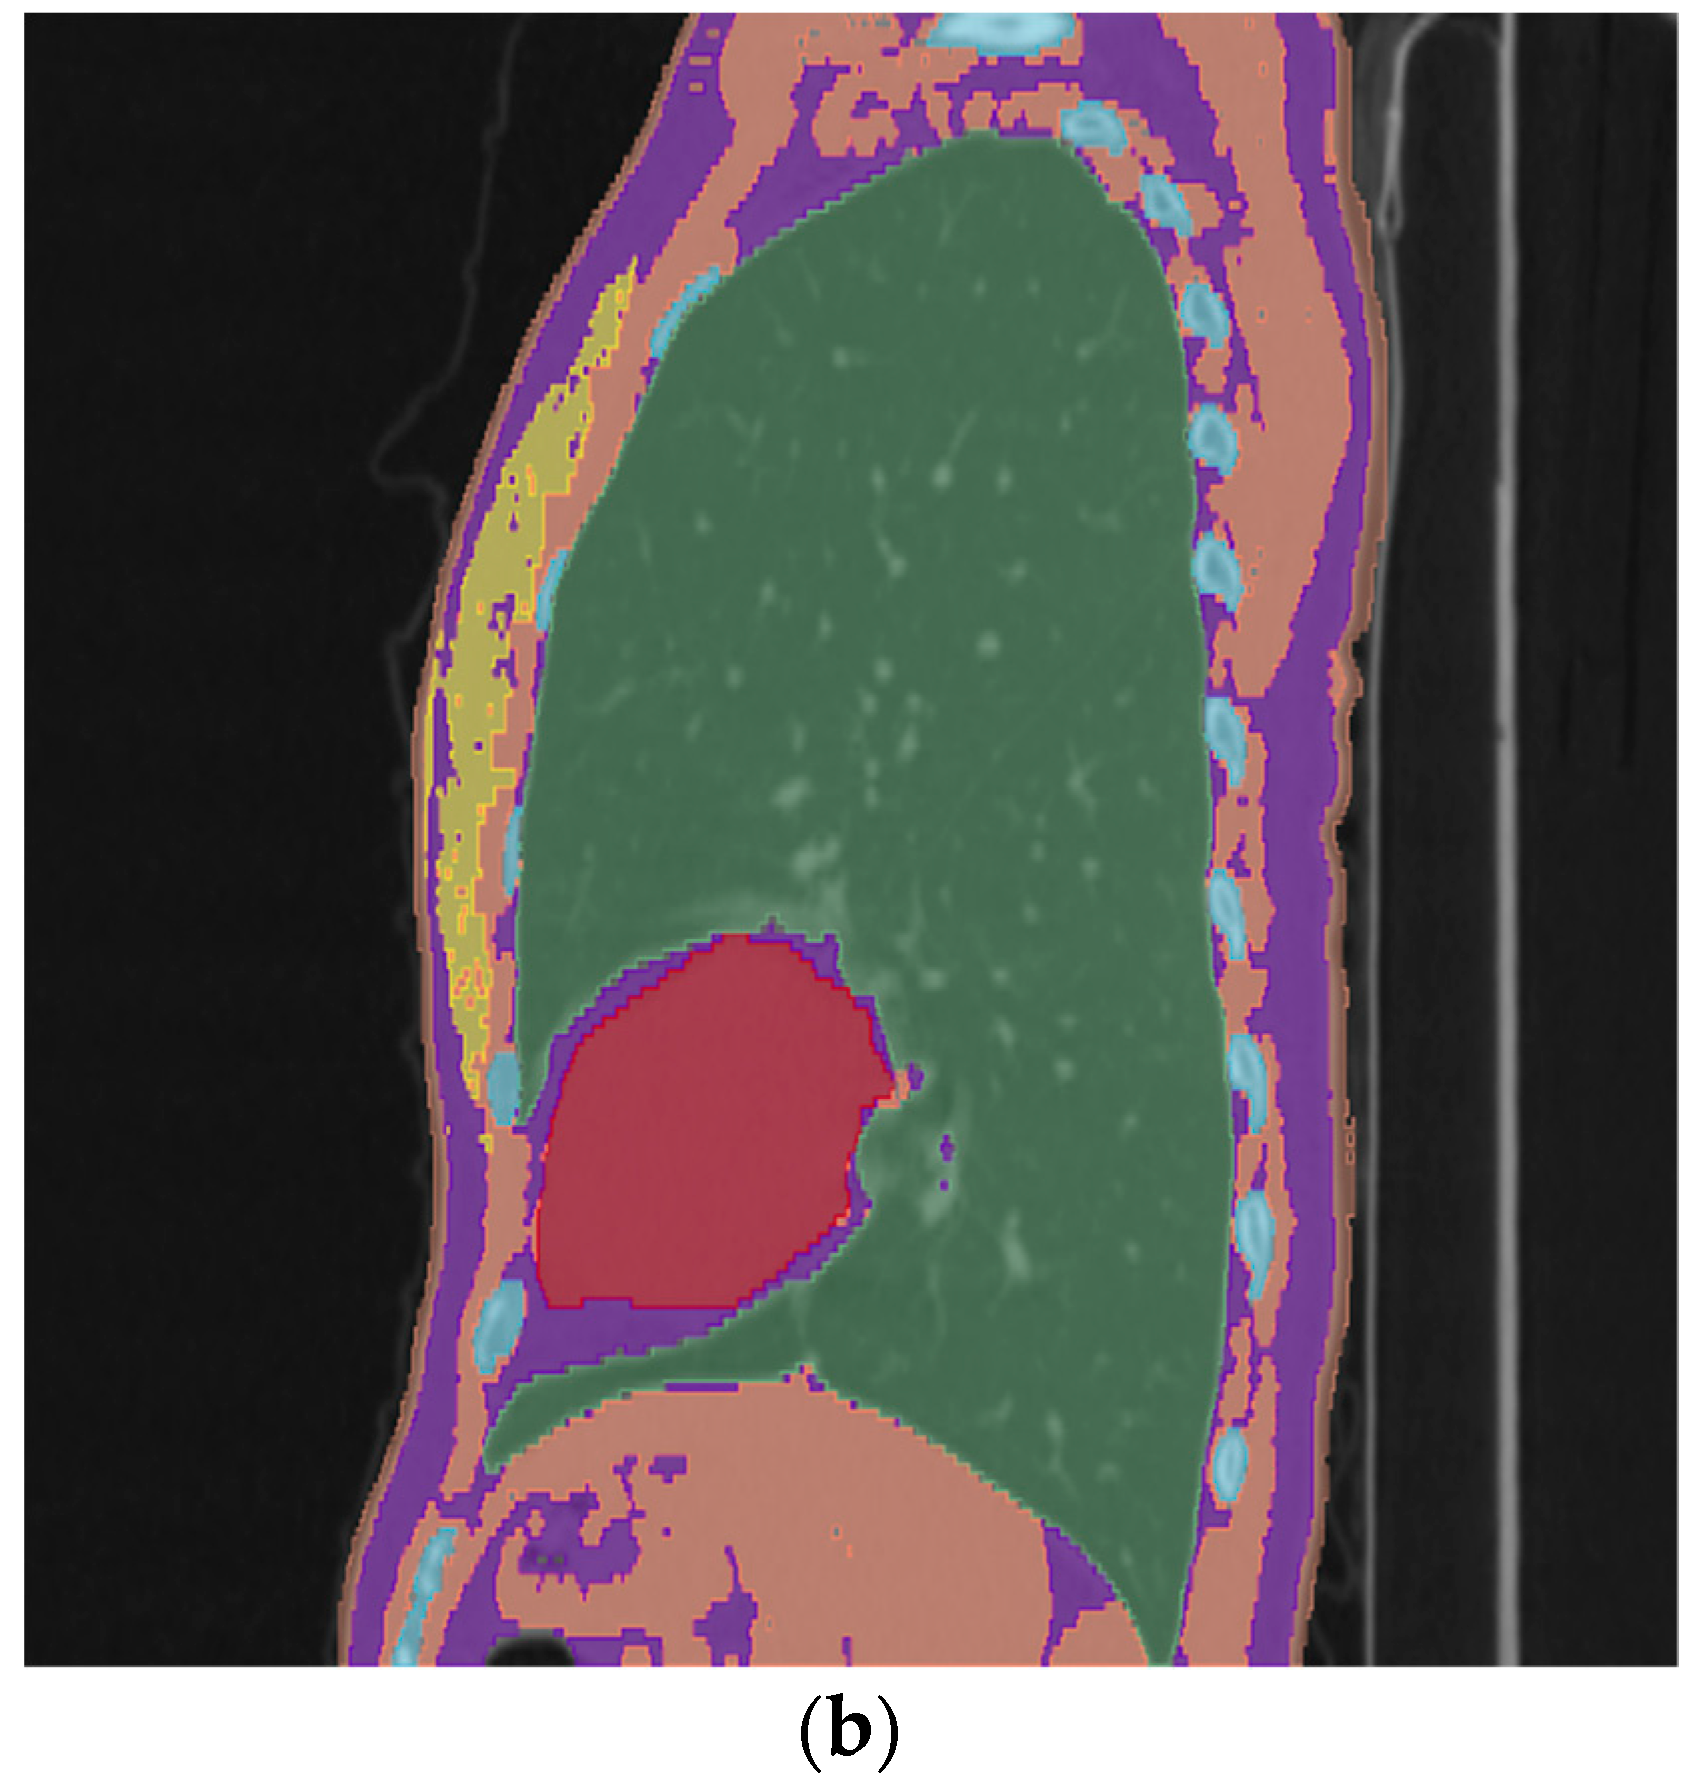
3.1. Voxelized Chest Models of Patients

In this study, a total of 18 chest models for the patients were voxelized. Their WED, organ volumes, and displayed CTDIvol undergoing chest CT examinations are listed in Table 1. As shown in Table 1, the WED, CTDIvol, lung volume, heart volume, and breast volume (glandular breast tissue for both breasts) of females vary significantly, especially for the breast volume. As expected, the CTDIvol generally increases with the WED. Through the linear regression analysis and Pearson correlation analysis, it was found that there was a strong correlation (R2 = 0.88, p < 0.001) between the CTDIvol and the WED; however, the correlations between the lung, heart, or breast volume and the WED were all weak (R2 ≤ 0.15, p > 0.05). The results indicate that it is hard to estimate the volumes of lung, heart, or breast simply by the WED for each person, and it implies that, for a more accurate estimation of the organ volume for each person, the voxelized model is necessary.

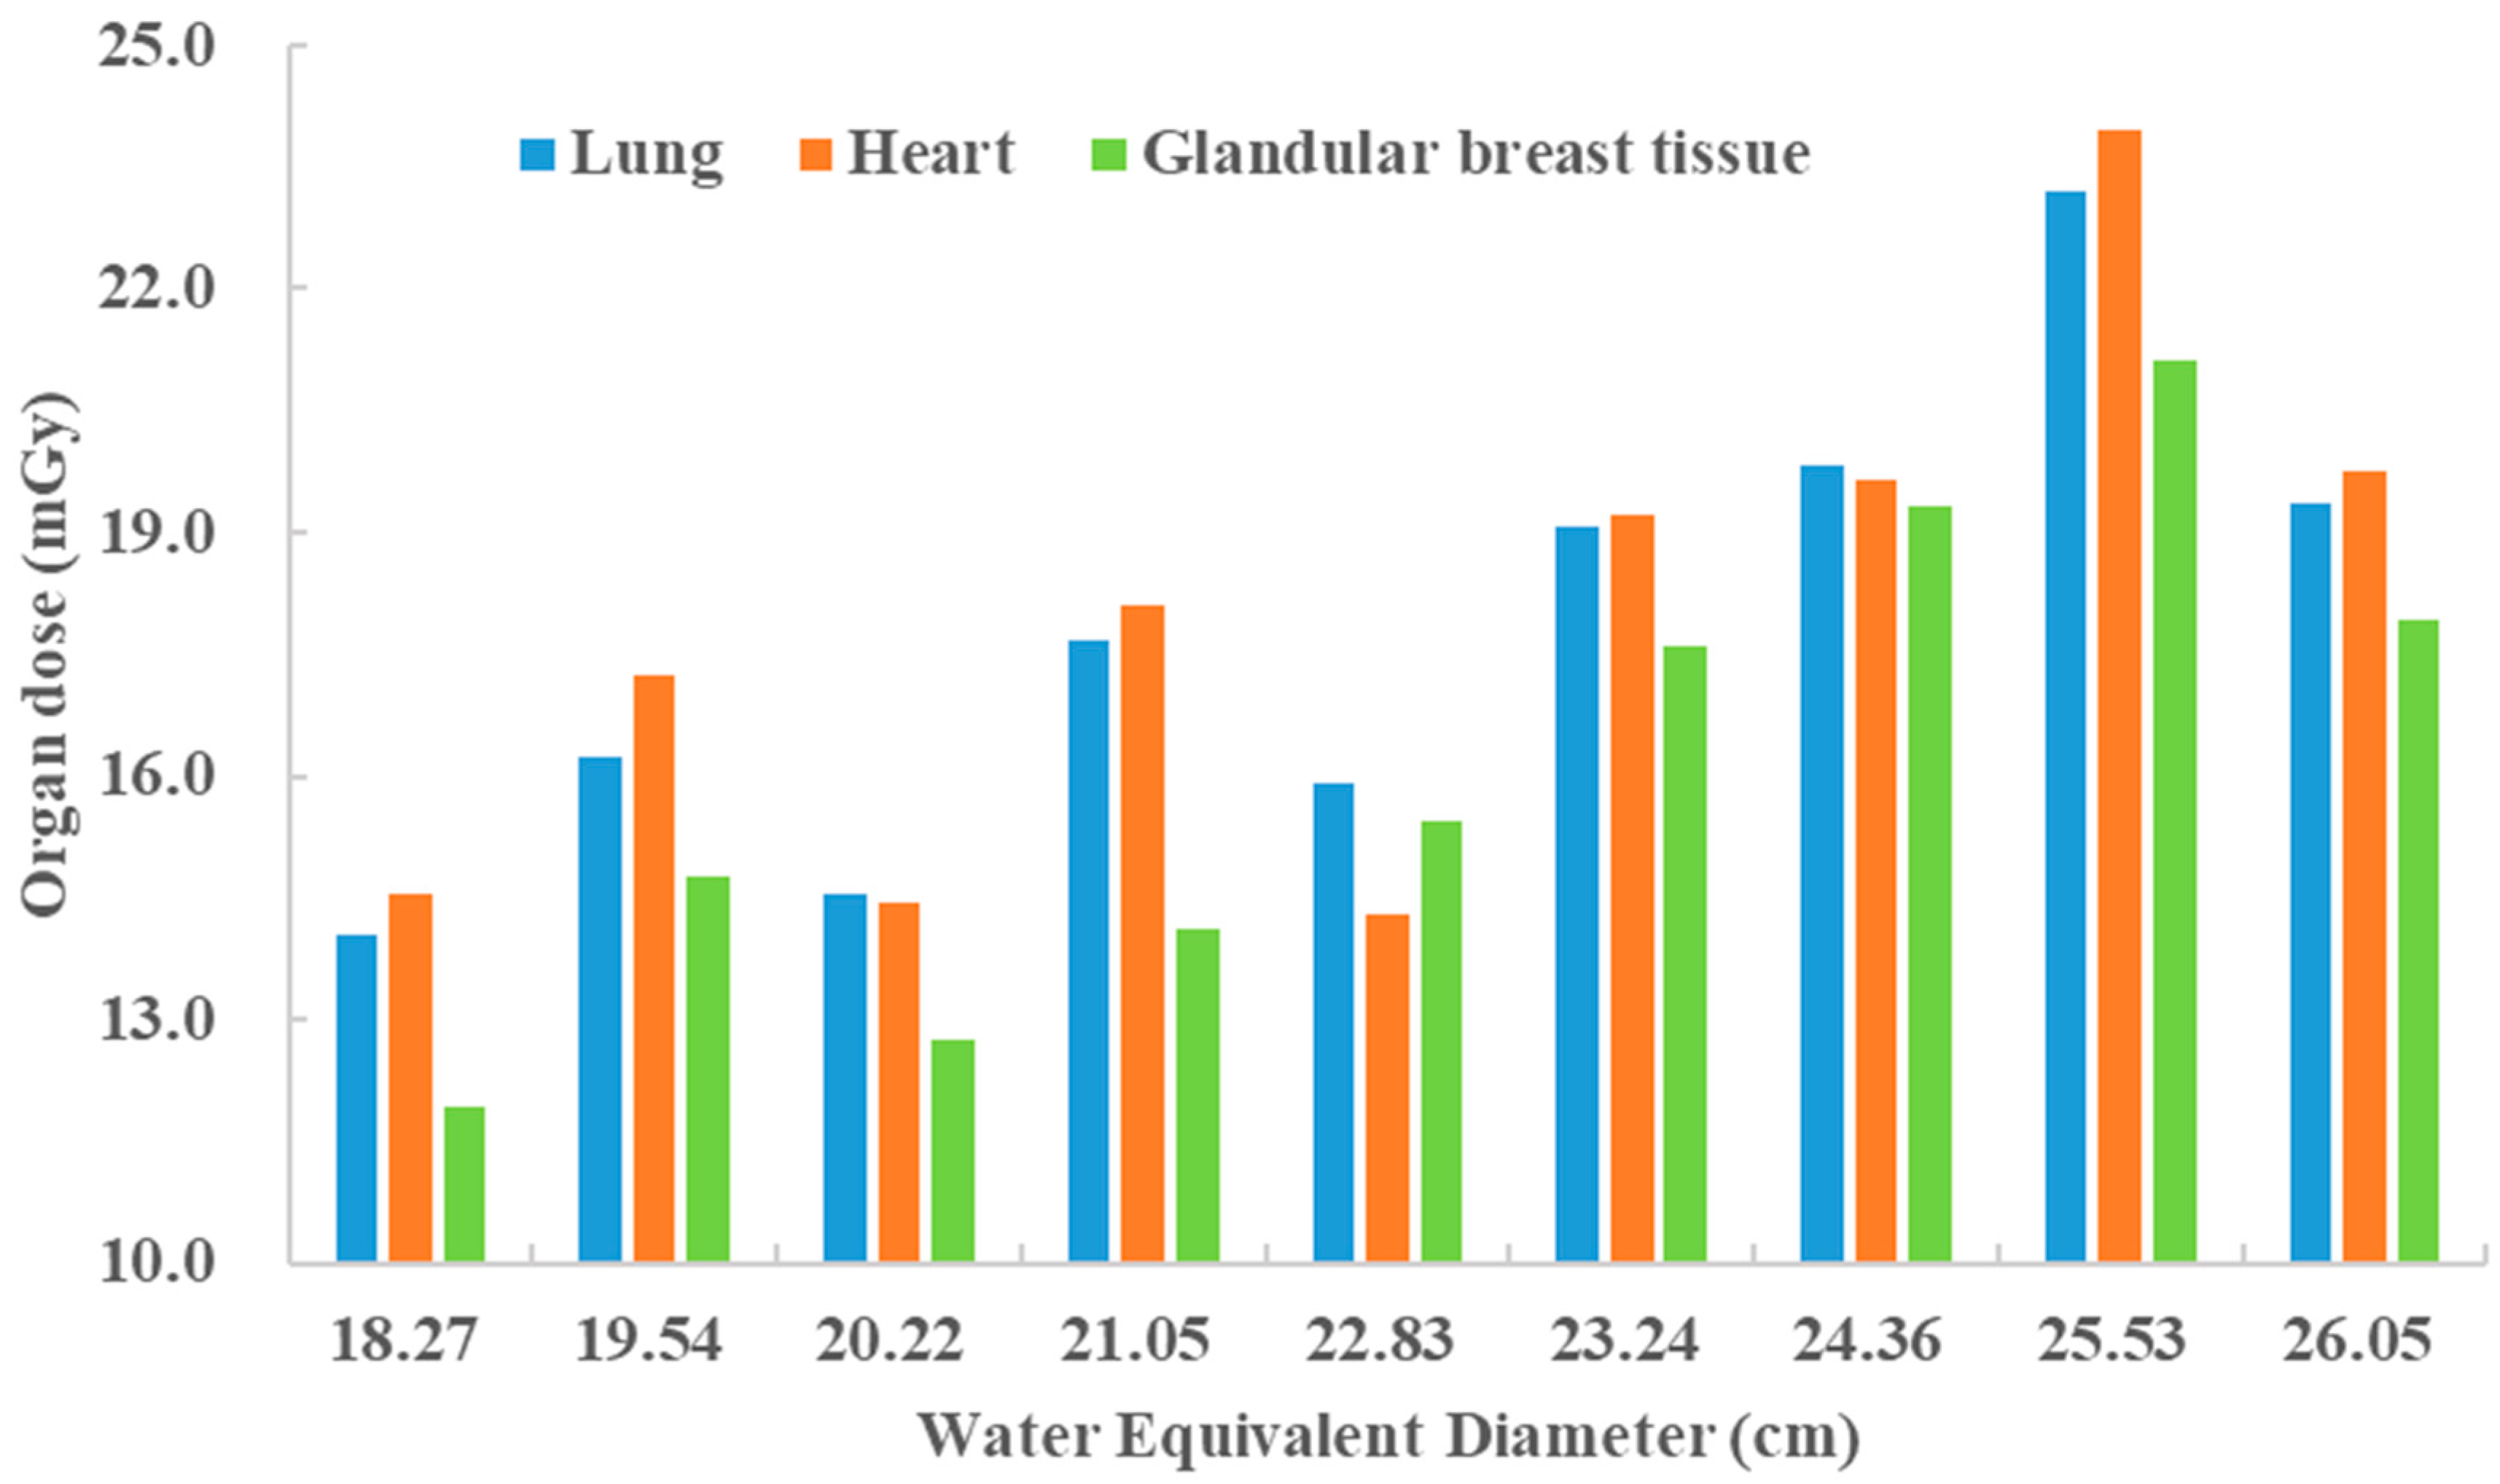
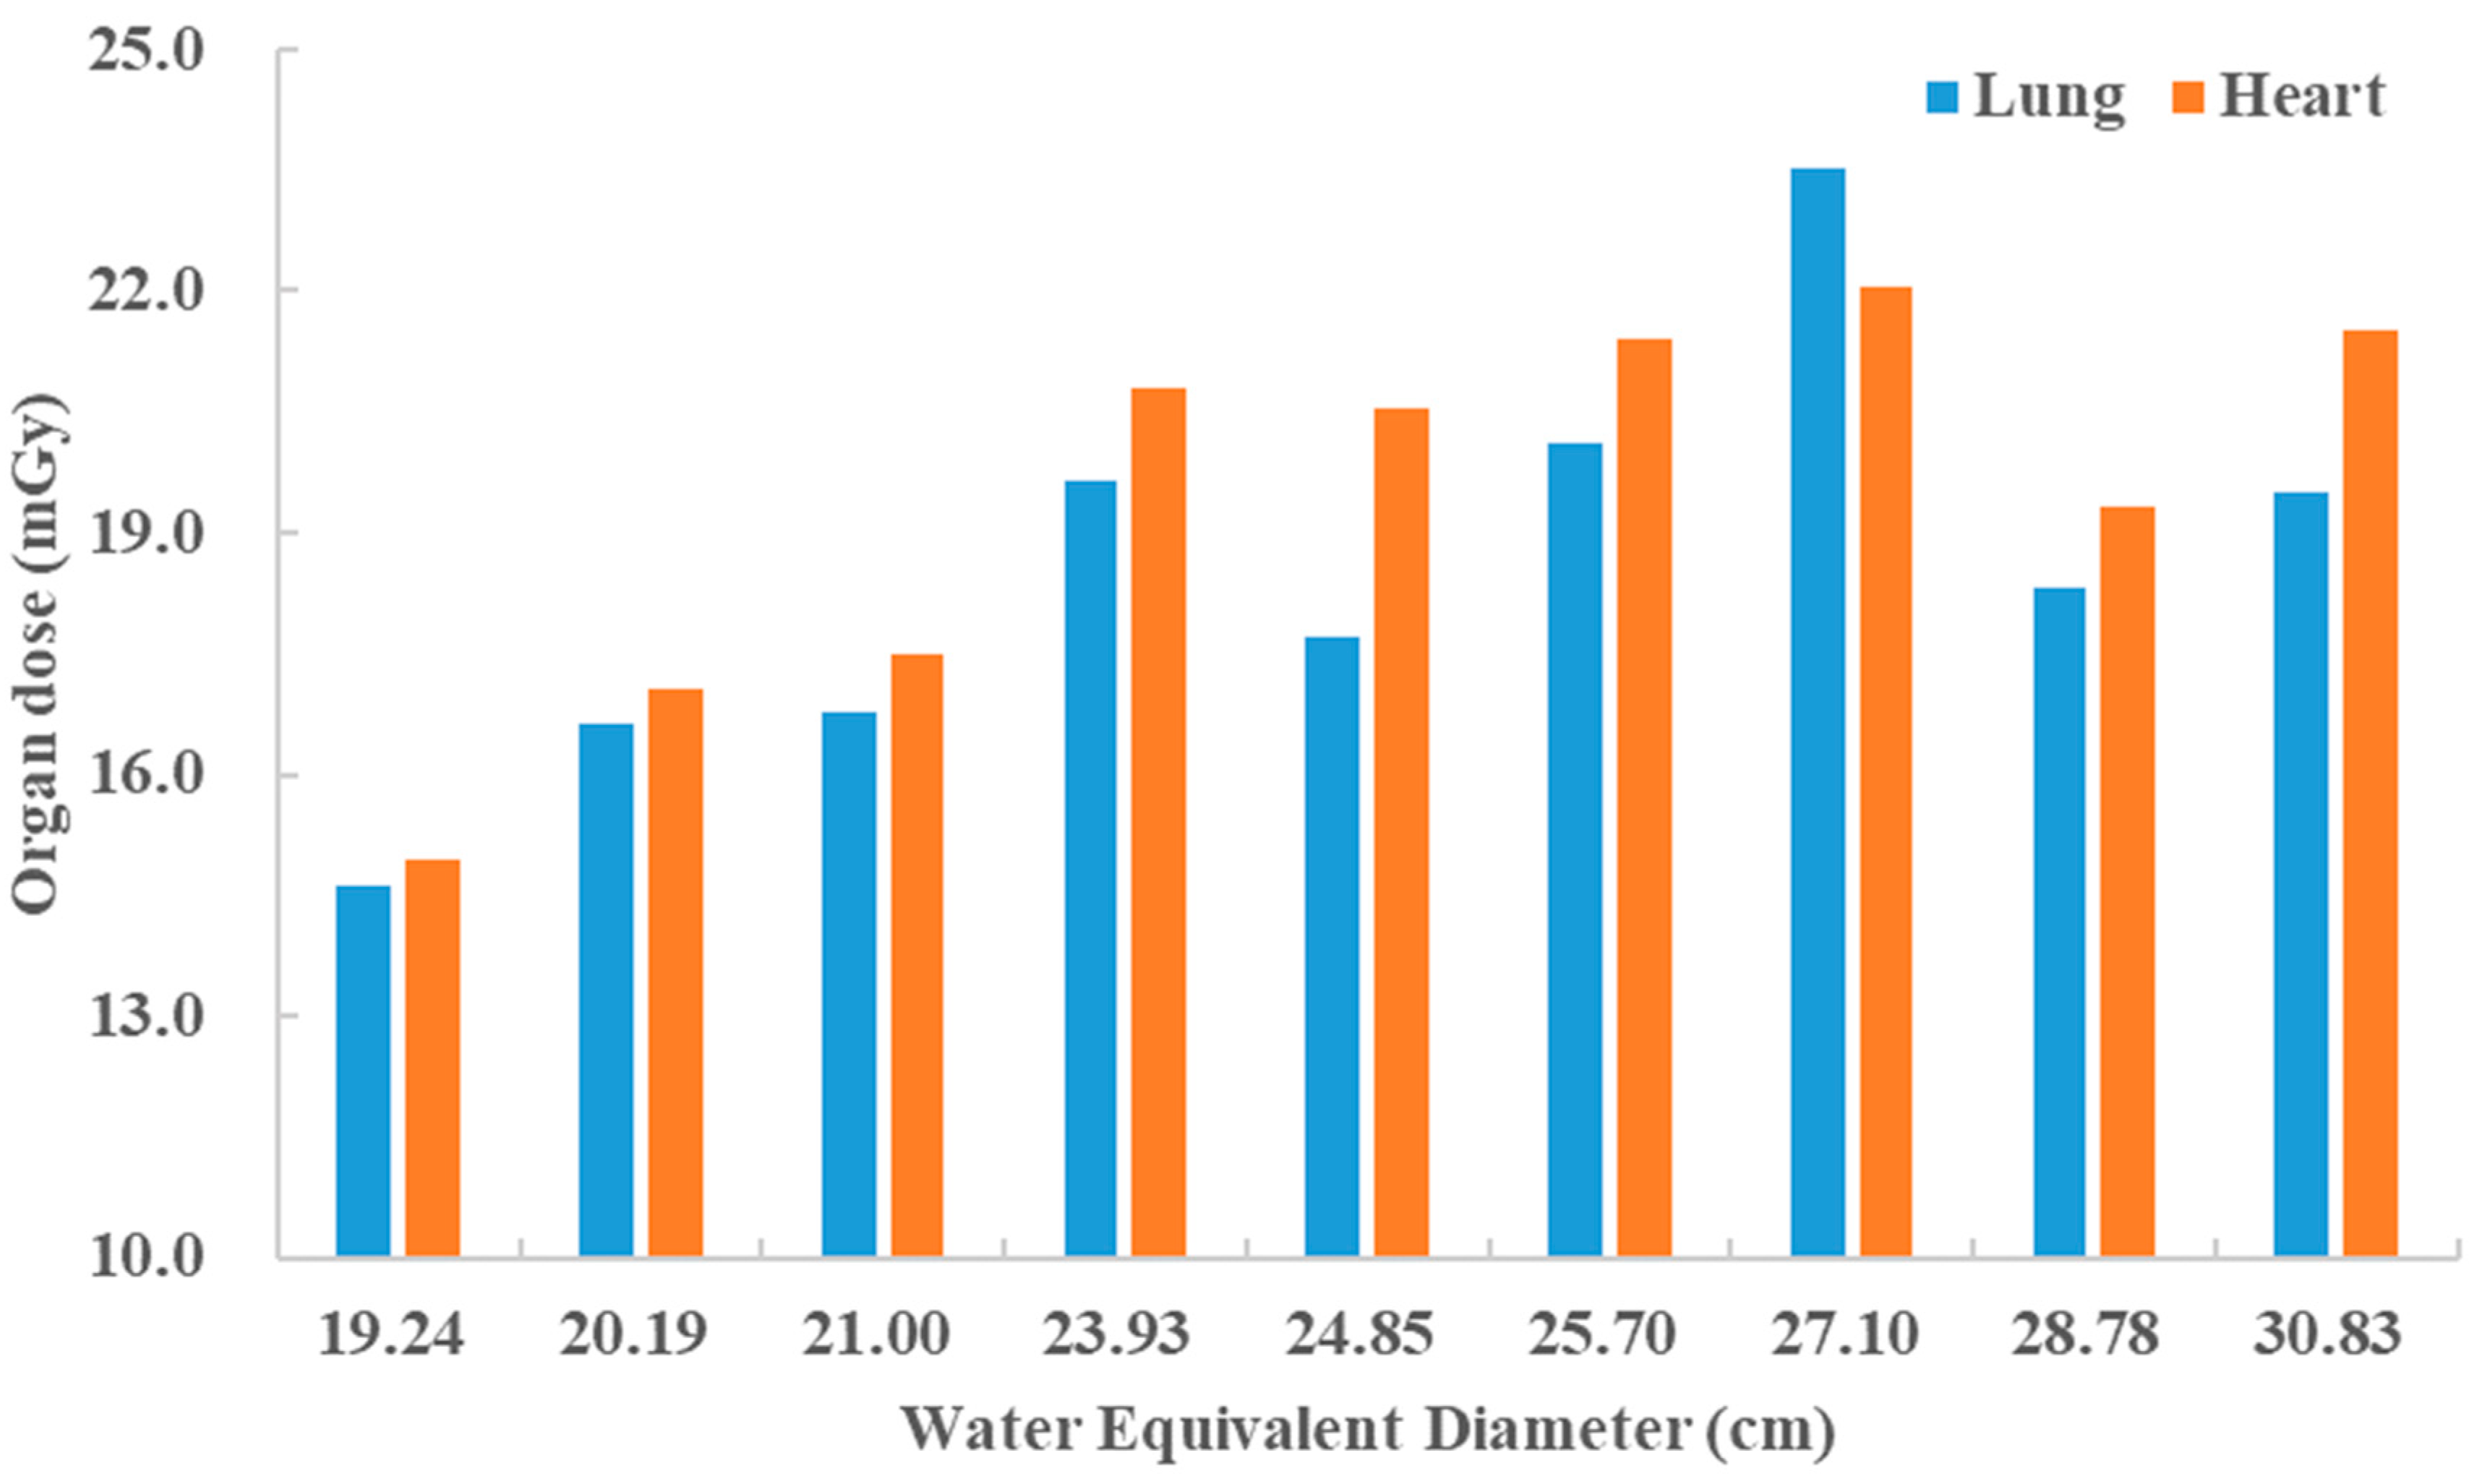
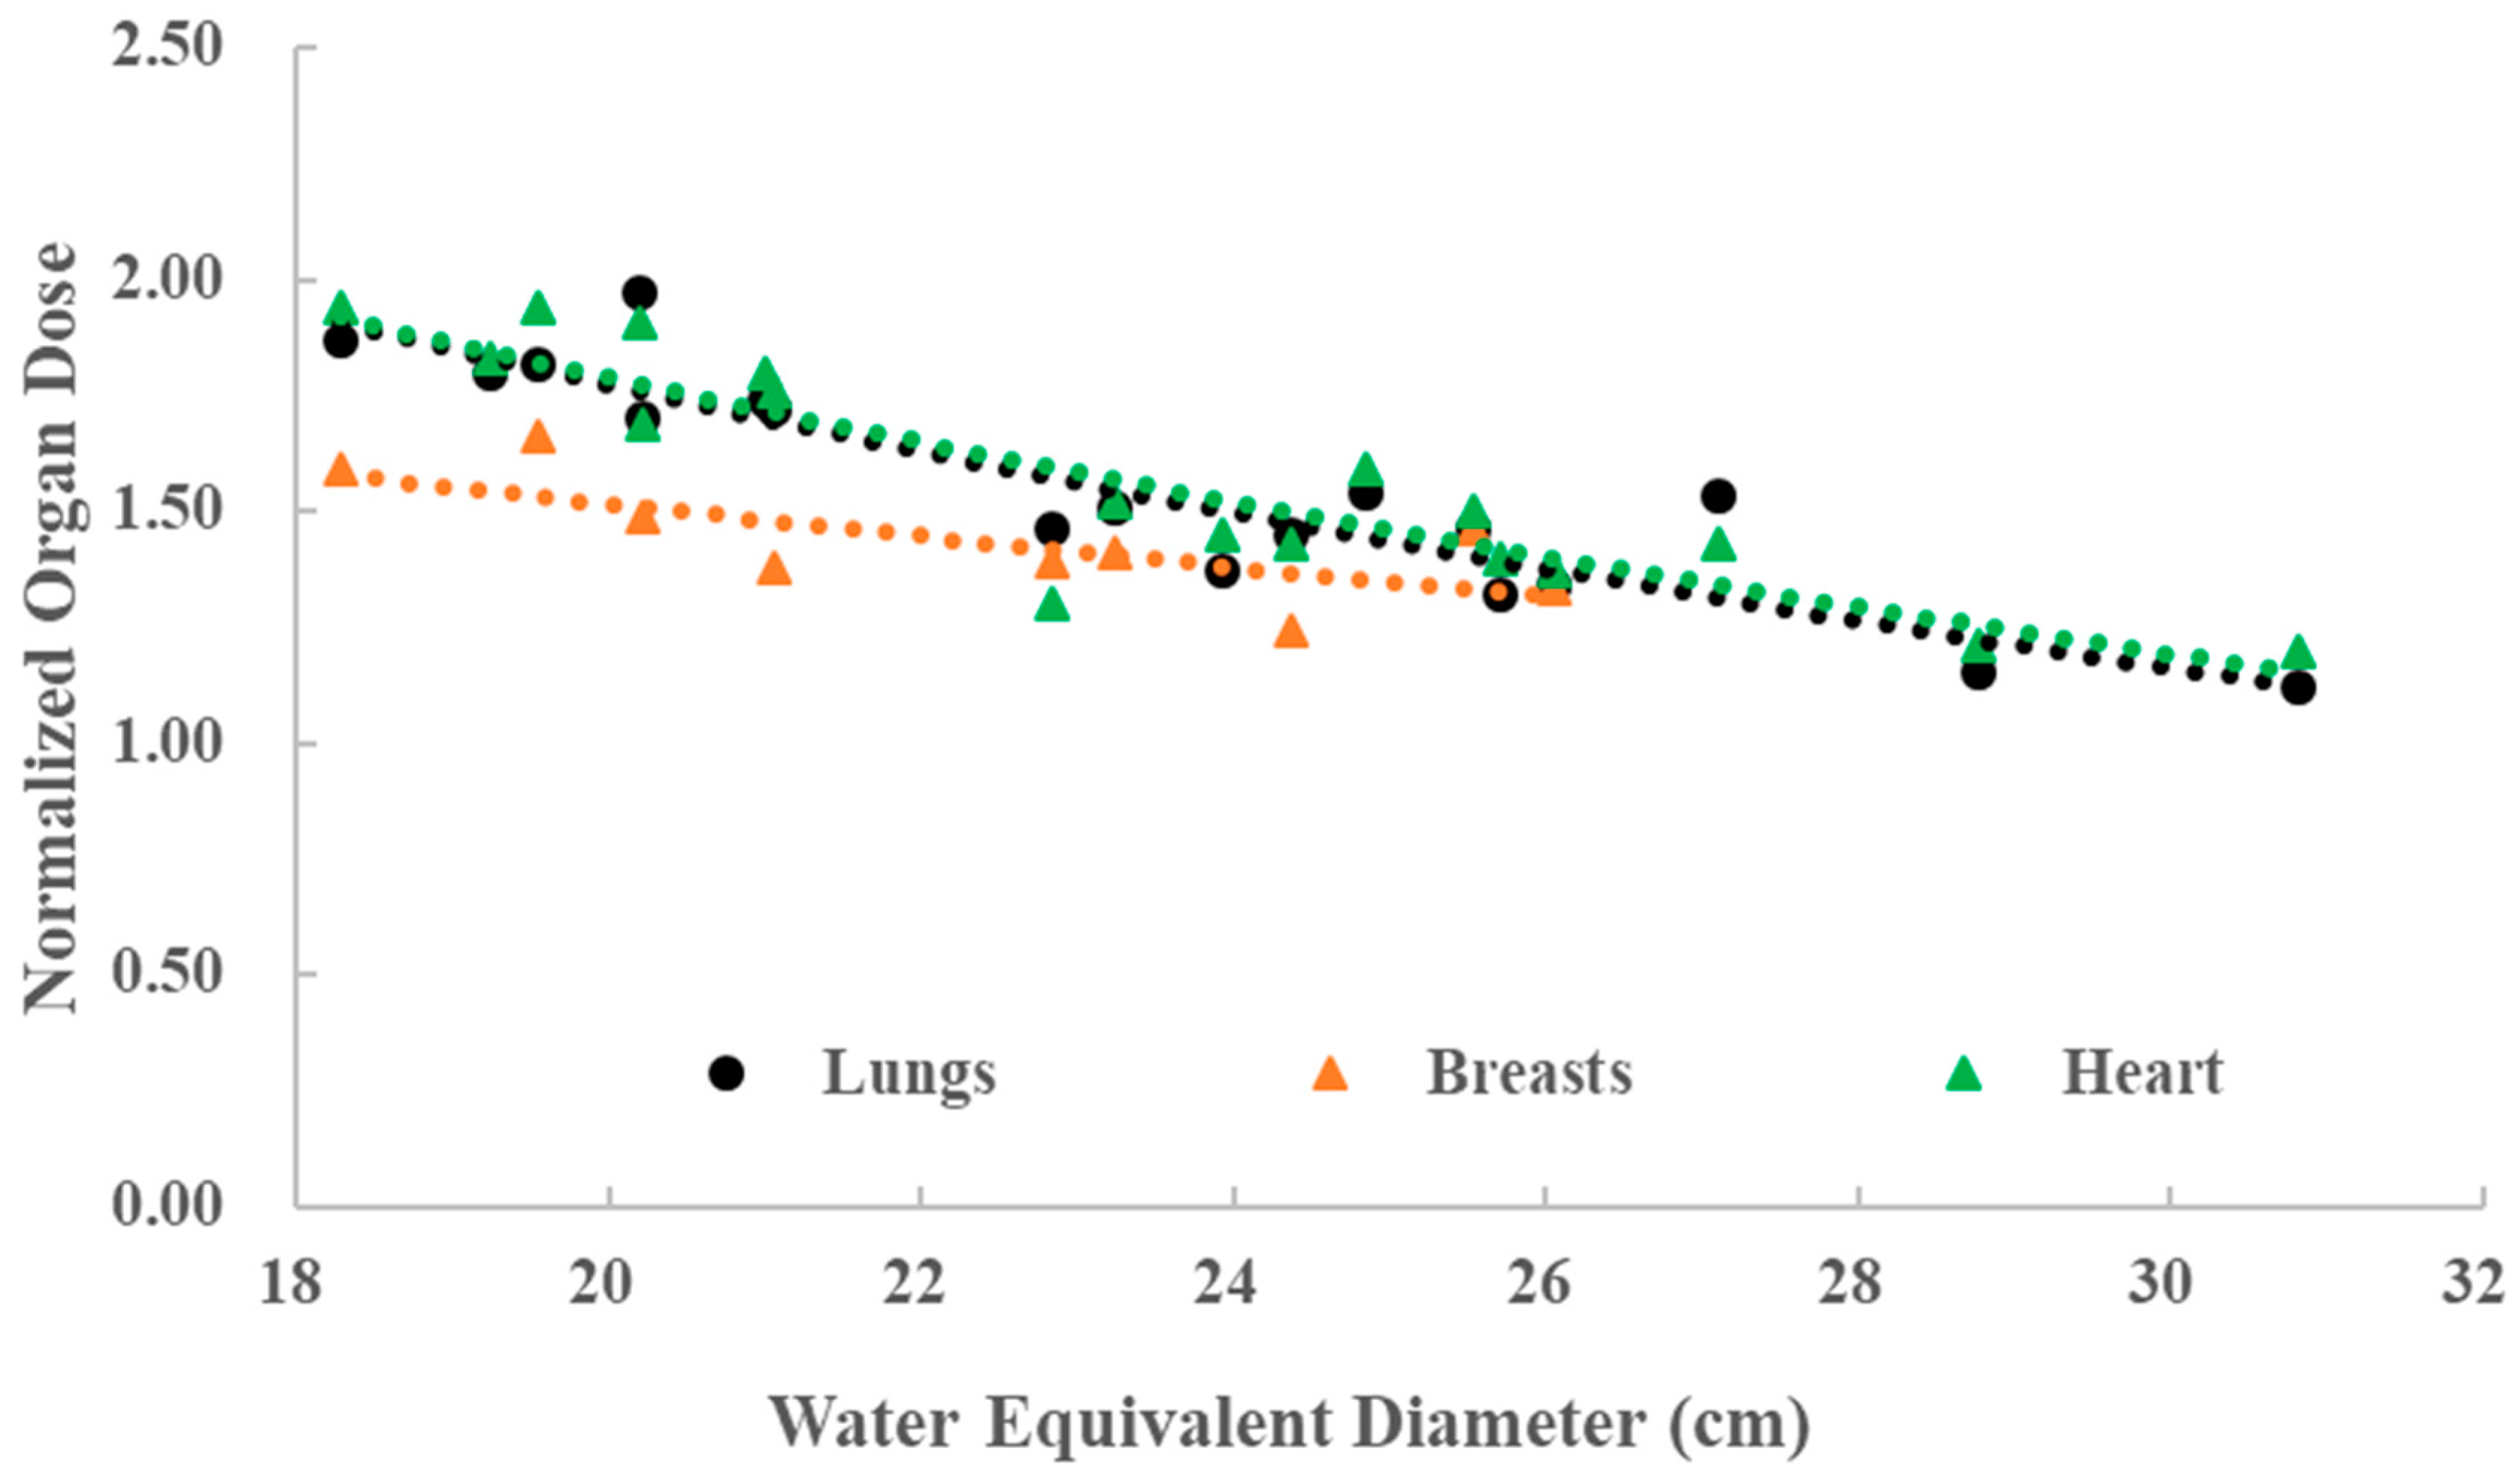
3.2. Simulated Organ Doses

The simulated organ doses and the measured WED for the 9 females are plotted in Figure 2. The lung, heart, and breast doses were 14.04–23.19 mGy, 14.54–23.97 mGy, and 11.92–21.12 mGy, respectively. Moreover, the mean dose of lung, heart, and breast were 18.15 ± 2.69 mGy, 18.68 ± 2.87 mGy, and 16.11 ± 3.08 mGy, respectively. For both men and women, there was no statistical difference between lung dose and heart dose (p > 0.05). However, the breast dose was statistically different from that of the other two organs (p < 0.05). As shown in Figure 2 and Figure 3, the organ doses generally increase with the increase of the WED for both genders (p < 0.05). The phenomenon is consistent with previous research [13]. Through a one-way ANOVA test, it was found that there was no statistical difference in the absolute doses of the three organs for both males and females. However, for individuals, the difference between the breast dose and the lung or heart dose could reach up to 20%.
To test the correlations between the organ dose and organ volume, Pearson correlation analysis was performed in this study. No statistical correlation was found between the organ dose and the organ volume (p > 0.05). This implies that it is possible to roughly estimate the organ dose with the aid of the WED. It was also found that larger patients received higher organ doses than smaller patients, which can be explained, as the tube current increases to compromise the more X-ray attenuation for larger patients by the ATCM.

3.3. Estimation of Organ Doses with CTDIvol and WED

In principle, the organ dose depends on both the radiation output (CTDIvol) and patient size. Previous studies have indicated that the organ doses normalized by the CTDIvol could eliminate the impact of the scanner output [30]. Figure 4 plots the simulated lung, breast, and heart doses normalized by the CTDIvol and the WEDs for the 18 patients in this study. The lung, heart, and breast doses normalized by CTDIvol were 1.48 ± 0.22, 1.54 ± 0.20, and 1.41 ± 0.13, respectively. As shown in Figure 4, the normalized lung, heart, and breast doses significantly decrease with the increase of the WED, while the decrease in the normalized breast dose seems more gradual.
Through the regression analysis, it was also found that all of the three organ doses could be expressed in the form of the same exponential function listed below, and the coefficient of determination (R2) of regression equations are 0.85, 0.81, and 0.57 for the lung, heart, and breast, respectively.
D l u n g = 4.13 × exp ( 0.042 × W E D ) × C T D I v o l
D h e a r t = 4.02 × exp ( 0.041 × W E D ) × C T D I v o l
D b r e a s t s = 2.43 × exp ( 0.024 × W E D ) × C T D I v o l
Based on the above functions, the relative deviations between the estimated organ doses and the simulated ones for the 18 patients are summarized in Table 2. For comparison, the deviations estimated by using the functions built by Abuhaimed et al. [17] and Bostani et al. [15] are also listed in Table 2. The organ doses for comparison in the table from Bostani et al. were calculated using the regional average WED.
As shown in Table 2, for lung, heart, and breast doses, the average deviation of all 18 patients was less than 10.08% when using any of the three functions. It indicates that the function built by Bostani et al. and Abuhaimed et al. using patients from a Western population are suitable for a Chinese population.

4. Discussion

As in other countries, the frequency of CT examinations in China is also increasing with time, and the chest scan accounts the largest proportion [31,32]. The radiation risk has also aroused great concern, especially for the radiosensitive organs, such as breasts and lungs. Therefore, it is necessary to estimate the organ dose undergoing CT examinations as accurately as possible.
As we know, the CTDI is just a simple robust indicator of CT scanner output, and not the patient dose [6]. Even though the CTDIvol can be used to normalize organ doses from fixed tube current CT examinations, it is useless in TCM exams due to varying tube current, which is a function of patient attenuation and thus wholly patient-specific. Therefore, more accurate and practical methods of estimating organ doses in CT exams are still desirable.
Organ doses were proved to be estimated using both CTDIvol and WED with different models [15,17]. In this study, there is also a good exponential fitting relationship between normalized organ doses and the WED. The fitting curves of the heart and lung were similar, while the dose curves of the breast were quite different from them. The results were consistent with that of previous studies [14].
The constant term of the organ dose model should be further studied by ethnicity. Compared with the other estimation model, the new fitting model calculated in this study was more consistent with the MC simulation results for the estimation of breast dose in Chinese patients. Although the dose to deep-seated organs does not vary greatly among different ethnicities, the difference in dose of superficial organs, such as breasts, between different ethnicities cannot be ignored. It might be due to differences in anatomical structure and the characteristics of physique between different populations. Therefore, it is necessary to study the structure of the Chinese breast and compare the differences between different populations. It is also valuable to establish a more accurate estimation model of Chinese organ doses through the retrospective studies of a larger number of patients considering different breast size and tissue composition. In addition to the influence from the patient size, part of the differences in the results may result from the difference of 120 kVp energy spectrum between the different scanners. However, the differences in energy spectrum between different scanners does not significantly affect the dose results [17].
Although it may have the potential to provide a better estimate of organ dose for the Chinese population, this study still has many limitations and requires further exploration and concrete analysis. The developed and tested dose estimation model in this study has the capability to estimate organ dose more accurately for Chinese adults than the existing methods; it is limited to only three fully-irradiated organs and one type of CT examination, and the doses caused by the over-ranging were not investigated. Because the chest CT in this study can only provide a voxelized chest model for each patient, it is not capable of assessing doses to partially or indirectly irradiated organs, nor is it able to estimate an effective dose. Moreover, the patients in this retrospective study were selected from 567 patients in one hospital, but the range of body sizes was not complete. The overall average WED of women is smaller than that of men (p < 0.001). Since this study was a preliminary verification and discussion, the number of the CT scanners and patients were limited. We have considered adding more patients and CT scanners for comparative analysis in the future. Since we carried out a retrospective study, another limitation of the study was that it refers to a single CT scanner model used at a specific kVp. Other kVp settings available in the CT scanners will be studied and discussed in the future.

5. Conclusions

This study investigated patient-specific organ doses from chest CT scans with ATCM, and further discussed the effect of patient size on organ dose. It can be concluded that patient organ doses are positively related to the WED, while, after CTDIvol normalization, the quotient decreases with an increasing WED. Organ doses for chest CT examination in different populations under different CT models can be estimated by a specific exponential model. The results of our study could be used to assist physicists and doctors in evaluating the organ dose of patients after chest CT examination. This might help the operators to further optimize the parameter settings of CT protocol, so as to achieve reasonable patient dose reduction. In addition, a larger number of subjects need to be repeated to test for the validity of the dose-predictive relationships in the future.

Author Contributions

Conceptualization, H.L. and Y.Y.; methodology, H.L. and Y.Y.; software, T.X.; validation, W.Z., H.L. and Y.Y.; formal analysis, Y.Y.; investigation, Y.Y.; resources, H.L.; data curation, Y.Z. and C.W.; writing—original draft preparation, Y.Y.; writing—review and editing, W.Z., H.L., T.X. and Y.Y.; visualization, Y.Z.; supervision, W.Z. and H.L.; project administration, W.Z. and H.L.; funding acquisition, H.L. All authors have read and agreed to the published version of the manuscript.

Funding

National Natural Science Foundation of China: 12075064; National key R&D Program of China: 2019YFC0117304.

Institutional Review Board Statement

Ethical review and approval were waived for this study, since this research is a retrospective study.

Informed Consent Statement

Informed consent was obtained from all subjects involved in the study.

Data Availability Statement

Supporting data includes CT scan parameters of each slice and raw data generated at the MC simulation. All of the data supporting the findings of the presented study are available from the corresponding authors on reasonable request.

Conflicts of Interest

The authors declare no conflict of interest.

References

  1. International Commission on Radiological Protection. Annals of the ICRP-Publication 102-Managing Patient Dose in Multi-Detector Computed Tomography (MDCT); ELSEVIER: Ottawa, ON, Canada, 2007; Volume 37. [Google Scholar]
  2. Shuryak, I.; Lubin, J.H.; Brenner, D.J. Potential for adult-based epidemiological studies to characterize overall cancer risks associated with a lifetime of CT scans. Radiat. Res. 2014, 181, 584–591. [Google Scholar] [CrossRef] [PubMed] [Green Version]
  3. Brenner, D.J. What we know and what we don’t know about cancer risks associated with radiation doses from radiological imaging. Br. J. Radiol. 2014, 87, 20130629. [Google Scholar] [CrossRef] [PubMed]
  4. United Nations Scientific Committee on the Effects of Atomic Radiation. UNSCEAR 2019 Report: Sources and Effects of Ionizing Radiation. Report to the General Assembly with Scientific Annexes; United Nations: New York, NY, USA, 2020. [Google Scholar]
  5. Brenner, D.J.; Hall, E.J. Computed tomography—An increasing source of radiation exposure. N. Engl. J. Med. 2007, 357, 2277–2284. [Google Scholar] [CrossRef] [PubMed] [Green Version]
  6. McCollough, C.H.; Leng, S.; Yu, L.; Cody, D.D.; Boone, J.M.; McNitt-Gray, M.F. CT dose index and patient dose: They are not the same thing. Radiology 2011, 259, 311–316. [Google Scholar] [CrossRef] [Green Version]
  7. American Association of Physicists in Medicine. Size-Specific Dose Estimates (SSDE) in Pediatric and Adult Body CT; Report of AAPM task group 204; American Association of Physicists in Medicine: College Park, MD, USA, 2011. [Google Scholar]
  8. International Electrotechnical Commission. Methods for Calculating Size Specific Dose Estimates (SSDE) on Computed Tomography; IEC 62985; International Electrotechnical Commission: Geneva, Switzerland, 2019. [Google Scholar]
  9. International Commission on Radiological Protection. Annals of the ICRP-Publication 110-Adult Reference Computational Phantoms; ELSEVIER: Ottawa, ON, Canada, 2009. [Google Scholar]
  10. Ding, A.; Gao, Y.; Liu, H.; Caracappa, P.F.; Long, D.J.; Bolch, W.E.; Liu, B.; Xu, X.G. VirtualDose: A software for reporting organ doses from CT for adult and pediatric patients. Phys. Med. Biol. 2015, 60, 5601–5625. [Google Scholar] [CrossRef] [Green Version]
  11. Lee, C.; Kim, K.P.; Bolch, W.E.; Moroz, B.E.; Folio, L. NCICT: A computational solution to estimate organ doses for pediatric and adult patients undergoing CT scans. J. Radiol. Prot. 2015, 35, 891–909. [Google Scholar] [CrossRef]
  12. Abadi, E.; Harrawood, B.; Sharma, S.; Kapadia, A.; Segars, W.P.; Samei, E. DukeSim: A realistic, rapid, and scanner-specific simulation framework in computed tomography. IEEE Trans. Med. Imaging 2019, 38, 1457–1465. [Google Scholar] [CrossRef]
  13. Angel, E.; Yaghmai, N.; Jude, C.M.; DeMarco, J.J.; Cagnon, C.H.; Goldin, J.G.; McCollough, C.H.; Primak, A.N.; Cody, D.D.; Stevens, D.M.; et al. Dose to radiosensitive organs during routine chest CT: Effects of tube current modulation. AJR Am. J. Roentgenol. 2009, 193, 1340–1345. [Google Scholar] [CrossRef] [Green Version]
  14. Khatonabadi, M.; Kim, H.J.; Lu, P.; McMillan, K.L.; Cagnon, C.H.; DeMarco, J.J.; McNitt-Gray, M.F. The feasibility of a regional CTDIvol to estimate organ dose from tube current modulated CT exams. Med. Phys. 2013, 40, 051903. [Google Scholar] [CrossRef] [Green Version]
  15. Tian, X.; Li, X.; Segars, W.P.; Paulson, E.K.; Frush, D.P.; Samei, E. Pediatric chest and abdominopelvic CT: Organ dose estimation based on 42 patient models. Radiology 2014, 270, 535–547. [Google Scholar] [CrossRef]
  16. Bostani, M.; McMillan, K.; Lu, P.; Kim, H.J.; Cagnon, C.H.; DeMarco, J.J.; McNitt-Gray, M.F. Attenuation-based size metric for estimating organ dose to patients undergoing tube current modulated CT exams. Med. Phys. 2015, 42, 958–968. [Google Scholar] [CrossRef] [PubMed]
  17. Bostani, M.; McMillan, K.; Lu, P.; Kim, G.H.; Cody, D.; Arbique, G.; Greenberg, S.B.; DeMarco, J.J.; Cagnon, C.H.; McNitt-Gray, M.F. Estimating organ doses from tube current modulated CT examinations using a generalized linear model. Med. Phys. 2017, 44, 1500–1513. [Google Scholar] [CrossRef] [PubMed]
  18. Abuhaimed, A.; Martin, C.J. Assessment of organ doses for CT patients based on x-ray attenuation using water equivalent diameter. Radiat. Phys. Chem. 2021, 181, e109332. [Google Scholar] [CrossRef]
  19. McMillan, K.; Bostani, M.; Cagnon, C.H.; Yu, L.; Leng, S.; McCollough, C.H.; McNitt-Gray, M.F. Estimating patient dose from CT exams that use automatic exposure control: Development and validation of methods to accurately estimate tube current values. Med. Phys. 2017, 44, 4262–4275. [Google Scholar] [CrossRef]
  20. American Association of Physicists in Medicine. Use of Water Equivalent Diameter for Calculating Patient Size and Size-Specific Dose Estimates (SSDE) in CT; Report of AAPM task group 220; American Association of Physicists in Medicine: College Park, MD, USA, 2014. [Google Scholar]
  21. International Commission on Radiological Protection. Annals of the ICRP-Publication 89-Basic Anatomical and Physiological Data for Use in Radiological Protection; International Commission on Radiological Protection: Ottawa, ON, Canada, 2003. [Google Scholar]
  22. National Standard of the People’s Republic of China (NSPRC). Reference Individuals for Use in Radiation Protection: Part 1 Physique Parameters; Chinese Standard GBZ/T200.1; People’s Medical Publishing House Co., Ltd.: Beijing, China, 2007.
  23. National Standard of the People’s Republic of China (NSPRC). Reference Individuals for Use in Radiation Protection: Part 2 Masses of Main Organs and Tissues; Chinese Standard GBZ/T200.2; People’s Medical Publishing House Co., Ltd.: Beijing, China, 2007.
  24. Kalra, M.; Maher, M.; Toth, T.; Schmidt, B.; Westerman, B.; Morgan, H.; Saini, S. Techniques and applications of automatic tube current modulation for CT. Radiology 2004, 233, 549–657. [Google Scholar] [CrossRef]
  25. Zheng, S.; Zhang, Y.; Huang, L.; Zheng, Q.; Liu, P.; Guo, H.; Zou, T.; Yan, J. Investigation and analysis of the application frequency of medical X-CT and the dose in Fujian Province in 2016. Chin. J. Radiol. Health 2018, 6, 543–546. [Google Scholar] [CrossRef]
  26. Smith-Bindman, R.; Wang, Y.; Chu, P.; Chung, R.; Einstein, A.J.; Balcombe, J.; Cocker, M.; Das, M.; Delman, B.N.; Flynn, M.; et al. International variation in radiation dose for computed tomography examinations: Prospective cohort study. BMJ 2019, 364, k4931. [Google Scholar] [CrossRef] [Green Version]
  27. Huang, Y. Study on the Method for Estimating Organ Dose from X-CT Scans with Automatic Tube Current Modulation. Master’s Thesis, Radiation Medicine, Fudan University, Shanghai, China, 2018. [Google Scholar]
  28. Yang, Y.; Zhuo, W.; Chen, B.; Lu, S.; Zhou, P.; Ren, W.; Liu, H. A new phantom developed to test the ATCM performance of chest CT scanners. J. Radiol. Prot. 2021, 41, 349. [Google Scholar] [CrossRef]
  29. Punnoose, J.; Xu, J.; Sisniega, A.; Zbijewski, W.; Siewerdsen, J. Technical Note:Spektr 3.0 A computational tool for X-Ray spectrum modeling and analysis. Med. Phys. 2016, 43, 4711–4717. [Google Scholar] [CrossRef]
  30. Turner, A.C.; Zankl, M.; Demarco, J.J.; Cagnon, C.H.; Zhang, D.; Angel, E.; Cody, D.D.; Stevens, D.M.; McCollough, C.H.; McNitt-Gray, M.F. The feasibility of a scanner-independent technique to estimate organ dose from MDCT scans: Using CTDIvol to account for differences between scanners. Med. Phys. 2010, 37, 1816–1825. [Google Scholar] [CrossRef] [Green Version]
  31. Su, Y.; Lu, G.; Xiao, G.; Du, X.; Sun, Q. The study and prediction of the total number of radio-diagnosis and radiotherapy examination in hospitals. Chin. J. Radiol. Health 2017, 26, 302–305. [Google Scholar]
  32. Yao, J.; Gao, L.; Qian, A.; Wang, B.; Jiang, Z. Survey on frequency of medical X-ray diagnosis in Shanghai. Chin. J. Radiol. Med. Prot. 2019, 39, 370–375. [Google Scholar] [CrossRef]
Figure 1. An example within the chest CT image sequences used to create voxelized patient model, where different colors represent the heart wall, muscle, bone, fat, and skin segmented by the 3D Slicer software: (a,b) are the transverse and sagittal axial image of the patient, respectively.
Applsci 11 08961 g001aApplsci 11 08961 g001b
Figure 2. Organ doses simulated by Monte Carlo methods as a function of WED for female.
Applsci 11 08961 g002
Figure 3. Organ doses simulated by Monte Carlo methods as a function of WED for male.
Applsci 11 08961 g003
Figure 4. Normalized lung, breast, and heart doses and the WED for 18 patients.
Applsci 11 08961 g004
Table 1. The WED, CTDIvol, and organ volumes for 18 patient models used in this study.
Patient IDAgeGenderWED
(cm)
CTDIvol
(mGy)
Lung Volume
(cm3)
Heart Volume
(cm3)
Glandular Tissue Volume of both Breasts (cm3)
132F18.277.63 3461 609 233
226F19.548.89 3588 546 28
369F20.2210.21 4411 590 73
444F21.058.92 3029 632 68
564F22.8312.63 4200 659 72
661F23.2411.34 3381 651 42
735F24.3613.84 4134 656 188
870F25.5316.28 4449 744 77
940F26.0514.46 4023 636 303
1026M19.248.76 4857 488 ND (a)
1125M20.1910.50 7746 760 ND (a)
1244M21.0010.30 5996 753 ND (a)
1344M23.9315.46 4560 866 ND (a)
1478M24.8514.50 5283 810 ND (a)
1534M25.7015.38 4334 754 ND (a)
1649M27.1014.18 2590 868 ND (a)
1739M28.7816.05 4319 829 ND (a)
1833M30.8318.31 3934 842 ND (a)
Average45 ± 17 23.48 ± 3.50 (b)12.65 ± 3.154350 ± 1161705 ± 113120 ± 96
ICRP 89 --M----4615.38807.69--
--F----3653.85596.15196.08
(a): The breast tissue for males was not measured; (b): Ave. ± 1SD.
Table 2. Relative deviations * between the estimated organ doses and the simulation results for the 18 patients.
OrganBostani et al.Abuhaimed et al.This Study
RangeAverageRangeAverageRangeAverage
Lung (−13.50–17.40) %6.54%(−13.70–17.92) %7.48%(−13.54–16.56) % 5.34%
Heart ----(−7.18–33.20) %9.74%(−7.65–25.09) %2.13%
Breast(−18.15–25.36) %−10.08%----(−8.54–5.90) %0.93%
* Relative deviations = (MC simulation results − estimated organ doses)/MC simulation results × 100%.
Publisher’s Note: MDPI stays neutral with regard to jurisdictional claims in published maps and institutional affiliations.

