Article

Differences between Championships of Football 5-a-Side for Blind People

Research Group in Optimization of Training and Performance Sports, Faculty of Sport Sciences, University of Extremadura, 10005 Cáceres, Spain
*
Author to whom correspondence should be addressed.
Appl. Sci. 2021, 11(19), 8933; https://doi.org/10.3390/app11198933
Submission received: 25 July 2021 / Revised: 18 September 2021 / Accepted: 21 September 2021 / Published: 25 September 2021
(This article belongs to the Section Applied Biosciences and Bioengineering)

Abstract

:
Research on Football 5-a-side for blind people is usually informative and does not often consider sports performance analysis. This study aimed to verify the existing differences between the 2014 World Championship of Fa5 and the 2016 Paralympic Games, analyzing the action for an effective game, the throws to the goal. For this purpose, a total of 52 matches were analyzed and the statistical analysis unit was all the throws made to the goal during the game (n = 2.227). A descriptive and differential analysis was made between the variables proposed in the study considering the type of competition. The results show the existence of differences between the championships, analyzed explicitly through the variables: Championship phases, Throwing moment, Match status, Starting zone, and Throwing result, as well as the variables Progression type, Throwing zone, Striking situation, Corporal zone, and Striking type. These results highlighted that teams played differently but also set game trends and styles for future competitions.

1. Introduction

Paralympic sports have significantly evolved in recent years. Currently, there are 20 Paralympic sports, including Football 5-a-side (henceforth Fa5), an exclusive modality for blind or visually impaired people [1]. It has become one of the most popular sports within this community. This popularity is also reflected in the number of publications about it. However, current Fa5 studies in the literature tend to be informative, but often do not consider the study of the sports performance analysis [2]. Existing work on performance analysis focuses on the design and validation of an observation instrument to understand competitive performance indicators through expert judges [3]. They also describe the training process and evaluate the inter-observer reliability of the coders participating in the study [4]. Another study on Fa5 focuses on the 2014 World Championship. The Fa5, different from other sports, focuses on low scores in terms of types of advances, blocks, and game systems [5], and is played outdoors to provide the athletes with optimal acoustics. It is played by two teams of five players (one goalkeeper and four field players) and has become one of the most popular sports among this population. Additionally, some studies analyze the internal and external loads during competition of Fa5 through the use of inertial devices [6,7]. However, no studies have analyzed the evolution of the game between different championships.
Match analysis has had a growing importance in providing relevant information for coaches and sports scientists [8]. In the scientific literature, studies have analyzed the performance of non-disabled football players at different competitive levels. Some studies have tried to identify the game styles in men’s football World Cups such as the U.S., 1994 [9], France, 1998 [10], Korea/Japan, 2002 [11], Germany, 2006 [12] and Brazil, 2014 [13]. The evolution of the game between different World Cups has also been analyzed [14,15]. Some studies have also studied women’s soccer, such as the 1999 U.S. World Cup [16]. These studies have tried to identify how situational variables influence game performance. In the competition phases, the team’s performance has been analyzed during the group phase of the UEFA Champions League competition in the 2009–2010 season [17], as well as exclusively in the semifinals and finals of the European and World Championships between 1982 and 2010 [18] to determine the differences between championships.
Similarly, there is a study that analyzed the matches in a competition during the 2009 to 2013 seasons to identify the influence of different situational variables on performance indicators and the results obtained [19]. Situational variables are frequently analyzed [20,21], including the observed score or the kind of competition [22] as well as match status (whether the team wins, ties or loses) [23,24]. Other works also analyze variables focused on the game, such as the end zones [25], the actions in attack situations [26] and processes or game models [27].
The literature shows that performance in football is the result of a complex interaction of multiple variables [28]. Therefore, when analyzing the performance indicators applied in team sports, it is necessary to know the logic of the game through technical-tactical factors [29,30]. These allow the scientific analysis of the sports performance for the progress of the contextual knowledge of the game to improve future results [31]. Therefore, the term “performance indicator” does not apply to any variable, but only to those already confirmed as valid measures of an essential aspect of sports performance analysis and which, likewise, have an objective measurement procedure, a known measurement scale, and an adequate interpretation [32]. This knowledge allows coaches to have a precise understanding of the game [30,31,32,33] and extracts relevant information regarding the reality of the specific context to be investigated [34].
To the best of our knowledge, there are no studies analyzing multiple competitions through Fa5 performance indicators. Thus, given the lack of scientific literature related to sports performance indicators in Fa5, which allows characterizing the object of the study modality, the need to increase knowledge in this field using similar conventional football studies arises. Hence, this study aimed to check whether there are differences in performance indicators between the 2014 Fa5 World Championship and the 2016 Paralympic Games to determine the game’s evolution, as well as to determine whether the teams have changed their game patterns regarding the action that makes it possible to assess the effectiveness: the goal throws.

2. Materials and Methods

2.1. Design

The design of this research was quantitative empirical; it used an arbitrary code of observation and was developed in the natural environment with a descriptive and longitudinal nature since comparisons are made between different competitions [35].

2.2. Sample

Fifty-two matches corresponding to all the games played during the 2014 World Fa5 Championship (n = 34), held in Japan, and the 2016 Paralympic Games, held in Brazil, in the Fa5 modality (n = 18) were analyzed. The statistical analysis unit was configured with all goal throws during the match. The total number of registered throws was 2.227, with 67.22% from the 2014 World Championship (n = 1.497), and 32.78% from the 2016 Paralympic Games (n = 730). Teams participating in the 2014 World Cup were: Germany, Argentina, Brazil, China, Colombia, South Korea, Spain, France, Paraguay, Japan, Morocco, and Turkey. Teams participating in the 2016 Paralympic Games were: Argentina, Brazil, China, Spain, Iran, Morocco, Mexico, and Turkey. Additionally, the study was approved by the International Paralympic Committee (IPC) and by the Institutional Review Board (Universidad de Extremadura, Reg. Code 67/2017).

2.3. Variables

The independent study variable was Type of competition (World Cup 2014 and Paralympic Games 2016). Dependent variables used in this research were the usual ones in recent studies based on the observational methodology in Fa5 [4,5,6,7,8,9,10,11,12,13,14,15,16,17,18,19,20,21,22,23,24,25,26,27,28,29,30,31,32,33,34,35,36]. This research used situational variables such as “Goal throwing in the game” and “Result”, which constitute the block I of the IOLF5C instrument, designed and validated to determine the competitive performance indicators in Fa5 [3,4]. In other words, category systems were used to register each of the variables. Table 1 lists the variables used in the study of the sports performance indicators in Fa5.

2.4. Procedure

All matches of both competitions were videotaped for further analysis. This action required a coder training process to ensure that the data collected were valid and reliable. There was an improvement in concordance between coders during the Fa5 training process, with inter-observer reliability using Cohen’s Kappa greater than 0.85 in all variables [4,5,6,7,8,9,10,11,12,13,14,15,16,17,18,19,20,21,22,23,24,25,26,27,28,29,30,31,32,33,34,35,36]. The data obtained by coders show substantial levels of validity and reliability, and therefore can be applied in research focusing on observational analysis of Fa5 [4]. After the coder training, all game throws of both championships were individually (n = 2.227) recorded, obtaining all the registers for the corresponding analysis.

2.5. Statistical Analysis

First, a descriptive analysis (frequencies and percentages) of all categorical variables of the study was performed. Additionally, the nature of the data analyzed, categorical variables, required the use of non-parametric models. Thus, the estimation of the association among variables was made with Chi-squared (χ2) and Cramer’s Phi coefficient (φc) [37]. The level of association of Cramer’s φc was interpreted using the proposal of Crosstabs Command [38]. The interpretation of the degree of association among the variables used Adjusted Standardised Residues (ASR) from the Crosstabs Command, resulting from relating the independent variables (Type of competition) with the study’s dependent variables (Situational, Goal throwing in game and Efficacy), allowing a precise interpretation of the relationship existing between variables [39].

3. Results

First of all, the results to identify the differences between both championships in the variables analyzing the game are shown (Table 2).
The results indicate an existing relationship between the Competition Type variable and the variables proposed in the study, with a small association level in the variables: Championship Phases, Throwing Moment, Match Status, Starting Zone and Throwing Result. Moreover, there are variables related to a low association degree such as: Progression type, Throwing zone, Striking situation, Corporal zone and Striking type. There is no meaningful relationship between the Competition type and the Final result, Use of blocking, and Throwing opposition variables. Descriptive results are introduced using figures and the Crosstabs Command to read these differences.

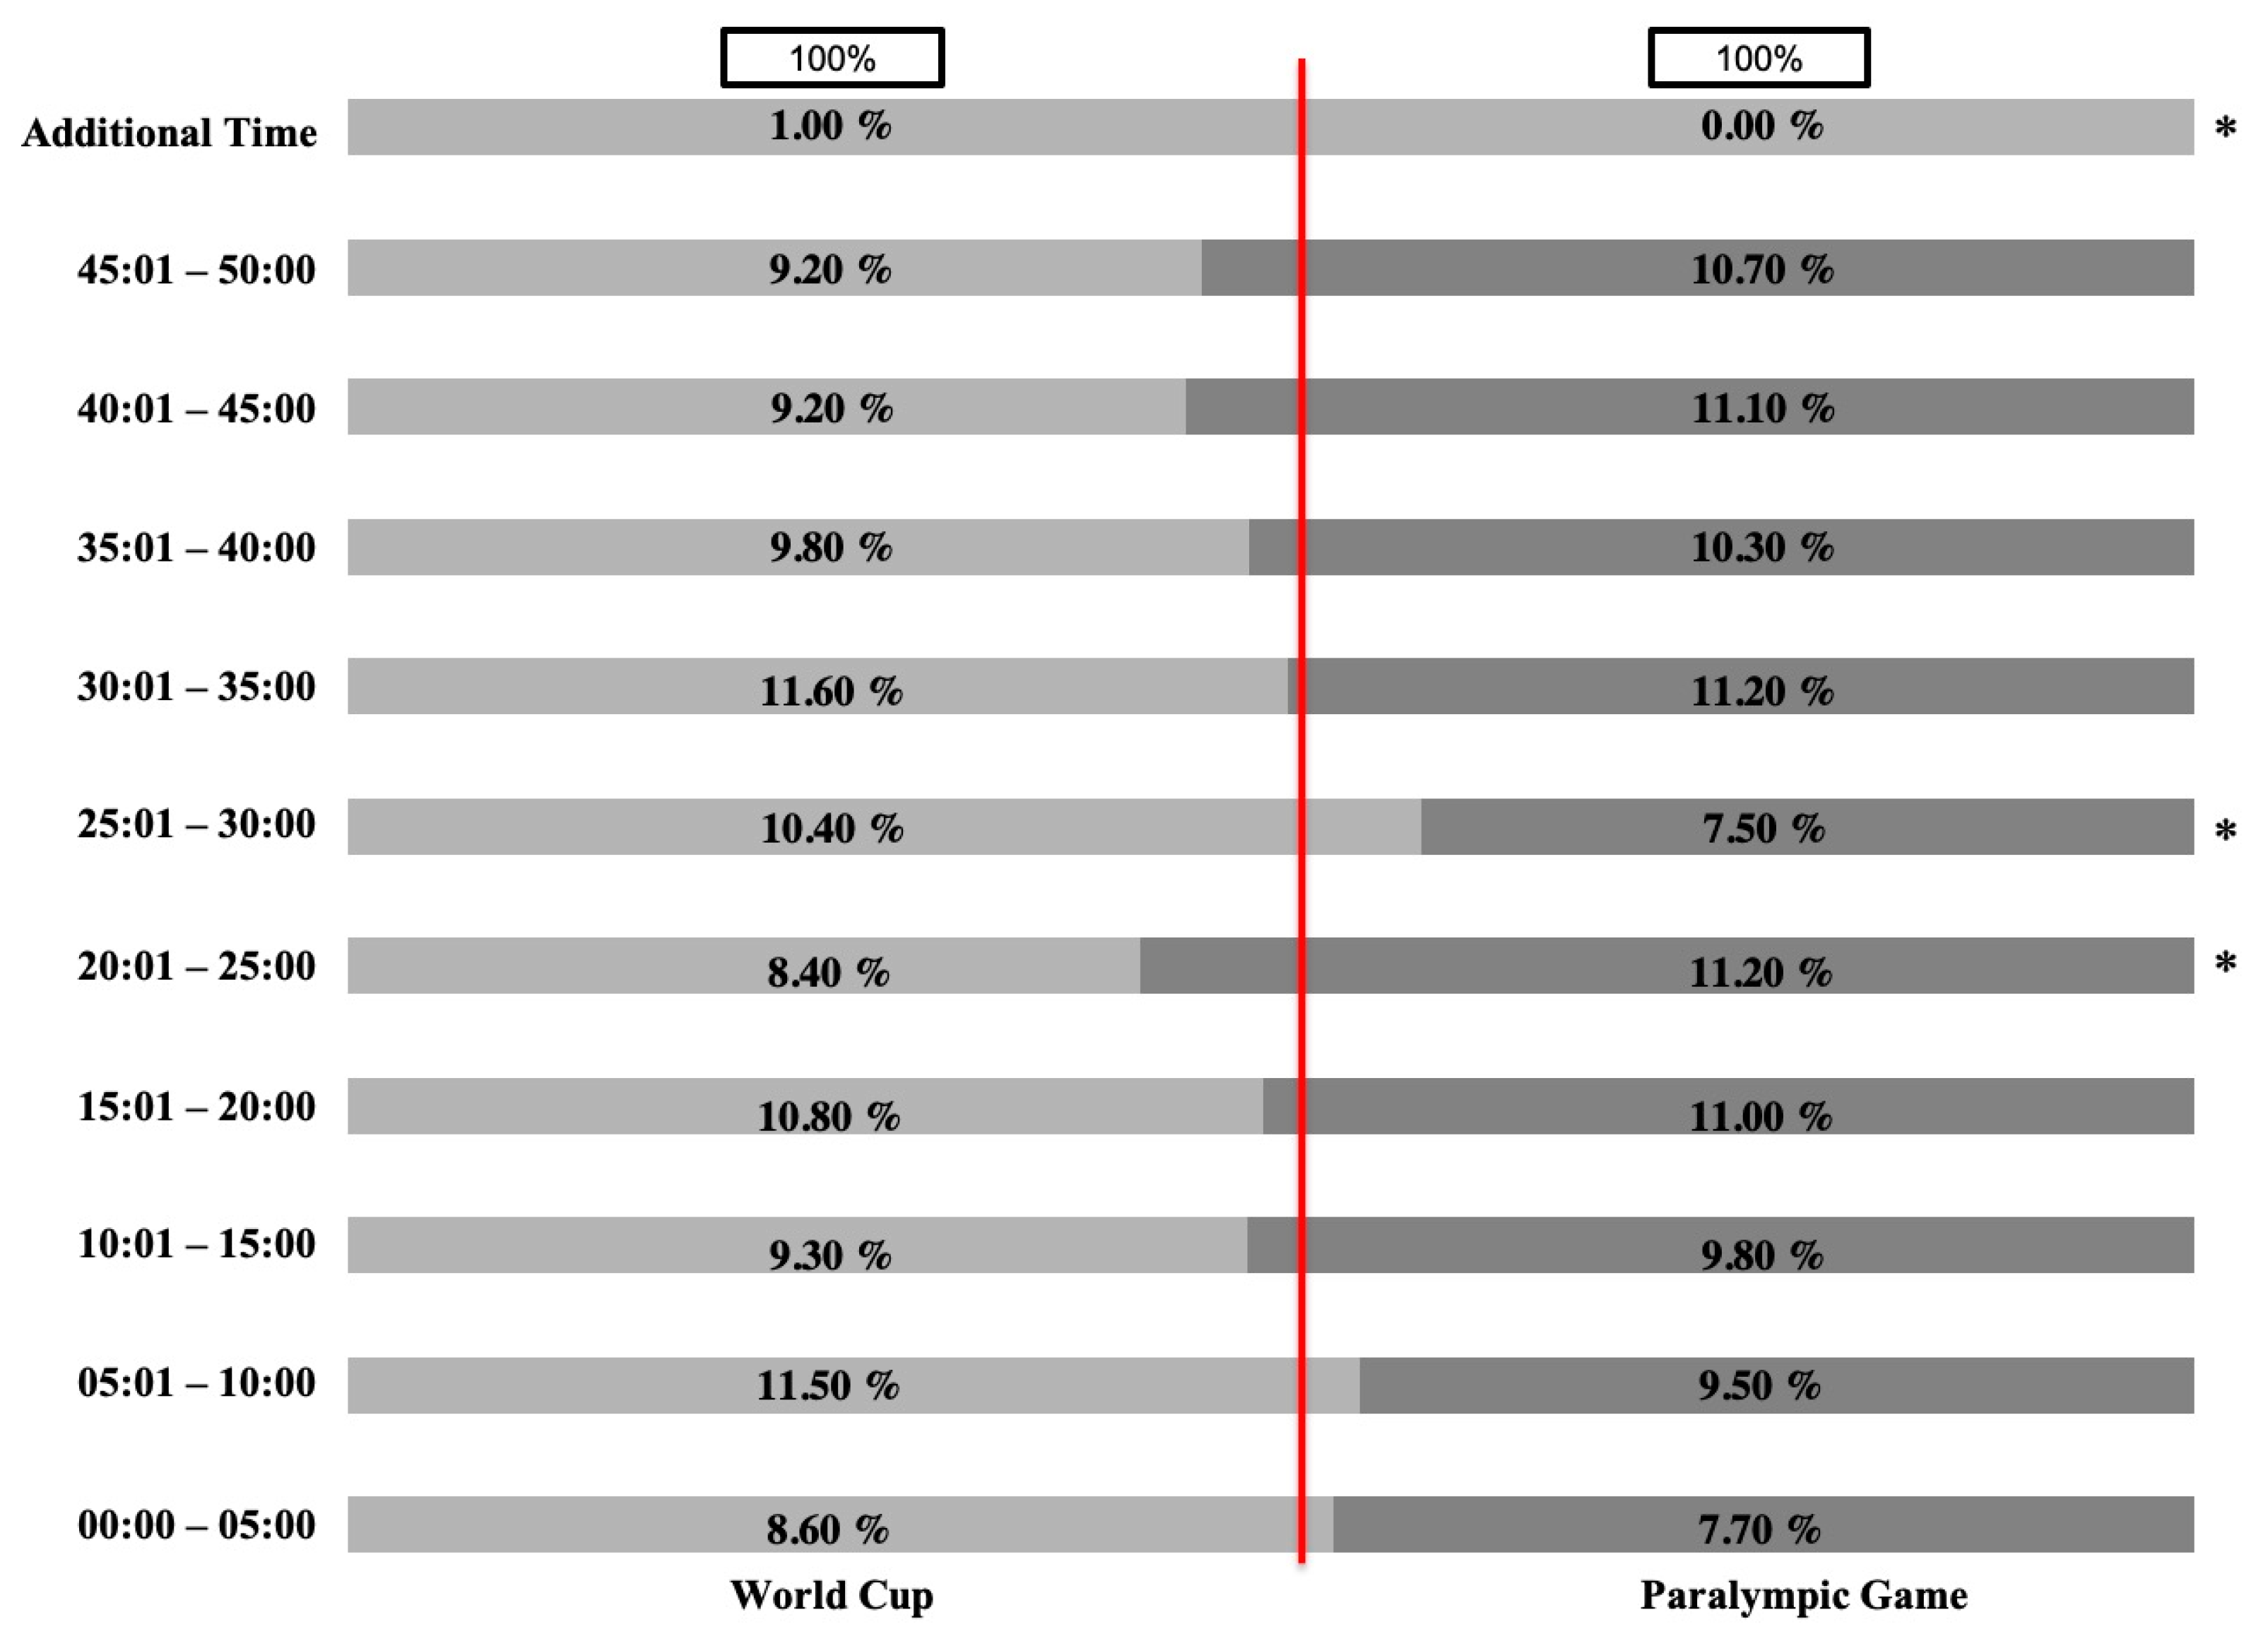
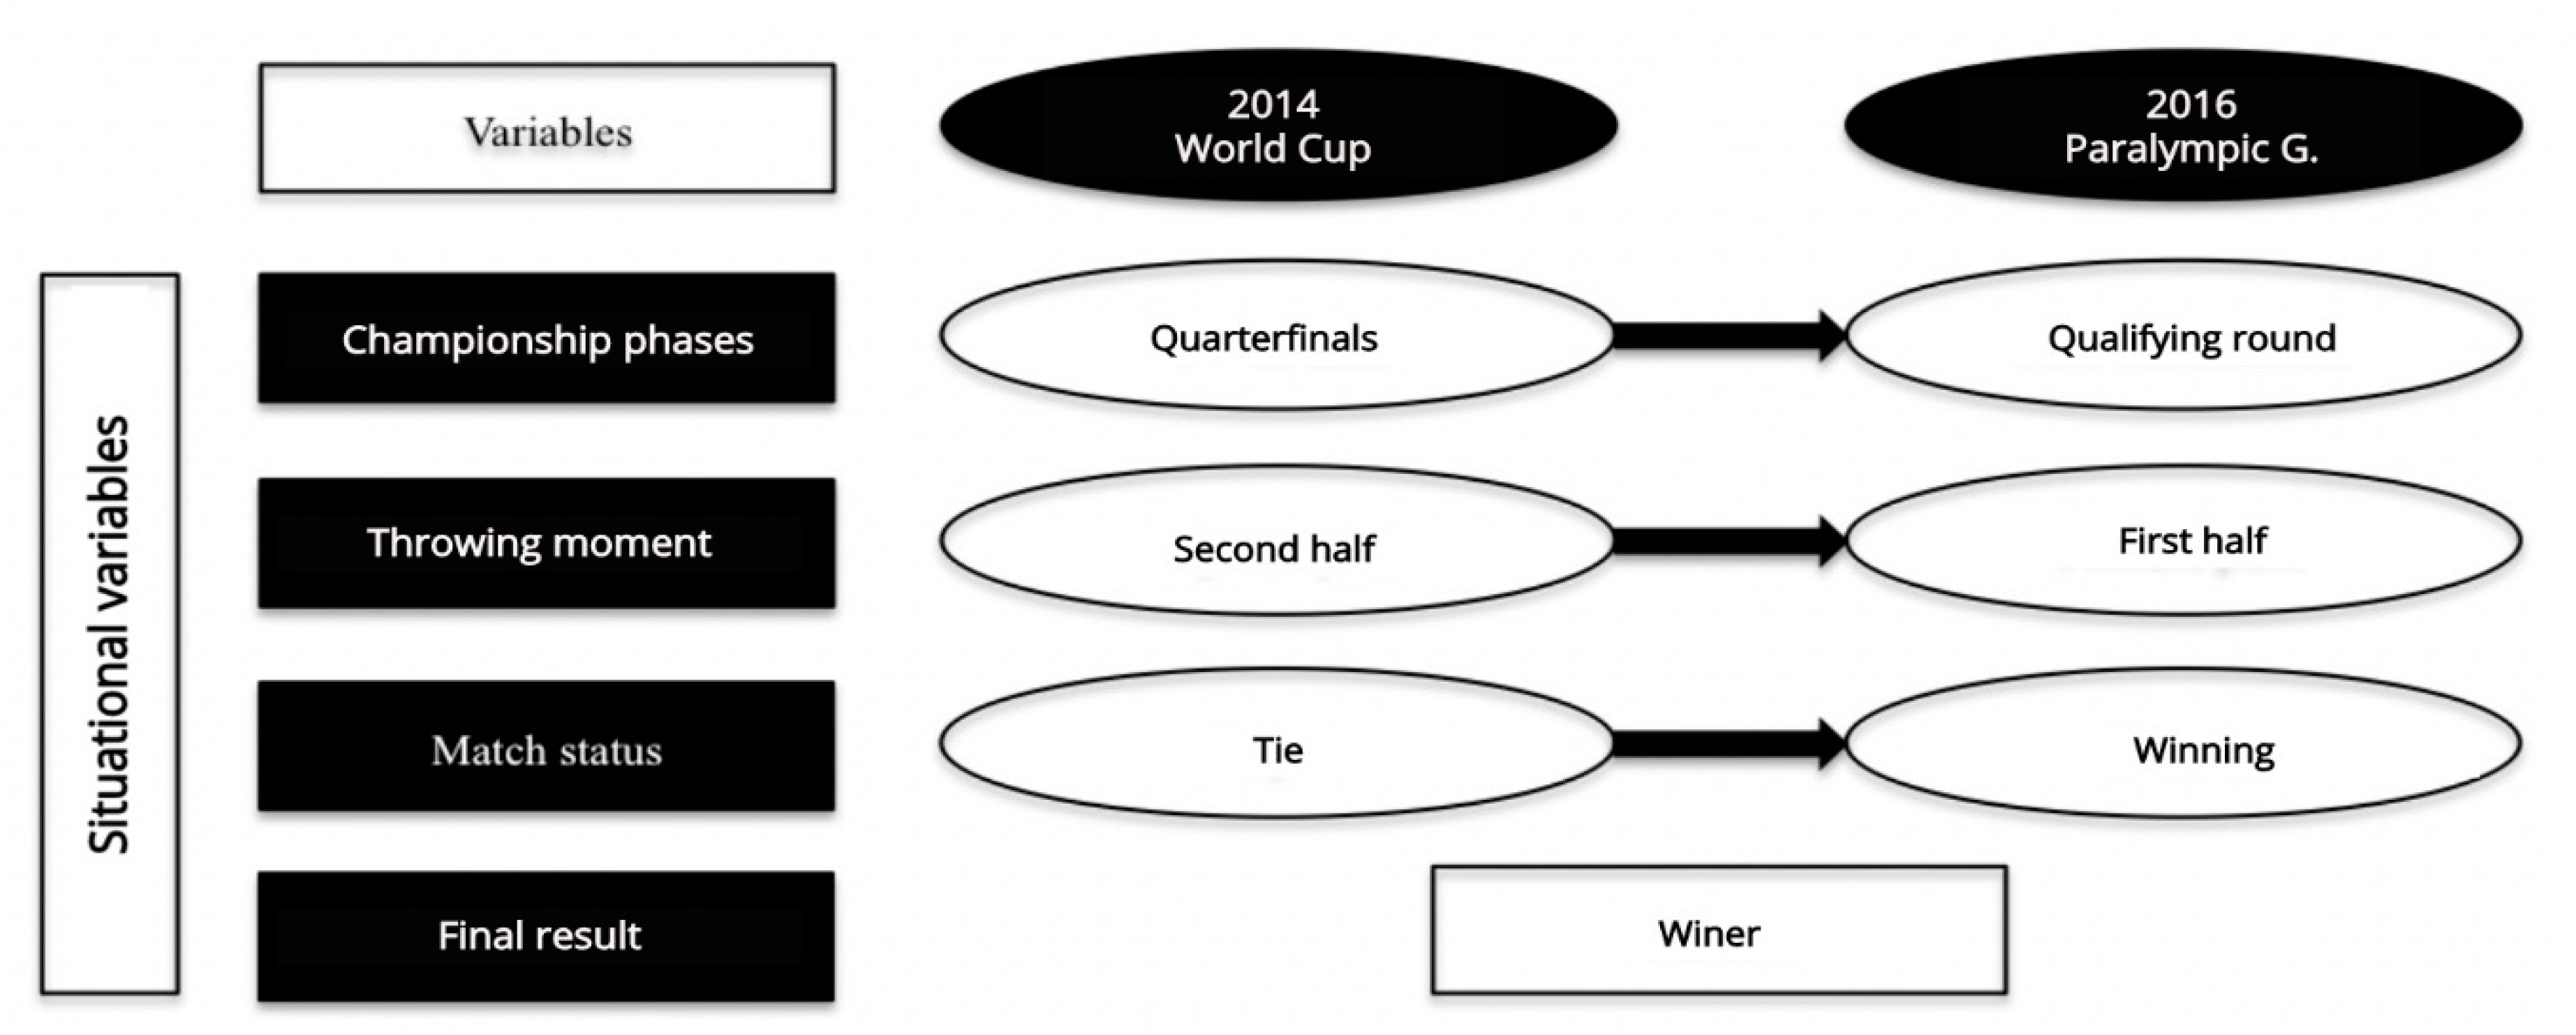
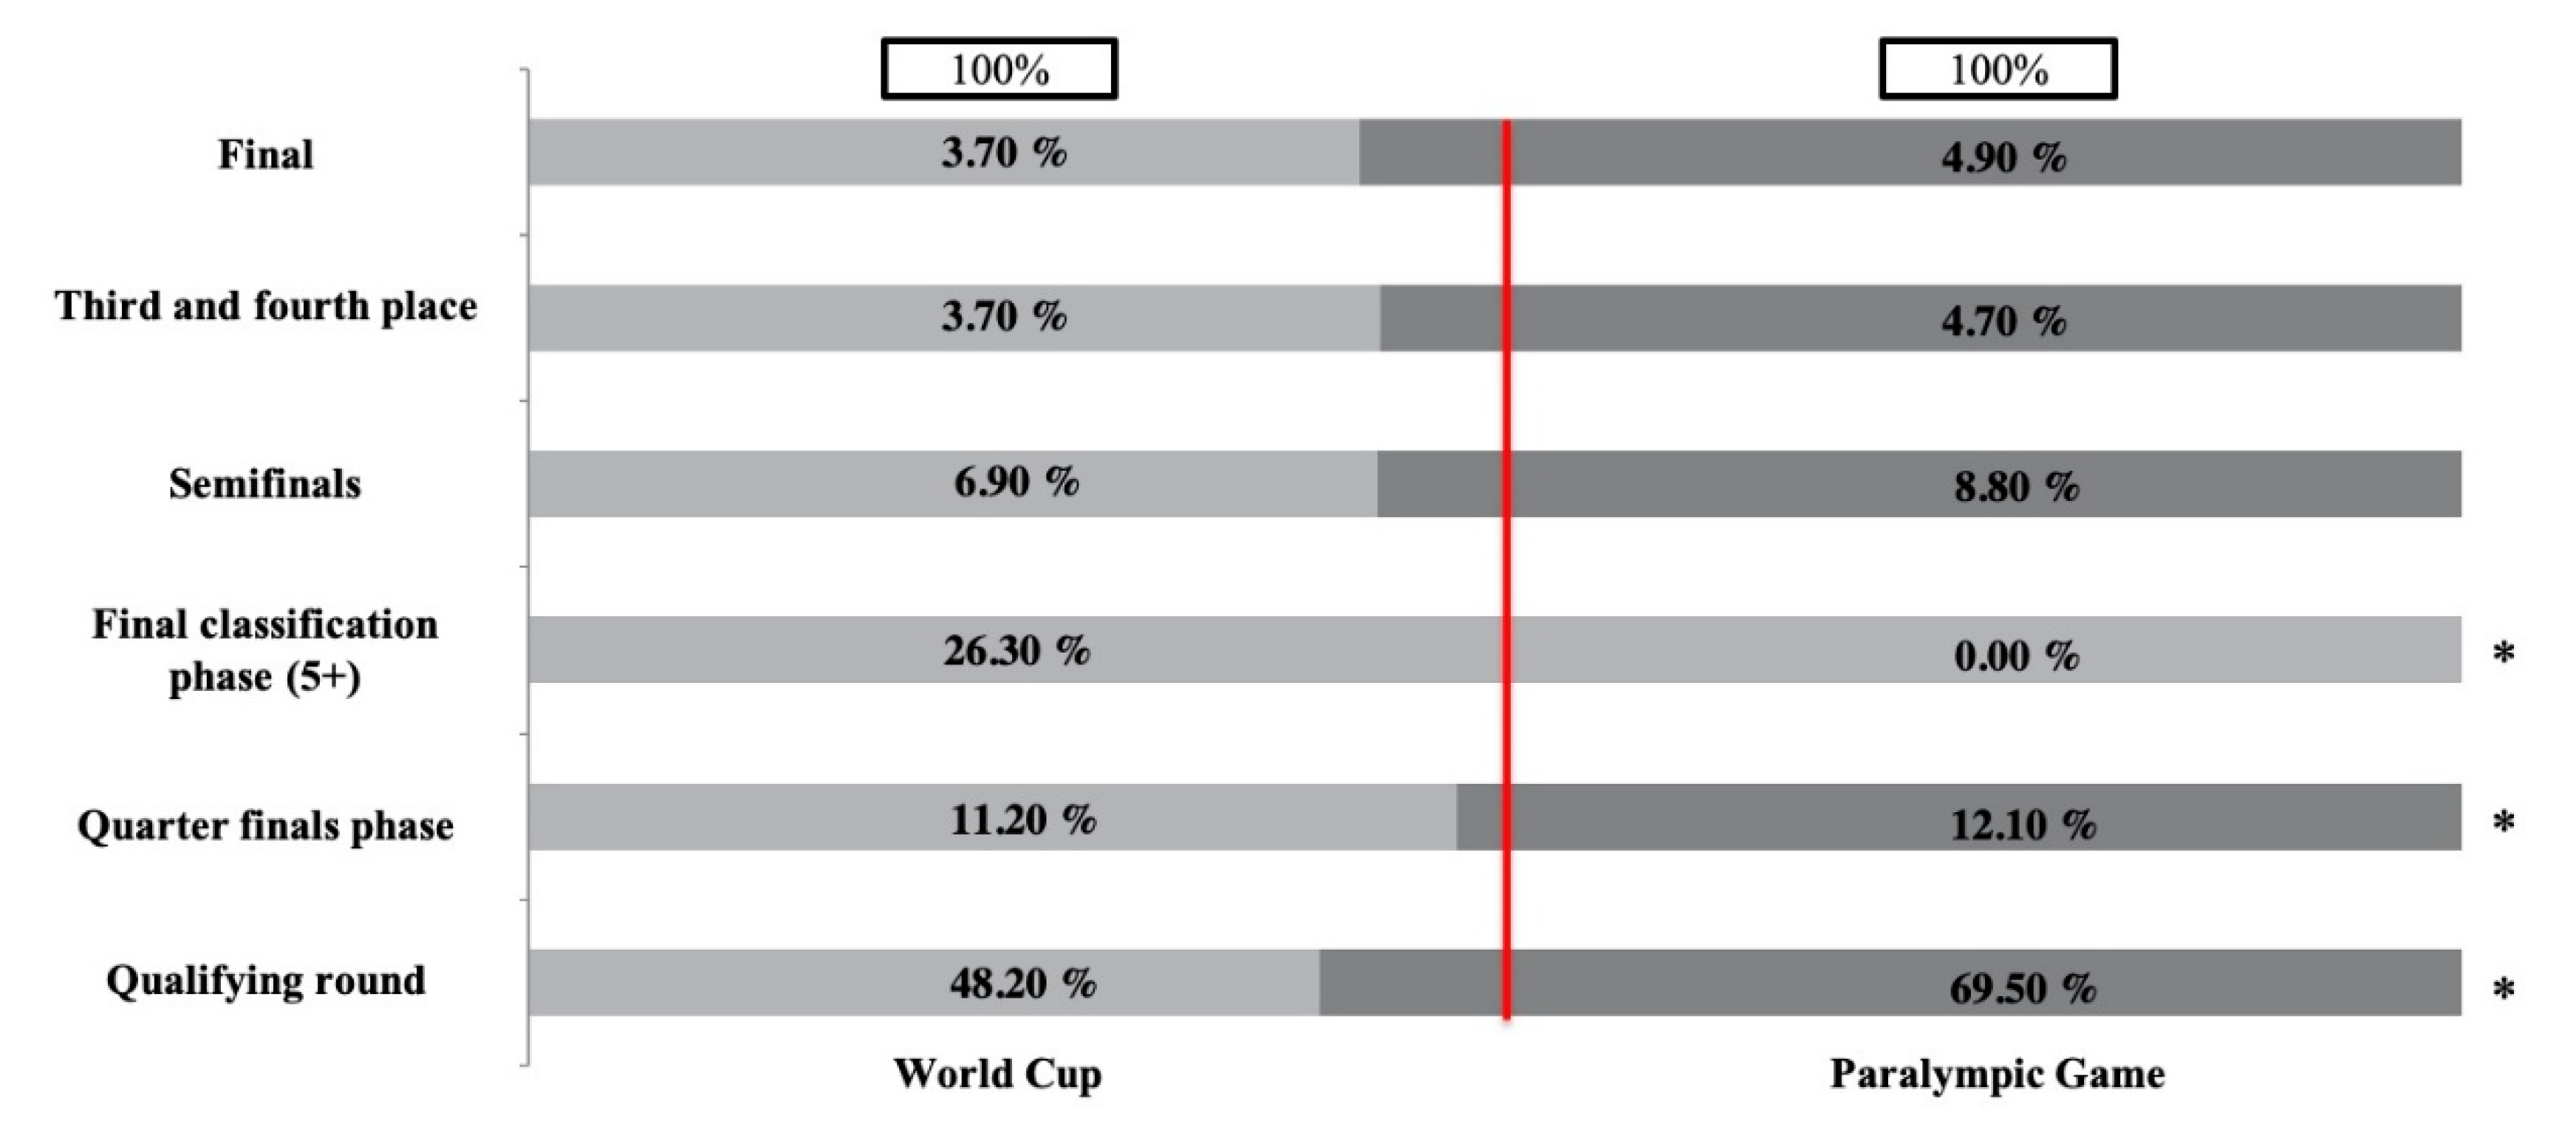
3.1. Situational Variables

The differences between championships in situational variables were identified among Championship phases, Throwing moment, and Match status. Figure 1 indicates the descriptive results in percentages of goal throwing in the game of each championship, according to the Championship phases established in the Fa5 competition guidelines. The total distribution of throws made during a championship can be seen in each column of the figure. The percentage of throws made at each stage of the championships is shown in each row. Finally, the significant differences between the championships analyzed are described.
A higher probability than expected of more goal throws conducted during the Quarterfinals Phase during the World Cup (ASR = 9.4), was identified, compared to a higher probability of throwing during the Qualifying Phase of the Paralympic Games (ASR = 9.5).
Figure 2 shows the descriptive results in percentages of goal throws during the different throwing moments of the analyzed competitions. There are also significant differences between the championships analyzed.
It shows a higher probability than expected during the World Cup, with a more significant number of goal throws at the beginning of the Second half, specifically between the minutes 25:01 and 30:00 (ASR = 2.4), as well as a greater probability of goal throws in Extra time (ASR = 2.1). At the Paralympic Games, there was a greater likelihood of goal throwing at the end of the First half (20:01–25:00) (ASR = 2.1).
Table 3 shows the descriptive results and the ASRs of the situational variable Match status of the Fa5 study.
The results show that there are differences between the Match status and the Competition type. It was more likely than expected for teams to have a tie during the World Cup when throwing to the goal (ASR = 2.3), compared to the Paralympic Games where most of the teams’ goal throws were the winning ones (ASR = 2.9).

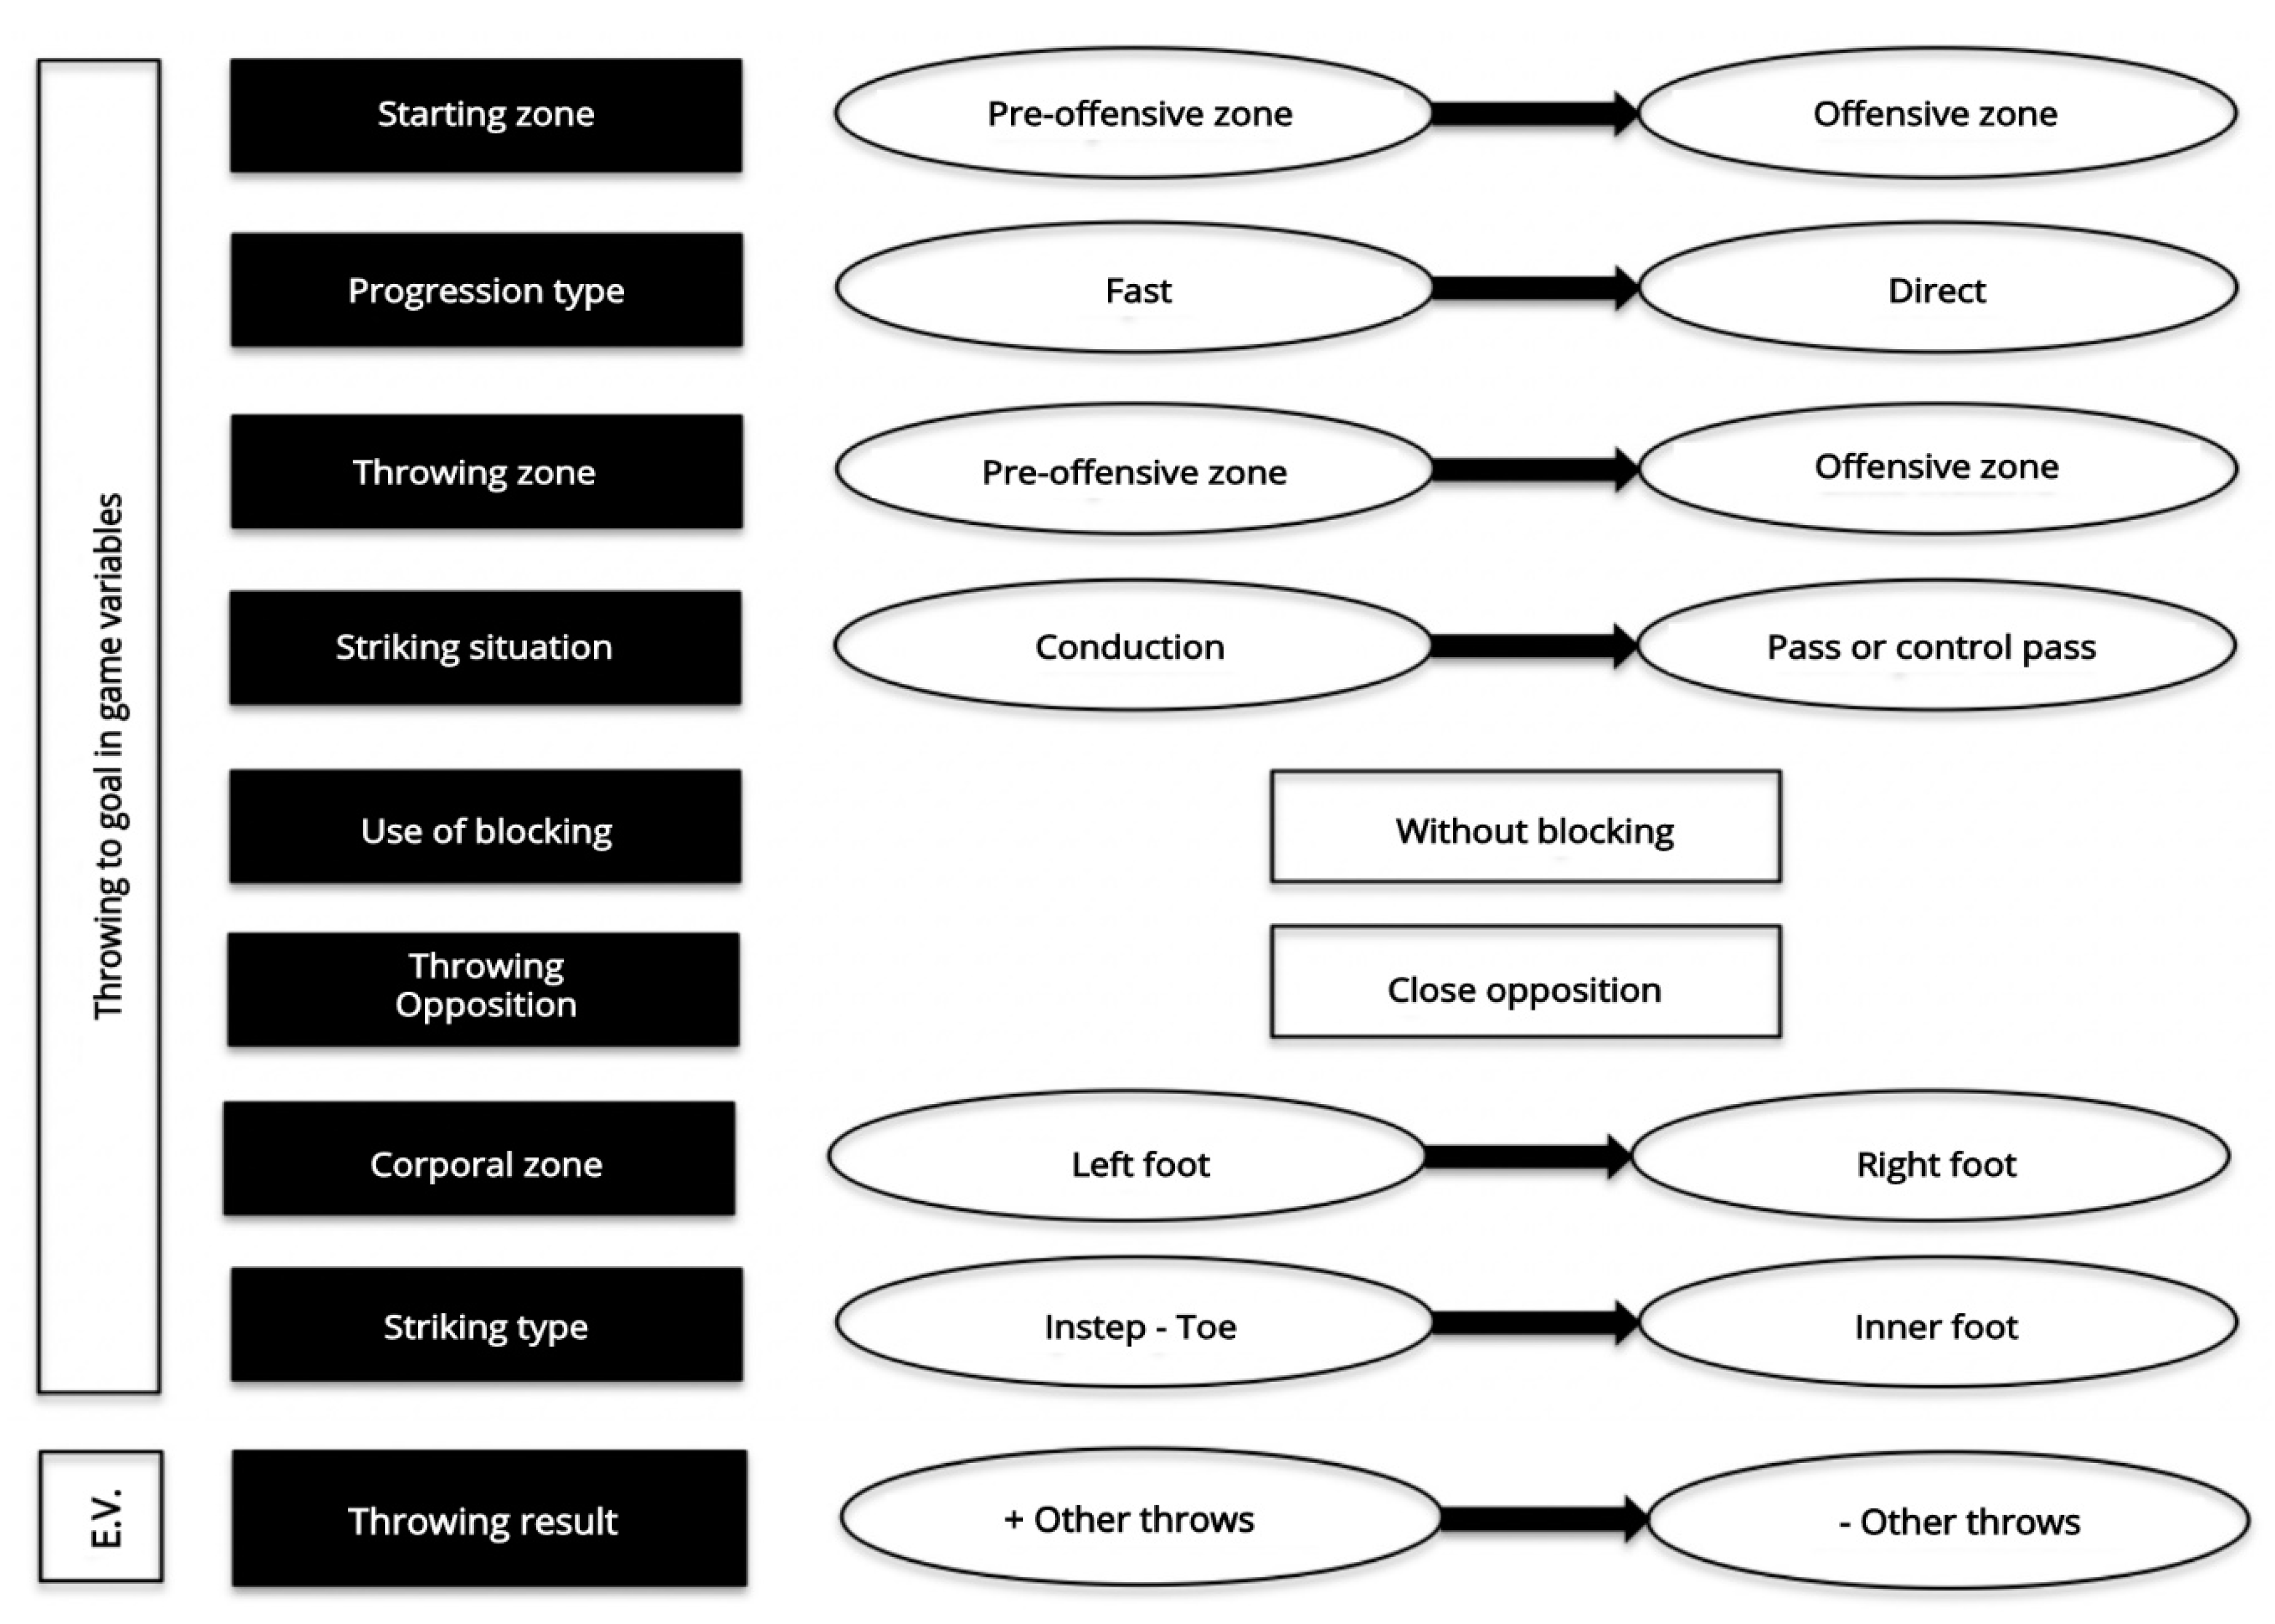
3.2. Goal throwing Variables

Table 4 shows the descriptive results and the ASRs of the Goal throwing variables in the game of the Fa5 study.
There are differences regarding the throwing’s starting zone. During the World Cup, there was a higher probability than expected that teams would initiate actions before throwing to the goal in the Pre-Offensive Zone (ASR = 3.4). However, in the Paralympic Games, the starting zone was the Offensive Zone (ASR = 2.3).
Furthermore, the Progression type towards the goal also shows differences in both championships. The results show a higher probability than expected for the progression type to be fast during the World Cup (ASR = 9.6), while at the Paralympic Games, teams used a direct attack to throw to the goal (ASR = 8.7), and with combinatorial actions (ASR = 2.5).
As for the Throwing zone, there are also differences in both championships. During the World Cup, teams started their moves in the Pre-offensive zone (ASR = 11.2), while at the Paralympic Games they started their moves in the Offensive zone (ASR = 10.4).
Likewise, there are differences between the Striking Situation and the Competition Type. World Cup teams were more likely than expected to perform conduction-throwing (ASR = 6.7), while during the Paralympic Games they tended to perform passing actions, specifically pass-throwing (ASR = 5.5) and pass-control-throwing (ASR = 2.6), as well as other actions before the goal strike situation (ASR = 3.0).
Regarding the Corporal zone used for goal throwing, there are differences in both championships. Players were more likely than expected to strike the ball at the goal with their right foot at the Paralympic Games (ASR = 5.3), while at the World Cup was with their left foot (ASR = 4.9).
Differences were identified between the championships analyzed concerning the Striking type. World Cup teams were more likely than expected to kick the ball into the goal with their instep-toe (ASR = 2.4), outer foot (ASR = 2.8), and other areas (the goalkeeper’s goal kick with hands or ball rebounds on players) (ASR = 2.3), while during the Paralympic Games, teams usually hit with the inner foot (ASR = 4.6).

3.3. Efficiency Variable

Descriptive results and ASRs of the efficiency variable in the goal throwing of the Fa5 study are shown in Table 5.
During the World Cup, there was a higher probability than expected that the result of goal throwing was through Other throws (ASR = 2.8), i.e., with bouncing throws on the side, or intentionally, as a consequence of playing without seeing, which makes it difficult to control the ball. Figure 3 shows the game evolution during the championships analyzed through the studied variables allowing us to determine the efficiency of goal throws.

4. Discussion

This study aimed to determine the evolution of the game between the 2014 World Championship and the 2016 Paralympic Games in the Fa5 modality, considering the different sport performance indicators associated with goal throwing in the game. In the World Cup, Fa5’s teams made the goal throws mainly in the second half, after making a rapid progression towards the pre-offensive zone, striking the sound ball with the left foot and with the instep-toe, while during the Paralympic Games, the teams threw at the goal in the first half, moving the ball into the offensive zone by the pass or pass-control, and usually kicked the ball with the inside of their right foot.
In the literature, there are works regarding conventional football which analyze the different variables influencing the competition [13,14,15,16,17] even in other sports such as basketball [40,41], rugby [42], or volleyball [43]. Additionally, current studies analyze the evolution in different championships [10] or competitions [31]. However, the absence of studies regarding sports performance in Fa5 brings about the need to contrast these discoveries with regular football and even with other sports contexts where similar methodologies have been applied. The results of the descriptive and inferential analysis of both Fa5 competitions facilitate the collection of relevant information for coaches, allowing them to plan and propose more appropriate training, as well as to determine which strategies and tactics should be used during the competitions, and also to understand the evolution of championships.
As for the situational variables, differences between the analyzed championships were identified in the Championship phases, Throwing moment and Match status variables. However, the goal throwing is not influenced by the final result. In other words, there are no differences between both competitions. Teams that throw to the goal end up winning the match.
The competition structure conditions the number of throws made in each Championship phase. In both competitions, there is a group phase, and then it goes through the eliminatory phases until the final. Goal throws are more significant than expected during the Quarterfinal Phase of the World Cup, while this considerable number of actions occur during the Qualifying Phase at the Paralympic Games. Players’ psychology during the development of matches in the eliminatory phases can affect the match since defeat means finishing the championship, although performance indicators are optimal [44]. The overall success or failure in the competition is directly related to the phases that teams ultimately play, in addition to the final classification. In Fa5, as in conventional football, qualifying matches can be influenced by playing time, the number of fouls, cards shown [14,15,16,17,18,19,20,21,22,23,24,25,26,27,28,29,30], corner kicks received [22], and the rhythm of teams and even injuries suffered during the match. Therefore, Fa5 coaches have to design training tasks where different match situations are worked on and select the most suitable players to be successful in the crucial moments of the competition phases.
The Throwing Moment to the goal in game changed in both competitions. During the World Cup, teams tend to throw more shots into the goal in the second half of the match, as well as finish the matches in a tie. Additionally, in the eliminatory phases they tend to play overtime to determine the winner. At the Paralympic Games, teams threw more shots at the goal during the first half. Teams’ play systems are parameters which can alter or vary the competition, as this study has shown. For this reason, winning teams set trends that other teams tend to imitate [9]. It would be advisable to have more dynamic analyses mainly focused on the playing time and the performance evolution throughout each match [29]. Sports performance indicators help to detect those trends and provide a rough understanding of the rival teams’ characteristics. The sport scouting figure is currently a determinant of success [5] and would help determine the predominant moment of each team’s goal throws as well as the strategies they use.
Differences in Match status exist between both competitions. During the World Cup, goal throws predominated when the score situation was a tie, while in the Paralympic Games, the winning teams threw more at the goal. An intentional or unintentional mistake can vary the result of the match, forcing the losing team to increase the pressure, and consequently boost the number of errors to try to level and even win the game. In conventional football, teams that score the most goals are the winners [24]. However, sometimes a tie, a victory or a defeat can hide clear superiority in the game of one team against the other that is not reflected in the moment or final result [33]. Scores in Fa5 are often very close, decided by team faults as a consequence of the characteristics of the sport’s modality, in which all field players have limited vision, except the goalkeeper. For that reason, game situations where players are at an advantage or disadvantage in terms of the scoreboard must be designed to adapt their performances to the different phases of the competition.
Regarding the Final result, there are no differences between both competitions. Teams that throw the most to the goal end up winning the match. These results corroborate that offensive patterns before a goal are altered over time, as in conventional football [18]. It is necessary then to increase the number of goal actions, throws, to ensure success.
Regarding the variables of goal throwing in the game, differences between the championships exist in the Starting zone, Progression type, Throwing zone, Striking situation, Corporal zone and Striking type. There are no differences in the Use of the blocking and Throwing Opposition.
The Starting zone of the goal throwing evolves. During the World Cup, the teams start their actions in the Pre-offensive Zone prior goal throwing, while in the Paralympic Games, their actions begin in the Offensive Zone. In other words, two different game tendencies are identified. Match analysis is a relevant issue for coaches [8,9,10,11,12,13,14,15,16,17,18,19,20,21,22,23,24,25,26,27,28,29] and will help them understand the characteristics of the game at any given time [21] to achieve better results [24], as well as determine the strengths and weaknesses of the competing teams [9]. Therefore, Fa5 coaches must design variability tasks of starting zones. Furthermore, they must know how the players perform in the different positions on the field, as well as the game dynamics of rival teams. This knowledge will allow them to develop more appropriate training for the demands of each moment and also prepare their teams for the crucial phases of the competition.
Two Progression types characteristic of each competition were identified. During the World Cup, the players tended to make Quick progressions in contrast to Direct actions implemented at the Paralympic Games. These results show that the Fa5 has evolved and teams are looking for different types of movements. These actions are vital to moving the ball from one zone or another one on the field towards the end zone. Namely, being able to reach the opposition area quickly, with finishing options, seems the most advisable in Fa5, as in conventional football [45]. Additionally, Fa5 players do not use centers as a means to transport the ball to completion areas, except the goalkeeper. In football, it is a widespread action [18]. Fast or direct defense–attack transitions in Fa5 are specific characteristics of the sports modality, being fundamental when it comes to winning the match, and it is one of the essential elements in each training session. However, Fa5 is a game where a tight marker predominates, and its dynamics focus on defending and looking for quick transitions, just like in conventional football. Teams conducting actions close to the finishing zones and trying to increase the number of throws [24] are the teams with the best results in competitions and tournaments [13,14,15,16,17,18,19]. Fa5 coaches should design counterattack tasks, as they are more effective than the elaborated attacks [27].
The zone where throws are concluded evolves in the championships since during the World Cup there is a tendency to complete the actions of goal striking in the Pre-offensive zone, while at the Paralympic Games it happens in the offensive zone. Teams look for finishing areas closer to the goal. Throwing actions taking place in the zones next to the score point (goal or basket) are the most likely to succeed [31]. Teams with the most throws in the finishing zone are those who tend to be at the top of the leaderboard or pass the round in tournaments [13,22,45]. Then, causes leading to succeed or fail in the Fa5 are quantifiable, such as a goal, an expulsion, goal opportunities as well as throws to goal. Therefore, all parameters influencing success or failure are more important than their quantity [30].
Preliminary actions performed by Fa5 players before throwing have evolved from a game based on Conduction-throwing, at the World Cup, to collective actions at the Paralympic Games, with Pass-throwing and Pass-control-throwing, as well as other options such as direct kicks from the goalkeeper to the rival goal. These previous actions are similar to what happens in football today, where more extended sequences of passes produce more possession goals than the short ones [9,10,11,12,13,14,15,16,17,18,19,20,21,22,23,24,25,26] and most goals are produced in group moves [46]. Fa5 has evolved regarding the control of ball possession, and this shows that the sports discipline is continuously changing; thus, useful game patterns cannot be determined. Coaches would have to design training tasks to implement the effective game sequences of the different championships analyzed.
The Use of the blocking, in both competitions, is similar, predominantly the game Without blocking and a few existing with Blocking before throwing. This outcome is a consequence of the fast or direct transitions made by the Fa5 players, in an attempt to transfer the ball as quickly as possible from the defensive zone or recovery zone to the end zone. Therefore, it is confirmed that teams play mainly with fast or direct transition actions as in conventional football [27]. The opposition before throwing stays stable, with a close opposition. Namely, when throwing, opponents intend to intercept the action, as in other sports such as basketball [31] or rugby [42].
There has been an evolution in the Corporal zone used to throw. During the World Cup, it is more likely to strike the ball with the left foot than at the Paralympic Games. In conventional football, players who throw penalties with the right leg predominate [47], as well as during the match [10]. The game situation conditions the leg used to strike the ball. Therefore, it is recommended to learn how to throw at goal correctly with both legs in Fa5, giving players greater experience when throwing at the goal regardless of the field situation.
Likewise, there has been a change in the Striking Type, conditioned by the change in the gameplay. During the World Cup, striking the ball actions are usually with the Outer foot or foot instep-toe induced by the time of fast attack with conduction, while in the Paralympic Games, goal throws are executed with the Inner foot, as combinatorial actions predominate. Powerful throws characterize both striking resources. These results are similar to those in the literature regarding the kinematic striking characteristics in football [46]. This is the case of the study comparing the kinematic differences between strikes by blind and sighted players, where it describes and corroborates that the instep strike is the most used form in Fa5 [48] to give power to the ball when aiming the goal. Therefore, coaches have to design tasks from completion to goal where the ball is struck indistinctly as well as in different situations close to the conditions of international competitions.
Finally, there are differences in the consequences of throwing to the goal. During the World Cup, striking produces a wide variety of results, such as throws over the side fences of the field, to the detriment of the baselines, or error actions during the hit, which are more frequent than in other football modalities since Fa5 is a sport practiced in the absence of sight [2]. It is clear that playing without seeing makes it difficult to control the ball, even if it is audible, as well as having optimal spatial-temporal perception regarding teammates and opponents. In other words, international Fa5 is a very low scoring sport, where it is difficult to take the goal as a reference for success in the attacking action, even less than in conventional football. For this reason, counting the number of goals scored in matches, despite being a common practice in other sports [9], which allows to determine and predict the general performance and of teams in particular [18], is not appropriate for the analysis of sports performance in Fa5. A relevant indicator would be to score first [5,6,7,8,9,10,11,12,13,14,15,16,17,18,19,20,21,22,23,24,25,26,27,28,29,30,31,32,33,34,35,36], among other reasons, since when the team is losing, goal attempts are reduced [21], not only the final score [23]. Performance indicators could help to better interpret the final scores in each match, the classification at the end of the competition, and the reasons for the team’s success or failure [45].
This type of study about the evolution of Fa5 championships helps determine and construct a framework of possible effective game patterns [15], as well as the changes in the playing mode. The game’s evolution has progressed from dominating actions in the first half to score a goal to dominate the game and the match rhythm. This success occurs with direct attacks, not with ball control but with passes, which provoke counterattacks. All this implies that the goal throws are produced with greater control of the action with the inner foot.

5. Conclusions

An evolution of the game was identified between the 2014 Fa5 World Cup held in Japan and the 2016 Paralympic Games in Brazil. The teams played differently, but both set trends and game styles for future competitions.
The knowledge of the different defensive and offensive patterns allows us to foresee the evolutionary tendencies of the game and to anticipate decisions regarding the way to plan the competitions, training methodologies and possible regulatory changes.
Fa5 coaches have to design training tasks where the effective game sequences of the different championships analyzed are applied, specifically scenarios favoring quick situations after ball recoveries in the areas close to goals to finish with fast or direct progressions.
In this article, the performance indicators of the 2014 Fa5 World Championship and the 2016 Paralympic Games have been analyzed, as well as the evolution of the teams with the game patterns and goalkeeping. However, it is necessary to continue researching to learn about Fa5 in depth with future studies that increase the scientific knowledge of soccer 5. It would be interesting to analyze the injuries of the players, analyze the movement of the players with GPS and even look into the design of training tasks, as well as the sports performance indicators in Fa5. For this, it is recommended to use new methodologies applied in research in sports sciences.

Author Contributions

Conceptualization, J.M.G. and J.M.-J.; methodology, J.M.G. and J.M.-J.; software, J.M.G. and K.L.; validation, J.M.G., J.M.-J., K.L. and S.J.I.; formal analysis, J.M.G. and J.M.-J.; investigation, J.M.G. and S.J.I.; resources, J.M.G. and S.J.I.; data curation, J.M.G., J.M.-J. and K.L.; writing—original draft preparation, J.M.G., J.M.-J., K.L. and S.J.I.; writing—review and editing, J.M.G., J.M.-J., K.L. and S.J.I.; visualization, J.M.G., J.M.-J., K.L. and S.J.I.; supervision, J.M.G., J.M.-J., K.L. and S.J.I.; project administration, J.M.G., J.M.-J. and K.L.; funding acquisition, J.M.G., J.M.-J., K.L. and S.J.I. All authors have read and agreed to the published version of the manuscript.

Funding

Please add: This work was led by the Group for the Optimization of Training and Sports Performance (GOERD) of the Faculty of Sports Sciences of the University of Extremadura and has been partially supported by the funding for research groups (GR18170) granted by the Government of Extremadura (Employment and infrastructure office—Consejería de Empleo e Infraestructuras), with the contribution of the European Union through the European Regional Development Fund (ERDF).

Institutional Review Board Statement

The study was reviewed and approved by the Institutional Review Board (Universidad de Extremadura, Reg. Code 67/2017).

Informed Consent Statement

The study is approved by the International Paralympic Committee (IPC).

Data Availability Statement

The data has been extracted from the official videos of the different competitions analyzed. For this, it has been necessary to have the approval of the International Paralympic Committee (IPC).

Acknowledgments

The study developed within the Group to Optimization of Training and Performance Sports of Faculty of Physical Activity and Sport Sciences (University of Extremadura, Spain).

Conflicts of Interest

The authors declare no conflict of interest.

References

  1. Gorla, J.I.; De Athayde, A.; De Campos, L.; Dos Santos, C.F.; de Almeida, J.J.; Duarte, E.; Queiroga, M.R. Body composition and somatotype of athletes of Brazilian 5-a-side football team. Rev. Bras. Ciên. Esporte 2017, 39, 79–84. [Google Scholar] [CrossRef]
  2. Gamonales, J.M.; Muñoz-Jiménez, J.; León, K.; Ibáñez, S.J. Football 5-a-side for individuals with visual impairments: A review of the literature. Eur. J. Adapt. Phys. Act. 2018, 11, 1–19. [Google Scholar] [CrossRef] [Green Version]
  3. Gamonales, J.M.; León, K.; Muñoz-Jiménez, J.; González-Espinosa, S.; Ibáñez, S.J. Validation of the IOLF5C instrument for the efficacy of shooting on goal in football for the blind. Rev. Int. Med. Cien. Deporte 2018, 18, 359–379. [Google Scholar] [CrossRef]
  4. Gamonales, J.M.; Muñoz-Jiménez, J.; León, K.; Ibáñez, S.J. Reliability and inter-coders training in the analysis of football for blind persons. RETOS Nuevas Tend. Educ. Fís. Deporte Recreac. 2018, 34, 155–161. [Google Scholar]
  5. Gamonales, J.M.; Muñoz-Jiménez, J.; León, K.; Ibáñez, S.J. Efficacy oh shots on goal in football for the visually impaired. Int. J. Perform. Anal. Sport 2018, 18, 393–409. [Google Scholar] [CrossRef]
  6. Gamonales, J.M.; León, K.; Rojas-Valverde, D.; Sánchez-Ureña, B.; Muñoz-Jiménez, J. Data mining to select relevant variables influencing external and internal workload of elite blind 5-a-side soccer. Int. J. Environ. Res. Public Health 2021, 18, 3155. [Google Scholar] [CrossRef] [PubMed]
  7. Gamonales, J.M.; Muñoz-Jiménez, J.; Mancha-Triguero, D.; Ibáñez, S.J. The influence of the competition phase and the result of the match on the competitive demands in football 5-a-side for the visually impaired. Int. J. Perform. Anal. Sport 2020, 1–11. [Google Scholar] [CrossRef]
  8. Robles, F.J.; Castellano, J.; Perea, A. Differences of the game between the football Spanish team and its rivals. Rev. Iberoam. Cien. Act. Fís. Deporte 2014, 3, 1–8. [Google Scholar]
  9. Hughes, M.; Franks, I. Analysis of passing sequences, shots and goals in soccer. J. Sports Sci. 2005, 23, 509–514. [Google Scholar] [CrossRef]
  10. Castellano, J.; Hernández-Mendo, A.; Morales, V.; Anguera, M.T. Optimising a probabilistic model of the development of play in soccer. Qual. Quant. 2007, 41, 93–104. [Google Scholar] [CrossRef] [Green Version]
  11. Scoulding, A.; James, N.; Taylor, J. Passing in the soccer World Cup 2002. Int. J. Perform. Anal. Sport 2004, 4, 36–41. [Google Scholar] [CrossRef]
  12. Xu, J.; Shen, J.; Zhou, X. Offensive and defensive characteristics of 18th FIFA World Cup. J. Sports Sci. Med. 2007, 10, 203. [Google Scholar]
  13. Liu, H.; Gómez-Ruano, M.A.; Lago-Peñas, C.; Sampaio, J. Match statistics related to winning in the group stage of 2014 Brazil FIFA World Cup. J. Sports Sci. 2015, 1–9. [Google Scholar] [CrossRef] [PubMed]
  14. Castellano, J.; Perea-Rodríguez, A.; Hernández-Mendo, A. Análisis de la evolución del fútbol a lo largo de los mundiales. Psicothema 2008, 20, 928–932. [Google Scholar]
  15. Wallace, J.L.; Norton, K.I. Evolution of World Cup soccer final games 1966-2010: Game structure, speed and play patterns. J. Sci. Med. Sport 2014, 17, 223–228. [Google Scholar] [CrossRef] [PubMed]
  16. Konstadinidou, X.; Tsigilis, N. Offensive playing profiles of football teams from the 1999 Women’s World Cup Finals. Int. J. Perform. Anal. Sport 2005, 5, 61–71. [Google Scholar] [CrossRef]
  17. Valez, A.; Areces, A.; Blanco, H.; Arce, C. Design and application of a multidimensional battery of performance indicators for evaluating competitive performance in top-level football. Int. J. Sport Sci. 2011, 7, 103–112. [Google Scholar]
  18. Barreira, D.; Garganta, J.; Castellano, J.; Prudente, J.; Anguera, M.T. Evolution of attacking Patterns in elite-level soccer between 1982 and 2010: The application of lag sequential analysis. Rev. Psicol. Deporte 2014, 23, 139–146. [Google Scholar]
  19. García-Rubio, J.; Gómez-Ruano, M.A.; Lago-Peñas, C.; Ibáñez, S.J. Effect of match venue, scoring first and quality of opposition on match outcome in the UEFA Champions League. Int. J. Perform. Anal. Sport 2015, 15, 527–539. [Google Scholar] [CrossRef]
  20. Caballero, P.; García-Rubio, J.; Ibáñez, S.J. Influence of situational variables on the U´18 soccer performance analysis. RETOS Nuevas Tend. Educ. Fís. Deporte Recreac. 2017, 32, 224–227. [Google Scholar]
  21. Taylor, J.; Mellalieu, S.; James, N.; Barter, P. Situation variable effects and tactical performance in professional association football. Int. J. Perform. Anal. Sport 2010, 5, 255–269. [Google Scholar] [CrossRef]
  22. Lago-Ballesteros, J.; Lago-Peñas, C. Performance in team Sports: Identifying the keys to success in soccer. J. Hum. Kinet. 2010, 25, 85–91. [Google Scholar] [CrossRef]
  23. Castellano, J.; Casamichana, D.; Lago-Peñas, C. The use of match statistics that discriminate between successfut and unsuccessfun soccer teams. J. Hum. Kinet. 2012, 31, 139–147. [Google Scholar] [CrossRef]
  24. Gómez-Ruano, M.A.; Gómez-López, M.T.; Jiménez-Sáiz, S.L. Differences between winning and losing teams football match type function by studying performance indicators. Rev. Euroam. Cienc. Deporte 2013, 2, 37–41. [Google Scholar] [CrossRef]
  25. Yiannakos, A.; Armatas, V. Evaluation of de goal scoring Patterns in European Championship in Portugal 2004. Int. J. Perform. Anal. Sport 2006, 121, 223–243. [Google Scholar] [CrossRef]
  26. Lago-Peñas, C.; Martín-Acero, R.; Seirul-lo, F. Team performance in soccer. Modelling the main variables of F.C. Barcelona. Apunts 2007, 90, 51–58. [Google Scholar]
  27. Tenga, A.; Ronglan, L.T.; Bahr, R. Measuring the effectiveness of offensive match-play professional soccer. Eur. J. Sport Sci. 2010, 10, 269–277. [Google Scholar] [CrossRef]
  28. Garganta, J. Análisis del juego en el fútbol. El recorrido evolutivo de las concepciones, métodos e instrumentos. Rev. Entrenamiento Deportivo 2000, 14, 6–13. [Google Scholar]
  29. Gómez-Ruano, M.A. The importance of performance analysis as an emergent research topic in sport sciences. RICYDE Rev. Int. Cienc. Deporte 2017, 13, 1–4. [Google Scholar] [CrossRef]
  30. Reina-Gómez, A.; Hernández-Mendo, A. Football performance indicators review. Rev. Iberoam. Cienc. Act. Fís. Deporte 2012, 1, 1–14. [Google Scholar] [CrossRef] [Green Version]
  31. Ibáñez, S.J.; Feu, S.; García, J.; Parejo, I.; Cañadas, M. Shot differences between professional (ACB) and amateur (EBA) basketball teams. Multifactorial study. Rev. Psicol. Deporte 2009, 18, 313–317. [Google Scholar]
  32. O’Donoghue, P. An Introduction to Performance Analysis of Sport; Routledge Taylor & Francis Group: London, UK; New York, NY, USA, 2015. [Google Scholar]
  33. Ardá, T.; Maneiro, R.; Rial, A.; Losada, J.L.; Casal, C.A. Efficiency analysis of corner kicks in the 2010 World Cup. Trying to identify the explanatory variables. Rev. Psicol. Deporte 2014, 1, 165–172. [Google Scholar]
  34. Lames, M.; Mcgarry, T. On the search for reliable performance indicators in game sports. Int. J. Perform. Anal. Sport 2007, 7, 62–79. [Google Scholar] [CrossRef]
  35. Montero, I.; León, O.G. A guide for naming research studies in Psychology. Int. J. Clin. Health Psychol. 2007, 7, 847–862. [Google Scholar]
  36. Gamonales, J.M.; Muñoz-Jiménez, J.; León, K.; Ibáñez, S.J. Effectiveness of the Launch at FA5 for Blind Persons in 2016 Paralympic Games. Rev. Int. Med. Cienc. Act. Fís. Deporte 2019, 19, 745–764. [Google Scholar] [CrossRef]
  37. Crewson, P. Applied Statistics Handbook; AcaStat Software: Leesburg, VA, USA, 2006. [Google Scholar]
  38. Newell, J.; Aitchison, T.; Grant, S. Statistics for Sports and Exercise Science: A Practical Approach; Routledge: London, UK, 2014. [Google Scholar]
  39. Field, A. Discovering Statistics Using SPSS, 3rd ed.; Sage Publications Ltd: London, UK, 2009. [Google Scholar]
  40. Ciampolini, V.; Ibáñez, S.J.; Nunes, E.; Borgatto, A.; Nascimento, J. Factors associated with basketball field goals made in the 2014 NBA finals. Motriz 2017, 23, 1–7. [Google Scholar] [CrossRef] [Green Version]
  41. García-Rubio, J.; Ibáñez, S.J.; Gómez-Ruano, M.; Sampaio, J. Basketball Game-related statistics discriminating ACB league teams according to game location, game outcome and final score differences. Int. J. Perform. Anal. Sport 2014, 14, 443–452. [Google Scholar] [CrossRef]
  42. Ortega, E.; Villarejo, D.; Palao, J.M. Differences in game statistics between winning and losing rugby teams in the six nations tournament. J. Sports Sci. Med. 2009, 8, 523–527. [Google Scholar] [PubMed]
  43. Koch, C.; Tilp, M. Beach volleyball techniques and tactics: A comparison of male and female playing characteristics. Kinesiology 2009, 41, 52–59. [Google Scholar]
  44. Ibáñez, S.J.; Sampaio, J.; Sáenz-López, P.; Giménez, J.; Janeira, M.A. Game statistics discriminating the final outcome of junior World Basketball Championship Matches (Portugal 1999). J. Hum. Mov. Stud. 2003, 45, 1–19. [Google Scholar]
  45. Castellano, J. Relationship between performance indicators and the success in professional football. Rev. Psicol. Ejerc. Deporte 2018, 13, 41–49. [Google Scholar]
  46. Lapresa, D.; Álvarez, L.; Arana, J.; Garzón, B.; Caballero, V. Observational analysis of the offensive sequences that ended in a shot by the winning team of the 2010 UEFA Futsal Championship. J. Sports Sci. 2013, 31, 1731–1739. [Google Scholar] [CrossRef] [PubMed]
  47. Almeida, C.; Volossovitch, A.; Duarte, R. Penalty kick outcomes in UEFA club competitions (2010–2015): The roles of situational, individual and performance factors. J. Perform. Anal. Sport 2017, 16, 508–522. [Google Scholar] [CrossRef]
  48. Giagazoglou, P.; Katis, A.; Kellis, E.; Natsikas, C. Differences in soccer kick kinematics between blind players and controls. Adapt. Phys. Act. Q. 2011, 28, 251–266. [Google Scholar] [CrossRef] [PubMed]
Figure 1. Distribution of goal throws according to the championship phases. * ASR > |1.96|.
Applsci 11 08933 g001
Figure 2. Distribution of goal throws according to the throwing moments by competition. * ASR > |1.96|.
Applsci 11 08933 g002
Figure 3. Game evolution between the World Cup and the Paralympic Games in Fa5. E.V: Efficiency variable.
Applsci 11 08933 g003aApplsci 11 08933 g003b
Table 1. Variables involved in Fa5 research.
Type of VariablesCategorical Core
IndependentCompetition TypeChampionship
DependentsSituational variablesChampionship phases
Throwing moment
Match status
Final result
Variables of goal throwing in gameStarting zone
Progression type
Throwing zone
Striking situation
Use of blocking
Throwing opposition
Corporal zone
Striking type
Efficiency variableThrowing result
Table 2. Relationship between the “Competition type” variable and the dependent variables.
Competition Type
Variablesχ2gl.Sig. φcSig.Association Level
Championship phases173.34450.000*0.2790.000Low
Throwing moment19.155100.038*0.0930.038Small
Match status8.47220.014*0.0620.014Small
Final result5.83320.054 0.0510.054---
Starting zone15.68330.001*0.0840.001Small
Progression type97.16920.000*0.2090.000Low
Throwing zone127.28530.000*0.2390.000Low
Striking situation51.00630.000*0.1510.000Low
Use of blocking6.68840.151 0.0540.153---
Throwing opposition4.36740.359 0.0440.359---
Corporal zone28.07720.000*0.1120.000Low
Striking type33.98440.000*0.1240.000Low
Throwing result11.16940.025*0.0710.025Small
* p < 0.05; association level [37].
Table 3. Descriptive results and the ASRs of the match status variable.
VariableCompetition Type
2014 World Cup2016 Paralympic Games
n%ASRn%ASR
Match statusWinner26617.8−2.916722.92.9
Loser22715.20.111015.1−0.1
Tie100467.12.345362.1−2.3
ASR > |1.96|.
Table 4. Descriptive results and ASRs of the goal throwing variables in game of the Fa5 study.
VariablesCompetition Type
2014 World Cup2016 Paralympic Games
n%ASRn%ASR
Starting zoneDefensive zone42028.1−1.823231.81.8
Pre-defensive zone30320.21.113418.4−1.1
Pre-offensive zone37525.13.4 *13618.6−3.4 *
Offensive zone39926.7−2.3 *22831.22.3 *
Progression typeCombinatorial15910.6−2.5 *10414.22.5 *
Direct31821.1−8.7 *28338.88.7 *
Fast102068.19.6 *34347.0−9.6 *
Throwing zoneDefensive zone372.50.6152.1−0.6
Pre-defensive zone362.4−0.3192.60.3
Pre-offensive zone39226.211.2 *456.2−11.2 *
Offensive zone103268.9−10.4 *65189.210.4 *
Striking situationPass-control-throwing744.9−2.6 *567.72.6 *
Pass-throwing503.3−5.5 *648.85.5 *
Conduction-throwing127585.26.7 *53673.4−6.7 *
Others986.5−3.0 *7410.13.0 *
Corporal zoneRight foot111774.6−5.3 *61784.55.3 *
Left foot31621.14.9 *9212.6−4.9 *
Others644.31.6212.9−1.6
Striking typeInner foot33623.1−4.6 *23632.34.6 *
Instep-toe98765.92.4 *43960.6−2.4 *
Outer foot291.92.8 *30.4−2.8 *
Heel10.1−1.830.41.8
Others1349.02.3 *456.2−2.3 *
* ASR > |1.96|.
Table 5. Descriptive results and ASRs of the efficiency variable.
VariableCompetition Type
2014 World Cup2016 Paralympic Games
Throwing resultn%ASRn%ASR
Success. Goal322.1−1.1212.91.1
Success. Throwing, no goal with rebound33422.31.414720.1−1.4
Failure. Throwing, no goal and no rebound56037.4−0.828639.20.8
Failure. Outside direct52935.3−0.926936.80.9
Other throws422.82.871.0−2.8
ASR > |1.96|.
Publisher’s Note: MDPI stays neutral with regard to jurisdictional claims in published maps and institutional affiliations.

