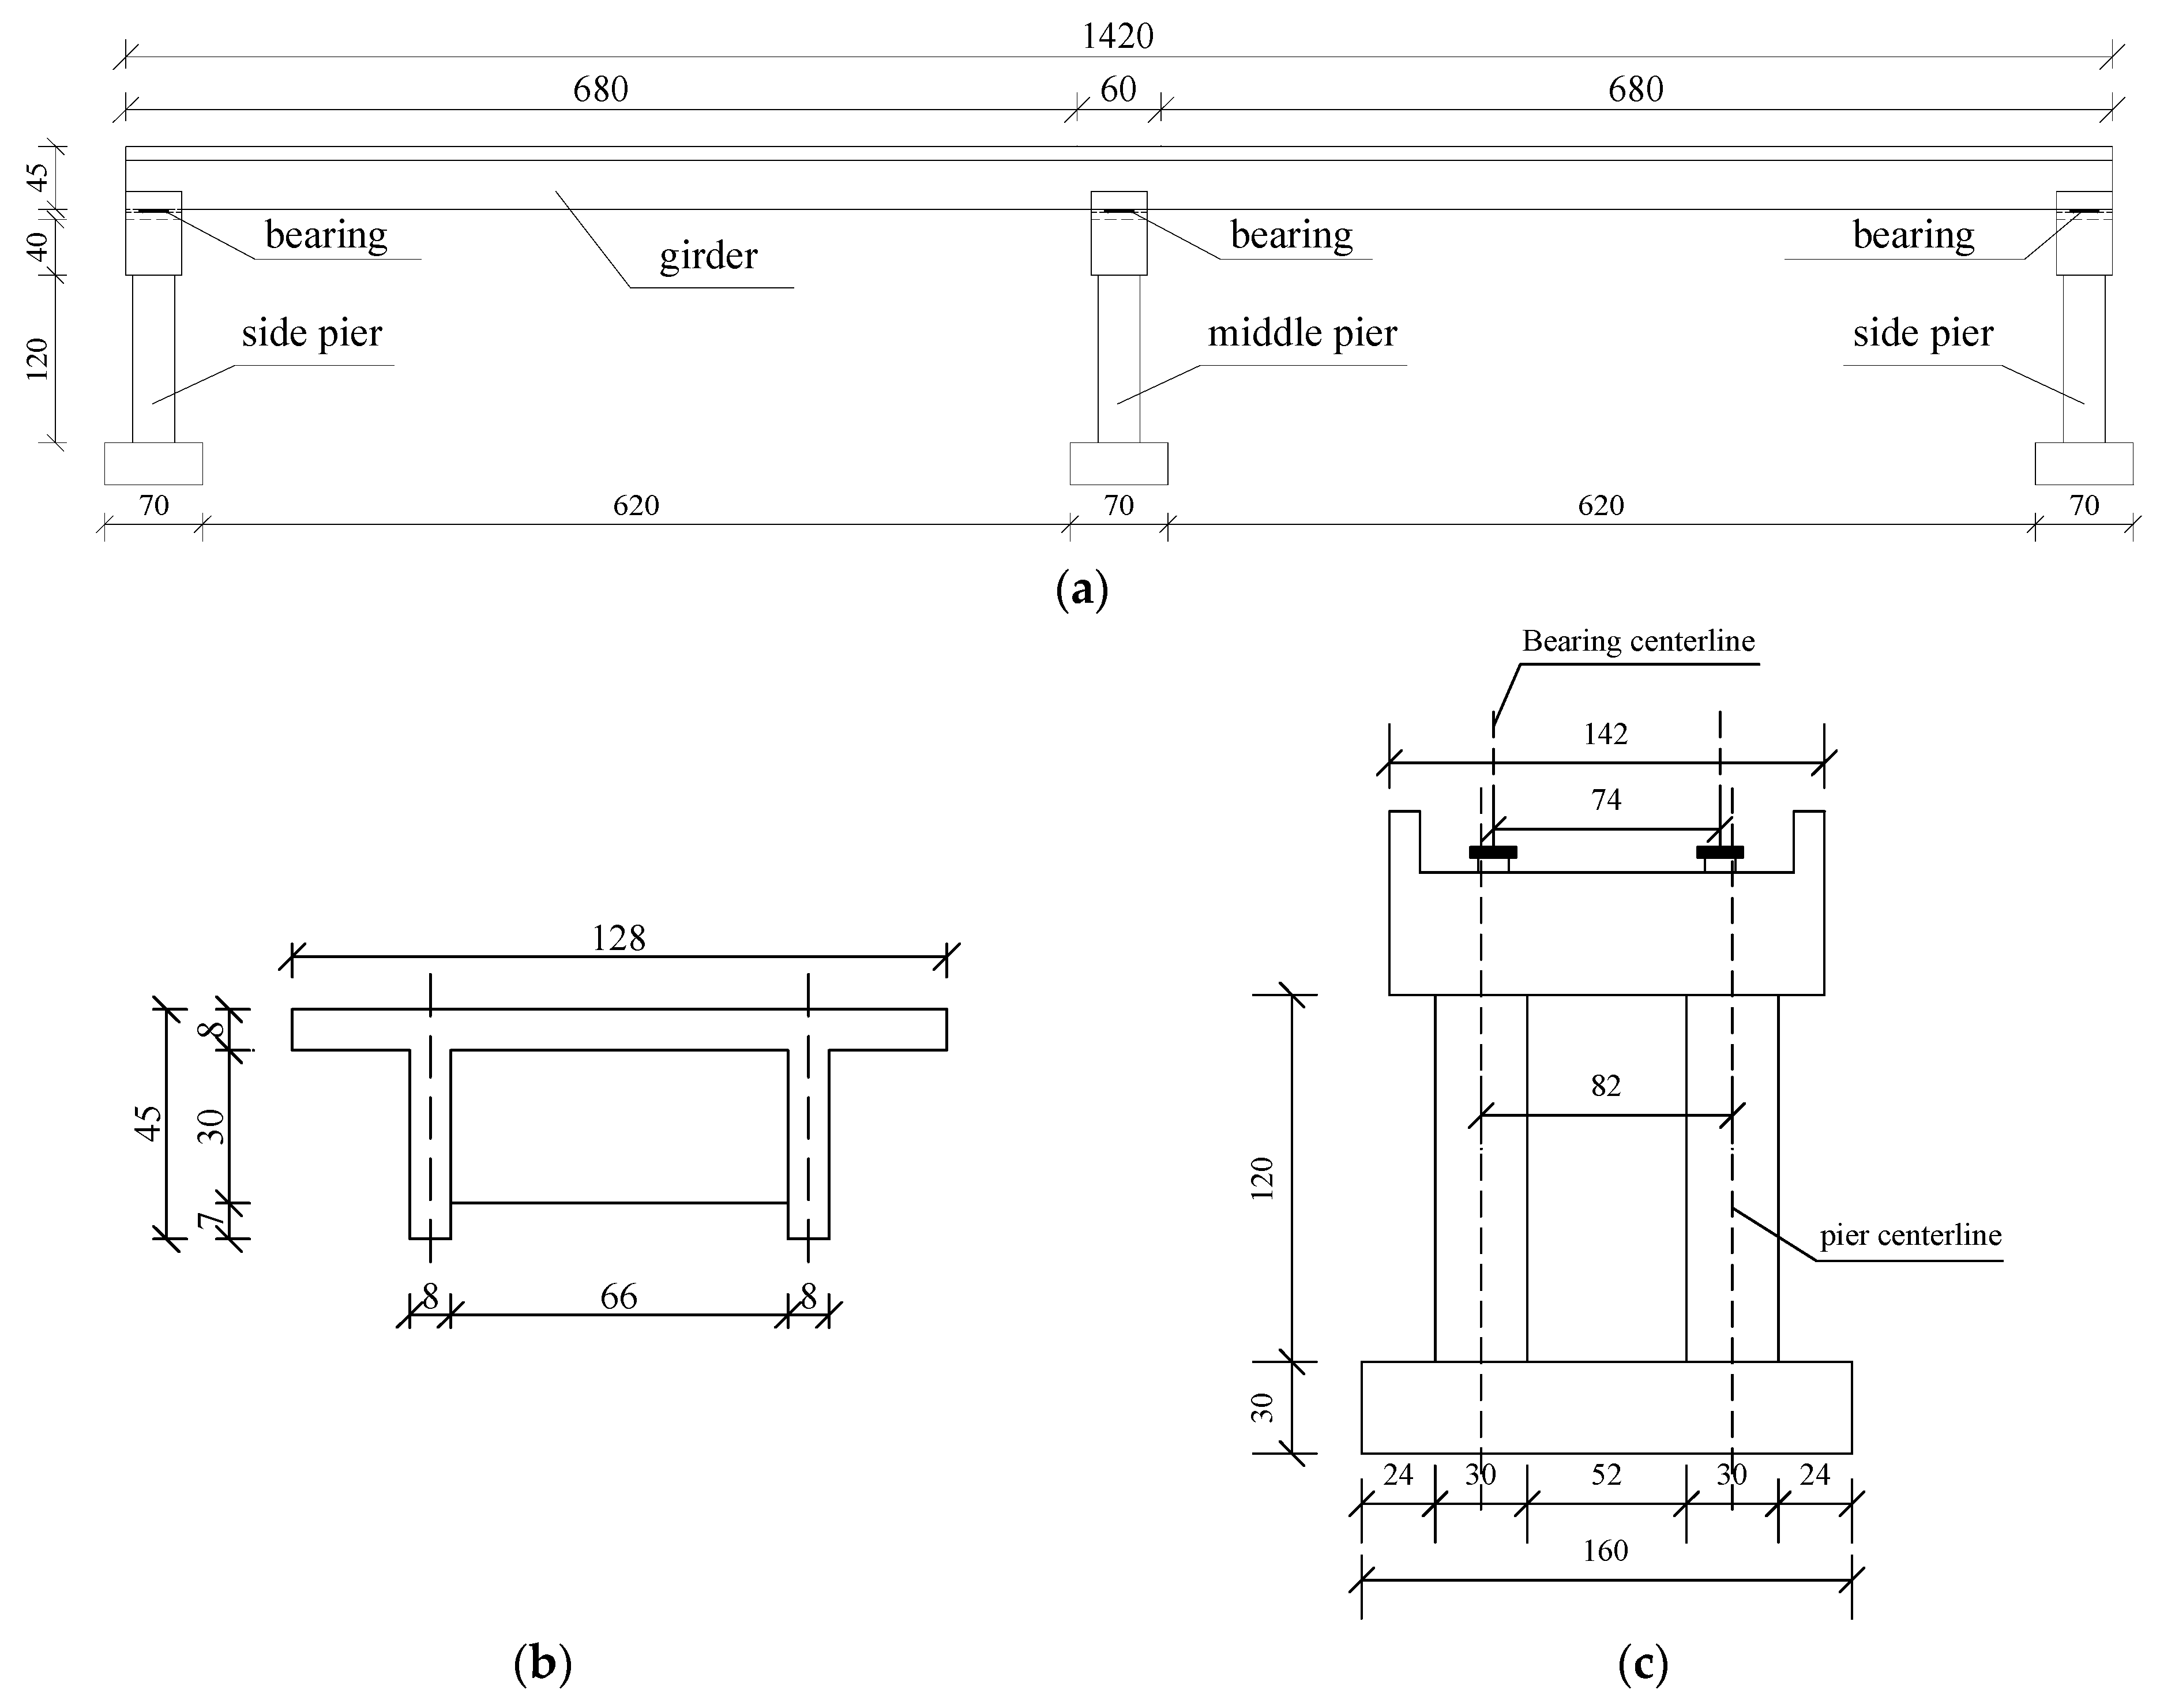
Article

Collapse Analysis of a Two-Span Reinforced Concrete Bridge Model

1
Department of Building Engineering, Jiangsu Open University, Nanjing 210036, China
2
Department of Civil Engineering, Southeast University, Nanjing 210096, China
3
Department of Road, Bridge, Port and Navigation Engineering, Nanjing Vocational Institute of Transport Technology, Nanjing 211188, China
4
Department of Civil Engineering, Fuzhou University, Fuzhou 350108, China
*
Author to whom correspondence should be addressed.
Appl. Sci. 2021, 11(19), 8935; https://doi.org/10.3390/app11198935
Submission received: 17 August 2021 / Revised: 18 September 2021 / Accepted: 22 September 2021 / Published: 25 September 2021
(This article belongs to the Section Civil Engineering)

Abstract

:
The continuous girder bridge is the main type of small- and medium-sized bridges; however, it has poor collapse resistance and suffers frequent earthquake damage. In order to grasp its collapse mechanism and clarify the internal and external factors affecting its collapse resistance, a 1:3-scaled, two-span bridge model subjected to shaking table test research was taken as the research object. The factors such as seismic characteristics, multi-directional seismic coupling, span, pier height, and structural system type were analyzed to determine the influences on the collapse mode of the bridge. The numerical results showed that different ground motion characteristics led to different collapse modes. Vertical ground motion had little effect on the structural response of the bridge. The change of span and pier height significantly changed the collapse resistance. A seismic isolation design could improve the anti-collapse performance, but the collapse mode varied with the system. The final anti-collapse design suggestions could provide reference for the seismic reinforcement of existing continuous girder bridges and the seismic design of continuous girder bridges that will be constructed.

1. Introduction

Although the continuous girder bridge is the main type of highway bridge, its structural form is simpler than that of long-span bridges. Therefore, few researchers pay attention to it. It has been found that the continuous girder bridge is vulnerable to seismic waves, and many collapse events occur [1,2,3]. In order to improve the collapse resistance of this type of bridge, studying the collapse mechanism and the influencing factors of collapse is key.
In view of the seismic problem of girder bridges, scholars were concerned about different isolation systems and their effects [4]. Li et al. [5] and Mahjoubi et al. [6] studied the collision problem under earthquakes using a shape memory alloy pseudo-rubber shock-induced device and pipe dampers, respectively. The control effect of those devices on superstructure collision was remarkable, but the control effect on structural collapse under large earthquakes was not present.
In terms of collapse analysis, many researchers conducted research based on typical collapse events to explain the reasons for collapse, such as material corrosion [7,8,9,10,11,12], improper construction [13], heavy vehicle partial load [14,15], vehicle impact [16,17,18], site displacement [19,20], tsunami damage [21], and excessive structural response [22,23]. A small number of these events was caused by earthquakes. Bhattacharya et al. analyzed the collapse of Showa Bridge during the 1964 Niigata earthquake, and the increase of the natural vibration period caused by the liquefied ground was the main reason for resonance with ground motion [24]. Nan Aye et al. elucidated the damage mechanism of Tawarayama Bridge, which incurred severe damage by the 2016 Kumamoto Earthquake, and pointed out that the buckling design of the lower lateral members was important [25]. Hu et al. developed the simplified rigid surface coupling method to analyze the collapse of Gaoyuan Bridge in the Wenchuan earthquake, and found the oversize longitudinal displacement caused the girder falling [26]. These scholars have revealed the collapse mechanism of specific girder bridges, but their conclusions cannot be extended to other bridges. If the structural design parameters change, the failure mode may change. When the reinforced concrete continuous beam bridge was discussed, most scholars conducted in-depth research on the damage and failure of the pier column [27]. The collapse mode of the whole bridge system was less explored.
Considering that there is little research on collapse mode of continuous girder bridges, the collapse mechanism and the influencing factors of the collapse was our main study. The research team for this paper carried out an experimental study and collapse analysis of a two-span continuous bridge under a strong earthquake. The bridge model in the shaking table test was a single structure with a specific span and pier height. The relationship between the collapse mode and the structural design parameters or the seismic input characteristics was not clear. Therefore, this paper presents further research on the above problems and tries to reveal the critical factors leading to the collapse of a two-span continuous girder bridge. Finally, the design suggestions for the bridge are put forward, providing a reference for the seismic design of bridges that will be built and the seismic reinforcement of existing bridges.

2. Description of Bridge Model

The prototype bridge structure is long and of great quality. In order to study its seismic response, the bridge must be scaled. Considering the test conditions, the geometric similarity ratio of 1:3 was finally determined. For comparison with the performance of the prototype bridge, the materials of the scaled model were the same as the prototype materials, with similar ratios of gravity, stress, and strain and an elastic modulus equal to 1, as shown in Table 1. Based on the shaking table test results of the two-span continuous bridge model, the collapse resistance of this structure and its influencing factors were further explored.
The scaled model was a two-span continuous girder bridge with a main girder length of 14.2 m (see Figure 1a). The cross section was two T-beams, and the bearing was an ordinary plate rubber bearing. The width of the T-beams was 128 cm and the height of the girder was 45 cm, as shown in Figure 1b. The substructure comprised two-column reinforced concrete piers with diameters of 30 cm. The detailed geometric arrangement and reinforcement design of the pier are shown in Figure 1c and Figure 2. The concrete strength title of the beam and pier was C30 and the compressive strength was 32 MPa. The reinforcement was HPB235 grade steel. The yield strength and the tensile strength of Φ10 bar were 351 MPa and 558 MPa, respectively. The yield strength and the tensile strength of Φ6.5 bar were 350 MPa and 531 MPa, respectively. Figure 3 shows the picture of the bridge model.
The shaking table test of the structure was carried out to obtain the seismic response characteristics for medium and small earthquakes in the engineering structure laboratory of the Civil Engineering Test Center of Fuzhou University. The seismic simulation shaking table array system consists of a 4 m × 4 m middle table and two 2.5 m × 2.5 m side tables. The test bridge models included the conventional system of ordinary rubber bearings and the isolation system replaced by high damping rubber (HDR) bearings. Except for the different bearings, the other components were completely consistent. More details are illustrated in the paper on experimental research [28]. Unfortunately, limited to the conditions of the test equipment, the bridge model was not failed in the end. The collapse mode was only studied by numerical analysis.

3. Finite Element Analysis Model

3.1. Element and Material

LS-DYNA software [29] was used to study the failure process of the structure. A concrete block was simulated by the solid element (solid164), and its cube compressive strength, uniaxial compressive strength, uniaxial tensile strength, and elastic modulus were 32 MPa, 17.4 MPa, 1.39 MPa, and 2.75 × 10⁴ MPa, respectively. For the constitutive relationship of concrete, we adopted the formula in code for the design of concrete structures [30], and the descending section was subjected to the treatment method of Hongnestad, as shown in Figure 4a. The concrete material would fail when the compressive strain reached 0.0033 or the tensile stress reached 2.24 MPa. The material model number of concrete was *Mat_024 in the LS-DYNA software. The steel bar was simulated by the link element (link160). The yield strength and ultimate strength of the vertical reinforcement were 351 MPa and 558 MPa, respectively. The yield strength and ultimate strength of the stirrup were 350 MPa and 531 MPa, respectively. The elastic modulus of the steel bar (E in Figure 4b) was 2 × 10⁵ MPa, and the tangential modulus after yield (Et in Figure 4b) was 2 × 10³ MPa, which was a bilinear isotropic hardening mode, as shown in Figure 4b. The material model of *Mat_003 in LS-DYNA was used to simulate steel reinforcements. The steel bar and concrete were connected by a joint node, without considering the slip and fracture of the steel bar and the constraint effect of the steel bar on concrete.
The spring element (combi165) was adopted to simulate the laminated rubber bearing. Mechanical properties of bearings were simulated by spring material model *MAT_S01. The longitudinal, transverse, and vertical stiffnesses of the side bearings were 550 kN/m, 800 kN/m, and 2 × 10⁵ kN/m, respectively. The longitudinal, transverse, and vertical stiffnesses of the middle bearing were 955 kN/m, 1 × 10³ kN/m, and 5 × 10⁵ kN/m, respectively. When the shear stress exceeded the ultimate shear stress of bearings, the bearing was destroyed. The interaction between the pier and the girder after bearing failure was simulated by the contact mode, and the static and dynamic friction coefficients were 0.3 and 0.15, respectively. The mass element (mass166) was used in the simulation of the mass block. Each mass point was 9.3 kg; thus, the total mass was 6 tons. The specific modeling process is shown in Figure 5.

3.2. Finite Element Model Modification

The above continuous bridge model was studied with a shaking table test and environmental vibration test [31]. The finite element model was updated, taking the measured modal frequency as the modification target. The updating effect is shown in Table 2.
The effectiveness of the model was verified by the comparison of the test value and calculated value. Relative longitudinal displacements between the pier and the beam under two longitudinal seismic wave input conditions with a PGA of 0.05 g are illustrated in Figure 6. This shows that the calculation results of the finite element model were reliable and the calculation accuracy was acceptable.

3.3. Seismic Waves

In the shaking table test, four different types of seismic waves were tested considering the influence of different site conditions, which were the Landers seismic wave, Cerro Prieto seismic wave, El Centro seismic wave, and Chi−Chi seismic wave. Two representative ground motions were selected for collapse analysis, which were the El Centro seismic wave and Chi−Chi seismic wave. Their seismological characteristics are shown in Table 3. According to the time similarity ratio, the duration of the input ground motion of the bridge model was 0.408 times that of the original ground motion. A longitudinal test seismic wave with a peak ground acceleration (PGA) of 0.05 g is depicted in Figure 7. The PGA of the seismic waves’ input in the collapse analysis rose gradually from 0.1 g until the bridge specimen collapsed.

4. Analysis of Collapse Mode

4.1. Influence of Ground Motion Characteristics

When the PGA of the El Centro longitudinal input was 1.2 g, the failure of the middle pier of the two-span continuous beam bridge model in the ordinary system caused serious damage to the main beam, which exhibited a pronounced deflection above the same middle pier, as shown in Figure 8.
When the Chi-chi wave was longitudinally input and the PGA was 1.2 g, the main beam of the two-span continuous beam bridge model of the ordinary system was damaged first, and then the right-side pier and the beam separated, aggravating the damage of the main beam and breaking the beam; finally, the second span of the girder fell, as shown in Figure 9.
In summary, the El Centro wave mainly damaged the pier, and the displacement response was not the main factor controlling the collapse. The relative displacement of the side pier and the beam caused by the Chi−chi wave was significant, and the main risk was beam lowering.

4.2. Influence of Multidirectional Seismic Coupling

In the previous shaking table test, due to equipment constraints, only horizontal ground motion input was carried out. The numerical analysis also followed the input mode of the shaking table test in the horizontal direction, so the collapse mode obtained did not consider the influence of vertical ground motion input. However, in an actual earthquake, the input of a seismic wave imposes both vertical and horizontal loading at the same time. Therefore, the coupling effect of vertical ground motion and horizontal ground motion was considered in this paper, and the longitudinal collapse mode of a two-span continuous bridge model was analyzed. The test waves were the El Centro wave and Chi−chi wave. According to the information of original ground motion, the peak ratio of vertical ground motion and horizontal ground motion was adjusted to the peak ratio of the original wave; thus, the peak ratios of the El Centro wave and Chi-chi wave were 0.6 and 0.8, respectively.
The case of the El Centro wave with a 0.4 g longitudinal PGA was selected for analysis. The time history curve of vertical ground motion in this case is shown in Figure 10, and the PGA was 0.24 g. After adding the vertical ground input, the longitudinal relative displacement between the superstructure and substructure was basically not changed. From the comparison curve of Figure 11, it can be seen that the two curves almost coincided, and the maximum longitudinal relative displacement increased from 12.14 mm to 12.45 mm. The peak acceleration response of the middle pier cap increased slightly from 6.75 m/s2 to 7.68 m/s2 under unidirectional input. The main compressive strain at the bottom of the middle pier also increased from 519 με to 531 με, as shown in Figure 12 and Figure 13.
In the analysis of the 0.4 g El Centro bidirectional wave case, it could be seen that the coupling effect of vertical ground motion and horizontal ground motion was not significant. The bridge structure finally failed in the form of the collapse of the main girder due to the failure of the middle pier. The PGA was still 1.2 g, and the specific collapse process was similar to that in Figure 8.
Then, the longitudinal Chi−chi wave of 0.4 g PGA was selected for analysis. The time history curve of vertical ground motion in this condition is shown in Figure 14, and the PGA was 0.32 g. After adding vertical ground motion in the longitudinal seismic condition, the response of the structure showed no obvious change. From Figure 15, the maximum longitudinal relative displacement was 15.47 mm, which was basically consistent with the value of 15.53 mm under unidirectional input. The acceleration response of the middle pier increased from 6.59 m/s2 to 7.52 m/s2 under unidirectional input, as shown in Figure 16. The response diagram of the maximum principal compressive strain at the bottom of the middle pier showed that the force of the pier column was slightly weakened, from the maximum compressive strain of 611 με to 602 με (see Figure 17).
From the analysis of the bidirectional input condition of the Chi-chi wave with 0.4 g PGA, it was found that the vertical and horizontal coupling of ground motion was not obvious. The two-span continuous beam bridge model finally collapsed in the 1.2 g Chi−chi wave bidirectional input condition, and the collapse mode was a falling beam. The process was as follows: The middle bearings failed at 3.05 s, and the main beam cracked at the lower edge of the section near the middle pier at 3.35 s. The right-side pier and the main beam were about to be separated when t was 16.85 s; thus, one end of the main beam became a cantilever beam at 16.88 s. The negative bending moment at the upper edge of the damaged section near the middle pier of the main beam caused cracking on the upper edge of the section at 17.48 s; therefore, the main beam broke at 17.63 s, the second span girder fell, and the model bridge reached the collapse stage at this time, as shown in Figure 18. This collapse mode was similar to that in the 1.2 g longitudinal Chi−chi wave input case (see Figure 9).
In general, whether under Chi−chi wave or El Centro wave conditions, the coupling effect of vertical and horizontal longitudinal input ground motions was not obvious in the shaking process, as shown in Table 4. The interaction between the two can be ignored, and only the longitudinal unidirectional input was used to study the subsequent collapse failure.

4.3. Influence of Span

The span of the prototype bridge was 10 m, 16 m, 20 m, and 25 m. According to the similarity ratio of 1:3, the span of the finite element model was 3.3 m, 5.3 m, 6.7 m, and 8.3 m. Considering the influence of span variation on the collapse process of the two-span bridge model, the parametric analysis was carried out. The selected longitudinal ground motions were the El Centro wave and Chi−chi wave, without considering the influence of vertical ground motion. The longitudinal collapse modes of the four structures under these two ground motions were obtained by finite element analysis, as shown in Table 5 and Table 6. The larger the span, the greater the axial pressure of the column. The increase of the mass of the superstructure was the main reason for the increase of the force of the pier column and the relative displacement between the side pier and the beam.
Therefore, the smaller the span, the later the collapse time of the structure, and the greater seismic intensity could be endured. The collapse modes of the same type of ground motion input were basically similar. The two-span continuous girder bridge under the El Centro wave input condition was dominated by pier failure, and the collapse phenomenon of the bridge model under the Chi−chi wave input condition was main girder sliding.

4.4. Influence of Pier Height

The influence of different pier heights on the collapse process of the model bridge was studied. We assumed that the substructure form of the two-span continuous beam bridge model was unchanged; that is, the pier section size and reinforcement were completely the same, with only the pier height changed to 1.2 m, 1.8 m, 2.4 m, 3 m, and 3.6 m. The selected longitudinal ground motions were still the El Centro wave and Chi−chi wave. Without considering the influence of vertical ground motions, the longitudinal collapse modes of these five structures under two different ground motions were specified by finite element analysis, as shown in Table 7 and Table 8.
The higher the pier column, the smaller the longitudinal stiffness of the model bridge. The variation of the seismic response of the bridge model with pier height varied with different types of ground motion.
The predominant period of the El Centro wave was 0.19 s. When the pier height of the bridge model increased from 1.2 m to 3.6 m, the longitudinal self-vibration period of the bridge was greater than the predominant period and gradually moved away from the predominant period. Thus, the acceleration response of the main beam decreased, and the bridge model could withstand a greater intensity of this kind of earthquake.
In contrast, the predominant period of the Chi−chi wave was 0.57 s, which was more than the natural periods of vibration of these five bridge models. With the increase of the height of the pier column, the natural periods of vibration moved closer to the predominant period of Chi-chi wave, meaning that the acceleration response and displacement response of the structure increased and the collapse state appeared earlier, as shown in Table 7 and Figure 19.

4.5. Influence of Structural Systems

4.5.1. Isolation System

The traditional seismic design method is to improve the strength and stiffness of the structure to enhance the resistance of the structure, which will undoubtedly greatly increase the construction cost. The structural control theory developed in the past 30 years can be used to improve the vibration performance of the structure under catastrophic earthquake excitation. The structural vibration control technology can be divided into four categories according to whether the control measures adopted need external energy: passive control, active control, semi-active control, and hybrid control. The vibration control method of the continuous beam bridge basically is passive control method. Passive control of the continuous beam bridge includes bearing isolation, energy dissipation, and restraint device, etc. Bearing isolation is the most common method.
The HDR bearing is one kind of isolation bearing. HDR increases the damping of the bearing by improving the formula of rubber, and its damping ratio can reach about 0.15, which is less affected by temperature. It integrates vertical bearing capacity, horizontal restoring force, and damping. The initial elastic stiffness can play a braking effect on wind load, while the HDR bearing plays a role of damping energy dissipation under large displacement. On the one hand, it maintains the good mechanical properties of the plate rubber bearing; on the other hand, the HDR has high viscosity and damping, so it can absorb seismic energy and reduce seismic response in the earthquake. In addition, the cost of HDR bearings is not high and environmental impact is small.
After the shaking table test of the bridge model of ordinary rubber bearings, the ordinary rubber bearings were replaced with HDR bearings and the isolation system was investigated by the shaking table test. The results showed that the seismic response was significantly reduced [28]. The collapse modes before and after isolation were then obtained by numerical analysis. Taking the El Centro wave case as an example, under the longitudinal input of a 1.2 g seismic wave, the failure of the middle pier caused serious damage to the main beam, which exhibited a pronounced deflection above the same middle pier. In the HDR system, the collapse occurred under the longitudinal input of 2 g PGA, and the failure mode was the same as that of the ordinary system [32]. It could be seen from the above that the isolation bearings played a role in delaying the collapse of the structure but maintained the basic characteristics of the original structure.

4.5.2. Shock Mitigation System

Damping is the friction and other hindrances that attenuate free vibration, and the special components placed in the structural system that can provide movement resistance are dampers [33,34]. The commonly used dampers on bridges are fluid viscous dampers, which have been widely used in structural engineering. They have no initial stiffness and will not affect other calculations of the structure (such as period, vibration mode, etc.). It can not only reduce the displacement of dynamic response but also control the force, so as to decrease the structural cost.
(1)
Parameter Design
If the structural system was a damping system rather than an isolation system, the collapse modes would be different. The commonly used fluid viscous damper was chosen, and the damping system is described below. Dampers are usually located at the maximum displacement of the structure, so the dampers were symmetrically set in two simply supported ends of the two-span continuous beam bridge model, with a total of two dampers (see Figure 20).
A viscous damper is a velocity-dependent damper whose damping force can be expressed as
F = C v α
where C is the damping coefficient, v is velocity, and α is the velocity index. When the local vibration input is certain, v is the determined value and the damping force is related to the values of C and α. F increases with C. If α decreases, the hysteresis curve of the damper becomes squarer, the area increases, and the energy dissipation effect is improved. However, when α is close to 0, vα is close to 1 and the damping force is basically only related to C, which will lose the basic characteristics of the velocity correlation of the viscous damper and violate the original intention of the design. Therefore, the value of the velocity index must not be too small and is usually selected between 0.2 and 1. According to the characteristics of the research bridge in this paper, the optimization range of damper parameters is determined as shown in Table 9. The damping coefficient increases from 1 kN·(s/m)α to 12 kN·(s/m)α when the velocity index varies from 0.2 to 1. The 42 structures were subjected to El Centro seismic waves with PGA of 0.4 g. The velocity index and damping index of the damper directly affected the actual output, output rate, and maximum stroke of the damping force, as shown in Figure 21 and Figure 22.
When the velocity index is determined, the larger the damping coefficient, the larger the damping force peak value generated by the damper and the smaller the piston rod stroke. When the damping coefficient is constant, the velocity index decrease will result in higher nonlinearity, a larger actual output of the damper, and a smaller required stroke. When the damping coefficient is large enough, the velocity index can be increased and the damping force is similar to that generated by a small damping coefficient and small velocity index. For example, if α = 0.4, C = 10 kN·(s/m)0.4, then Fmax = 6.40 kN, Dmax = 9.04 mm; if α = 0.2, C = 8 kN·(s/m)0.2, then Fmax = 6.48 kN, Dmax = 8.18 mm. The damping forces of the two dampers are equivalent, but the latter has a small stroke. The damper control of the structure is reflected in two aspects: force and deformation control. Considering the characteristics of seismic damage and the collapse failure of continuous beam bridges, displacement control is important. Sometimes the substructure has a large displacement response under the condition of small shocks, which leads to serious consequences of falling beams. Therefore, the relative displacement of the pier and the beam at the simply supported end of the two-span continuous beam model bridge are analyzed. The peak value of longitudinal relative displacement is listed in Figure 23.
For all the conditions except scheme 1 when C = 1 kN·(s/m)α, schemes 30 and 37 when C = 2 kN·(s/m)α, and scheme 38 when C = 4 kN·(s/m), the setting of the damper increased the relative displacement between the side pier and the beam, but the increase was less than 0.5 mm. This shows that an excessively small damping coefficient is not conducive to the displacement control of the damper. With the increase of the damping coefficient, the relative displacement was gradually weakened by the damper. If the isolation effect of the HDR bearings in Section 4.5.1 is taken as the optimization goal, the number of damper design schemes can be reduced from 42 to 12, as listed in Table 10.
The final design scheme needed to be further screened after analyzing the comprehensive stress of the bridge. Figure 24 shows that when the velocity index was constant, the bending moment of the middle pier decreased with the increase of the damping coefficient. Under the same damping coefficient, the smaller the velocity index, the better the internal force control. Then, taking the isolation effect of HDR bearings as a reference, the scheme was screened, and schemes 3, 4, 6, 7, 8, 9, 10, and 11 of Table 9 were retained. Among the eight schemes, the damping coefficient was in the range of 8–12 kN·(s/m)α and the velocity index was in the range of 0.2–0.4. From the design perspective, one of these could be arbitrarily selected as the final scheme. Considering the economy and nonlinear degree, scheme 8 in Table 9 was finally selected as the viscous damper design scheme in this paper: C = 10 kN·(s/m)0.4, α = 0.4. Then, the damping material was used to simulate the dampers in LS-DYNA.
(2)
Collapse Mode
The El Centro wave case was taken as an example to compare the collapse modes of the damping system and the isolation system. Under the action of longitudinal unidirectional El Centro seismic waves, the bridge model of the fluid viscous damper system eventually collapsed under the condition of 1.4 g PGA, as shown in Figure 25. Compared with the original system and isolation system, the collapse mode of the shock mitigation system was obviously different. Although the seismic intensity of the resistance was less than the isolation system, thanks to the setting of the damper, the main beam did not fall even if the damage of the middle pier and the main beam was serious, which provided a guarantee for the safety of the structure and for personnel to escape.

5. Suggestions for Anti-Collapse Design

Based on the above study of influencing factors, it is suggested that the span of continuous beam bridges should be reasonably designed. In order to ensure that the structure has good anti-collapse ability, long span structures are not preferred. The height of the pier should consider the site conditions; thus, its natural period of vibration should be as far from the predominant period as possible. In the case of permitted conditions, it is recommended to choose the isolation system or the damping system. The damping system is more preferable in high-seismic-intensity areas due to the significant displacement control effect and the comprehensive performance. The anti-collapse design of continuous girder bridges could be carried out as shown in Figure 26.

6. Conclusions

This paper discussed the influence of different structural parameters and ground vibration conditions on the collapse mode of continuous beam bridges. The main conclusions can be summarized as follows.
  • The ground motion of the short predominant period is more likely to cause pier damage, while the ground motion of the long predominant period is more likely to cause excessive relative displacement between upper and lower structures and beam lowering damage.
  • The coupling effect of vertical and longitudinal input ground motions was not obvious in the collapse process, and the interaction between the two can be ignored in the collapse analysis.
  • The increase in the span improved the axial compression of the pier column and the seismic response of the main beam and the pier column. Therefore, controlling the span length of the bridge can improve the collapse resistance of the structure and delay the collapse time.
  • The increase in pier height caused an extended natural vibration period of the bridge structure. The relationship between the predominant period of ground vibration and the increased structural natural vibration period changed accordingly. If the two were closer, the seismic response would be more significant.
  • Changing the structural system to an isolation system or shock mitigation system could effectively improve the collapse resistance. The two control systems had different effects on the collapse mode. The isolation system reduced the seismic response of the superstructure and delayed the collapse time, but the mechanical mechanism of the structure remained unchanged. The shock mitigation system increased the structural damping and constraint. The increase of structural damping reduces the earthquake response, and the increase of structural constraints reduces the risk of falling beams.
  • An anti-collapse design idea for a continuous beam bridge was provided. It was recommended to choose the shock isolation design or shock absorption design according to the site situation, and the pier height and span size should be moderate.
It should be noted that the above research results are based on limited varieties of ground motion. The research in this paper only analyzed the collapse modes of the two-span reinforced concrete bridge model under two representative ground motions. Further studies and supplements are needed for more types of continuous girder bridges under a large number of ground motions.

Author Contributions

The authors contributed equally to this work. Y.L. (Yale Li) analyzed the data and finished the manuscript writing. Z.Z. provided ideas for this manuscript. B.Y. provided analysis tools. Z.X. was responsible for project consultation. Y.L. (Yuanzheng Lin) managed the analysis data. J.L. graphed the data. All authors have read and agreed to the published version of the manuscript.

Funding

This research was sponsored by the National Natural Science Foundation of China (grant No. 52008187) and Qinglan Project of Jiangsu Province of China.

Institutional Review Board Statement

Not applicable.

Informed Consent Statement

Not applicable.

Data Availability Statement

Data sharing not applicable.

Acknowledgments

The authors greatly appreciate the financial support from the National Natural Science Foundation of China (Grant No.52008187) and the Qing Lan Project.

Conflicts of Interest

The authors declare no conflict of interest regarding the publication of this manuscript.

References

  1. Yen, W.P.; Chen, G.; Yashinski, M.; Hashash, Y.M.A. Bridge Lessons Learned from the Wenchuan, China, Earthquake. Transp. Res. Rec. 2010, 2202, 102–108. [Google Scholar] [CrossRef]
  2. Abrahamczyk, L.; Maiwald, H.; Schwarz, J.; Lobos, D. The Magnitude 8.8 Maule (Chile) Earthquake of February 27, 2010-Engineering analysis of earthquake damage. Bautechnik 2010, 87, 462–473. [Google Scholar] [CrossRef]
  3. Sakellariadis, L.; Anastasopoulos, I.; Gazetas, G. Fukae bridge collapse (Kobe 1995) revisited: New insights. Soils Found. 2020, 60, 1450–1467. [Google Scholar] [CrossRef]
  4. Yang, C.; Cai, X.; Lai, Z.; Yuan, Y. Hybrid Test on a Simply Supported Bridge with High-Damping Rubber Bearings. Front. Built Environ. 2020, 6, 141. [Google Scholar] [CrossRef]
  5. Li, S.; Guo, A.; Li, H.; Mao, C. An analysis of pounding mitigation and stress waves in highway bridges with shape memory alloy pseudo-rubber shock-absorbing devices. Struct. Control Health Monit. 2016, 23, 1237–1255. [Google Scholar] [CrossRef]
  6. Mahjoubi, S.; Maleki, S. Pipe dampers as passive devices for seismic control of isolated bridges. Struct. Control Health Monit. 2016, 24, e1869. [Google Scholar] [CrossRef]
  7. De Domenico, D.; Messina, D.; Recupero, A. A Combined Experimental–Numerical Framework for Assessing the Load-Bearing Capacity of Existing PC Bridge Decks Accounting for Corrosion of Prestressing Strands. Materials 2021, 14, 4914. [Google Scholar] [CrossRef]
  8. Invernizzi, S.; Montagnoli, F.; Carpinteri, A. Fatigue assessment of the collapsed XXth Century cable-stayed Polcevera Bridge in Genoa. Procedia Struct. Integr. 2019, 18, 237–244. [Google Scholar] [CrossRef]
  9. Colajanni, P.; Recupero, A.; Ricciardi, G.; Spinella, N. Failure by corrosion in PC bridges: A case history of a viaduct in Italy. Int. J. Struct. Integr. 2016, 7. [Google Scholar] [CrossRef]
  10. Hu, Y.C.; Tan, Y.H.; Xi, F. Failure assessment and virtual scenario reproduction of the progressive collapse of the FIU bridge. Eng. Struct. 2021, 227, 111423. [Google Scholar] [CrossRef]
  11. Salem, H.M.; Helmy, H.M. Numerical investigation of collapse of the Minnesota I-35W bridge. Eng. Struct. 2014, 59, 635–645. [Google Scholar] [CrossRef]
  12. Liao, M.; Okazaki, T.; Ballarini, R.; Schultz, A.E.; Galambos, T.V. Nonlinear finite-element analysis of critical gusset plates in the I-35W bridge in Minnesota. J. Struct. Eng. 2011, 137, 59–68. [Google Scholar] [CrossRef]
  13. Xu, X.; Wang, J.; Wei, J.; Taciroglu, E.; Dai, F.; Peng, W. A forensic investigation of the Taihe arch bridge collapse. Eng. Struct. 2018, 176, 881–891. [Google Scholar] [CrossRef]
  14. Shi, X.; Zhou, Z.; Ruan, X. Failure Analysis of a Girder Bridge Collapse under Eccentric Heavy Vehicles. J. Bridg. Eng. 2016, 21, 05016009. [Google Scholar] [CrossRef]
  15. Zhuang, D.; Xiao, R.; Jia, L.; Sun, B. Failure analysis for overall stability against sliding and overturning of a girder bridge. Eng. Fail. Anal. 2019, 109, 104271. [Google Scholar] [CrossRef]
  16. Sun, W.; Fan, W.; Yang, C.; Peng, W. Lessons learned from vehicle collision accident of Dongguofenli Bridge: FE modeling and analysis. Eng. Struct. 2021, 244, 112813. [Google Scholar] [CrossRef]
  17. Cao, R.; Agrawal, A.K.; El-Tawil, S.; Wong, W. Overheight impact on bridges: A computational case study of the Skagit River bridge collapse. Eng. Struct. 2021, 237, 112215. [Google Scholar] [CrossRef]
  18. Stark, T.D.; Benekohal, R.; Fahnestock, L.A.; LaFave, J.M.; He, J.; Wittenkeller, C. I-5 Skagit river bridge collapse review. J. Perform. Construct. Facil. 2016, 30, 04016061. [Google Scholar] [CrossRef] [Green Version]
  19. Sun, J.; Zhang, J.; Huang, W.; Zhu, L.; Liu, Y.; Yang, J. Investigation and finite element simulation analysis on collapse accident of Heyuan Dongjiang Bridge. Eng. Fail. Anal. 2020, 115, 104655. [Google Scholar] [CrossRef]
  20. Peng, W.; Tang, Z.; Wang, D.; Cao, X.; Dai, F.; Taciroglu, E. A forensic investigation of the Xiaoshan ramp bridge collapse. Eng. Struct. 2020, 224, 111203. [Google Scholar] [CrossRef]
  21. Salem, H.; Mohssen, S.; Nishikiori, Y.; Hosoda, A. Numerical Collapse Analysis of Tsuyagawa Bridge Damaged by Tohoku Tsunami. J. Perform. Constr. Facil. 2016, 30, 04016065. [Google Scholar] [CrossRef]
  22. Cheng, F.Y.; Lou, K.Y. Assessment of a bridge collapse and its design parameters for Northridge earthquake. In Post-Earthquake Rehabilitation and Reconstruction; Pergamon: New York, NY, USA, 1996; pp. 7–20. [Google Scholar]
  23. Lee, T.Y.; Hung, W.H.; Chung, K.J. Seismic-induced collapse simulation of bridges using simple implicit dynamic analysis. Eng. Struct. 2018, 177, 1–11. [Google Scholar] [CrossRef]
  24. Bhattacharya, S.; Tokimatsu, K.; Goda, K.; Sarkar, R.; Shadlou, M.; Rouholamin, M. Collapse of Showa Bridge during 1964 Niigata earthquake: A quantitative re-appraisal on the failure mechanisms. Soil Dyn. Earthq. Eng. 2014, 65, 55–71. [Google Scholar] [CrossRef] [Green Version]
  25. Aye, M.N.; Kasai, A.; Shigeishi, M. An investigation of damage mechanism induced by earthquake in a plate girder bridge based on seismic response analysis: Case study of Tawarayama bridge under the 2016 Kumamoto earthquake. Adv. Civil Eng. 2018, 2018, 9293623. [Google Scholar] [CrossRef]
  26. Hu, M.; Han, Q.; Wen, J.; Bai, Y. Seismic failure of multi-span simply supported RC slab-on-grider bridge in 2008 Wenchuan earthquake: Case study. Eng. Fail. Anal. 2019, 95, 140–153. [Google Scholar] [CrossRef]
  27. Mohanty, P.; Dutta, S.; Bhattacharya, S. Proposed mechanism for mid-span failure of pile supported river bridges during seismic liquefaction. Soil Dyn. Earthq. Eng. 2017, 102, 41–45. [Google Scholar] [CrossRef]
  28. Li, Y.; Zong, Z.; Yang, B. Experimental Study on Seismic Performance of Concrete Continuous Bridge with HDR Bearings. J. Inst. Eng. 2020, 101, 293–314. [Google Scholar] [CrossRef]
  29. Hallquist, J.O. LS-DYNA Theory Manual; Livermore Software Technology Corporation: Livermore, CA, USA, 2006; pp. 25–31. [Google Scholar]
  30. GB 50010-2010. Code for Design of Concrete Structures; Ministry of House and Urban-Rural Development of People’s Republic of China: Beijing, China, 2010. (In Chinese)
  31. Li, Y.; Zong, Z.; Liu, S.; Huang, X.-Y.; Xia, Z.-H. Shaking table array testing of reinforced concrete continuous girder bridge model. China J. Highw. Transp. 2016, 29, 232–242. (In Chinese) [Google Scholar]
  32. Li, Y.; Zong, Z.; Yang, B.; Lin, Y.; Lin, J. Research on Longitudinal Collapse Mode and Control of the Continuous Bridge under Strong Seismic Excitations. Appl. Sci. 2020, 10, 6049. [Google Scholar] [CrossRef]
  33. De Domenico, D.; Gandelli, E.; Quaglini, V. Adaptive isolation system combining low-friction sliding pendulum bearings and SMA-based gap dampers. Eng. Struct. 2020, 212, 110536. [Google Scholar] [CrossRef]
  34. Sosorburam, P.; Yamaguchi, E. Seismic Retrofit of Steel Truss Bridge Using Buckling Restrained Damper. Appl. Sci. 2019, 9, 2791. [Google Scholar] [CrossRef] [Green Version]
Figure 1. Dimensional details of bridge specimen: (a) section view of main girder, (b) section view of column, (c) pier (unit: cm).
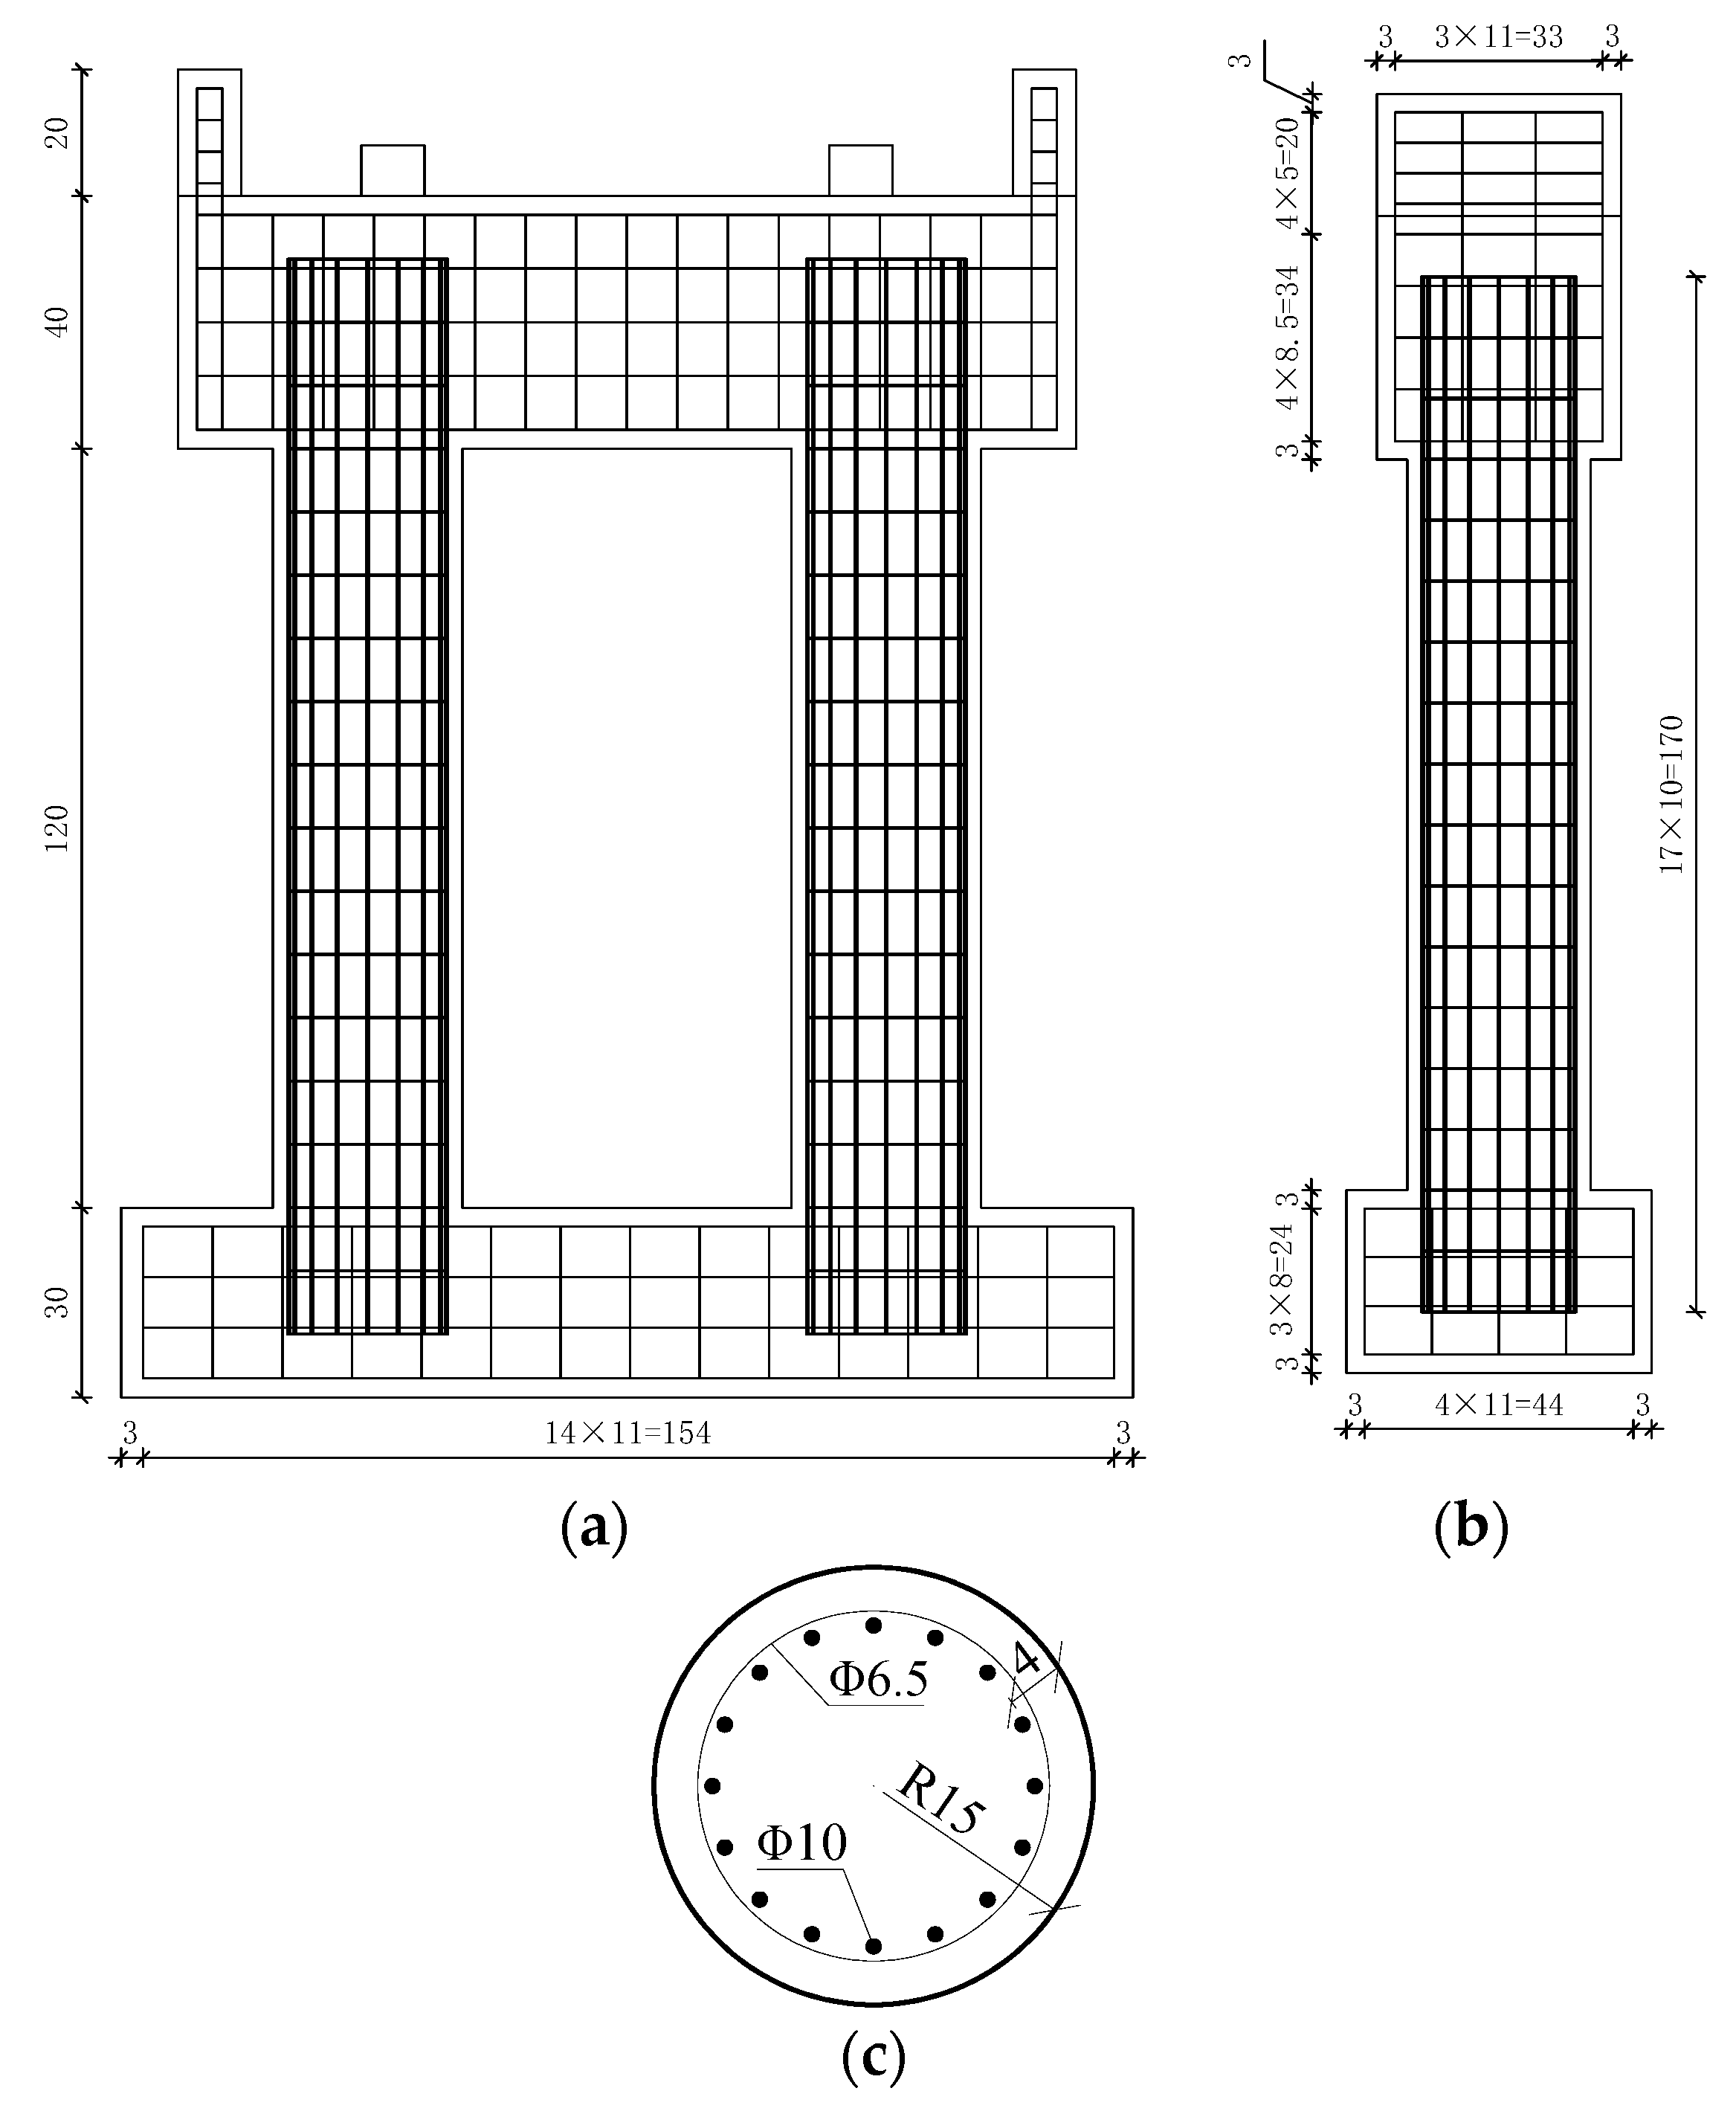
Applsci 11 08935 g001
Figure 2. Layout diagram of reinforcement: (a) elevation view, (b) side view, (c) cross section (unit: cm).
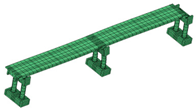
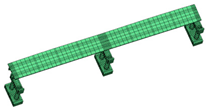
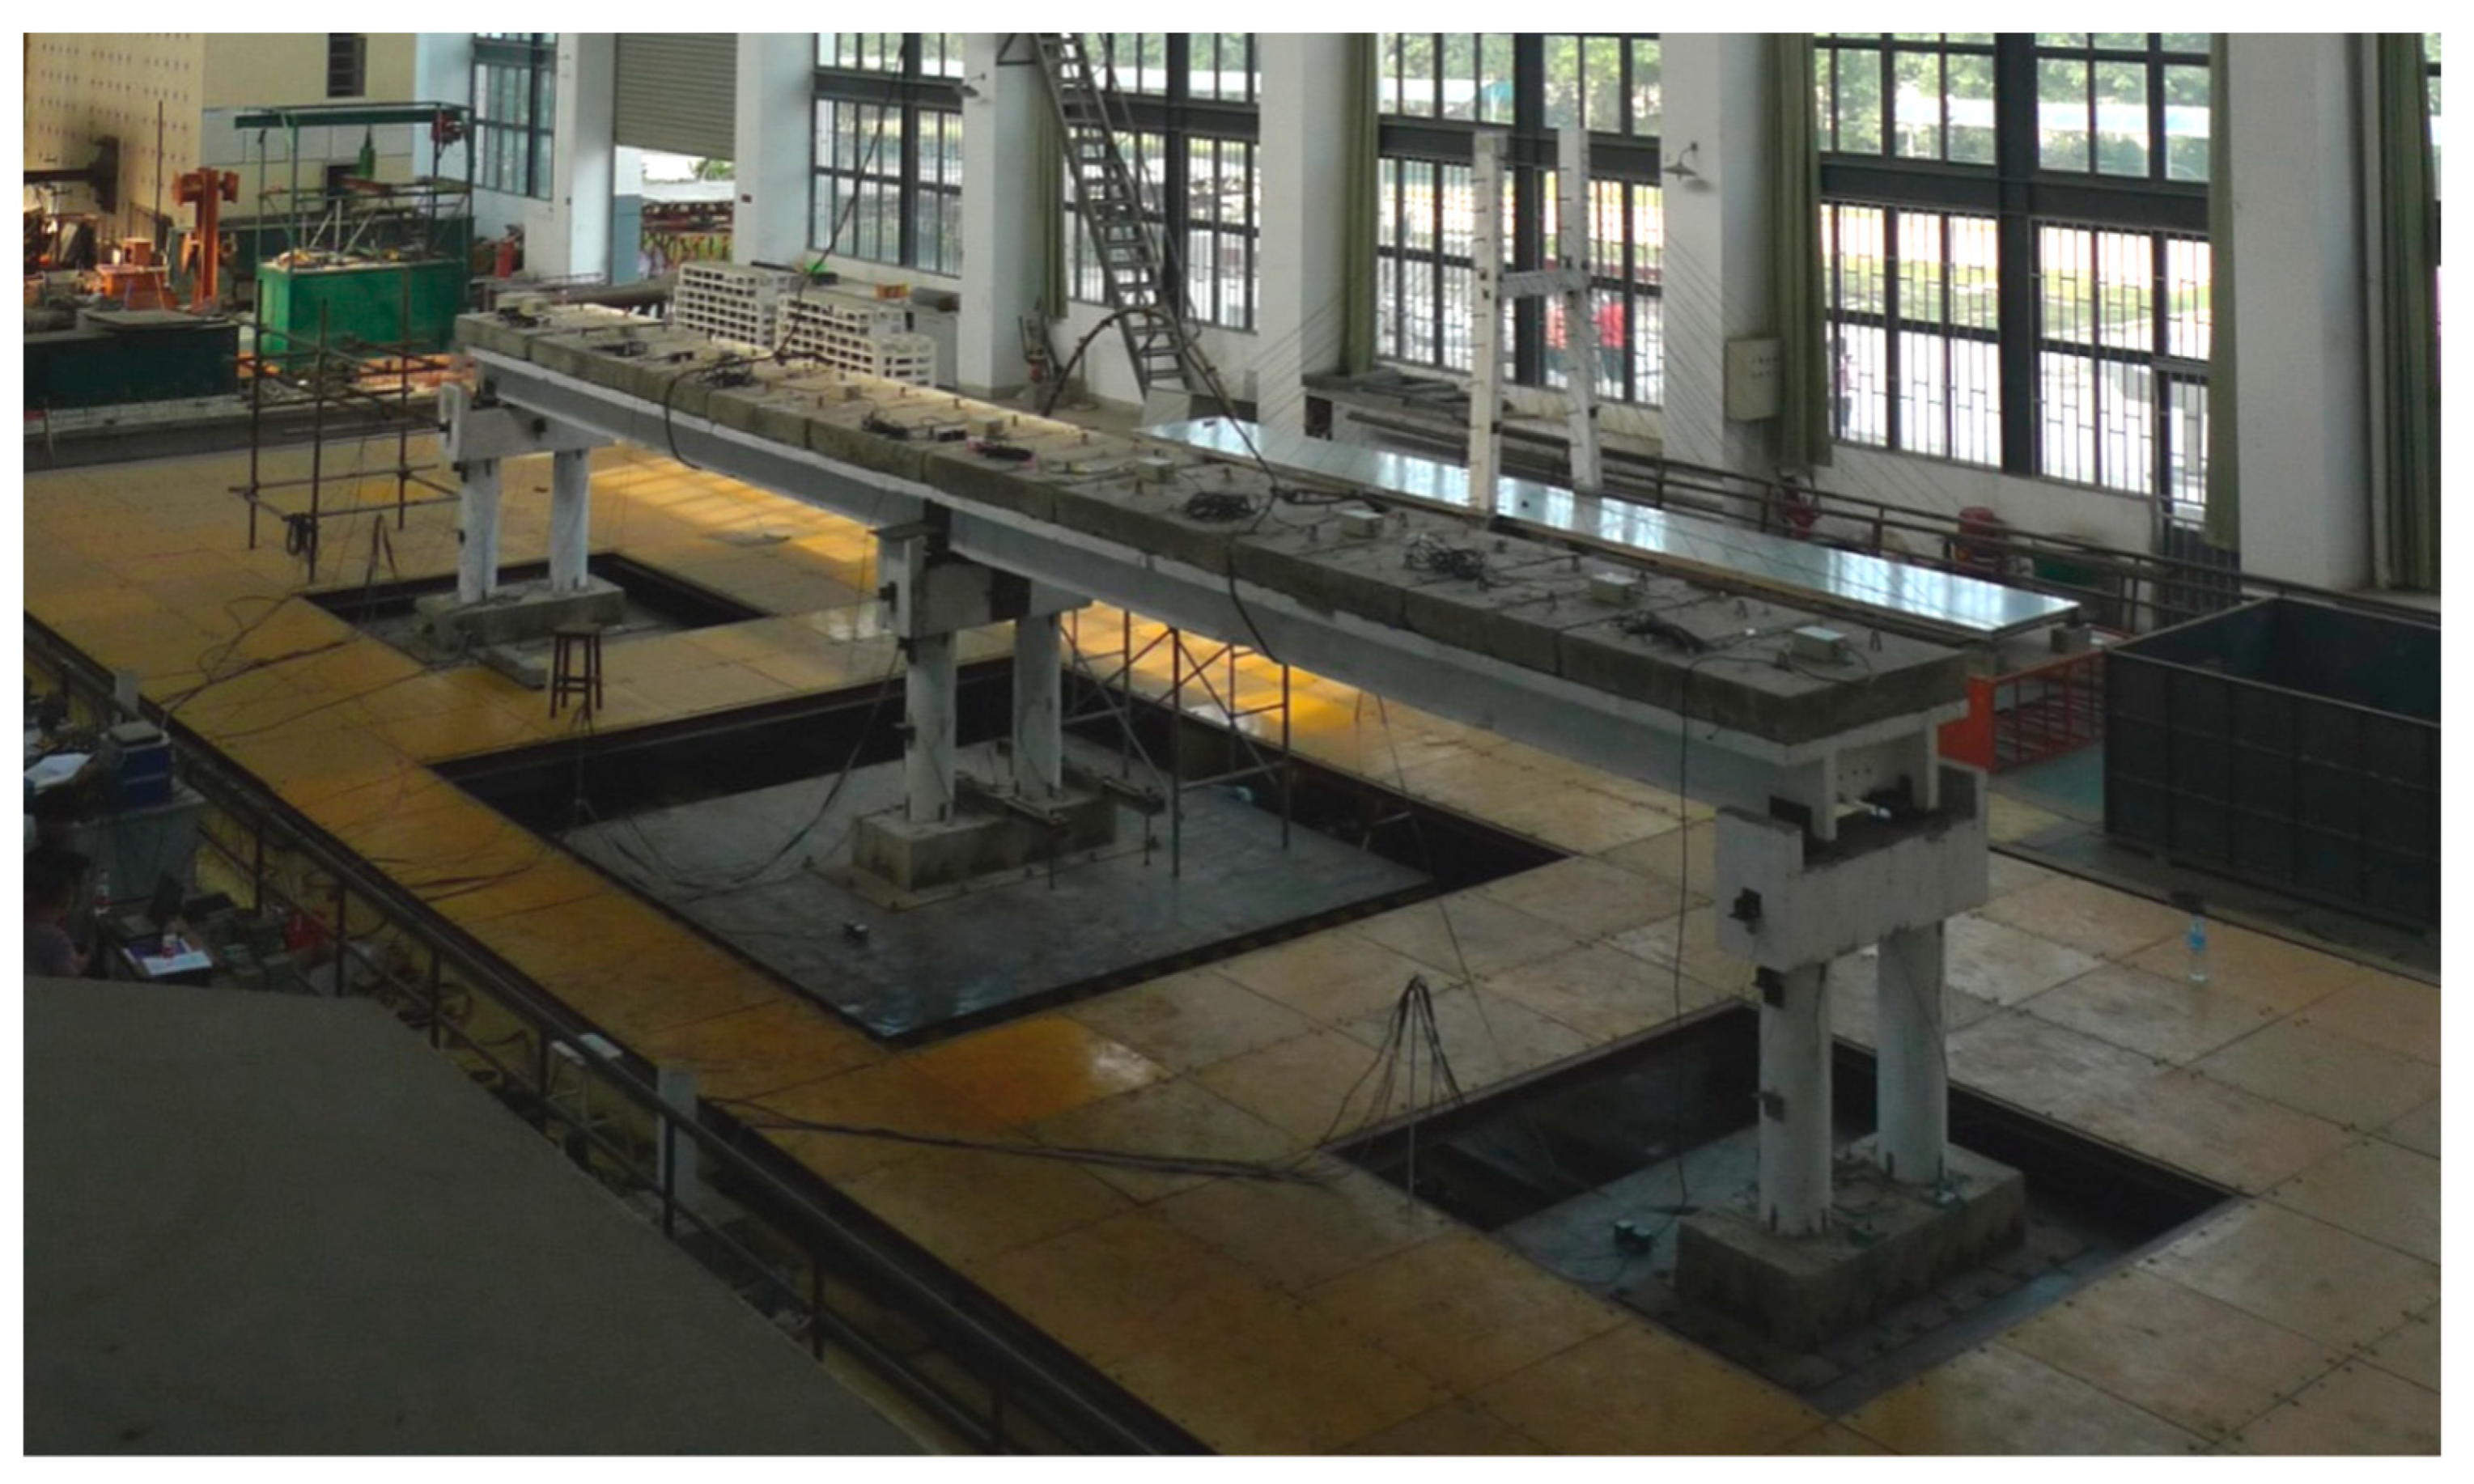
Applsci 11 08935 g002
Figure 3. Picture of bridge model.
Applsci 11 08935 g003
Figure 4. Constitutive relationship: (a) the concrete, (b) the steel bar.
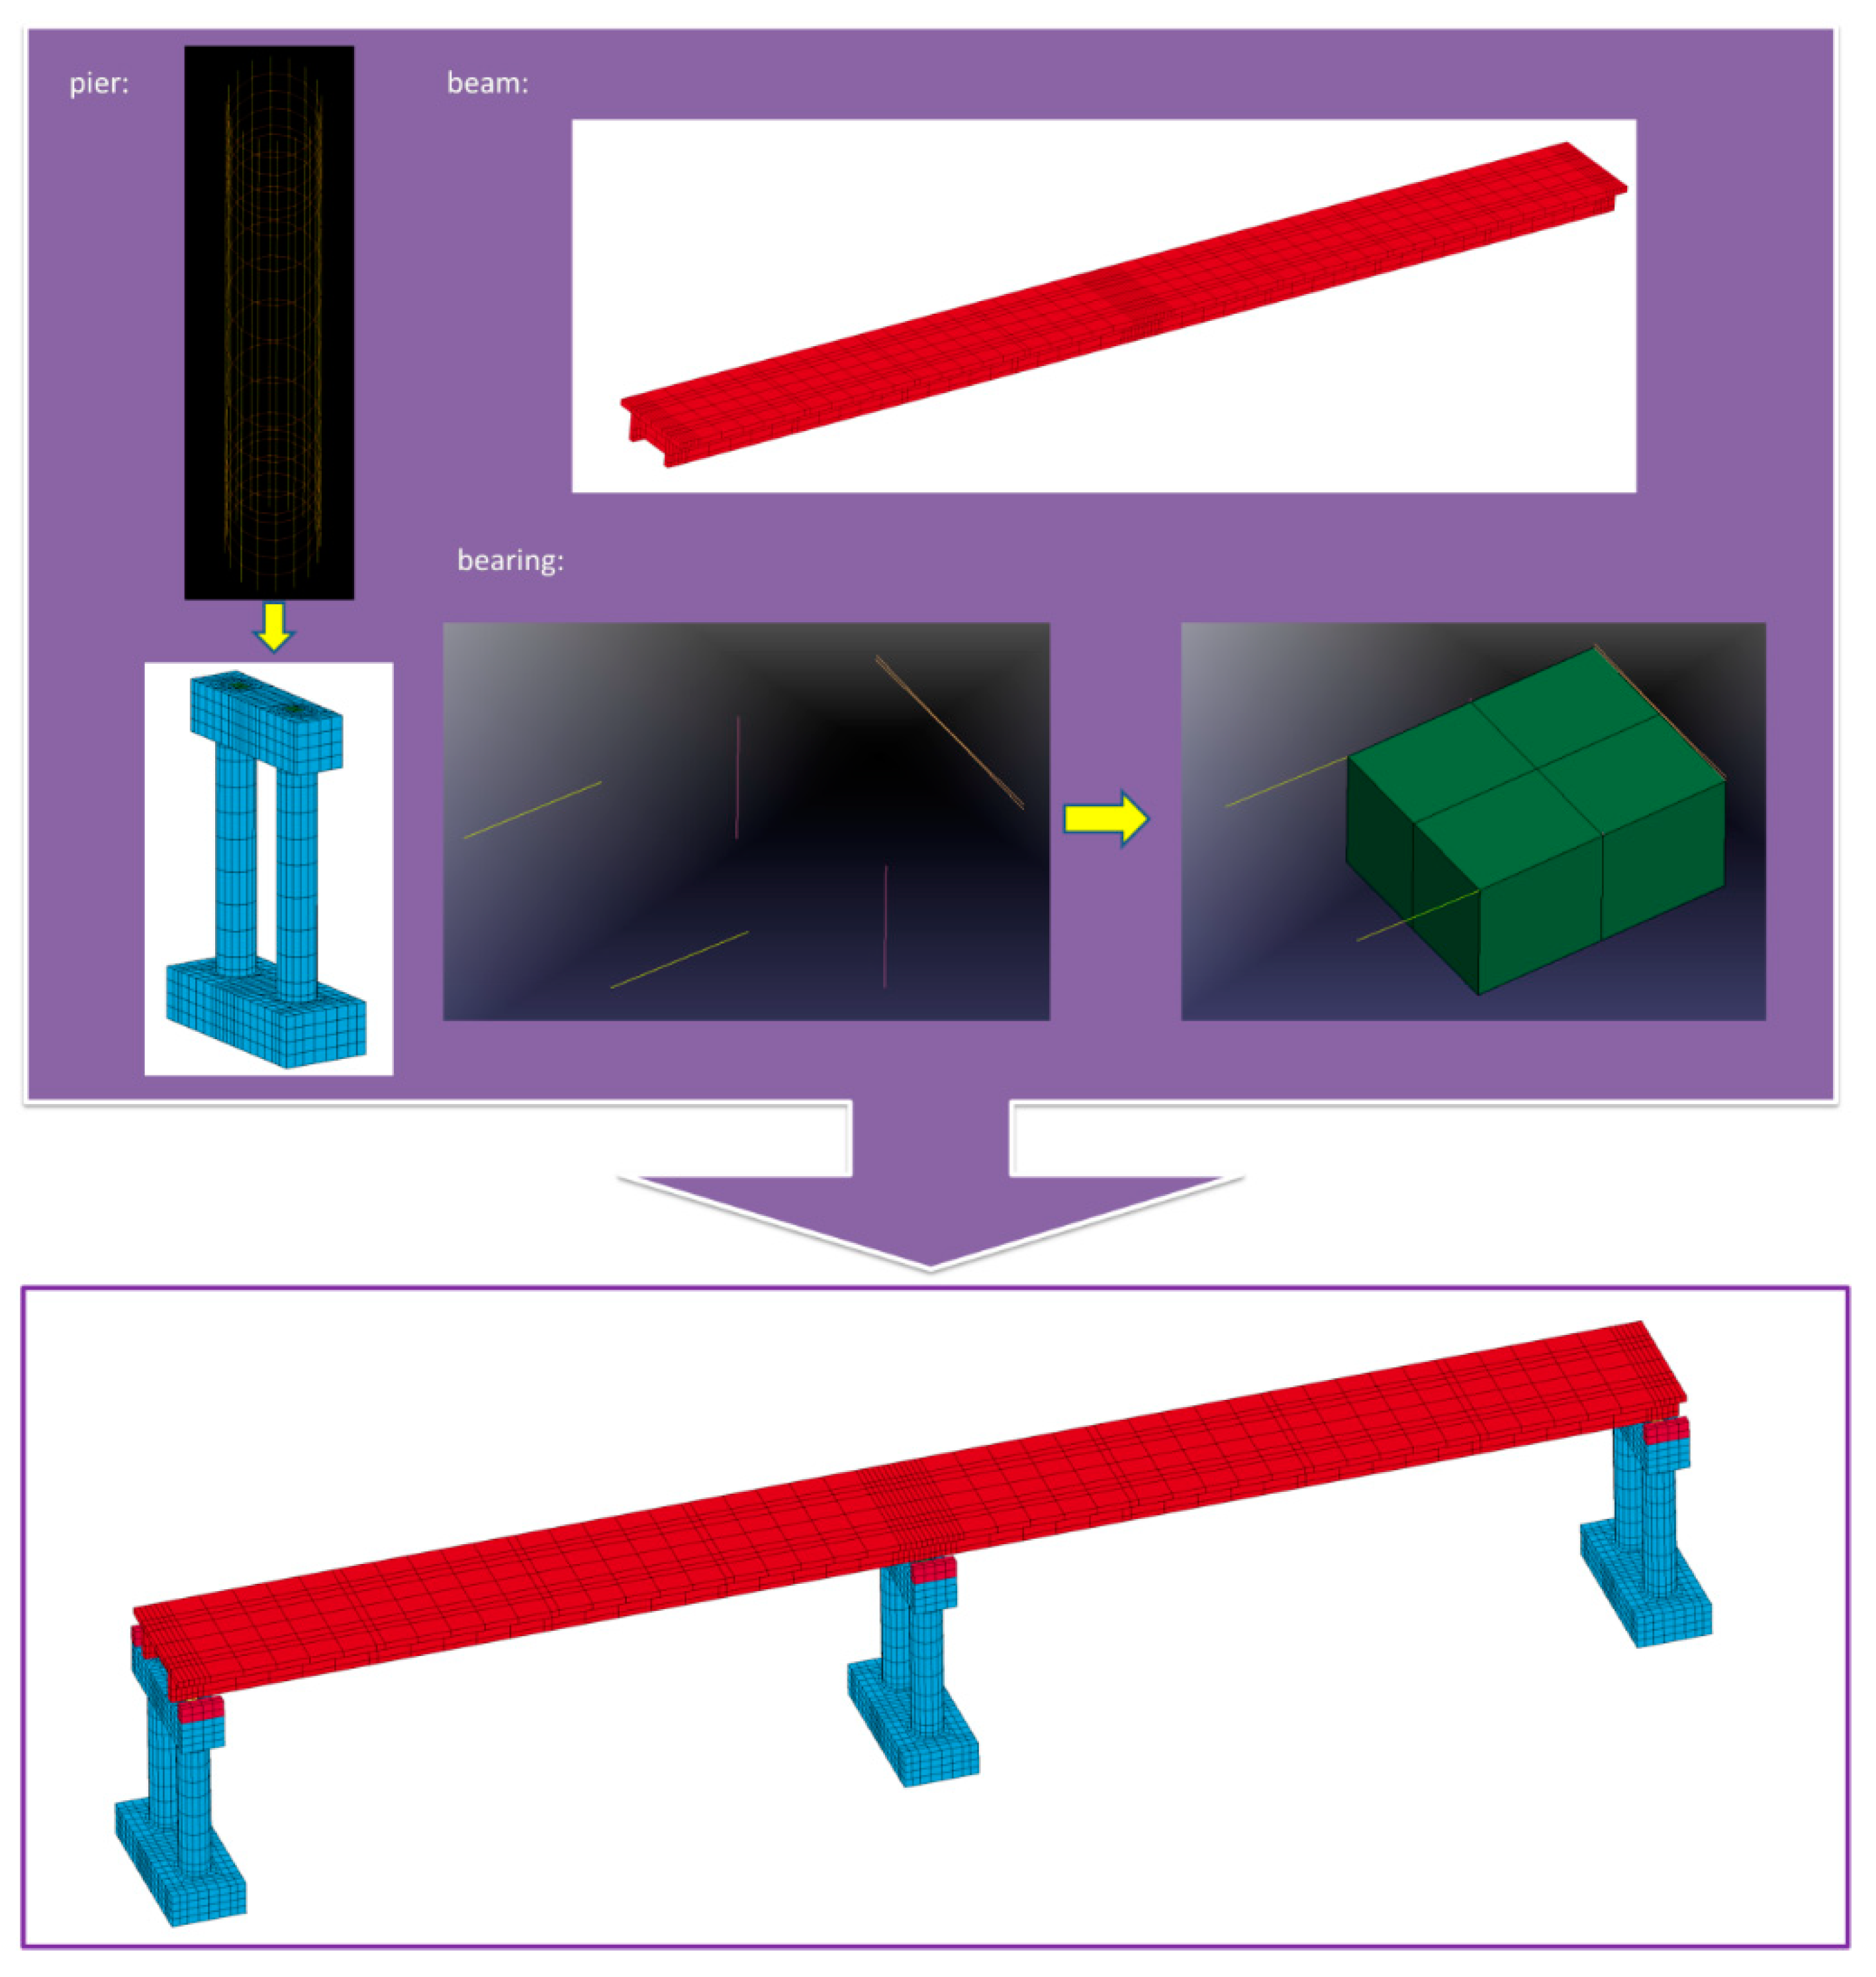
Applsci 11 08935 g004
Figure 5. Procedure of the modeling.
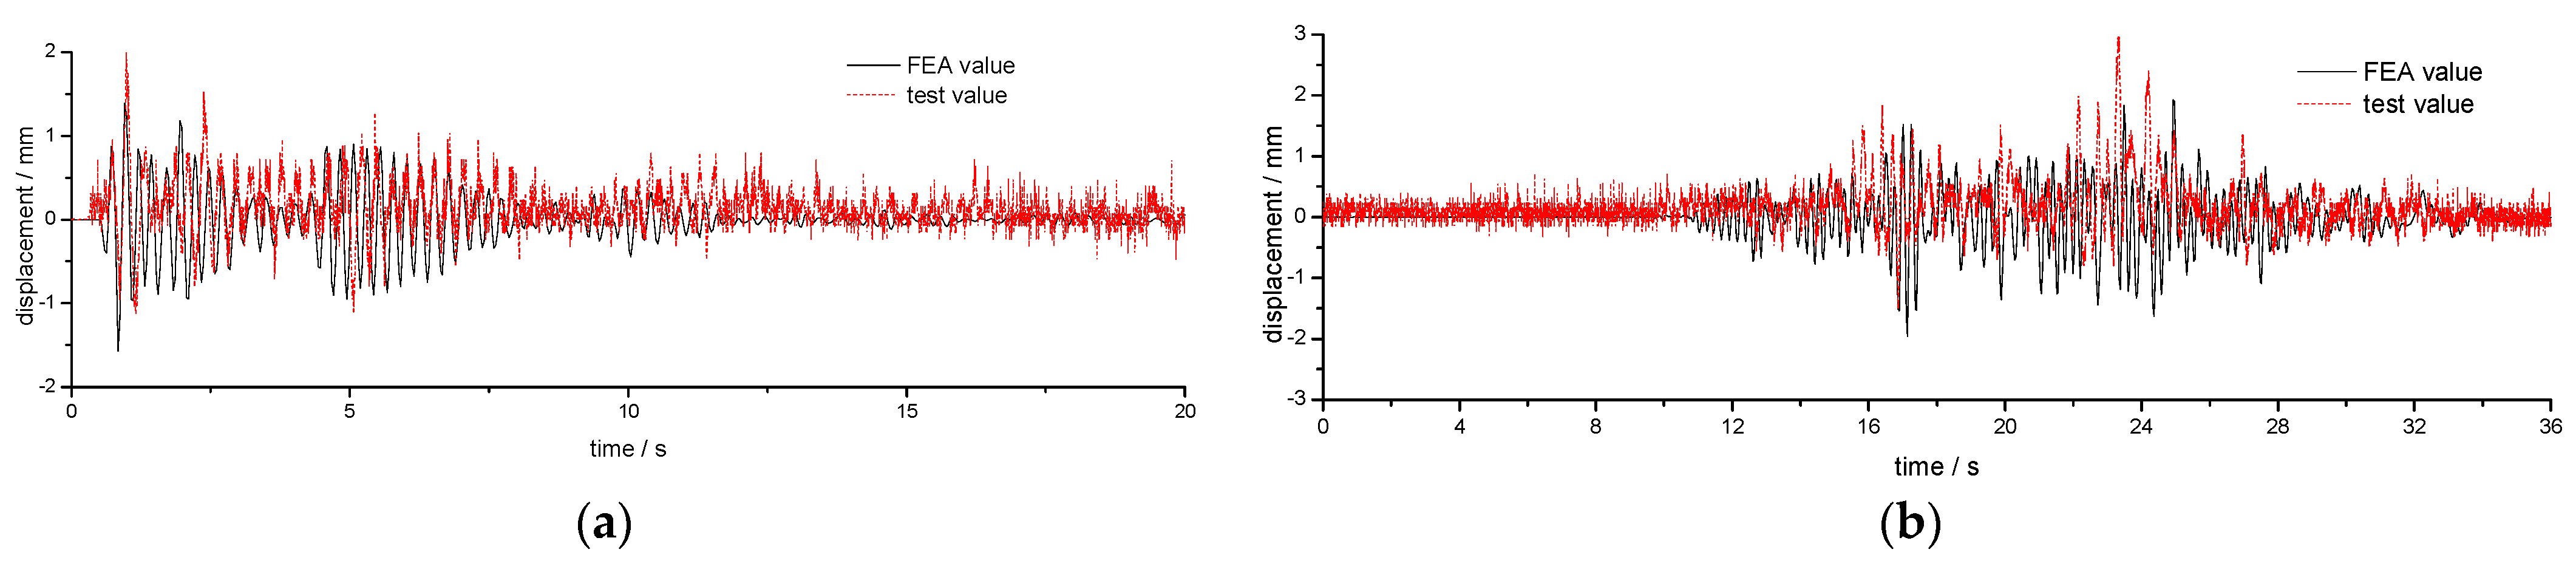
Applsci 11 08935 g005
Figure 6. Comparison of relative longitudinal displacement between the pier and the beam: (a) El Centro wave, (b) Chi−chi wave.
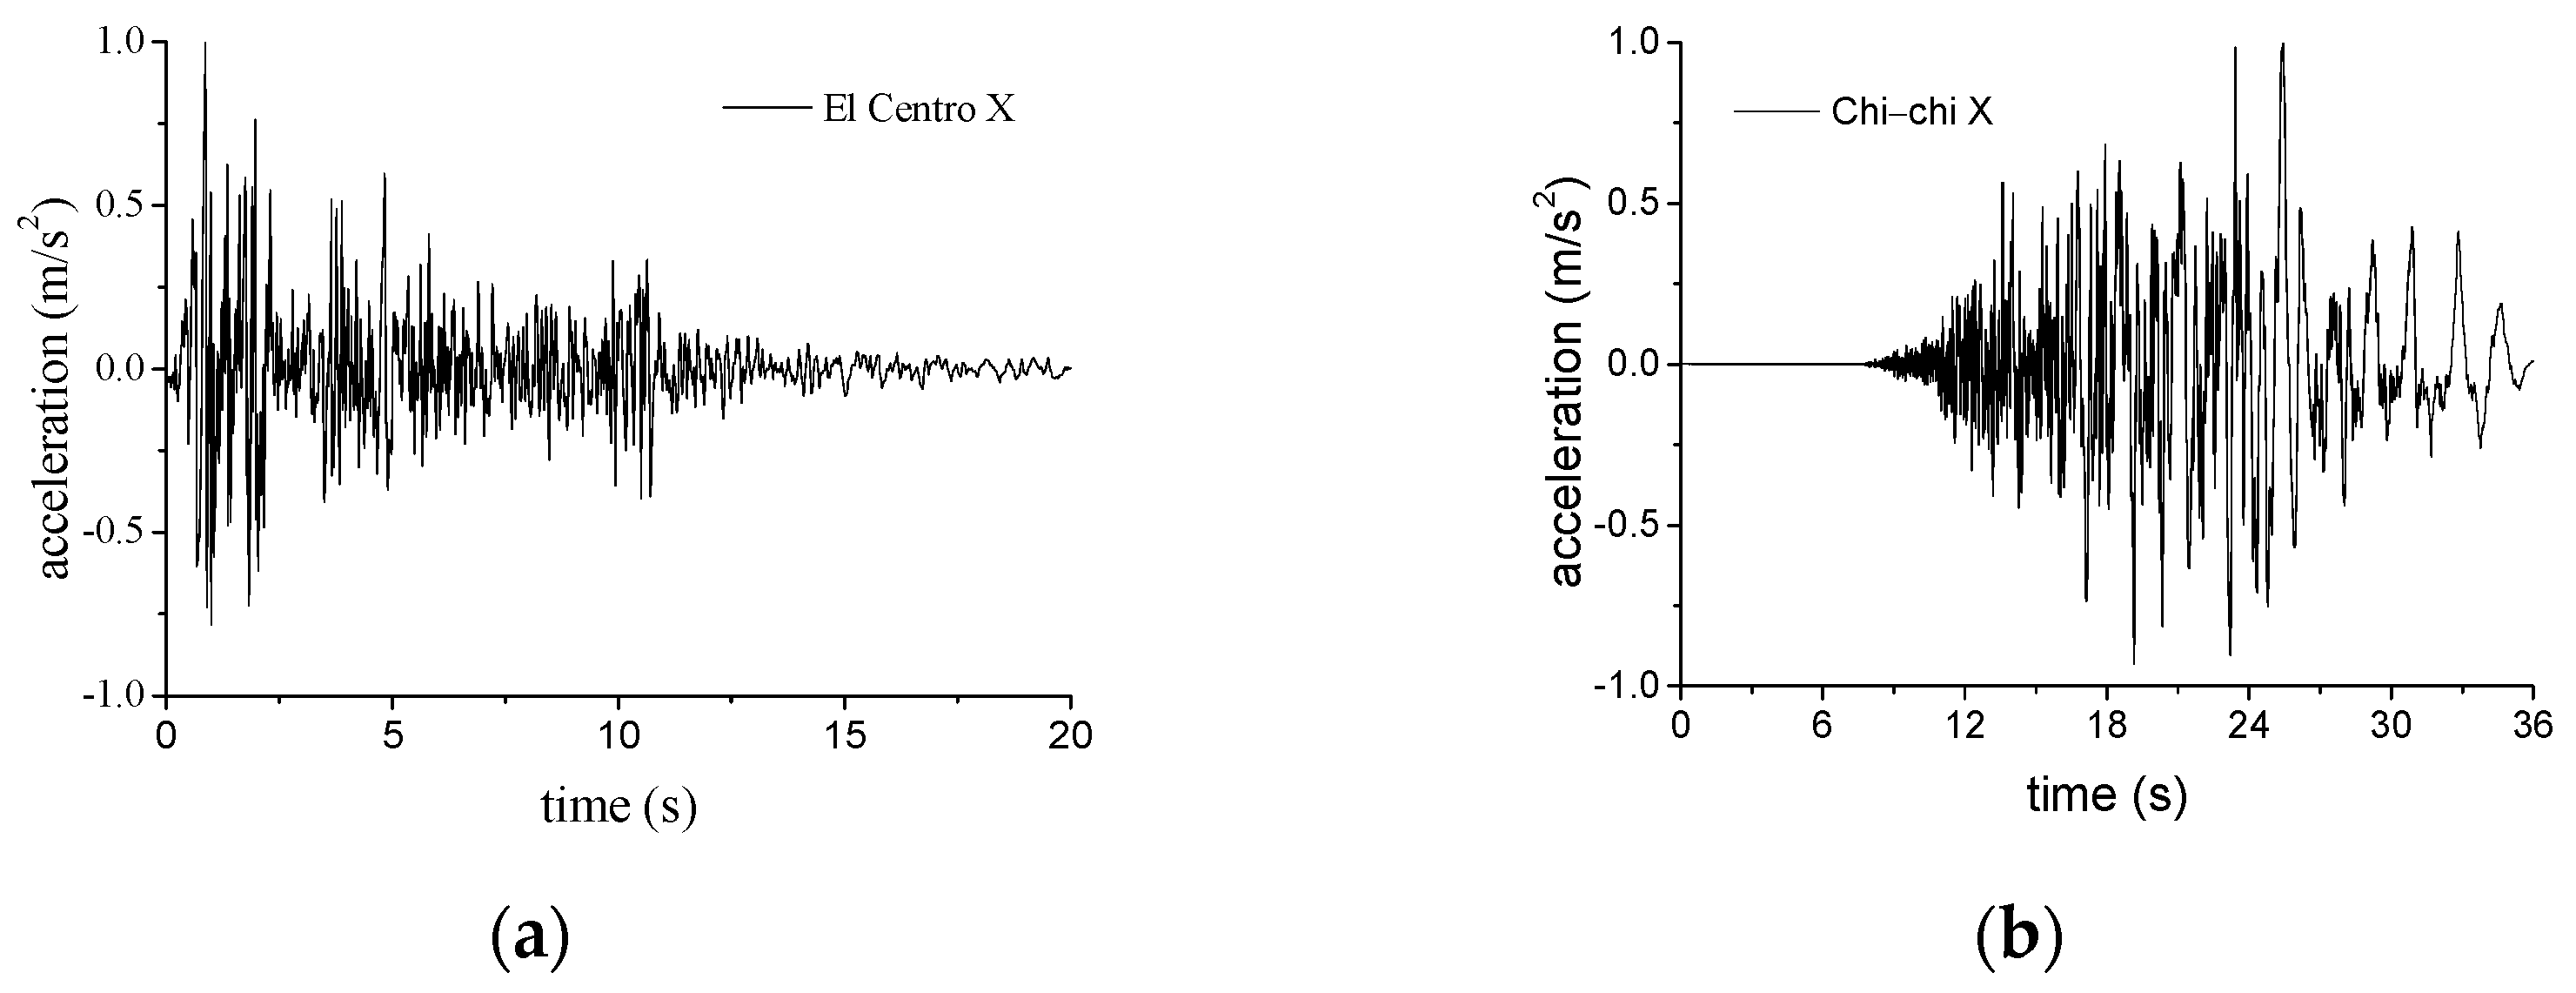
Applsci 11 08935 g006
Figure 7. Longitudinal test seismic wave: (a) El Centro wave, (b) Chi−chi wave.
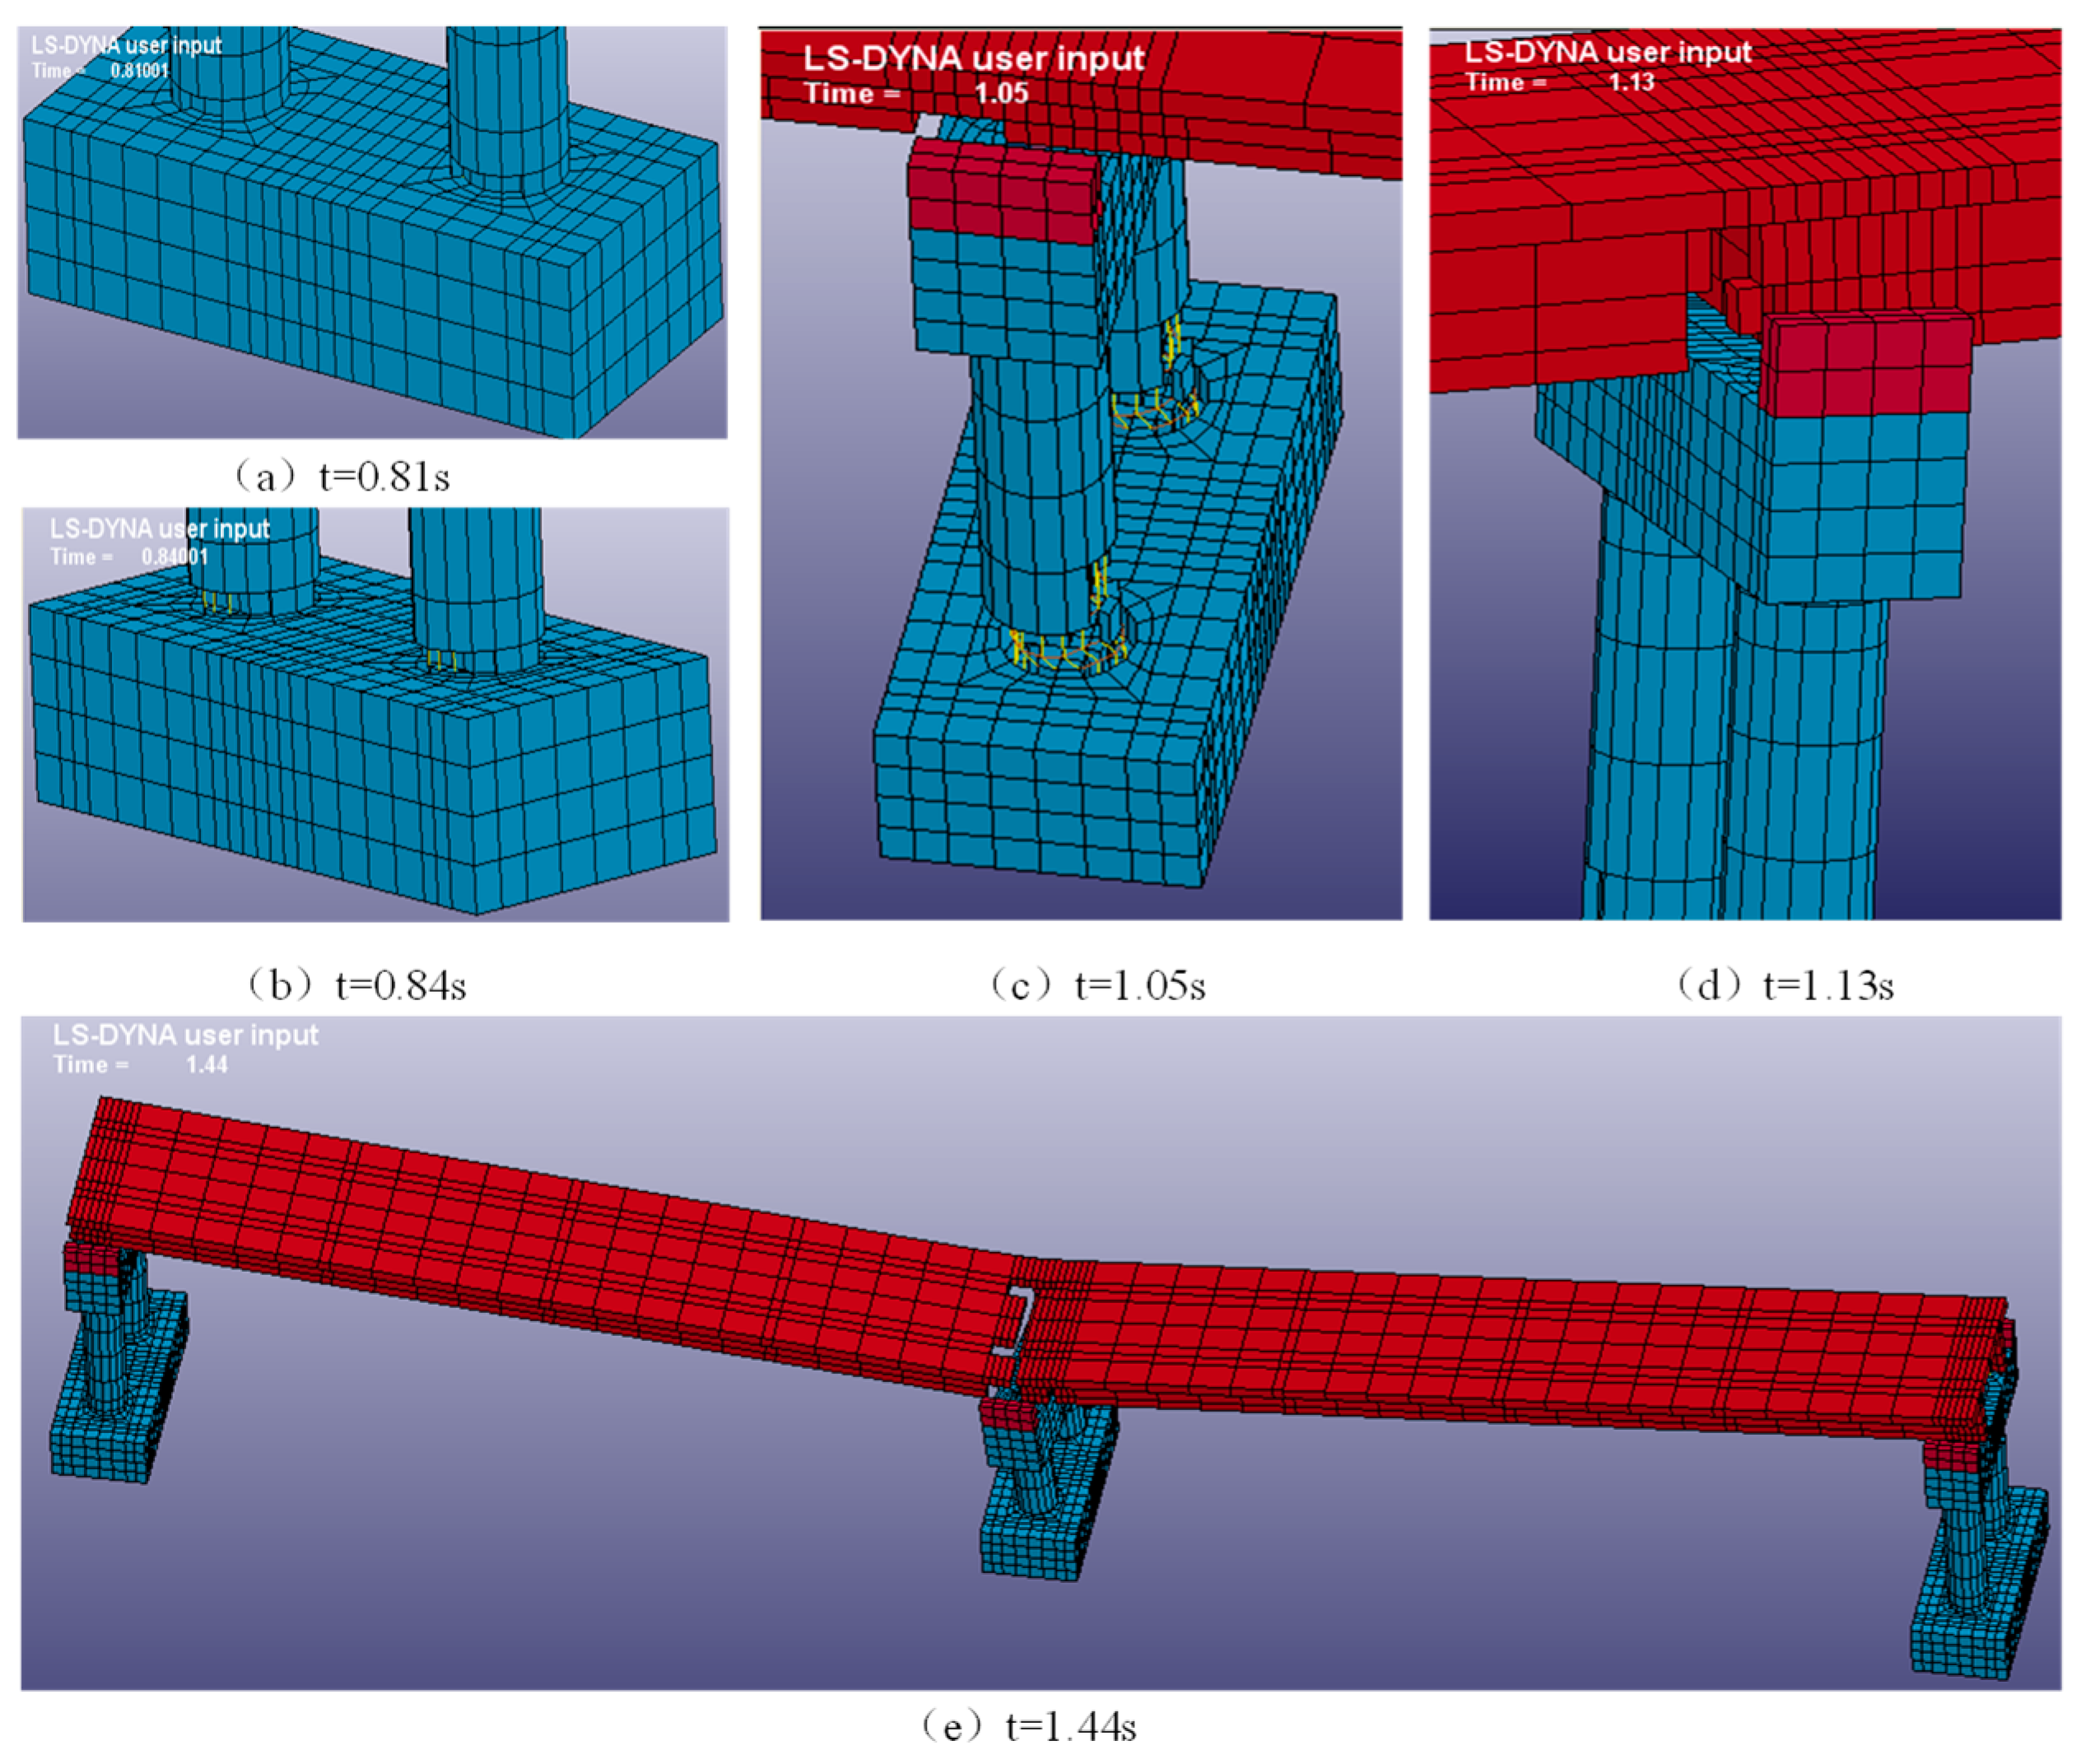
Applsci 11 08935 g007
Figure 8. Longitudinal collapse mode of bridge model under El Centro wave.
Applsci 11 08935 g008
Figure 9. Longitudinal collapse mode of bridge model under Chi-chi wave.
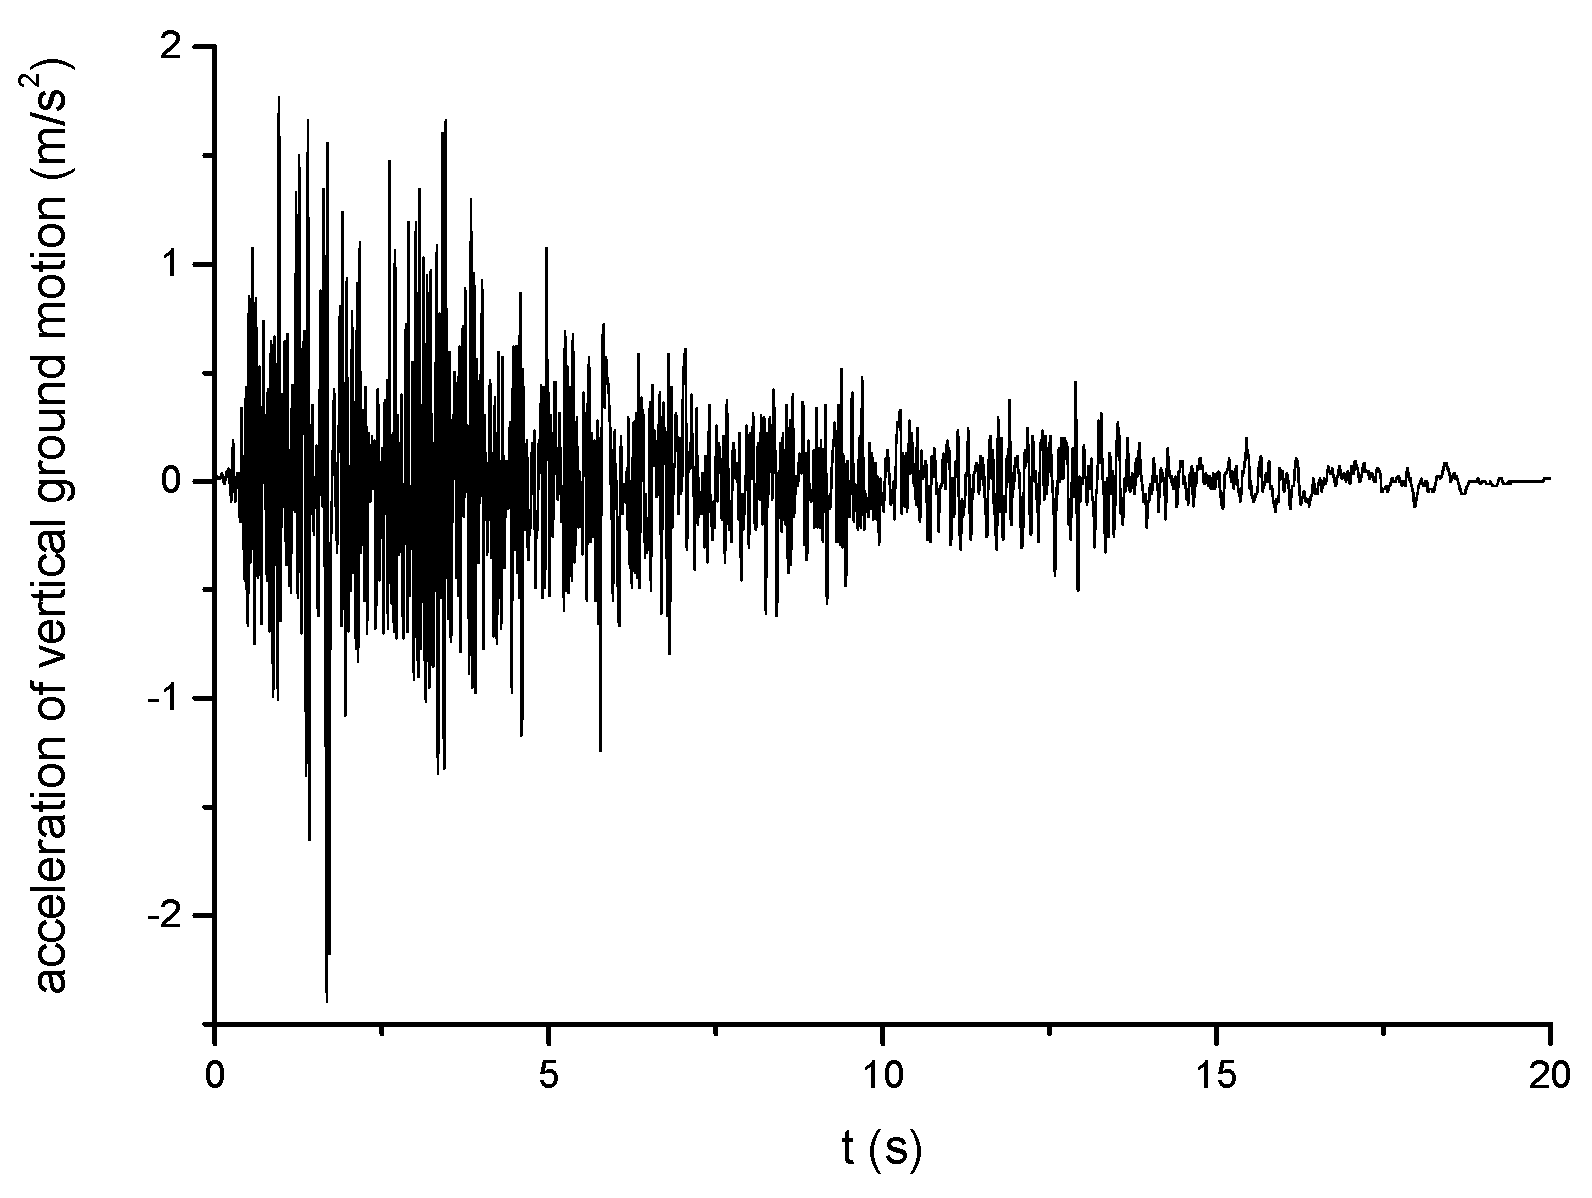
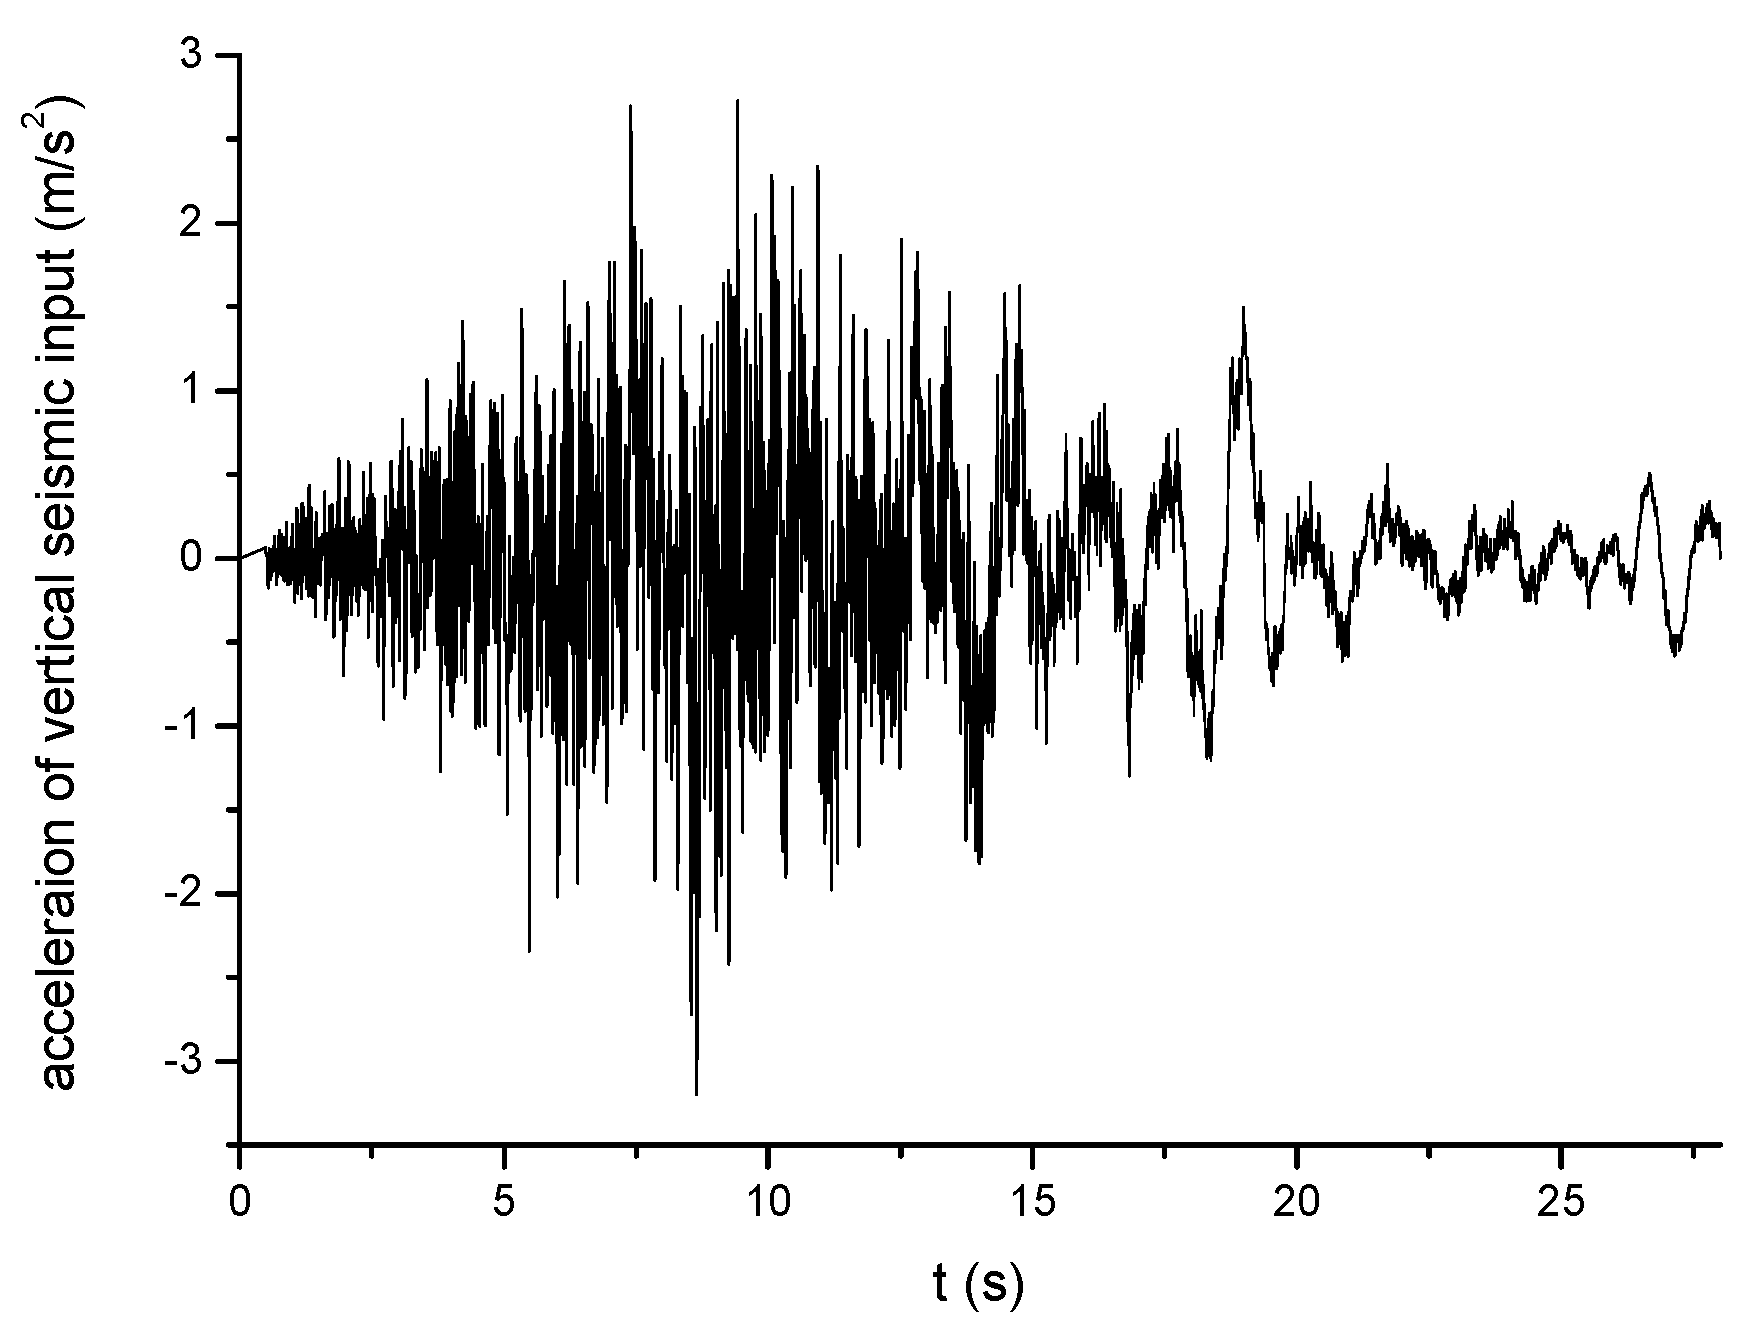
Applsci 11 08935 g009
Figure 10. Time history curve of vertical seismic input of El Centro wave.
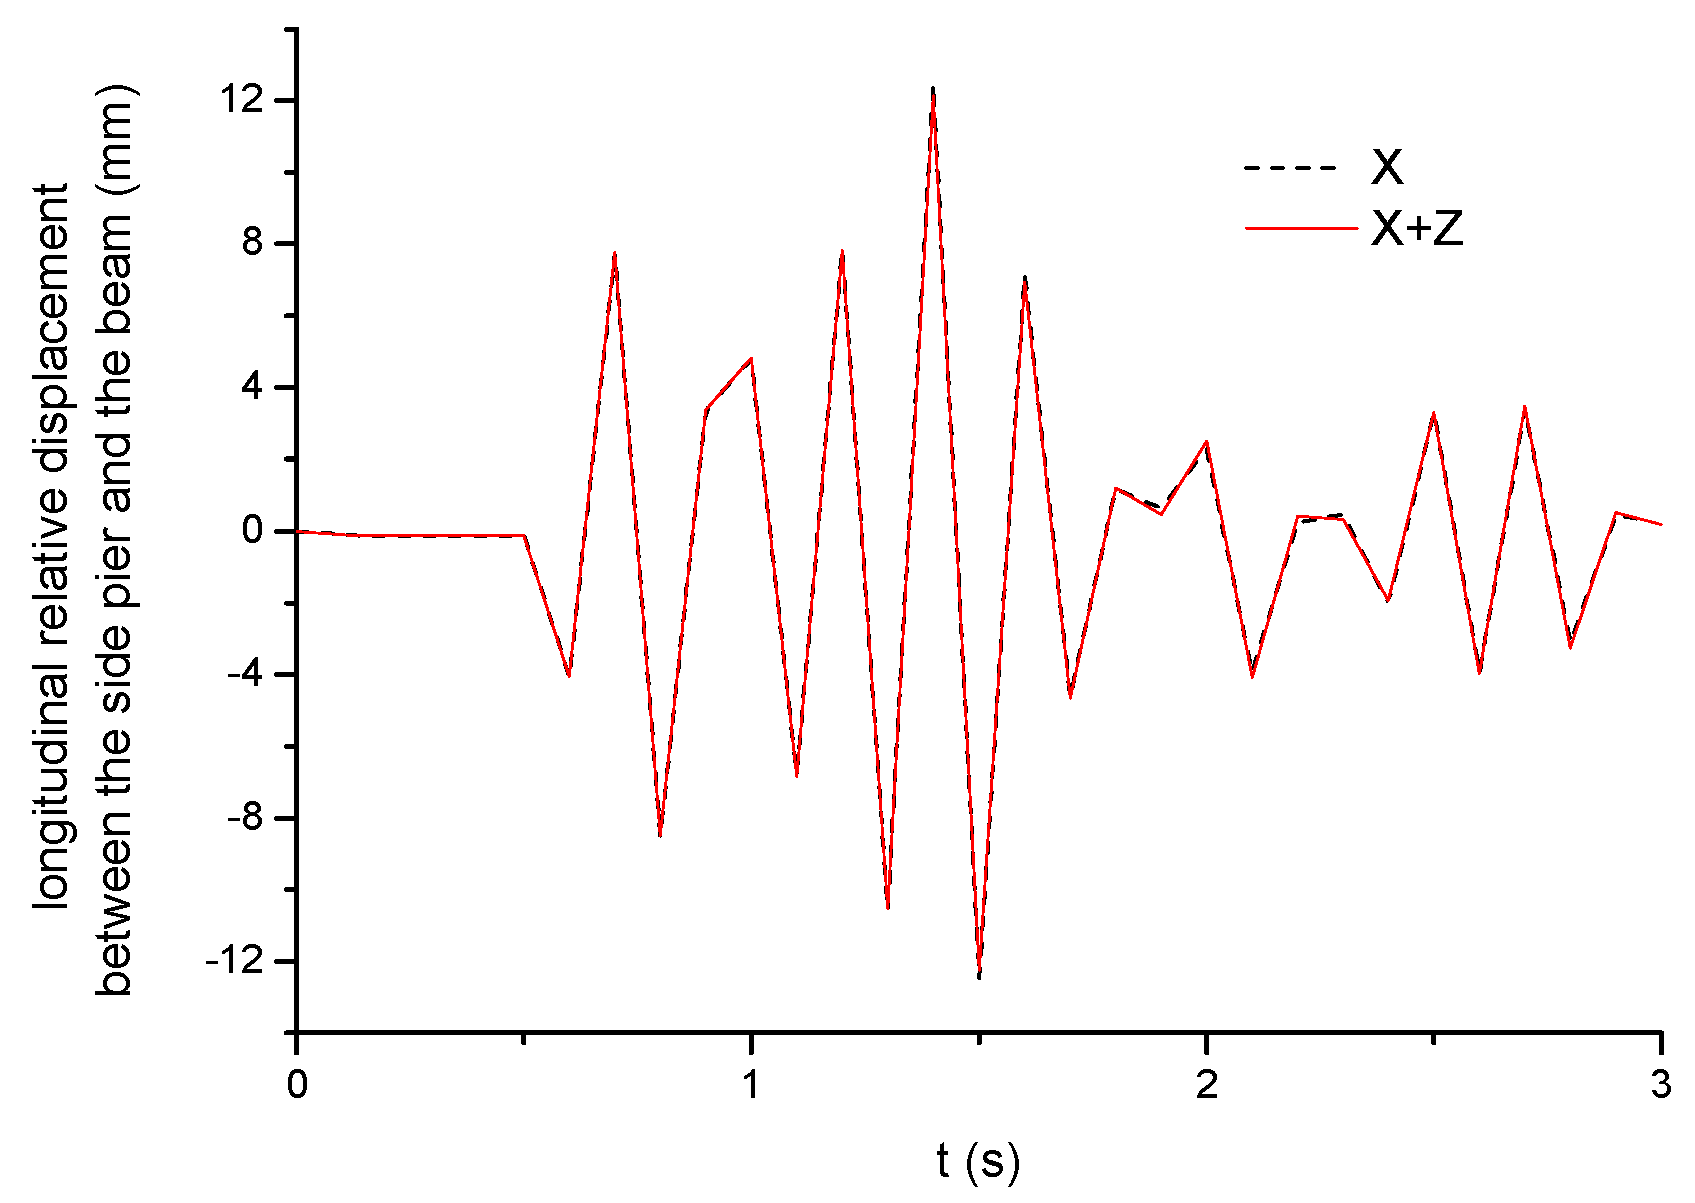
Applsci 11 08935 g010
Figure 11. Time history curve of the relative displacement between the side pier and the girder under El Centro wave.
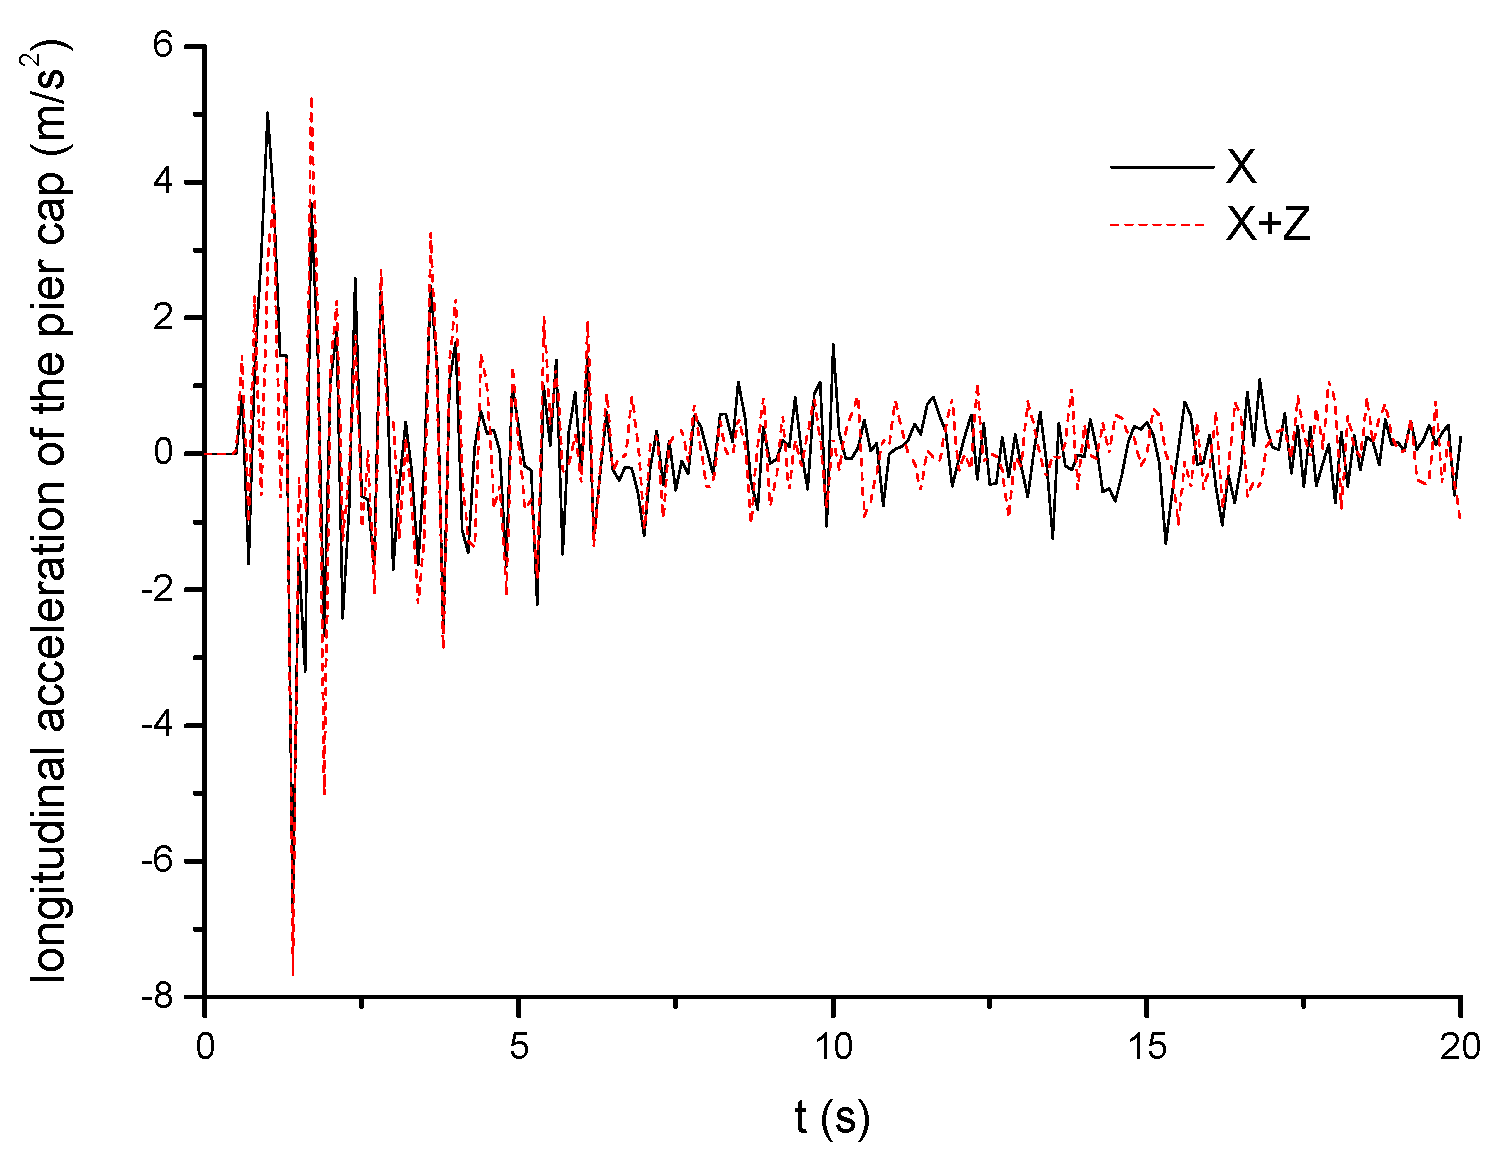
Applsci 11 08935 g011
Figure 12. The time history curve of acceleration response of middle pier cap under El Centro wave.
Applsci 11 08935 g012
Figure 13. The time history curve of principle compressive strain of middle pier at the bottom under El Centro wave.
Applsci 11 08935 g013
Figure 14. Time history curve of vertical seismic input of Chi−chi wave.
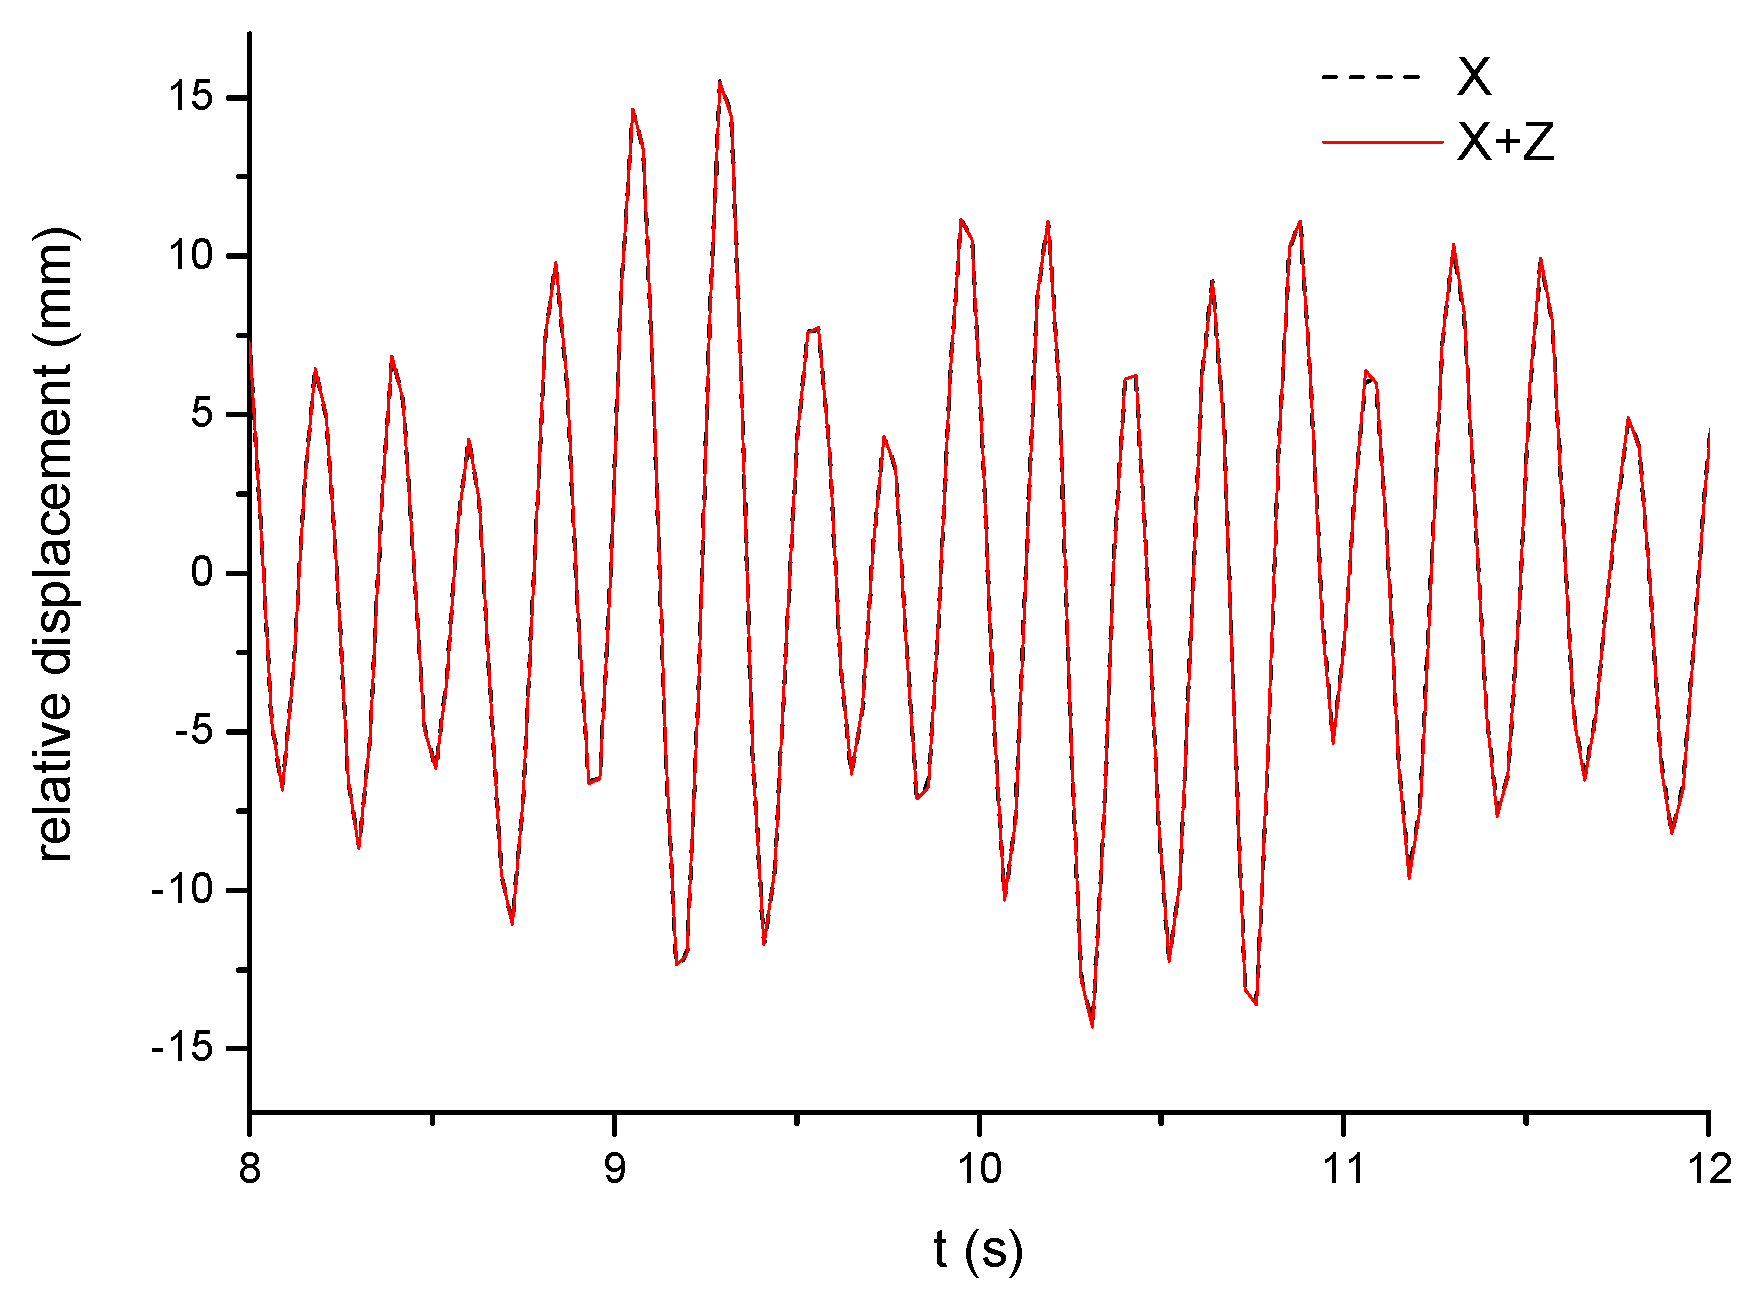
Applsci 11 08935 g014
Figure 15. Time-history curve of the relative displacement between the side pier and the girder under Chi−chi wave.
Applsci 11 08935 g015
Figure 16. The time history curve of acceleration response of middle pier cap under Chi−chi wave.
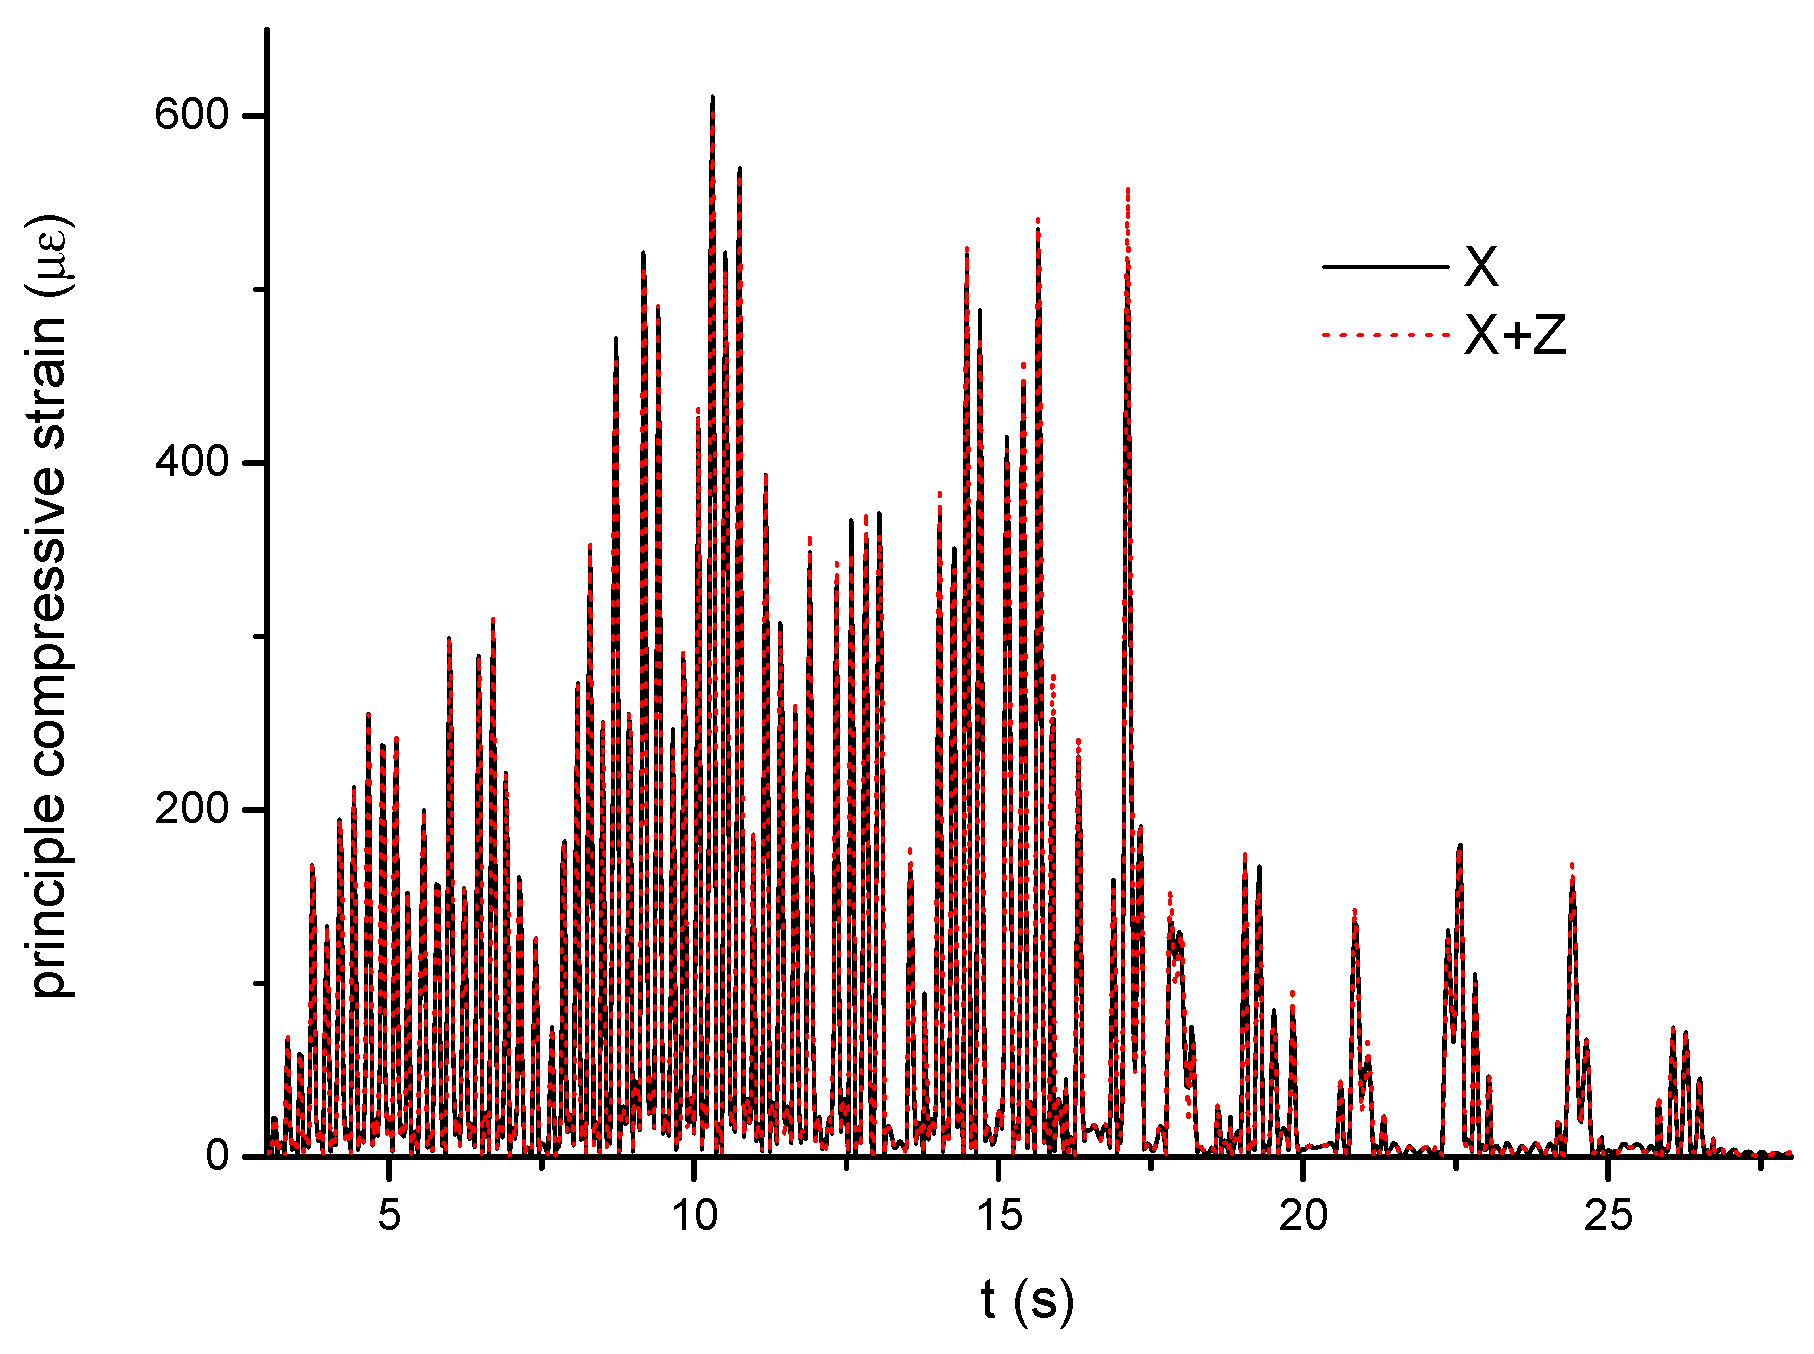
Applsci 11 08935 g016
Figure 17. The time history curve of principle compressive strain of middle pier at the bottom under Chi−chi wave.
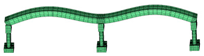
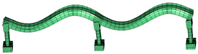
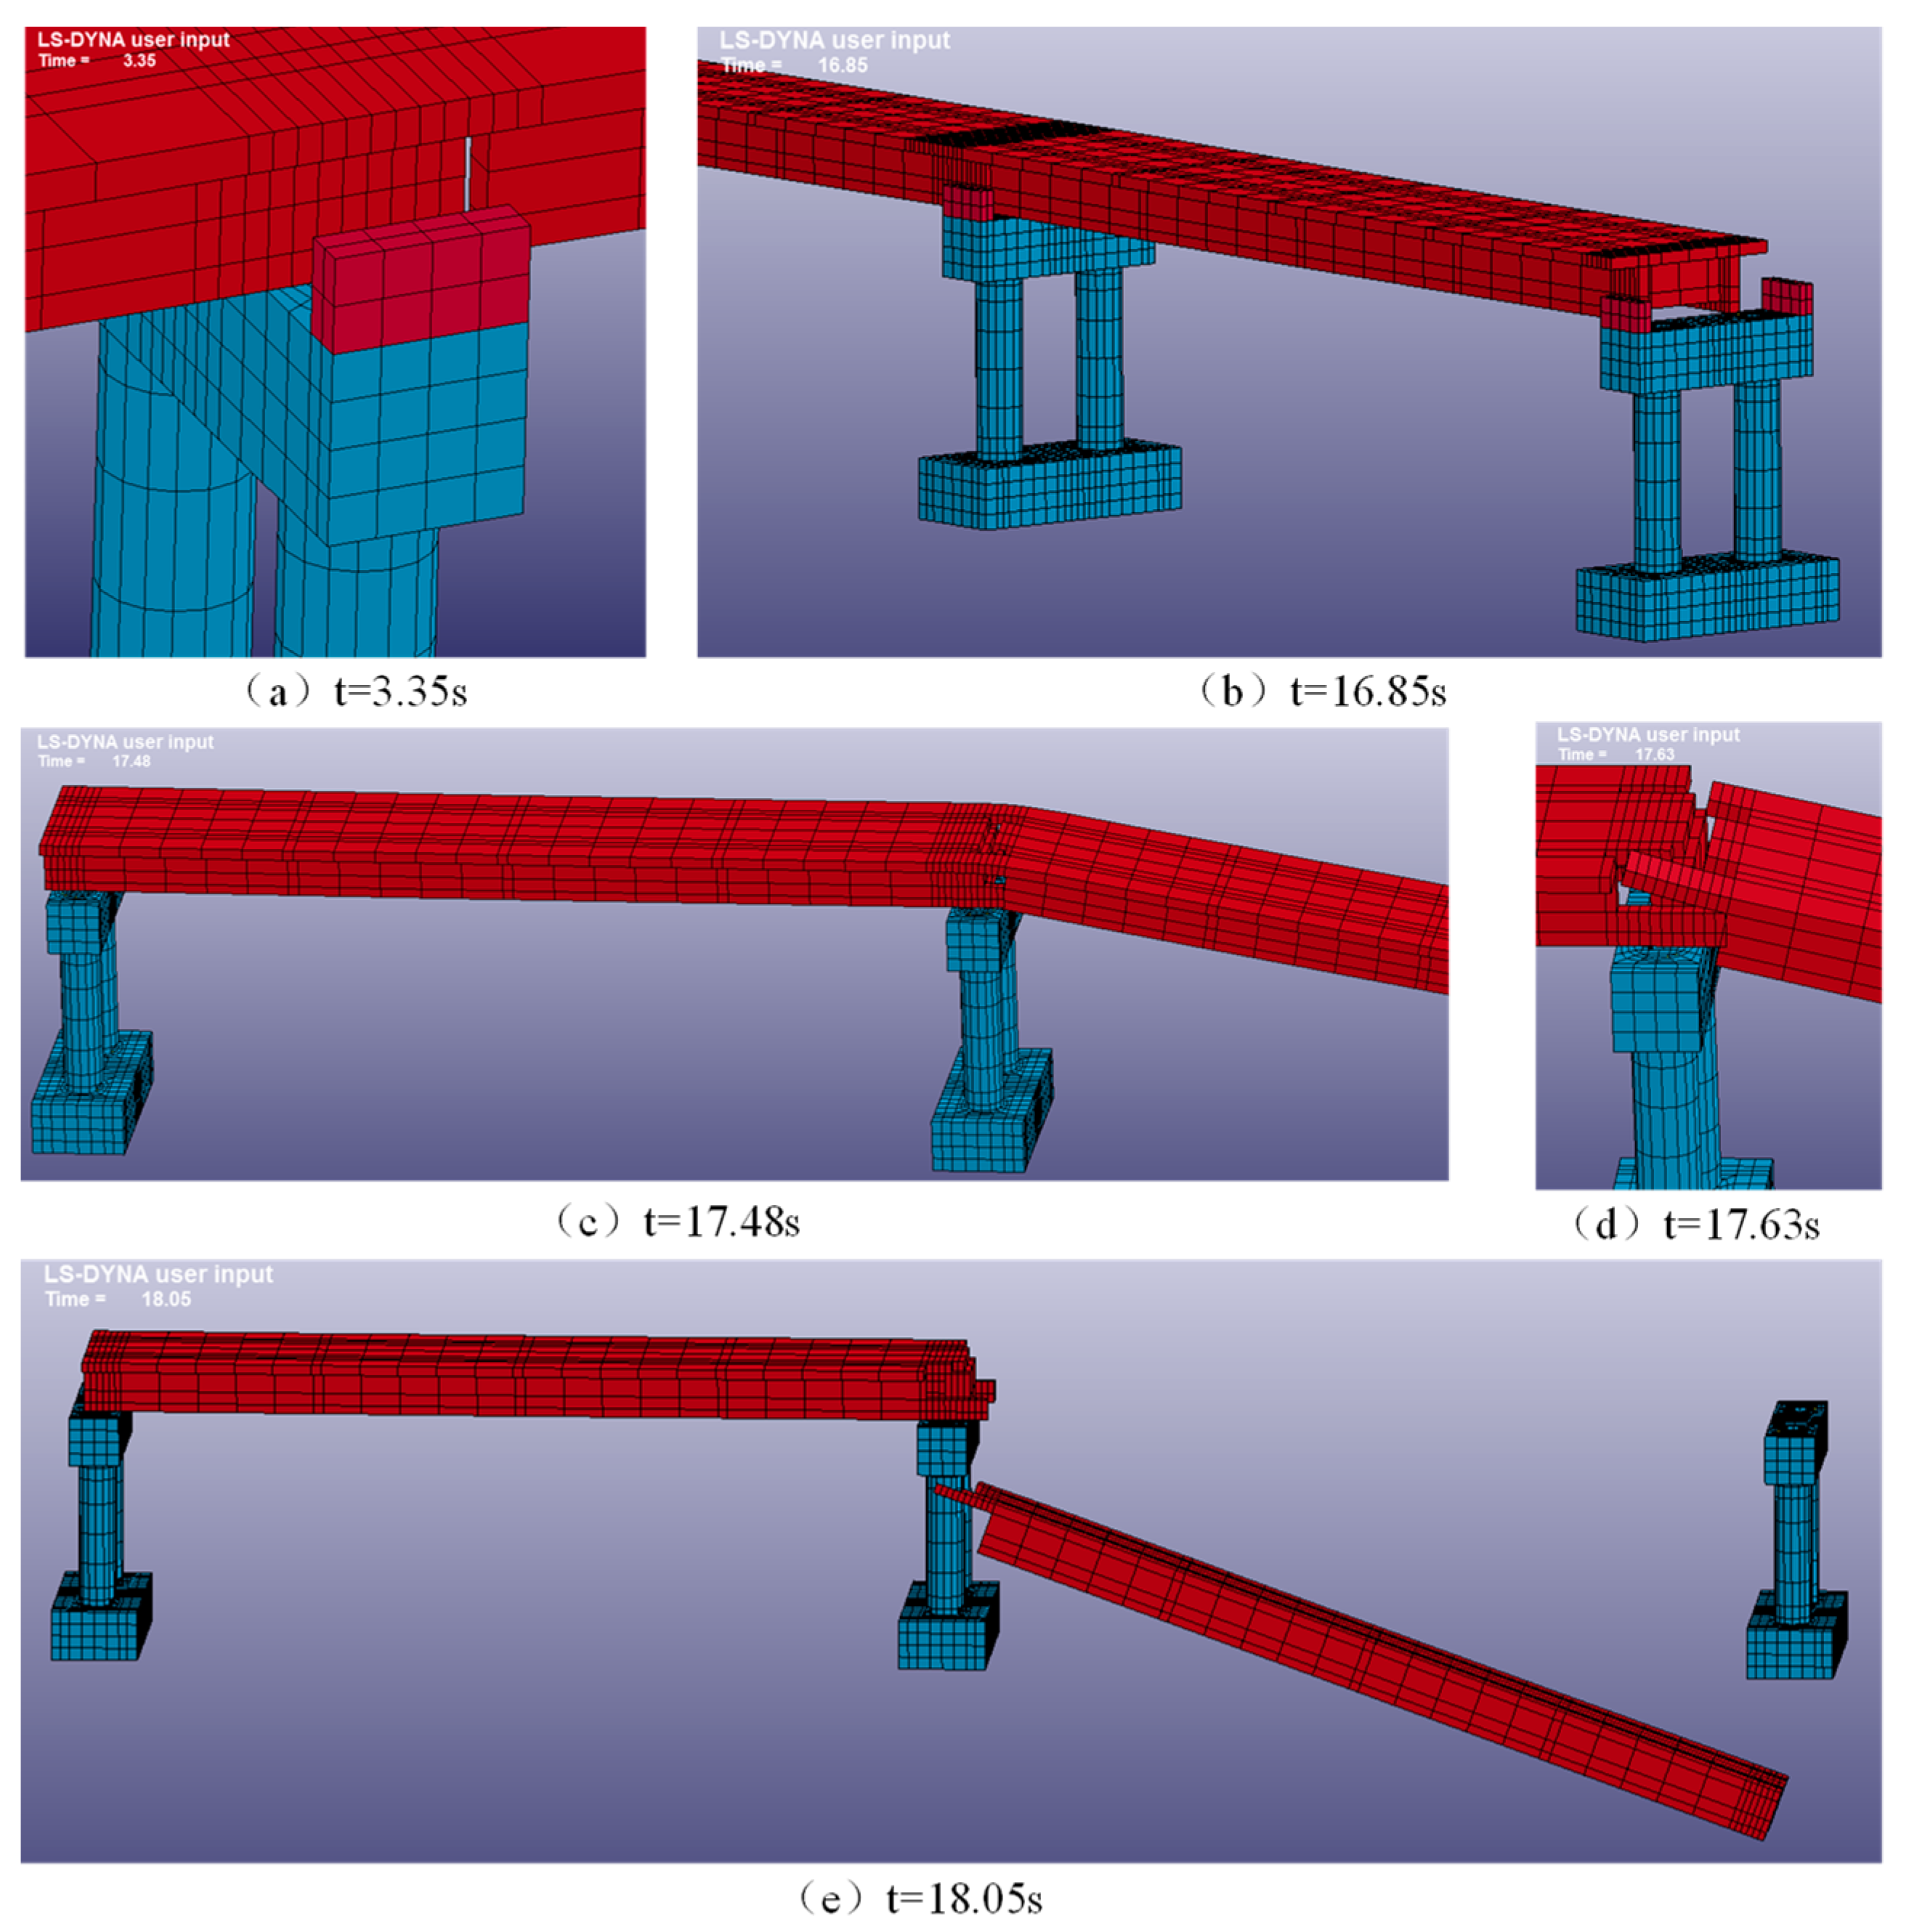
Applsci 11 08935 g017
Figure 18. Collapse process under bidirectional Chi−chi wave input.
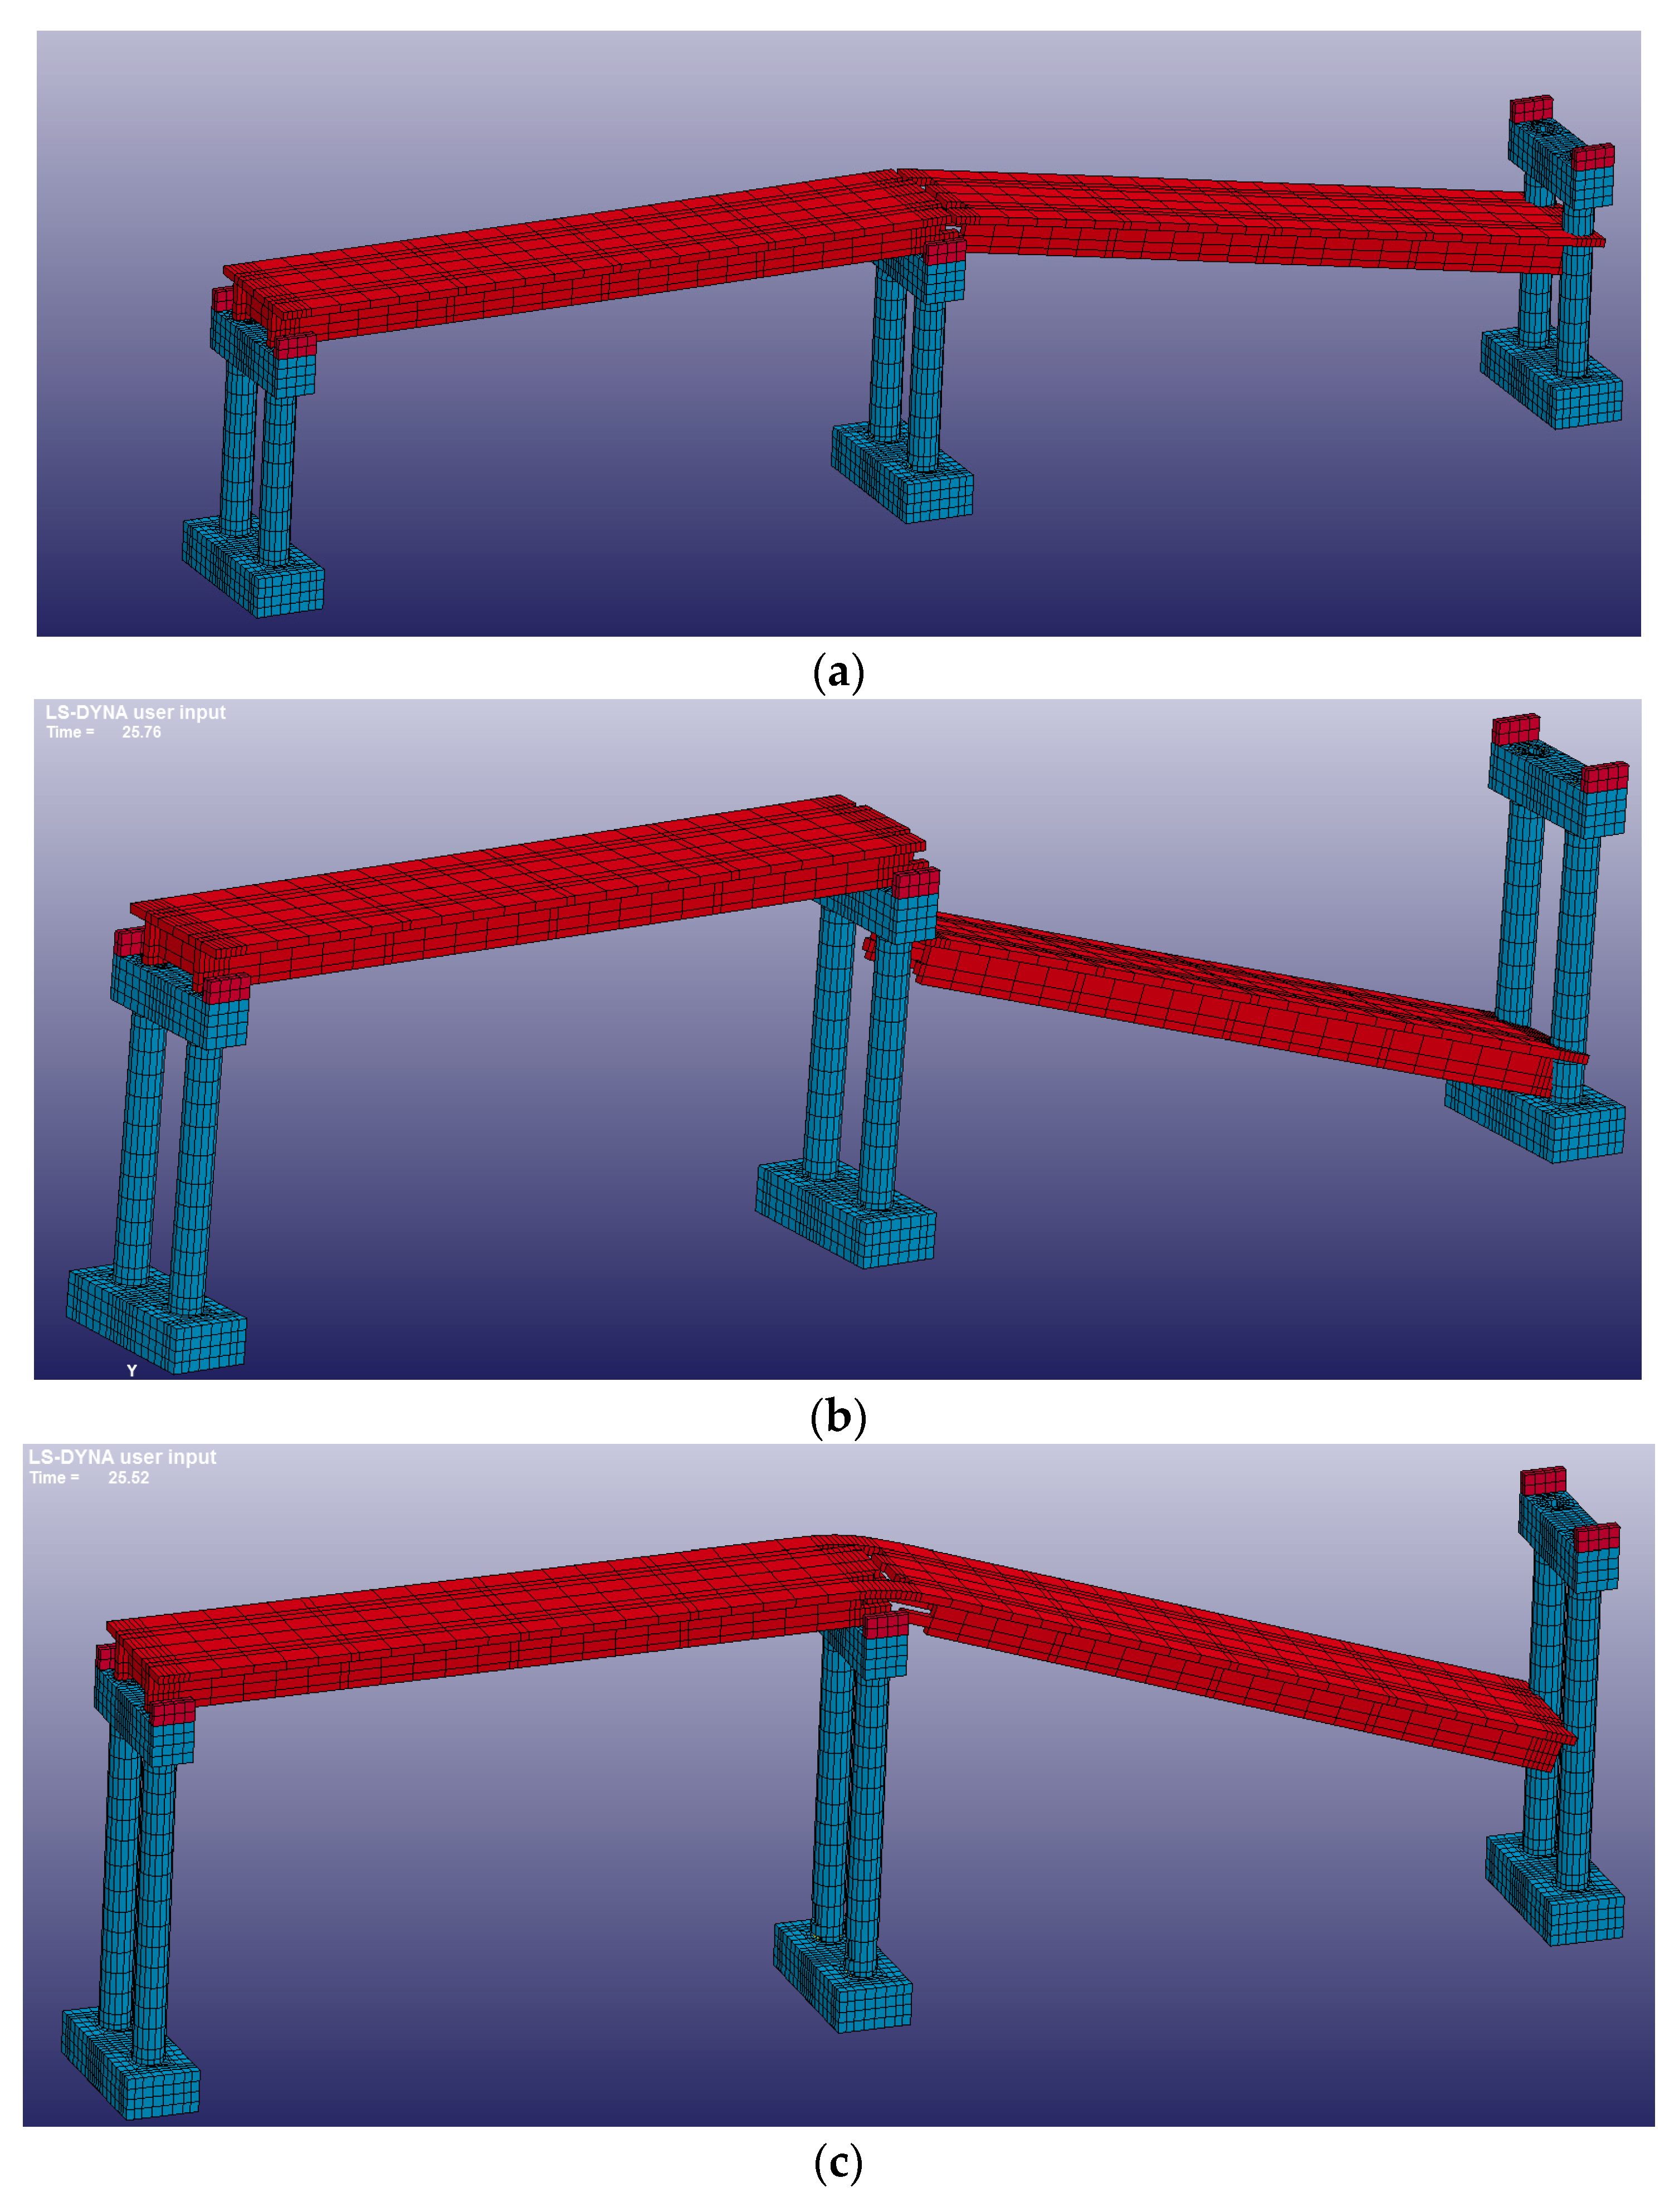
Applsci 11 08935 g018
Figure 19. Collapse mode of bridge model under Chi−chi wave input: (a) column length of 1.8 m; (b) column length of 2.4 m; (c) column length of 3 m; (d) column length of 3.6 m.
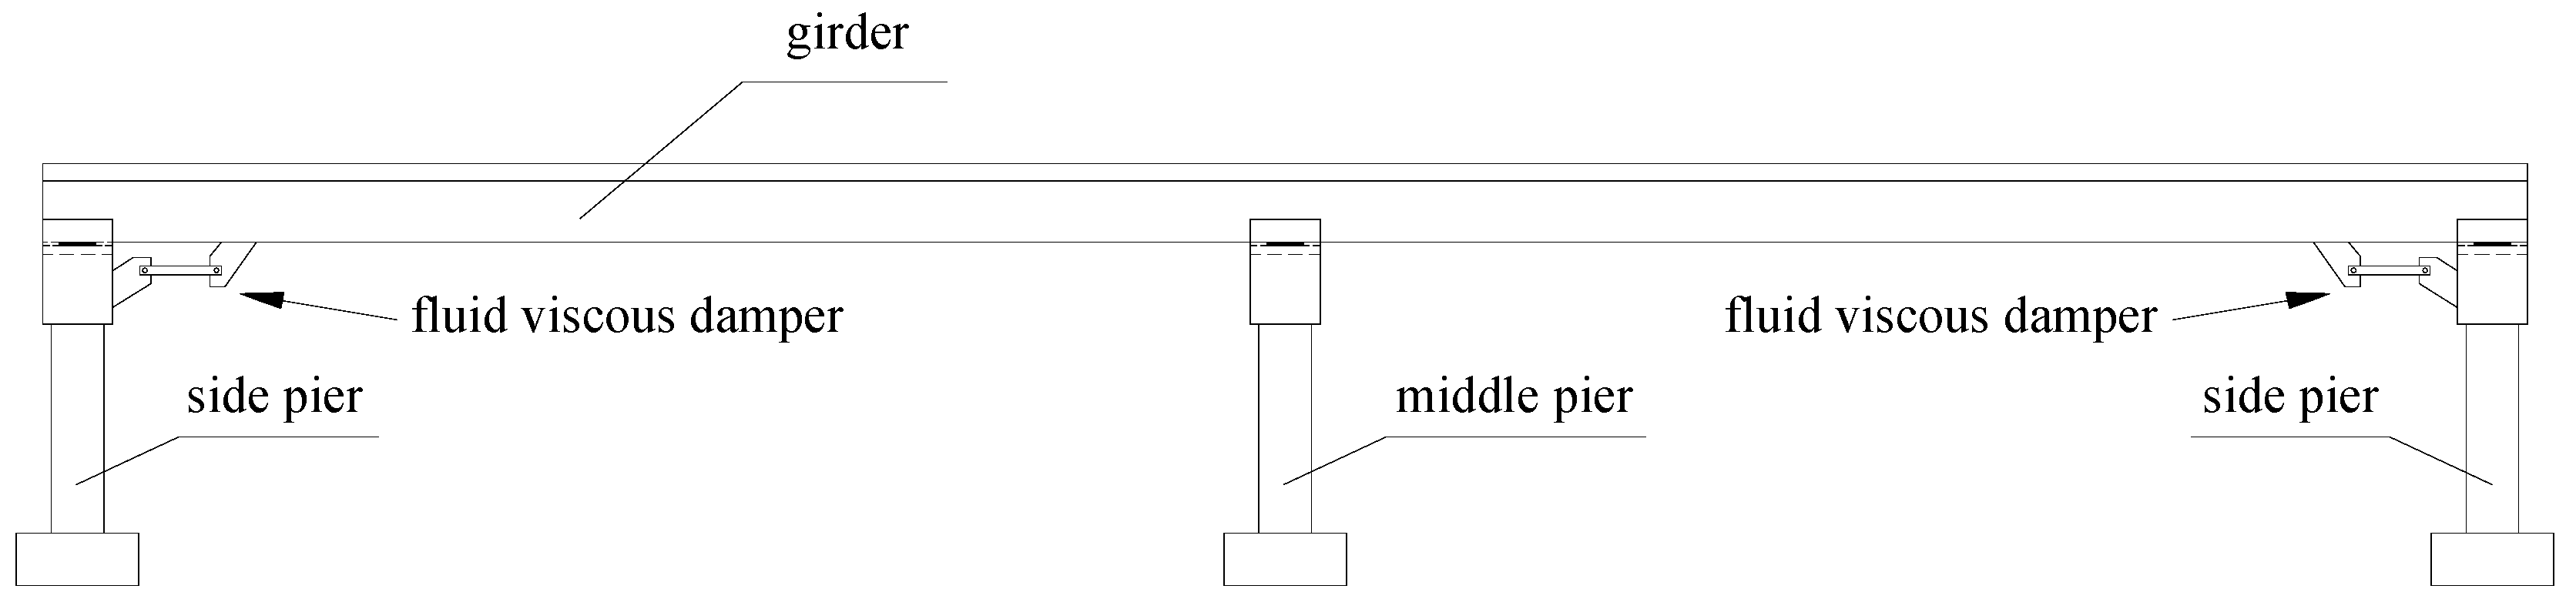
Applsci 11 08935 g019aApplsci 11 08935 g019b
Figure 20. Layout diagram of fluid viscous damper.
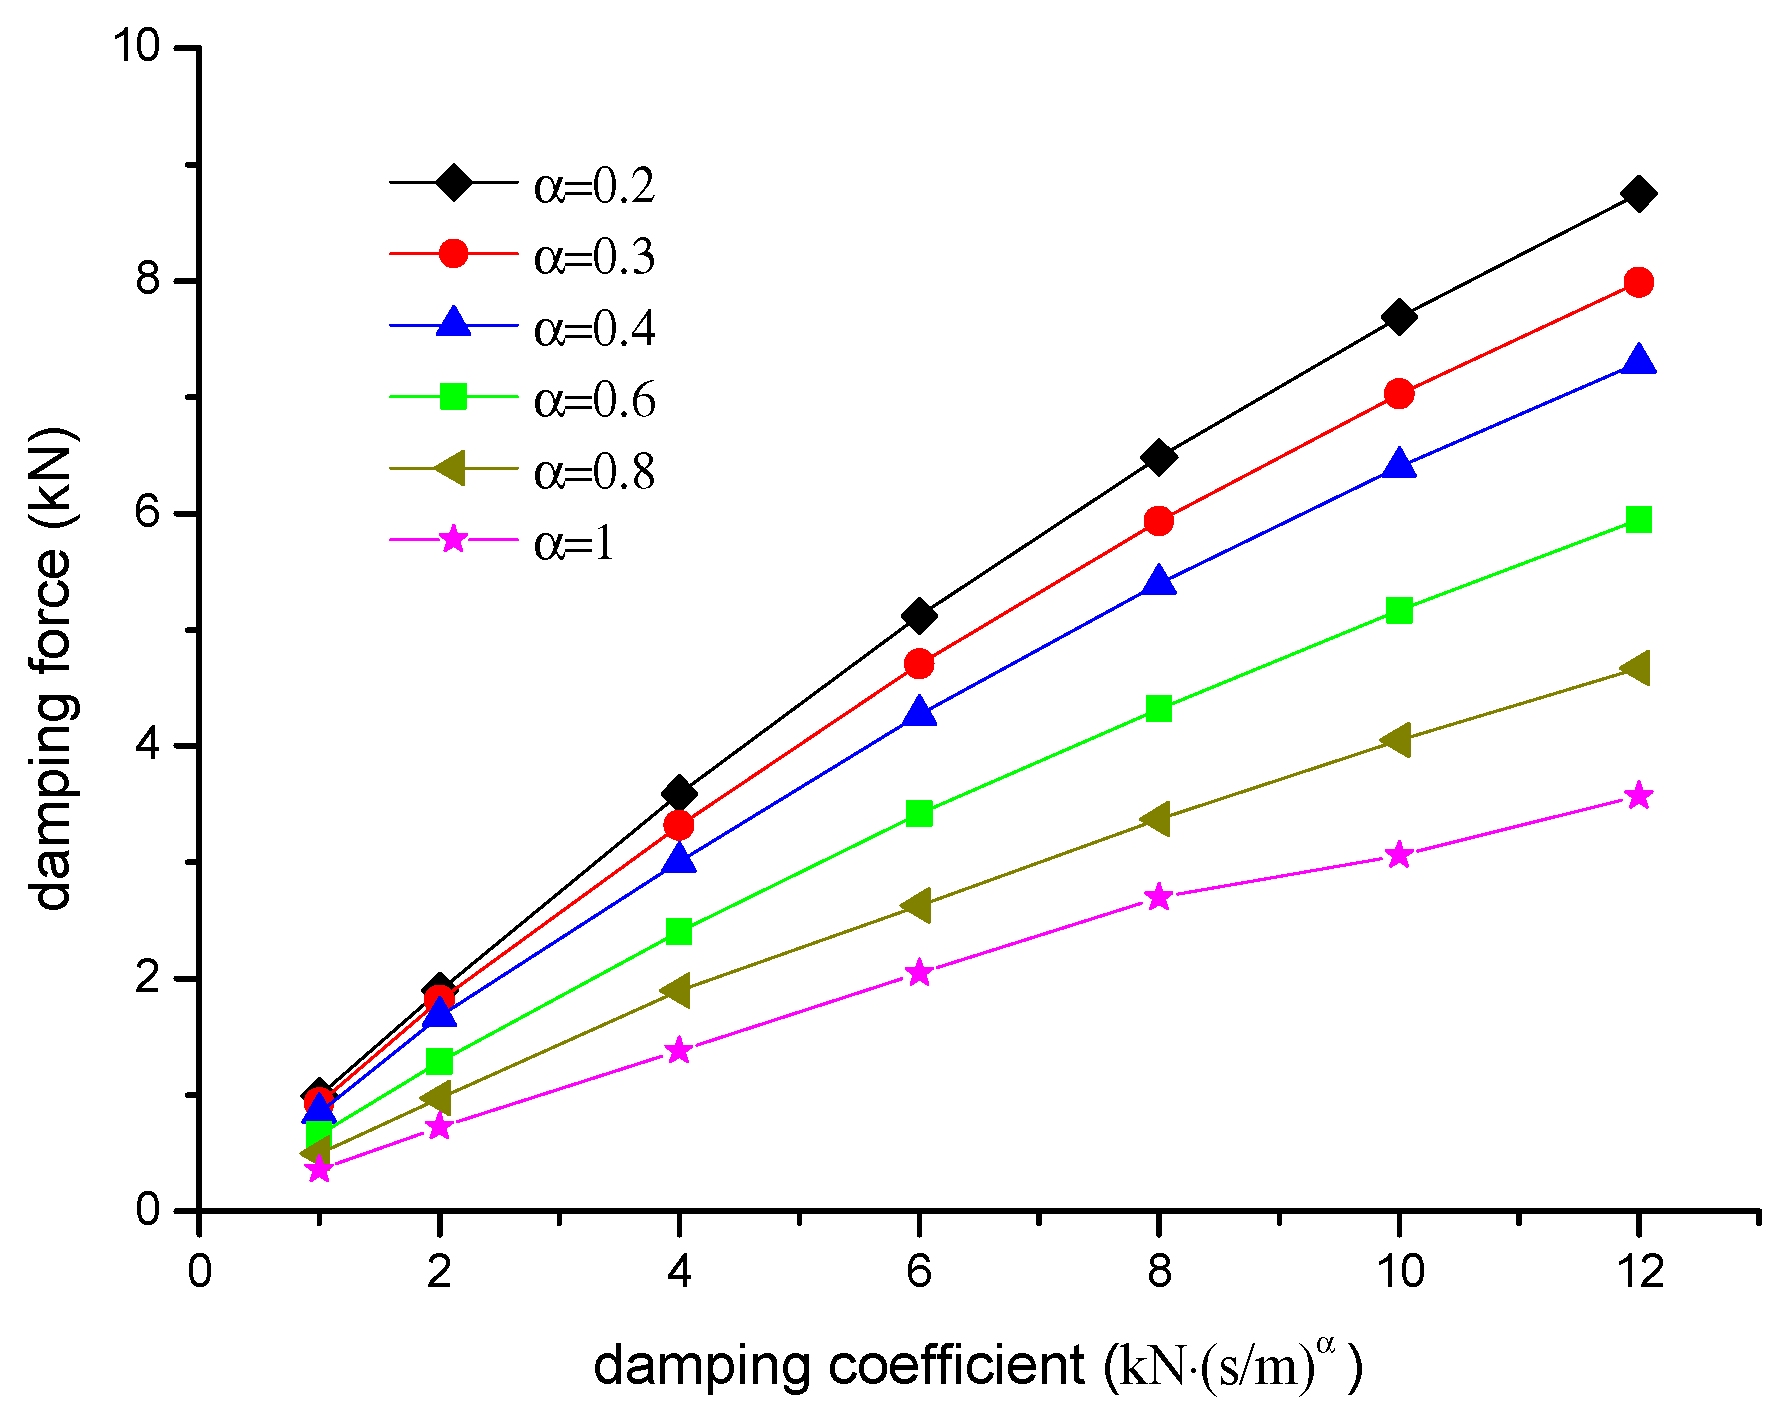
Applsci 11 08935 g020
Figure 21. The change curve of damping force peak.
Applsci 11 08935 g021
Figure 22. The change curve of damper stroke peak.
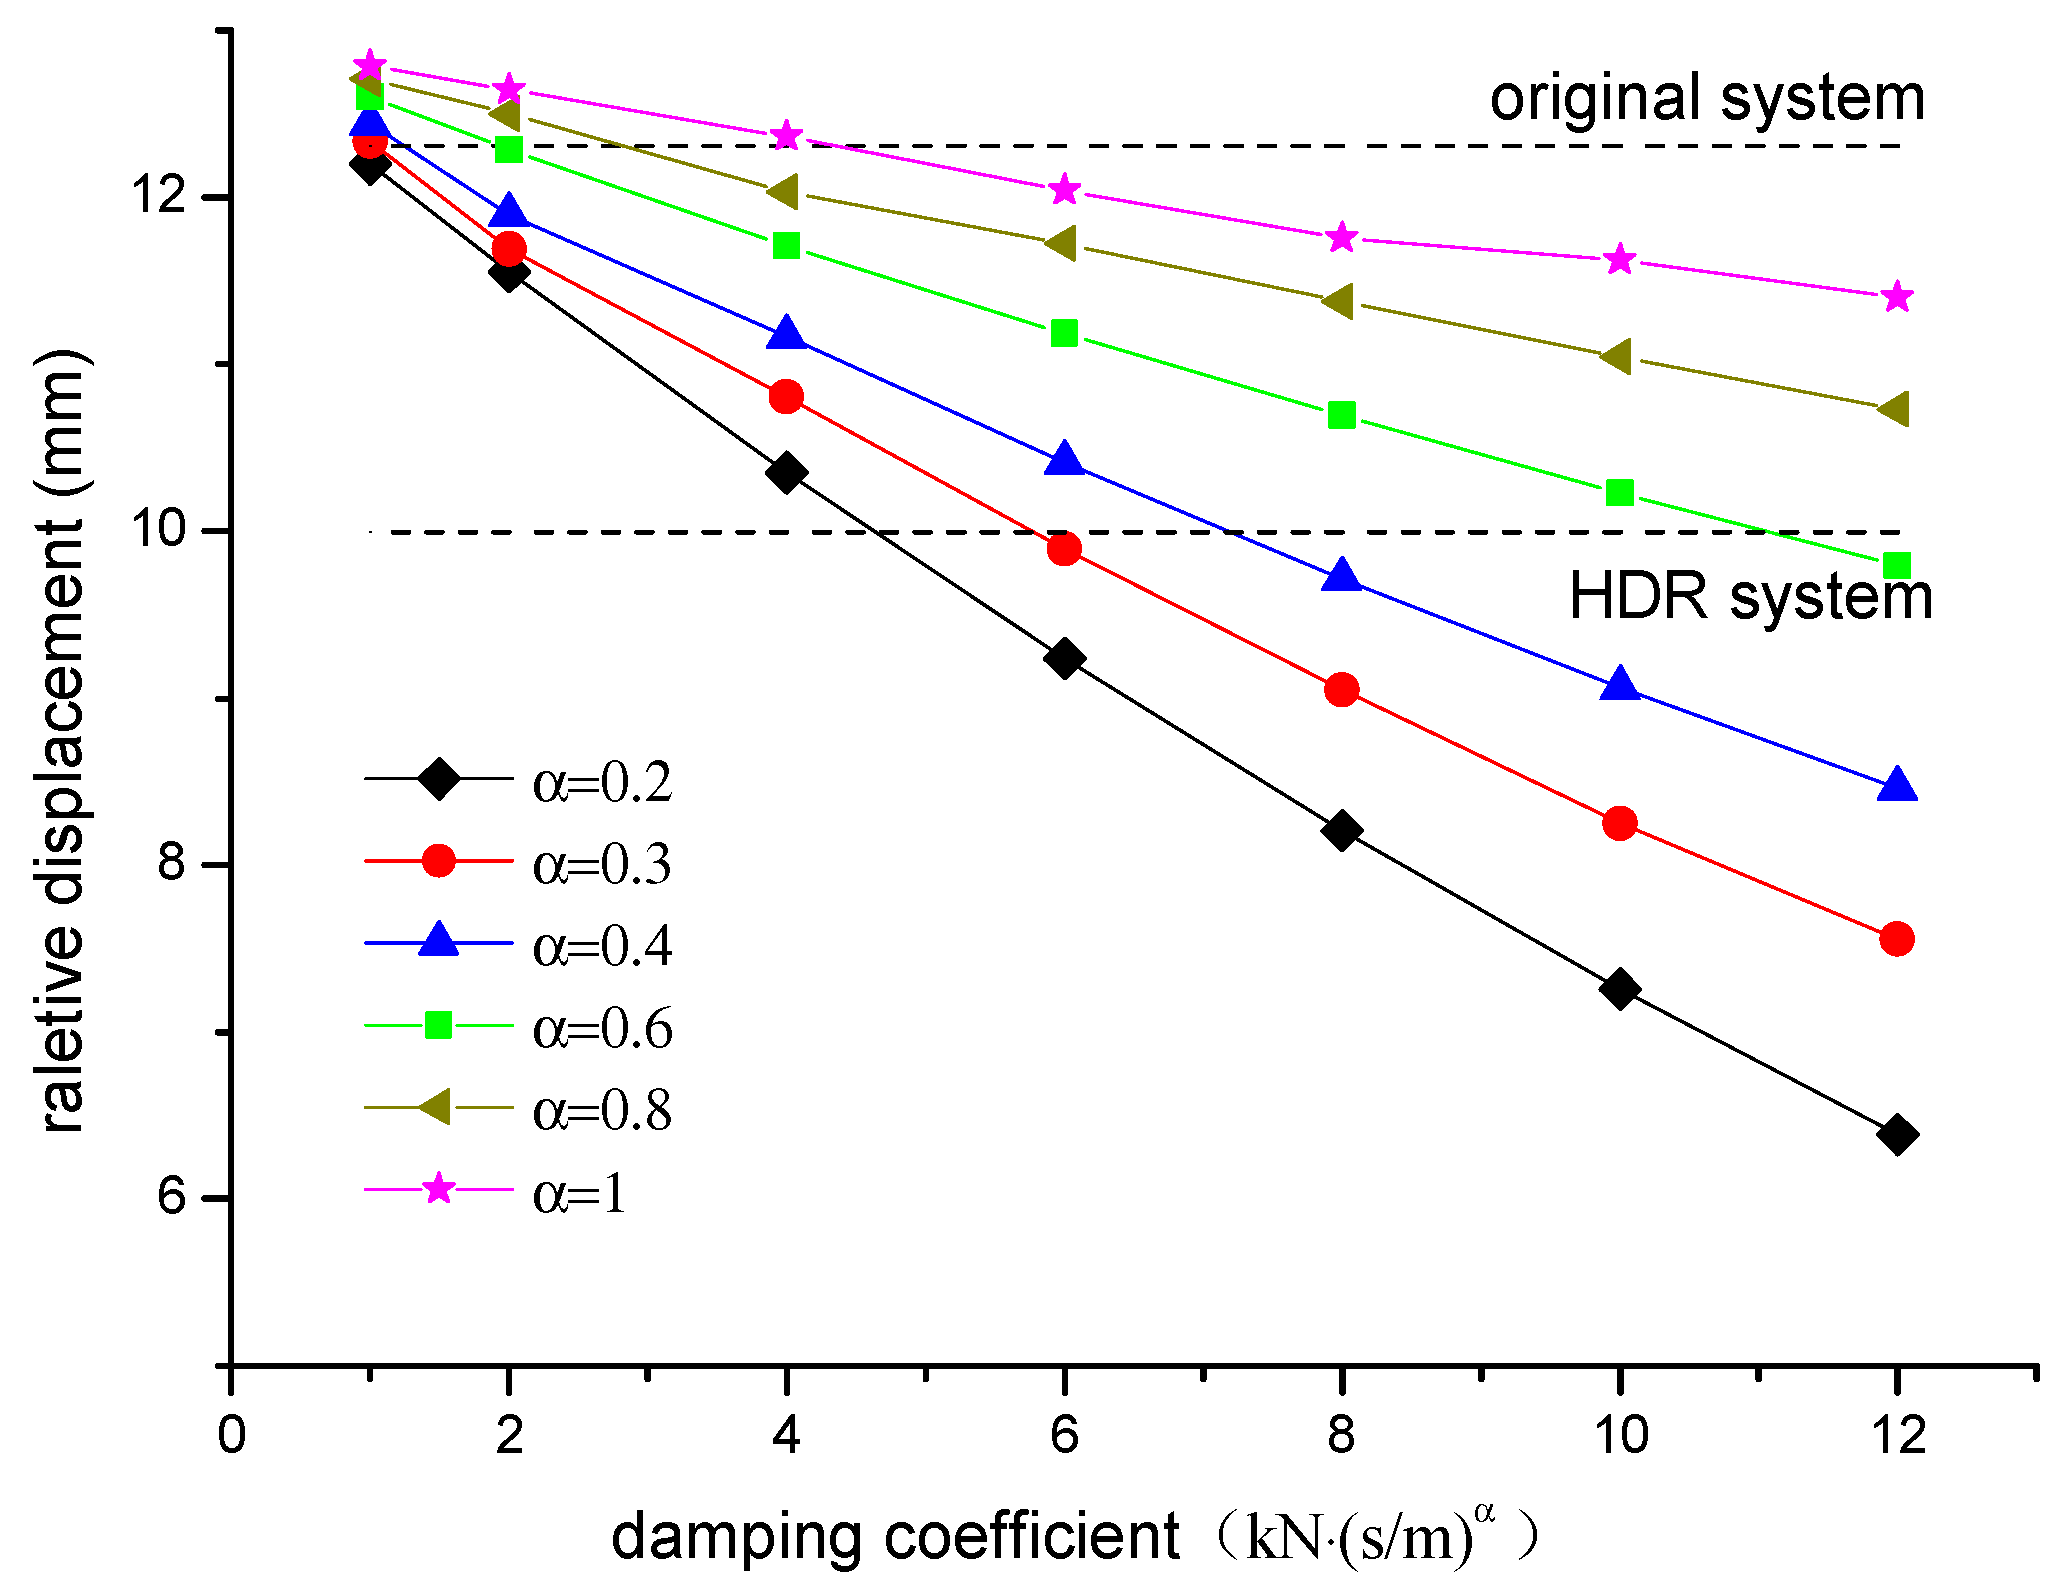
Applsci 11 08935 g022
Figure 23. Peak relative displacement between the side pier and the beam.
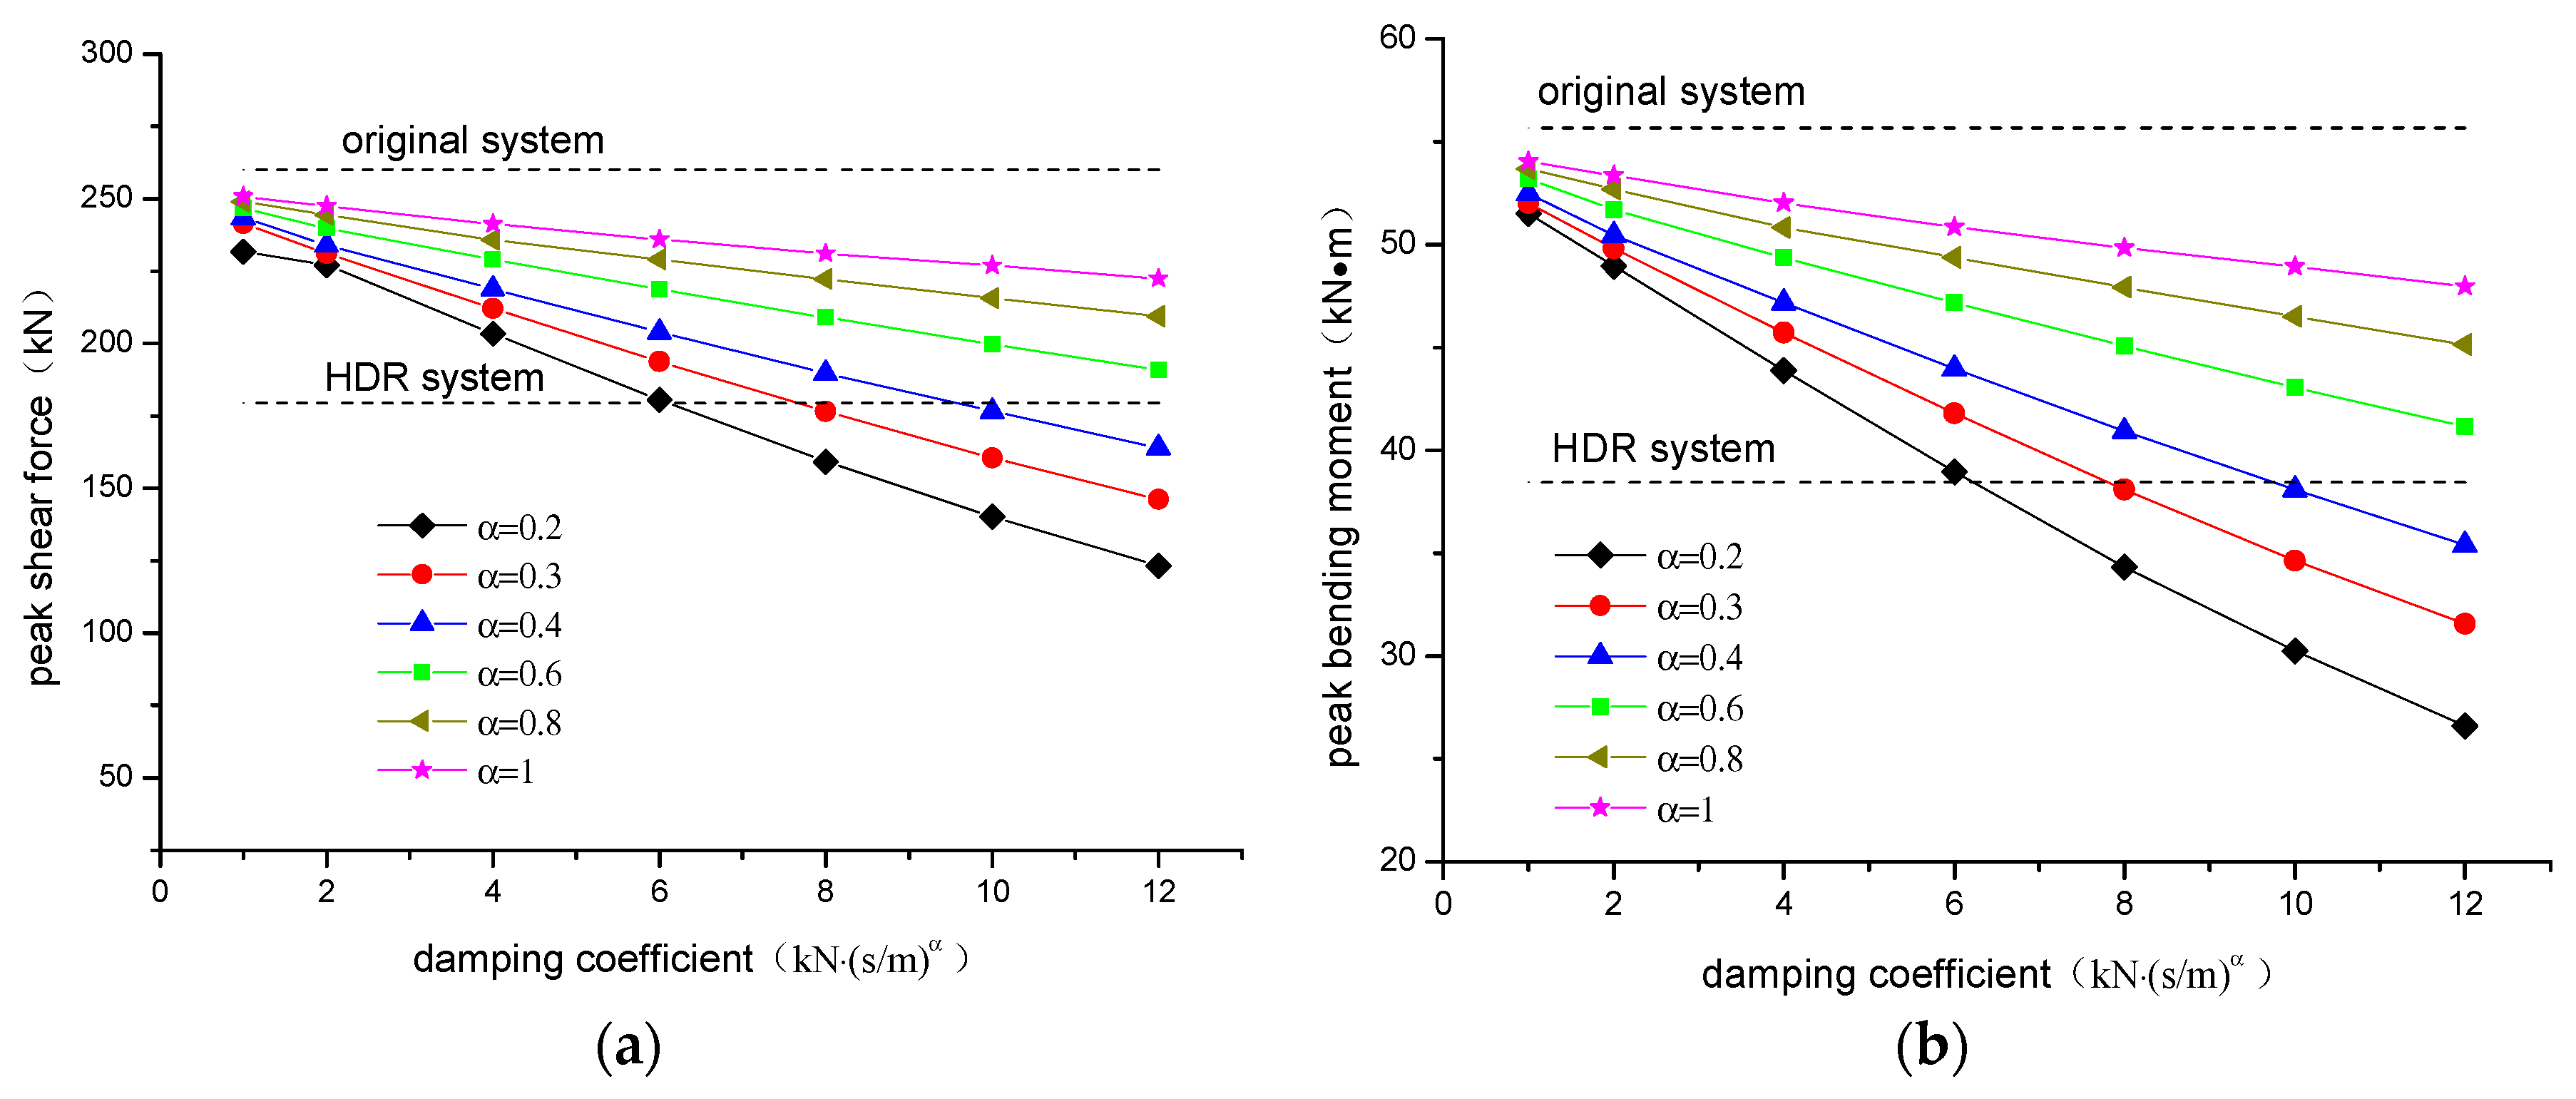
Applsci 11 08935 g023
Figure 24. The change curve of internal force peak at the bottom of the middle pier: (a) shear force; (b) moment.
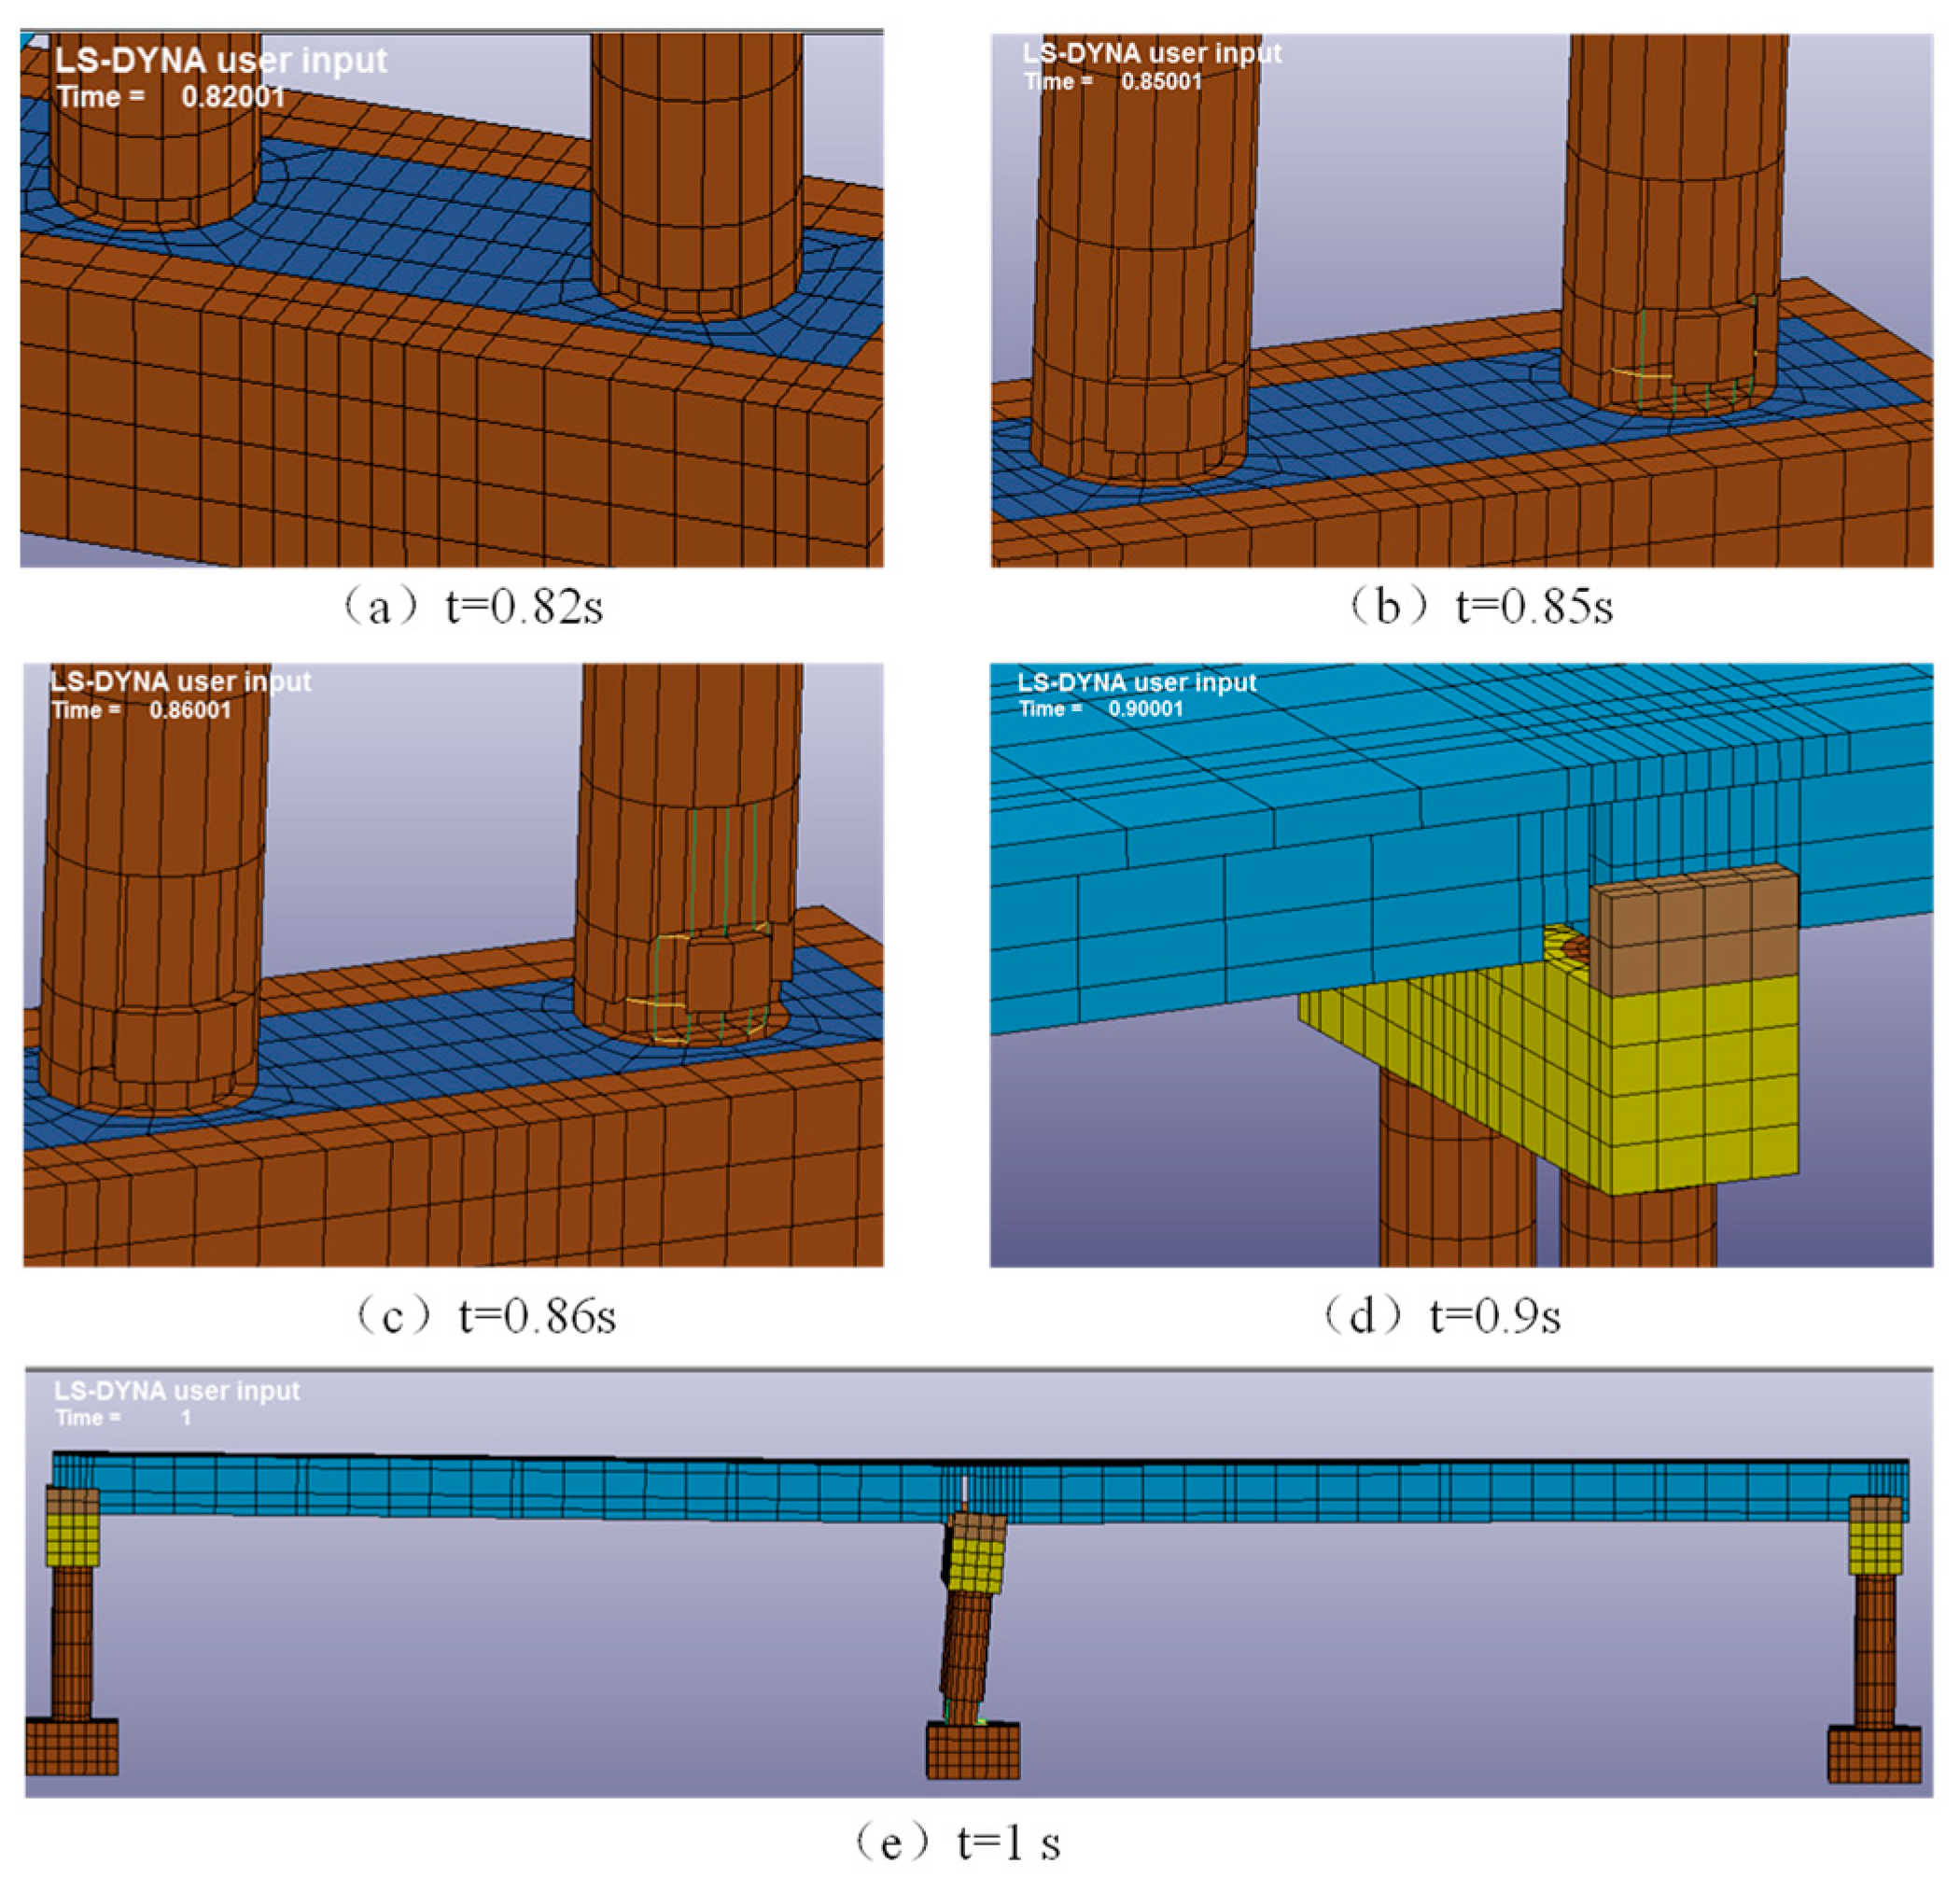
Applsci 11 08935 g024
Figure 25. Collapse process of shock mitigation system under El Centro seismic wave.
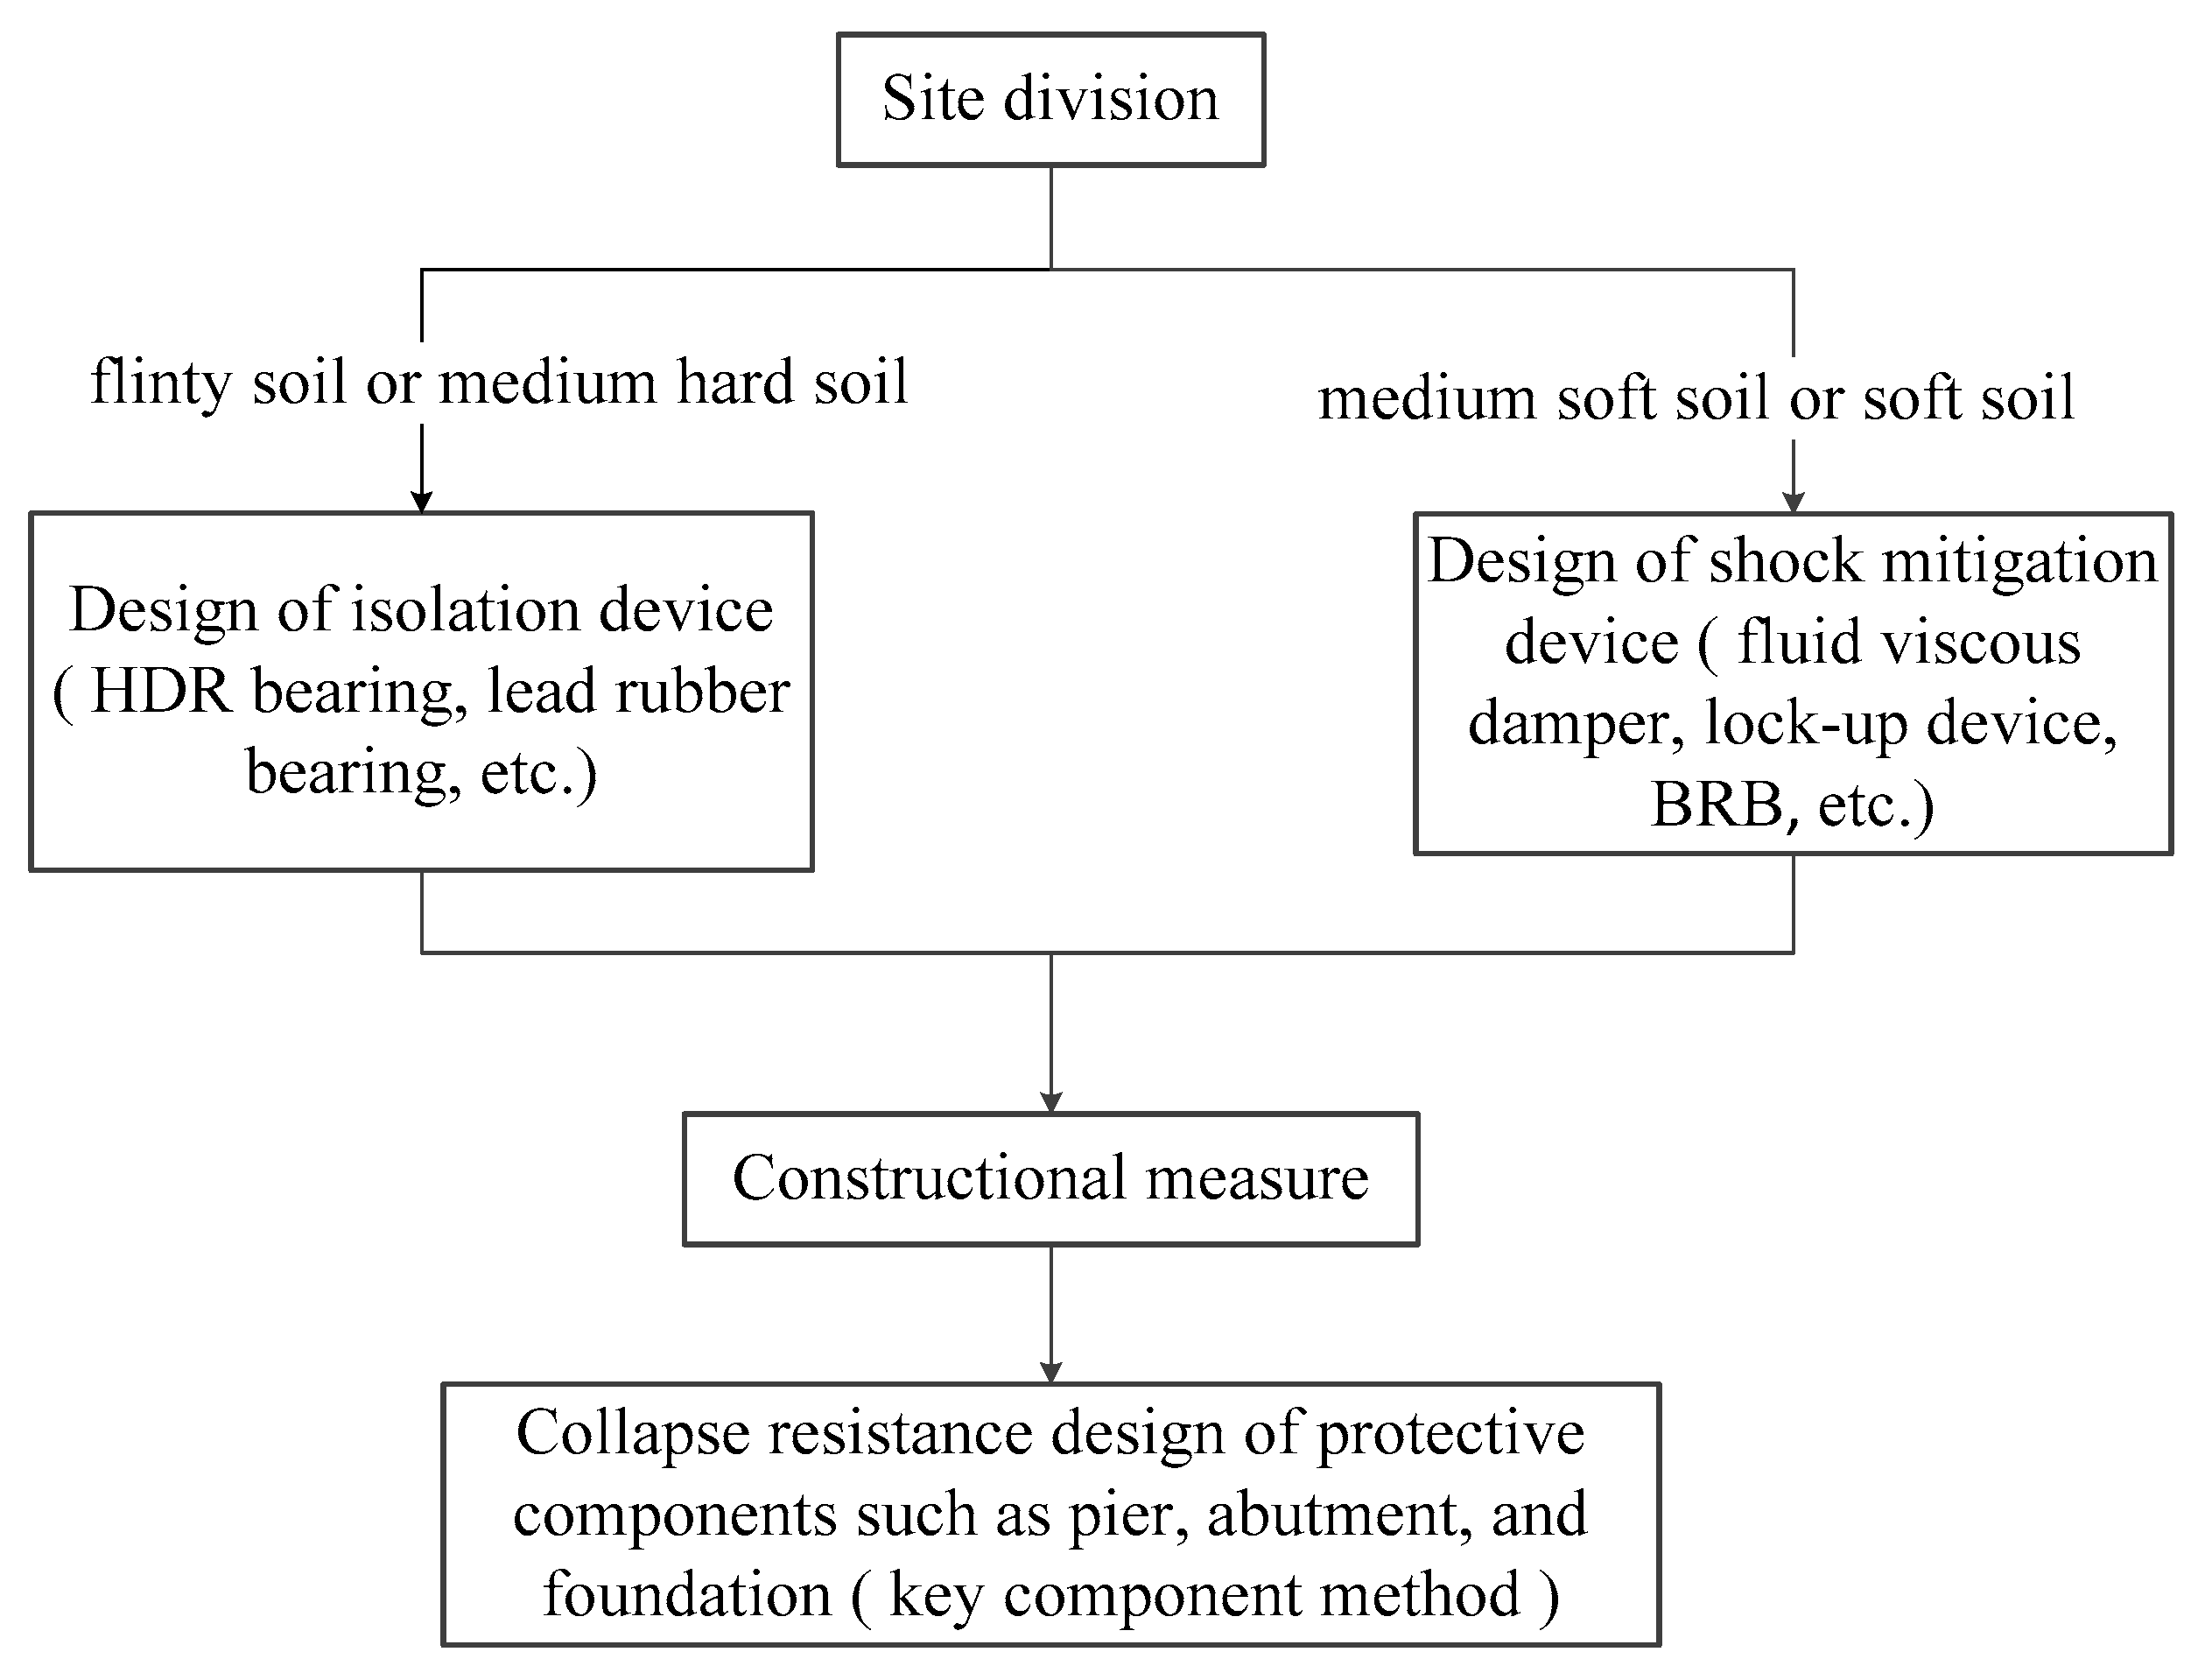
Applsci 11 08935 g025
Figure 26. Suggested anti-collapse ductility design flow.
Applsci 11 08935 g026
Table 1. Similar relation of bridge specimen.
Physical QuantityDimensionRelationshipCoefficient of Similarity
Geometric propertiesLength[L]Sl1/3
Area[L]Sl21/9
Material propertiesMass[M]Sl2·Sσ/Sa1/18
Density[ML−3]Sσ/(Sl·Sa)1.5
Stress[ML−1T−2]Sσ1
Strain[1]Sσ/SE1
Elastic Modulus[ML−1T−2]Sσ1
Load performanceForce[MLT−2]Sl2·Sσ1/9
Moment[ML2T−2]Sl3·Sσ1/27
Dynamic propertiesTime[T]Sl0.5·Sa−0.50.408
Frequency[T−1]Sl0.5·Sa0.52.449
Acceleration[LT−2]Sa2.0
Gravity[LT−2]11
Damping Ratio[MT−1]Sl1.5·Sσ·Sa0.51/9
Table 2. Comparison between calculated and experimental values of vibration mode frequency of finite element model.
DirectionMode OrderExperimental Values/HzCalculated Values/HzError/%Vibration Mode
Longitudinal13.8643.847−0.44 Applsci 11 08935 i001
Transverse14.2644.4354.01 Applsci 11 08935 i002
25.3645.115−4.64 Applsci 11 08935 i003
312.70413.4676.01 Applsci 11 08935 i004
Vertical18.5197.939−6.81 Applsci 11 08935 i005
212.69212.345−2.73 Applsci 11 08935 i006
326.65927.7904.24 Applsci 11 08935 i007
Table 3. Original shaking wave details.
WaveObservation StationYearDuration/sPGA/m·s−2Predominant Period/s
El CentroImperial Valley, USGS194053.4603.40.19
Chi−ChiTCU117199989.9951.20.57
Table 4. Comparison of seismic response and collapse condition.
Wave conditionCase of 0.4g PGACollapse Case
Peak Longitudinal Relative Displacement/mmPeak Acceleration Response of Middle Pier Cap/m·s−2Peak Principle Compressive Strain of Middle Pier at the Bottom/μεPGA of the Wave
El Centro waveX12.146.755191.2 g
X + 0.6Z12.457.685311.2 g
Chi−chi waveX15.536.596111.2 g
X + 0.8Z15.477.526021.2 g
Table 5. Longitudinal collapse information of El Centro wave input condition.
Span/mPGA/gFailure Time of Middle Pier/sCollapse Mode
3.31.41.94Structural collapse caused by failure of middle pier
5.31.20.93
6.71.20.9
8.31.00.91
Table 6. Longitudinal collapse information of Chi−chi wave input condition.
Span/mPGA/gCracking Time of Upper Edge of Beam/sCollapse Mode
3.31.617.09Excessive relative displacement between pier and beam led to falling beam
5.31.417.3
6.71.217.48
8.31.224.26
Table 7. Longitudinal collapse information of El Centro wave input condition.
Pier Height/mNatural Period of Vibration/sPGA/gFailure Time of Middle Pier/sCollapse Mode
1.20.2831.21.05Structural collapse caused by failure of middle pier
1.80.3381.21.07
2.40.4091.41.04
30.4951.41.37
3.60.5942.21.97
Table 8. Longitudinal collapse information of Chi−chi wave input condition.
Pier Height/mNatural Period of Vibration/sPGA/gCracking Time of Upper Edge of Beam/sCollapse Mode
1.20.2831.217.45Excessive relative displacement between pier and beam led to falling beam
1.80.3381.025.28
2.40.4091.025.34
30.4950.825.22
3.60.5940.825.13
Table 9. Damper parameter optimization scheme.
Scheme NumberαC/kN·(s/m)αScheme NumberαC/kN·(s/m)α
10.21220.61
20.22230.62
30.24240.64
40.26250.66
50.28260.68
60.210270.610
70.212280.612
80.31290.81
90.32300.82
100.34310.84
110.36320.86
120.38330.88
130.310340.810
140.312350.812
150.413611
160.423712
170.443814
180.463916
190.484018
200.41041110
210.41242112
Table 10. Damper parameter alternative scheme.
Scheme Number123456789101112
C/kN·(s/m)α6688810101012121212
α0.20.30.20.30.40.20.30.40.20.30.40.6
Publisher’s Note: MDPI stays neutral with regard to jurisdictional claims in published maps and institutional affiliations.

