Article

Terahertz Sensing for R/S Chiral Ibuprofen via All-Dielectric Metasurface with Higher-Order Resonance

1
Tianjin Key Laboratory of Micro-scale Optical Information Science and Technology, Institute of Modern Optics, Nankai University, Tianjin 300350, China
2
Tianjin Key Laboratory of Optoelectronic Sensor and Sensing Network Technology, Nankai University, Tianjin 300350, China
*
Authors to whom correspondence should be addressed.
Appl. Sci. 2021, 11(19), 8892; https://doi.org/10.3390/app11198892
Submission received: 18 August 2021 / Revised: 16 September 2021 / Accepted: 21 September 2021 / Published: 24 September 2021
(This article belongs to the Special Issue Applications of Millimeter-Wave and Terahertz Technologies)

Abstract

:
A terahertz (THz) all-dielectric metasurface with crescent cylinder arrays for chiral drug sensing has been demonstrated. Through the multipole expansion method, we theoretically found that breaking the symmetry of the metasurface can excite higher-order resonance modes and provide stronger anisotropy as well as enhanced sensitivity for the surroundings, which gives a better sensing performance than lower-order resonance. Based on the frequency shift and transmittance at higher-order resonance, we carried out the sensing experiments on (R)-(−)-ibuprofen and (S)-(+)-ibuprofen solution on the surface of this metasurface sensor. We were able to monitor the concentrations of ibuprofen solutions, and the maximum sensitivity reached 60.42 GHz/mg. Furthermore, we successfully distinguished different chiral molecules such as (R)-(−)-ibuprofen and (S)-(+)-ibuprofen in the 5 μL trace amount of samples. The maximum differentiation was 18.75 GHz/mg. Our analysis confirms the applicability of this crescent all-dielectric metasurface to enhanced sensing and detection of chiral molecules, which provides new paths for the identification of biomolecules in a trace amount.

1. Introduction

With increasing demands for developing reliable and effective biological sensors [1], terahertz (THz) radiation has attracted great attention as a promising tool in biological and medical investigation in recent years. Because of the unique characteristics of THz waves—which are as follows: (1) non-ionizing and do not damage biological tissues; (2) sensitive to weak resonances [2]; (3) highly sensitive to water—THz sensing could soon become a suitable technology for biological applications. In particular, up to now many reports have demonstrated that THz time-domain spectroscopy (THz-TDS) is a powerful technique for label-free, non-contact, and highly sensitive biomolecule sensing, including the detection of proteins, DNA, or RNA [3,4,5]; the detection of cells [6]; and antibiotics [7], etc. However, achieving reliable sensing for trace amounts of sample is still a major challenge.
One of the most promising routes to promote THz sensing sensitivities is to use metasurfaces [8,9,10,11,12,13,14]. These artificial structures’ electromagnetic properties can be easily controlled by the geometry, shape, or orientation of their constituents, which provide extremely strong confinement of electromagnetic fields to detect small changes in the dielectric environment around the metasurfaces [15,16,17], leading to high efficiency and sensitivity. Many reports have successfully demonstrated the high sensitivity of metasurface-based THz biosensors; for example, Cheng et al. proposed a THz biosensing metamaterial absorber based on spoof surface plasmon polaritons which showed ultrasensitive sensitivity and high resolution in virus detection [18]. Zhang et al. achieved highly sensitive THz sensing of small-volume liquid samples by a multi-microfluidic channel metamaterial biosensor [19]. However, applications in chiral pharmaceutical analysis have rarely been reported until now.
The chiral structure of molecules is one of the basic elements of nature. In the living system, chiral molecules often have extremely important properties and functions. Many important biological macromolecules, such as amino acids, polypeptides, proteins, polysaccharides, nucleic acids, and enzymes, are almost all chiral molecules [20,21]. Chiral drugs contain chiral centers in drug molecules. They usually achieve their pharmacological effects through strict chiral matching and molecular recognition with biological macromolecules in vivo [22,23]. Significant differences in pharmacological activity, the metabolic process, and toxicity exist between the chiral enantiomers of the drugs; one enantiomer may be effective, while the other enantiomer may be harmful [24]. For example, ibuprofen (4-isobutyl-2-phenylpropionic acid, C13H18O2), a well-known painkiller and an efficient anti-inflammatory, is widely used in daily life. It contains in its chemical structure a stereogenic carbon, and, thus, it has two enantiomers, called S-(+)-ibuprofen and R-(−)-ibuprofen, respectively. S-(+)-ibuprofen has anti-inflammatory and analgesic effects, while R-(−)-ibuprofen has almost no anti-inflammatory effect but will increase the metabolic burden. Therefore, the identification of enantiomers of chiral substances has always been one of the main problems in life sciences and other fields.
Recently, Asgari Somayyeh’s group [25] proposed a tunable and controllable graphene chiral metastructure to analyze the collagen biomolecule. Their simulations showed that a refractive index sensitivity value can be achieved as high as 0.96 THz per refractive index unit for the CD spectra. Zhang et al. [26] proposed a THz polarization sensing method and a chiral metasurface to improve sensing sensitivity. D- and L- enantiomers of three kinds of chiral amino acids in aqueous solution were successfully distinguished. Zhou et al. [27] incorporated graphene with a THz metasurface into a microfluidic cell for sensitive biosensing, and they found that 100 nm DNA short sequences could be detected by this method. This research has made breakthrough progress, but the structure design and experimental method are complicated. Achieving reliable and efficient detection is still a major challenge.
In this work, we present THz-TDS studies of a periodic crescent cylinder metasurface for highly sensitive detection of (R)-(−)-ibuprofen and (S)-(+)-ibuprofen. By using the traditional THz transmission experimental system, we found that when the symmetry of the cylinder is broken, the input THz waves can excite higher-order resonance modes inside the metasurface and provide stronger anisotropy as well as enhanced sensitivity for the surroundings. It is worth noting that by monitoring the frequency shift and transmittance at higher-order resonance, we were able to detect different concentrations of ibuprofen and distinguish the slight difference between (R)-(−)-ibuprofen and (S)-(+)-ibuprofen at the same concentration. The experimental results show that our metasurface-based sensor is compatible with drug concentration detection and chiral biomolecule recognition.

2. Structure Design and Theoretical Analysis

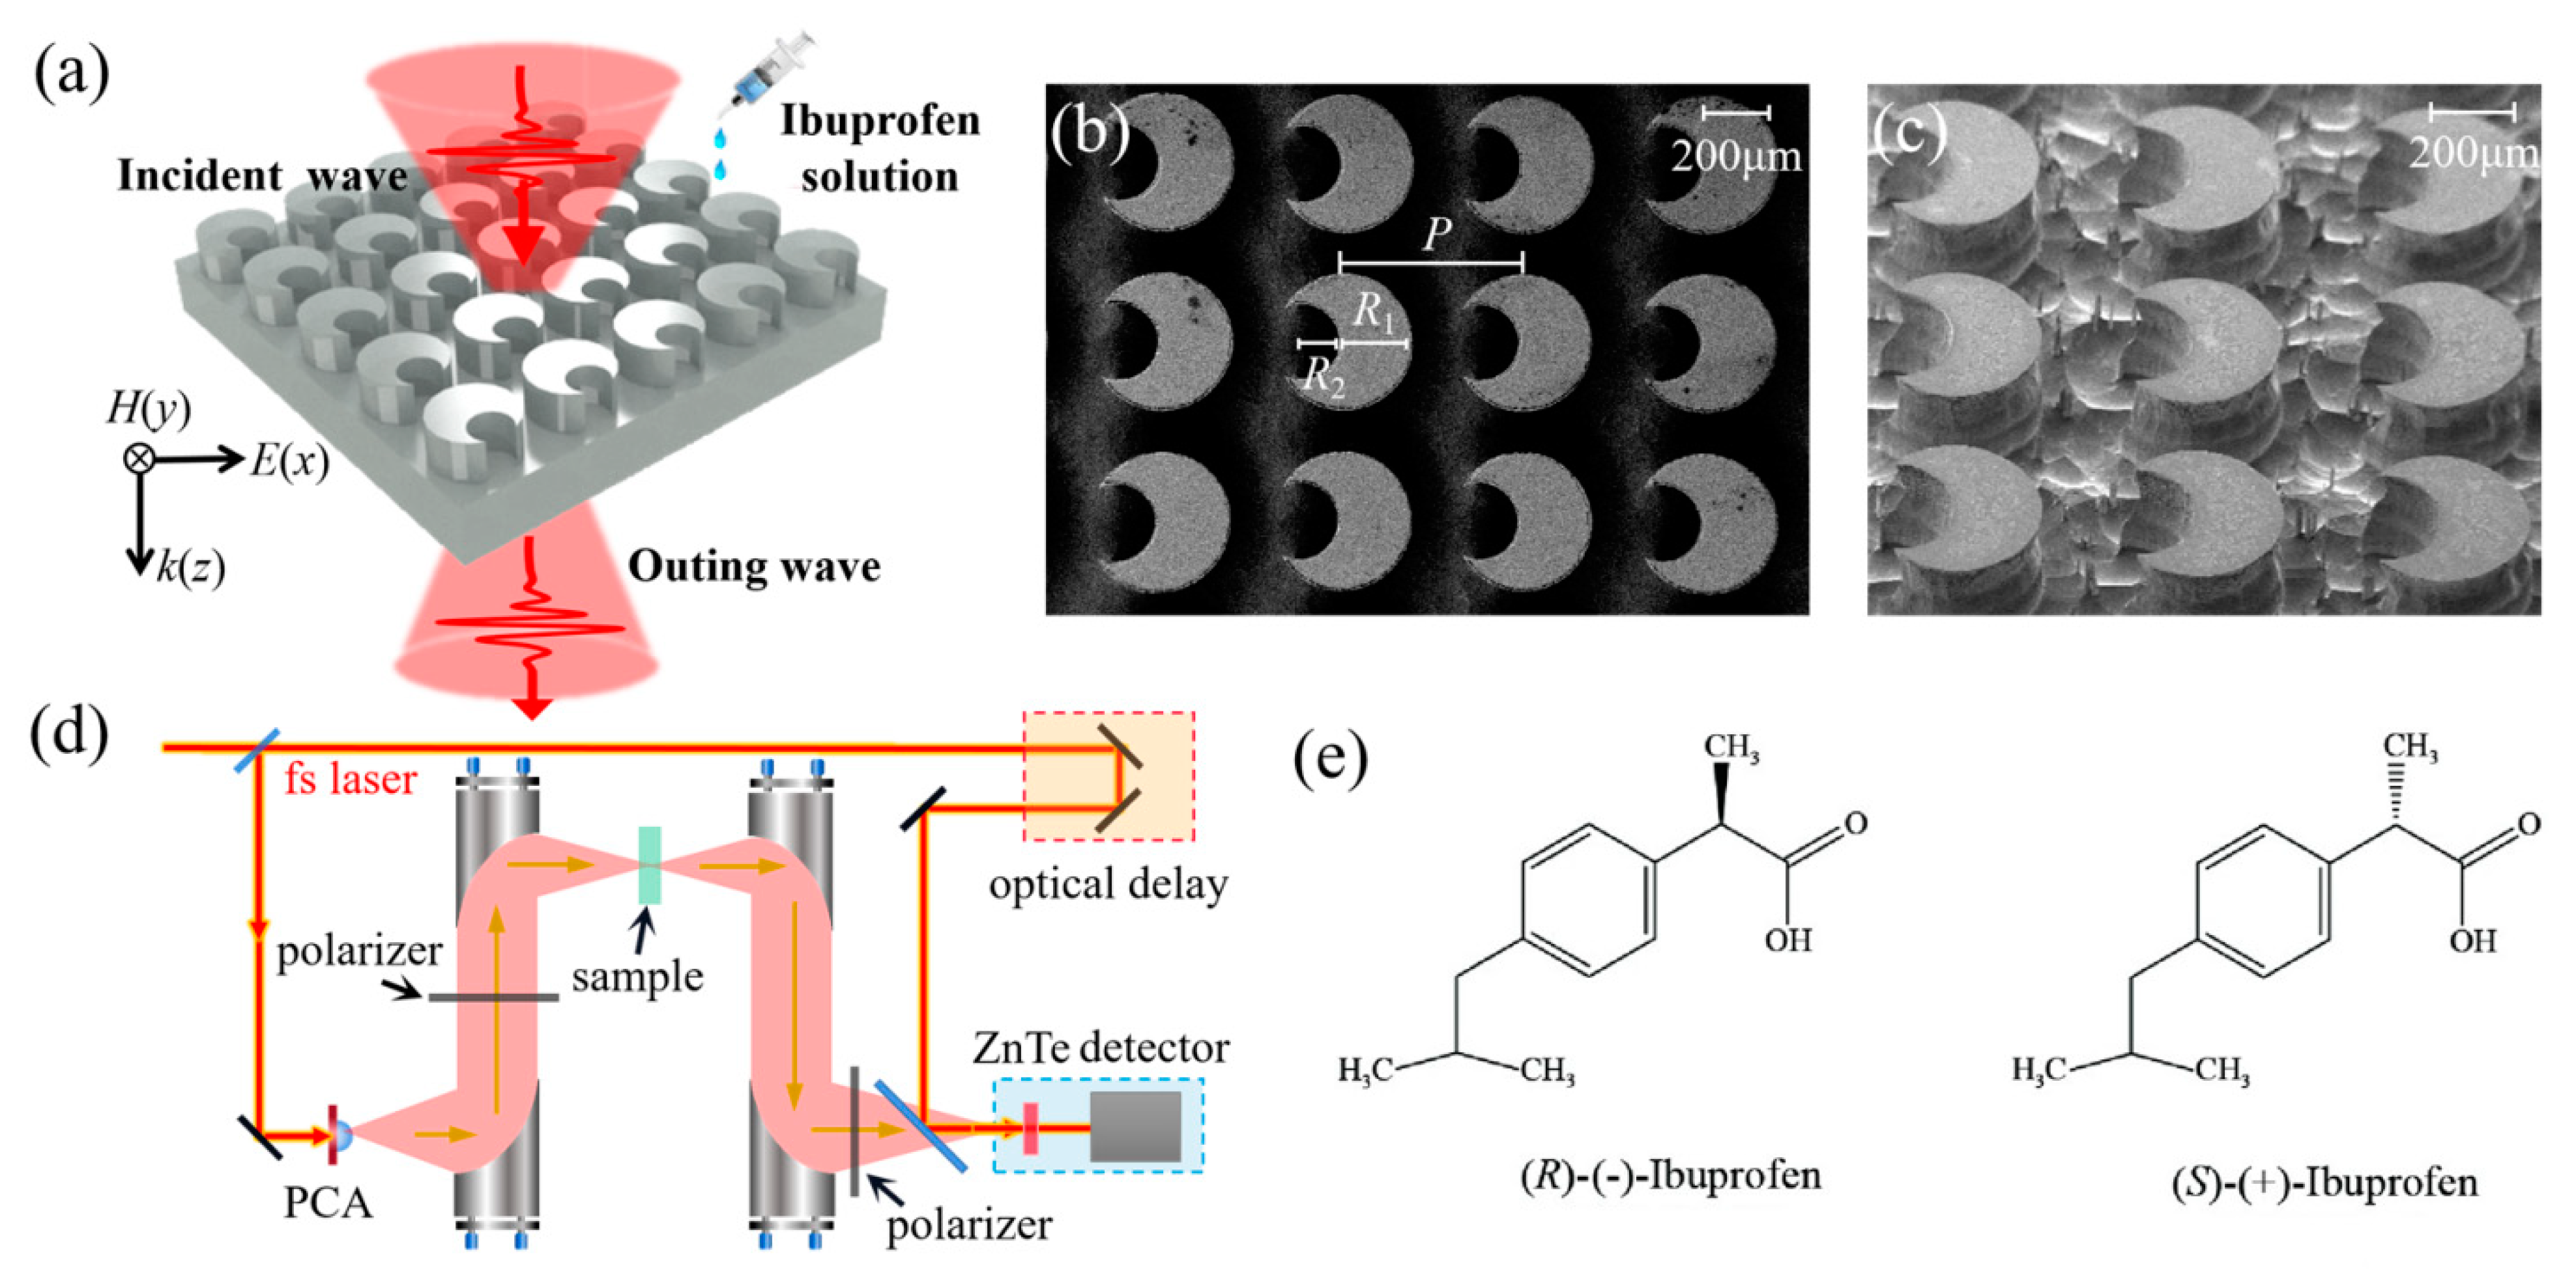
2.1. Structural Layout and Device Fabrication

The asymmetric all-dielectric metasurface structure was designed as shown in Figure 1a. Through the processes of masking, photolithography, and reactive ion beam etching on a high resistance silicon wafer, a deep etching relief pattern with a height of H = 230 μm was obtained. This metasurface consisted of a periodic array of crescent cylinders with the period of unit cell P = 450 μm. Each crescent cylinder was produced in the following way. A cylinder with a radius of R1 = 200 μm was etched away by a cylinder with a radius of R2 = 100 μm at a distance of 120 μm from the center of the larger cylinder. The SEM images of the device are presented in Figure 1b,c. The remaining substrate was silicon with a thickness of d = 270 μm.

2.2. Numerical Simulation for the Sensor

The optical response of the designed metasurface sensor was numerically investigated by time-domain simulations, which were performed by commercial CST Microwave Studio(Computer Simulation Technology AG, Darmstadt, Germany); the permittivity of the silicon was set at ε = 11.8, the x and y directions were chosen to the periodic boundaries, and the open boundaries were set at the z-axis. The linear polarized plane wave was incident into the device. We simulated the transmission spectra of the metasurface filled with simulative materials of different refractive indices. Assuming that the material filled in the grooves of the metasurface, and that the height was 150 μm in addition, the simulative materials were considered to be loss-free.
The simulated transmission spectra of the metasurface filled with materials of different refractive indices n are shown in Figure 2. There are two resonance dips located at different frequencies in the transmission spectra. When the incident wave was y-polarized, the first resonance appeared at around 0.42 THz and the second resonance was located at 1.07 THz. For the x-polarized wave, the resonances were located at 0.42 THz and 1.03 THz, respectively. Besides this, according to the spectral shift in resonances, the sensing performance of the higher frequency resonance was better than the resonance located at a lower frequency. Different sensing performance originated from the diverse electromagnetic modes hidden within the metasurface; thus, it was necessary to determine the electromagnetic properties inside the unit cell.

2.3. Multipole Decomposition Analysis

To explore the electromagnetic properties of this crescent cylinder theoretically and analyze the resonance model inside the unit cell, we employed multipole expansions based on the decomposition of the fields in a single cylinder into Cartesian multipole moments [28,29,30]. By this technique, the multiple contributions to the optical responses can be identified. The detailed analysis process can be found in the Appendix A.
The results of the multipole decomposition in the unit cell for the two incident polarization directions are shown in Figure 3. The surrounding medium was air and the excitation field was propagating along the z-axis. According to the multipole decomposition results, in both directions of polarization, for the first resonance the ED and MD were dominant inside the structure, and the higher-order modes were almost negligible. For the second resonance in the higher frequency, besides the ED and MD modes, the EQ and MQ were strongly induced, so much so that they could not be ignored.
To further investigate the physical mechanism of the sensor, the electric field and magnetic field at two resonances were monitored and are shown in Figure 4 and Figure 5 for two different polarized directions, respectively. For lower-order resonance, as shown in Figure 4a and Figure 5a, the direction of electric field vectors was consistent with the polarization direction of the incident light; it flowed into the structure from one side and flowed out along the geometry of the structure, connected head to tail in the plane without much deflection, which implies that an electric dipole resonant mode was generated at the first resonance. For higher-order resonance, the flow direction of the electric field vectors was not simply along one direction. From Figure 4f and Figure 5f, we found that the direction of the electric field in the middle of the structure was opposite to that around the structure, which resulted in multiple circular electric fields inside the structure, and, thus, electric quadrupole moments were generated. We then analyzed the magnetic field distribution. In Figure 4g for a y-polarization incident wave, a ring-shaped magnetic field formed inside the structure, and it flowed clockwise in the xz plane, which induced a magnetic dipole resonant mode. For an x-polarization incident wave, as shown in Figure 5g, two pairs of ring-shaped magnetic fields were generated above and below the structure and flowed in opposite directions, which also induced a magnetic dipole resonant mode. When the frequency increased to around 1.03 THz, for higher-order resonance, the distribution of magnetic fields became more complex; several ring-shaped magnetic fields were formed inside the structure. They flowed in different directions and were distributed throughout the plane. These ring-shaped magnetic fields interact with each other, and their collective contribution results in the magnetic quadrupole moment.
From the above analysis, we found that high frequency THz waves are more likely to induce higher-order resonance modes inside the unit cell. Moreover, at higher-order resonance, the electric and magnetic field distributions are more sensitive to the change in the dielectric environment surrounding the structure; thus, the sensing performance of the resonance in a higher frequency is better than that of the lower-order resonance.
It is worth mentioning that Wang et al. presented a similar design in the optical frequency range very recently [31], but their result is different from ours. Although the geometry of our structure is similar to that in their work, the physical mechanism of resonance excitation is quite different. Our metasurface can generate higher-order resonance (EQ and MQ modes) and lower-order resonance (ED and MD modes), which have different electric and magnetic field distributions from the bound states in the continuum in Wang’s work, so the two structures show different responses to changes in the surrounding dielectric environment, resulting in opposite directions of frequency shift. For our periodic two-dimensional dielectric structure, the resonances are always excited at the frequencies that satisfy the phase matching condition. The frequency shift with the refractive index of the sensing samples depends on the change in equivalent refractive index, described by the equivalent medium theory. A detailed theoretical analysis can be found in our previous work [10], which showed the same frequency shift trend as this work.

3. Experimental Results and Discussion

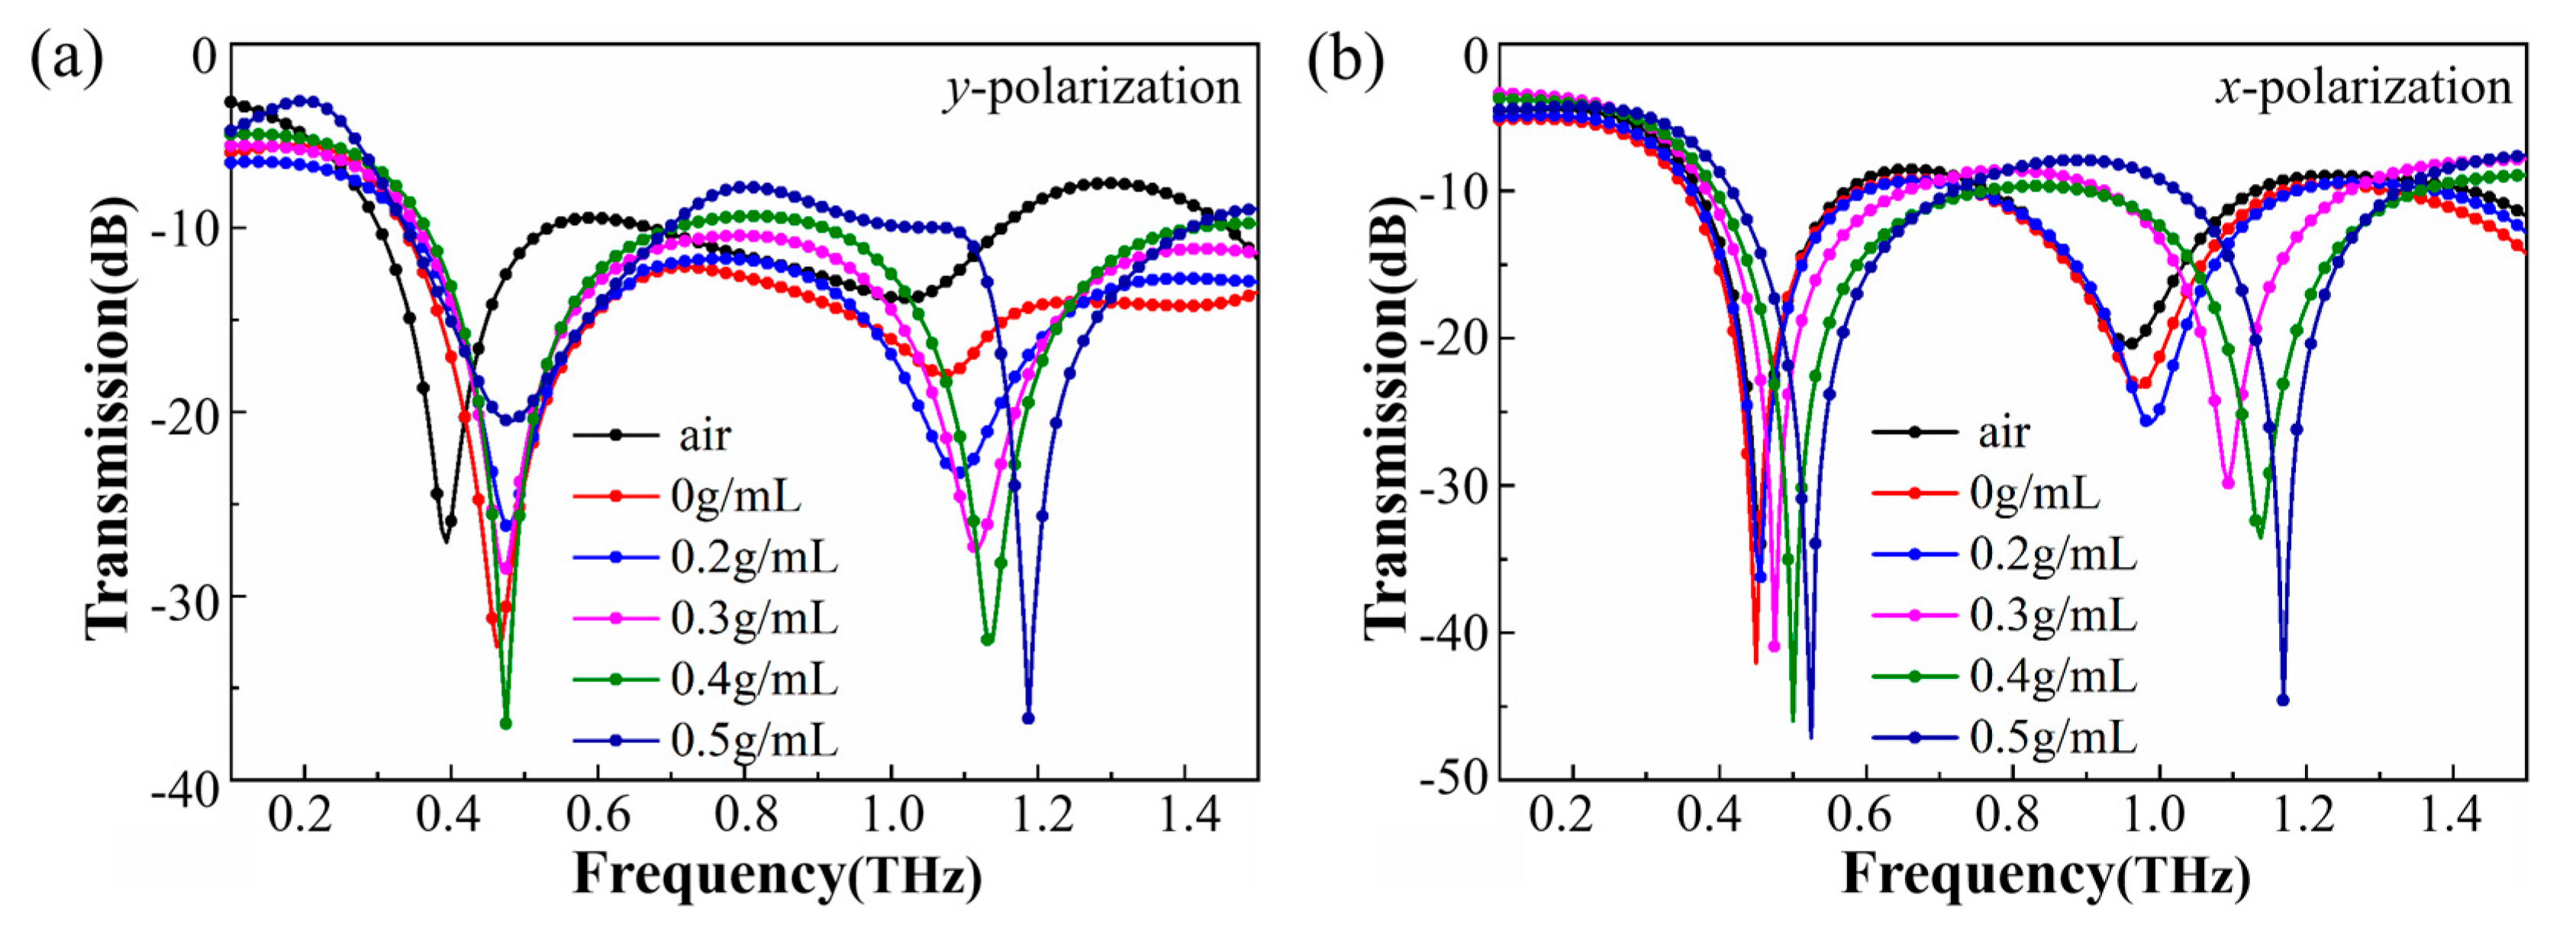
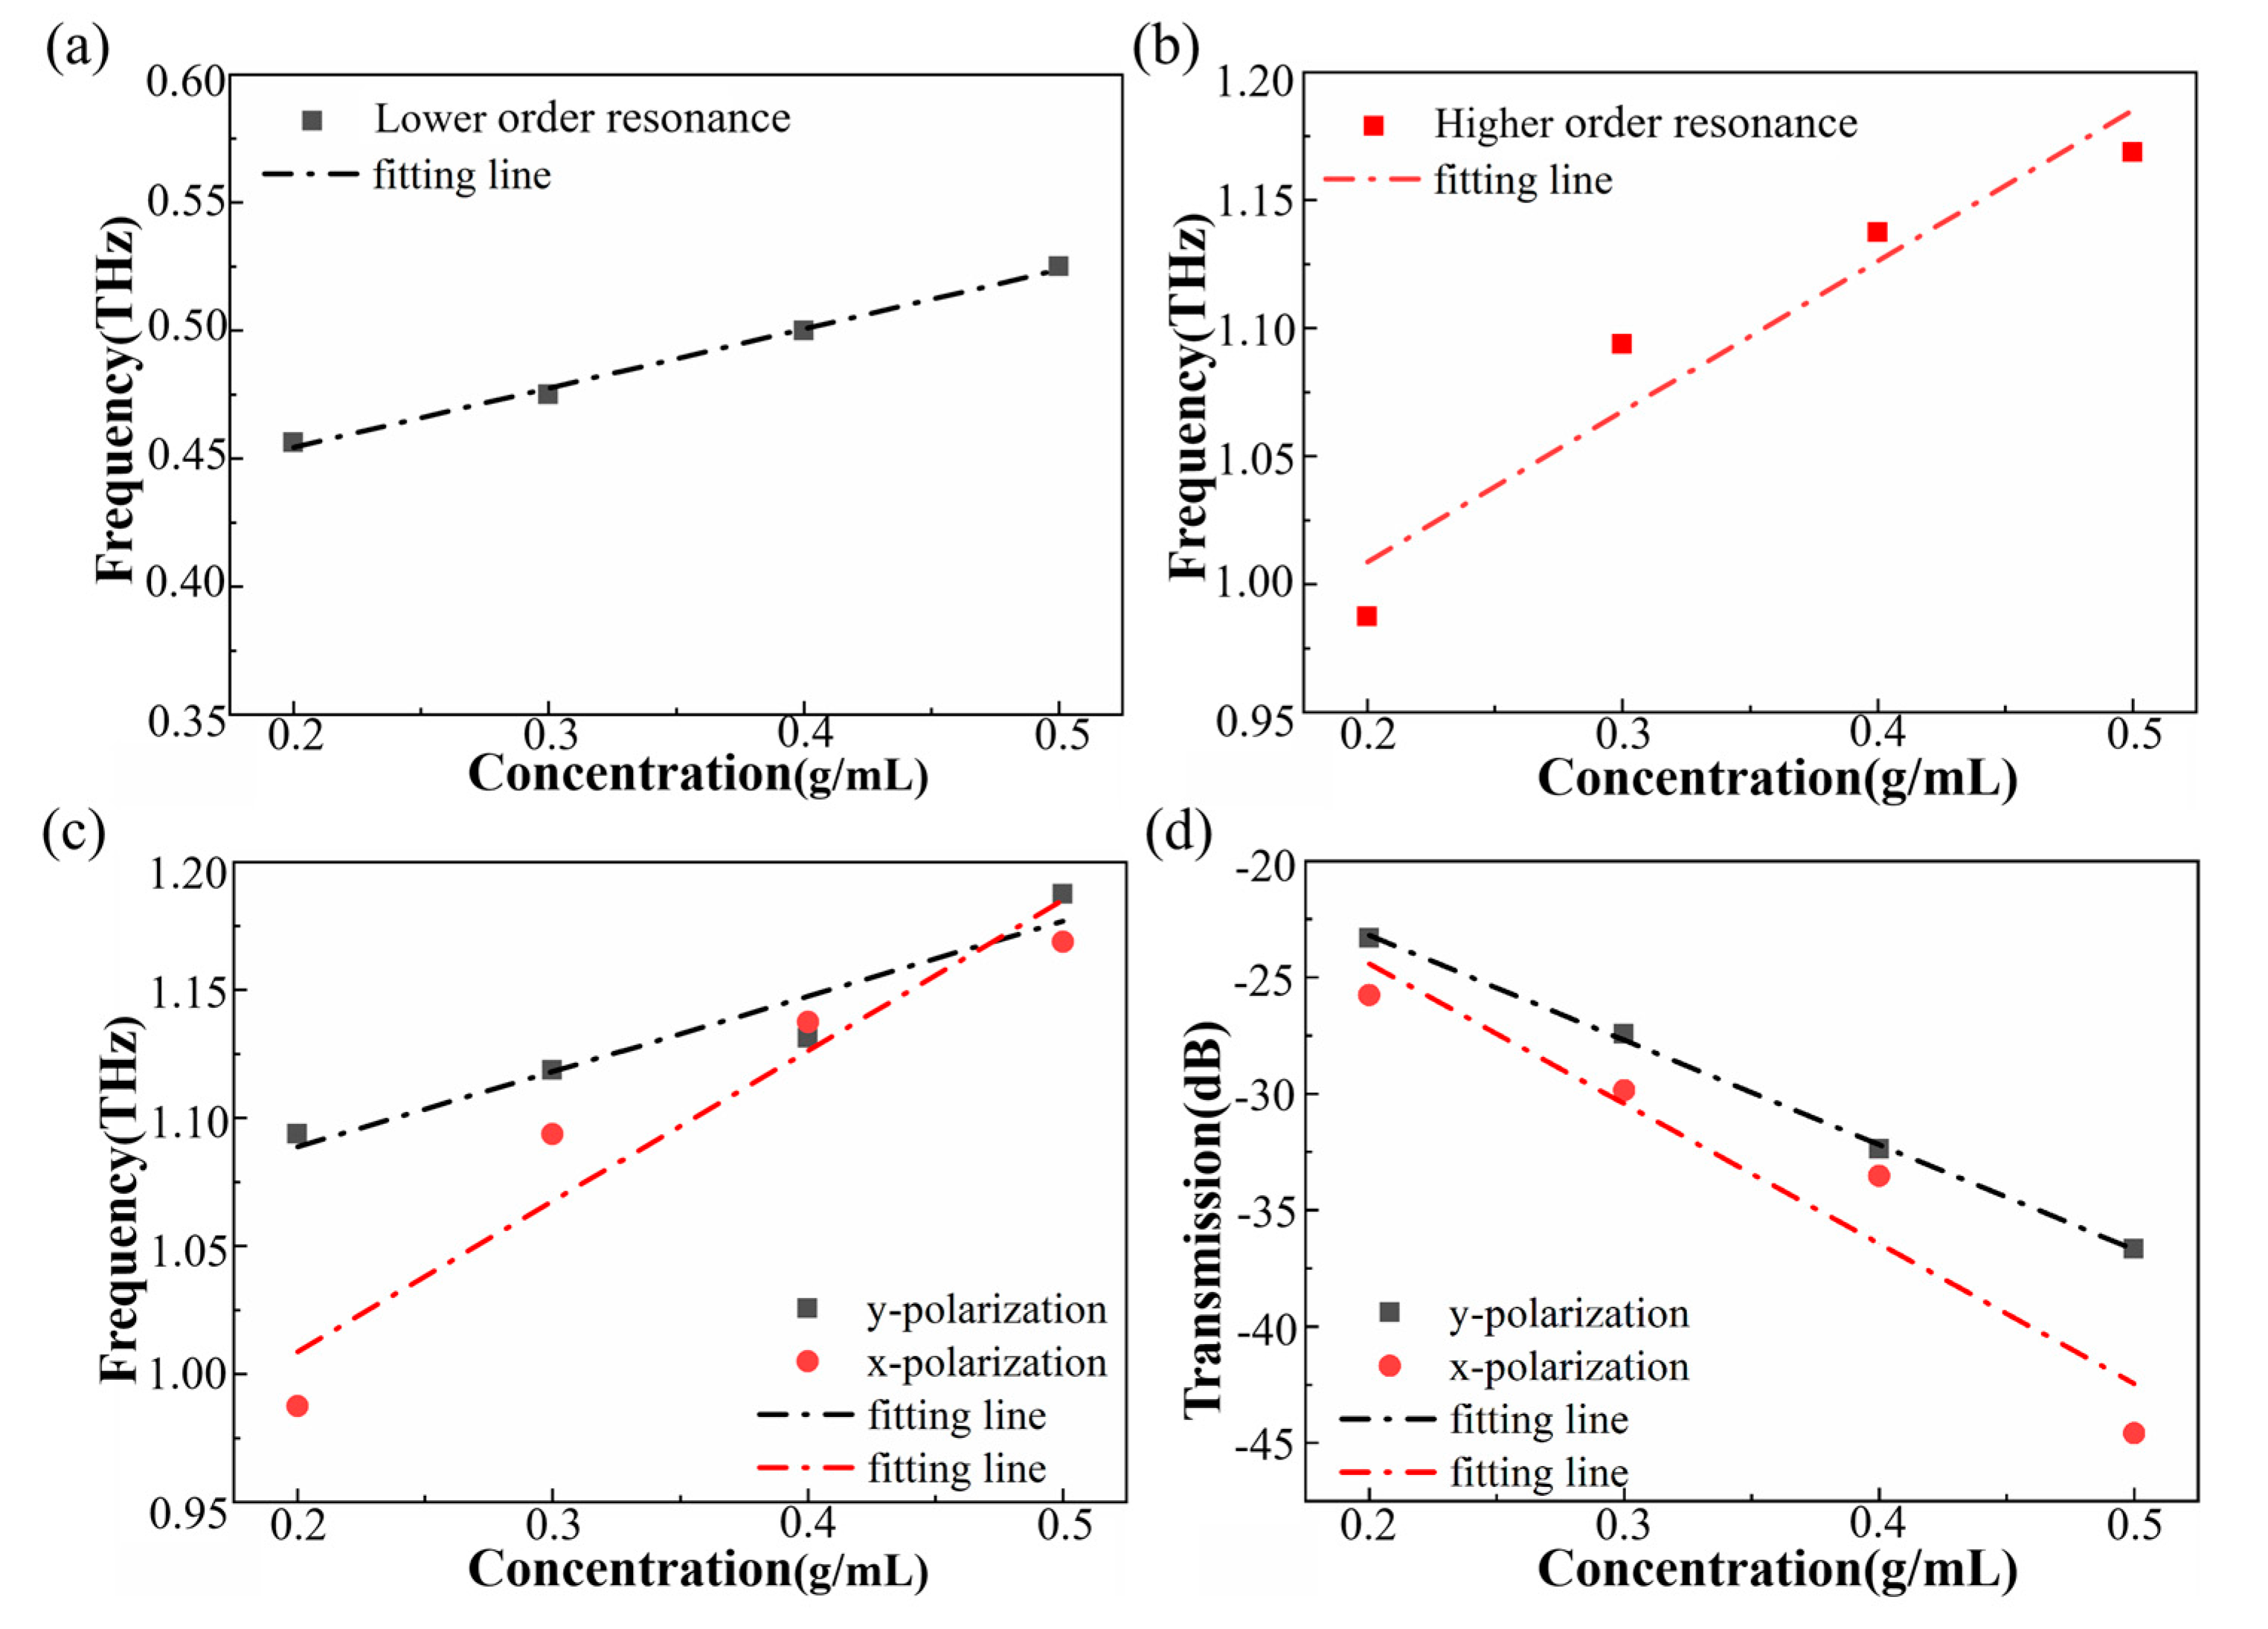
3.1. Ibuprofen Concentration Determination Based on THz Sensing

The real-time THz transmission amplitudes of the metasurface-based sensor with ibuprofen solutions were measured using a self-made THz-TDS setup at room temperature. As shown in Figure 1d, a femtosecond laser with a wavelength of 800 nm is incident on a GaAs photoconductive antenna which emits a linearly polarized THz pulse. The pulse is then focused on the sensor filled with ibuprofen solutions. By varying the time delay between the THz waves and the probe beam, both amplitude and phase information can be measured. Finally, the THz spectrum can be obtained by applying a fast Fourier transform to the time domain spectrum and normalized to the reference. The working frequency range of our system was 0.05–3 THz.
THz sensing of (S)-(+)-ibuprofen (98% purity) was performed through measurements of the transmission change as a function of ibuprofen concentrations ranging from 0.2 to 0.5 g/mL. Avoiding absorption of THz waves is a key point when measuring samples in a liquid environment. For example, Jahn David’s group proposed a special sensor design which overcame an issue of damped resonance caused by material losses in resonance-based sensors [32]. Our work also takes this into account. The influence of absorption on the experiment was greatly reduced. In our experiment, the solvent used to dissolve ibuprofen was a self-made mixed solvent (absolute alcohol:DMSO = 4:1 in volume), to avoid the absorption of THz waves by water. We confirmed that the absorption of THz waves by the mixed solvent was much smaller than that of water. Before the experiment, we prepared four different ibuprofen concentrations of 0.2, 0.3, 0.4, and 0.5 g/mL. Using this hybrid solution allowed us to perform sensing of ibuprofen on trace amounts of samples. However, the ibuprofen solution still absorbed THz waves, especially when the sample volume increased; thus, there were still many difficulties in accurately measuring the optical parameters of the sample in the THz frequency range, such as measuring the thickness of the sample in trace amount by using a THz-TDS system, so we did not obtain the specific optical parameters of the sample (refractive index and absorption).
We then measured the normally incident y-polarized and x-polarized THz transmission spectra of the metasurface with solutions of different concentrations of ibuprofen. Figure 6 shows the experimental results for the two polarization directions. It can be observed that there are some differences between the simulation curve and the experimental curve, because the material filled into the structure was loss-free in the simulation, but the biological sample in the experiment absorbed THz waves. Thus, the transmittance amplitude of the simulation is inconsistent with that of the experiment. The main purpose of our simulation was to compare the sensing performance of the two kinds of resonant modes as well as a general change trend. It can be seen that the simulation results were consistent with the experimental results in terms of frequency shift tendency. From Figure 6, it is evident that with the increase of ibuprofen concentration, the resonance dips moved to a higher frequency (blue shift). In addition, one can note that for both x-polarized and y-polarized incident waves, the frequency shift of the higher-order resonance is greater than that of the lower-order resonance. To further investigate the sensing performance of the device, we plotted frequency shift with change in concentration and the best-fitting line in Figure 7.
According to the experimental results, when the incident wave was x-polarized, with an increase in concentration, for lower-order resonance the resonance dip moved from 0.456 THz up to 0.525 THz when the ibuprofen concentration increased to 0.5 g/mL (Figure 7a). For higher-order resonance, the resonance dip moved from about 0.98 THz up to 1.17 THz in the same case (Figure 7b). The sample volume of each measurement was 10 μL, measured by pipette. Thus, the sensitivity of the different resonance can be calculated by:
Sf = ∆f/∆m,
where ∆m represents the mass of ibuprofen filled onto the metasurface. ∆m = (0.5–0.2) g/mL × 10 μL = 3 mg. The sensitivity of the metasurface is shown in Table 1. Compared with the lower-order resonance, the frequency shift ∆f was improved from 68.75 to 181.25 GHz by higher-order resonance, and the sensitivity of the higher-order resonance was about 2.64 times that of the lower-order resonance.
Figure 7c,d shows the higher-order resonance’s frequency shifts and transmission changes compared between the two different polarization directions. It is worth noting that the sensing performance of the x-polarization was better. The results are shown in Table 2. The Sf for the x-polarization is close to two times that of the y-polarization.

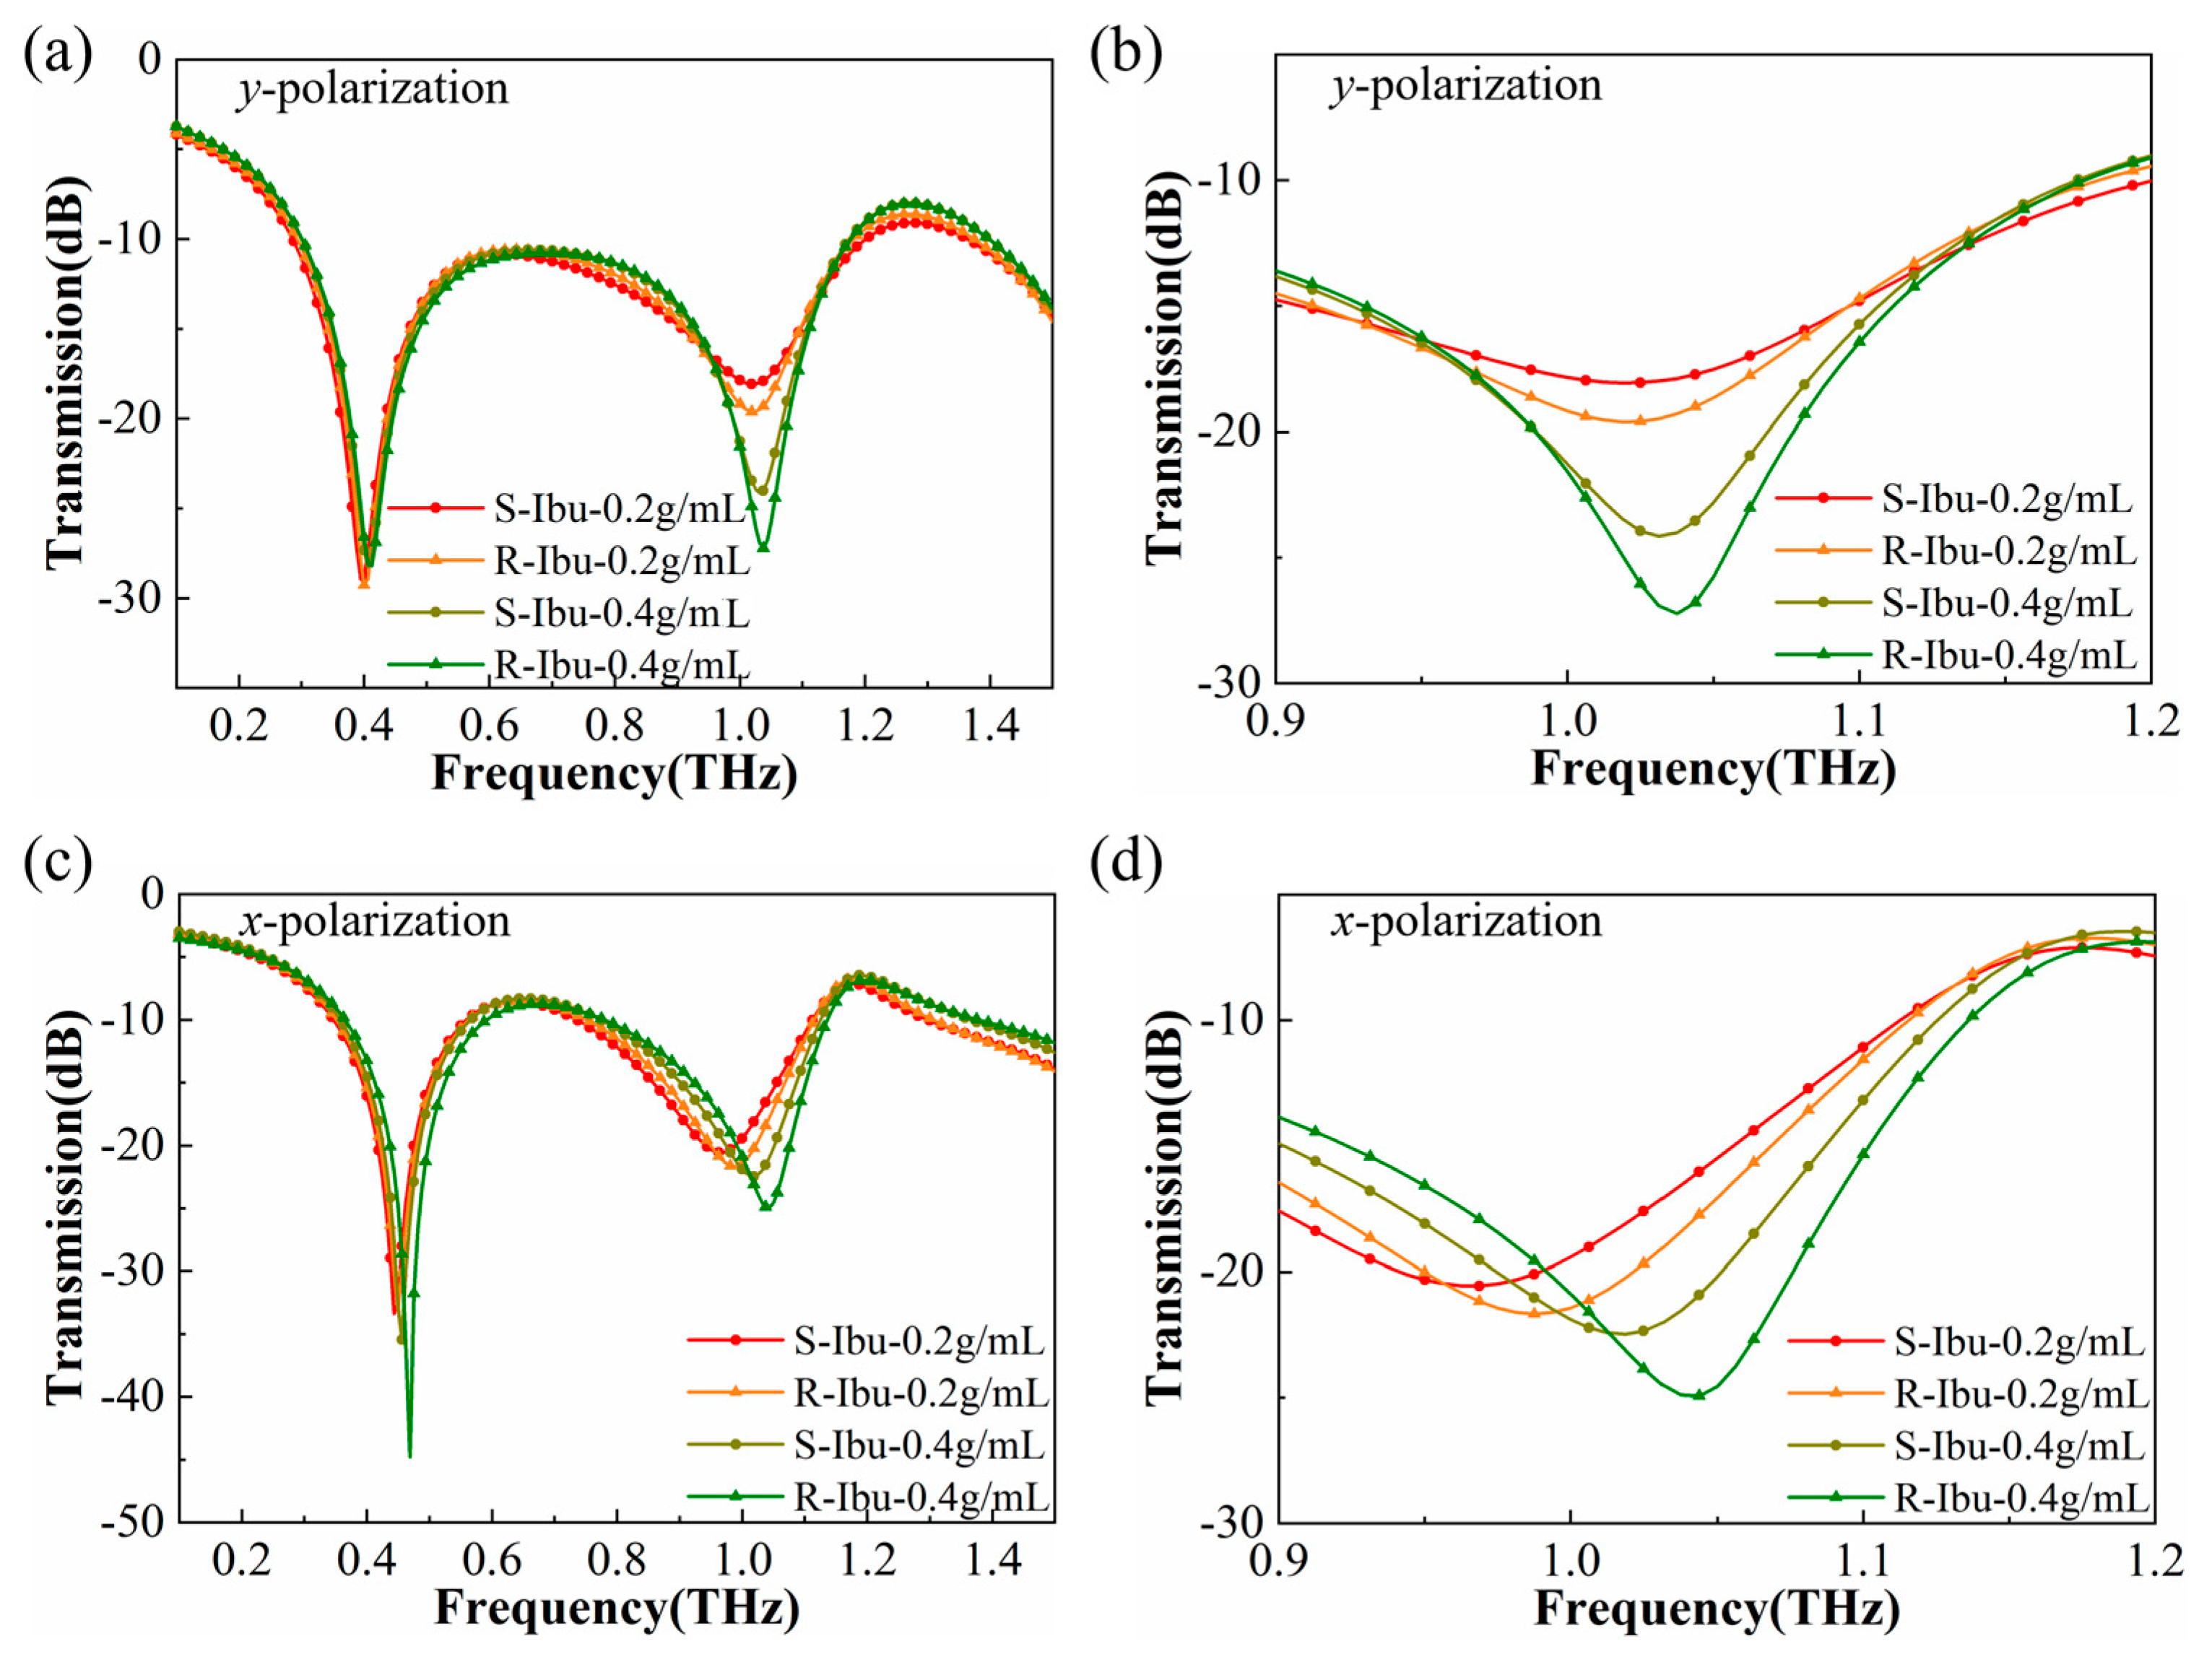
3.2. Chiral Recognition of R/S Chiral Ibuprofen Based on THz Sensing

Next, we performed sensing experiments on (R)-(−)-ibuprofen and (S)-(+)-ibuprofen at the same concentration to study whether higher-order resonance could be applied in the recognition of chiral enantiomers. Although the structure we designed was not a chiral metasurface, from previous experiments we found that the higher-order resonance generated inside the structure had better sensing performance than the lower-order resonance. It was particularly sensitive to different refractive indices and absorption. Different molecular structures of chiral molecules will cause slight differences in response to THz waves, such as in refractive index and absorption. Therefore, higher-order resonance is used to enhance the response of these slight differences. Additionally, to further test the performance of our sensor in the trace amount of the sample, the sample volume of each measurement was only 5 μL in this experiment.
The experimental results are shown in Figure 8, including the cases of two different polarization directions. Figure 8b,d shows detailed information for the higher-order resonance. Although the amount of the sample was reduced, our device still showed good sensing performance. The transmittance magnitude at the higher-order resonance valley gradually decreased with increasing concentrations of both (R)-(−)-ibuprofen and (S)-(+)-ibuprofen. In particular, when the incident THz wave was x-polarized, with the increase in concentration, an obvious blue shift could still be observed. To measure the sensor’s ability to recognize R/S chiral ibuprofen, it is important to calculate the degree of differentiation, which can be expressed as D∆f = ∆f/m, D∆T = ∆T/m, where ∆f = fR-IbufS-Ibu and ∆T = TR-IbuTS-Ibu, with the same concentration; m is the mass of ibuprofen. For the x-polarized wave, R/S chiral ibuprofen could be distinguished not only by frequency shift but also by different transmittance magnitudes. The detailed results are shown in Table 3.
When the incident THz wave was y-polarized, it was difficult to distinguish (R)-(−)-ibuprofen and (S)-(+)-ibuprofen by frequency shift, as shown in Figure 8b. Fortunately, the different transmittance magnitude between the two types of ibuprofen could still help us to recognize them. For example, when the ibuprofen concentration was 0.4 g/mL for (R)-(−)-ibuprofen, the transmittance magnitude reached about −27 dB; in the same case, the transmittance magnitude for (S)-(+)-ibuprofen was around −24 dB, and the degree of differentiation is 1.545 dB/mg in Table 3. According to our experimental results at different concentrations, the transmittance at the higher-order resonance of (S)-(+)-ibuprofen is always higher than that of (R)-(−)-ibuprofen. Therefore, our experiments demonstrated that the slight differences of R/S chiral ibuprofen can be distinguished through THz higher-order resonance in 5 μL trace amounts of samples on this crescent cylinder metasurface sensor.

4. Conclusions

In summary, we demonstrated that the THz crescent cylinder metasurface sensor can be used to detect different concentrations of ibuprofen and recognize R/S chiral ibuprofen. In particular, from our experimental results and simulation analysis, we found that the higher-order resonance (MQ and EQ model) is more sensitive to changes in the dielectric environment compared with the lower-order resonance (ED and MD model). The sensitivity of the higher-order resonance in the ibuprofen concentration experiment was 60.42 GHz/mg, about 2.64 times that of the lower-order resonance. Meanwhile, by utilizing the higher-order resonance not only different concentrations of ibuprofen can be distinguished, but also the slight difference between R/S chiral ibuprofen can be recognized, even in a trace amount of sample, and the maximum differentiation can reach 18.75 GHz/mg when the sample volume is only 5 μL. Therefore, our results confirmed that this THz crescent cylinder metasurface sensor has potential applications in drug concentration detection and identification of enantiomers of chiral drugs with high sensitivity. We believe our approach will contribute to the development of THz biosensors.

Author Contributions

Conceptualization, F.F. and X.W.; methodology, F.F., W.S., and Z.Z.; software, W.S. and T.Z.; validation, F.F. and W.S.; formal analysis, F.F. and W.S.; investigation, W.S. and Z.Z.; resources, F.F.; data curation, W.S.; writing—original draft preparation, W.S.; writing—review and editing, W.S.; visualization, S.L.; supervision, S.C.; project administration, F.F.; funding acquisition, F.F. All authors have read and agreed to the published version of the manuscript.

Funding

This work was supported by the National Natural Science Foundation of China (61971242, 61831012), the National Key Research and Development Program of China (2017YFA0701000), the Natural Science Foundation of Tianjin City (19JCYBJC16600) and the Key Program of the Natural Science Foundation of Tianjin (19JCZDJC32700).

Institutional Review Board Statement

Not applicable.

Informed Consent Statement

Not applicable.

Data Availability Statement

The data presented in this study are available on request from the corresponding author.

Conflicts of Interest

The authors declare no conflict of interest. The funders had no role in the design of the study; in the collection, analyses, or interpretation of data; in the writing of the manuscript; or in the decision to publish the results.

Appendix A

The electric dipole moments (ED) inside the unit cell can be calculated by integrating the induced current J over the whole volume:
P = i ω J d r ,
with
J = i ω ε 0 ( n 2 1 ) E ,
Here, ω denotes the angular frequency, E is the electric field, and ε0 is the vacuum permittivity. Then the magnetic dipolar (MD) moments of the unit cell can be expressed as:
m = 1 2 c ( r × J )   d r ,
where c is the speed of light in a vacuum. The electric and magnetic quadrupole moments (EQ and MQ) can be written as:
Q α β e = 1 j 2 ω [ r α J β + r β J α 2 3 δ α β ( r J ) ]   d r , Q α β m = 1 3 c {   [ r × J ] α r β + [ r × J ] β r α }   d r ,
where δ is the Dirac delta function and the subscripts α, β = x, y, z. Then we can obtain the scattering cross-sections associated with P, MD, EQ, and MQ, which are given by:
C s c a ( e d ) = k b 4 6 π | E 0 | 2 | p | 2 , C s c a ( m d ) = k b 4 μ 0 6 π | E 0 | 2 | m | 2 , C s c a ( e q ) = k b 6 720 π | E 0 | 2 | Q α β e | 2 , C s c a ( m q ) = k b 6 80 π | E 0 | 2 | Q α β m | 2 ,
assuming the electric field amplitude of the incident plane wave is E0 = 1 V/m and the permeability in a vacuum is μ0 = 1.

References

  1. Fournier, P.E.; Drancourt, M.; Colson, P.; Rolain, J.M.; Scola, B.L.; Raoult, D. Modern clinical microbiology: New challenges and solutions. Nat. Rev. Microbiol. 2013, 11, 574–585. [Google Scholar] [CrossRef]
  2. Yang, X.; Yang, K.; Luo, Y.; Fu, W. Terahertz spectroscopy for bacterial detection: Opportunities and challenges. Appl. Microbiol. Biotechnol. 2016, 100, 5289–5299. [Google Scholar] [CrossRef]
  3. Son, J.H. Terahertz Biomedical Science & Technology; CRC Press: Boca Raton, FL, USA, 2014. [Google Scholar]
  4. Fischer, B.; Hoffmann, M.; Helm, H.; Wilk, R.; Rutz, F.; Kleine-Ostmann, T.; Koch, M.; Jepsen, P. Terahertz time-domain spec-troscopy and imaging of artificial RNA. Opt. Express 2005, 13, 5205–5215. [Google Scholar] [CrossRef] [PubMed] [Green Version]
  5. Wu, X.; Ye, X.; Xu, X.; Wang, L. Label-free monitoring of interaction between DNA and oxaliplatin in aqueous solution by terahertz spectroscopy. Appl. Phys. Lett. 2012, 101, 33704. [Google Scholar] [CrossRef]
  6. Yan, X.; Yang, M.; Zhang, Z.; Liang, L.; Wei, D.; Wang, M.; Zhang, M.; Wang, T.; Liu, L.; Xie, J.; et al. The terahertz electromagnetically induced transparency-like metamaterials for sensitive biosensors in the detection of cancer cells. Biosens. Bioelectron. 2019, 126, 485–492. [Google Scholar] [CrossRef]
  7. Xie, L.; Gao, W.; Shu, J.; Ying, Y.; Kono, J. Extraordinary sensitivity enhancement by metasurfaces in terahertz detection of antibiotics. Sci. Rep. 2015, 5, 8671. [Google Scholar] [CrossRef]
  8. Beruete, M.; Jáuregui-López, I. Terahertz Sensing Based on Metasurfaces. Adv. Opt. Mater. 2020, 8, 1900721. [Google Scholar] [CrossRef] [Green Version]
  9. Fan, F.; Gu, W.H.; Wang, X.H.; Chang, S.J. Real-time quantitative terahertz microfluidic sensing based on photonic crys-tal pillar array. Appl. Phys. Lett. 2013, 102, 121113. [Google Scholar] [CrossRef]
  10. Fan, F.; Chen, S.; Wang, X.-H.; Wu, P.-F.; Chang, S.-J. Terahertz Refractive Index Sensing Based on Photonic Column Array. IEEE Photon Technol. Lett. 2014, 27, 478–481. [Google Scholar] [CrossRef]
  11. Tao, H.; Kadlec, E.A.; Strikwerda, A.; Fan, K.; Padilla, W.J.; Averitt, R.D.; Shaner, E.A.; Zhang, X. Microwave and terahertz wave sensing with metamaterials. Opt. Express 2011, 19, 21620–21626. [Google Scholar] [CrossRef]
  12. Park, S.J.; Son, B.H.; Choi, S.J.; Kim, H.S.; Ahn, Y.H. Sensitive detection of yeast using terahertz slot antennas. Opt. Express 2014, 22, 30467–30472. [Google Scholar] [CrossRef]
  13. Cong, L.Q.; Tan, S.Y.; Yahiaoui, R.; Yan, F.P.; Zhang, W.L.; Singh, R. Experimental demonstration of ultrasensitive sensing with terahertz metamaterial absorbers: A comparison with the metasurfaces. Appl. Phys. Lett. 2015, 106, 031107. [Google Scholar] [CrossRef]
  14. Wang, Y.; Han, Z.; Du, Y.; Qin, J. Ultrasensitive terahertz sensing with high-Q toroidal dipole resonance governed by bound states in the continuum in all-dielectric metasurface. Nanophotonics 2021, 10, 1295–1307. [Google Scholar] [CrossRef]
  15. Lee, B.; Lee, I.-M.; Kim, S.; Oh, D.-H.; Hesselink, L. Review on subwavelength confinement of light with plasmonics. J. Mod. Opt. 2010, 57, 1479–1497. [Google Scholar] [CrossRef]
  16. Kang, J.H.; Kim, D.S.; Park, Q.-H. Local Capacitor Model for Plasmonic Electric Field Enhancement. Phys. Rev. Lett. 2009, 102, 093906. [Google Scholar] [CrossRef]
  17. Chen, H.T.; Lu, H.; Azad, A.K.; Averitt, R.D.; Gossard, A.C.; Trugman, S.A.; O’Hara, J.F.; Taylor, A.J. Electronic control of extraordinary terahertz transmission through subwavelength metal hole arrays. Opt. Express 2008, 16, 7641–7648. [Google Scholar] [CrossRef] [PubMed] [Green Version]
  18. Cheng, D.; He, X.; Huang, X.L.; Zhang, B.; Liu, G.; Shu, G.; Fang, C.; Wang, J.; Luo, Y. Terahertz biosensing metamaterial absorber for virus detectionbased on spoof surface plasmon polaritons. Int. J. RF Microw. Comput. Aided Eng. 2018, 28, e21448. [Google Scholar] [CrossRef]
  19. Zhang, R.; Chen, Q.; Liu, K.; Chen, Z.; Li, K.; Zhang, X.; Xu, J.; Pickwell-MacPherson, E. Terahertz Microfluidic Metamaterial Biosensor for Sensitive Detection of Small-Volume Liquid Samples. IEEE Trans. Terahertz Sci. Technol. 2019, 9, 209–214. [Google Scholar] [CrossRef]
  20. Hare, P.; Gil-Av, E. Separation of D and L amino acids by liquid chromatography: Use of chiral eluants. Science 1979, 204, 1226–1228. [Google Scholar] [CrossRef] [PubMed]
  21. Glavin, D.P.; Burton, A.S.; Elsila, J.E.; Aponte, J.C.; Dworkin, J.P. The Search for Chiral Asymmetry as a Potential Biosignature in our Solar System. Chem. Rev. 2019, 120, 4660–4689. [Google Scholar] [CrossRef] [Green Version]
  22. Wnendt, S.; Zwingenberger, K. Thalidomide’s chirality. Nat. Cell Biol. 1997, 385, 303–304. [Google Scholar] [CrossRef]
  23. Tao, W.A.; Gozzo, F.C.; Cooks, R.G. Mass Spectrometric Quantitation of Chiral Drugs by the Kinetic Method. Anal. Chem. 2001, 73, 1692–1698. [Google Scholar] [CrossRef] [PubMed]
  24. Kasprzyk-Hordern, B. Pharmacologically active compounds in the environment and their chirality. Chem. Soc. Rev. 2010, 39, 4466–4503. [Google Scholar] [CrossRef] [PubMed] [Green Version]
  25. Asgari, S.; Granpayeh, N.; Fabritius, T. Controllable terahertz cross-shaped three-dimensional graphene intrinsically chiral metastructure and its biosensing application. Opt. Commun. 2020, 474, 126080. [Google Scholar] [CrossRef]
  26. Zhang, Z.Y.; Zhong, C.Z.; Fan, F.; Liu, G.H.; Chang, S.J. Terahertz polarization and chirality sensing for amino acid solution based on chiral metasurface sensor. Sens. Actuators B Chem. 2021, 330, 129315. [Google Scholar] [CrossRef]
  27. Zhou, R.Y.; Wang, C.; Huang, Y.X.; Huang, K.; Wang, Y.; Xu, W.; Xie, L.; Ying, Y. Label-free terahertz microfluidic biosensor for sensitive DNA detec-tion using graphene-metasurface hybrid structures. Biosens. Bioelectron. 2021, 188, 113336. [Google Scholar] [CrossRef]
  28. Evlyukhin, A.B.; Fischer, T.; Reinhardt, C.; Chichkov, B.N. Optical theorem and multipole scattering of light by arbitrarily shaped nanoparticles. Phys. Rev. B 2016, 94, 205434. [Google Scholar] [CrossRef]
  29. Radescu, E.E.; Vaman, G. Exact calculation of the angular momentum loss, recoil force, and radiation intensity for an arbitrary source in terms of electric, magnetic, and toroid multipoles. Phys. Rev. E 2002, 65, 046609. [Google Scholar] [CrossRef]
  30. Grahn, P.; Shevchenko, A.; Kaivola, M. Electromagnetic multipole theory for optical nanomaterials. New J. Phys. 2012, 14, 093033. [Google Scholar] [CrossRef]
  31. Wang, J.; Kühne, J.; Karamanos, T.; Rockstuhl, C.; Maier, S.A.; Tittl, A. All-Dielectric Crescent Metasurface Sensor Driven by Bound States in the Continuum. Adv. Funct. Mater. 2021, 2104652. [Google Scholar] [CrossRef]
  32. Jahn, D.; Soltani, A.; Balzer, J.C.; Withayachumnankul, W.; Koch, M. Fabry-Pérot interferometer for sensing polar liquids at terahertz frequencies. J. Appl. Phys. 2017, 121, 204502. [Google Scholar] [CrossRef]
Figure 1. Schematic diagram of device structure and experimental device. (a) A schematic representation of the THz metasurface sensing experiment. SEM images of the structure: (b) top view and (c) side view. (d) A schematic representation of the THz-TDS system. PCA: photoconductive antenna. (e) The molecular structure of R/S chiral ibuprofen.
Applsci 11 08892 g001
Figure 2. Simulation transmission spectra of the bare device (black line) and filled with the different refractive index materials by CST simulation. The polarization direction of the incident waves was along the y-axis (a) and x-axis (b).
Applsci 11 08892 g002
Figure 3. The scattering spectra of multipole decomposition for the unit cell of the metasurface: y-polarized wave in (a) the lower THz frequency range and (b) the higher THz frequency range; x-polarized wave in (c) the lower THz frequency range and (d) the higher THz frequency range. The positions of the resonances are indicated by the dotted lines in the figures.
Applsci 11 08892 g003
Figure 4. The monitored electric field and magnetic field inside the unit cell in the case of the y-polarization incident wave. (a,b) ED and EQ mode plotted in the x–y plane. (c,d) MD and MQ mode plotted in the x–z plane. (eh) The corresponding electric (magnetic) field vectors at the resonant frequency.
Applsci 11 08892 g004
Figure 5. The monitored electric field and magnetic field inside the unit cell in the case of the x-polarization incident wave. (a,b) ED and EQ modes plotted in the x–y plane. (c,d) MD and MQ modes plotted in the y–z plane. (eh) The corresponding electric (magnetic) field vectors of the resonance.
Applsci 11 08892 g005
Figure 6. Experimental transmission spectra of the metasurface filled with ibuprofen in different concentrations for (a) the y-polarized incidence and (b) the x-polarized incidence. The experimental transmission of the bare metasurface is also included as a reference.
Applsci 11 08892 g006
Figure 7. Resonant frequency shift and transmittance magnitude as a function of concentration. The frequency shifts of (a) the lower-order resonance and (b) the higher-order resonance with increasing concentration for the x-polarized input THz wave. (c) Frequency shifts and (d) transmission changes (higher-order resonance) for different polarization directions. Dotted lines are linear fits to the data.
Applsci 11 08892 g007
Figure 8. Transmitted THz spectra of the R/S chiral ibuprofen at different concentrations. (a) Transmitted spectra for y-polarized incident THz wave and (b) for the details. (c) Transmitted amplitude for x-polarized incident THz wave and (d) for the details.
Applsci 11 08892 g008
Table 1. The sensitivity of the higher-order and lower-order resonance.
Resonancem (mg)f (GHz)T (dB)Sf (GHz/mg)ST (dB/mg)
Higher-order3181.2518.8160.426.27
Lower-order368.75-22.92-
Table 2. The calculated sensitivity of the higher-order resonance with respect to different polarization directions.
Polarizationm (mg)f (GHz)T (dB)Sf (GHz/mg)ST (dB/mg)
x-polarization3181.2518.8160.426.27
y-polarization393.7518.731.256.23
Table 3. The calculated degree of differentiation of the R/S chiral ibuprofen by higher-order resonance for different concentrations.
PolarizationConcentrationsm (mg)f (GHz)T (dB)Df (GHz/mg)DT (dB/mg)
x-polarization0.2 g/mL118.751.1118.751.11
0.4 g/mL2252.4712.51.235
y-polarization0.2 g/mL1-1.55-1.55
0.4 g/mL2-3.09-1.545
Publisher’s Note: MDPI stays neutral with regard to jurisdictional claims in published maps and institutional affiliations.

