Article

Analysis of the Water Quality Improvement in Urban Stream Using MIKE 21 FM

Department of Civil & Environmental Engineering, Incheon National University, Incheon 22012, Korea
Appl. Sci. 2021, 11(19), 8890; https://doi.org/10.3390/app11198890
Submission received: 20 August 2021 / Revised: 18 September 2021 / Accepted: 21 September 2021 / Published: 24 September 2021

Abstract

:

Featured Application

Water resource and environmental engineering.

Abstract

Domestic urban streams face insufficient base flow and consequently become dry streams in drought season, and vulnerable to water quality deterioration and ecological impairment, due to contaminants introduced from the urban pollutants. Many efforts are being made to improve the natural flow by actively enforcing restoration projects of urban streams. Gulpocheon is a national stream flowing through Incheon-si and Gimpo-si. As of March 2019, the reclaimed wastewater or the ozone-processed Gulpo treated sewage has formed the upper part of Gulpocheon. This study aimed to analyze the improvement in water quality of Gulpocheon before and after supplying the reclaimed water by collecting the water quality data of the target area. Before and after providing the base flow, the water quality was analyzed using the two-dimensional numerical analysis model, i.e., MIKE 21 FM. The water quality one year before and after supplying the reclaimed water was compared, with a focus on DO, BOD, TN, and TP; they are used as water quality standards for stream water. The concentration of DO at all spots of Gulpocheon increased on average. The concentration of BOD, TN, and TP water quality parameters decreased, indicating water quality improvement. In addition, accurate water quality assessment is possible using MIKE 21 FM model simulation for urban stream analysis.

1. Introduction

The annual precipitation in South Korea is concentrated in the summer season. The river flow is extremely low from December to February, resulting in water quality deterioration, water deficit, and water distribution imbalance across different regions [1,2]. Moreover, water quality deterioration and other problems exist because wastewater, sewage, and domestic sewage are discharged to urban streams without treatment. Furthermore, the base flow is insufficient in urban streams due to the lowered underground water level and reduced streamflow due to the development and supply of agricultural water.
There are 369 urban streams in South Korea, and 36.3% (134 streams) are expected to undergo stream depletion [3]. Therefore, there is an increasing need for proper management and practical usage of limited water resources. The immediate solution is securing sufficient flow. Regarding the base flow of the domestic urban stream, there was some research that compared the effect of eluted underground water, sewage treatment-reclaimed wastewater, and reservoir discharge water [4].
As in the previous study, it is necessary to discuss the supply of various inflow water in order to secure the flow rate of the river. In particular, when water does not flow in a river during a drought, it has a great impact on the ecosystem, so it is most important to establish a plan for securing water for maintenance. Various studies utilized the sewage treatment-reclaimed wastewater as base flow within the urban stream [5,6,7]. There have been some published reports on the use of sand filter, ozone treatment, flocculation, precipitation, active-carbon adsorption, and membrane filtration process [8,9,10]. In particular, the ozone oxidation process is widely used for purposes other than disinfection in water treatment. It has a bleaching and deodorization effect, oxidizes organic and inorganic matters, and improves biodegradation [11,12,13,14].
Internationally, research on methodology and water quality analysis are conducted in relation to the application of reclaimed water to urban rivers [15,16,17]. It is necessary to quantitatively evaluate before and after the supply of reclaimed water using a numerical model, and this study can be used as analysis data on the effect of urban reclaimed water. For water quality improvement and maintenance in urban rivers, the exact effect of reclaimed water application should be identified. Additionally, it needs to be verified through the evaluation of observation data and numerical analysis models in parallel.
In this study, water quality improvement was quantitatively analyzed when the reclaimed water was supplied to the actual stream as base flow. Gulpocheon, where sewage treatment discharged water was processed with ozone treatment, was selected as a target stream for this study. The domestic stream’s water quality standards (Ministry of Environment) were established to protect the aquatic ecosystem from water pollution and preserve the water quality suitable for water use. In this study, numerical simulations were conducted to analyze the water quality factors (e.g., dissolved oxygen (DO), biochemical oxygen demand (BOD), total-nitrogen (TN), and total-phosphorus (TP)) that influence stream water quality standards for Gulpocheon. The treated sewage water was utilized as the base flow.
In particular, the water quality improvement within Gulpocheon before and after supplying the reclaimed water was quantitatively analyzed using the two-dimensional numerical analysis model, MIKE 21 FM (DHI, https://www.mikepoweredbydhi.com, accessed on 20 August 2021). Reclaimed water is wastewater that has been treated and transformed into a product that is clean, clear, and odorless [18]. The installed ozone-treatment facility at Gulpocheon improves the water quality using chemical process by ozone and its facility uses the sewage water from near city. The reclaimed ozone-treated water was discharged into Gulpocheon for improving the water quality.

2. Theoretical Background

2.1. Overview of Ozone Treatment and Stream Water Quality Factors

2.1.1. Stream Water Quality Factors

Although several factors determine the water quality of the stream, those corresponding to the stream’s habitability include dissolved oxygen (DO), biological oxygen demand (BOD), total phosphorus (TP), and total nitrogen (TN) [2,4,5].
BOD is the biochemical oxygen demand and is an important indicator used in relation to water treatment and river water quality. BOD concentration is also used to judge the water treatment methods and operation efficiency. The decomposition speed of organic matter and consumption speed of oxygen can be estimated by measuring the BOD; high BOD indicates that the organic contamination is high [19,20]. Therefore, the BOD can be used to verify the current status of river water quality and the effect of water quality improvement.
Total nitrogen (TN) is the total amount of nitrogenous compounds included underwater, including organic nitrogen, ammonium nitrogen, and nitrite and nitrate nitrogen. It increases with the artificial inflow of domestic sewage, industrial wastewater, and livestock wastewater; however, it is included in natural water during the nitrogen circulation process of nature and hence not easy to control [20].
Phosphorus is a nutrient important for plant growth. In most lakes, phosphorus is the limiting nutrient, which means that everything that plants and algae need to grow is available in excess (sunlight, warmth, water, nitrogen, etc.) except phosphorus [21]. Phosphorus acts as a limiting substrate of the eutrophication of closed water bodies, such as lakes and swamps, along with nitrogen. A large amount of phosphorus is included in synthetic detergents. A very high phosphorus concentration is found in livestock and agricultural wastewater [22].
In South Korea, the Ministry of Environment mandates the stream water quality standards for protecting the aquatic ecosystem from water pollution and preserving the water quality suitable for use. In the Ministry of Environment standards, the degree of goodness of the water quality is displayed by classifying the water quality factors, such as pH, BOD, TOC, SS, DO, and TP into 1–7 grades [23].

2.1.2. Overview of Ozone Treatment

The ozone treatment purifies waste water via oxidative decomposition reaction. Ozone is an unstable gas composed of three oxygen atoms with higher sterilizing rate. Furthermore, there is no controversy over the dangers of using the remaining materials [24]. It kills germs and viruses by destroying their cell membranes, has a harmful material decomposition function, and does not leave any harmful secondary byproduct other than oxygen.
In addition, it is known to have far-reaching effects, such as color, odor, TPC, chemical oxygen demand (COD) removal, manganese oxidation, and increased dissolved oxygen [24,25]. The ozone treatment facility installed at the Gulpo sewage treatment plant uses the high-efficiency ozone oxidation method [26].

2.2. Introduction of the MIKE 21 FM Model

To effectively analyze the water quality improvement based on the supply of the ozone-treated reclaimed wastewater in Gulpocheon, a numerical analysis model that can accurately simulate the actual flow of the stream and predict the water quality change was used in this study. A two-dimensional model was used to predict fluid flow accurately rather than the existing one-dimensional numerical analysis model typically used in the stream’s hydraulic and water quality analyses.
In more complex river systems, it is likely that a 1D model will deviate too far from reality, whereas a 2D model with horizontal dimensions predominating over vertical dimensions can lead to a more realistic description of the case. The evolution of numerical methods and the development of powerful computational tools, which facilitate the application of more complex approaches, have led to increasing use of 2D hydraulic models [27,28].
The water quality analysis models include QUAL2E, WASP series, EFDC, and MIKE 21 FM. Among these models, the MIKE 21 FM model is universally utilized both in and outside South Korea. Its chief advantage is that it can quickly analyze the hydraulic and water quality of the complicated streamflow under the unsteady flow [29,30,31].
The MIKE 21 FM model is designed such that the hydraulic flow is analyzed using the continuity and momentum equations of the Hydrodynamic Module (HD) [31]. This HD module is the numerical analysis model that performs the water level and flow rate analyses in the stream and coastal areas.
Furthermore, the MIKE 21 ECO Lab module analyzes water quality by connecting with the HD module and simulates various statuses of water quality reaction processes. The water quality model of MIKE 21 calculates simultaneous differential equations, which describe the physical, chemical, and biological interactions related to bacterial survival, oxygen conditions, and excess degree of nutrients, by the Standard Fourth-Order Runge–Kutta method or Euler Linear Integral method.

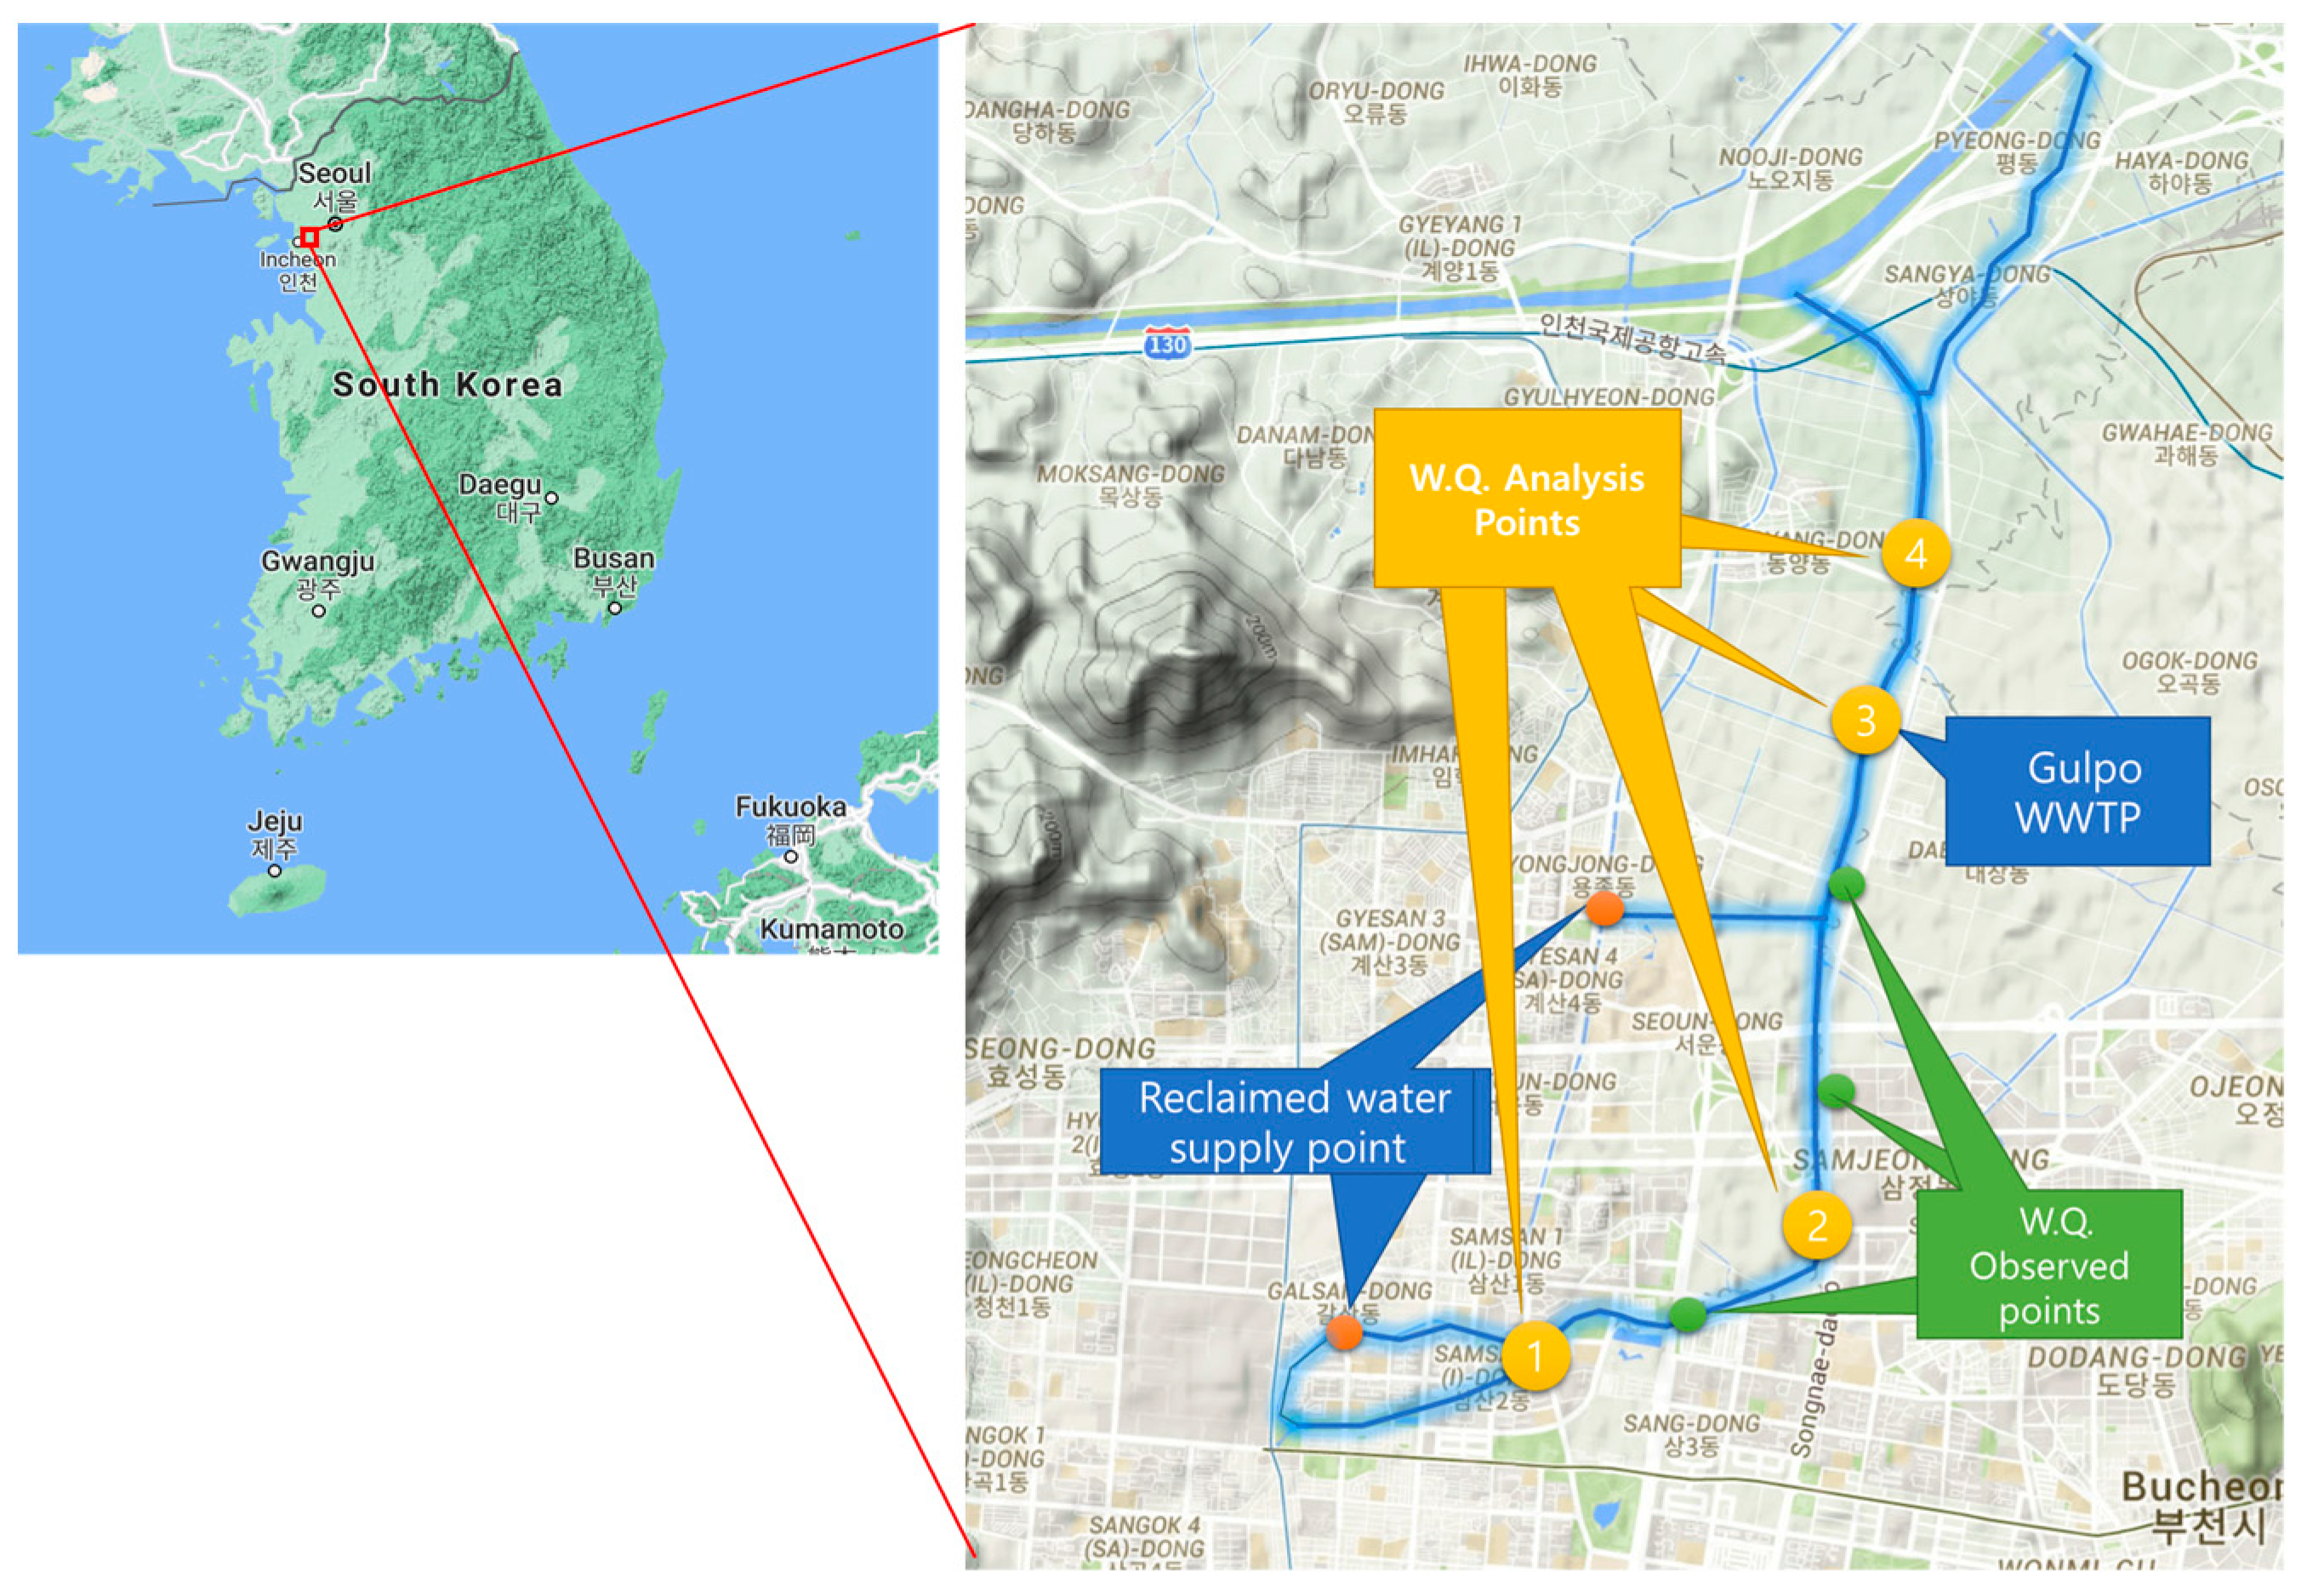
3. Selection and Current Status of the Target Area

3.1. Current Status of the Target Area

Gulpocheon is a stream 20.73 km long, with a basin area of 131.75 km2 with Galsandong, Bupyeonggu, as a starting point and Gimposi, Gyeonggido, as an endpoint. The upstream of Gulpocheon is the typical urban stream that passes through Incheon and Bucheonsi, and agricultural lands are widely distributed downstream [32].
The water quality of Gulpocheon has deteriorated due to the inflow of domestic sewage and industrial wastewater, slow flow, stream covering, inflow pollutants, and structural problems. In particular, small-sized factories near the stream, large-scale industrial complexes established midstream and upstream, and domestic sewage from increasing population are the primary sources of pollution of Gulpocheon. Furthermore, the structural problems of the stream, including straightened channels and slow flow rate, degrade the self-purification capacity of the stream. Hence, the water quality of Gulpocheon remains the lowest in the country [33].
Before the supply of the ozone-treated reclaimed water, Gulpocheon was supplied by Hangang untreated water from the Seoul Pungnap water intake station as the base flow of the upstream. However, although more than 75,000 tons of water needed to be supplied to Gulpocheon daily, only 20,000 tons of water, i.e., less than one-third of the supply plan, was supplied in a day due to the cost issues [34]. In particular, because of the precipitation characteristics of South Korea, the streamflow is extremely low in December to February compared with June to August, and it affected the water quality; thus, a continuous and sufficient supply is required. The ozone treatment facility connected with the sewage treatment plant alongside the supply pipeline connected to the Gulpocheon upstream was completed inside Gulpocheon in March 2019. The flow supply was enabled to utilize the reclaimed water.
The annual concentration of water quality factors was compared to analyze the water quality improvement before and after the supply of the ozone-treated reclaimed water. After collecting the actually measured water quality data, it was applied to the numerical analysis model. The water quality monitoring spots within the target area are presented in Figure 1. There are Cheongcheoncheon and Gyesancheon as tributary streams in Gulpocheon. The water monitoring spots correspond to the upstream and midstream of Gulpocheon.
For analyzing the degree of improvement of the water quality, the stream water quality environmental standard factors [23], i.e., BOD, DO, TN, and TP, were investigated. The correlation between the annual seasonal change and water quality factors was taken into account. Since the ozone treatment facility was completed in March 2019 and operated after that, the water quality of main spots in Gulpocheon 1 year before and after March 2019 was comparatively analyzed. The water quality information from April 2018 to March 2020, provided in the Water Environment Information System [23], was used for the water quality monitoring data. The flow data were additionally collected and utilized for the MIKE 21 FM model building.
As shown in Figure 1, the supply points of the ozone-treated reclaimed water are the upstream and midstream (Gyesancheon) of Gulpocheon, and 30,000–45,000 m3/d and 13,000–20,000 m3/d of flux are provided to the upstream and midstream (Gyesancheon incoming point), respectively, since March 2019. In 2019, 30,000 m3/d of flux was discharged in the Gulpocheon upstream on average, and 15,000 m3/d of flux was discharged in the Gyesancheon (midstream of Gulpocheon). The discharge flow is adjusted by changing the base flow because the stream flux rapidly increases in the summer rainy season. For this reason, the water quality change sometimes rapidly takes place in the summer season.
Figure 2 presents the 2019 supply data of the base flow in the Gulpocheon upstream and Gyesancheon.
Figure 3 shows the flow measurement results after the Gulpocheon upstream and Gyesancheon joining point based on the flow measurement data of the water environment measurement network.
As presented in Figure 3, the flow tends to increase in the summer due to rainfall, and the flow downstream is five times higher than the flow upstream. Moreover, after the supply of the ozone-treated reclaimed water in March 2019, the yearly average flow upstream (Spot 1) was increased from 0.235 m3/s to 0.427 m3/s. The yearly average flow downstream (Spot 3) was increased from 1.469 m3/s to 1.527 m3/s compared with that of the previous year. Before supplying the ozone-treated reclaimed water, rapid flow change was observed due to the rainy season in summer. In contrast, after providing the ozone-treated reclaimed water, the stable flow was secured constantly.

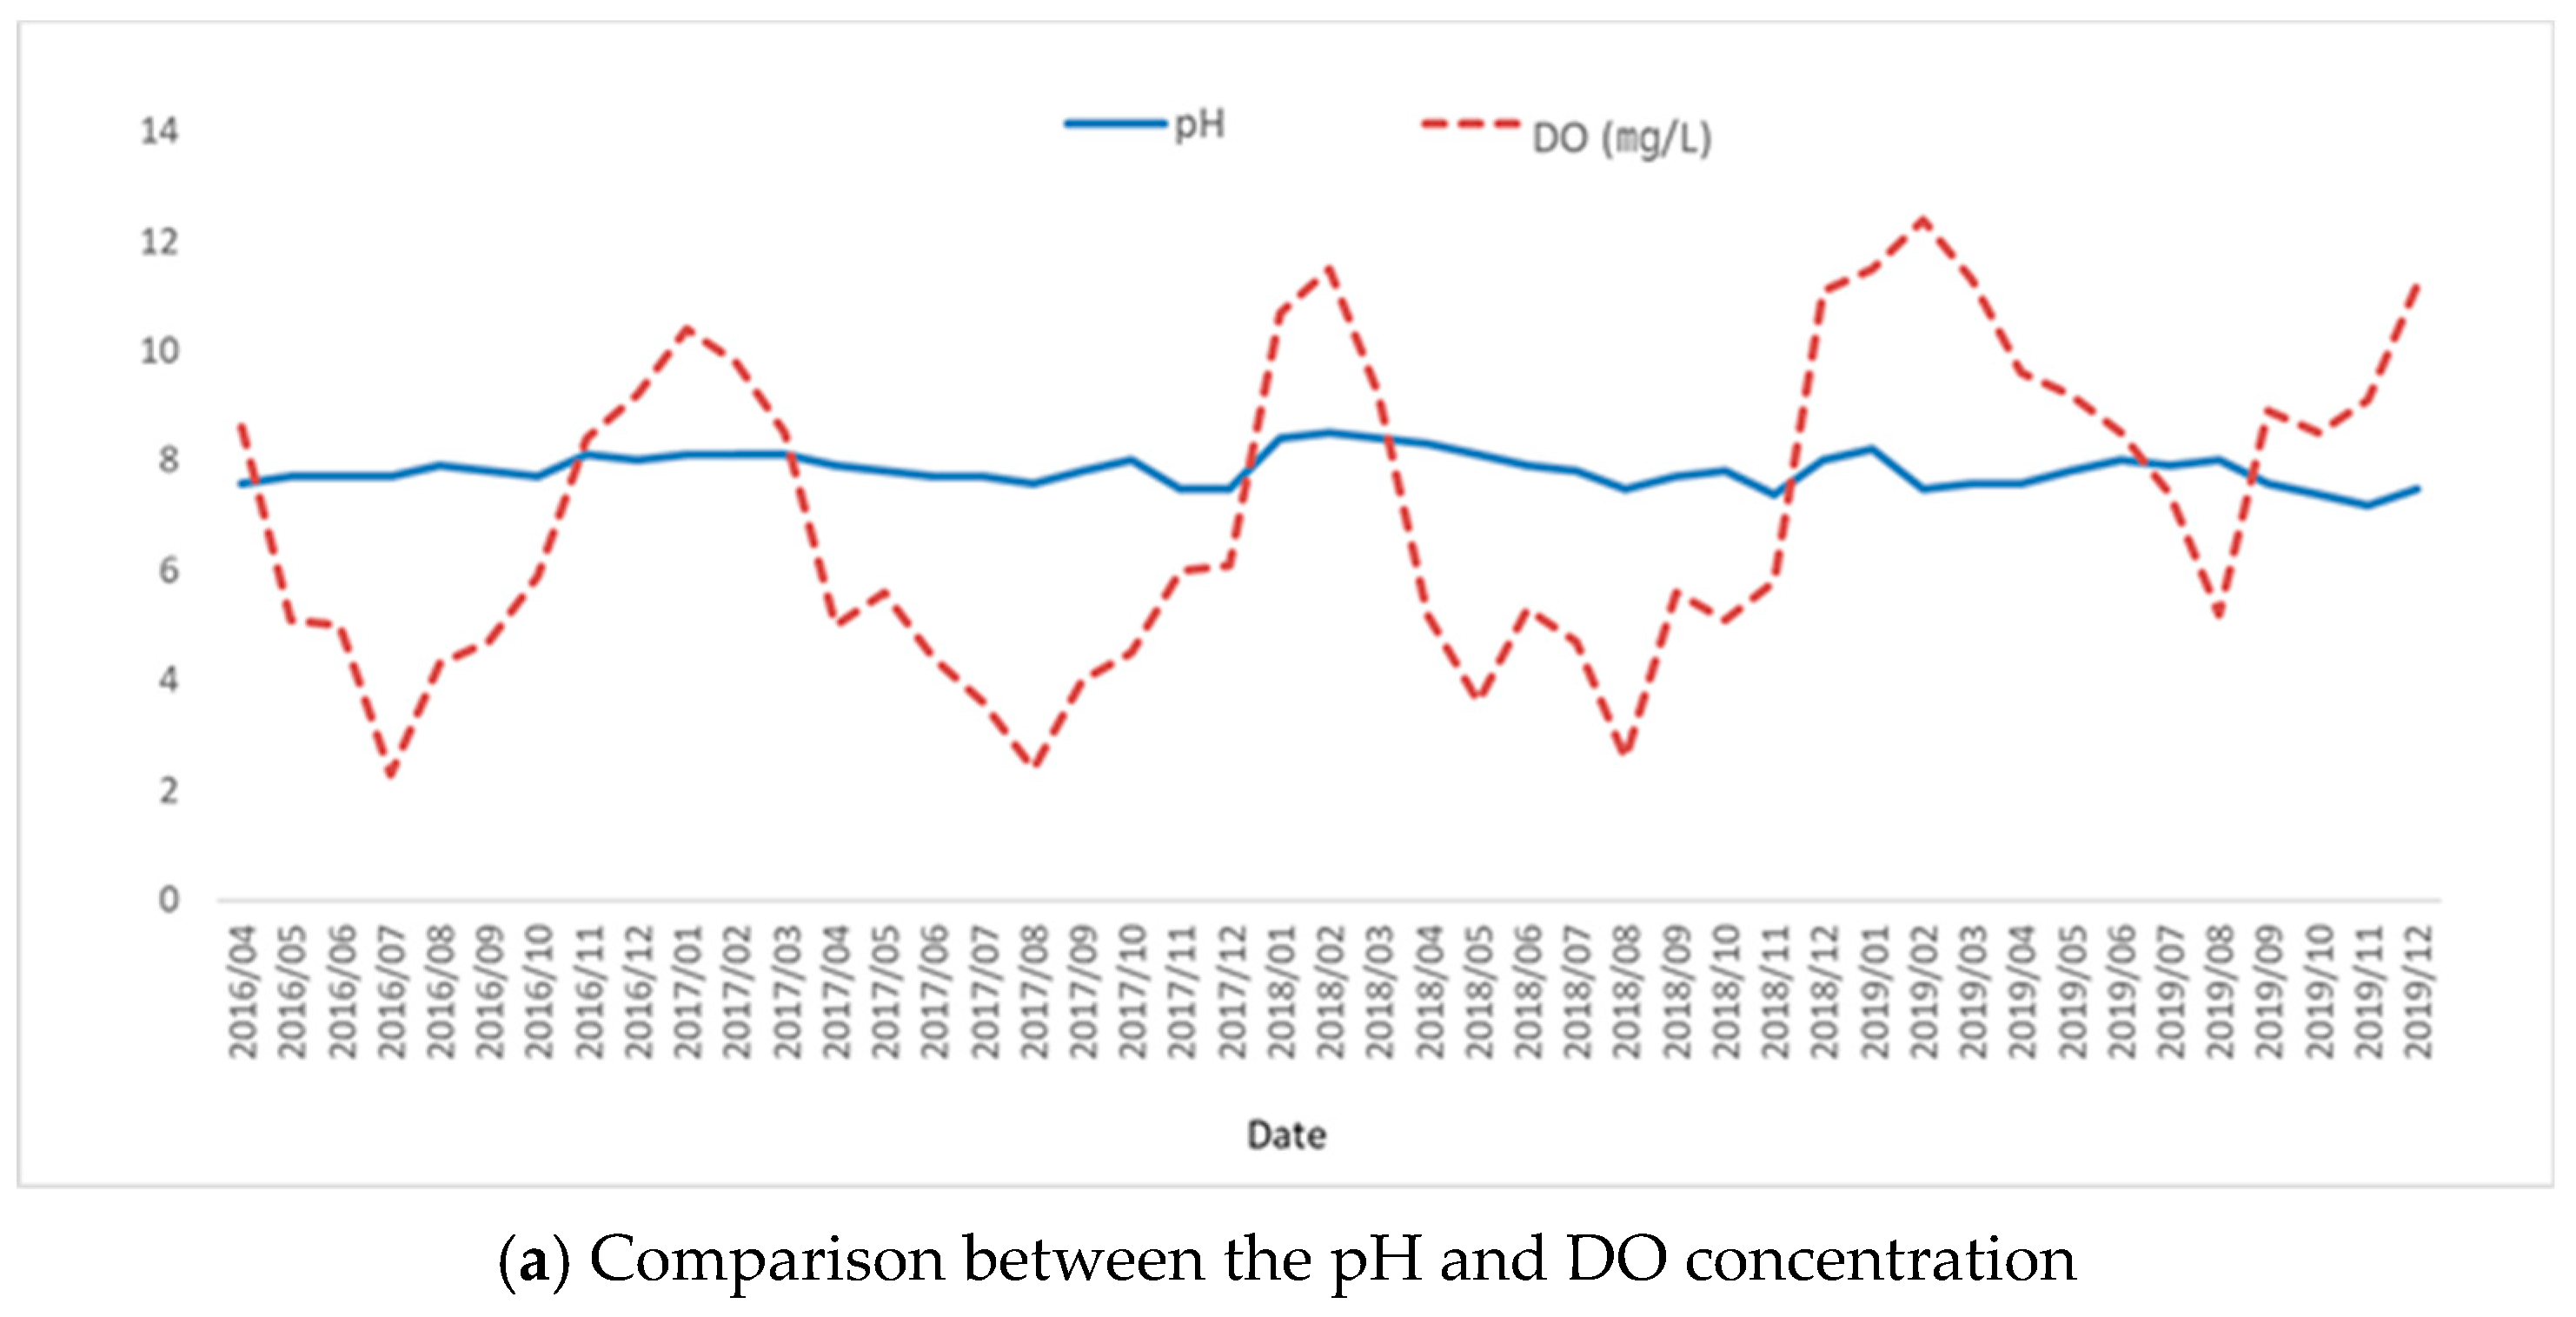
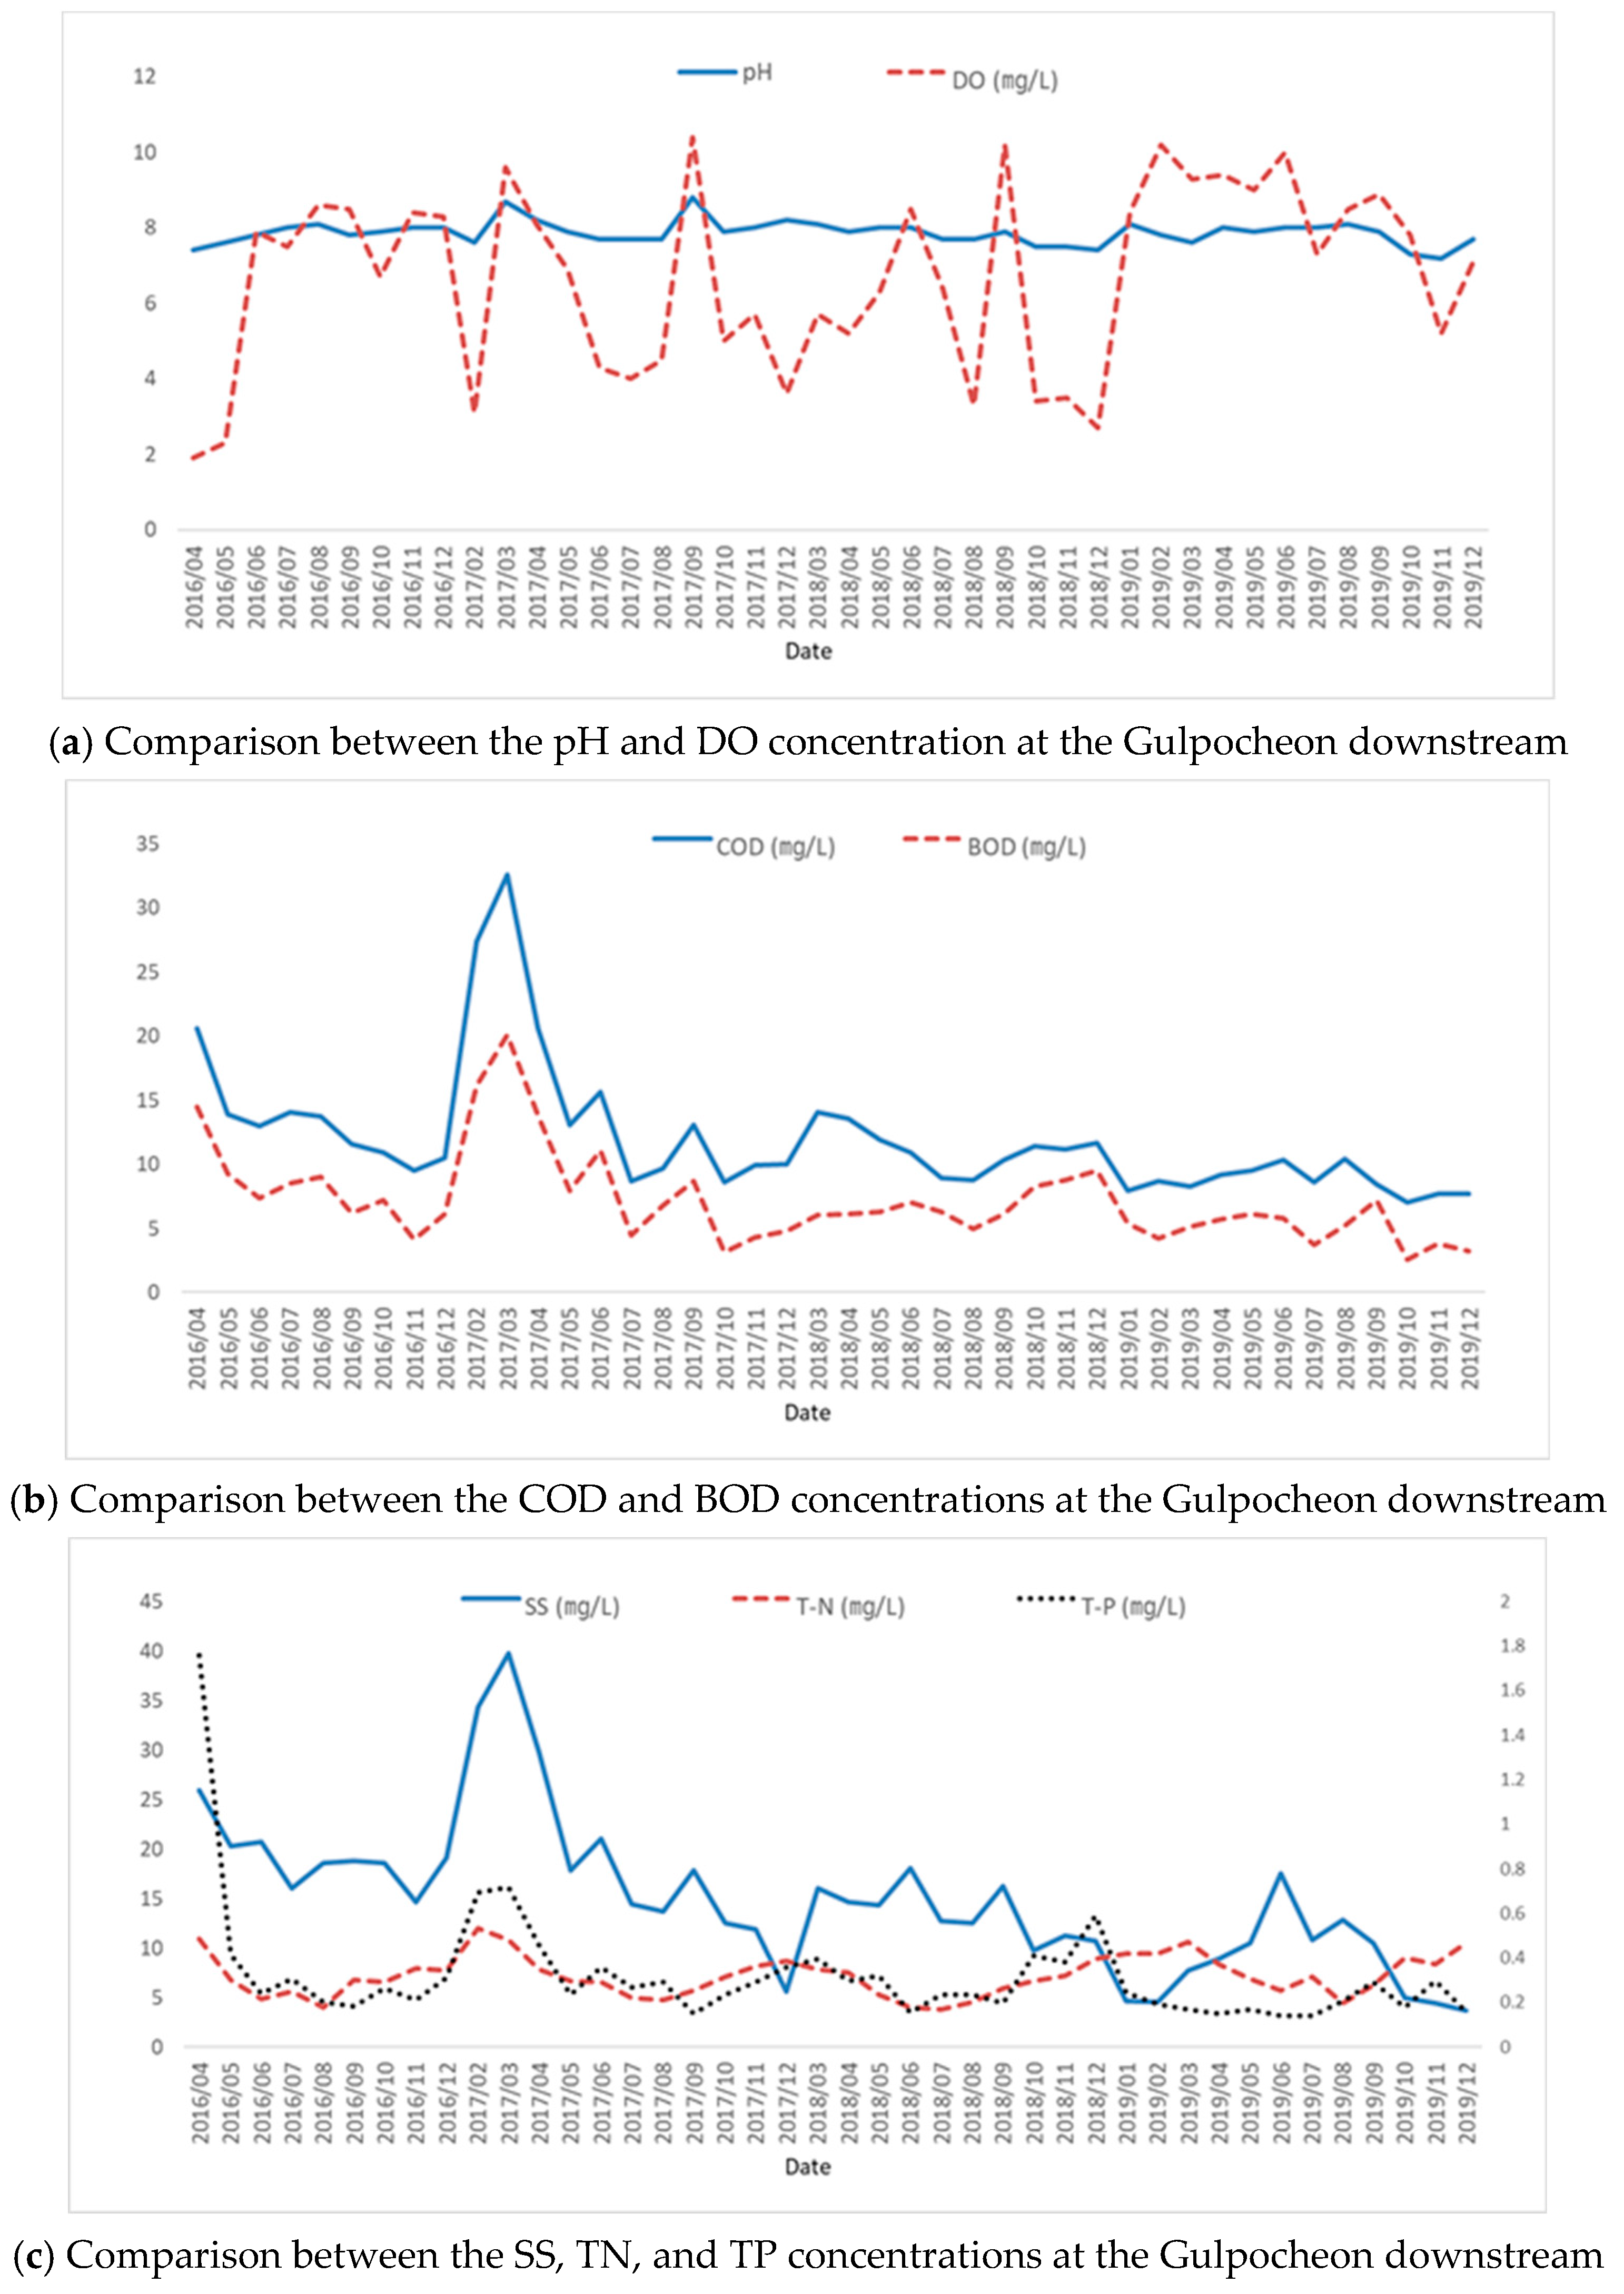
3.2. Comparative Analysis of the Observed Water Quality Concentration

The water quality results of the Gulpocheon upstream are presented in Figure 4. Based on the comparison the pH and DO as shown in Figure 4a, it was observed that the dissolved oxygen is affected by the seasonal effect. The DO is high in the winter season and low in the summer season. Since March 2019, when the ozone treatment facility was completed, the DO concentration was generally higher than the other years compared, suggesting a more stable water quality. The pH was within 6.5 to 8, and the pH change due to the discharge of reclaimed water was insignificant.
Figure 4b shows the COD and BOD concentration changes. After April 2019, the concentration of COD and BOD was lower than 8 mg/L and 3 mg/L, respectively. As it shows the lowest concentration of COD and BOD since April 2016, it can be concluded that there is water quality improvement in all seasons after the discharge of the ozone-treated reclaimed water.
As the concentrations of SS, TN, and TP rapidly increase, depending on the seasonal effect and pollutant loading period, they can be used as criteria to declare water pollution. Before supplying the ozone-treated reclaimed water, the SS concentration exceeded 25 mg/L in October 2016 and December 2018, corresponding to the ‘slightly bad’ rank of the water quality environment standard of the stream water. The TP concentration rapidly increased in the summer and exceeded 0.2 mg/L, the ‘normal’ rank. Since April 2019, the TP and SS items were more satisfactory than the ‘normal’ rank. They did not show significant deviation across different seasons.
The water quality analysis results of the Gulpocheon downstream are presented in Figure 5. On comparing the results of pH and DO, the DO showed the lowest value of 5.2 mg/L in November, which corresponds to the ‘good’ rank the stream water quality standard. These are better results than the ones obtained before providing the reclaimed water. The pH varied between 6.5 to 8.0, and no significant change was observed. The COD and BOD concentrations were stable after April 2019. Based on the results, it can be concluded that there is water quality improvement after the discharge of the ozone-treated reclaimed wastewater. After completing the ozone treatment facility, the SS and TP showed more stable concentrations. The SS showed a continuous decreasing tendency, and the concentration of TP was found to be 0.29 mg/L in November. All showed water quality of ‘normal’ rank except ‘slightly bad’ according to the stream water quality environment standard. The concentration of TN was satisfactory, with no significant deviation across the whole analysis period.
Based on the significant water quality measurement results, the base flow of the ozone treatment facility supplied into the Gulpocheon upstream and Gyesancheon showed water quality improvement in terms of the DO, BOD, COD, and SS concentrations in the target area. By comparing the measured concentrations of the major water quality factors, it was established that the water quality concentration is consistent with the stream water quality environmental standards. Furthermore, based on the field investigation results after the facility’s completion, it was identified that the transparency of the Gulpo stream water was enhanced, and its odor was significantly removed.
The TP and TN concentrations in the treated sewage water were higher than those in the Gulpo stream water. Their concentration was partially increased compared with their concentration before the business. While the TP and TN concentrations tended to increase rapidly before providing the base flow, their water quality concentrations tended to be stable after supplying the base flow, suggesting it is favorable for the water quality management.
Figure 6 shows the results of time series concentration comparison according to location by main water quality factors. Regarding DO, BOD, TN, and TP, the water quality concentration in the middle and downstream has a similar tendency to each other. In particular, in the case of the midstream, high concentrations of water quality were found for BOD, TN, and TP due to the influence of non-point sources during a certain period.
Table 1 is the statistics of all measured water quality from April 2016 to December 2019. The concentrations of BOD, TN, and TP were higher in the middle and downstream than the upstream. In particular, in the middle stream, the BOD concentration increased to 46 mg/L. Overall, the upstream showed stable water quality compared to the middle and downstream areas.

4. Model Building and Data

Building of water quality using the MIKE 21 FM model was based on the reports and observational data of ‘An Implementation Plan for the Total Water Pollution Management of the Hangang Water System in Incheon Metropolitan City (Incheon Metropolitan City, 2014)’, Gulpocheon Stream Maintenance Basic Plan (Incheon Metropolitan City, 2009), and Water Environment Information System [23]. The inflow and outflow analysis simulation conditions were established based on the hydraulic and water quality input data investigated in this study.
For the application of the water quality model to the Gulpo A unit basin (Gulpocheon water system), which is the targeted water quality maintenance region, the basin was classified into a total of five reaches. Each reach was classified into 64 calculational units with a constant interval of 0.2 km, and the water quality model was designed. For the Gulpocheon topography, the cross-sectional data presented in the Gulpocheon stream maintenance basic plan was used. Among the MIKE Zero modules, boundaries were built using the Mesh Generator. A triangular grid was used considering the elevation of the Gulpocheon topography.
The total number of triangular grids was 905. The shapes of the small waterways and loops at the upstream were materialized in detail. Figure 7 presents the analysis region and grid of Gulpocheon.
The flow and water quality conditions using the MIKE 21 FM model were set up using the 2018 actual measurement data and data obtained from organizations (Bucheonsi and Public Health and Environment Research Institute). For the flow data, the conditions before and after the supply of the base flow were set to have the same boundary conditions (i.e., primary external force conditions, such as temperature and water quality), according to the schematic diagram of a water system (An Implementation Plan for the Total Water Pollution Management of the Hangang Water System in Incheon Metropolitan City, 2014). The annual water quality data was established based on the actual measurement data and information system. The data of Incheon Environment Corporation, a facility management agency, was used for evaluating the water quality concentration of the ozone-treated discharged water. The data provided by Bucheonsi was utilized for the Gulpocheon sewage discharged water data.
The input water quality based on the water quality measured in 2018 is presented in Figure 8. To set up identical water quality boundaries for the ozone-treated reclaimed water discharge conditions, the 2018 water quality was applied. The ozone-treated discharged water was assumed to be additionally introduced into Cheongcheoncheon and Gyesancheon.

5. Model Verification and Analysis Results

5.1. Setting of the Simulation Conditions

The conditions before and after the supply of the ozone-treated base flow within Gulpocheon were compared through annual simulations, by building a hydraulic and water quality simulation model. Quantitative analysis was conducted for the water quality improvement on supplying ozone-treated base flow. Table 2 shows the overview of the hydraulic and water quality experiments.
The minimum calculation time step of the model for unsteady analysis was set to 0.01 s to minimize the effect of model errors and divergence. The horizontal eddy viscosity set up with Smagorinsky formulation with 0.28 value. The manning coefficient representing the roughness of the river bed was 1/32, and it is a condition with stones and weeds in general.

5.2. Model Verification Results

To verify the constructed MIKE 21 FM model, observation data and simulation data were compared. Figure 9 shows the measured water quality data provided by the water environment measurement network of the Ministry of Environment in Korea. The water quality data observed between January and October 2018 and the water quality results at the same observation point by modeling simulation were compared.
The comparison results at the same point through monthly observational water quality data and modeling simulation are shown in Figure 10.
As shown in Figure 10, the water quality of the measured and simulated values was similar. In the case of BOD, the simulated values tended to be slightly lower than the observed values, and in the case of DO, the simulated values were generally high, but the trend was similar. Overall, TN and TP showed consistent results.
Figure 11 shows the correlation with the R2 values for the observed and simulation values as a result of the scatter graph.
For BOD, DO, TN, and TP, the measured values and model values are expressed as R2 values, respectively. Excluding DO, it was found to be more than 0.9, which was consistent with each other. In the case of DO, the R2 value was about 0.8, but the overall trend of the simulated results was consistent. Using this built model, water quality change was compared according to the simulations before and after supplying ozone-treated reclaimed water in Section 5.3.

5.3. Model Simulation Results

The hydraulic and water quality simulation was carried out upstream and downstream of Gulpocheon. The primary analysis spots are presented in Figure 1. The analysis spot number 1 was upstream of the ozone-treated reclaimed water discharged spot (Cheongcheoncheon). There was no effect of the reclaimed water in this analysis spot. The analysis spot number 2, the Gulpocheon midstream, was set to be the spot after the reclaimed water discharged spot (after the joining of Cheoncheoncheon), and spot number 3 (Gulpo treated sewage water discharged spot) was set to be the spot after Gyesancheon. The analysis spot number 4, Gulpocheon downstream, was affected by the reclaimed and Gulpo treated sewage water.

5.3.1. Comparison of BOD before and after the Supply of the Ozone Treated Reclaimed Wastewater

Figure 12 presents the BOD concentration change at the analysis spots. Except for the Gulpocheon upstream, where there is no reclaimed water supply, the midstream and downstream were analyzed. Based on the analysis results, the BOD concentration decreased by 0.73 mg/L after the reclaimed water was supplied. Compared with the stream water, the BOD concentration of the Gulpo treated sewage water and ozone-treated water was lower; thus, the same tendency was found in the analysis spots within Gulpocheon.

5.3.2. Comparison of Dissolved Oxygen (DO) before and after the Supply of the Ozone Treated Reclaimed Wastewater

Figure 13 shows the DO concentration change at the analysis spots. As presented in Figure 13b–d, the DO concentration increased in all regions after the discharge of the ozone-treated reclaimed water. The DO concentration was increased by 3 mg/L and 1.5 mg/L midstream and downstream, respectively. It was improved by 1.1 mg/L on the whole, indicating water quality improvement.

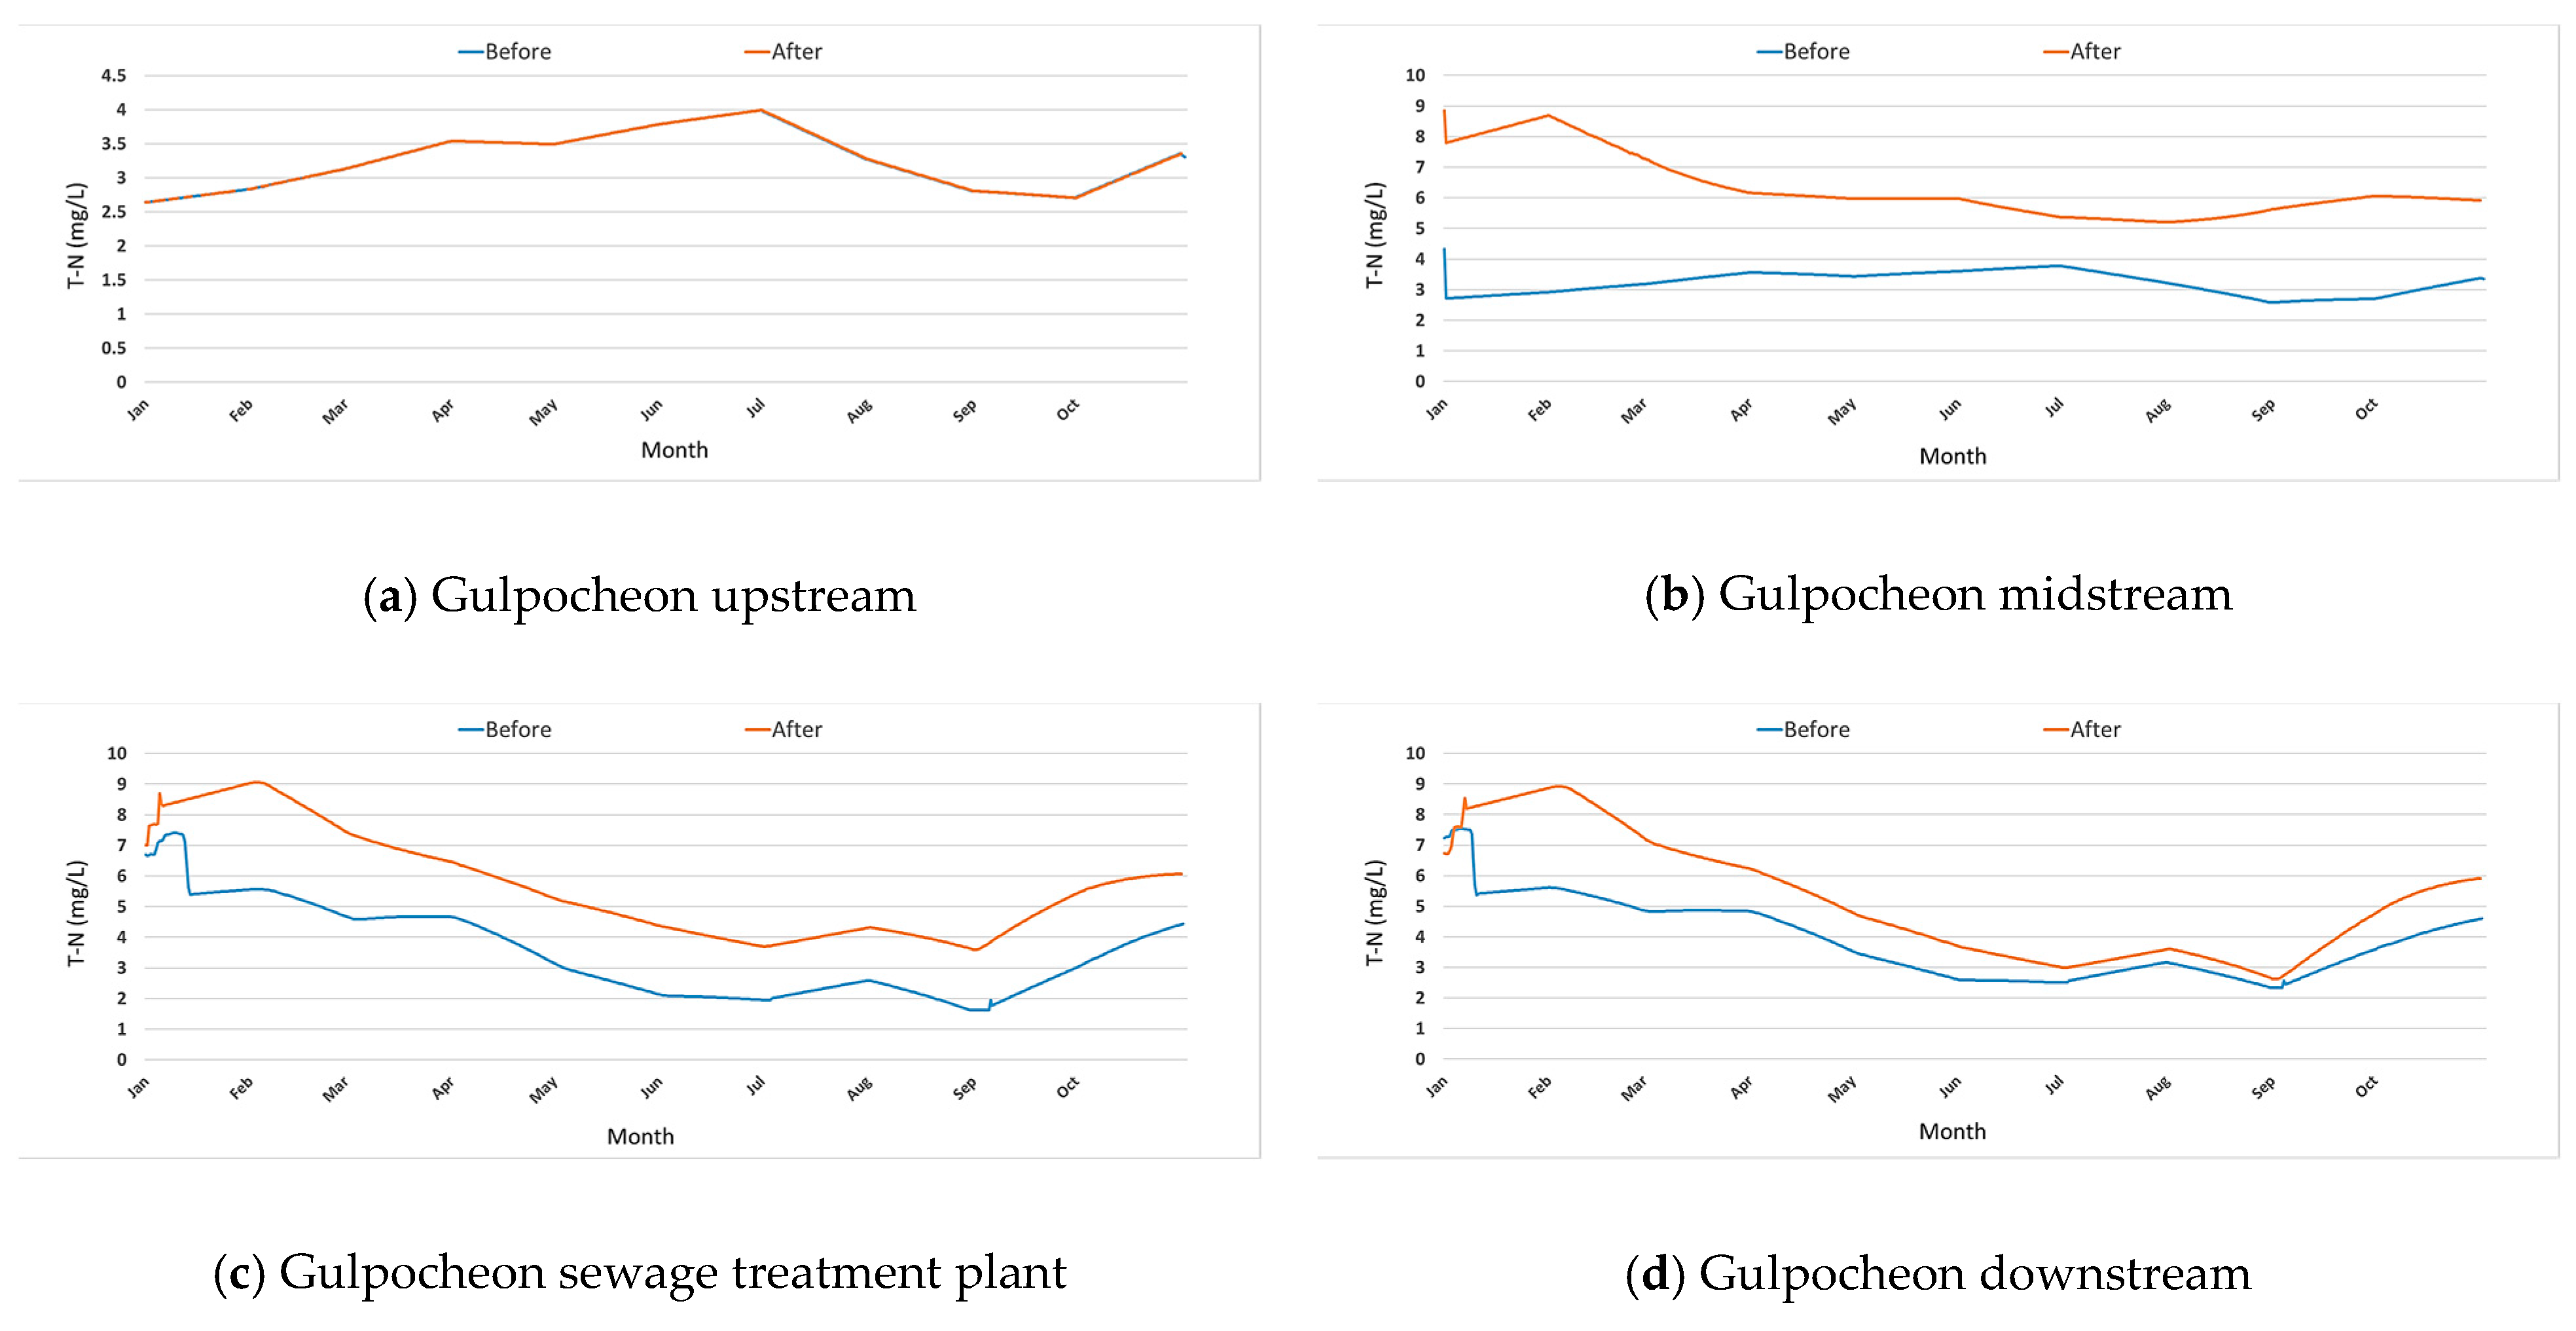
5.3.3. Comparison of Total Nitrogen (TN) before and after the Supply of the Ozone Treated Reclaimed Wastewater

Figure 14 presents the TN concentration change at the analysis spots. As shown in Figure 14b–d, the TN concentration increased in all regions after discharge of the ozone-treated reclaimed water except the Gulpocheon upstream. This is because the nitrogen concentration of the treated sewage water and ozone-treated reclaimed water was higher than that of the stream water. This difference was more evident at the midstream with relatively lower flow. Furthermore, the TN concentration increased downstream.

5.3.4. Comparison of Total Phosphorus (TP) before and after the Business

Figure 15 shows the TP concentration change at the analysis spots. As presented in Figure 15b–d, the TP concentration was maintained constant after the discharge of the ozone-treated reclaimed water. Before the supply of the ozone-treated base flow, the TP concentration was higher in the summer season due to the seasonal effect. However, after the discharge of the reclaimed water, it was maintained at a relatively constant concentration due to the ozone-treated reclaimed water. If the TP concentration of the Gulpo treated sewage water is lowered before the discharge, a higher water quality improvement is expected.
After supplying the base flow, the water quality improvement on the DO and BOD concentrations was captured. Regarding TN and TP, the Gulpo treated sewage water’s water quality and ozone-treated water is higher than that of the stream water. Therefore, if the sewage treatment discharged water’s TN and TP concentration standards are strengthened before the discharge, water quality improvement is expected.
Table 3 shows the mean, maximum, minimum, and standard deviation for the results of Figure 12, Figure 13, Figure 14 and Figure 15.
As a result of analysis of four analysis points through the supply of ozone treated reclaimed water, BOD decreased by about 30% and DO increased by 12%. It can be judged that there is an effect of improving water quality according to the supply of reclaimed water.
In the case of TP, it decreased by 6.3%, but in the case of TN, it increased by 32.2%.
The concentration was increased due to the high concentration of TN in the reclaimed water itself. Overall, there is an improvement effect on BOD and DO, but it is judged that TN and TP should be managed according to the quality of the reclaimed water discharged.
The simulation results indicated that in the Gulpocheon midstream corresponding to the downstream of Cheongcheoncheon and Gyesancheon, water quality is significantly affected by the discharged amount of the base flow alongside the water quality concentration. For the future planning of the Gulpocheon water quality improvement, the reclaimed water’s water quality and discharge flow should be considered. It is expected that the reclaimed water supply after the discharge of the ozone-treated water will result in increased flow after the junction of Cheongcheoncheon and Gyesancheon and, in turn, more favorable and easier maintenance of the stream in terms of hydraulics and water quality.

6. Conclusions

In this study, the water quality improvement and flow were compared on supplying the base flow after completing ozone treatment through the water quality measurement results and numerical modeling analysis, and the following conclusions were drawn.
Based on the numerical analysis results of the MIKE 21 FM model, the water quality improvement of the ozone-treated water is significant in the Gulpocheon region. The DO was increased by 1.1 mg/L on the whole, while BOD concentration was reduced by 0.73 mg/L. If the water quality of the reclaimed water discharged is continuously managed and utilized as the base flow inside Gulpocheon, the stability preservation and water quality improvement of the stream can be expected.
Compared with directly discharging the treated sewage water as the base flow of the stream, discharging it after passing through the ozone treatment process will lead to the immediate improvement of water quality, along with the dilution effect. Hence, it is expected to contribute to improving the accessibility to the residents around the urban stream.
Future studies need to compare the water quality and concentrations with the stream environmental standards (Ministry of Environment), quantitatively analyze the base flow effect of the ozone treatment facility, and utilize it in the facility operation. Furthermore, the utilization effect of the ozone-treated water, monitored through the continuous water quality inside Gulpocheon, is expected to play a more critical role in water quality maintenance due to algal bloom in the summer season.

Funding

This research was funded by Incheon National University Research Grant in 2020.

Institutional Review Board Statement

Not applicable.

Informed Consent Statement

Informed consent was obtained from all subjects involved in the study.

Data Availability Statement

Water Environment Information System at (http://water.nier.go.kr, accessed on 18 September 2021).

Acknowledgments

This work was supported by the Incheon National University Research Grant in 2020.

Conflicts of Interest

The author declares no conflict of interest.

References

  1. Choi, J.Y. A Study on Calculating and Securing the Stream Maintenance Water Demand in Urban Watershed. Korea Spat. Plan. Rev. 2001, 32, 63–76. [Google Scholar]
  2. Ministry of Environment. Study on the Rational Adjustment of Water Quality Standards for Water Reuse Activation; Ministry of Environment: Seoul, Korea, 2009.
  3. Jee, Y.K.; Ahn, J.H.; Lee, J.H. Urban Instream Flow Augmentation Using Reclaimed Water in Korea. J. Korean Soc. Water Wastewater 2012, 26, 285–294. [Google Scholar] [CrossRef] [Green Version]
  4. Lee, K.S.; Chung, E.S.; Park, S.B.; Jin, L.S. Variations of Runoff Quantity and Quality to Landuse Changes in the Hakuicheon Watershed. In Proceedings of the Korea Water Resources Association Conference, Iksan, Korea, 20–21 May 2005; pp. 664–668. [Google Scholar]
  5. Lee, K.S.; Jin, L.S.; Lee, S.H.; Lee, J.M. Water Engineering: Provision Measures of Maintenance Water to Prevent Streamflow Depletion Using PCSWMM. J. Korean Soc. Civ. Eng. 2005, 25, 437–441. [Google Scholar]
  6. Cho, C.W.; Kim, J.T.; Park, J.J.; Song, J.H.; Lee, M.S.; Jeong, J.R.; Ryou, J.W. A Study on Reuse of Reclaimed Water in Jeonbuk Province. J. Korean Soc. Environ. Eng. 2017, 39, 237–245. [Google Scholar] [CrossRef]
  7. Kim, D.H.; Kim, J.S. Strategies for Improved Reuse of Effluent Water from Wastewater Treatment Plants in Incheon; The Incheon Institute: Incheon, Korea, 2009. [Google Scholar]
  8. Lee, H.S.; Hur, J.; Jeong, S.A.; Hwang, S.J.; Shin, J.K. Spatial Characterization of Water Pollution in the Urban Stream Watershed (Gap Stream) Korea. J. Korean Soc. Water Qual. 2006, 22, 943–951. [Google Scholar]
  9. Choi, C.H.; Namkung, K.C.; Youn, J.W.; Lee, C.Y. Improvement of River Water Quality By Combined treatment of Sand Filtration and Ozonation(1)—Focusing on Reduction of BOD, COD, SS and Color. J. Korean Soc. Water Qual. 2011, 27, 813–821. [Google Scholar]
  10. Jung, J.H. A Study on River Maintenance Water Reuse of Sewage Secondary Effluent by Coagulation-Membrane Separation Process. Ph.D. Thesis, Dong-A University, Busan, Korea, 2009. [Google Scholar]
  11. Seo, J.B. Effluent Reuse by the serial Processes of Sand Filter/O3/BAC/Zeolite. J. Inst. Nat. Sci. 1998, 5, 219–230. [Google Scholar]
  12. Mori, Y.; Oota, T.; Hashimoto, M.; Takamura, M.; Fujii, Y. Ozone-microfiltration System. Desalination 1998, 177, 211–218. [Google Scholar] [CrossRef]
  13. Park, S.J.; Lee, H.G.; Oh, B.S.; Kim, K.S.; Song, S.J.; Joo, S.; Kang, J.W. Evaluation of Ozone and Ozone/UV Processes for the Reuse of Sewage Treatment Plant Effluent. In Proceedings of the KSEE Conference, Daejeon, Korea, 1–3 May 2003; pp. 973–980. [Google Scholar]
  14. Ahn, G.H.; Park, K.Y.; Maeng, S.G.; Hwang, J.H.; Song, K.K.; Lee, Y.H.; Lee, J.W.; Chung, M.W. Fundamental Study on Ozone Treatment for Reduction and Recycle of Wastewater Sludge. In Proceedings of the KSWW & KSWE Conference, Gwangju, Korea, 13 April 2001; Volume 2001, pp. 41–44. [Google Scholar]
  15. Yi, L.; Jiao, W.; Chen, X.; Chen, W. An overview of reclaimed water reuse in China. J. Environ. Sci. 2011, 23, 1585–1593. [Google Scholar] [CrossRef]
  16. Chen, W.; Lu, S.; Jiao, W.; Wang, M.; Chang, A.C. Reclaimed water: A Safe Irrigation Water source? Environ. Dev. 2013, 8, 74–83. [Google Scholar] [CrossRef]
  17. Gyan Chhipi-Shrestha, G.; Hewage, K.; Sadiq, R. Microbial Quality of Reclaimed Water for Urban Reuses: Probabilistic Risk-based Investigation and Recommendations. Sci. Total Environ. 2017, 576, 738–751. [Google Scholar] [CrossRef] [PubMed]
  18. Cocoa Florida. Available online: https://www.cocoafl.org/269/What-is-Reclaimed-Water (accessed on 13 September 2021).
  19. Kang, J.H. A Study on NOD Ratio of Effluent BOD in Sewage Treatment Plant. Master’s Thesis, University of Seoul, Seoul, Korea, 2009. [Google Scholar]
  20. Kim, J.K. Introduction to Water Pollution; Donghwa Technology: Donghwa, Korea, 2000. [Google Scholar]
  21. RMB Environmental Laboratories, Inc. Available online: https://www.rmbel.info/primer/total-phosphorus (accessed on 13 September 2021).
  22. Environmental Engineering Research Association. Dictionary of Environmental Engineering Terminology; Seongandang: Seoul, Korea, 2002. [Google Scholar]
  23. Water Environment Information System. Available online: http://water.nier.go.kr (accessed on 13 September 2021).
  24. Bocci, V. How Does Ozone Act? In How and Why Can. We Avoid Ozone Toxicity? Springer: Berlin/Heidelberg, Germany, 2005. [Google Scholar]
  25. Remondino, M.; Valdenassi, L. Different Uses of Ozone: Environmental and Corporate Sustainability. Literature Review and Case Study. Sustainability 2018, 10, 4783. [Google Scholar] [CrossRef] [Green Version]
  26. Water Mail. Available online: http://www.watermaeil.com/news/articleView.html?idxno=1695 (accessed on 13 September 2021).
  27. Bladé Castellet, E.; Cea, L.; Corestein, G. Numerical modelling of river inundations. Ing. Agua 2014, 18, 71–82. [Google Scholar] [CrossRef]
  28. Pinos, J.; Timbe, L. Performance assessment of two-dimensional hydraulic models for generation of flood inundation maps in mountain river basins. Water Sci. Eng. 2019, 12, 11–18. [Google Scholar] [CrossRef]
  29. Symonds, A.M.; Vijverberg, T.; Post, S.; Spek, B.V.D.; Henrotte, J.; Sokolewicz, M. Comparison between MIKE 21 FM, Delft3D and Delft3D FM flow models of Western Port Bay, Australia. Coast. Eng. Proc. 2017, 1. [Google Scholar] [CrossRef]
  30. DHI. MIKE 21 Flow Model Hydrodynamic Module User Guide; DHI: Hørsholm, Denmark, 2017. [Google Scholar]
  31. Paliwal, R.; Ratra, R.R. Applicability of MIKE 21 to assess temporal and spatial variation in water quality of an estuary under the impact of effluent from an industrial estate. Water Sci. Technol. 2011, 63, 1932–1943. [Google Scholar] [CrossRef] [PubMed]
  32. Wikipedia. Available online: https://ko.wikipedia.org/wiki/%EA%B5%B4%ED%8F%AC%EC%B2%9C (accessed on 20 August 2021).
  33. Ahn, T.W.; Jung, J.H.; Kim, T.H.; Kim, S.W.; Choi, I.S.; Oh, J.M. A Study on the Characteristic of Pollutants of Water Quality and Sediments in Gul-po Stream Basin. JKSEE 2012, 34, 495–503. [Google Scholar] [CrossRef]
  34. Seol, H. Discussion on the Designating Gulpo River as the National River; National Assembly Strategy and Finance Committee: Seoul, Korea, 2013.
  35. Incheon Environmental Corporation. Available online: https://www.eco-i.or.kr/main/main.asp (accessed on 13 September 2021).
Figure 1. Monitoring and analysis spots of Gulpocheon.
Applsci 11 08890 g001
Figure 2. The supply of the base flow in Gulpocheon and Gyesancheon [35].
Applsci 11 08890 g002
Figure 3. Flow change during the analysis period.
Applsci 11 08890 g003aApplsci 11 08890 g003b
Figure 4. Water quality comparison of the upstream of Gulpocheon [23].
Applsci 11 08890 g004aApplsci 11 08890 g004b
Figure 5. Water quality comparison of the downstream of Gulpocheon [23].
Applsci 11 08890 g005
Figure 6. Observed water quality by location.
Applsci 11 08890 g006
Figure 7. Boundary, elevation, and grid.
Applsci 11 08890 g007
Figure 8. Water quality concentration input criteria of the MIKE 21 FM model.
Applsci 11 08890 g008aApplsci 11 08890 g008b
Figure 9. Observation and water quality data [23].
Applsci 11 08890 g009
Figure 10. Comparison of observed data and simulation results.
Applsci 11 08890 g010
Figure 11. Scatter graph comparison.
Applsci 11 08890 g011aApplsci 11 08890 g011b
Figure 12. Comparison of the BOD change at analysis spots.
Applsci 11 08890 g012
Figure 13. Comparison of the DO change at analysis spots.
Applsci 11 08890 g013
Figure 14. Comparison of the TN change at analysis spots.
Applsci 11 08890 g014
Figure 15. Comparison of the TP change at analysis spots.
Applsci 11 08890 g015
Table 1. Statistical analysis of observed water quality.
Statistical ParametersUpstreamMidstreamDownstream
DO (mg/L)BOD (mg/L)TN (mg/L)TP (mg/L)DO (mg/L)BOD (mg/L)TN (mg/L)TP (mg/L)DO (mg/L)BOD (mg/L)TN (mg/L)TP (mg/L)
Average7.044.014.590.179.0510.078.020.336.707.167.200.32
Minimum2.31.21.6890.0172.91.73.8070.1091.92.63.7950.139
Maximum12.49.711.5930.52216.24615.6421.06810.420.111.9461.759
S.D.2.812.392.750.123.0610.562.740.252.443.542.040.26
Table 2. Hydraulic and water quality simulation conditions.
ItemContents
Model compositionGrid compositionUnstructured triangular grid system
Number of gridsNumber of grids for practical calculation: 905
Simulation conditionsFlow input dataGulpocheon inflow discharge: 2018 measured flow (Water Environment Measurement Network, 2019), Gulpo sewage treatment plant discharged water (Bucheonsi, 2019), Ozone treatment facility reclaimed water (Incheon Environment Corporation, 2019)
Water quality input dataGulpocheon measured flow: 2018 Ministry of Environment Water Environment Measurement Network data,
Sewage treatment discharged flow: 2018 Gulpo sewage treatment plant discharge data
Ozone treatment reclaimed water discharge flow: Ozone treatment reclaimed water discharge flow (Incheon Environment Corporation, 2019)
Main water quality constantsBOD process: 1st order decay (dissolved) = 0.5/d
Oxygen process: Secchi disk depth = 0.4 m, Temp. Coef. respiration = 1.08, Half-saturation Conc. = 2 g/L
Nitrification: 1st order decay rate = 0.05/d, Oxygen demand by nitrification, NH4 to NO2 = 3.42, Half-Sat. oxygen Conc. = 2 mg/L
Phosphorus process: Phosphorus content in dissolved BOD = 0.06, Half-Sat. Conc. for P-uptake = 0.005 mg/L
Simulation periodBefore supply of the reclaimed water: January to October, a total of 300 days (2018)
After the supply of the reclaimed water: January to October, a total of 300 days (2018)
Calculation time step and coefficientsMinimum time step = 0.01 s, Eddy coefficient = 0.28, Manning’s roughness coefficient (river bed condition) = 1/32
Simulation caseCase 1: Conditions of not discharging the ozone-treated reclaimed wastewater
Case 2: Conditions of discharging the ozone-treated reclaimed wastewater
Table 3. Statistical results of MIKE 21 FM simulation.
W.Q. ParametersStatistical ParametersOriginal ConditionAfter the Supply of the Ozone Treated Reclaimed WastewaterChange Ratio
UpMidGulpo STPDownAve.UpMidGulpo STPDownAve.
BOD
(mg/L)
Average4.073.711.582.623.004.121.921.821.302.29−30.8
Minimum1.751.630.842.001.551.751.051.351.021.29−20.3
Maximum9.538.212.803.566.039.533.603.132.814.77−26.3
S.D.1.881.560.270.361.021.860.560.320.200.73−38.7
DO
(mg/L)
Average7.928.167.867.687.917.7410.429.068.839.0112.3
Minimum4.045.134.594.864.654.048.666.515.806.2525.6
Maximum13.1513.1713.6613.1613.2913.1912.8613.2613.6413.24−0.4
S.D.2.492.392.852.552.572.371.232.022.351.99−28.8
TN
(mg/L)
Average3.263.213.503.873.463.276.295.675.175.1032.2
Minimum2.642.581.612.352.292.645.203.592.623.5134.7
Maximum3.994.327.417.555.823.998.859.068.937.7124.5
S.D.0.400.361.451.220.860.400.991.681.921.2431.2
TP
(mg/L)
Average0.190.210.380.340.280.200.250.300.320.27−6.3
Minimum0.010.020.120.110.060.010.180.220.220.1659.4
Maximum0.370.390.680.640.520.370.380.630.670.51−1.0
S.D.0.100.110.120.110.110.100.030.040.050.06−99.3
Publisher’s Note: MDPI stays neutral with regard to jurisdictional claims in published maps and institutional affiliations.

