Article

Air Quality Assessment of a School in an Industrialized Area of Southern Italy

1
CNR ISAC Institute of Atmospheric Sciences and Climate, National Research Council, 73100 Lecce, Italy
2
Biology Department, Bari University, 70126 Bari, Italy
3
Chemistry Department, Milan University, 20133 Milan, Italy
*
Author to whom correspondence should be addressed.
Appl. Sci. 2021, 11(19), 8870; https://doi.org/10.3390/app11198870
Submission received: 1 August 2021 / Revised: 8 September 2021 / Accepted: 14 September 2021 / Published: 23 September 2021
(This article belongs to the Special Issue New Insights into Atmospheric Chemistry and Climate)

Abstract

:
In this study, simultaneous monitoring of indoor and outdoor Volatile Organic Compounds (VOCs) was carried out in a school, by both Radiello® cartridges and real-time monitors (Corvus, IonScience Ltd., Fowlmere UK). Moreover, an outdoor air quality assessment was performed with data from an air quality monitoring station (ARPA Puglia) located close to the school. In particular, VOCs, Benzene, Toluene, Ethylbenzene, and Xilenes concentrations, obtained by using Radiello® diffusive samplers, were monitored in two classrooms, two bathrooms, and outside of the school building for three weeks during winter 2019. Simultaneously, the Total VOC (TVOC) concentrations were measured by means of real-time monitors inside and outside the classroom in order to individuate the activation of sources during the sampling campaign days. The results evidence that indoor TVOC concentrations were bigger than those outdoors; this suggests the presence of indoor pollutant sources, both in the classrooms and the bathrooms. The results of our study can help the school management by the following recommendations: increasing ventilation in classrooms during school activities and after cleaning; involving students in discussions regarding the use of acrylic paints, permanent markers, perfumes and deodorants, and the limitation of smoking activities both in bathrooms and outdoor spaces.

1. Introduction

1.1. Indoor Air Quality and Children’s Exposure

Children are more sensitive to air pollution than adults. In fact, children are constantly growing and, in proportion to their weight, they breathe more air and consume more food and water than adults do [1]. Because of both their developing respiratory and immune systems and different responses to environmental exposure, children show an increased risk in the development of several diseases, such as allergy and respiratory symptoms, compared to adults [2]. Moreover, children spend large amounts of their time in school buildings where they may be exposed to unknown levels of indoor pollutants [3]. The SINPHONIE study [4], a two-year multidisciplinary study performed in 115 European schools (located in 54 cities of 23 European countries), suggested that in Europe: (i) children are exposed to a multiplicity of air pollutants with concentrations that often overcome the recommended standards at school; (ii) exposures to elevated concentrations of indoor air pollutants, including VOCs, are adversely associated with several adverse health effects among schoolchildren; and (iii) there is a significant potential protective effect of some physical and comfort parameters (temperature and ventilation) on respiratory and allergy symptoms. In Baloch et al. [4], elevated levels of benzene in classrooms were significantly associated with the upper airways, lower airways, and systemic symptoms in schoolchildren. Moreover, the adverse effects of limonene were observed in schoolchildren. The health effects linked to limonene are irritation of the nose, eyes, throat, and skin [5]. However, another study performed in a population-based sample of approximately 3000 Canadians suggested that household exposure to limonene may increase the spread of the exhibition of asthma symptoms in children [6]. Baloch et al. [4] demonstrated a stronger linear-positive association between the VOC score and systemic symptoms, as well as upper and lower airway symptoms.

1.2. Influence of Temperature and Relative Humidity on VOC Concentrations

Studies in literature highlight contrasting trends between total concentrations of VOCs and meteorological parameters such as temperature and relative humidity. For instance, Huang et al. [7] found that an increase in temperature and relative humidity are associated with an increase in the level of indoor VOCs. In contrast, Becker Portela et al. [8] found no correlation between VOCs and ambient temperature, justified by the contrasting effect of higher temperatures leading to an increased evaporation of solvents, but also to a greater concentration of the hydroxyl ion which is responsible for VOC removal. Finally, Dutra de Lima et al. [9] reported higher concentration of this class of pollutants on colder days due to lower temperatures, leading to more stable atmospheres which favor the accumulation of VOCs in indoor environments.

1.3. Italian Studies on School Air Quality

In Italy, few studies have been conducted on the indoor air quality of schools, as it appears in a study promoted and carried out by the Tuscan regional authority [10]. Among the few studies, a VOC indoor/outdoor screening campaign performed in a high environmental risk site of South Italy, Taranto city, highlighted a significant indoor contribution from terpenes and 2-butoxyethanol [11]. Even if the school was located close to an industrial area, outdoor VOC concentrations were low in comparison to studies conducted in similar areas of the world. The use of high time resolution monitoring equipment facilitated the identification of VOC emission patterns of possible indoor sources and confirmed cleaning activities, occurring after the pupils leave, as one of the sources [11]. During an indoor VOC monitoring campaign performed in schools in a suburban area of the Po plain in Italy [12], it was highlighted that the classrooms were characterized by low pollutant concentrations, even if there was a contribution from indoor contamination for most of the investigated components. Daily trends confirm that VOCs have mainly an indoor origin [12]. Diffusion passive samplers have been widely used in indoor/outdoor VOC monitoring because of the absence of a power supply, their easy handling, and analytical robustness [4,11,12]. However, continuous and real-time detectors are contemporarily employed in order to obtain high-resolution data that allows tracking of the activation of sources during the monitoring period [11,12].
The present study focuses on the city of Galatina (Apulia Region, Italy). The area hosts a large cemetery and other small industries. For several decades, elevated male mortality rates for lung cancer in the Lecce province, compared with the national values, have been reported. Recently, a cluster analysis of lung cancer incidence was detected in the hinterland of the province, including the area of Galatina. Another study [13] showed that children aged 6–8 years living in the area had a higher frequency of micronucleated cells in oral mucosa than children living in other areas of the Lecce Province not included in the cluster area. The aim of this work is to assess the indoor air quality in a school building located in Galatina (Lecce) using both passive cartridges and active systems for VOC monitoring.

2. Materials and Methods

2.1. Area of Study

The indoor and outdoor measurements were conducted in a secondary school located in Galatina (Lecce), a small city in Southern Italy (40°10′0.5″ N; 18°10′25″ E; 76 m a.s.l) (Figure 1) with around 27,000 inhabitants. The school enrolls approximately 800 students per year, with an average of 25 students per classroom. School activities start at 8:00 and finish at 13:00. There is a 15′ break in the middle of the day. Students sometimes have to go to another specific classroom to learn sports in the daily schedule. The area hosts a large cemetery and other small industries situated about 4–5 km southwest of the school. Measurements were made indoors in 2 classrooms (4B and 4E) and 2 bathrooms (B1, B2). In the classroom (4E), indoor measurements were made simultaneous to outdoor ones on the classroom balcony. The school planimetry, highlighting the 4B and 4E classroom positions, can be found in the Supplementary Materials as Figure S1.
The sampling was carried out from 1 February to 12 March 2019. To study their influence on measurements, local meteorological parameters were investigated using weather data, such as temperature (°C), relative humidity (%), rain (mm), air pressure (hPa), wind speed (m/s), and direction, provided by the ground-based meteorological weather station (AQ1 in Figure 1) located nearby the school (about 500 m) and managed by the regional environmental protection Agency of Apulia Region, Arpa Puglia (https://www.arpa.puglia.it (last access: 16 September 2021)). The sampling campaign was mainly characterized by clear skies, and only 4 rainy days occurred. Average daily temperatures ranged between 6.8 °C and 16.0 °C, with values of approximately 7.8 °C at 8.00 (school starting time) and 15.4 °C at 13.00 (school finishing time). Relative humidity varied between 42% and 84%, while wind speed showed values between 0.4 and 5.0 m/s (see Supplementary Materials Figures S2–S4). The same station (AQ1) provided measurements of air pollutants NO2, PM2.5, PM10, and CO.

2.2. Sampling Equipment and Data Collection Procedure

During the experimental campaign, analytical measurements of VOCs were made through Radiello passive samplers, and total VOC measurements through Photo Ionization Detectors (PIDs).

2.2.1. Volatile Organic Compounds: Passive Sampling

During the indoor/outdoor sampling campaign, passive VOC measurements (VOCs and aldehydes) were carried out using diffusive samplers in radial symmetry with adsorbent cartridges Rad 130 (Radiello®—Fondazione Salvatore Maugeri-IRCCS, Padova, Italia). The sampling time schedule is defined in Table 1. Radiello samplers were installed in classrooms and bathrooms at a distance of 50 cm under the ceiling, and no closer than 2 m to windows. The sampling time covered a 3-day period from Tuesday morning until Friday afternoon, and a 4-day period from Friday afternoon to Tuesday morning next week. Sampling indoor places investigated were: B1 (male bathroom), B2 (female bathroom), 4B (classroom 4B), 4E (classroom 4E), and O4E (external balcony classroom 4E).

2.2.2. Volatile Organic Compounds: Real-Time Monitoring

High temporal resolution monitoring of TVOC concentrations (ppm), temperature (°C), and relative humidity (%) was performed inside the selected educational buildings through the deployment of Photo Ionization Detectors (PIDs) (Corvus, IonScience Ltd., UK). The PIDs’ high-sensitivity technology comprises a Kripton UV lamp operating at 10.6 eV ionization potential, two collecting electrodes, and an electric-signals converter to measure TVOC concentrations within the 0.01 to 50 ppm concentration range with an accuracy of 134 ± 5 ppb, and a limit of detection (LOD) equal to 5 ppb. The PIDs featured built-in humidity compensation, thanks to the integration of humidity and temperature sensors and, thus, they automatically provided TVOC concentrations corrected for relative humidity. Before deployment inside the investigated schools, and to ensure data quality, the PIDs were factory calibrated using isobutylene as the calibration gas (thus, TVOC concentrations are herein expressed and discussed in ppmv isobutylene equivalent). During the monitoring campaign, TVOC concentrations were recorded with a 1 sec time resolution and were successively averaged on a 15 min time-frame for data analysis. The selection of the monitoring locations inside the selected classrooms was carefully decided according to representativeness criteria. Moreover, with specific regard to classroom 4E, indoor-outdoor simultaneous monitoring of TVOC concentrations was carried out by placing one PID inside the classroom and another on the external balcony. Inside the classroom, the detector was placed near the occupants’ breathing zone, approximately 1 m above the floor and at least 2 m away from windows, doors, or active heating systems. The selection of the monitoring location was carefully decided to make the readings as representative of the whole room volume as possible. A distance of at least 2 m between the windows and the detector was guaranteed to avoid any air turbulence near the monitoring system, which could result in potential fluctuations in data readings. Outdoor measurements were taken to set the reference outdoor concentrations.

2.2.3. Determination of Radiello Volatile Organic Compounds by Gas Chromatography—Mass Spectrometer (GC-MS)

Volatile organic compounds were extracted from the cartridges using 2 mL of carbon disulfide (CS2) and by stirring the solution from time to time over 30 min, both manually and with the aid of a mechanical stirrer (Vortex, VWR Collections). The extraction solvent was prepared to contain the internal standards (1,2-dichloroethane-d4, toluene-d8, 4-bromofluorobenzene) at a concentration of 5 g mL−1.
The analysis was performed using the gas chromatography-mass spectrometry technique (Agilent Technologies Inc. 8890 GC System, Santa Clara, CA, USA) with a DB-624 column (60 m × 0.25 mm i.d. and 1.4 m film thickness), using helium as carrier gas. An amount of 1 mL was injected into the instrument using an autosampler (Gerstel robotic MPS multipurpose sampler) in splitless mode. The oven temperature was 48 °C for the initial 4 min and increased by 5 °C/min to 110 °C (holding 7 min), then was increased by 6 °C/min to 165 °C (holding 0 min), and finally was increased by 20 °C/min to 220 °C (holding 4 min). Overall, the duration of the chromatographic run was approximately 40 min.
Regarding mass spectrometry, electron ionization (EI), conducted at 70 eV, was used as the ionization technique. Identification and quantification of the 22 VOCs tested was performed by SIM and SCAN monitoring modes.

3. Results and Discussion

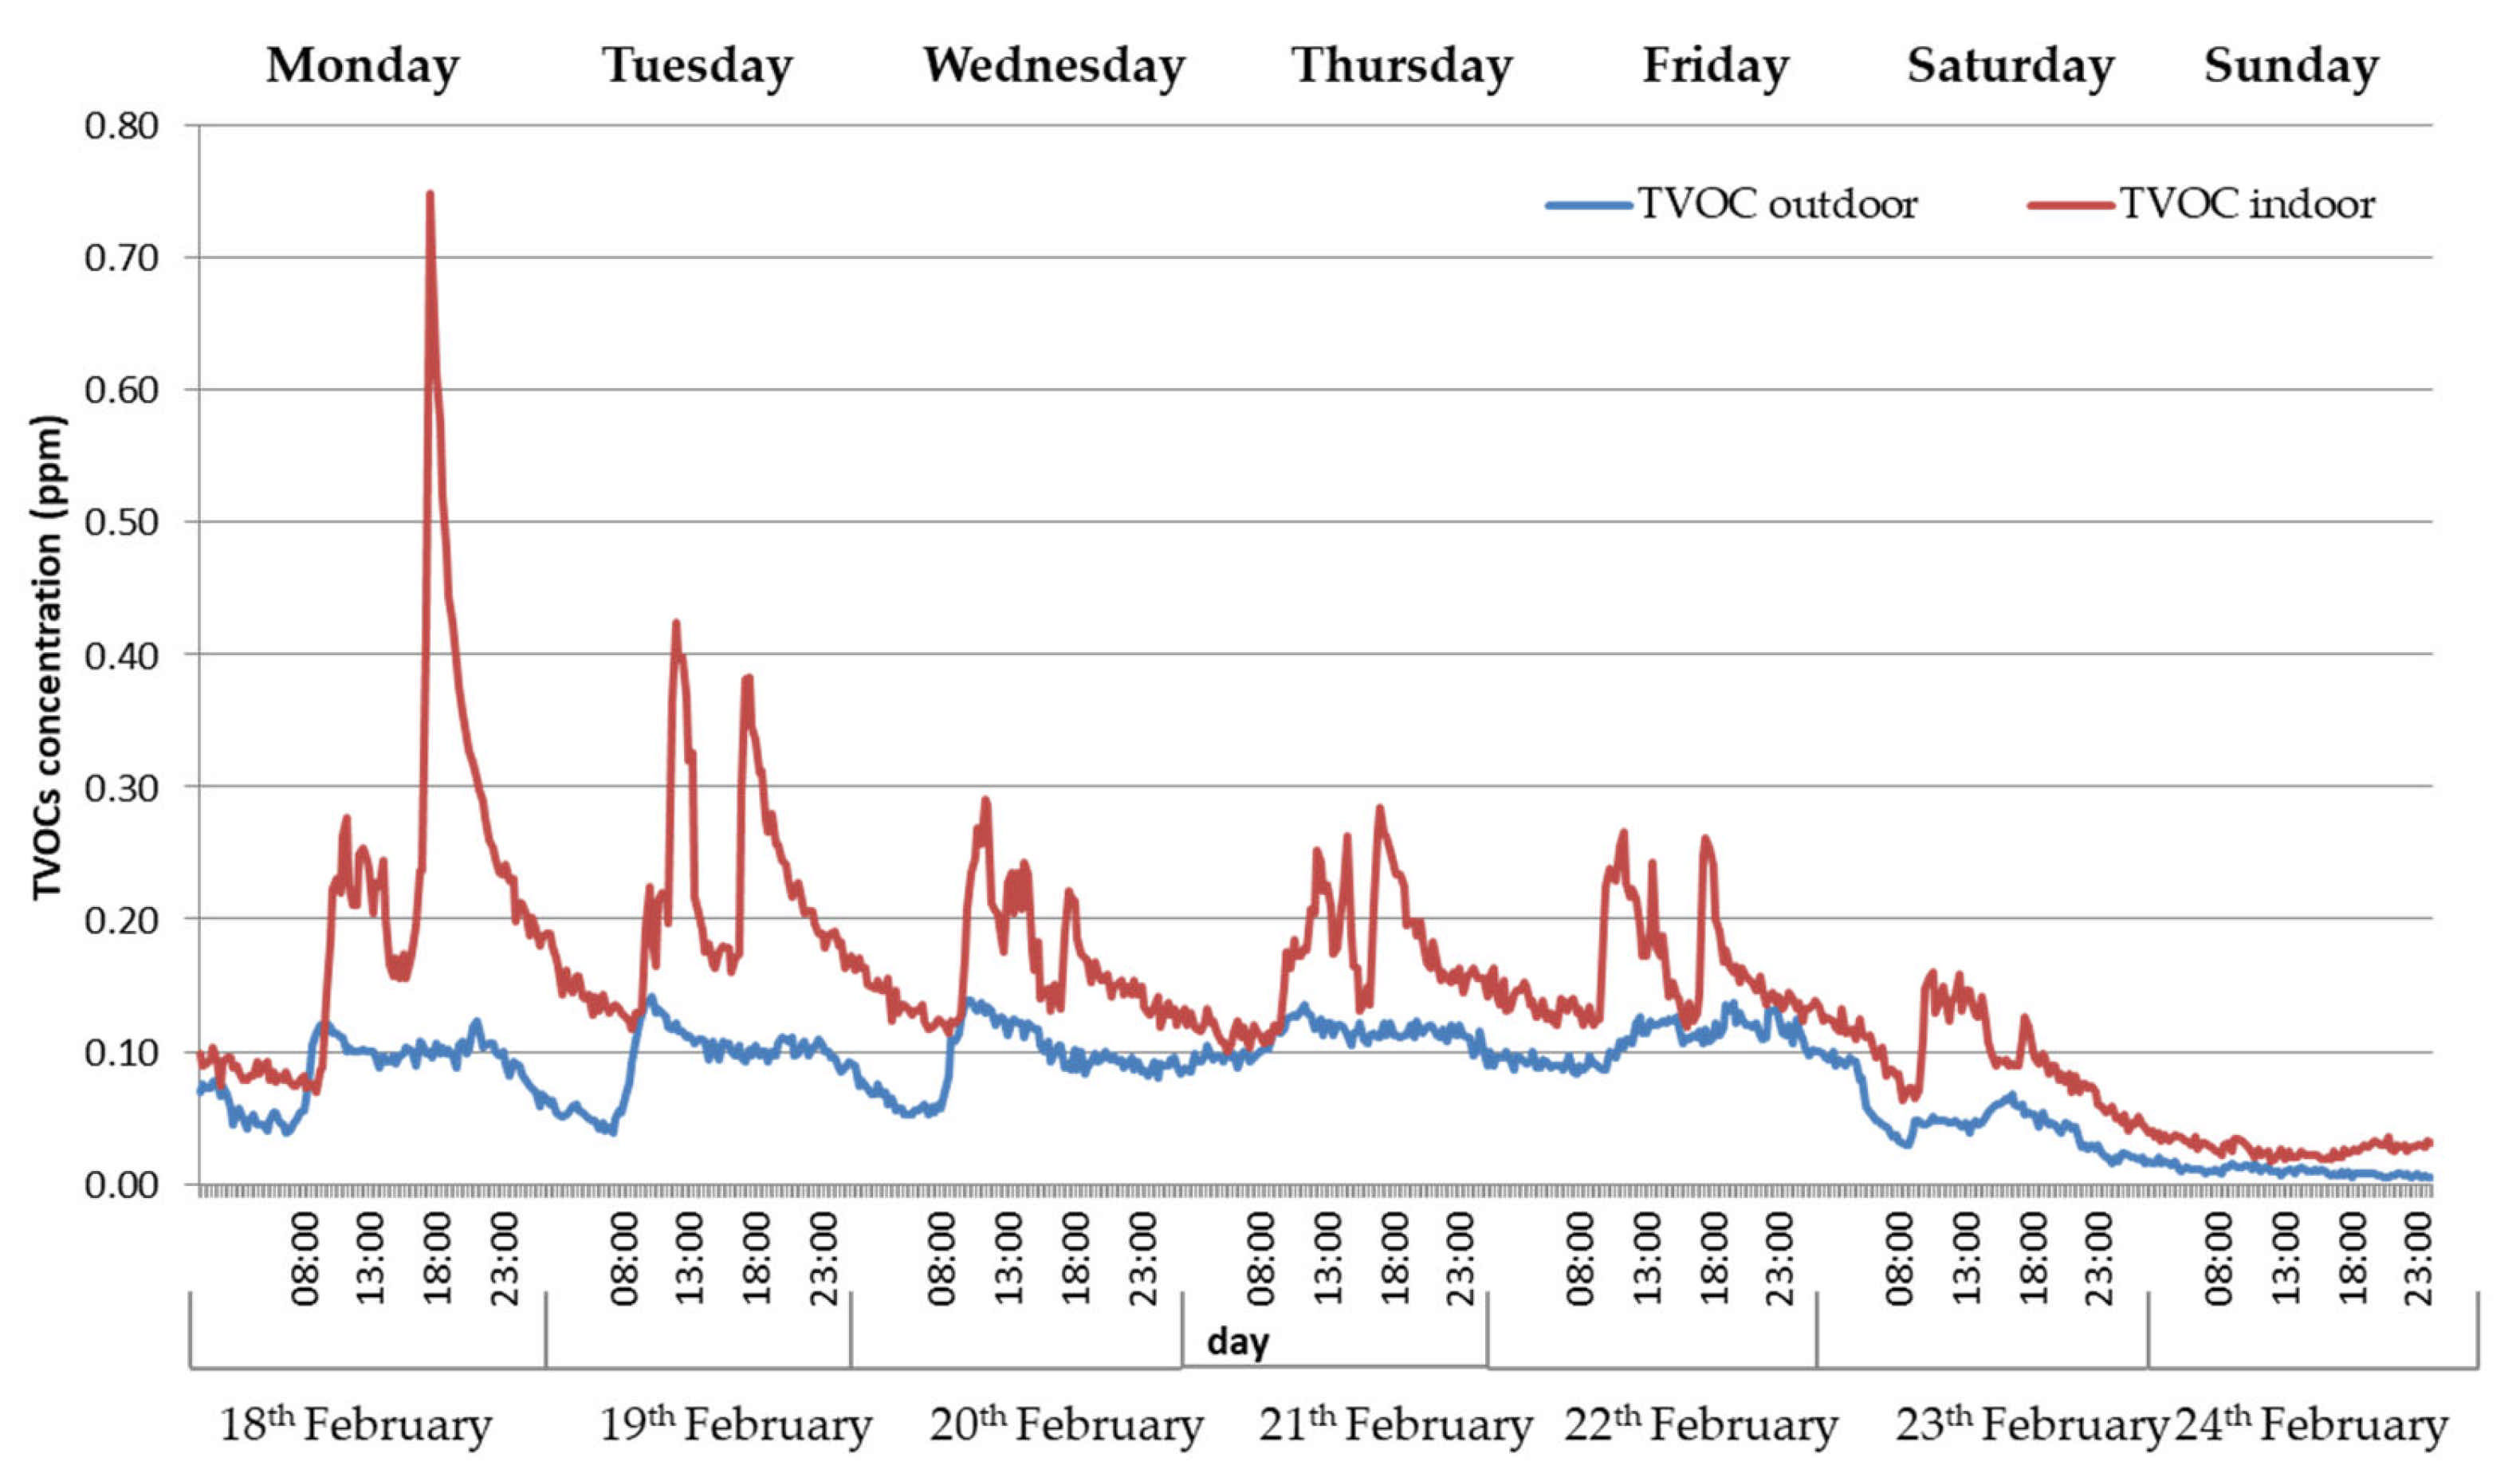
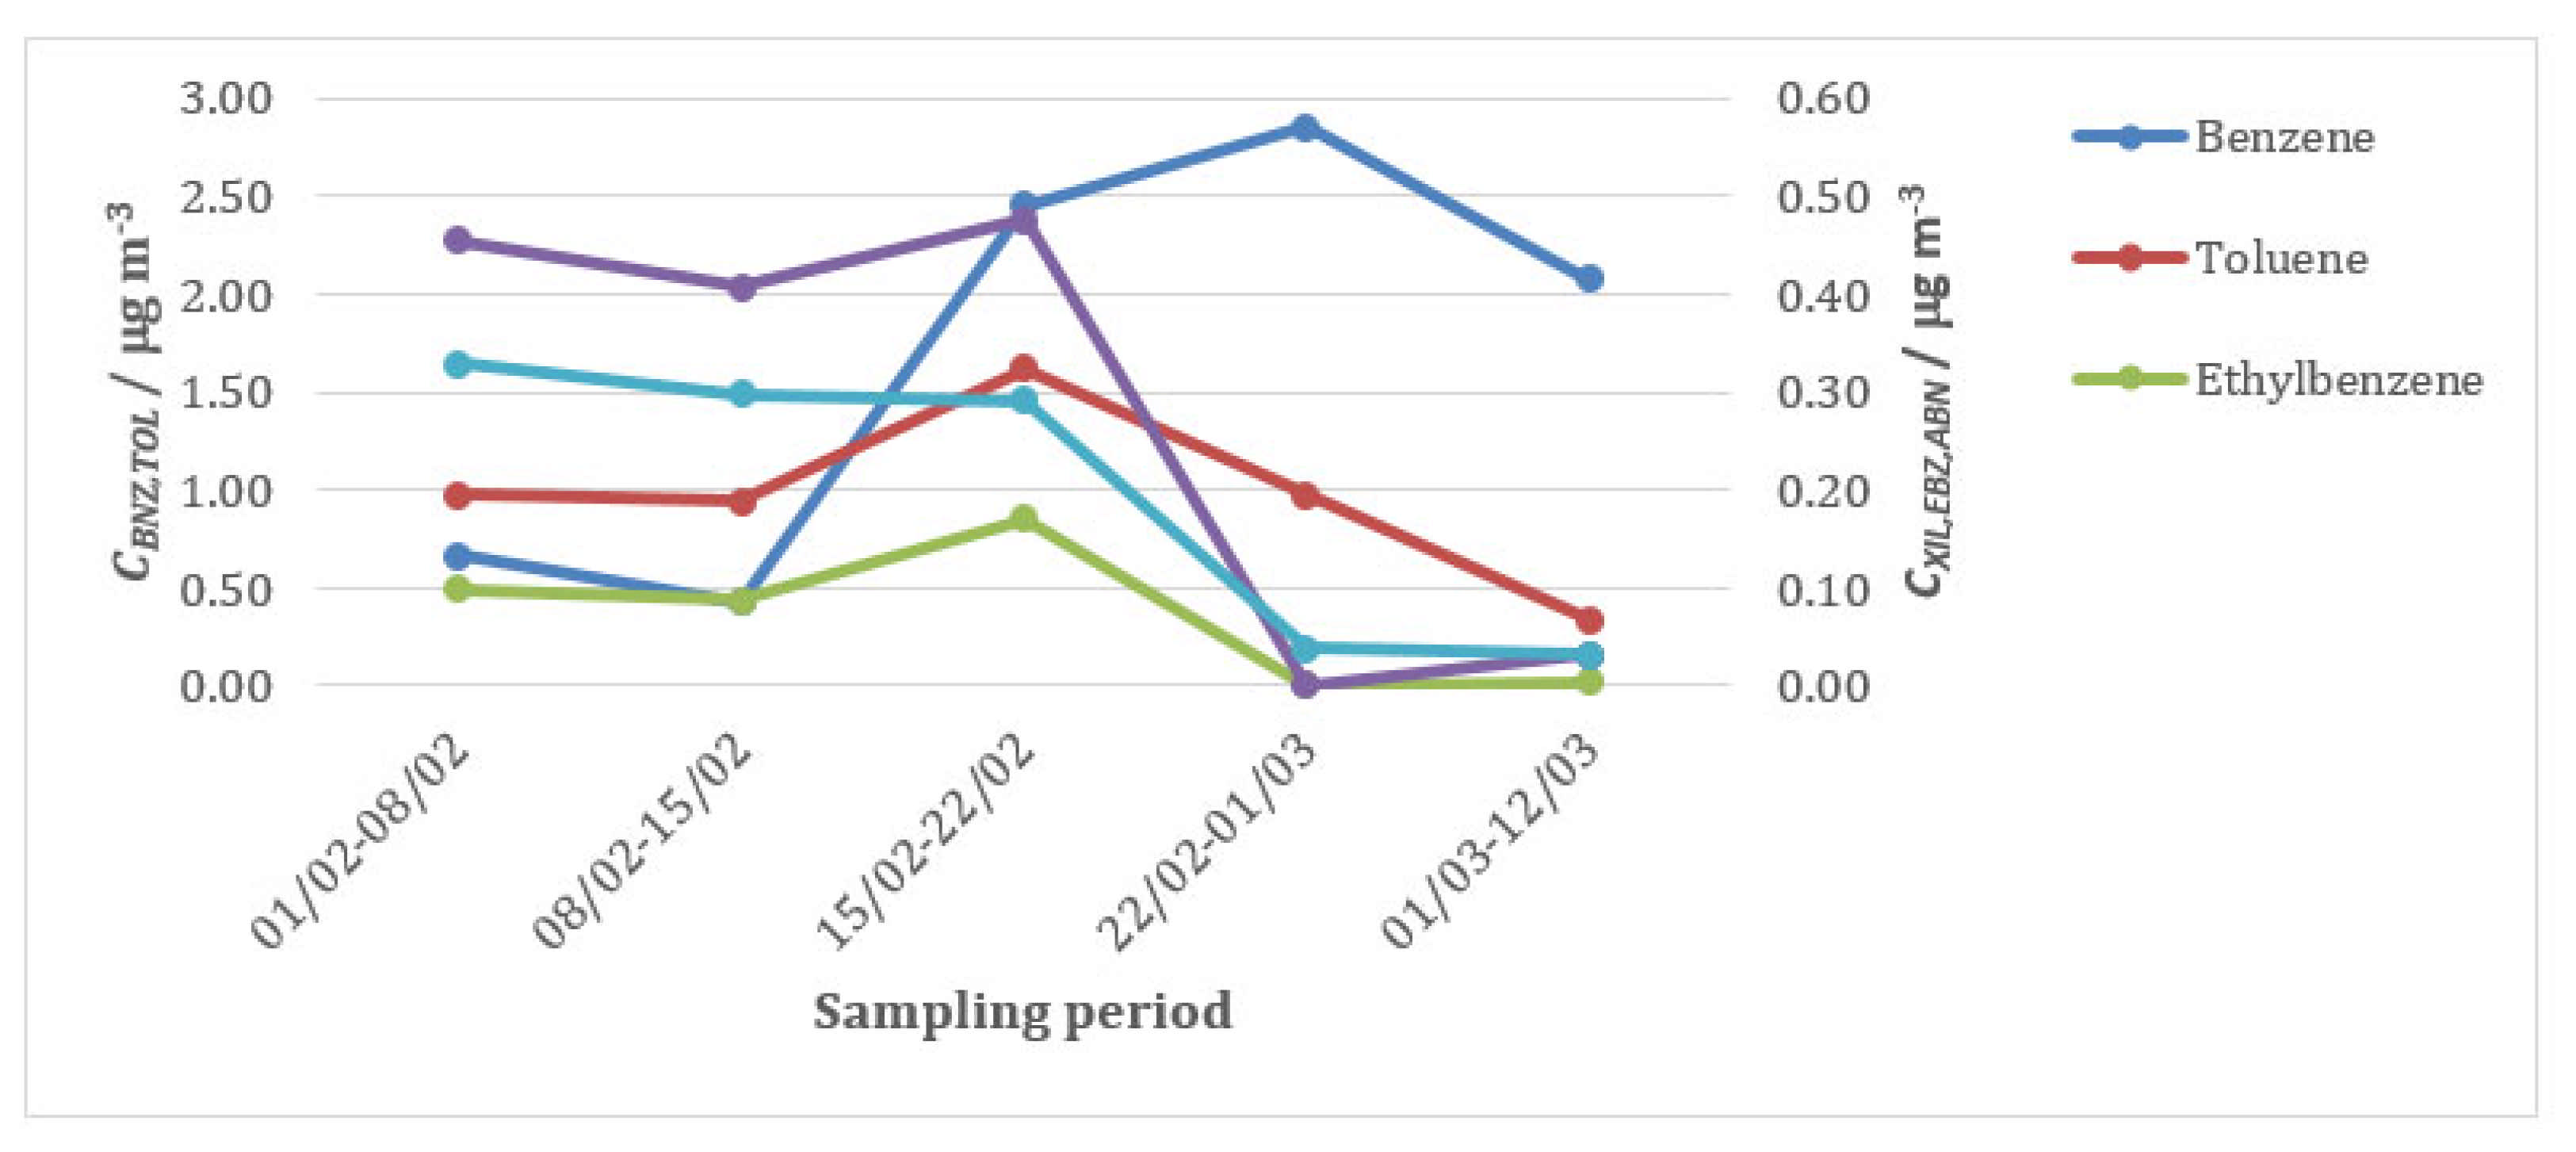
3.1. Total Volatile Organic C Concentration

The real time TVOC concentrations, monitored over the entire investigated period, both inside and outside the school, showed indoor concentrations systematically larger than outdoor ones, with a mean value of 0.10 ± 0.04 ppm for the outdoor sites and 0.14 ± 0.07 ppm for indoor, and a mean value of the I/O ratio equal to 1.41. As expected, the analysis by day of the week shows that the mean value of TVOC concentrations during school hours (0.16 ± 0.07 ppm) was higher than that calculated for Sunday (0.11 ± 0.05 ppm). Differences between indoor and outdoor profiles are shown in Figure 2, which reports, for example, the TVOC data collected from Monday 18 to Sunday 24 February. Indoor TVOC profiles showed more frequent and higher peak values (up to 0.76 ppm) with respect to the outdoor profiles. Both profiles presented a decrease on 23 and 24 February, related both to the increase of wind speed intensity in the two days (Figure S3), and to the emission reduction on Sunday. This is particularly evident in the indoor profile where no peak was registered. The daily profiles (Figure 2) show the presence of two peaks of TVOC concentrations during the morning and afternoon, not directly linked to outdoor intrusion. Moreover, considering the outdoor temperature trend shown in Figure S2, a decrease during 23 and 24 February can be observed, such as the RH trend. The higher TVOC concentrations registered through the daytime school hours were probably due to student occupancy (acrylic/tempera paints, permanent markers containing aromatic- and alkane-containing solvents and adhesive, use of perfumes and deodorants after gym activities) and poorly-ventilated classrooms in the cold investigated period. In the same way, taking into account that after-school activities were carried out on Monday and Tuesday, the highest peaks registered during these two afternoons would be due to student occupancy and activities. On the other weekdays, the afternoon TVOC peaks showed about the same duration and time slot, suggesting a link between VOC concentrations and cleaning activities.
A comparison between outdoor TVOC concentrations and NO2 (Figure S5) measured at the air quality monitoring station shows a correlation of 0.53 between the two pollutants (r = 0.53; n = 169; p = 0.03), suggesting the hypothesis that only a portion of outdoor TVOCs is attributable to vehicle-traffic emissions, which is the main source of NO2 in the examined area.

3.2. VOC Distribution in the Different School Areas Investigated and Their Temporal Variability

Table 2 shows the concentrations of toluene, ethylbenzene, and xylenes, calculated as average values over the entire monitoring period, compared to the average value reported in the literature for school environments. Moreover, for a better visualization of this comparison, the reader can observe Figure S6 in the Supplementary Materials.
The measurements show that concentrations of volatile organic compounds in the investigated school were, on average, lower than those reported in the literature for other schools [1,14,15]. It is worth noting that, for alkylbenzenes and halogen VOCs, reference values were not available. In particular, in the case of benzene, toluene, and xylenes, a comparison was made with the determinations for schools in the European Union [14]: we found that average indoor concentrations of toluene and xylenes were less than shown in the European schools, while average indoor concentration of Benzene was larger than reference levels. In the case of ethylbenzene, on the other hand, a comparison was made with an average value relating to a study carried out in Australian schools [15]. In our study, the ethylbenzene average indoor concentrations were less than values found in the Australian schools.
Furthermore, the values determined in the present study are also lower than what has been reported for the same pollutants in other places such as public buildings [16] or homes [17].
It is important to note that there are no limits or threshold values for these pollutants in indoor environments. In contrast, the average concentrations of benzene far exceed the average value of 0.98 µg/m3 reported in the literature. Despite this, it doesn’t exceed the limit of 5 µg/m3 imposed by the European Union for outdoor environments to protect health. In addition to being above the European average, benzene concentrations were higher than those of the other BTEXs, while it is worth noting that benzene is usually the lowest among the BTEXs present.
Figure 3 shows the values of all determined VOCs averaged over the entire monitoring period for the five environments studied. Benzene is always the pollutant present in the highest concentration, and the highest value was found on the balcony facing classroom 4E. Taking into account that the I/O ratio for benzene is less than 1 (see Table 3), an outdoor source can be assumed for this pollutant, as discussed further on in the text.
Alkylbenzenes show I/O ratios always around 1 for all locations, confirming their low variability. This suggests that there are no indoor sources for this class of pollutants, and that the concentrations found indoors are due to penetration from outdoors. Xylenes have higher I/O ratios for B1 and B2, i.e., the two bathrooms, and this could be related to emissions due to the use of specific cleaning products, smoking and/or cosmetics, although it is difficult to say this precisely. In Figure 4, Figure 5 and Figure 6, the trends of the different VOCs are reported for three of the examined environments (the balcony, the corresponding classroom, and one of the bathrooms) as average values calculated for each monitoring period (as reported in Table 1). It is worth noting that toluene shows the same trend both outdoors and indoors, indicating an outdoor origin. Benzene, as well as alkylbenzenes, xylenes, and ethylbenzene are characterized by different indoor trends (Figure 5) if compared to the outdoor values (Figure 4), apart from the first two periods. For site B2, different indoor trends (Figure 6) were observed with respect to classroom 4E.
Toluene/Benzene ratios (T/B) (reported in Figure 7) have been used to distinguish different sources. Many studies agree that the main outdoor sources of BTEX are industrial activities and vehicular traffic [18,19]. In particular, a ratio below 2 indicates that the pollutants mainly derive from vehicular emissions or biomass combustion, while ratios above 2 indicate the presence of contributions from sources such as industrial emissions [18]. Niu et.al. [20] state that if the B/T ratio is greater than 1 (i.e., T/B lower than 1), biomass combustion is likely to be the main source. This is also confirmed by Wang et.al. [21], who found higher benzene concentrations than toluene ones when wood burning was the main source. In general, typical T/B ratio values reported in literature studies fall in a range between 0.8 and 6 [18,19,22].
As can be seen, the T/B ratios found at locations B1, B2, and 4B are higher with respect to 4E and the outdoor site. For site 4B, for which the ratio is higher than 1, a possible contribution from outdoor traffic is plausible.
For sites B1, B2, 4E, and O4E, even if these values could be compatible, according to the literature [20], with sources such as biomass burning, some other contribution due to specific indoor sources could be present. In fact, it is very likely that the high concentrations of benzene at both locations 4E and O4E are related to emissions from cigarette smoke. This is because the balcony of classroom 4E overlooks the main atrium of the school where students gather during break periods, and cigarette smoke is, therefore, responsible for the high concentrations of benzene found. In fact, it has been shown that air concentrations of benzene from this source exceeds those of toluene, and that benzene is the VOC emitted in the highest quantities by cigarette smoke [23].

4. Conclusions

During the winter of 2019, simultaneous indoor and outdoor VOCs monitoring, carried out through Radiello passive samplers and Photo Ionization Detectors (PIDs), was performed in a secondary school of Galatina (South Italy). The results highlighted that indoor TVOC concentrations were systematically larger than those outdoors, with a mean value of the I/O ratio equal to 1.41. TVOC profiles showed a decrease with the increase of wind speeds, or during Sundays. It is plausible to assume that the higher TVOC concentrations registered throughout the daytime school hours were due to student occupancy and poorly ventilated classrooms in the cold investigated period.
Considering the VOC speciation performed by the Radiello cartridge sampling, it is possible to highlight that the average indoor concentration of toluene and xylene monitored were less than the values found in European schools as reported in the literature, while the average indoor concentration of benzene was larger. Moreover, benzene was always present in the highest concentrations in all indoor areas investigated, and the highest value was found on the balcony facing classroom 4E. Taking into account that the I/O ratio for benzene was less than 1, an outdoor source can be assumed for this pollutant. In particular, cigarette smoke is responsible for the high concentrations of benzene found, because the balcony of classroom 4E overlooks the main atrium of the school where students gather during break periods.
The results suggest some recommendations to protect the students’ health. The first measure is to encourage increasing ventilation in classrooms during school activities, and after cleaning. The second recommendation is to actively involve students in discussions regarding the use of acrylic paints, permanent markers, perfumes and deodorants, with a suggestion to limit the use of these products indoors all together. Another important recommendation would be to limit smoking activities in bathrooms, and also possibly in outdoor spaces.

Supplementary Materials

The following are available online at https://www.mdpi.com/article/10.3390/app11198870/s1, Figure S1: Planimetry of the secondary school. 4B and 4E classrooms are highlighted, Figure S2: The time series of the daily average temperature and relative humidity (RH) data from 29 January to 10 March 2019, Figure S3: The time series of the daily average wind speed (SW) data from 29 January to 10 March 2019, Figure S4: The time series of the daily average rain and air pressure data from 29 January to 10 March 2019, Figure S5: Comparison between outdoor TVOC concentrations measured on the classroom balcony and NO2 measured at the air quality monitoring station (AQ1) during the selected sampling week, Figure S6: Benzene, Toluene, Ethylbenzene and Xylene indoor (classroom 4E) mean concentration values and relative reference ones.

Author Contributions

Conceptualization, P.I. and C.M.; methodology, P.I., C.M. and P.F.; software, A.D.; validation, P.I., C.M. and P.F.; formal analysis, P.F., V.C., A.B., J.P., A.D.G., G.d.G. and A.D.; investigation, A.D.; resources, P.I. and C.M.; data curation, A.D., V.C. and A.B.; writing—original draft preparation, C.M. and A.D.; writing—review and editing, P.I. and P.F.; visualization, J.P., A.D.G. and G.d.G.; supervision, P.I., C.M. and P.F. All authors have read and agreed to the published version of the manuscript.

Funding

This research received no external funding and was performed in the frame of a collaboration activity with the secondary school ‘Liceo Scientifico e Linguistico—A- Vallone’ of Galatina.

Institutional Review Board Statement

This study was conducted according to collaboration activity with the secondary school Liceo Scientifico e Linguistico—‘A. Vallone’ and approved by the school manager (prot.9525 22/911/2018).

Informed Consent Statement

Research did not involve human subjects, human material, human tissues and human data. Monitoring activities and data collection were authorized by the prot.9525 22/911/2018 contract in accordance with school regulations.

Acknowledgments

The authors would like to acknowledge Sonia Vitaliti of Laboratorio di Prevenzione—ATS (Milan) for her scientific support.

Conflicts of Interest

The authors declare no conflict of interest.

References

  1. World Health Organization; Occupational and Environmental Health Team. WHO Air Quality Guidelines for Particulate Matter, Ozone, Nitrogen Dioxide and Sulfur Dioxide: Global Update 2005: Summary of Risk Assessment (WHO/SDE/PHE/OEH/06.02); World Health Organization: Geneva, Switzerland, 2006. [Google Scholar]
  2. Scientific Committee on Health and Environmental Risks (SCHER). Opinion on Risk Assessment on Indoor Air Quality. European Commission: Health & Consumer Protection. Directorate-General; SCHER: Brussels, Belgium, 2007; pp. 1–33. [Google Scholar]
  3. Rivas, I.; Viana, M.; Moreno, T.; Pandolfi, M.; Amato, F.; Reche, C.; Bouso, L.; Àlvarez-Pedrerol, M.; Alastuey, A.; Sunyer, J.; et al. Child exposure to indoor and outdoor air pollutants in schools in Barcelona, Spain. Environ. Int. 2014, 69, 200–212. [Google Scholar] [CrossRef] [PubMed] [Green Version]
  4. Baloch, R.M.; Maesano, C.N.; Christoffersen, J.; Banerjee, S.; Gabriel, M.; Csobod, É.; de Oliveira, F.E.; Annesi-Maesano, I. Indoor air pollution, physical and comfort parameters related to schoolchildren’s health: Data from the European SINPHONIE study. Sci. Total Environ. 2020, 739, 1–12. [Google Scholar] [CrossRef] [PubMed]
  5. Kotzias, D.; Koistinen, K.; Kephalopoulos, S.; Schlitt, C.; Carrer, P.; Maroni, M.; Jantunen, M.; Cochet, C.; Kirchner, S.; Lindvall, T.; et al. The INDEX Project Critical Appraisal of the Setting and Implementation of Indoor Exposure Limits in the EU. Final Report; European Commission, Directorate General, Joint Research Centre: Brussels, Belgium, 2005; p. 338. [Google Scholar]
  6. Dales, R.E.; Cakmak, S. Is residential ambient air limonene associated with asthma? Findings from the Canadian Health Measures Survey. Environ. Pollut. 2019, 244, 966–970. [Google Scholar] [PubMed]
  7. Huang, L.; Wei, Y.; Zhang, L.; Ma, Z.; Zhao, M. Estimates of emission strengths of 43 VOCs in wintertime residential indoor environments, Beijing. Sci. Total Environ. 2021, 793, 148623. [Google Scholar] [CrossRef] [PubMed]
  8. Becker, P.N.; Calesso, T.E.; Agudelo-Castaneda, D.M.; da Silva, C.M.; Oliveira Silva, L.F.; Vigo, A.; Kumar, P. Indoor-outdoor relationships of airborne nanoparticles, BC and VOCs at rural and urban preschools. Environ. Pollut. 2021, 268, 115751. [Google Scholar]
  9. De Lima, B.D.; Kautzmann, R.M.; da Silveira, F.R.; da Silva, C.M.; de Vargas, F.C.; Taffarel, S.R. Quantitative evaluation of total volatile organic compounds in urban and rural schools of southern Brazil. Environ. Monit. Assess. 2020, 192, 634. [Google Scholar] [CrossRef] [PubMed]
  10. La Vecchia, R.; Migili, L.; Benvenuti, A.; Balocchini, E.; Bianchimani, V.; Cercenà, P.; Arpea, C.; Cassinelli, C.; Sciarra, G.; Pinto, I.; et al. Progetto Toscano Indoor su Inquinanti Fisici e Chimici Nelle Scuole: Risultati e Considerazioni Epidemiologiche. Available online: https://www.researchgate.net/publication/26514239 (accessed on 16 September 2021).
  11. Marzocca, A.; Di Gilio, A.; Farella, G.; Giua, R.; de Gennaro, G. Indoor Air Quality Assessment and Study of Different VOC Contributions within a School in Taranto City, South of Italy. Environments 2017, 4, 23. [Google Scholar] [CrossRef]
  12. Vassura, I.; Venturini, E.; Bernardi, E.; Passarini, F.; Settimo, G. Assessment of indoor pollution in a school environment through both passive and continuous samplings. Environ. Eng. Manag. J. 2015, 14, 1761–1770. [Google Scholar]
  13. Idolo, A.; Grassi, T.; Bagordo, F.; Panico, A.; De Giorgi, M.; Serio, F.; Guido, M.; Piscitelli, P.; De Filippis, G.; Raho, A.; et al. Micronuclei in Exfoliated Buccal Cells of Children Living in a Cluster Area of Salento (Southern Italy) with a High Incidence of Lung Cancer: The IMP. AIR Study. Int. J. Environ. Res. Public Health 2018, 15, 1659. [Google Scholar] [CrossRef] [PubMed] [Green Version]
  14. Sarigiannis, D.A.; Karakitsios, S.P.; Gotti, A.; Liakos, I.L.; Katsoyiannis, A. Exposure to major volatile organic compounds and carbonyls in European indoor environments and associated health risk. Environ. Int. 2011, 37, 743–765. [Google Scholar] [CrossRef] [PubMed]
  15. Goodman, N.B.; Steinemann, A.; Wheeler, A.J.; Paevere, P.J.; Cheng, M.; Brown, S.K. Volatile organic compounds within indoor environments in Australia. Build. Environ. 2017, 122, 116–125. [Google Scholar] [CrossRef]
  16. Kotzias, D.; Geiss, O.; Tirendi, S. Valutazione dell’esposizione totale a benzene e formaldeide nei paesi europei. Epidemiol. Prev. 2005, 29, 17–21. [Google Scholar] [PubMed]
  17. Bertoni, G.; Tappa, R.; Ciuchini, C. Evaluation of indoor BTX in an outskirt zone of Rome (Italy). Ann. Chim. 2003, 93, 27–33. [Google Scholar] [PubMed]
  18. Zhang, D.; He, B.; Yuan, M.; Yu, S.; Yin, S.; Zhang, R. Characteristics, sources and health risks assessment of VOCs in Zhengzhou, China during haze pollution season. J. Environ. Sci. 2021, 108, 44–57. [Google Scholar] [CrossRef] [PubMed]
  19. Ceron-Breton, J.G.; Bretón, R.M.C.; Kahl, J.D.; Rico, G.S.; Lozada, S.E.C.; Fuentes, M.D.; Chi, M.P.U. Concentrations, sources, and health risk associated with exposure to BTEX at ten sites located in an urban-industrial area in the Bajio Region, Mexico. Air. Qual. Atmos. Health 2021, 14, 741–761. [Google Scholar] [CrossRef]
  20. Niu, Z.-Z.; Kong, S.-F.; Yan, Q.; Zheng, S.-R.; Zheng, H.; Zeng, X.; Yao, L.-Q.; Wu, J.; Zhang, Y.; Wu, F.-Q.; et al. Profile Characteristics of VOCs from Wood and Economic Crop Burning. Environm. Sci. 2020, 41, 1107–1115. [Google Scholar]
  21. Wang, H.; Lou, S.; Huang, C.; Qiao, L.; Tang, X.; Chen, C.; Zeng, L.; Wang, Q.; Zhou, M.; Lu, S.; et al. Source Profiles of Volatile Organic Compounds from Biomass Burning in Yangtze River Delta, China. Aerosol Air Qual. Res. 2014, 14, 818–882. [Google Scholar] [CrossRef] [Green Version]
  22. Cincinelli, A.; Martellini, T.; Amore, A.; Dei, L.; Marrazza, G.; Carretti, E.; Belosi, F.; Ravegnani, F.; Leva, P. Measurement of volatile organic compounds (VOCs) in libraries and archives in Florence (Italy). Sci. Total Environ. 2016, 572, 333–339. [Google Scholar] [CrossRef] [PubMed]
  23. Gilli, G.; Scursatone, E.; Bono, R. Benzene, toluene and xylenes in air, geographical distribution in the Piedmont region (Italy) and personal exposure. Sci. Total Environ. 1994, 148, 49–56. [Google Scholar] [CrossRef]
Figure 1. Area of study.
Applsci 11 08870 g001
Figure 2. Indoor and outdoor TVOCs concentration profiles over the period 18–24 February (classroom 4E and its balcony, respectively).
Applsci 11 08870 g002
Figure 3. Benzene, Toluene, Ethylbenzene, Xylene, and Alkylbenzenes indoor mean concentration values over the entire monitoring period in the different school areas investigated. B1 indicates the male bathroom site, B2 the female bathroom site, 4B the classroom 4B, 4E classroom 4E, and O4E the external balcony outside classroom 4E.
Applsci 11 08870 g003
Figure 4. Mean VOC concentration for each sampling period on site O4E (balcony of classroom 4E).
Applsci 11 08870 g004
Figure 5. Mean VOC concentration values for each sampling period on site 4E (classroom 4E).
Applsci 11 08870 g005
Figure 6. Mean VOC concentration values for each sampling period on site B2.
Applsci 11 08870 g006
Figure 7. Toluene/Benzene ratio in the monitored school areas. B1, indicates the male bathroom site; B2, the female bathroom site; 4B, classroom 4B; 4E, classroom 4E; and O4E, the external balcony of classroom 4E.
Applsci 11 08870 g007
Table 1. Sampling time schedule in the different school places: B1 (male bathroom), B2 (female bathroom), 4B (classroom 4B), 4E (classroom 4E), and O4E (external balcony classroom 4E).
Sampling PeriodVOC SamplingTVOC Sampling
SiteSiteSiteSiteSiteSiteSite
1–5 February 2019B1B24B4EO4E4EO4E
5–8 February 2019B1B24B4EO4E4EO4E
8–12 February 2019B1B2-4EO4E4EO4E
12–15 February 2019B1B2-4EO4E4EO4E
15–19 February 2019B1B2-4EO4E4EO4E
19–22 February 2019-B2-4EO4E4EO4E
22–26 February 2019-B2-4EO4E4EO4E
26 February–1 March 2019-B2-4EO4E--
1–5 March 2019-B2-4EO4E--
5–12 March 2019-B2-4EO4E--
Table 2. Indoor average concentration and reference values for main VOCs investigated.
VOCCaverage, indoor Galatina (µg m−3)Standard Deviation ± (µg m−3)C reference (µg m−3)
Toluene0.810.094.44 1
Ethylbenzene0.080.023.00 2
Alkylbenzenes0.290.09-
Xylenes0.180.042.64 1
Halogen VOCs<0.1--
Benzene1.940.470.98 1
1 Sarigiannis et.al., 2011. 2 Goodman et.al., 2016.
Table 3. Benzene, Toluene, Ethylbenzene, Alkylbenzenes, and Xylene indoor and outdoor mean concentration values.
VOCCaverage Indoor (µg m−3)Caverage Outdoor (µg m−3)I/O
Benzene1.943.230.60
Toluene0.810.531.52
Ethylbenzene0.080.032.67
Alkylbenzenes0.290.281.04
Xylene0.180.053.60
Publisher’s Note: MDPI stays neutral with regard to jurisdictional claims in published maps and institutional affiliations.

