
Indoor and Outdoor Performance of an Enhanced Photovoltaic Panel through Graphene/Fins/Phase Change Materials


Abstract
:1. Introduction
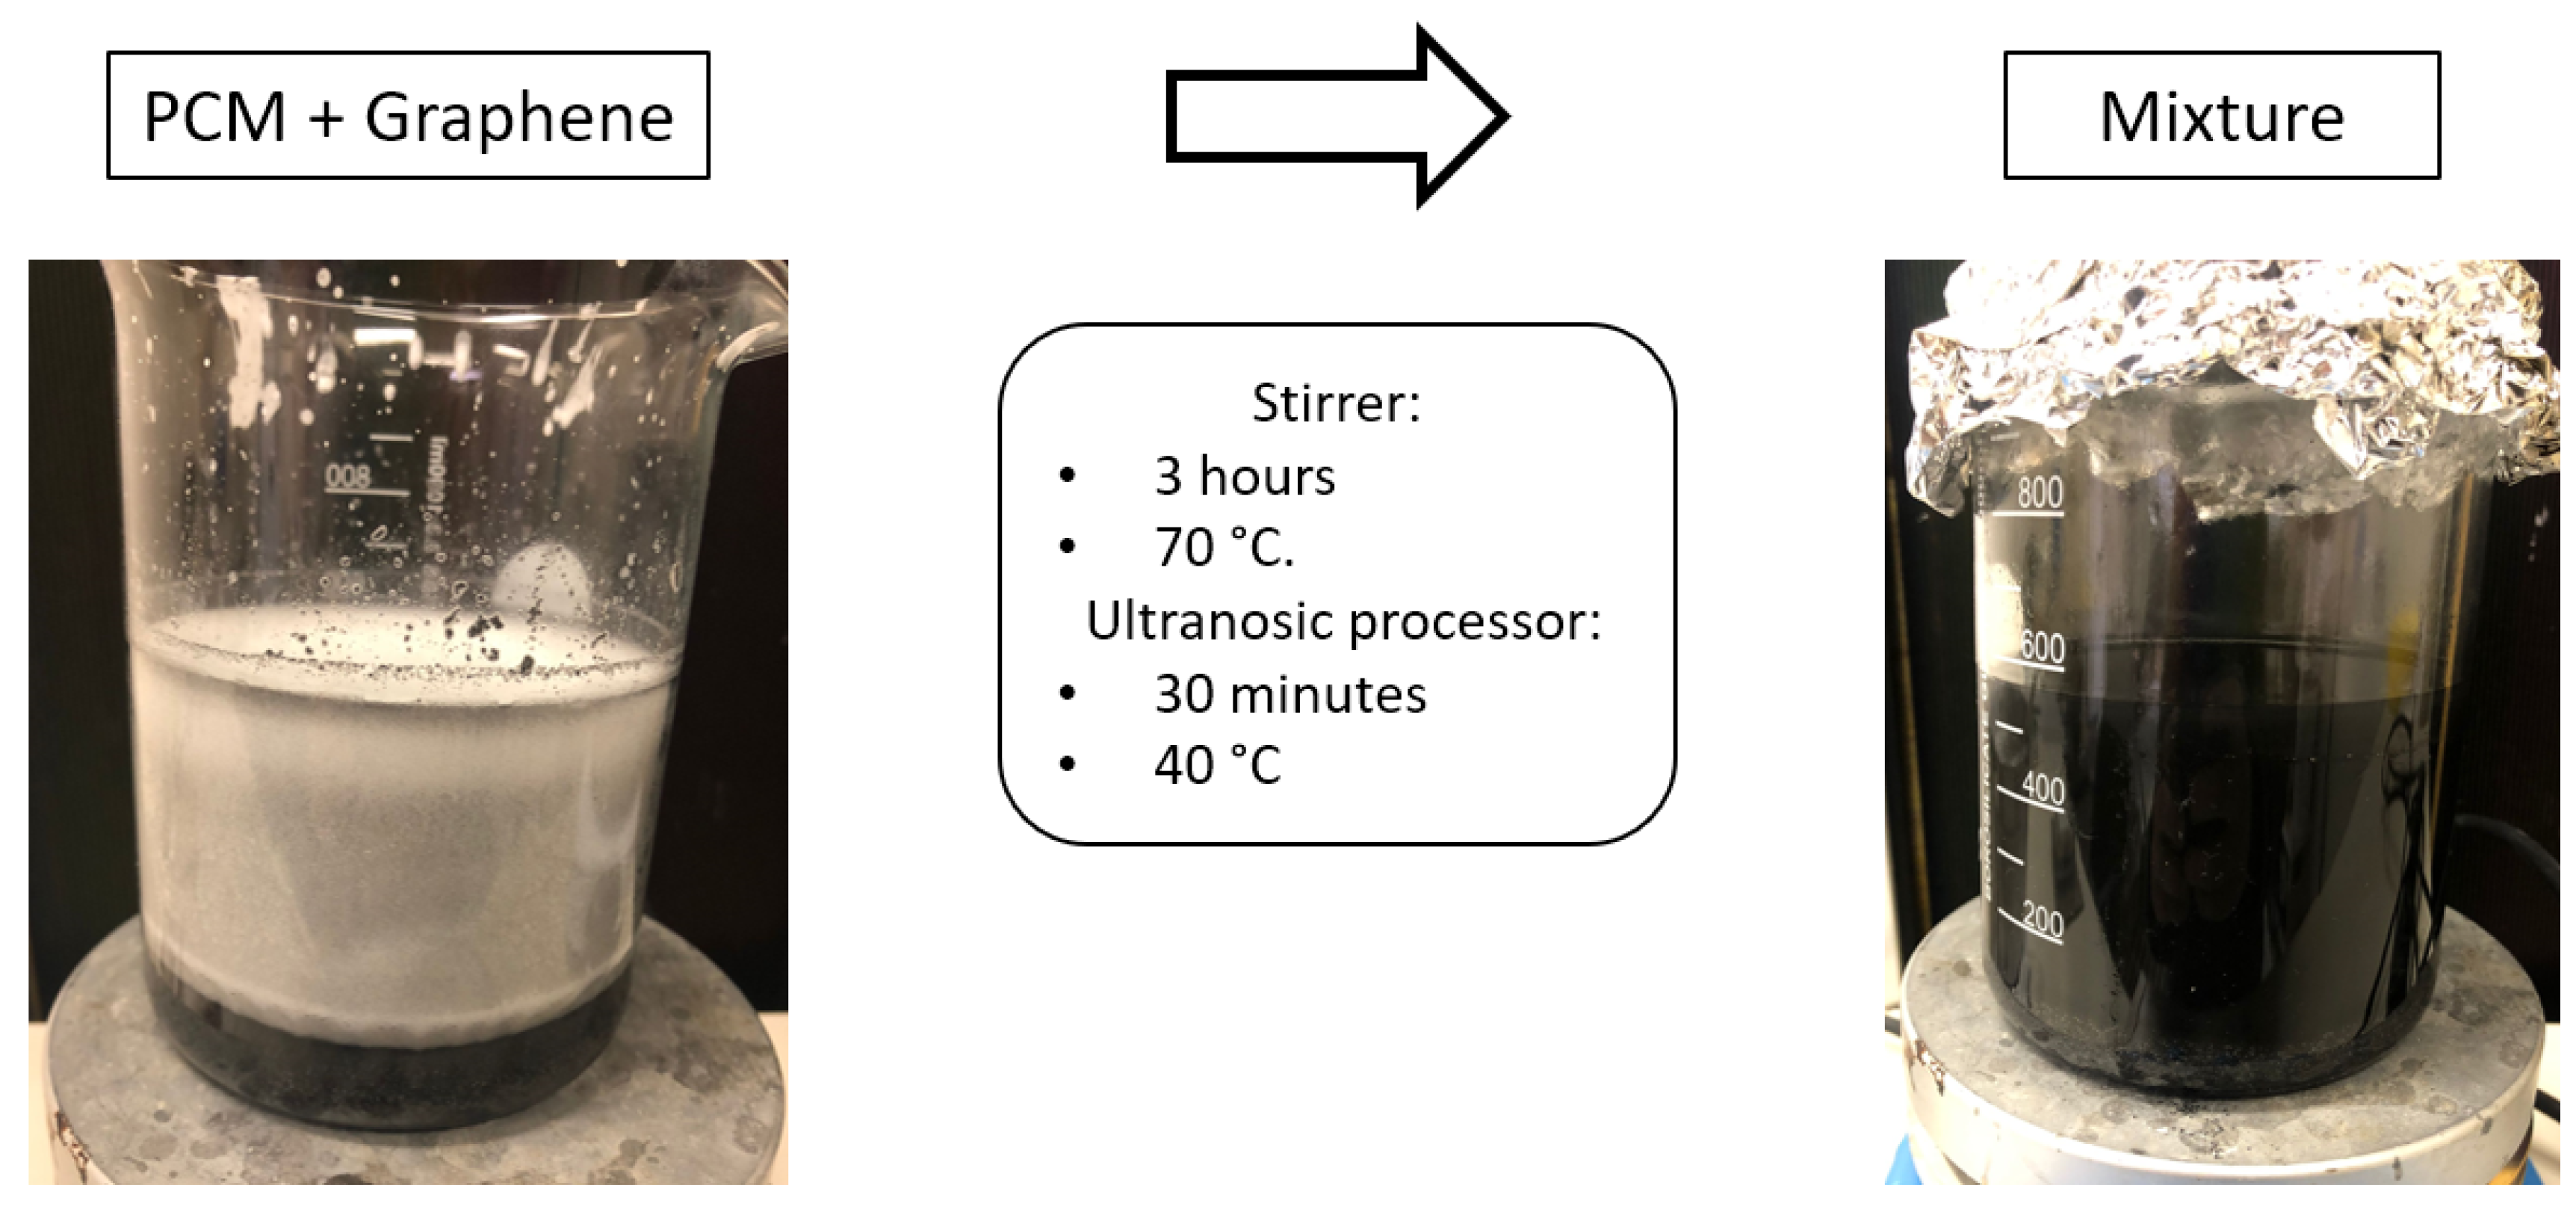
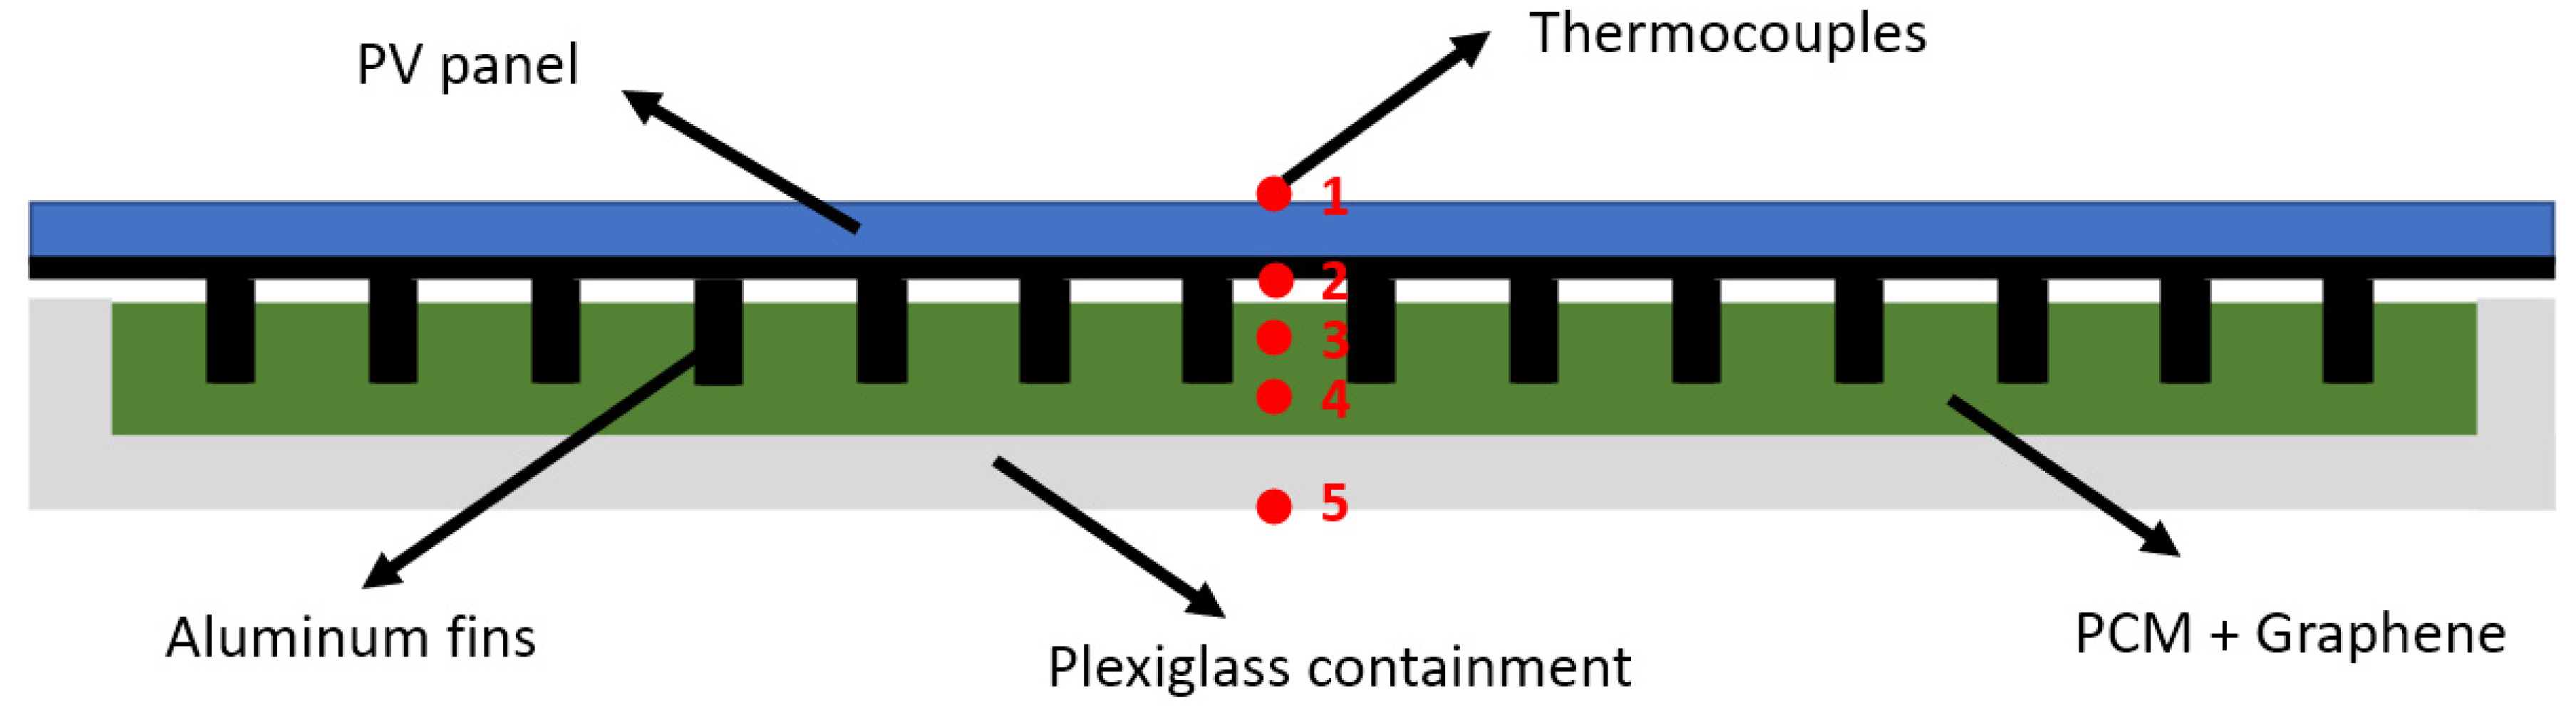
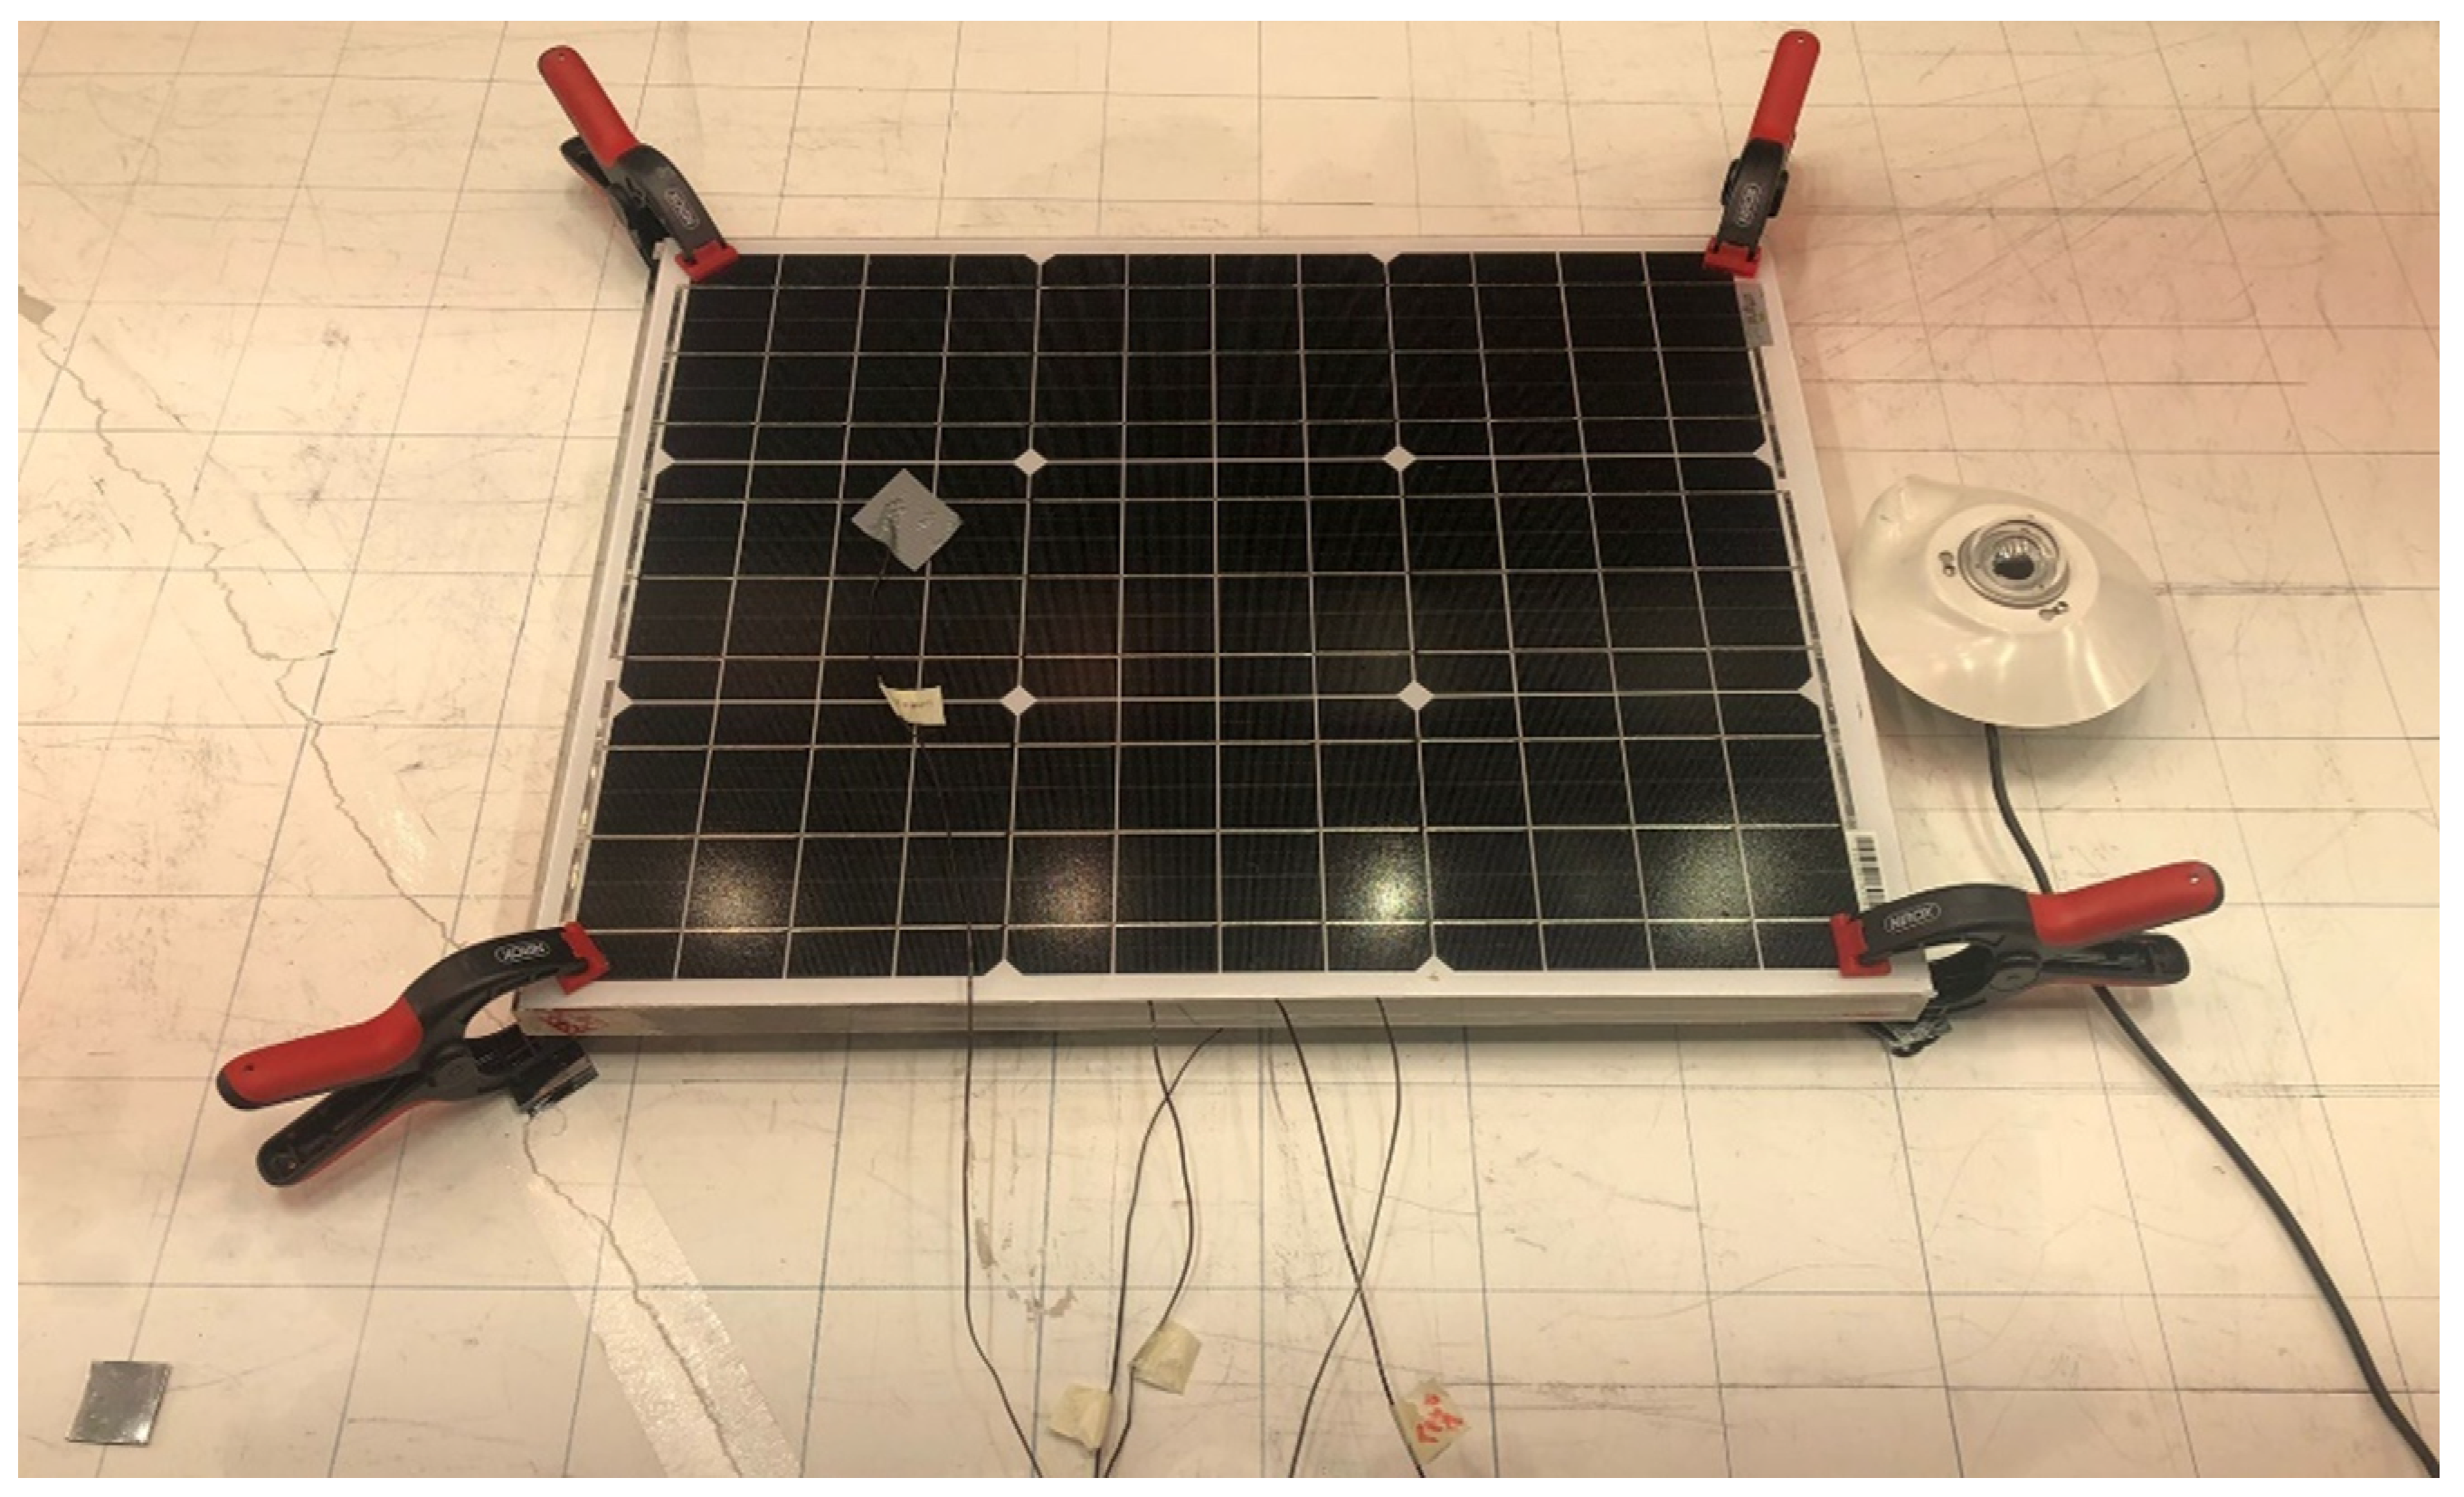
2. Materials and Methods
3. Results and Discussions
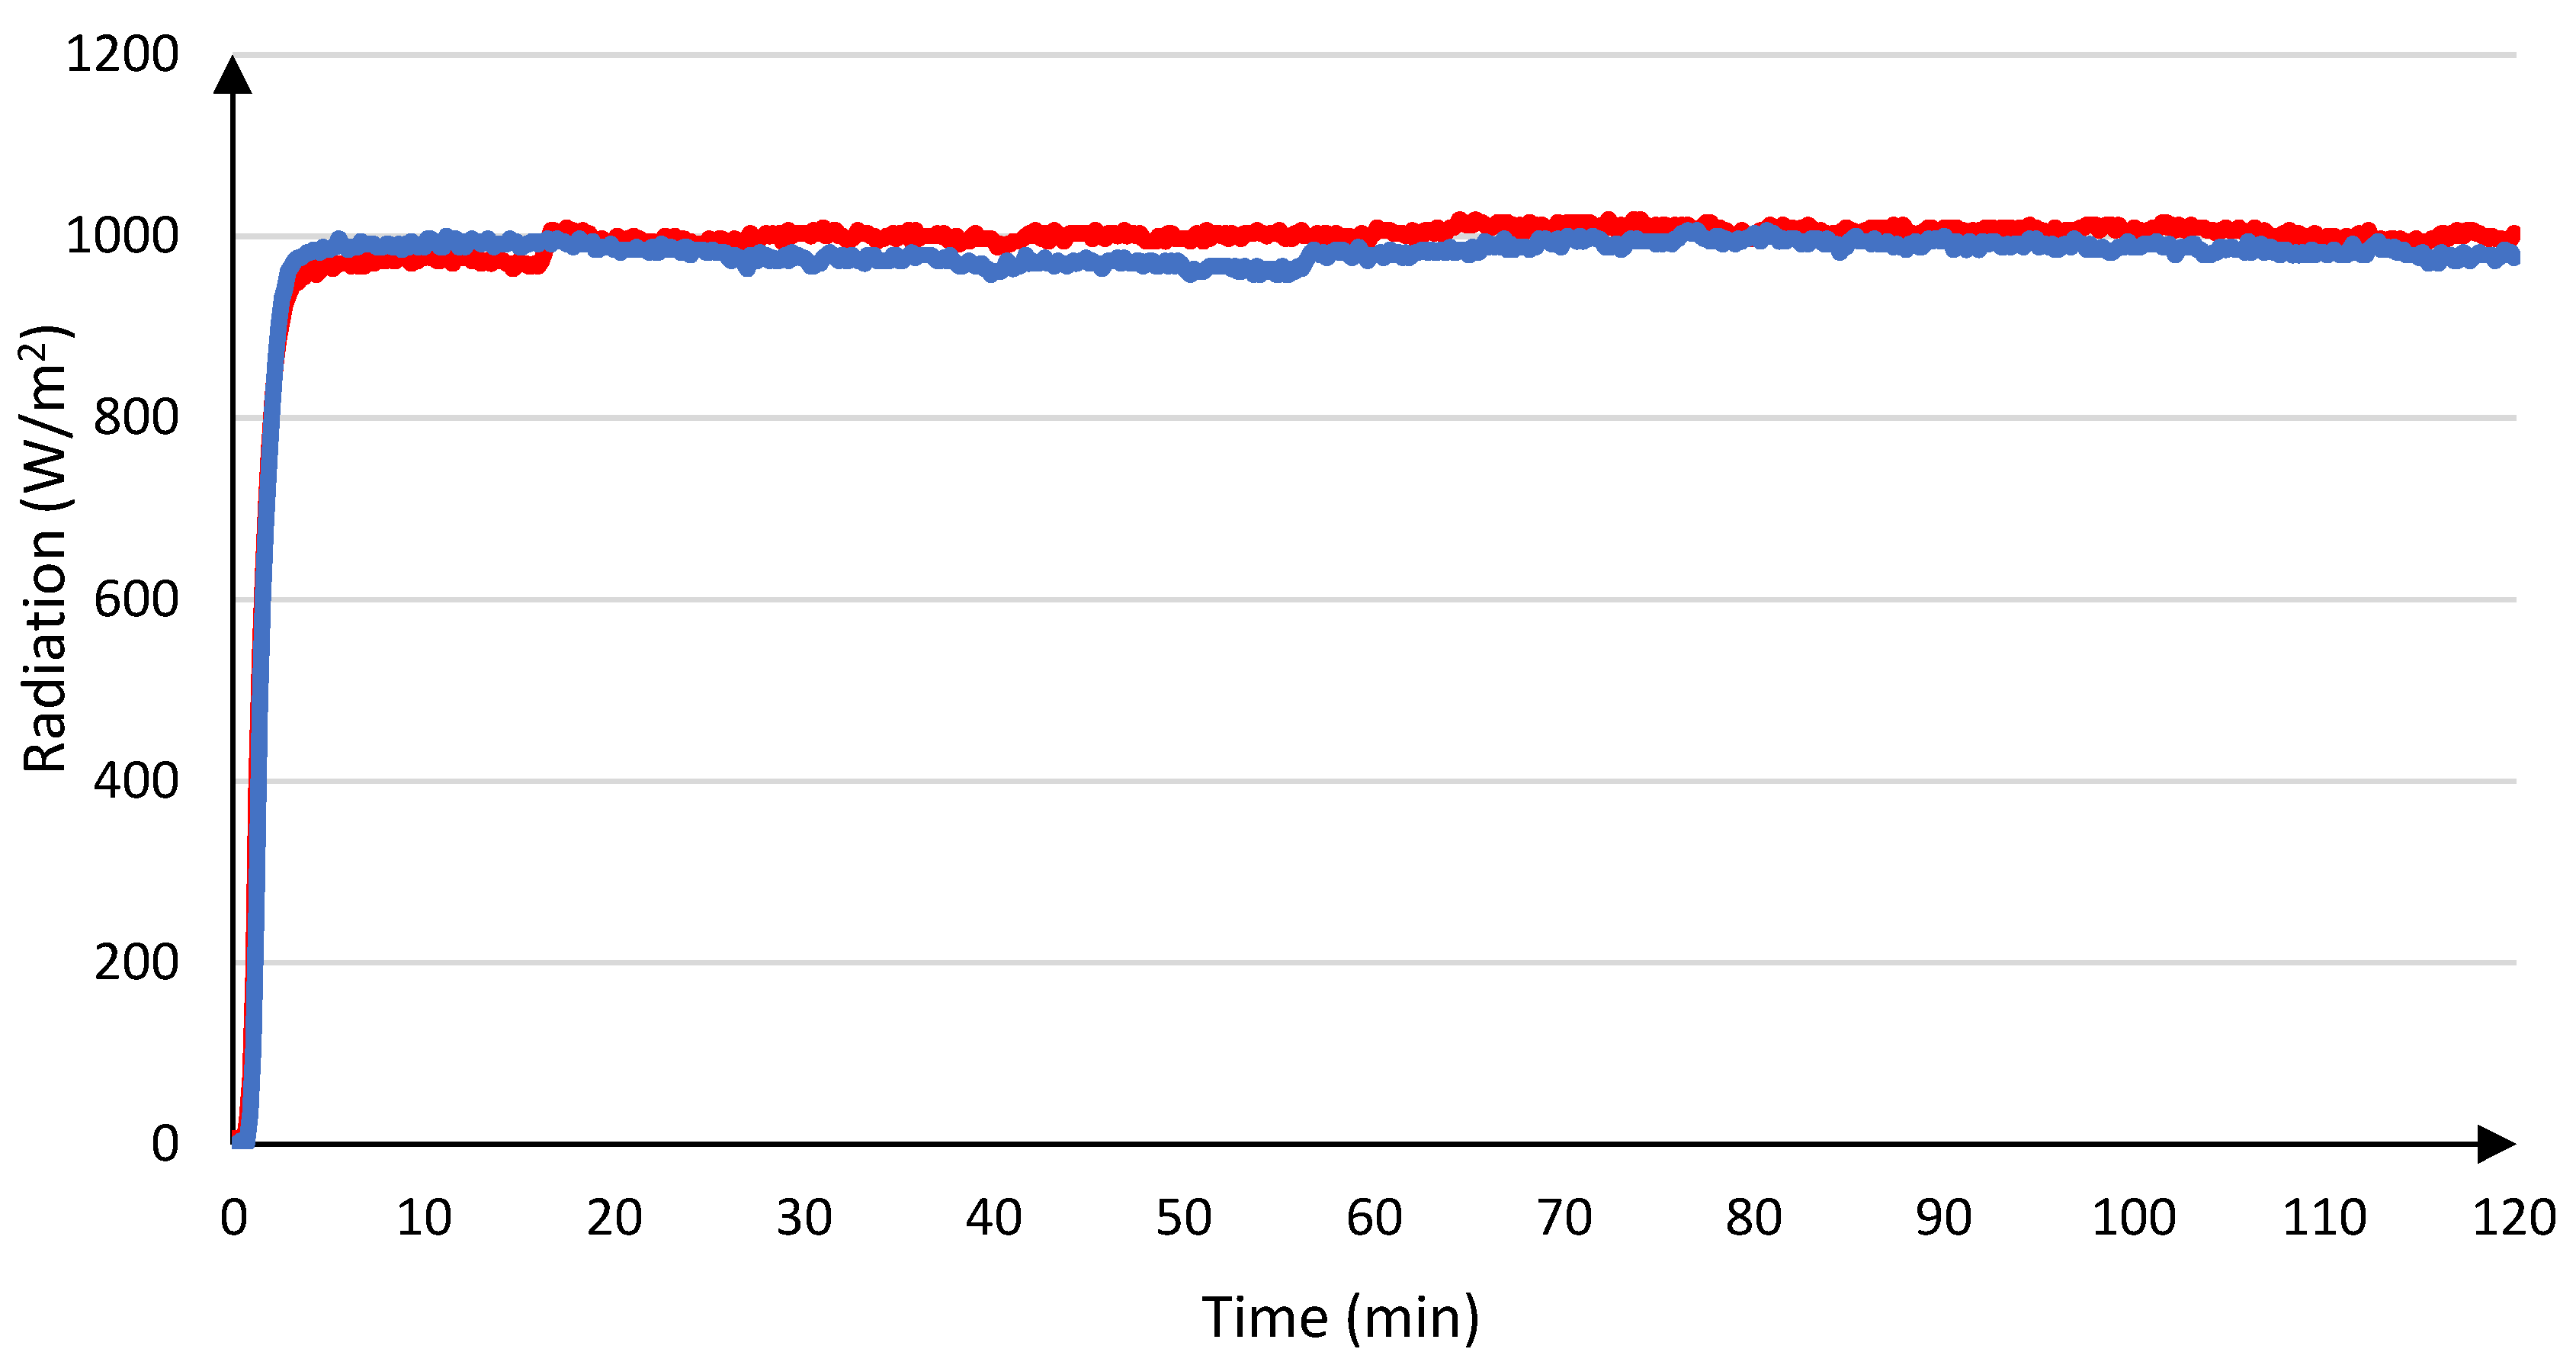
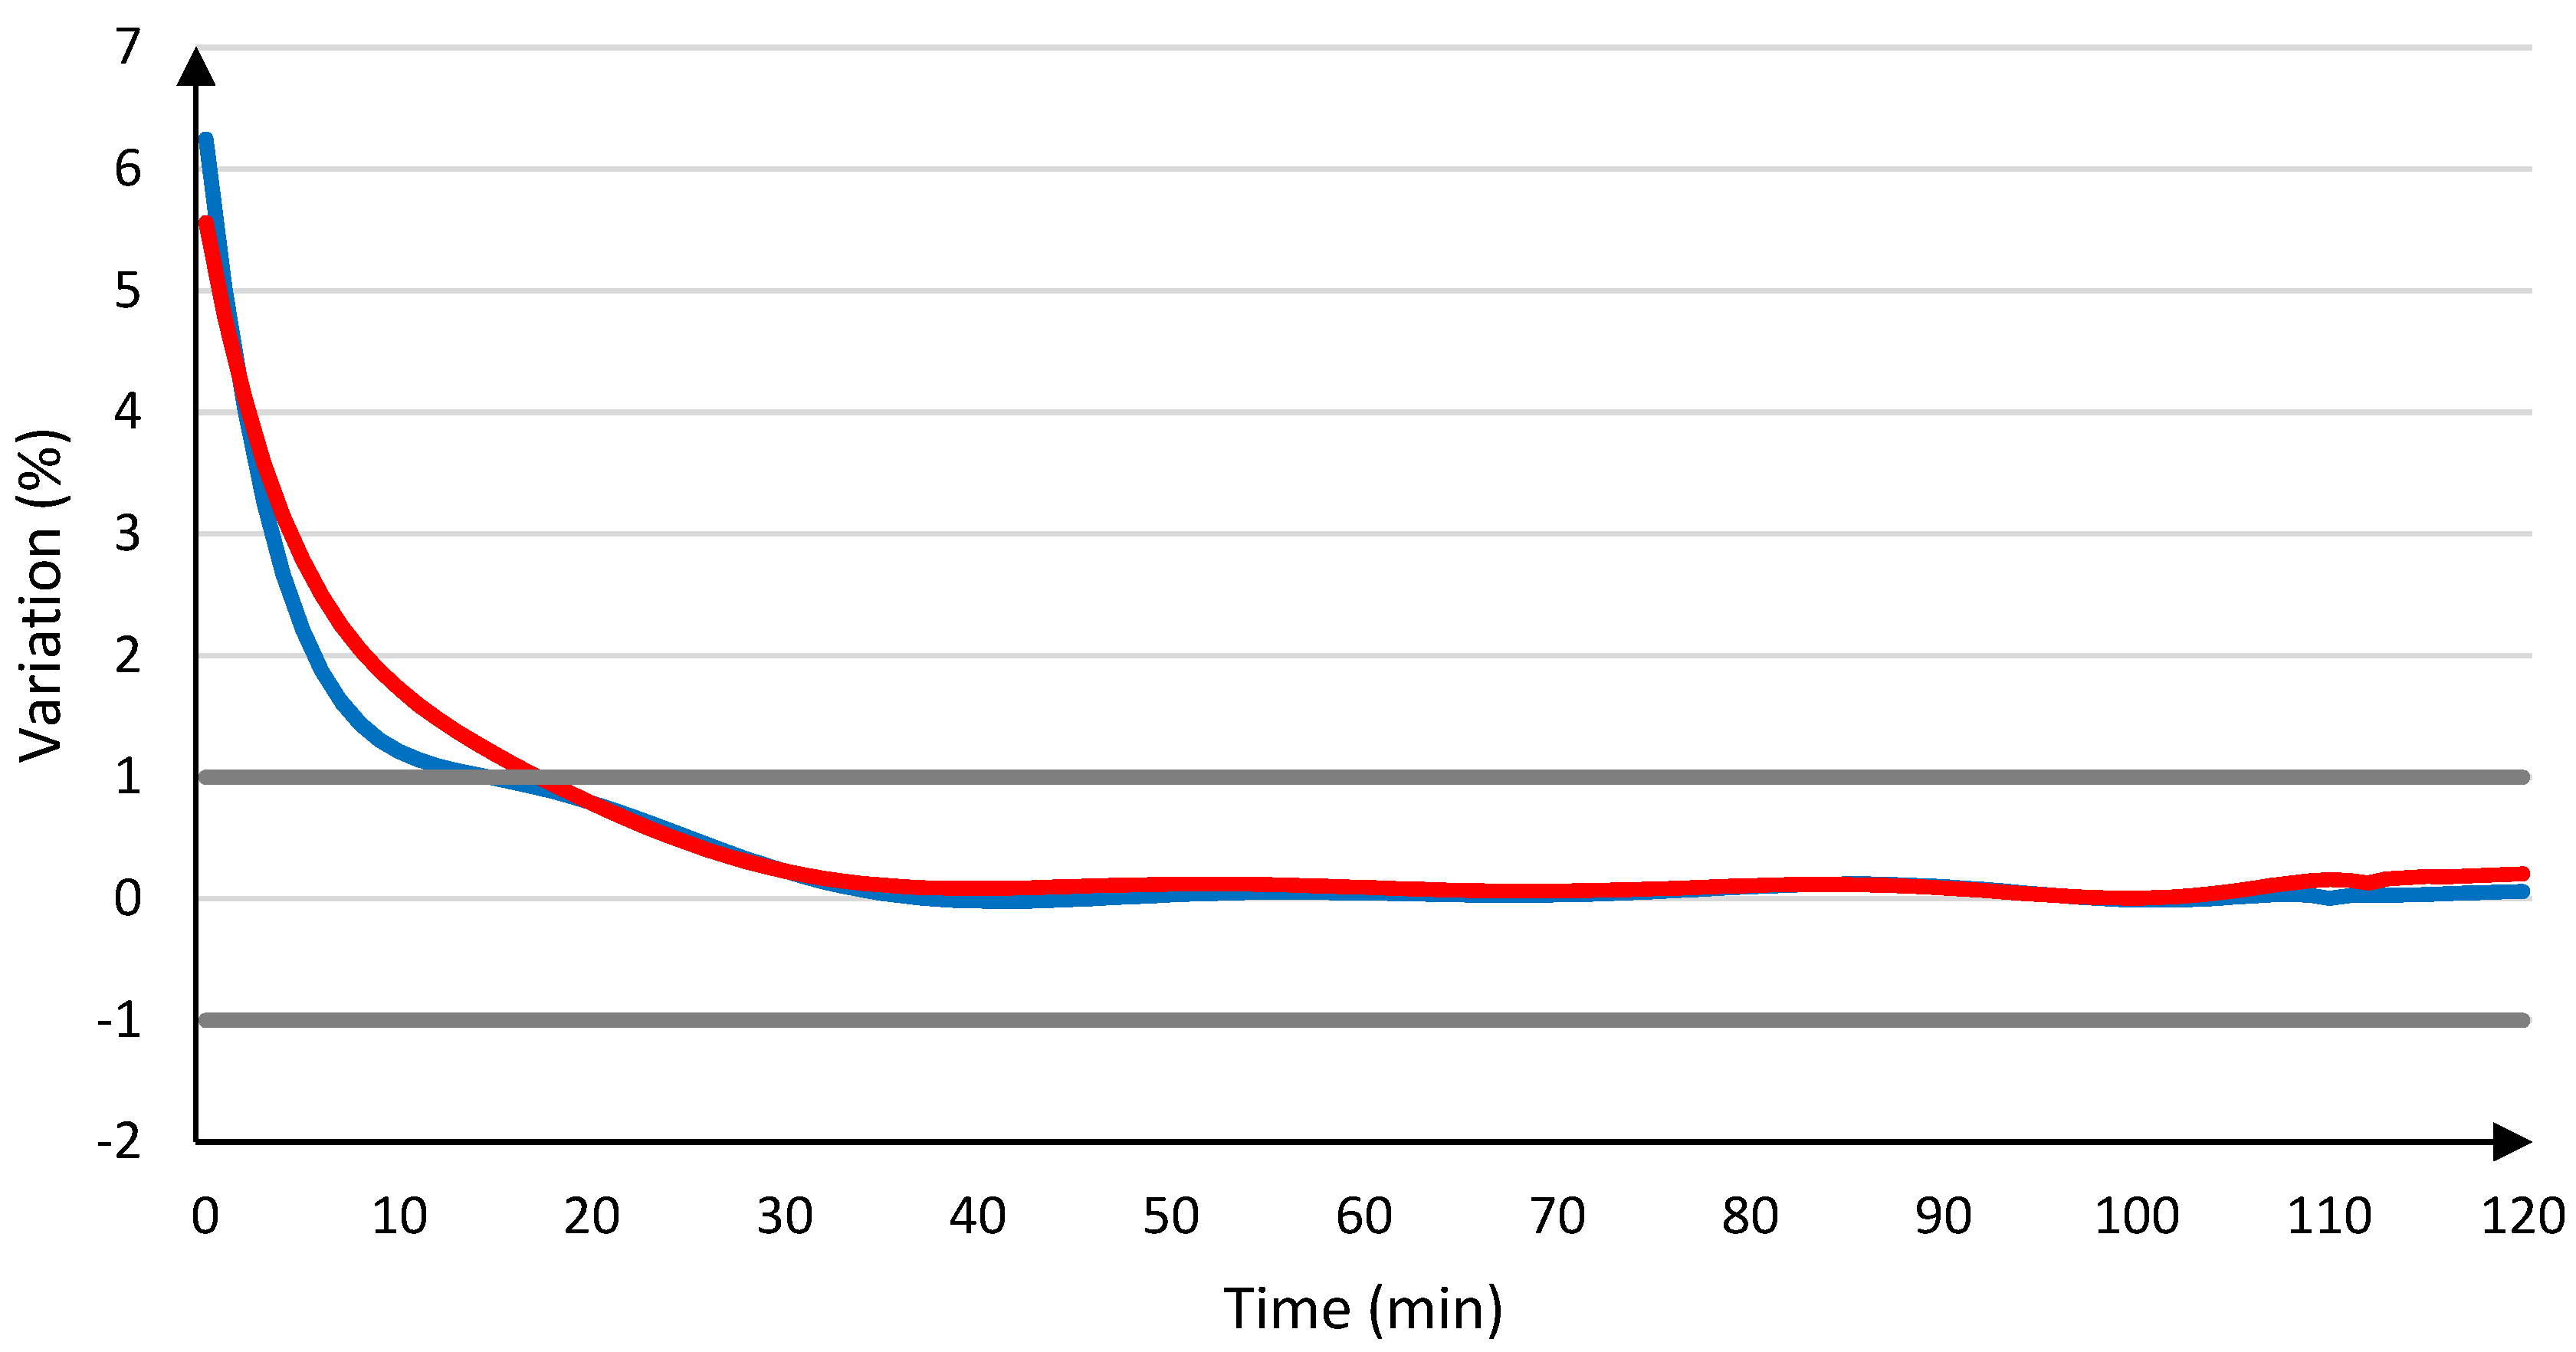
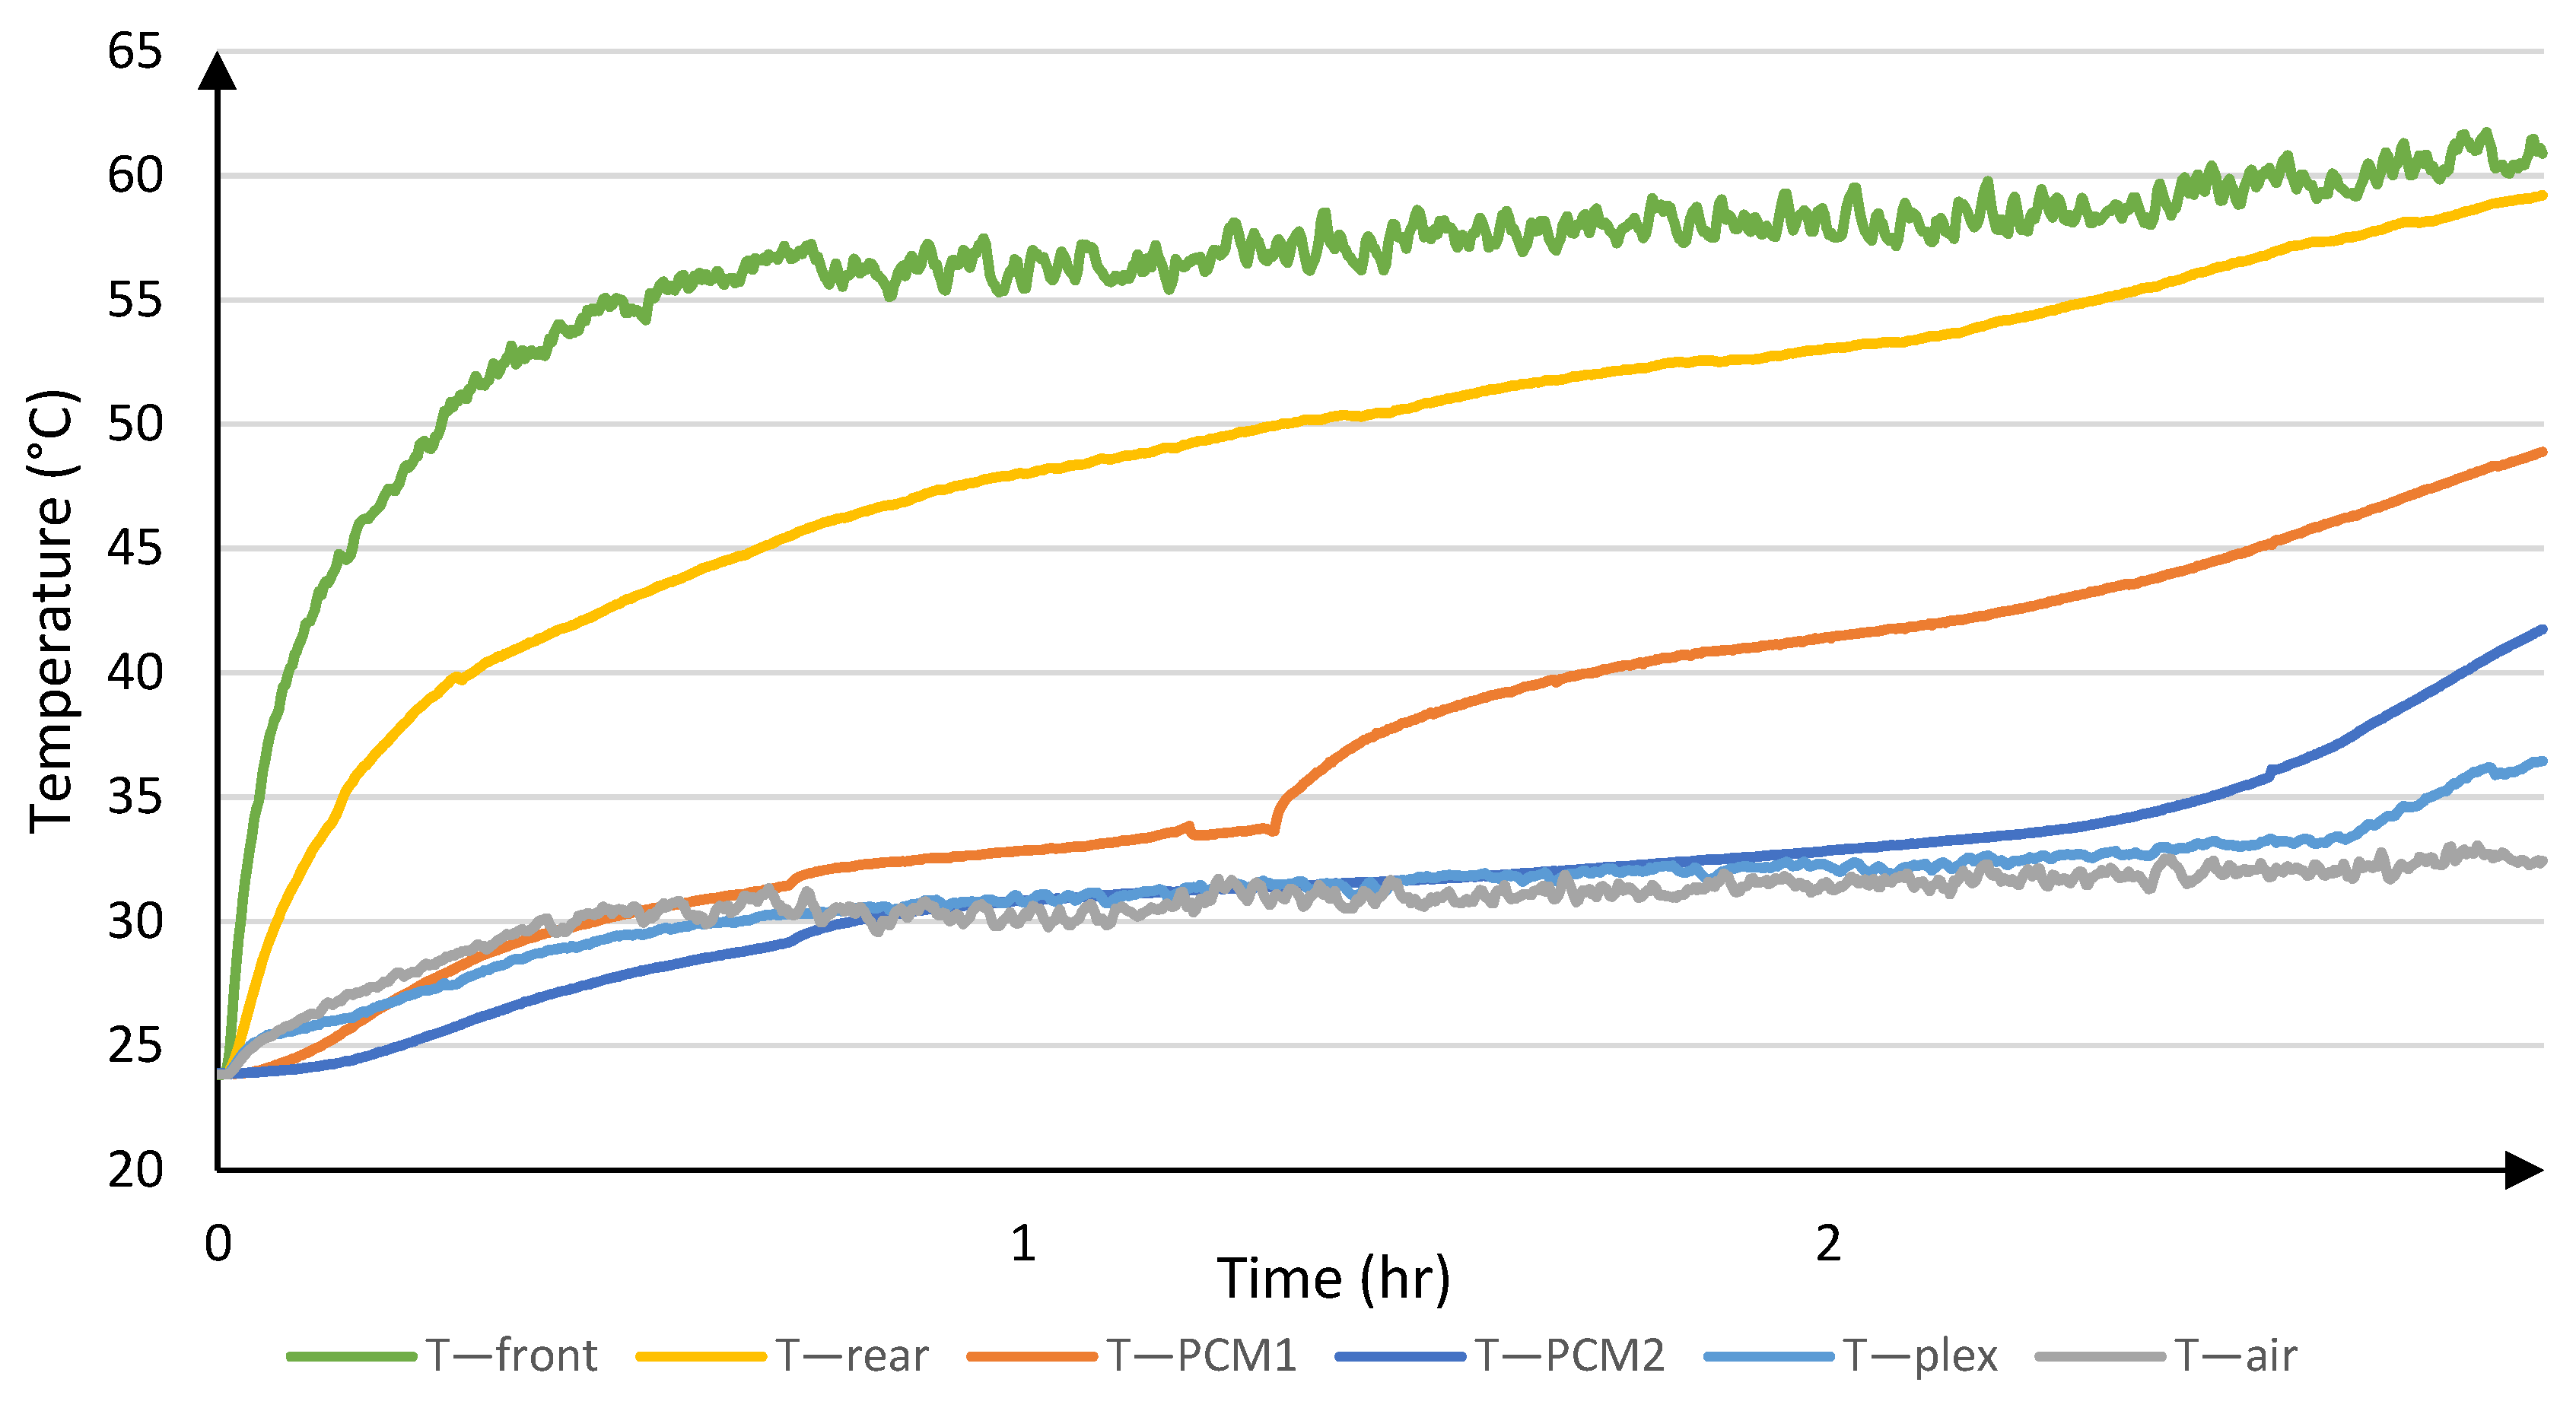
3.1. Indoor Characterization
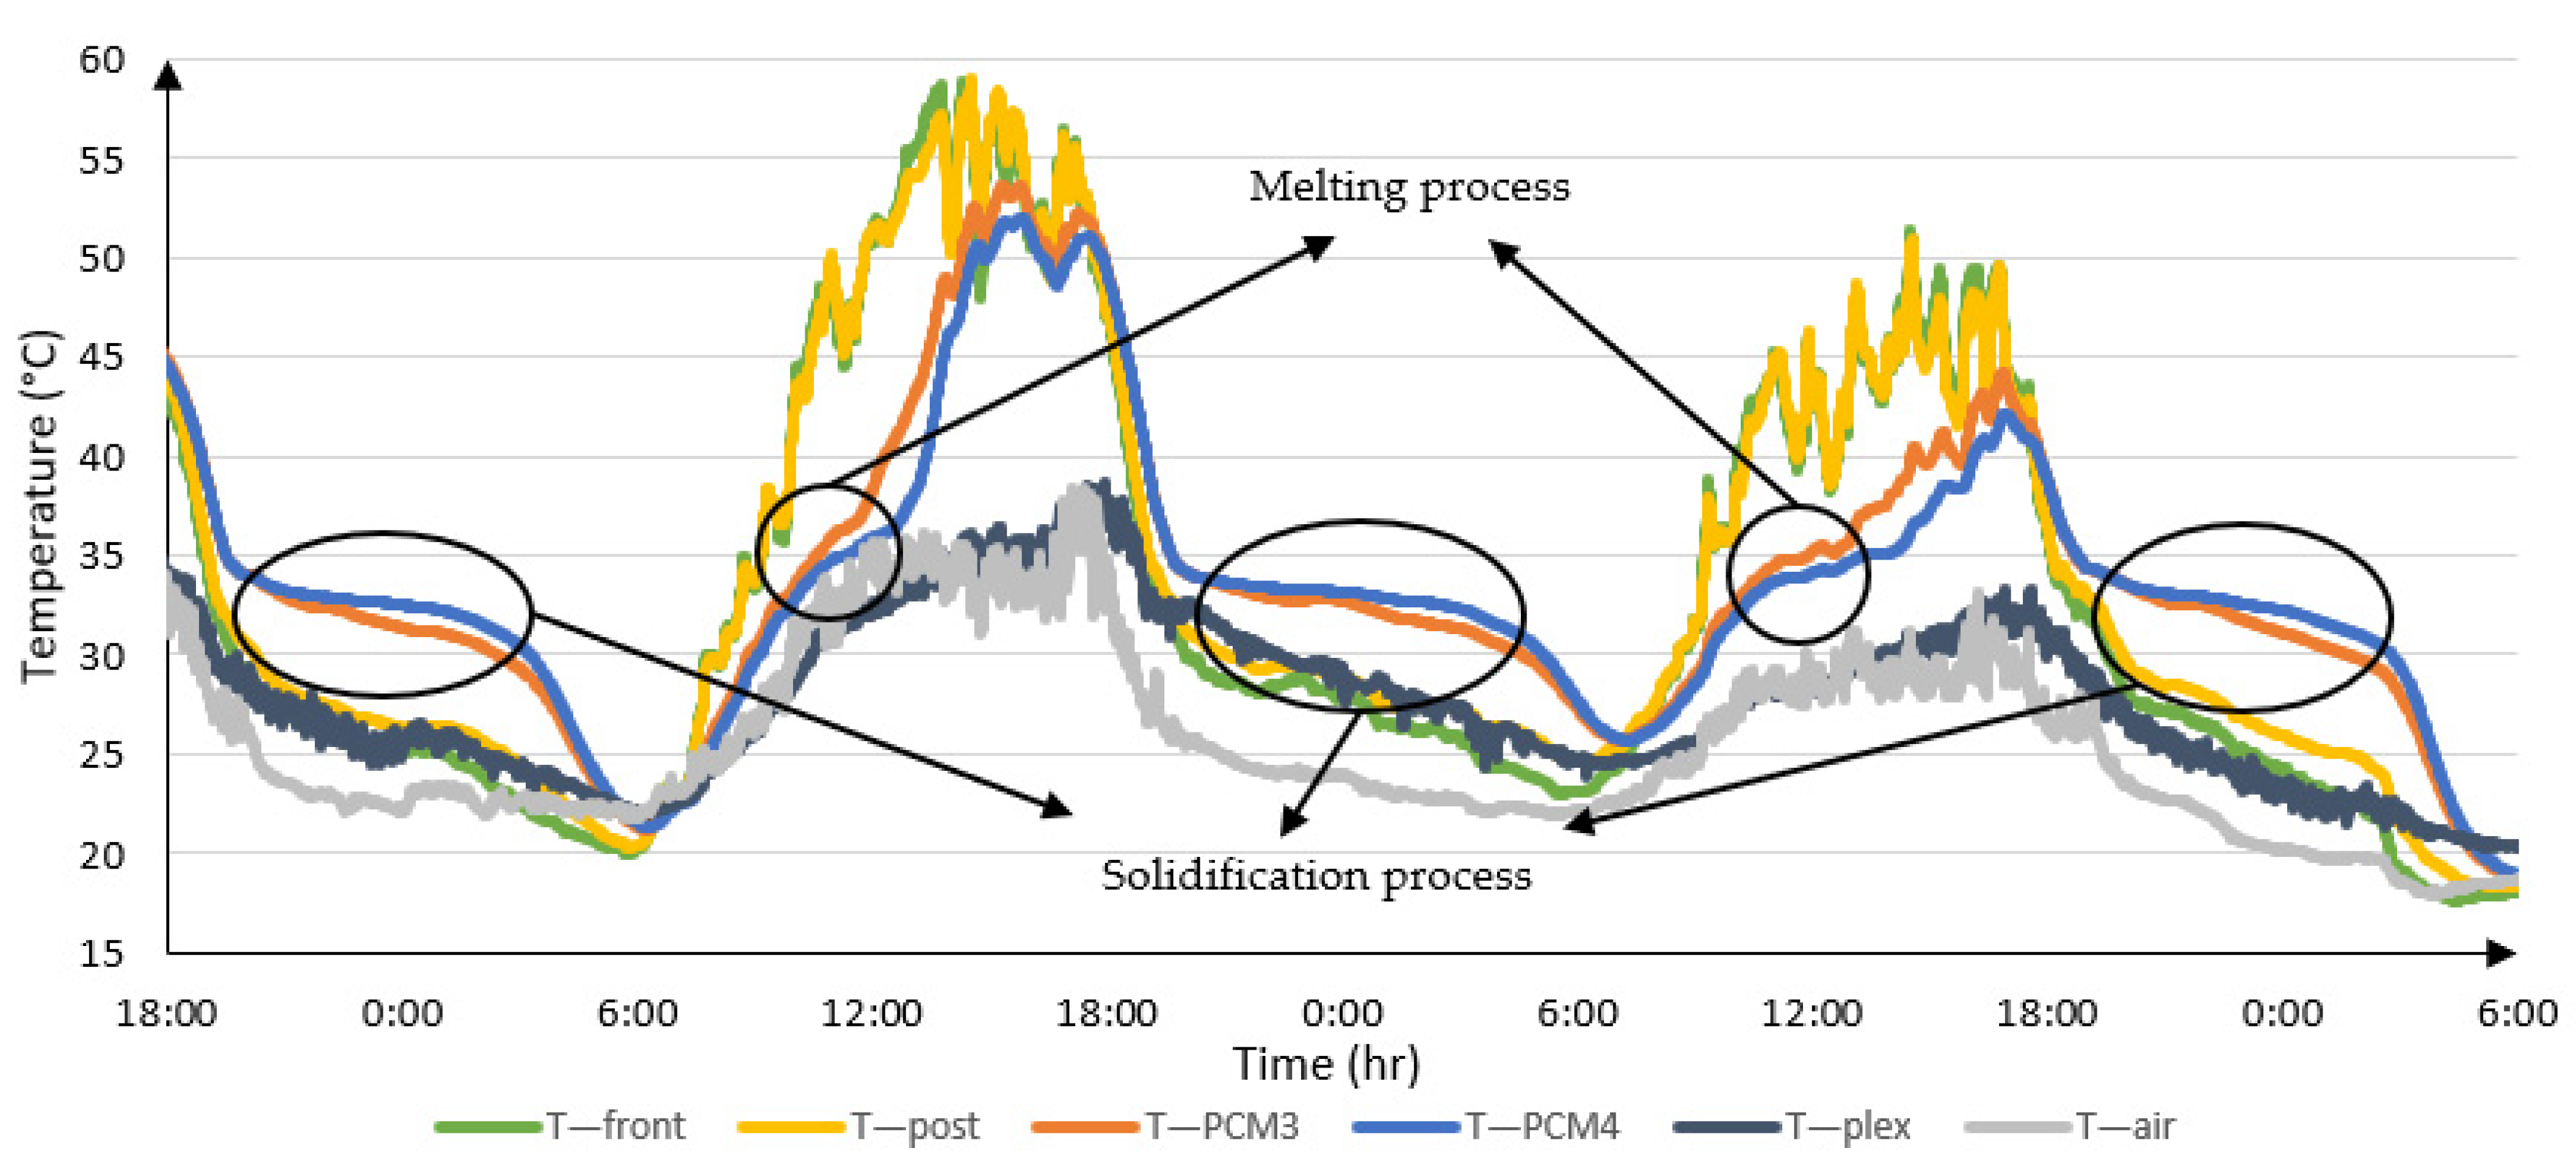
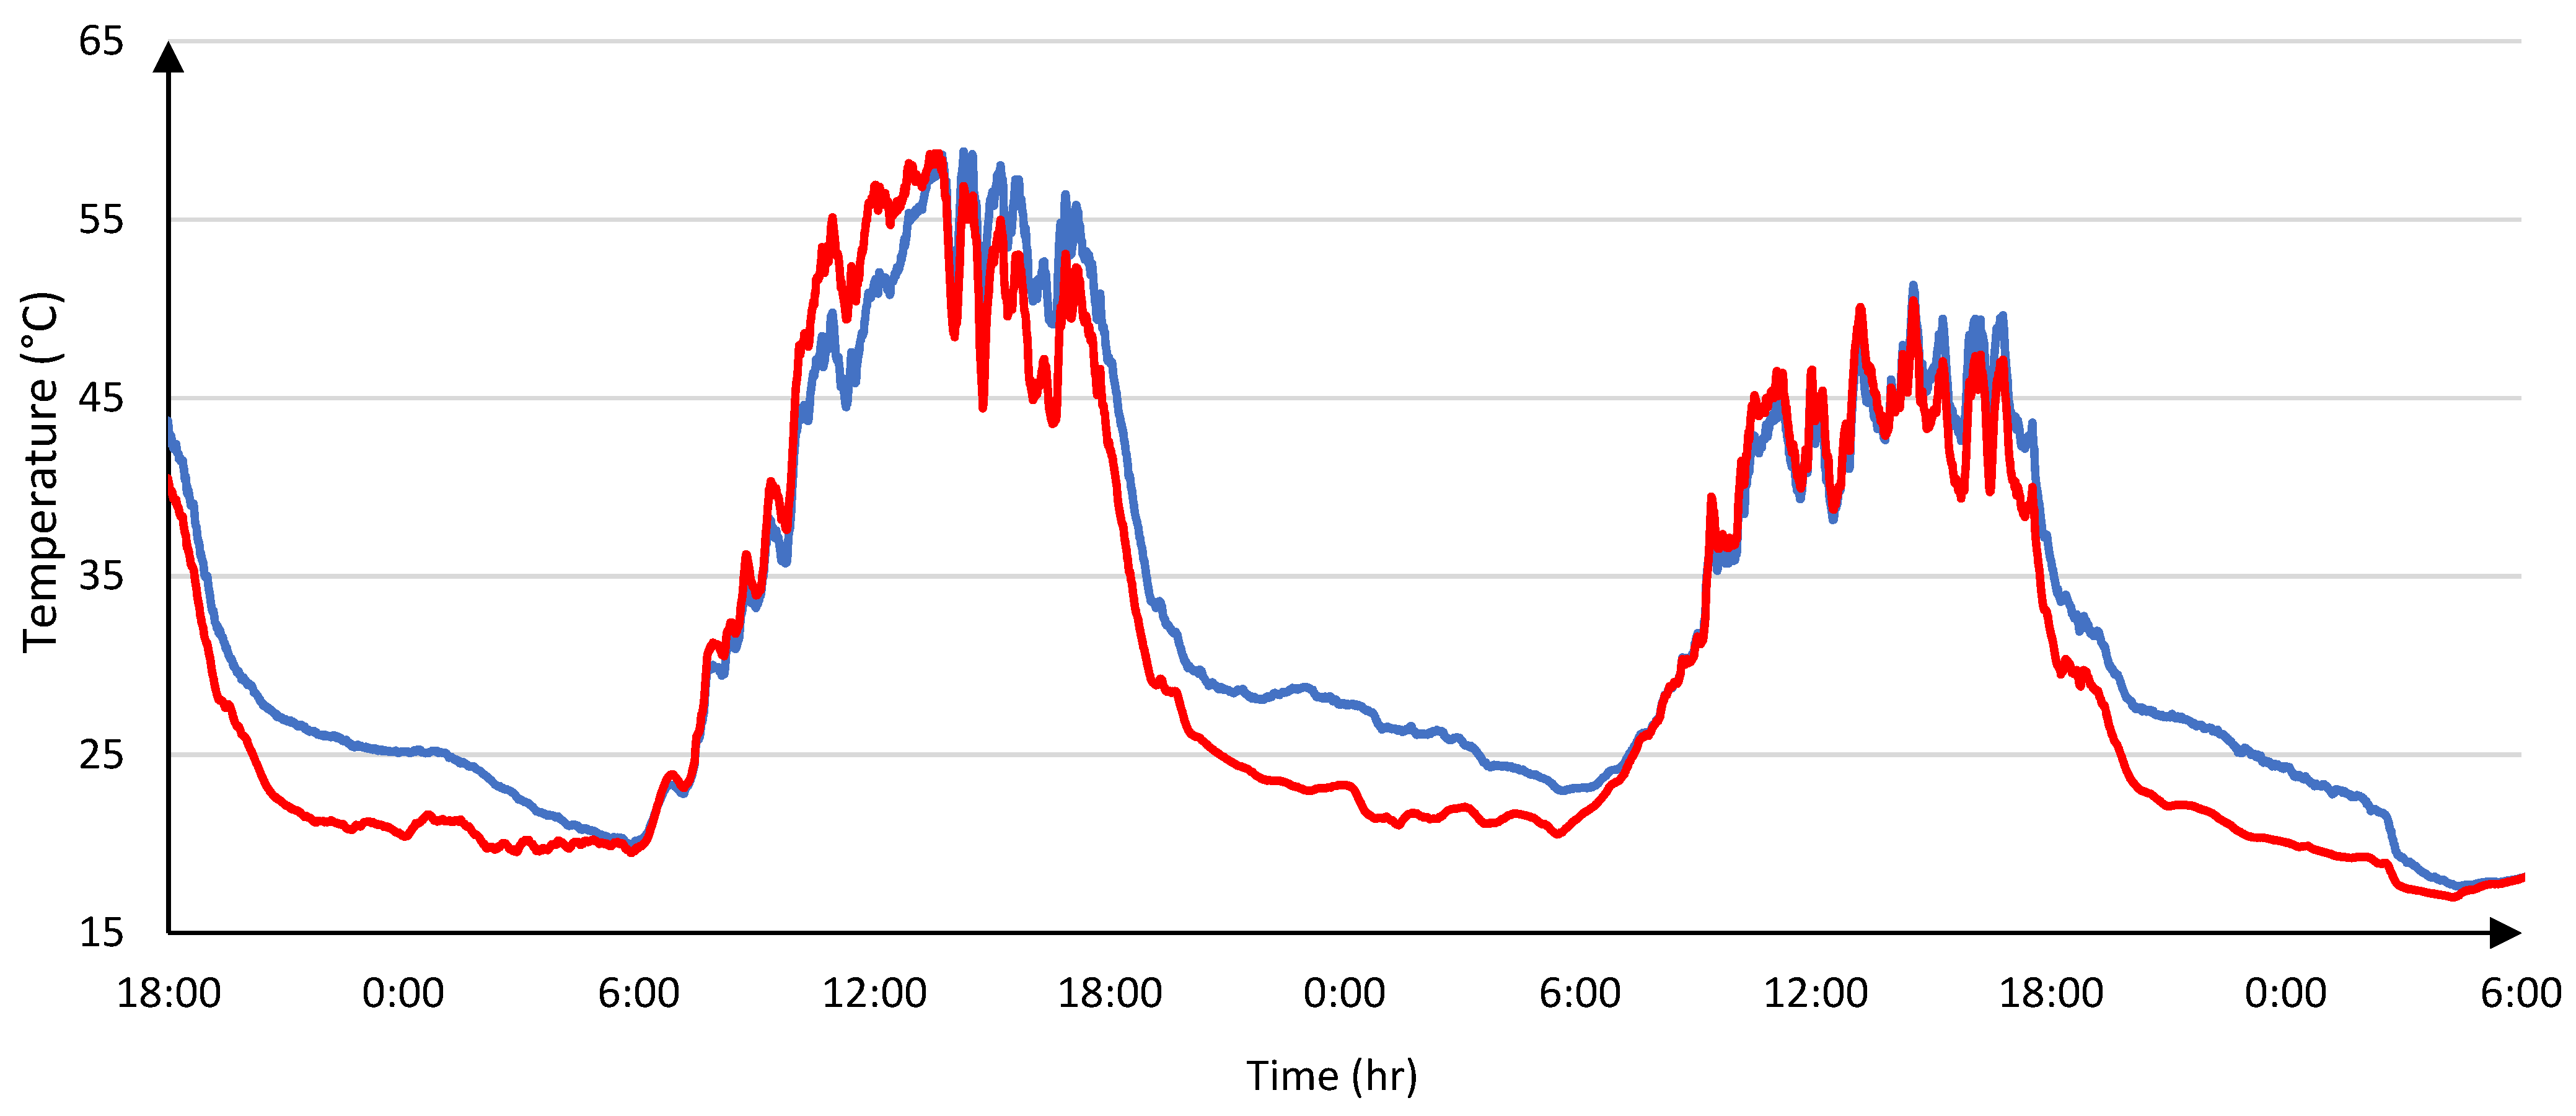
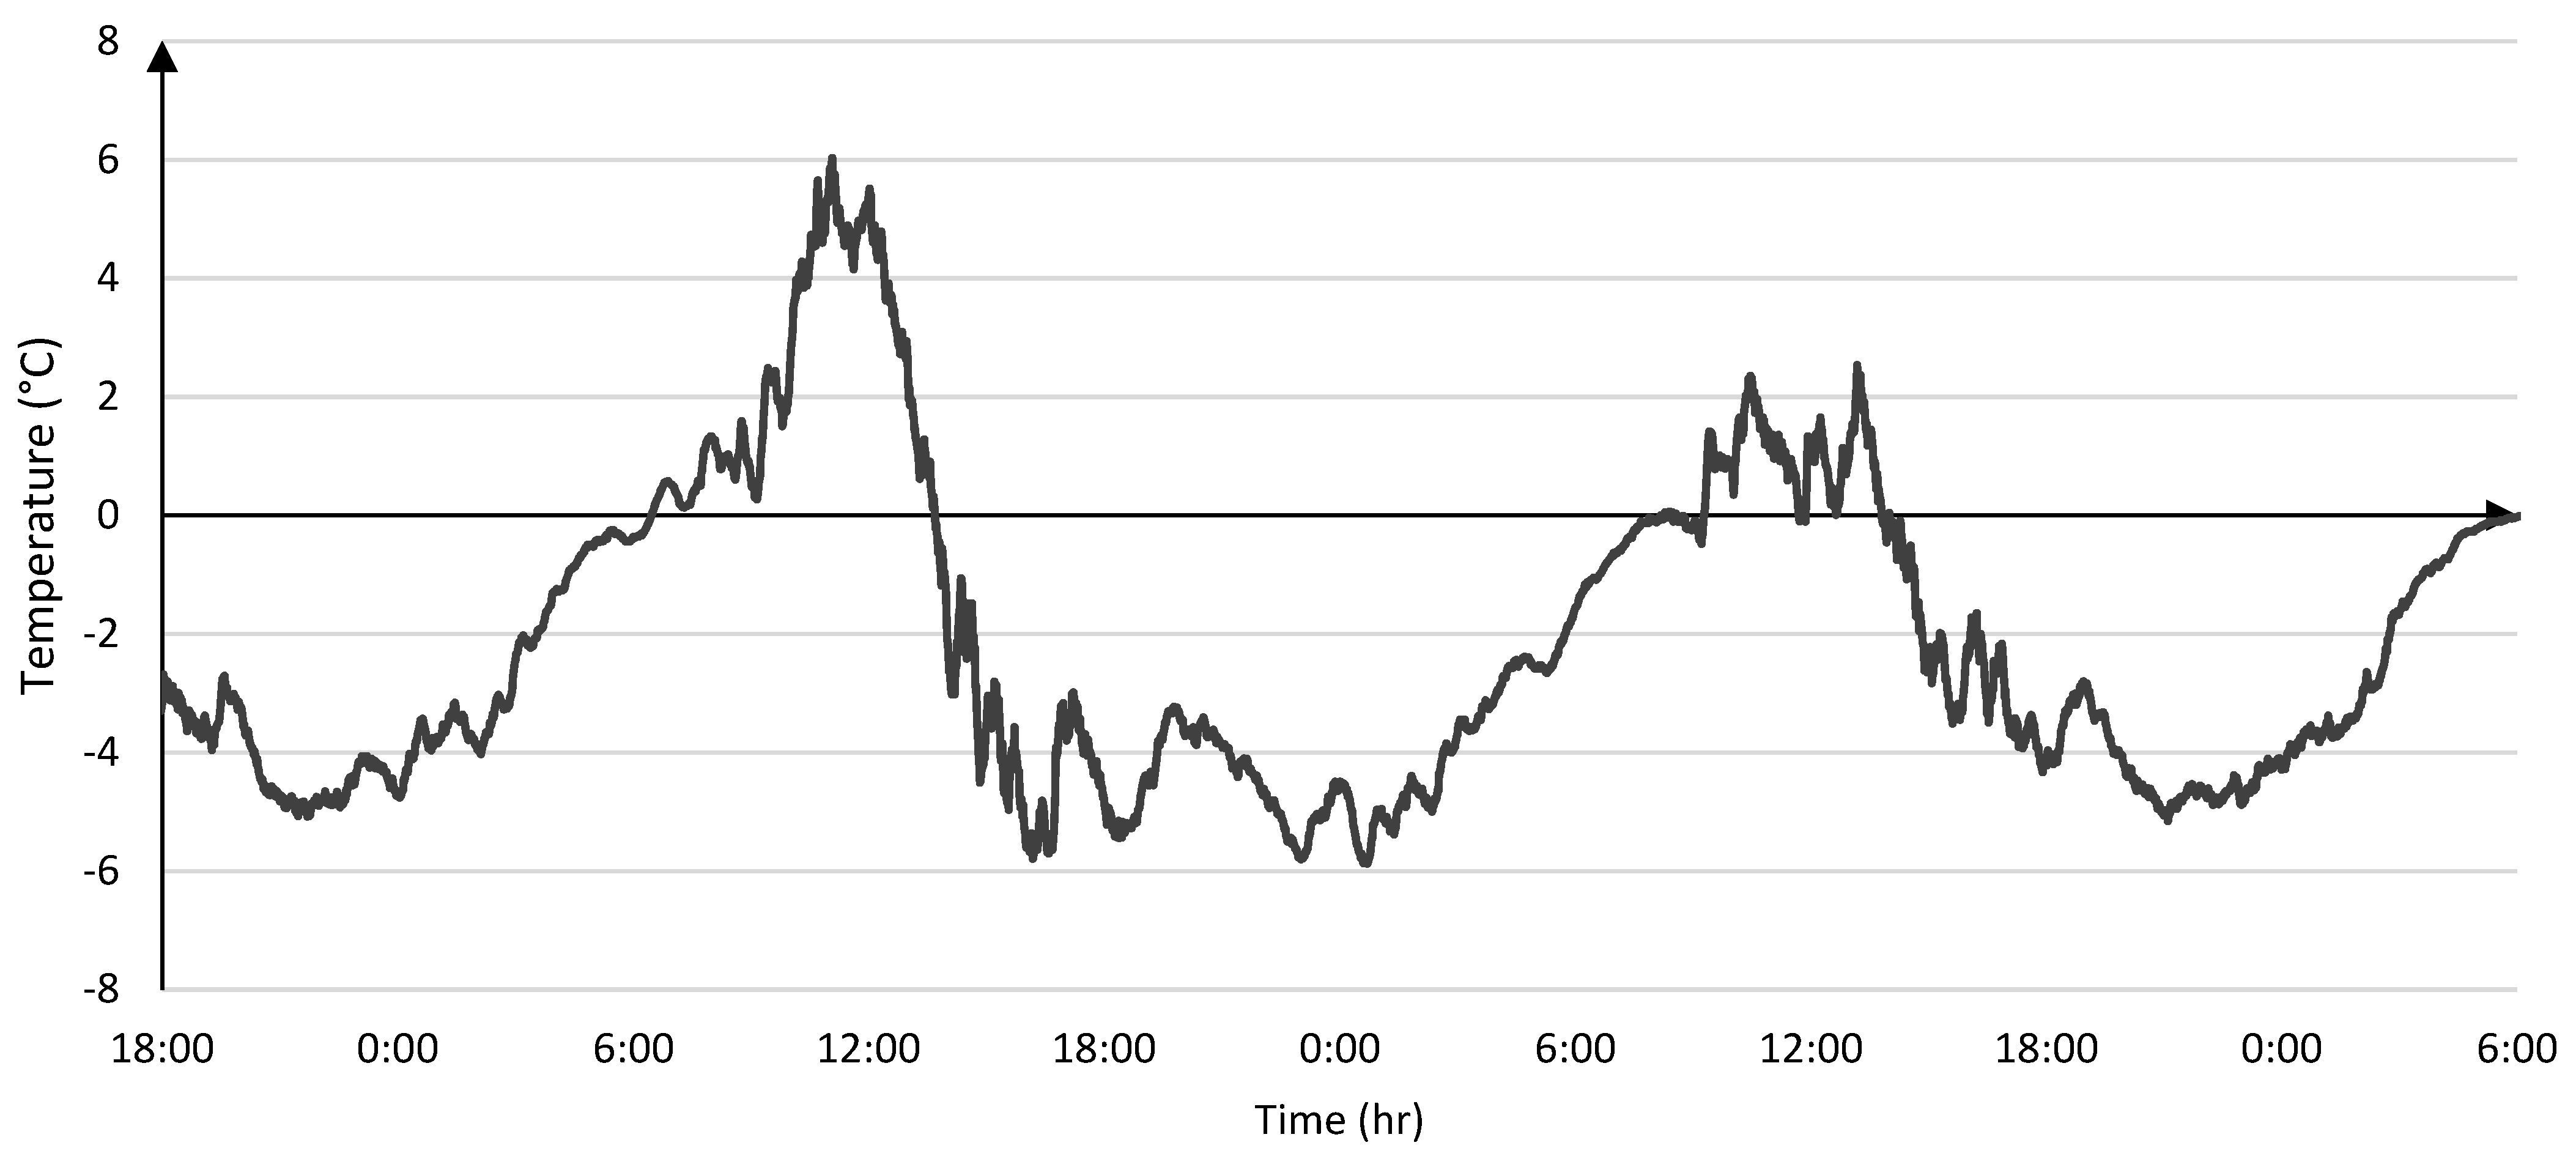
3.2. Outdoor Performance
4. Conclusions
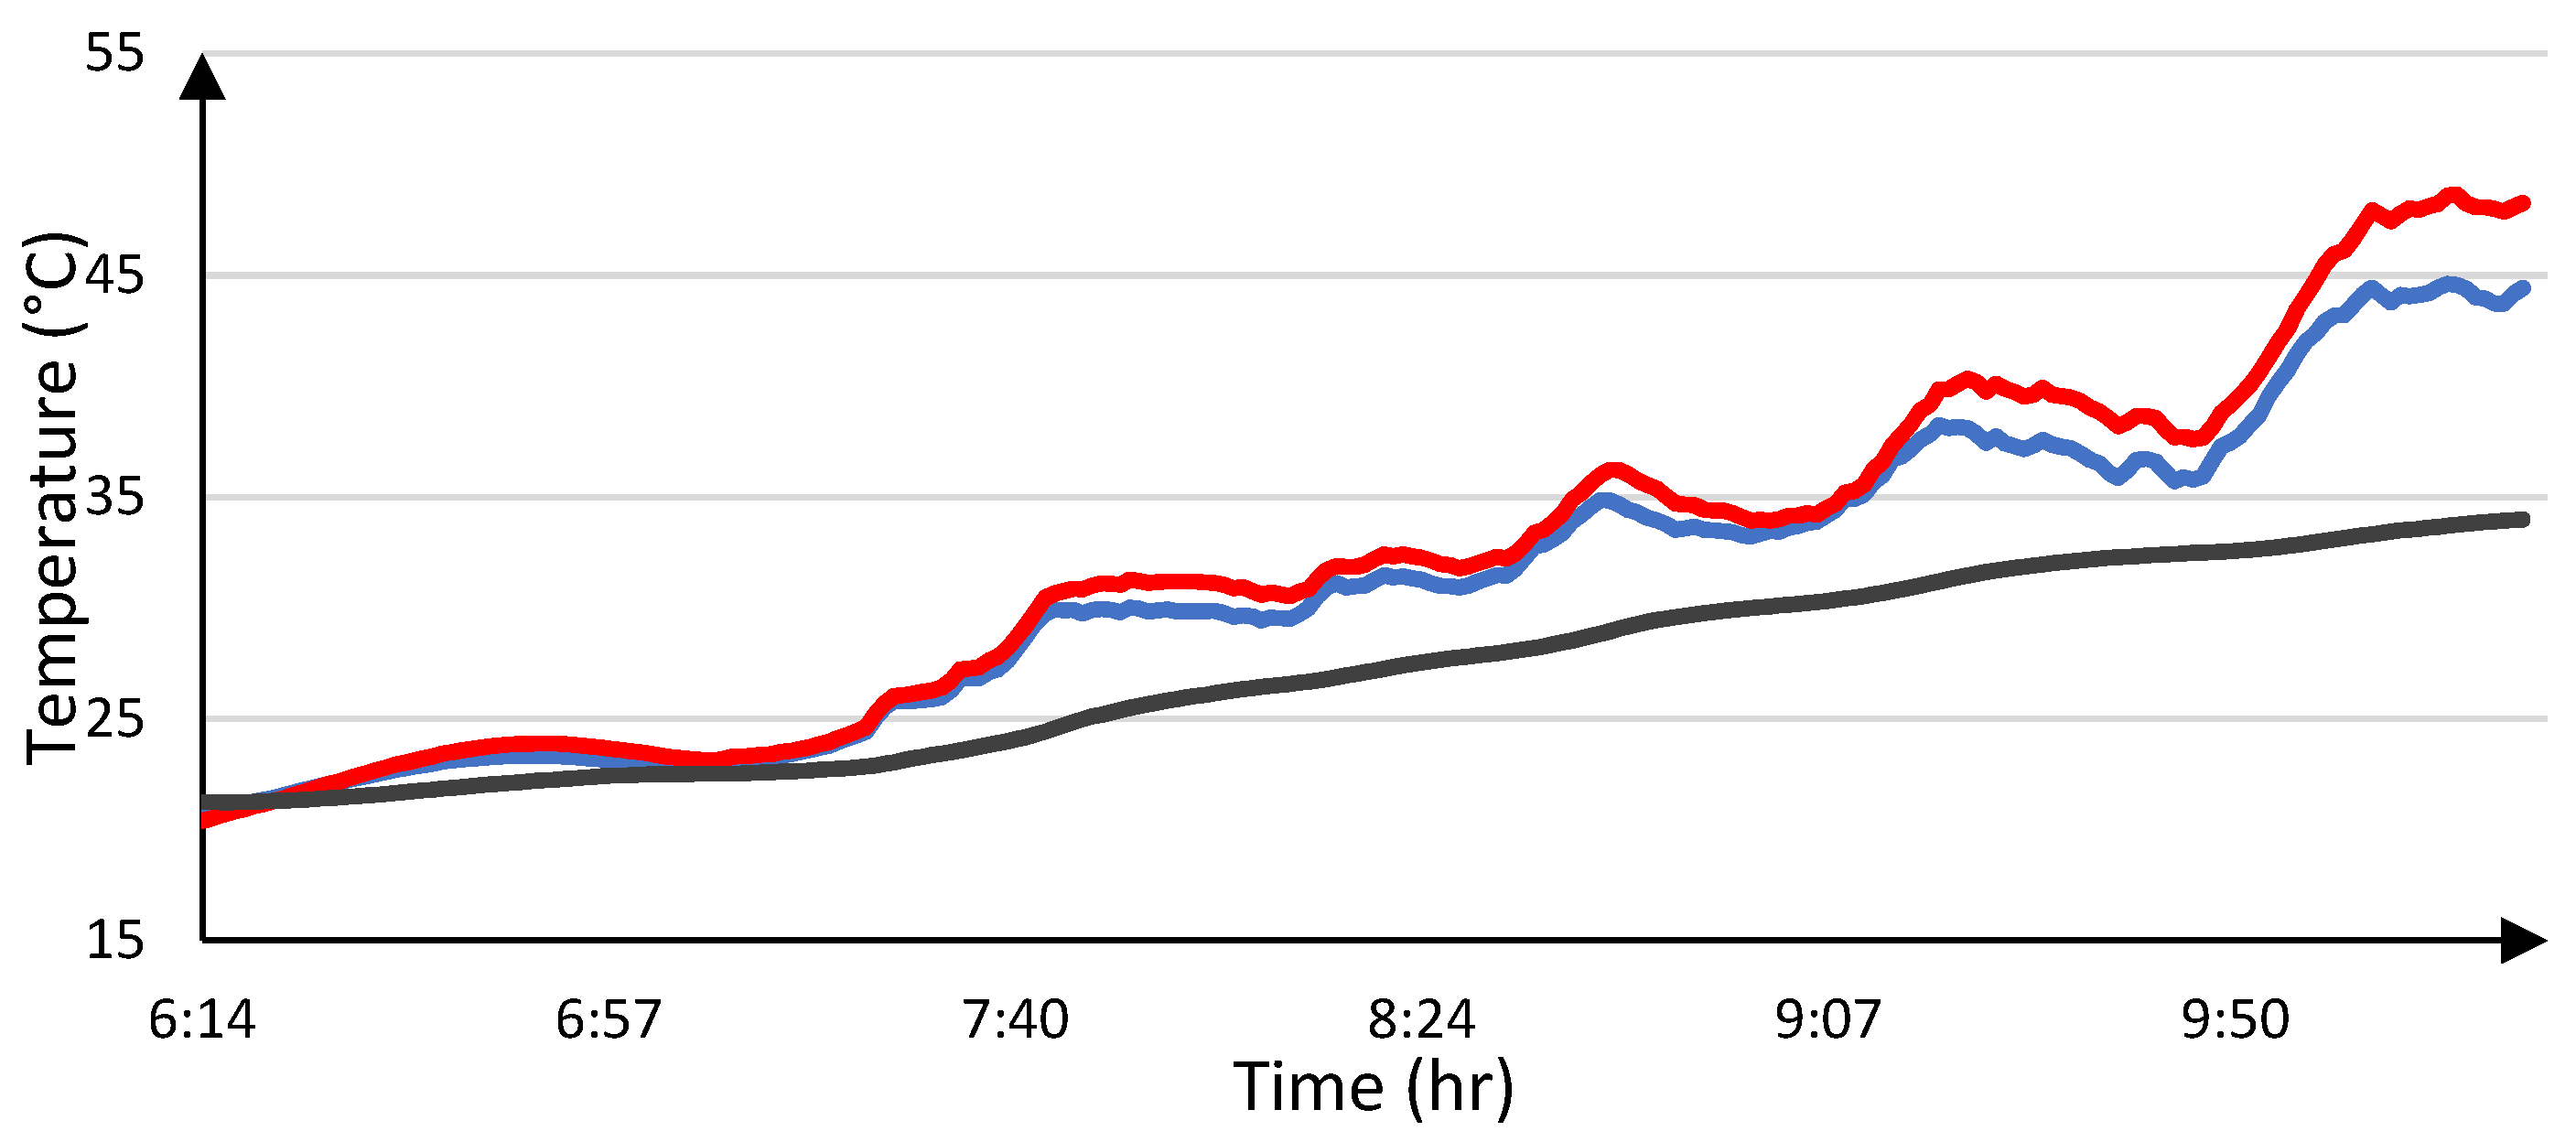
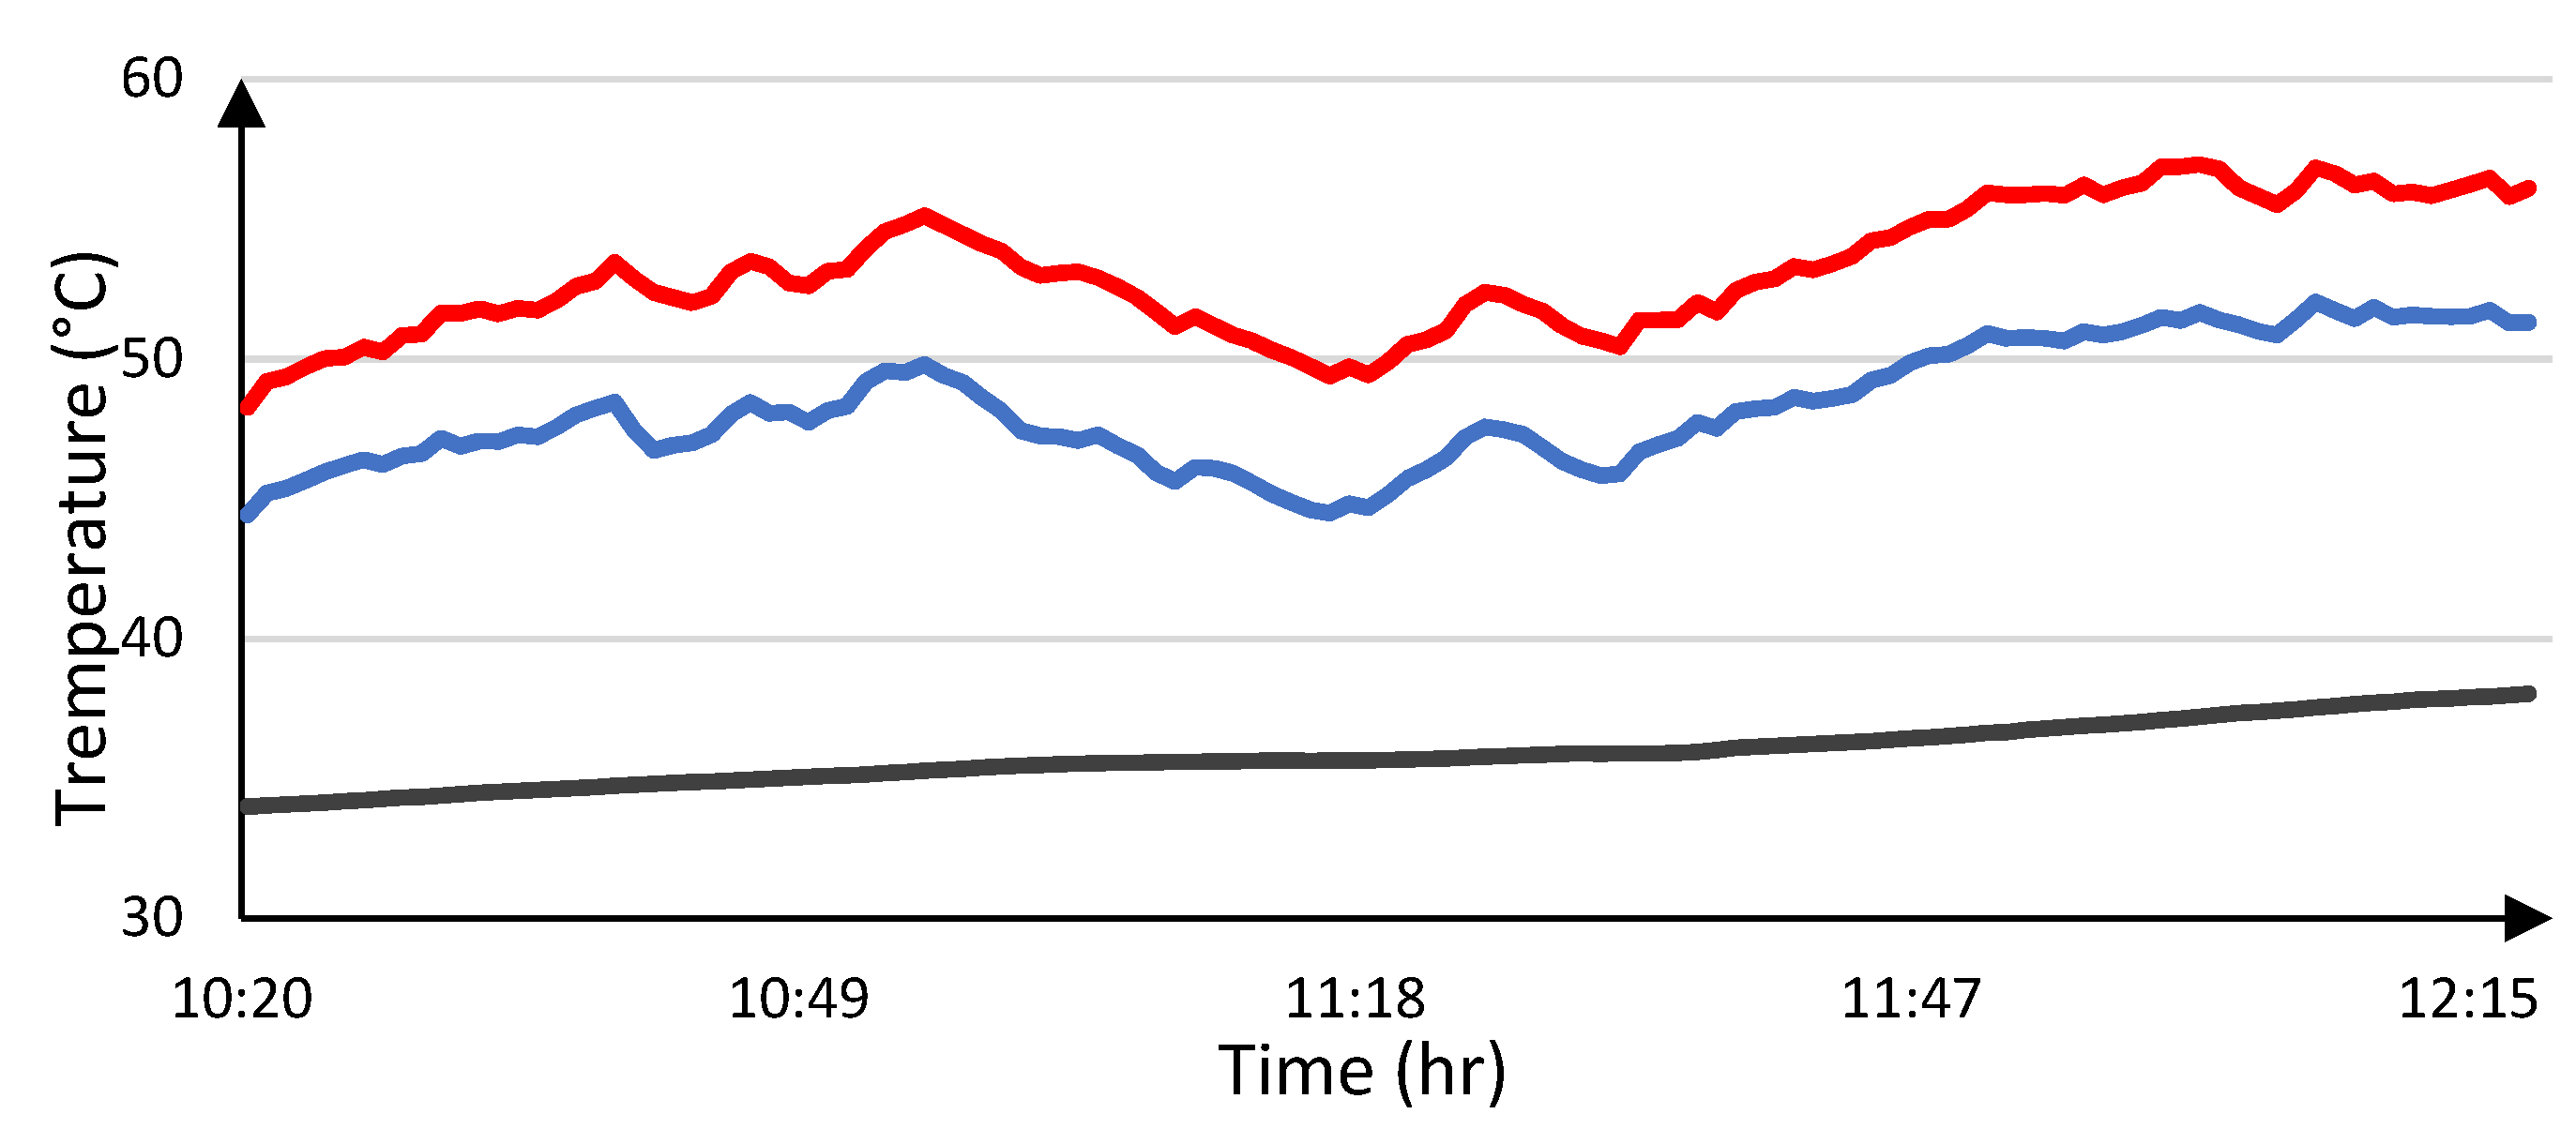
- During the solid phase, the two systems showed a similar temperature, the efficiency was slightly higher in the case of the hybrid panel (0.5%).
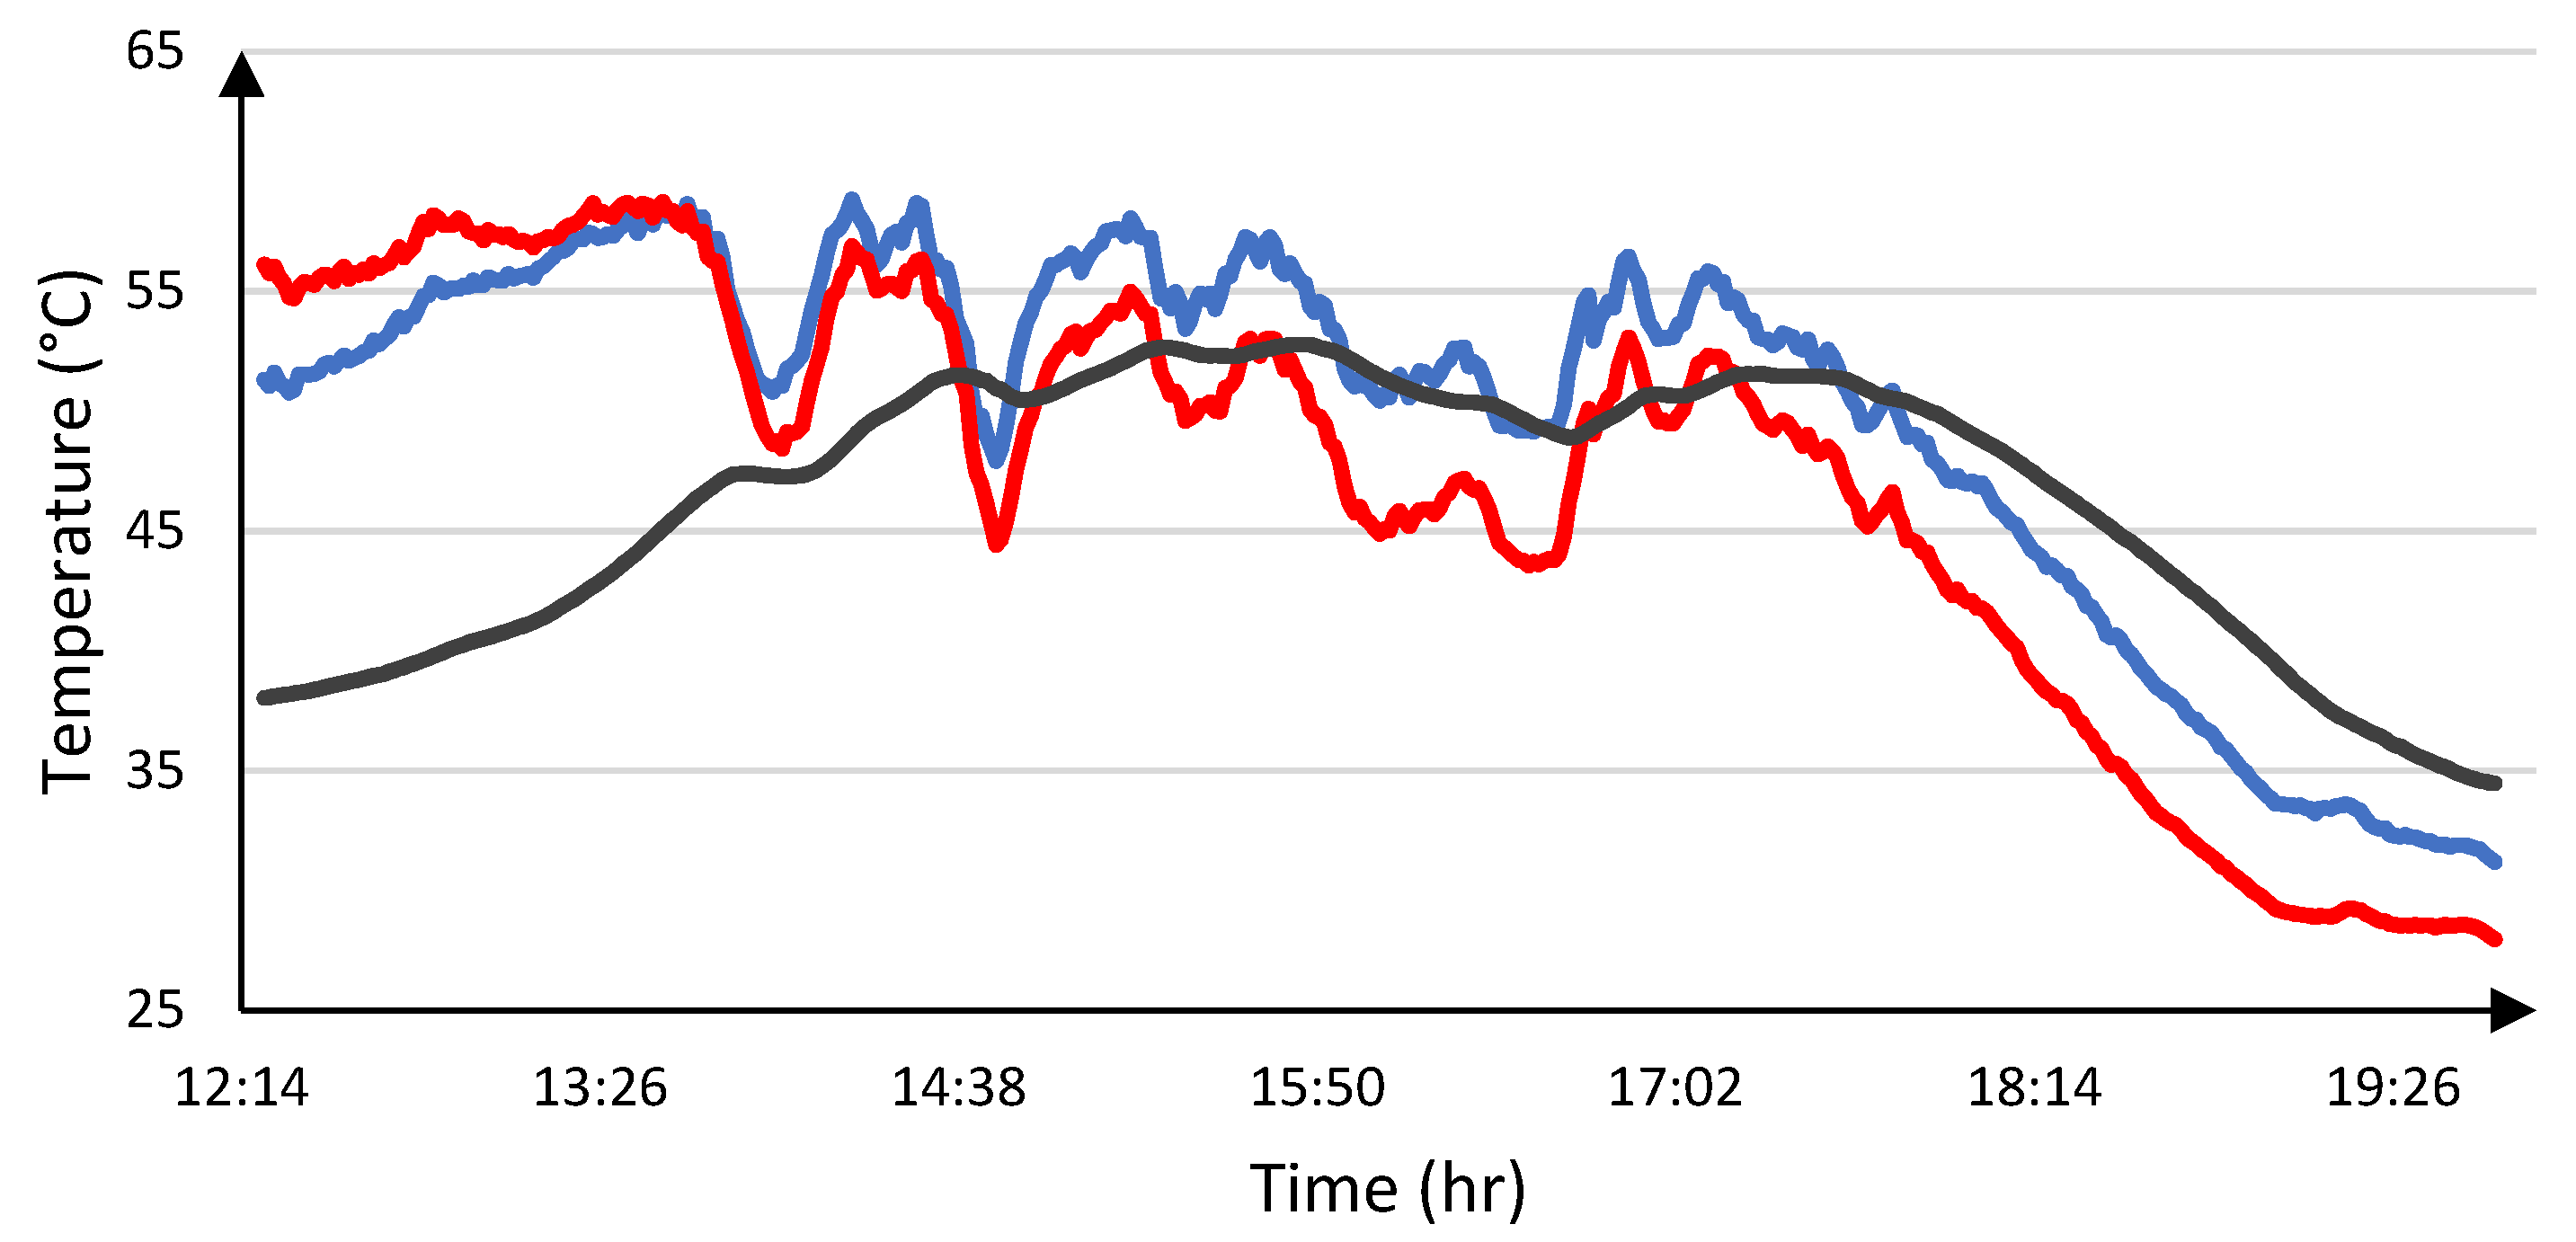
- The solid–liquid phase change provided the best results. The hybrid panel was about 5 °C colder, with an efficiency increase of about 2.5%.
- The liquid PCM did not absorb large amounts of heat, and the panel overheated. The hybrid panel showed higher temperatures, and the efficiency was reduced.
Author Contributions
Funding
Conflicts of Interest
References
- Gómez-Uceda, F.J.; Moreno-Garcia, I.M.; Perez-Castañeda, Á.; Fernández-Ahumada, L.M. Study of the dependence of solar radiation regarding design variables in photovoltaic solar installations with optimal dual-axis tracking. Appl. Sci. 2021, 11, 3917. [Google Scholar] [CrossRef]
- Saeed, M.A.; Kim, S.H.; Baek, K.; Hyun, J.K.; Lee, S.Y.; Shim, J.W. PEDOT: PSS: CuNW-based transparent composite electrodes for high-performance and flexible organic photovoltaics under indoor lighting. Appl. Surf. Sci. 2021, 567, 150852. [Google Scholar] [CrossRef]
- Xu, Y.; Yao, H.; Ma, L.; Wu, Z.; Cui, Y.; Hong, L.; Zu, Y.; Wang, J.; Woo, H.Y.; Hou, J. Organic photovoltaic cells with high efficiencies for both indoor and outdoor applications. Mater. Chem. Front. 2021, 5, 893–900. [Google Scholar] [CrossRef]
- Kim, S.H.; Saeed, M.A.; Lee, S.Y.; Shim, J.W. Investigating the indoor performance of planar heterojunction based organic photovoltaics. IEEE J. Photovolt. 2021, 11, 997–1003. [Google Scholar] [CrossRef]
- Griffith, J.S.; Rathod, M.S.; Paslaski, J. Some tests of flat plate photovoltaic module cell temperatures in simulated field conditions. In Proceedings of the 15th Photovoltaic Specialists Conference, Kissimmee, FL, USA, 12–15 May 1981; pp. 822–830. [Google Scholar]
- Du, D.; Darkwa, J.; Kokogiannakis, G. Thermal management systems for photovoltaics (PV) installations: A critical review. Sol. Energy 2013, 97, 238–254. [Google Scholar] [CrossRef]
- Hasanuzzaman, M.; Malek, A.B.M.A.; Islam, M.M.; Pandey, A.K.; Rahim, N.A. Global advancement of cooling technologies for PV systems: A review. Sol. Energy 2016, 137, 25–45. [Google Scholar] [CrossRef]
- Shukla, A.; Kant, K.; Sharma, A.; Biwole, P.H. Cooling methodologies of photovoltaic module for enhancing electrical efficiency: A review. Sol. Energy Mater. Sol. Cells 2017, 160, 275–286. [Google Scholar] [CrossRef]
- Sathe, T.M.; Dhoble, A.S. A review on recent advancements in photovoltaic thermal techniques. Renew. Sustain. Energy Rev. 2017, 76, 645–672. [Google Scholar] [CrossRef]
- Nižetić, S.; Giama, E.; Papadopoulos, A.M. Comprehensive analysis and general economic-environmental evaluation of cooling techniques for photovoltaic panels, part II: Active cooling techniques. Energy Convers. Manag. 2018, 155, 301–323. [Google Scholar] [CrossRef]
- Hasan, A.; McCormack, S.J.; Huang, M.J.; Norton, B. Characterization of phase change materials for thermal control of photovoltaics using differential scanning calorimetry and temperature history method. Energy Convers. Manag. 2014, 81, 322–329. [Google Scholar] [CrossRef]
- Ma, T.; Li, Z.; Zhao, J. Photovoltaic panel integrated with phase change materials (PV-PCM): Technology overview and materials selection. Renew. Sustain. Energy Rev. 2019, 116, 109406. [Google Scholar] [CrossRef]
- Heim, D.; Wieprzkowicz, A.; Knera, D.; Ilomets, S.; Kalamees, T.; Špitalský, Z. Towards improving the durability and overall performance of PV-ETICS by application of a PCM layer. Appl. Sci. 2021, 11, 4667. [Google Scholar] [CrossRef]
- Carlucci, F.; Cannavale, A.; Triggiano, A.A.; Squicciarini, A.; Fiorito, F. phase change material integration in building envelopes in different building types and climates: Modeling the benefits of active and passive strategies. Appl. Sci. 2021, 11, 4680. [Google Scholar] [CrossRef]
- Abdulmunem, A.R.; Samin, P.M.; Rahman, H.A.; Hussien, H.A.; Mazali, I.I.; Ghazali, H. Numerical and experimental analysis of the tilt angle’s effects on the characteristics of the melting process of PCM-based as PV cell’s backside heat sink. Renew. Energy 2021, 173, 520–530. [Google Scholar] [CrossRef]
- Huang, M.J. The effect of using two PCMs on the thermal regulation performance of BIPV systems. Sol. Energy Mater. Sol. Cells 2011, 95, 957–963. [Google Scholar] [CrossRef]
- Sharma, S.; Tahir, A.; Reddy, K.S.; Mallick, T.K. Performance enhancement of a building-integrated concentrating photovoltaic system using phase change material. Sol. Energy Mater. Sol. Cells 2016, 149, 29–39. [Google Scholar] [CrossRef] [Green Version]
- Hasan, A.; Sarwar, J.; Alnoman, H.; Abdelbaqi, E.S. Yearly energy performance of a photovoltaic-phase change material (PV-PCM) system in hot climate. Sol. Energy 2017, 146, 417–429. [Google Scholar] [CrossRef]
- Ma, T.; Zhao, J.; Li, Z. Mathematical modelling and sensitivity analysis of solar photovoltaic panel integrated with phase change material. Appl. Energy 2018, 228, 1147–1158. [Google Scholar] [CrossRef]
- Mahamudul, H.; Rahman, M.; Metselaar, H.S.C.; Mekhilef, S.; Shezan, S.A.; Sohel, R.; Bin Abu Karim, S.; Badiuzaman, W.N.I. Temperature regulation of photovoltaic module using phase change material: A numerical analysis and experimental investigation. Int. J. Photoenergy 2016, 2016, 5917028. [Google Scholar] [CrossRef]
- Ho, C.J.; Tanuwijava, A.O.; Lai, C.M. Thermal and electrical performance of a BIPV integrated with a microencapsulated phase change material layer. Energy Build. 2012, 50, 331–338. [Google Scholar] [CrossRef]
- Huang, M.J.; Eames, P.C.; Norton, B. Comparison of a small-scale 3D PCM thermal control model with a validated 2D PCM thermal control model. Sol. Energy Mater. Sol. Cells 2006, 90, 1961–1972. [Google Scholar] [CrossRef]
- Beemkumar, N.; Karthikeyan, A. Experimental investigation on enhancement of heat transfer in thermal energy storage system using paraffin wax as PCM. Appl. Mech. Mater. 2015, 766, 457–462. [Google Scholar] [CrossRef]
- Sarı, A.; Karaipekli, A. Thermal conductivity and latent heat thermal energy storage characteristics of paraffin/expanded graphite composite as phase change material. Appl. Therm. Eng. 2007, 27, 1271–1277. [Google Scholar] [CrossRef]
- Wang, Q.; Zhou, D.; Chen, Y.; Eames, P.; Wu, Z. Characterization and effects of thermal cycling on the properties of paraffin/expanded graphite composites. Renew. Energy 2020, 147, 1131–1138. [Google Scholar] [CrossRef]
- Sami, S.; Etesami, N. Improving thermal characteristics and stability of phase change material containing TiO2 nanoparticles after thermal cycles for energy storage. Appl. Therm. Eng. 2017, 124, 346–352. [Google Scholar] [CrossRef]
- Harikrishnan, S.; Hussain, S.I.; Devaraju, A.; Sivasamy, P.; Kalaiselvam, S. Improved performance of a newly prepared nano-enhanced phase change material for solar energy storage. J. Mech. Sci. Technol. 2017, 31, 4903–4910. [Google Scholar] [CrossRef]
- Cheng, X.; Li, G.; Yu, G.; Li, Y.; Han, J. Effect of expanded graphite and carbon nanotubes on the thermal performance of stearic acid phase change materials. J. Mater. Sci. 2017, 52, 12370–12379. [Google Scholar] [CrossRef]
- Babapoor, A.; Karimi, G.; Sabbaghi, S. Thermal characteristic of nanocomposite phase change materials during solidification process. J. Energy Storage 2016, 7, 74–81. [Google Scholar] [CrossRef]
- Ahmadi, R.; Monadinia, F.; Maleki, M. Passive/active photovoltaic-thermal (PVT) system implementing infiltrated phase change material (PCM) in PS-CNT foam. Sol. Energy Mater. Sol. Cells 2021, 222, 110942. [Google Scholar] [CrossRef]
- Lu, W.; Liu, Z.; Flor, J.F.; Wu, Y.; Yang, M. Investigation on designed fins-enhanced phase change materials system for thermal management of a novel building integrated concentrating PV. Appl. Energy 2018, 225, 696–709. [Google Scholar] [CrossRef]
- Khanna, S.; Reddy, K.S.; Mallick, T.K. Optimization of finned solar photovoltaic phase change material (finned pv pcm) system. Int. J. Therm. Sci. 2018, 130, 313–322. [Google Scholar] [CrossRef]
- Abdulmunem, A.R.; Jalil, M.J. Indoor investigation and numerical analysis of PV cells temperature regulation using coupled PCM/Fins. Int. J. Heat Technol. 2018, 36, 1212–1222. [Google Scholar] [CrossRef]
- Colarossi, D.; Tagliolini, E.; Principi, P.; Fioretti, R. Design and validation of an adjustable large-scale solar simulator. Appl. Sci. 2021, 11, 1964. [Google Scholar] [CrossRef]


| Characteristics | RT 35 HC |
|---|---|
| Melting area (°C) | 34–36 peak 35 |
| Congealing area (°C) | 36–34 peak 35 |
| Volume expansion (%) | 12 |
| Latent heat (kJ/kg) | 240 |
| Heat conductivity (W/m2 K) | 0.2 |
| Specific heat capacity (kJ/kg K) | 2 |
| Liquid density (kg/l) | 0.77 |
| Solid density (kg/l) | 0.88 |
| T Average (°C) | T Peak (°C) | Ramping Time (Minutes) | Average Solar Radiation (W/m2) | |
|---|---|---|---|---|
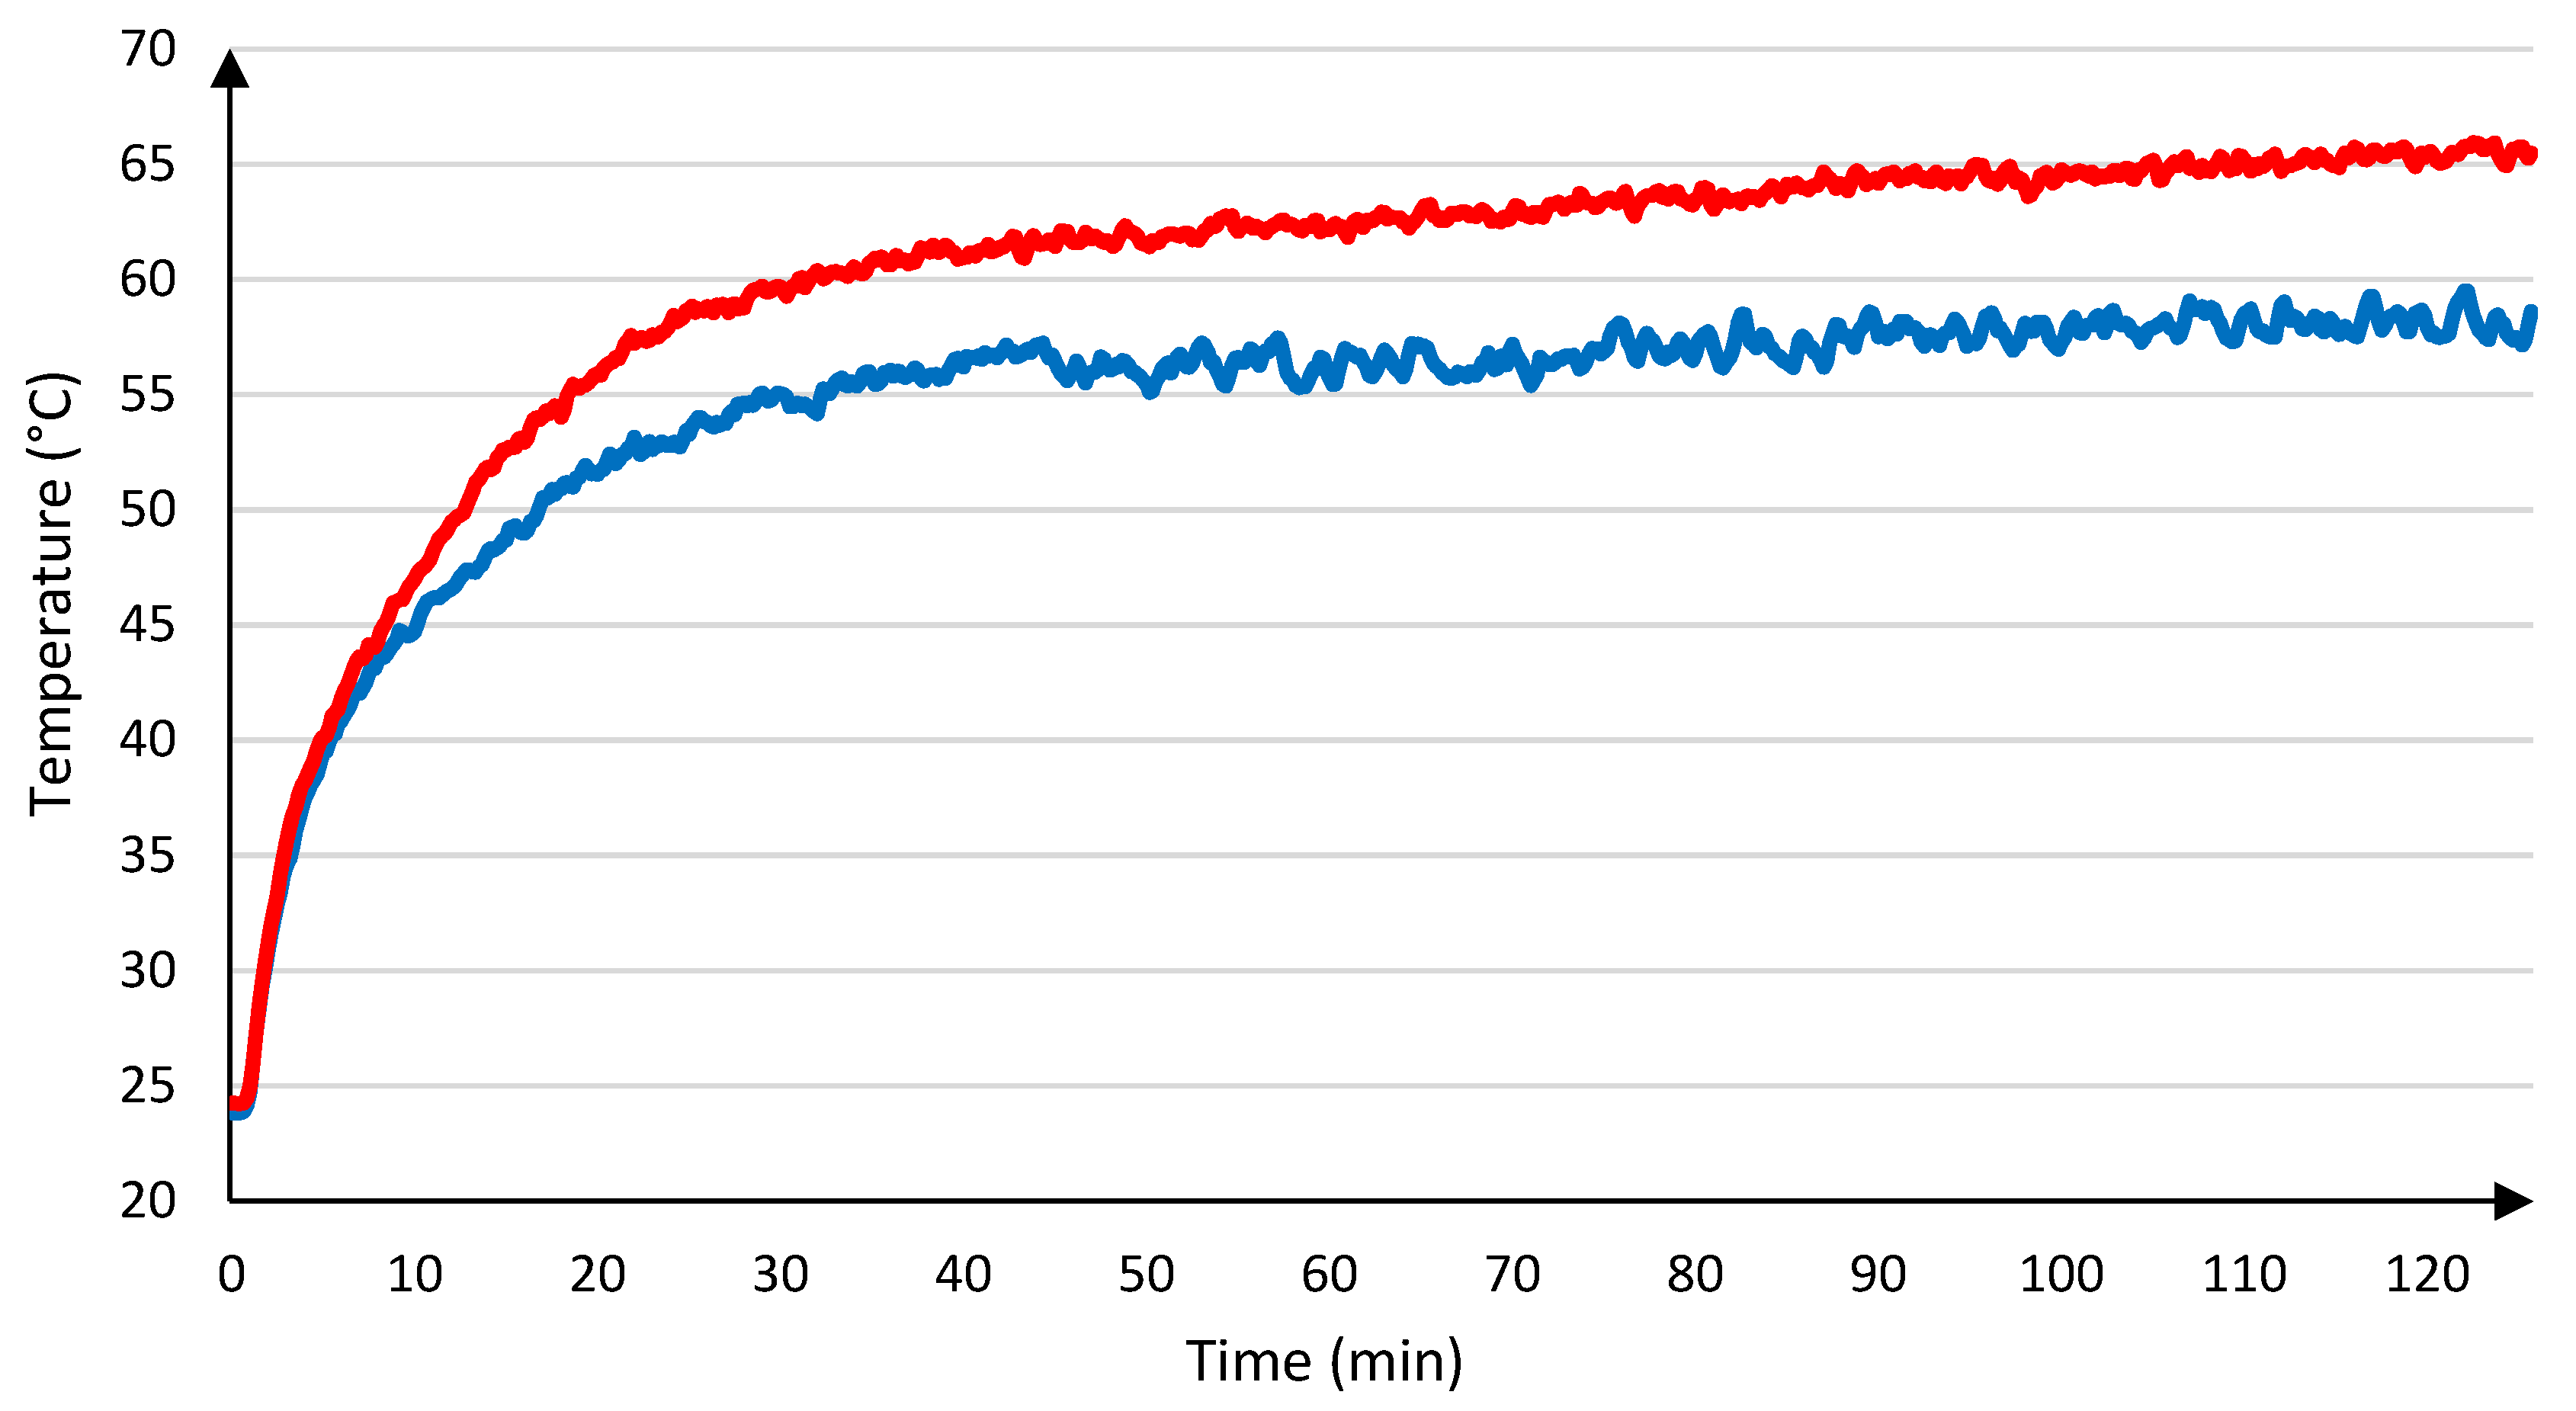
| Ref case | 60.01 | 65.4 | 20 | 977 |
| Enhanced panel | 54.48 | 58.6 | 14 | 992 |
| Tavg PV | Tavg PV–PCM | ∆T | ∆ yield (%) | |
|---|---|---|---|---|
| Solid state | 32.1 | 30.9 | 1.12 | 0.56 |
| Phase change | 53.09 | 48.2 | 4.87 | 2.44 |
| Solid state | 47.09 | 49.8 | −2.79 | −1.40 |
| Global | 43.3 | 43.8 | −0.49 | −0.25 |
| Radiation (MJ) | Heat Absorbed (MJ) | Yield (%) | |
|---|---|---|---|
| Solid state | 0.376 | 0.117 | 31.1% |
| Phase change | 1.062 | 0.906 | 65.6% |
| Liquid state | 2.609 | 0.176 | 6.6% |
| Global | 4.028 | 1.199 | 29.7% |
Publisher’s Note: MDPI stays neutral with regard to jurisdictional claims in published maps and institutional affiliations. |
© 2021 by the authors. Licensee MDPI, Basel, Switzerland. This article is an open access article distributed under the terms and conditions of the Creative Commons Attribution (CC BY) license (https://creativecommons.org/licenses/by/4.0/).
Share and Cite
Colarossi, D.; Principi, P. Indoor and Outdoor Performance of an Enhanced Photovoltaic Panel through Graphene/Fins/Phase Change Materials. Appl. Sci. 2021, 11, 8807. https://doi.org/10.3390/app11198807
Colarossi D, Principi P. Indoor and Outdoor Performance of an Enhanced Photovoltaic Panel through Graphene/Fins/Phase Change Materials. Applied Sciences. 2021; 11(19):8807. https://doi.org/10.3390/app11198807
Chicago/Turabian StyleColarossi, Daniele, and Paolo Principi. 2021. "Indoor and Outdoor Performance of an Enhanced Photovoltaic Panel through Graphene/Fins/Phase Change Materials" Applied Sciences 11, no. 19: 8807. https://doi.org/10.3390/app11198807
APA StyleColarossi, D., & Principi, P. (2021). Indoor and Outdoor Performance of an Enhanced Photovoltaic Panel through Graphene/Fins/Phase Change Materials. Applied Sciences, 11(19), 8807. https://doi.org/10.3390/app11198807