Article

Assessment of Ultraviolet Impact on Main Pigment Content in Purple Basil (Ocimum basilicum L.) by the Spectrometric Method and Hyperspectral Images Analysis

by
Yuri A. Proshkin
1,
Alexandr A. Smirnov
1,*,
Natalya A. Semenova
1,
Alexey S. Dorokhov
1,
Dmitry A. Burynin
1,
Alina S. Ivanitskikh
1 and
Vladimir A. Panchenko
1,2
1
Federal Scientific Agroengineering Center VIM, (FSAC VIM), Federal State Budgetary Scientific Institution, 109428 Moscow, Russia
2
Department of Theoretical and Applied Mechanics, Russian University of Transport, 127994 Moscow, Russia
*
Author to whom correspondence should be addressed.
Appl. Sci. 2021, 11(19), 8804; https://doi.org/10.3390/app11198804
Submission received: 11 August 2021 / Revised: 7 September 2021 / Accepted: 18 September 2021 / Published: 22 September 2021
(This article belongs to the Special Issue Energy Optimization for Agriculture and Agroengineering Systems)

Abstract

:
This research is aimed at the assessing the impact of the ultraviolet radiation in the A, B, and C ranges (as additives to the main light) on general plan condition, the stress experienced by them, the pigment concentration in the leaves and leaf reflective characteristics. Under studying, there were the photo-protective reactions of the purple variety basil plants. The plants were grown in plastic pots in a phyto-chamber equipped with an automatic microclimate system. The phyto-chamber was divided into four compartments where, in addition to the main lighting, there were installed the additional LEDs emitting their radiation in the ranges UV-A, UV-B, and UV-C. Plant reactions were evaluated by the contents of the main pigments as detected by the spectrometric method. Then correlations were revealed between those values and the vegetative indices obtained based on the hyperspectral images. A strong correlation (R2 ˃ 0.83) was observed between the values of the vegetative indices ARI and mARI and the anthocyanins concentration in basil leaves. A weak correlation (R2 = 0.0479) was found between the ARI and mARI values and the carotenoids index CRI700, which is attributed to the shielding effect of the anthocyanins. Deviations in the results are influenced by leaf surface unevenness, its thickness and density. Additional research is needed including developing reflection indices taking into account the shielding effect of the purple pigments.

1. Introduction

The negative anthropogenic impact on the Earth biosphere results in such serious climatic changes as the growth of atmosphere and ocean annual average temperatures, the formation of greenhouse gases in large amounts, the ozone layer depletion and consequently rises the UV radiation intensity. The impacts studying of the UV radiation shows that it affects the ecosystems’ biodiversity negatively and results in migrations and/or extinction of large species of animals and plants [1,2,3,4]. The ozone layer depletion and the inevitable rise of the levels of UV-A, UV-B and UV-C radiation affects negatively the organisms’ physiology, increases the frequency of cancer diseases in animals and inhibits plants’ vegetation and productivity [5,6]. In many publications devoted to this problem, the influence was studied of the light spectral composition on the plants’ growth and development; and the mechanisms of plant protection from the UV radiation were described including pigment synthesis and accumulation processes, the features of accumulation of the secondary metabolites and the functions of those substances [7,8,9,10].
It is well-known that in small doses, UV radiation can stimulate metabolic processes, thereby inducing a strengthening effect in plants [11]. When the plants are exposed to small doses of UV radiation, some insignificant changes occur in their morphological parameters, such as the plants’ fresh and dry mass, the average leaf area and the plant height. That is why the plants’ mechanisms of adaptation and photoprotection are studied mainly by the following metabolic parameters: the concentration of pigments and micro- and macro-nutrients, the content of nitrates, sugars and acids in the leaves, and the fruits of the plants. Mostly, the studies on this topic are carried out in an artificial environment, where conditions are created enabling the control of UV radiation exposure doses and duration. Many papers are devoted to studying of the influence of the sulfhydryl compounds (thiourea and dithiotreitol) and other active additives on the flavonoids concentration and accumulation rates as far as the flavonoids reduce significantly the stress caused by UV radiation [12,13,14,15]. First of all, the results of the studies of UV radiation’s effect on plants are important for enterprises growing agricultural products in an artificial climate. After all, the addition of UV spectrum rays to the main illumination will allow obtaining green and vegetable crops with the specified characteristics in terms of the contents of acids, sugars, anthocyanins and antioxidants and thereby increasing the nutritional value and taste qualities of the products.
Pigment concentration measurement by the chemical method takes quite a long time, limiting the ability to analyze a large number of samples, so sub-sampling is used instead. Modern digital technologies allow estimating the pigment concentration in a leaf by the analysis of its reflection spectra (analysis of the hyperspectral images) [16,17,18,19]. Based on such data, plant stress states can be determined [20,21,22] as well as the content of substances of interest, for example, shikimic acid [23]. Such measurements are carried out in a non-invasive way and require much less labor. However, in cases of the analysis of the purple-leaved crop, difficulties are encountered with assessment of the chlorophyll concentration.
Analysis of the published research on the UV radiation influences on green crops has revealed that only a few works are devoted to the effects of UV-A and UV-C on the purple-leaved crops. Additionally, the non-invasive methods are developed quite poorly for the pigment concentration measuring [24,25]. Taking the above into account, it was decided to study the photo-protective reactions of the red-leaved green crops under exposure to UV-A, UV-B, and UV-C radiation in addition to the main light. The plant reactions were evaluated by the change in the pigment concentration (by chemical method) and by the correlations presence between the obtained values and the vegetative indices calculated with aid of the hyperspectral images.
The aims of the conducted research were: to evaluate the effects of different UV radiation ranges (UV-A, UV-B, and UV-C) on the pigment concentration in plant leaves and the reflective characteristics of leaves; to give a general assessment of a stress state for the studied plants; to make a comparison between the results of the pigment concentration measurements obtained by the invasive biochemical method and the same obtained by the non-invasive research method (the optical method based on spectral analysis of the digital images made by a hyperspectral camera).

2. Materials and Methods

2.1. Vegetable Material

The experiment was carried out on the following purple-leaved varieties of the sweet basil (Ocimum basilicum L.): “Red Ruby”, “Gastronome” and “Markus” (“Prestige seeds” Ltd., Moscow, Russian Federation). Sweet basil is a herbaceous plant with a high content of essential oils that significantly affect both the taste and the flavor characteristics of the plant leaves. These essential oils are the secondary metabolites with pronounced antioxidant, antifungal, and antibacterial properties.
“Red Ruby” is an early-middle variety of basil. The plants are compact, not large. This variety is intended for growing both in protected soil (regardless in seedling or seedless culture) and in open ground. It has a strong clove aroma.
“Markus” is an early-middle variety of basil, too. It is recommended for growing both in open and protected ground. The variety adapts easily to various substrates, has a high cold resistance and is resistant to edge burn. It is rich in essential oils that give it the clove aroma.
“Gastronome” is a midseason-ripening, cold-resistant and leveled basil variety with stable color and the specific clove aroma.

2.2. Cultivation Conditions

The plants were grown in 1-L volume plastic pots. Seven seeds were sown in each pot; after germination, only three plants were left in each. As a substrate, the neutralized high-moor peat Agrobalt-C (“Rostorfininvest” CJSC, Moscow, Russian Federation) was used. Four groups of the basil plants of the three varieties (“Markus”, “Gastronome”, “Red Ruby”) were planted, five pots in each group; in total, sixty plants of each variety. For 60 days, the plants were cultivated in the phyto-chamber equipped with the automatic microclimate system under the following conditions: at the temperature range in day/night of 26/20 ± 1.0 °C and at the relative air humidity of 60 ± 10%. Watering was carried out by the drip method. The nutrient solutions were prepared on the basis of de-ionized water. The chemical composition of the nutrient solution was as follows: N-NO3 9.64 mM/L; N-NH4 1.07 mM/L; P-PO4 1.00 mM/L; K 5.77 mM/L; Ca 2.00 mM/L; Mg 1.65 mM/L; S-SO4 1.75 mM/L; Fe 15.00 μM/L; B 20.00 μM/L; Cu 1.00 μM/L; Zn 5.00 μM/L; Mn 10.00 μM/L; Mo 1.00 μM/L.

2.3. Irradiation Conditions

The volume of the phyto-chamber was divided by opaque panels into four equal compartments. In three of the four zones, in addition to the main lighting, there were installed additional LEDs emitting their radiation in the UV-A, UV-B, and UV-C ranges. (The fourth zone was for control). The spectral characteristics of the emitters in each zone are shown in Table 1. The UV irradiators consisted of an aluminum radiator with printed circuit boards with LEDs attached to them. The technical specifications of the installed LEDs are presented in Table 2. As a percentage of visible light, the intensity of the used UV emitters, comparable to that of sunlight, are for the Moscow summer season for 2019 and 2020 (with the exception of UV-C, which is absent under normal conditions, but it can be present in places with ozone holes in earth′s atmosphere).
In the photosynthetically active radiation zone, the exposure was provided by the combined LED-based irradiators of various spectral compositions. The light period duration was 16 h. The average irradiation intensity was 30 ± 1,2 Wm−2, which corresponds to the lower recommended level required for the normal basil cultivation.
The UV irradiators worked simultaneously with the main light. The UV irradiance was monitored with the portable UV radiometer TKA-PCM (STP “TKA”, Saint-Petersburg, Russian Federation).

2.4. Analysis of Pigment Content

The quantitative analysis of the pigment content was carried out on the 30th, 45th and 60th days of the cultivation. Five plants of each variety were chosen, with the 3rd leaf from the top taken for analysis.
In order to determine the quantitative content of the chlorophylls and the carotenoids, samples weighing 0.1 g were selected. The pigments were extracted from the plant tissues using 100% acetone. Weighing was performed on the laboratory electronic scales Sartorius LA230S laboratory scale (error rate 0.0001 g). After the filtration, the obtained extract was analyzed in the spectrophotometer SPECS SSP-705 (manufactured by “Spectroscopic systems” CJSC, Russia). The optical density was determined at the following wavelengths: 644 nm (peak absorption of the chlorophyll b), 662 nm (peak absorption of the chlorophyll a) and 440 nm (peak absorption of the carotenoids) as described by Semenova et al. [26]. The absorbing layer thickness in the cuvettes was 10 mm. The quantitative concentration of pigments was calculated by Holm–Wettstein method (for 100% acetone).
In order to determine the quantity of the anthocyanins, samples weighing 0.3 g were taken. Then the pigments were extracted from the plant tissues with use of the 1% hydrochloric acid solution; the tissues were kept in a water bath for 15 min at the temperature of 40–45 °C. After filtration, the samples remaining on the filter were extracted again using the 1% hydrochloric acid solution. The obtained extract was analyzed in the spectrophotometer SPECX SSP-705. The optical density was determined at the wavelengths of 510 nm and 657 nm (adjusted for the green pigment content accordingly) [27]. The thickness of the absorbing layer in the cuvette was 10 mm. The total content of the anthocyanins was calculated by cyanidin-3,5-diglycoside.

2.5. Vegetative Indices Calculation

The spectral characteristics of the leaves’ reflectivity were measured with aid of the portable hyperspectral camera Specim IQ (Spectral Imaging Ltd., Oulu, Finland). The reflection spectra were obtained for each individual pixel of the image in the range of 400–1000 nm (spectral resolution 7 nm, 204 spectral bands, spatial sampling of 512 pixels). Based on them, the vegetative indices were calculated. As the light source for Specim IQ, four halogen lamps were used. They were installed symmetrically relative to the camera position.
The spectral characteristics of the leaves’ reflectivity were measured on the 30th day of the cultivation. After the obtained hyperspectral images processing, the following well-known indices for the plants state assessment were calculated: the photochemical reflection index PRI (often used as the stress indicator), the indices ARI and mARI (used to assess the anthocyanins content in plant leaves), the chlorophyll indices MND705 and MND750/700 and the carotenoid index CRI700 [28,29]. The indices were calculated using the following formulas:
PRI = ((R531 − R570))/((R531 + R570))
ARI = (1/R550) − (1/R700)
mARI = R850 ((1/R550) − (1/R700))
MND705 = (R750 − R705)/(R750 + R705 − 2·R445)
R750/700 = R750/R700
CRI700 = (1/R510) − (1/R700)
The peak sensitivity of the reflection index to the anthocyanins concentration is found in the band of 550 nm. The 700 nm band is the chlorophyll absorption band; it is used in connection with the bands overlap of the light absorption by the chlorophyll and the anthocyanins. The band of 850 nm for the mARI index was taken as the closest one sensitive to reflection from the near-infrared range.

2.6. Statistical Analysis

The biochemical parameters were processed by applying ANOVA. To estimate the statistical significance of the considered parameters, the F-test and the least significant difference test were applied in the RStudio software.

3. Results and Discussion

3.1. Analysis of Basil Plants Habitus

The exposure to UV-A, UV-B, and UV-C had a significant impact on the basil growth and development. It was found that the UV-A and UV-B irradiation did stimulate the basil plants growth and development, although there was observed a variety-specific reaction of the “Red Ruby” variety to the UV-A and UV-B irradiation. In contrast to above, the UV-C irradiation caused substantial growth inhibition and burns on the leaves of all basil varieties (Figure 1).

3.2. Analysis of Pigment Content

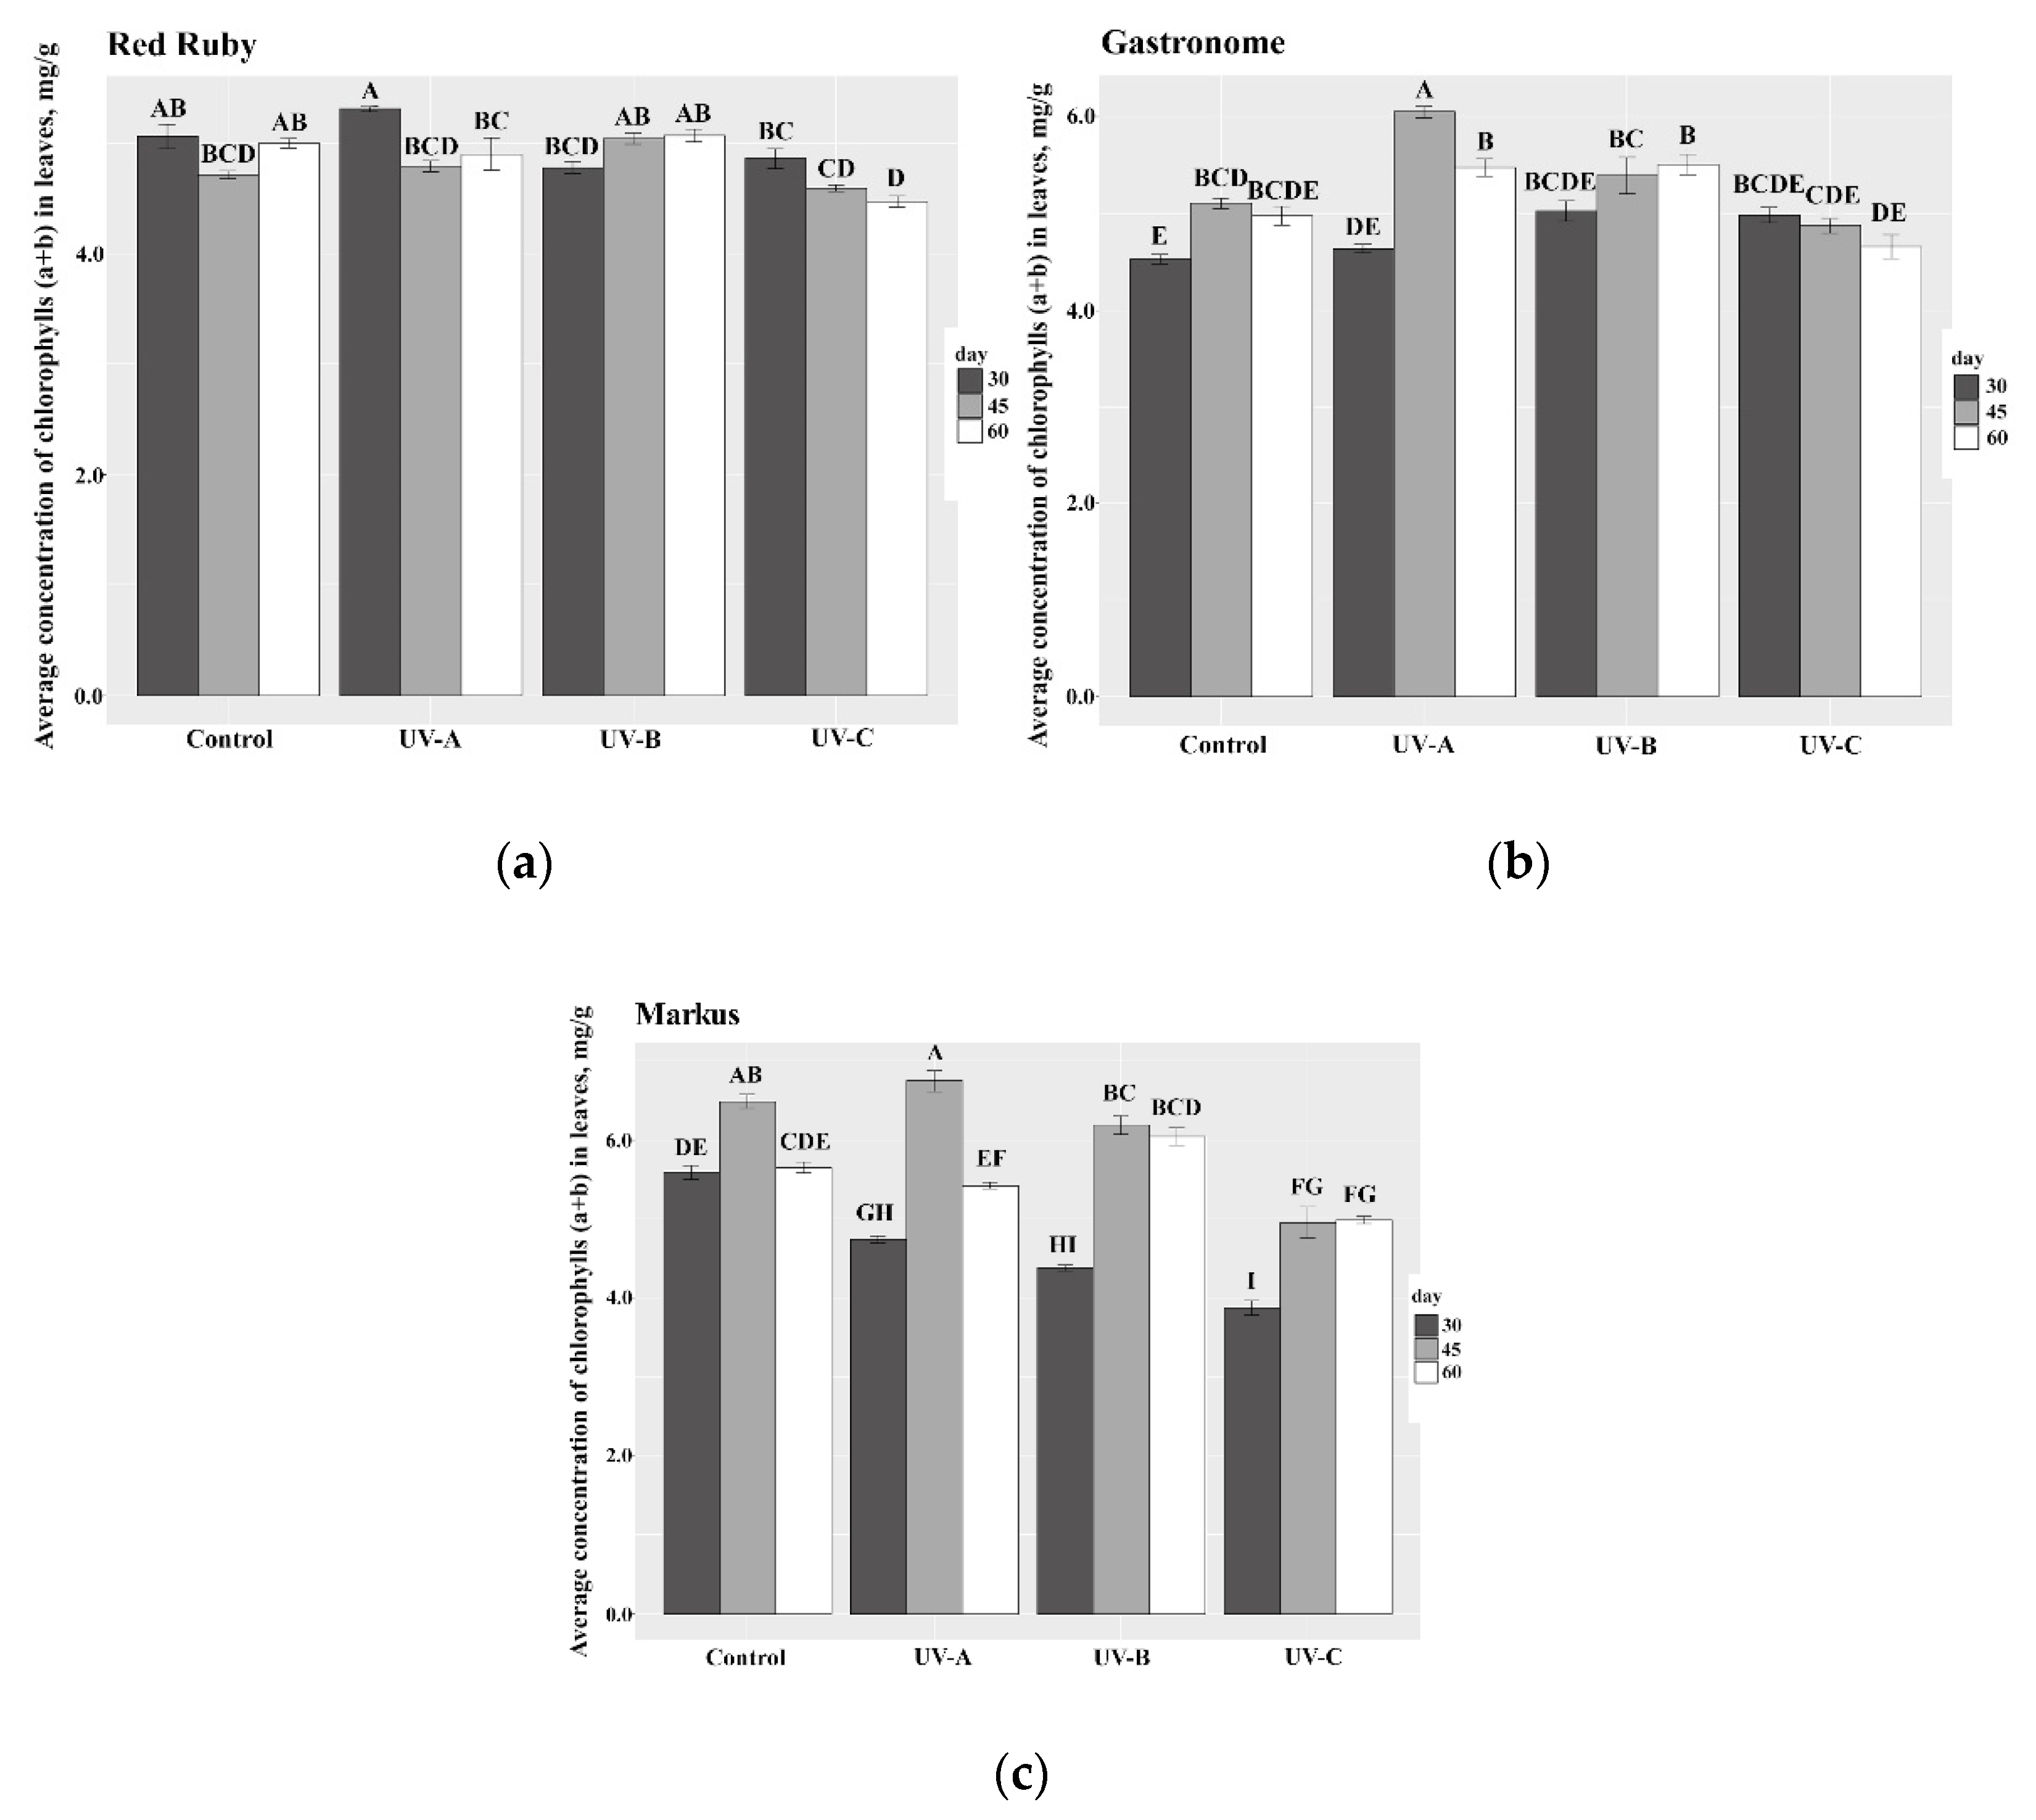
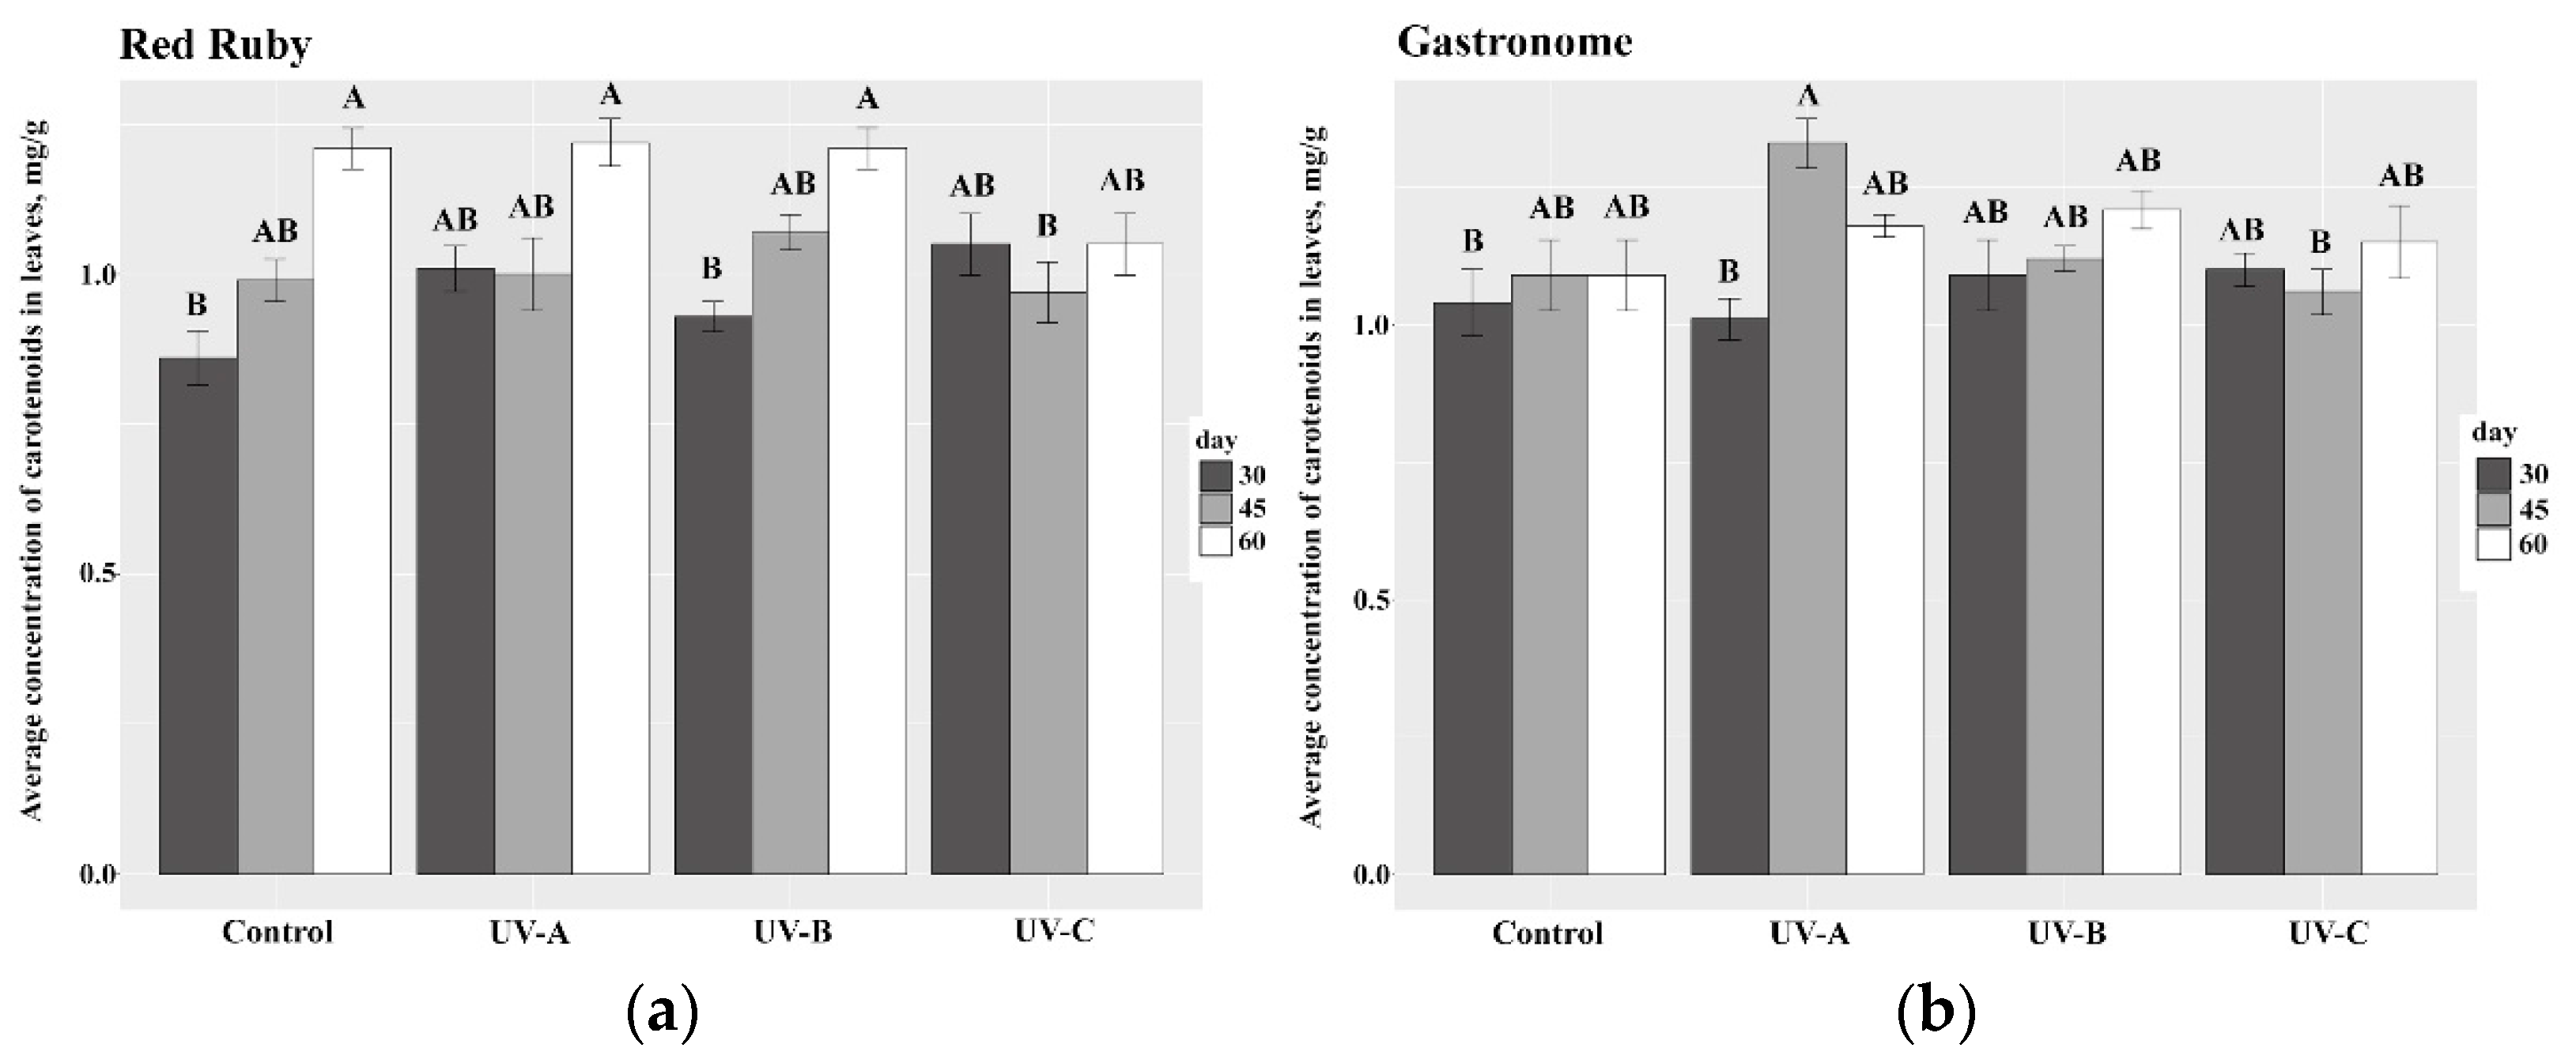
In the case of the “Red Ruby” variety: on the 30th and 45th days of the cultivation, the UV radiation had no significant effect on the chlorophyll concentration in leaves; the average concentration in all groups was 4.8–5.5 mg/g (Figure 2). In all the observed groups, the average carotenoids concentration in the leaves was approximately 1 mg/g (Figure 3). No significant effect of the UV radiation on the average carotenoids concentration in the leaves was revealed. The ratio of total chlorophyll to carotenoids showed that the plants actively photosynthesized; there were no signs of a physiological aging.
The “Gastronome” variety showed the greatest increase in the concentration of chlorophylls (by 17%) and carotenoids (by 25%) in the group with UV-A radiation on the 45th day of the cultivation. In the other variants of the UV irradiation, there was no significant differences from the control group.
The “Markus” variety showed a noticeable UV radiation effect on the average concentration of leaf total chlorophyll, mainly, on the 30th day of the cultivation. All the UV irradiation sources reduced the total chlorophyll concentration; along with this, the pattern changes in the carotenoid concentration differed from that of the chlorophyll. Carotenoids reduce the stress effect and protect the chlorophyll molecules from destruction caused by the light during the photo-oxidation [30]. Judging on the change in the ratio of carotenoids and chlorophylls, it can be concluded that the UV-C irradiation caused the greater stress and provoked the protective reaction emergence of the photosynthetic system of the basil plants of the “Markus” variety during the active growth period (on 30th day).
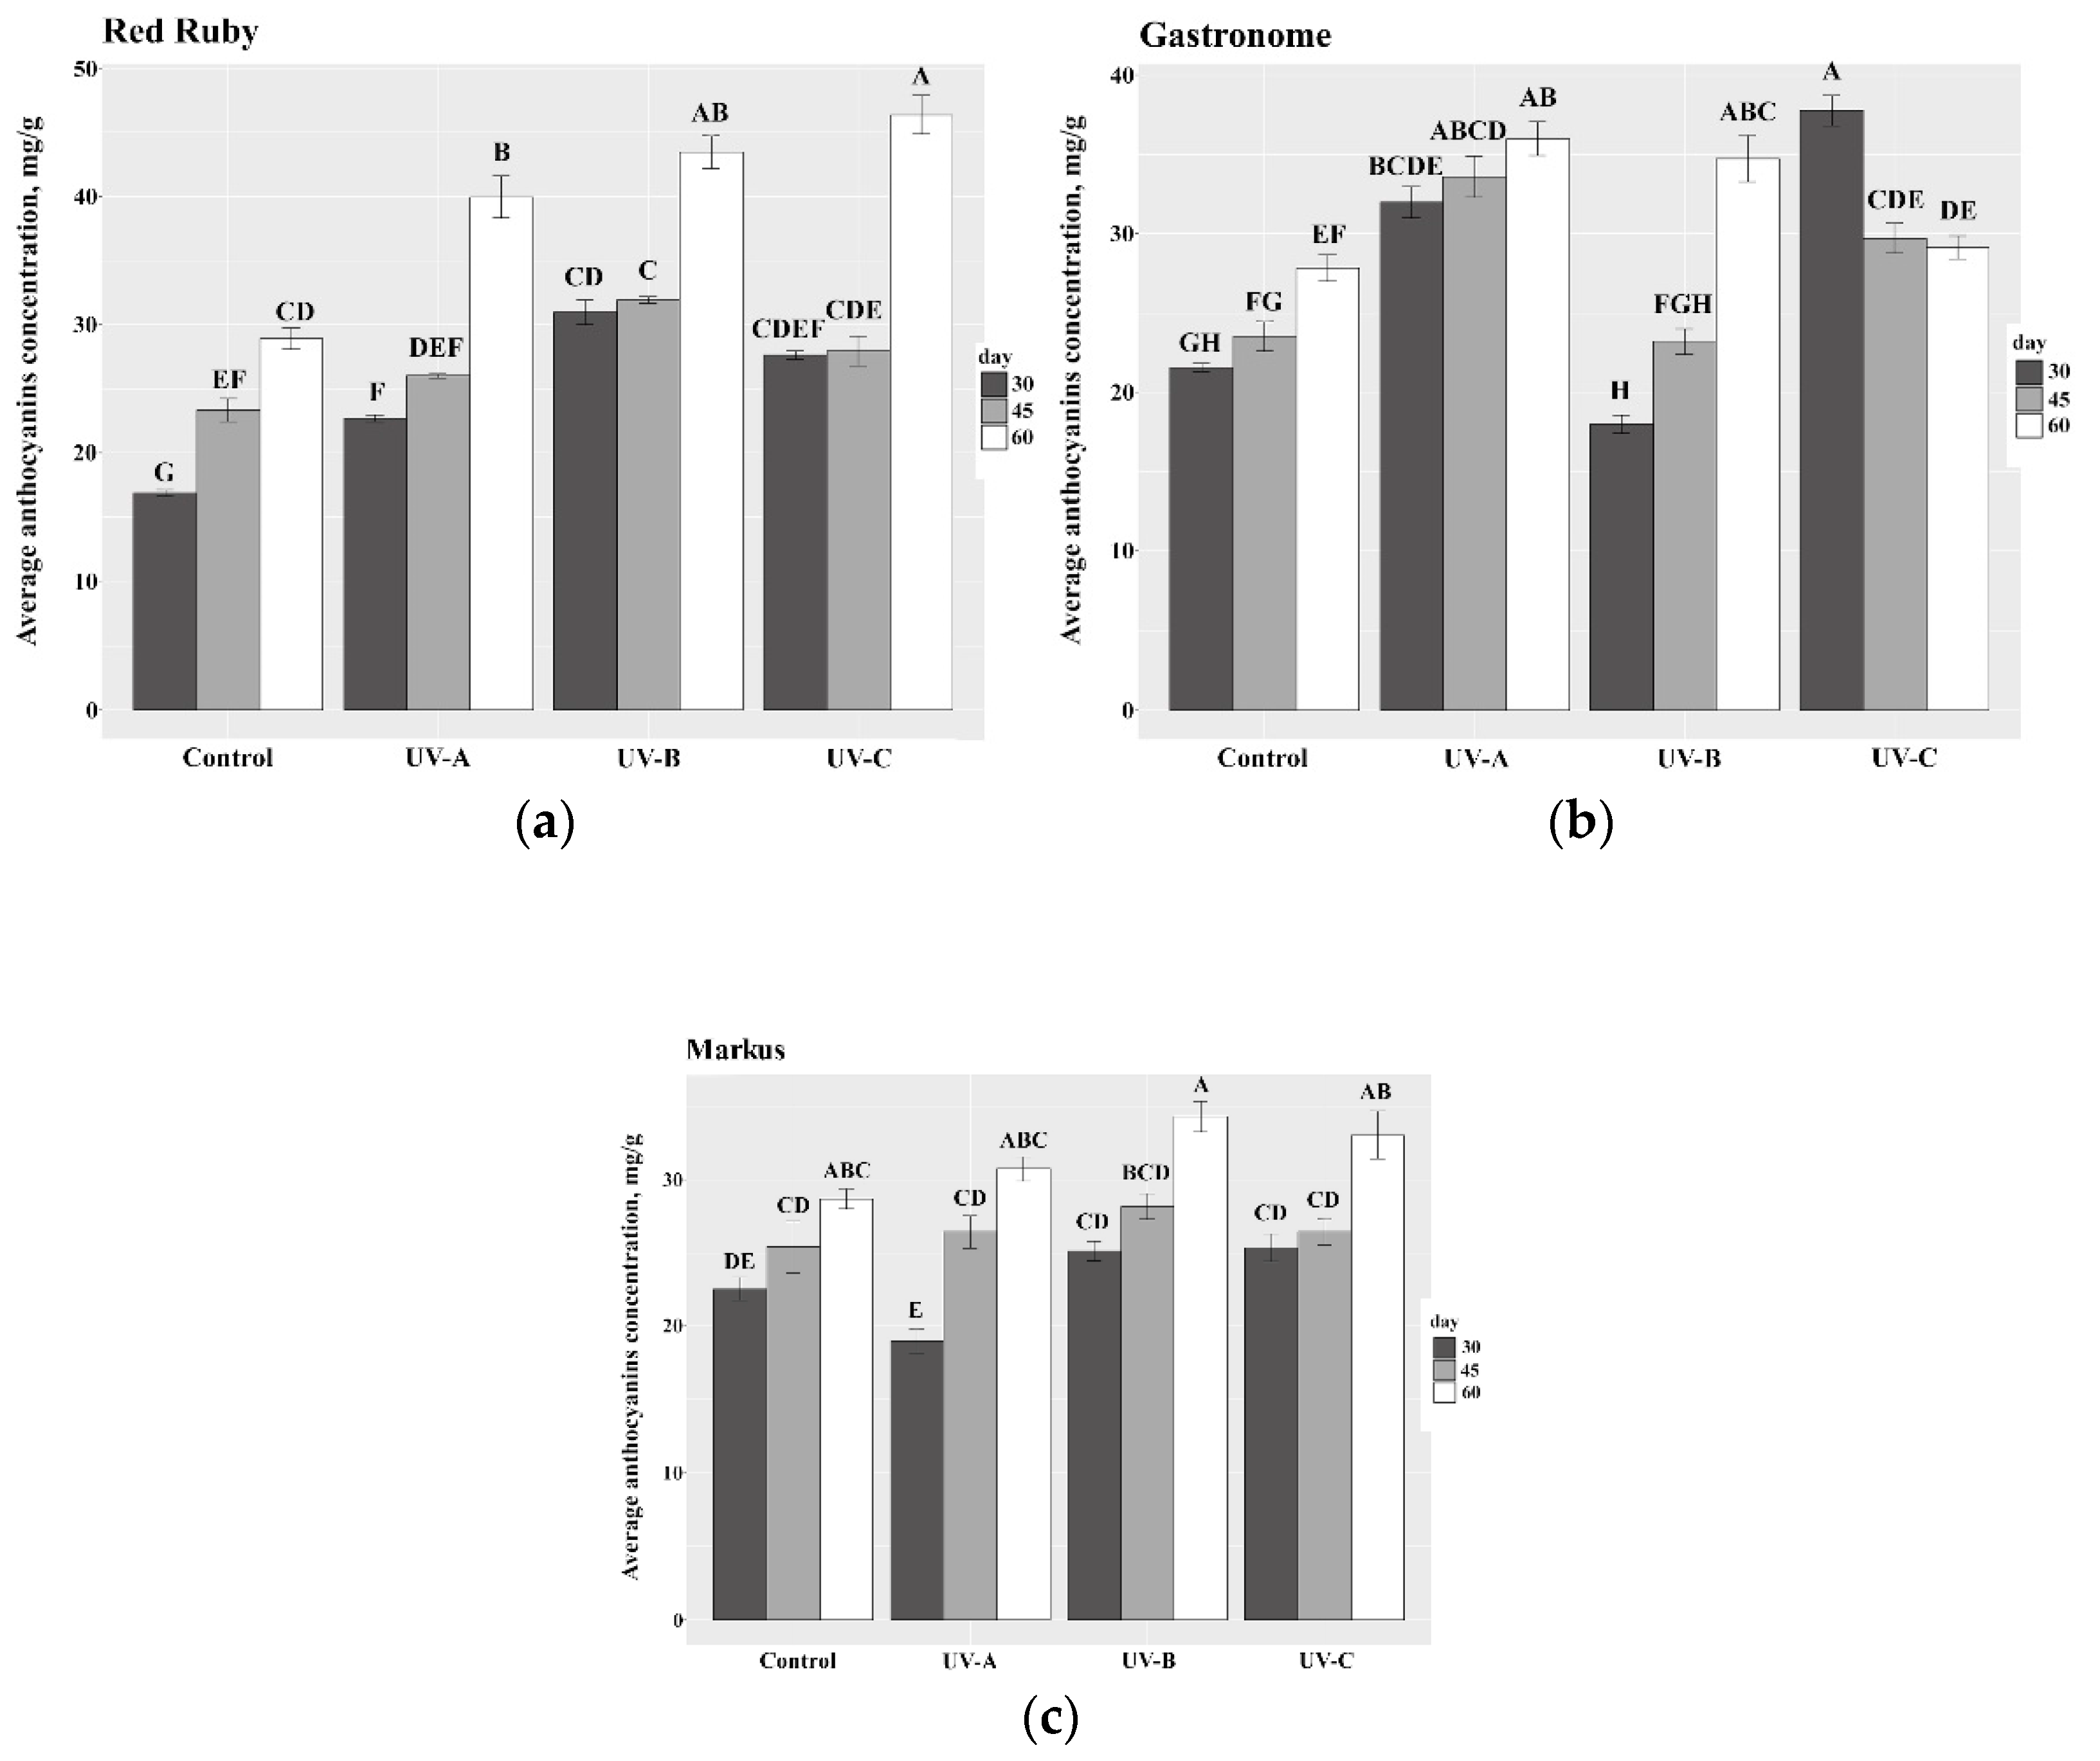
Analyzing the anthocyanin concentration in the plant leaves, it is found that in the “Red Ruby” variety, the average anthocyanin concentration in the leaves depends strongly on the exposure of the UV-A, UV-B, and UV-C irradiation. The UV-C radiation had the greatest effect on the 60th day of the cultivation (Figure 4). All groups differed with the UV radiation range, and there was observed a significant increase in anthocyanin concentration in leaves between the 45th and 60th day of cultivation by about 20–30%. In the case of the “Gastronome” variety, the average anthocyanin concentration in the leaves on the 60th day of the cultivation under the UV irradiation of different ranges has no significant difference from the control group. In the experiment variants of the “Markus” variety, the average anthocyanin concentrations obtained on the 30th, 45th and 60th days of the cultivation are the highest in the variants with the UV-B and UV-C radiation.
The high anthocyanins concentration in the variety “Red Ruby” on the 60th day of the cultivation indicates a greater response to the UV stress caused by the high-intensity lighting and the UV irradiation during budding and flowering than in the varieties “Gastronome” and “Markus”.
Most probably, the higher carotenoids concentration in the varieties “Gastronome” and “Markus” is attributed to the fact that due to the lower anthocyanins concentration, they take on the photo-protective function.

3.3. Analysis of Vegetative Indices

In the case of the hyperspectral analysis conducted with the purple-leaved crops, some difficulties arise in the indices’ calculation based on the light reflection in the spectrum green region. It is well-known that in the basil varieties with purple leaves, the anthocyanins are concentrated in the adaxial and abaxial epidermal cells in form of vacuolar solutions [31]. The anthocyanins can screen more than 90% of the green light giving protection to the mesophyll of the basil leaves from the photo-oxidative stress [32]. Figure 5 shows the reflection spectra of the purple and green leaves of the “Markus” basil variety. At a high anthocyanins concentration, the light absorption in the green part of the spectrum increases and so does the reflection in the near-infrared range. That is why it is impossible to identify the relationship between the PRI index and the stress states of the purple basil. So, in the future in order to assess the stress conditions, we used the vegetative indices associated with the photosynthetic pigment concentration.
The main advantage of the spectral method based on the reflection spectra analysis for the assessment of the pigment content consists in the fact that it is possible to determine their concentrations both for the whole plant and for an individual leaf (Figure 6 and Figure 7).
The analysis revealed the uneven distribution of the indices of R750/R700 for chlorophylls and mARI for anthocyanins over the leaf area (Figure 6 and Figure 7). Similar results were obtained for other indices under study (the data are not provided). This can be attributed to the varietal characteristics of the purple basil, which, depending on a variety, is characterized by instability of the purple pigments (anthocyanins) in both individual leaves and the whole plant [33]. Additionally, the uneven distribution of the index is affected by shadows due to uneven lighting and the glare of reflected light from the glossy surface of the leaf. To process the obtained hyperspectral images, the software “Envi 5.2” was used, the vegetative indices average values were obtained for whole plants on the 30th day of cultivation. For analyzing, from images of individual leaves, several areas were selected not containing any glare and shadows; then the average index value for the selected areas was determined (Table 3).
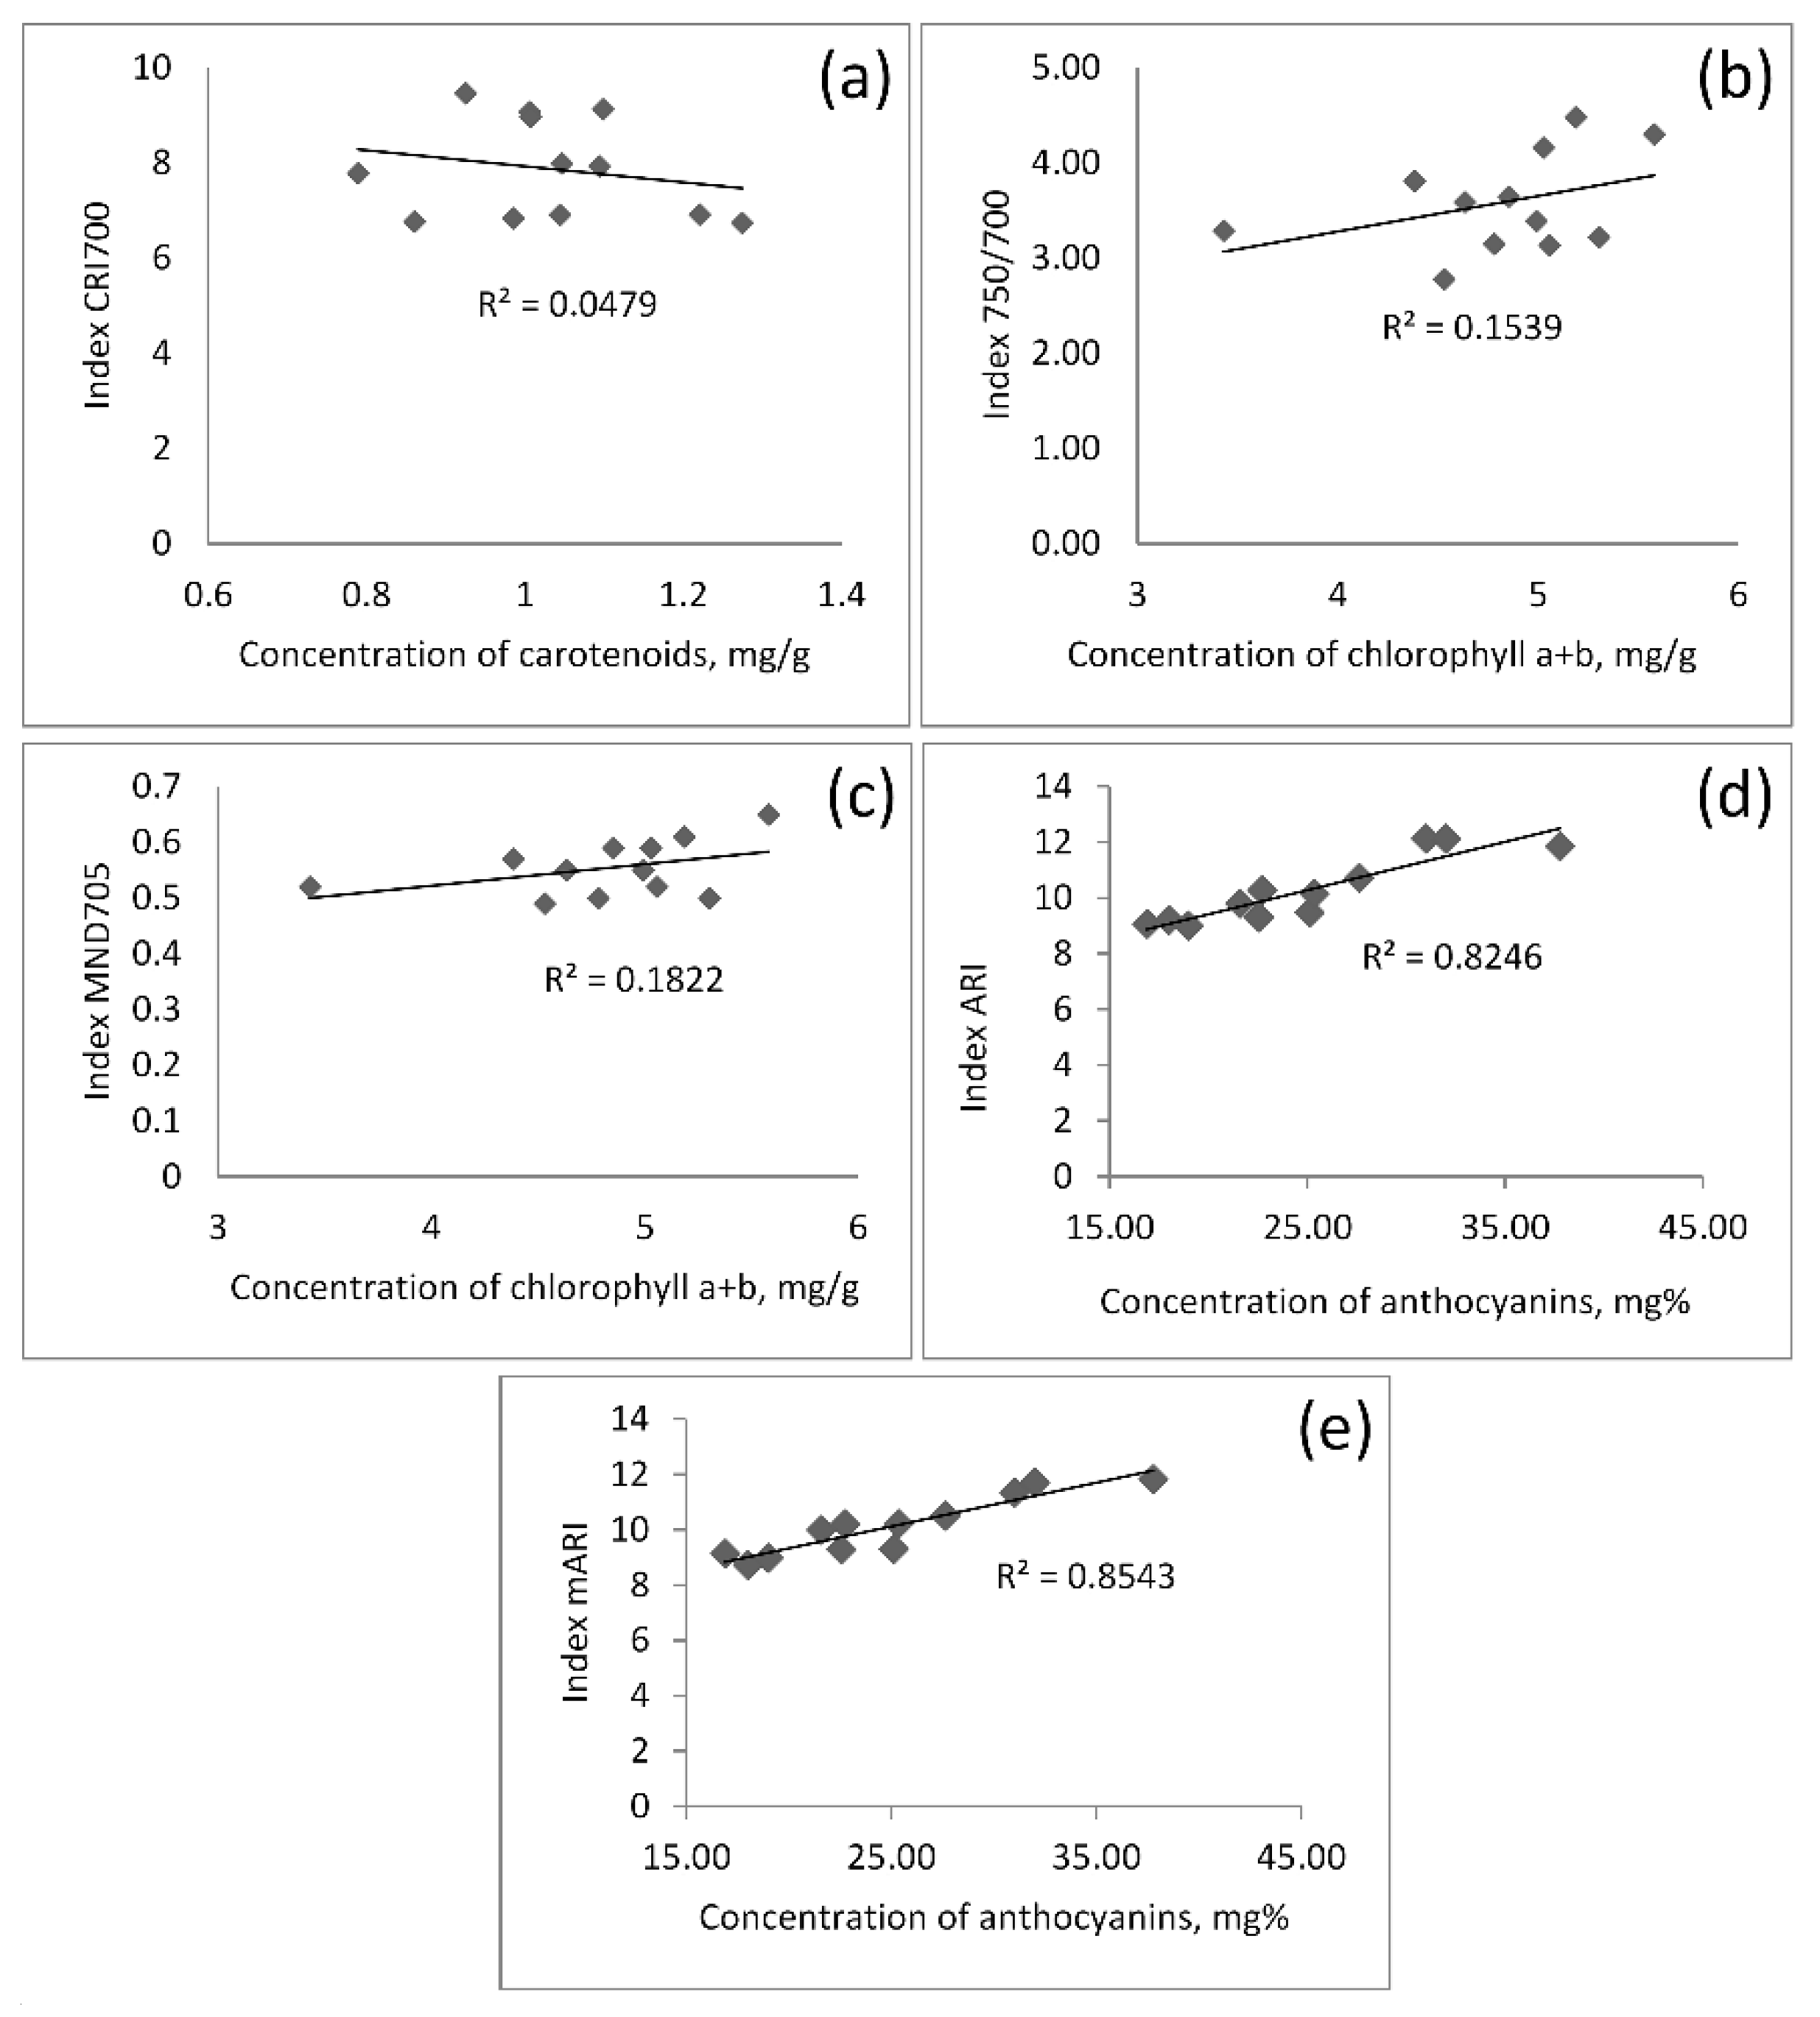
In order to test the effectiveness of the proposed method, the correlation was estimated between the obtained values of the vegetative indices ARI and mARI and the anthocyanins concentration value in the basil leaves obtained by the chemical method (Figure 8).
The determination coefficients R2 = 0.82 for ARI and R2 = 0.85 for mARI indicate a high degree of correlation, which indicates the acceptability of this method for the anthocyanins content assessment in plant leaves. For the carotenoids, a weak correlation was observed (R2 = 0.0479), which is explained by the shielding effect of the anthocyanins as far as the CRI700 index is determined at the reflection band of 510 nm, which coincides with the maximum absorption of the anthocyanins [32]. The weak correlations of the R750/R700 and MND705 indices obtained for the chlorophylls can be explained by the large unevenness of the reflection spectra over the leaf area (Figure 6), which is typical for the purple basil. After all, on the crops with the green leaves, the strong correlations of these indices with the chlorophyll content were revealed [34]. Additionally, the deviations present in the results are influenced by such factors as the geometry of a leaf, the uneven lighting, the morphological features (thickness and density of the sheet), etc.
For a more accurate assessment of the stress factors’ impact on the concentrations of the chlorophylls and the carotenoids in the purple-leaved crops and on the overall productivity, it is necessary to conduct some additional research and develop such reflection indices that take into account the shielding effect of the purple pigments.

4. Conclusions

The highest concentration of anthocyanins in leaves was recorded for the “Red Ruby” variety under continuous UV-C irradiation (30% higher than in controls); it was relatively lower in the samples under UV-B and UV-A (20–25% higher than in controls). Most probably, the higher anthocyanins concentration in the case of the “Red Ruby” variety compared to the “Gastronome” and “Markus” varieties under the UV irradiation of the studied ranges indicates a greater adaptability of the “Red Ruby” variety to the stresses caused by the UV radiation. The strong correlation between the obtained values of the vegetative indices ARI and mARI and the anthocyanins concentration in the basil leaves shows the possibility of using hyperspectral cameras to study the biochemical processes occurring during the plants’ vegetation. These results can be used for the development of light growing quantitative recommendations, for productivity increasing, and for food products obtaining with a high content of the anthocyanins. However, for the indices of chlorophyll and carotenoids, the correlations are found to be low, which is primarily due to the shielding effect of the anthocyanins and the uneven color of the leaves.

Author Contributions

Conceptualization and methodology, A.A.S. and Y.A.P.; validation, N.A.S.; formal analysis, Y.A.P. and N.A.S.; investigation and resources, A.S.I.; writing—original draft preparation, Y.A.P. and A.A.S.; writing—review and editing, N.A.S. and A.A.S., visualization, D.A.B.; supervision and funding acquisition, A.S.D. and V.A.P.; project administration, A.S.D. All authors have read and agreed to the published version of the manuscript.

Funding

This research was funded by a grant of the Ministry of Science and Higher Education of the Russian Federation for large scientific projects in priority areas of scientific and technological development (subsidy identifier 075-15-2020-774).

Institutional Review Board Statement

Not applicable.

Informed Consent Statement

Not applicable.

Data Availability Statement

No additional data available.

Conflicts of Interest

The authors declare no conflict of interest. The funders had no role in the design of the study, in the collection, analyses, or interpretation of the data, in the writing of the manuscript, or in the decision to publish the results.

References

  1. Ganzeveld, L.; Bouwman, L.; Stehfest, E.; van Vuuren, D.P.; Eickhout, B.; Lelieveld, J. Impact of future land use and land cover changes on atmospheric chemistry-climate interactions. J. Geophys. Res. Atmos. 2010, 115, D23301. [Google Scholar] [CrossRef]
  2. Parrish, D.D.; Derwent, R.G.; Staehelin, J. Long-term changes in northern mid-latitude tropospheric ozone concentrations: Synthesis of two recent analyses. Atmos. Environ. 2021, 248, 118227. [Google Scholar] [CrossRef]
  3. Bodeker, G.E.; Kremser, S. Indicators of Antarctic ozone depletion: 1979 to 2019. Atmos. Chem. Phys. 2021, 21, 5289–5300. [Google Scholar] [CrossRef]
  4. Neale, R.E.; Barnes, P.W.; Robson, T.M.; Neale, P.J.; Williamson, C.E.; Zepp, R.G.; Wilson, S.R.; Madronich, S.; Andrady, A.L.; Heikkilä, A.M.; et al. Environmental effects of stratospheric ozone depletion, UV radiation, and interactions with climate change: UNEP Environmental Effects Assessment Panel, Update 2020. Photochem. Photobiol. Sci. 2021, 20, 1–67. [Google Scholar] [CrossRef] [PubMed]
  5. Rafanelli, C.; Damiani, A.; Benedetti, E.; De Simone, S.; Anav, A.; Ciattaglia, L.; Di Menno, I. UV Solar Radiation in Polar Regions: Consequences for the Environment and Human Health. UV Radiat. Glob. Clim. Chang. 2010, 73–105. [Google Scholar] [CrossRef]
  6. Bornman, J.F.; Barnes, P.W.; Robinson, S.A.; Ballaré, C.L.; Flinte, S.D.; Caldwell, M.M. Solar ultraviolet radiation and ozone depletion-driven climate change: Effects on terrestrial ecosystems. Photochem. Photobiol. Sci. 2015, 14, 88–107. [Google Scholar] [CrossRef] [Green Version]
  7. Takshak, S.; Agrawal, S. Defense potential of secondary metabolites in medicinal plants under UV-B stress. J. Photochem. Photobiol. B Biol. 2019, 193, 51–88. [Google Scholar] [CrossRef]
  8. Skarupova, D.; Vostalova, J.; Svobodova, A.R. Ultraviolet A protective potential of plant extracts and phytochemicals. Biomed. Pap. Med. Fac. Univ. Palacky Olomouc Czech Repub. 2020, 164, 1–22. [Google Scholar] [CrossRef] [PubMed] [Green Version]
  9. Emiliani, J.; D’Andrea, L.; Falcone Ferreyra, M.L.; Maulión, E.; Rodríguez, E.J.; Rodriguez-Concepcion, M.; Casati, P. A role for beta, beta-xanthophylls in Arabidopsis UV-B photoprotection. J. Exp. Bot. 2018, 69, 4921–4933. [Google Scholar] [CrossRef] [PubMed]
  10. Pandey, A.; Jaiswal, D.; Agrawal, S.B. Ultraviolet-B mediated biochemical and metabolic responses of a medicinal plant Adhatoda vasica Nees at different growth stages. J. Photochem. Photobiol. B Biol. 2021, 216, 112142. [Google Scholar] [CrossRef]
  11. Mariz-Ponte, N.; Martins, S.; Gonçalves, A.; Correia, C.M.; Ribeiro, C.; Celeste Dias, M.; Santos, C. The potential use of the UV-A and UV-B to improve tomato quality and preference for consumers. Sci. Hortic. 2019, 246, 777–784. [Google Scholar] [CrossRef]
  12. Pandey, M.; Srivastava, A.K.; Suprasanna, P.; D’Souza, S.F. Thiourea mediates alleviation of UV-B stress-induced damage in the Indian mustard (Brassica juncea L.). J. Plant Interact. 2012, 7, 143–150. [Google Scholar] [CrossRef] [Green Version]
  13. Boghdady, M.S.; Desoky, E.M.; Azoz, S.N.; Nassar, D.M.A. Effect of Selenium on Growth, Physiological Aspects and Productivity of Faba Bean (Vicia faba L.). Egypt. J. Agron. 2017, 39, 83–97. [Google Scholar] [CrossRef] [Green Version]
  14. Germ, M.; Stibilj, V.; Šircelj, H.; Jerše, A.; Kroflič, A.; Golob, A.; Maršić, N.K. Biofortification of common buckwheat microgreens and seeds with different forms of selenium and iodine. J. Sci. Food Agric. 2019, 99, 4353–4362. [Google Scholar] [CrossRef] [PubMed]
  15. Golob, A.; Novak, T.; Marsic, N.K.; Sircelj, H.; Stibilj, V.; Jerse, A.; Kroflic, A.; Germ, M. Biofortification with selenium and iodine changes morphological properties of Brassica oleracea L. var. gongylodes) and increases their contents in tubers. Plant Physiol. Biochem. 2020, 150, 234–243. [Google Scholar] [CrossRef]
  16. Sytar, O.; Zivcak, M.; Neugart, S.; Brestic, M. Assessment of hyperspectral indicators related to the content of phenolic compounds and multispectral fluorescence records in chicory leaves exposed to various light environments. Plant Physiol. Biochem. 2020, 154, 429–438. [Google Scholar] [CrossRef]
  17. Alt, V.V.; Gurova, T.A.; Elkin, O.V.; Klimenko, D.N.; Maximov, L.V.; Pestunov, I.A.; Dubrovskaya, O.A.; Genaev, M.A.; Erst, T.V.; Genaev, K.A.; et al. The use of Specim IQ, a hyperspectral camera, for plant analysis. Vavilov J. Genet. Breed. 2020, 24, 259–266. [Google Scholar] [CrossRef]
  18. An, G.Q.; Xing, M.F.; He, B.B.; Liao, C.H.; Huang, X.D.; Shang, J.L.; Kang, H.Q. Using Machine Learning for Estimating Rice Chlorophyll Content from In Situ Hyperspectral Data. Remote Sens. 2020, 12, 3104. [Google Scholar] [CrossRef]
  19. Zhang, J.; Tian, H.Q.; Wang, D.; Li, H.; Mouazen, A.M. A novel spectral index for estimation of relative chlorophyll content of sugar beet. Comput. Electron. Agric. 2021, 184, 106088. [Google Scholar] [CrossRef]
  20. Li, L.; Zhang, Q.; Huang, D.F. A Review of Imaging Techniques for Plant Phenotyping. Sensors 2014, 14, 20078–20111. [Google Scholar] [CrossRef]
  21. Behmann, J.; Steinrucken, J.; Plumer, L. Detection of early plant stress responses in hyperspectral images. ISPRS J. Photogramm. Remote Sens. 2014, 93, 98–111. [Google Scholar] [CrossRef]
  22. Proctor, C.; Dao, P.D.; He, Y.H. Close-range, heavy-duty hyperspectral imaging for tracking drought impacts using the PROCOSINE model. J. Quant. Spectrosc. Radiat. Transf. 2021, 263, 107528. [Google Scholar] [CrossRef]
  23. Feng, X.P.; Yu, C.L.; Chen, Y.; Peng, J.Y.; Ye, L.H.; Shen, T.T.; Wen, Y.; He, Y. Non-destructive Determination of Shikimic Acid Concentration in Transgenic Maize Exhibiting Glyphosate Tolerance Using Chlorophyll Fluorescence and Hyperspectral Imaging. Front. Plant Sci. 2018, 9, 468. [Google Scholar] [CrossRef] [PubMed]
  24. Blackburn, G.A. Hyperspectral remote sensing of plant pigments. J. Exp. Bot. 2007, 58, 855–867. [Google Scholar] [CrossRef] [Green Version]
  25. Gitelson, A.A.; Chivkunova, O.B.; Merzlyak, M.N. Nondestructive estimation of anthocyanins and chlorophylls in anthocyanic leaves. Am. J. Bot. 2009, 96, 1861–1868. [Google Scholar] [CrossRef]
  26. Semenova, N.A.; Smirnov, A.; Grishin, A.; Pishchalnikov, R.Y.; Chesalin, D.D.; Gudkov, S.V.; Chilingaryan, N.O.; Skorokhodova, A.N.; Dorokhov, A.S.; Izmailov, A.Y. The Effect of Plant Growth Compensation by Adding Silicon-Containing Fertilizer under Light Stress Conditions. Plants 2021, 10, 1287. [Google Scholar] [CrossRef]
  27. Maslennikov, P.; Chupakhina, G.; Skrypnick, L.; Fedurayev, P.; Poltavskaya, R. Content of anthocyanin and carotenoid pigments in medicinal plants. Bull. Mosc. Reg. State Univ. 2013, 1, 6. [Google Scholar]
  28. Gitelson, A.A.; Merzlyak, M.N.; Chivkunova, O.B. Optical properties and nondestructive estimation of anthocyanin content in plant leaves. Photochem. Photobiol. 2001, 74, 38–45. [Google Scholar] [CrossRef]
  29. Ferri, C.P.; Formaggio, A.R.; Schiavinato, M.A. Narrow band spectral indexes for chlorophyll determination in soybean canopies [Glycine max (L.) Merril]. Braz. J. Plant Physiol. 2004, 16, 131–136. [Google Scholar] [CrossRef]
  30. Afanasyev, I.A.; Smashevsky, N.D. The structure of the photosynthetic apparatus of the plant genues Tamarix which grows in the Astrakhan region. Nat. Sci. 2013, 2, 11–13. [Google Scholar]
  31. Landi, M.; Guidi, L.; Pardossi, A.; Tattini, M.; Gould, K.S. Photoprotection by foliar anthocyanins mitigates effects of boron toxicity in sweet basil (Ocimum basilicum). Planta 2014, 240, 941–953. [Google Scholar] [CrossRef]
  32. Nichelmann, L.; Bilger, W. Quantification of light screening by anthocyanins in leaves of Berberis thunbergia. Planta 2017, 246, 1069–1082. [Google Scholar] [CrossRef] [PubMed]
  33. Phippen, W.B.; Simon, J.E. Anthocyanin inheritance and instability in purple basil (Ocimum basilicum L.). J. Hered. 2000, 91, 289–296. [Google Scholar] [CrossRef] [PubMed] [Green Version]
  34. Sims, D.A.; Gamon, J.A. Relationships between leaf pigment content and spectral reflectance across a wide range of species, leaf structures and developmental stages. Remote Sens. Environ. 2002, 81, 337–354. [Google Scholar] [CrossRef]
Figure 1. Basil plants of varieties “Red Ruby”, “Gastronome” and “Markus” on 45th and 60th days of cultivation; from left to right: control, UV-A, UV-B, and UV-C.
Applsci 11 08804 g001
Figure 2. Average concentration of chlorophylls (a+b) in leaves, mg/g. Obtained on 30th, 45th and 60th days of cultivation of following basil varieties: “Red Ruby” (a), “Gastronome” (b) and “Markus” (c).
Applsci 11 08804 g002
Figure 3. Average concentration of carotenoids in leaves. Obtained on 30th, 45th and 60th days of cultivation of following basil varieties: “Red Ruby” (a), “Gastronome” (b) and “Markus” (c).
Applsci 11 08804 g003aApplsci 11 08804 g003b
Figure 4. Average anthocyanins concentration on 30th, 45th and 60th day of cultivation of basil “Red Ruby” (a), “Gastronome” (b) and “Markus” (c).
Applsci 11 08804 g004
Figure 5. Reflection spectra (A) and appearance (B) of purple and green basil leaves of “Markus” on 30th day of cultivation.
Applsci 11 08804 g005
Figure 6. Graphic image of mARI index of basil leaves in false colors on 30th day of cultivation.
Applsci 11 08804 g006
Figure 7. Graphic image of R750/R700 index of basil leaves in false colors on 30th day of cultivation.
Applsci 11 08804 g007
Figure 8. Evaluation of correlation between pigment concentration and vegetation indices obtained on 30th day of cultivation. (a) Correlation between CRI700 index and carotenoids concentration; (b) correlation between the R750/R500 index and a+b chlorophylls concentration; (c) correlation between MND705 index and a+b chlorophylls concentration; (d) correlation between ARI index and anthocyanins concentration; (e) correlation between mARI index and anthocyanins concentration.
Applsci 11 08804 g008
Table 1. Spectral properties of radiation sources.
No.Experiment
Variant
Main Lighting,
W m−2
UV-Radiation,
W m−2
B
400–500
nm
G
500–600
nm
R
600–700
nm
FR
700–800
nm
UV-A
315–400
nm
UV-B
280–315
nm
UV-C
100–280
nm
1UV-A5
± 0.5
9.5 ±0.315.8
± 0.4
1.5
± 0.1
1.5 ± 0.2--
2UV-B-0.015 ± 0.005-
3UV-C--0.010
± 0.002
4Control---
Table 2. Characteristics of UV-LEDs.
CharacteristicsType of UV-LEDs
UV-A Raytron SolutionUV-B SzyunjuUV-C Epistar
Peak current, mA7504040
Output power, W2.4 ÷ 2.62 ÷ 44 ÷ 6
Direct voltage, V3.2 ÷ 3.85 ÷ 85 ÷ 8
Viewing angle, °60120120
Peak wavelength, nm365310275
Table 3. Average values of vegetative indices for basil varieties “Red Ruby”, “Gastronome” and “Markus” on 30th day of cultivation.
Plant VarietySample GroupIndex ARIIndex mARIIndex R750/R700Index MND705Index CRI700
“Red Ruby”Control9.079.153.140.526.77
UV-A10.2810.213.220.59.07
UV-B12.1411.363.150.509,47
UV-C10.7310.523.650.598.00
“Gastronome”Control9.8110.012.780.496.91
UV-A12.1311.713.590.558.97
UV-B9.218.734.160.597.94
UV-C11.8711.843.390.559.13
“Markus”Control9.329.304.300.656.74
UV-A9.018.993.290.527.79
UV-B9.489.323.810.576.84
UV-C10.1610.234.480.616.92
Publisher’s Note: MDPI stays neutral with regard to jurisdictional claims in published maps and institutional affiliations.