1. Introduction
In soccer, running performance (RP) has been extensively studied over the last two decades [
1,
2]. Detailed knowledge about this performance in match play is essential for the design and implementation of specific fitness training [
3,
4,
5,
6]. Previous studies have demonstrated that players regularly transit between brief bouts of high-intensity running and longer periods of low-intensity running [
1,
7]. These performances can be affected by different factors, such as the player’s playing position in the game [
8,
9,
10], physical capacities [
7,
11,
12], tactical formations [
13,
14] and technical level [
15]. In addition, contextual variables, such as the match status (win, draw, lose), location (home, away) and opponents’ level (top, middle, bottom), impact the RP [
16,
17,
18].
However, despite the importance of developing optimal physical conditioning in elite soccer players, information about the influence of RP on team achievement in soccer is scarce and contradictory [
19]. Specifically, studies have reported that less successful teams achieve greater RP (e.g., total distance covered and high-intensity distance covered) [
20,
21], while more recent studies have revealed similar RP in both successful and unsuccessful teams [
22,
23]. It is possible that these inconsistencies might be characterised by differences in the geographical, cultural, historical and social aspects of soccer teams from different countries [
24,
25,
26].
It is important to note that previously cited findings have referred to the pure RP without the context of ball possession. However, since ball possession is an important determinant of most successful teams [
27,
28], the RP with ball possession may have a greater influence on success in soccer than the RP without ball possession [
19,
22]. In support of this concept, Brito Souza et al. analysed the RP with and without ball possession from the Spanish La Liga and reported that distances covered with ball possession (above and below 21 km/h) were the main contributors of success (i.e., defined as the total earned points), while the running distance without ball possession had a minimal influence on the analysis [
19]. Similarly, Hoppe et al. reported moderate to strong correlations between all RPs with ball possession and the total points accumulated at the end of the German Bundesliga season, while the RP without ball possession was unrelated to the earned points [
22]. Furthermore, the distance covered with the ball was greater in more successful teams in the Serie A League, particularly when running with the ball at >14 km/h [
20]. In contrast to the previously cited studies [
19,
20,
22], the study from the Spanish La Liga indicated the same RP (at >21 km/h) and running distance with ball possession in both successful and unsuccessful teams [
23]. Although these investigations infer the importance of running with ball possession, the true influences of these actions on overall success in soccer remain unknown [
19].
All of the previously cited studies have analysed data from national competitions in Italy, Germany and Spain. However, there is no evidence of how the RP with ball possession affects team achievement in the most prestigious and most popular soccer competition [
29]: the UEFA Champions League (UCL). In addition, these studies have not analysed the influence of playing positions. Thus, the individual contributions of players at different playing positions on team achievement are still unknown. Therefore, the main objectives of this study were (i) to evaluate the RPs of players at different playing positions specifically for the attacking and defensive phases of the game, and (ii) to determine the associations between team achievement in the group stage of the UCL and the players’ RP in the attacking and defensive phases of the game and. We believe that the findings from this study will enable a better understanding of the differences between successful and unsuccessful teams in top-level soccer. Moreover, considering that success in soccer is dependent on the cooperative and competitive interactions between individuals [
30,
31], this study will help soccer coaches to determine the individual roles of players in achieving success.
2. Materials and Methods
2.1. Participants and Design
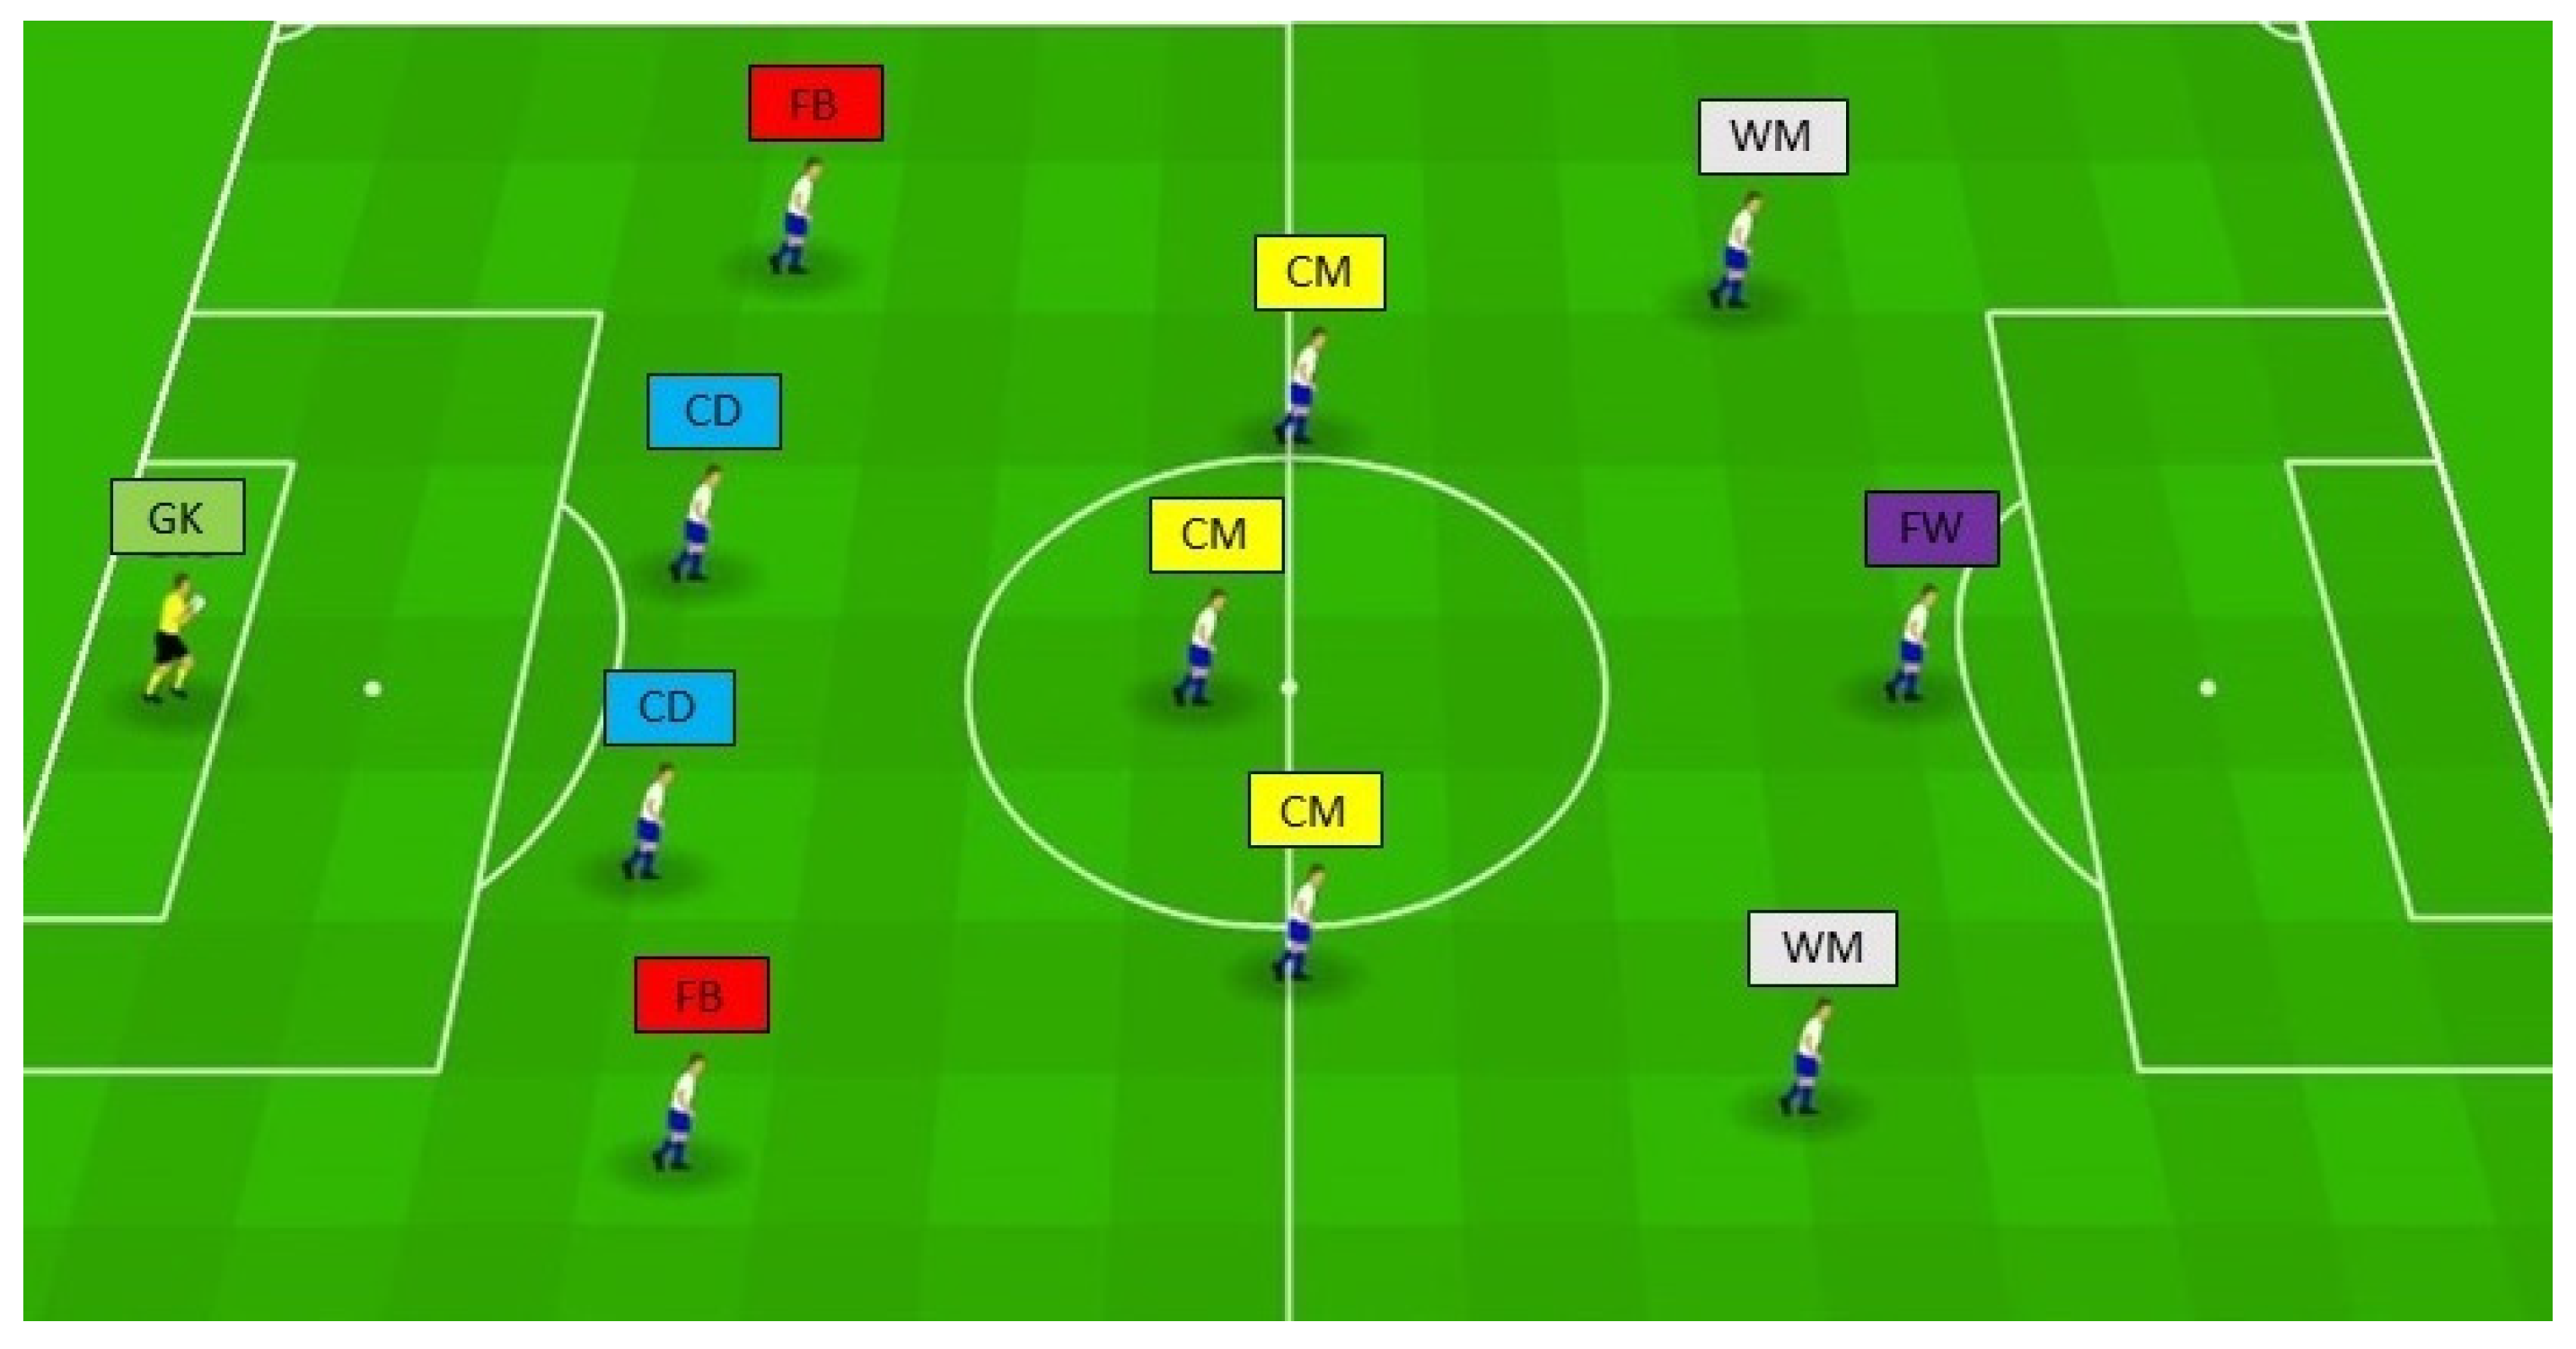
The participants in this study were top elite soccer players from teams that competed in the group stage of the UCL in the 2020/21 season. All RPs in the attacking phase (AP) and defensive phase (DP) of the game (please see the
Section 2.2 for the division of the RPs in the AP and DP) were obtained from 20 matches from groups A (
n = 3), B (
n = 3), C (
n = 4), E (
n = 4), F (
n = 3) and G (
n = 3), resulting in 244 matched RPs that were used as cases for this study. Only the results of players who participated in entire matches were analysed. Players’ RPs were divided according to soccer-specific playing positions as follows: central defenders (CD;
n = 79), fullbacks (FB;
n = 65), central midfielders (CM;
n = 55), wide midfielders (WM;
n = 28) and forwards (FW;
n = 17). Goalkeepers (GK) were excluded from the analysis due to the specificity of the position (
Figure 1) [
32].
The investigation was approved by the ethical board of the Faculty of Kinesiology, University of Split.
2.2. Procedures
RP data were collected using a semiautomatic camera tracking system (InStat Fitness, Moscow, Russia). This tracking system includes static cameras installed on the roof of the soccer stadium. Utilizing trigonometry, the camera continuously captures the location of the players. This procedure allowed us to quantify the total distance and distance covered in different speed zones. The use of this tracking system has appeared in previous research [
33]. The reliability of this tracking system has been demonstrated, as the tracking system has passed the official Fédération Internationale de Football Association (FIFA) test protocol for Electronic & Performance Tracking Systems (EPTS) (a report is available on the official FIFA webpage
https://www.fifa.com/technical/football-technology/resource-hub?id=aca57303eb0449f2835ac891b1beeb24 (accessed on 16 September 2021)).
RPs were observed according to the phase of the game and the ball possession as: (i) the AP of the game, and (ii) the DP of the game. The RP in the AP of the game was quantified when the team had the ball in their possession, while the RP in the DP of the game was quantified when the opponent had the ball in their possession [
34].
The RP variables in both the AP and DP of the game included the total distance covered (m) and distance covered in different categories: walking (<7.1 km/h), jogging (7.1–14.3 km/h), running (14.4–19.7 km/h), high-intensity running (>19.8 km/h), high-speed running (19.8–25.1 km/h) and sprinting (>25.2 km/h) [
35,
36].
Team achievement was defined by (i) the total group points earned at the end of the group phase of the UCL competition, (ii) match outcome in single matches (win, draw, loss)
2.3. Statistics
The normality of the distributions was checked by the Kolmogorov-Smirnov test, and the statistics included the means ± standard deviations. The homoscedasticity of all variables was confirmed by Levene’s test.
Univariate differences in the RPs among the (i) playing positions (ii) match outcomes (win, draw, loss) were analysed by one-way analysis of variance. Scheffe post-hoc test was applied to examine specific differences. The effect size was evidenced throughout the calculation of partial eta squared (η
2) (>0.02 was small; >0.13 was medium; >0.26 was large) [
37].
Multivariate differences in the RPs among the playing positions were analysed by canonical discriminant analysis. A t-test was used for the dependent sample to identify the differences between the RPs in the AP and DP of the game. Multiple regressions were calculated to identify the multivariate associations between predictors (RPs in the AP and DP of the game) and criteria (the total points earned at the end of the group stage of the UCL).
Pearson’s correlation was used to establish associations between the RP and total group points, and classified as previously suggested: r ≤ 0.35 indicates a low or weak correlation, 0.36 ≤ r ≤ 0.67 indicates a modest or moderate correlation, 0.68 ≤ r ≤ 1.0 indicates a strong or high correlation and r > 0.90 indicates a very high correlation [
38].
For all analyses, Statistica 16.0 (TIBCO Software Inc., Greenwood Village, CO, USA) was used, and p < 0.05 was considered statistically significant.
3. Results
Significant differences were evidence among playing positions for all RP variables in both the AP and DP of the game (all p < 0.01).
Specifically, in the AP, the CM covered the greatest total distance, while the FW covered the lowest total distance (4643 m and 3333 m, respectively). The CW and FW also covered the highest and lowest high-speed distance (467 m and 283 m, respectively) and running zone distance (1309 m and 662 m, respectively), respectively. The sprinting distance in the AP was the greatest among the FB (72 m) and lowest among the FW (27 m).
On the other hand, in the DP, the CD covered the lowest total distance, while the FW covered the greatest total distance (3311 m and 3977 m, respectively). The high-speed running and sprinting distance in the DP were highest among the WM (411 m and 96 m respectively) and lowest among the CD (131 m and 14 m, respectively) (
Table 1).
Discriminant canonical analysis demonstrated multivariate differences among playing positions for the RPs in the AP and DP of the game (
Table 2). In the calculation, the discriminant function variables that were intercorrelated/derived from other variables were excluded (e.g., the total distance covered and high-intensity distance covered). Three discriminant roots reached statistical significance.
The first discriminant root (Wilk’s Lambda 0.17, p < 0.001) explained the differences between the CM, and the CD and FW. Specifically, the CM outperformed the CD and FW in the running zone distance covered in the AP (correlations with a discriminant root of 0.73).
The second discriminant root (Wilk’s Lambda 0.45, p < 0.001) explained the differences between the FW and WM, and the CD, evidencing that the FW and WM were superior in the high-speed running and sprinting distances in the DP.
The third discriminant root (Wilk’s Lambda 0.84, p < 0.001) explained the differences between the FW and FB, indicating the FB’s superiority in the sprinting and high-speed running distances in the AP (correlations with a discriminant root of 0.72 and 0.66, respectively).
Correct classifications were obtained for 96% CD, 80% CM, 65% FB, 39% WM and 35% FW (73% correctly classified in total).
Significant negative associations (all p < 0.05) between the total points earned at the end of the group stage of the UCL, and the total, walking and jogging distances covered in the AP were evidenced for the CD, FB, CM and WM (all moderate correlations). In addition, the WM’s running zone distance covered and high-speed running distance covered in the AP were negatively associated with the total group points (all moderate correlations).
On the other hand, the results indicated positive associations between the total points earned at the end of the group stage of the UCL and the total, walking and jogging distances covered in the DP of the game for all playing positions (all moderate correlations). In addition, the running zone distances covered in the DP of game were positively associated with the total group points for the FB and CM (all moderate correlations) (
Table 3).
Significantly lower total, walking and jogging distance covered in AP were evidenced in won matches (significant post hoc differences when compared to the lost and drew matches; all small to medium effect sizes). On the other hand, the results indicated that won matches were characterized by significantly greatest total, walking, jogging and running distance covered in DP of game (significant post hoc differences when compared to the lost matches; all small to medium effect sizes) (
Table 4).
The multiple regression calculation utilized the RP variables in the AP and DP of the game as predictors for the total points earned at the end of the group stage of the UCL. In the calculation, the multiple regression variables that were intercorrelated/derived from other variables were excluded (e.g., the total distance covered and high-intensity distance covered). The results demonstrated that the RPs in the AP and DP of the game explained 37% of the variance in the total points earned at the end of the group stage of the UCL. Significant partial influence was evidenced for walking (negative partial influence), running (positive partial influence) and high-speed running (negative partial influence) in the AP, as well as for walking and running in the DP (both positive partial influence) (
Table 5).
4. Discussion
This is the first study to quantify the RP separately in the AP and DP of the game in the UCL utilizing different playing positions. The results indicated several important findings. First, all RPs in both the AP and DP of the game varied according to the specific playing positions. Second, the CD, FB and CM covered greater total distances, as well as the greater distances in low-, moderate- and high-intensity running in the AP than in the DP of the game. The WM and FW covered greater high-intensity distances in the DP than in the AP of the game. Third, negative associations were found between the total, low- and moderate- distances covered during the AP of the game and the total group points, while the RPs in the DP of the game were positively associated with the total group points earned at the end of the group stage of the UCL. Won matches were characterized by significantly lower and higher values of total, walking and jogging distances covered in AP and DP of the game, respectively.
4.1. Difference among Playing Positions in the RPs in the AP and DP of the Game
Previous studies which have investigated the RP without the context of the ball possession have reported that RPs vary according to playing positions due the different tactical roles during the soccer match [
8,
10,
13,
39]. Similarly, the present study analysed the RP in the context of the ball possession and found significant differences among playing positions in the RP during both the AP (i.e., when the team has the ball in their possession) and DP (i.e., when the opponent has the ball in their possession) of the game.
Specifically, the CM covered the greatest total distance in the AP (4643 m), while the FW covered the greatest total distance in the DP of game (3977 m). This may suggest that elite CM contribute significantly during the AP of the game, while elite FW have an important role in defensive duties in UCL matches. Importantly, studies which have analysed the RP without the context of ball possession have demonstrated very low high-intensity distances covered by the CM [
40]. However, when we observed the RP in the context of ball possession, the CM dominated in high-intensity distance in the AP of the game over the other playing positions (517 m). These findings indicate that the CM plays at the highest game pace when their team has the ball in in their possession. This may be supported by another finding of this study: the CM achieved the lowest walking distance (679 m) of all playing positions when their team had the ball in their possession.
When the team loses the ball in the AP of the game, the players attempt to recover the ball [
41]. Basically, this is the start of the DP. The players participating in the defensive duties (i.e., recovering the ball) are the farthest players from the centre of the team [
42,
43]. In general, these are the players that play in attacking positions (i.e., forwards, strikers, attacking wingers). Not surprisingly, the results from our study showed that the greatest high-intensity distances (i.e., high-speed running and sprinting) in the DP of the game were covered by the WM and FW (507 m and 483 m, respectively). These findings demonstrate that players who mainly played in attacking positions had very demanding running requirements when their team did not have the ball in their possession. Accordingly, these results suggest that elite WM and FW largely contribute to ball recovery during UCL matches. However, this must be confirmed in future studies by analysing specific technical-tactical parameters.
4.2. Differences between the RPs in the AP and DP of the Game
The observed differences between the RPs in the AP and DP of the game indicate that the CD, FB and CM covered a greater total distance, as well as greater distances in low-, moderate- and high-intensity running in the AP than in the DP of the game. In other words, these players experienced the greatest running demands when their team had the ball in their possession. Considering that the CM are responsible for the connection between the defense and attack, which consequently results in high overall running demands in both the AP and DP of the game, these findings may be expected [
39,
44]. On the other hand, considering that the CD and FB are defensive players, these findings may be surprising. However, although they are mainly defensive players, the CD’s main technical roles in the DP of the game (i.e., aerial duels, tackles, positioning, and interceptions of the balls passed to the attackers) are generally more focused on reactions and accelerations than on running demands [
40]. Furthermore, in some tactical formations, the CD has an important role when keeping the attack from the goalkeeper, which consequently results in the large running demands [
13]. Altogether, this explains the greater RPs in the AP than the DP of the game for the CD. Similarly, although the FB also is also a mainly defensive player, their main technical requirements are the number of entries to the third part of the pitch (i.e., pressing) and the number of crosses, which occur in the AP of the game [
45,
46]. Since these duties require high running demands, the FB experiences the greatest RPs in the AP of the game.
FW achieved significantly greater high-speed running and sprinting distances in the DP than in the AP of the game, while their total, low and moderate distances covered were similar irrespective of the game phase. Basically, the FW experienced greater running demands at higher speeds (>20.1 km/h) in the DP although they are primarily attacking players. These findings confirmed our previous considerations (please see the
Section 4) that FW players had a large impact on the defensive duties in UCL matches, specifically during ball recovery. Here, it must be noted that previous studies have reported sprinting distance as an important determinant of the FW’s positional success, indicating that the most of the FW’s activities are focused on attacking [
40]. However, by separately analysing the RPs in the AP and DP of the game, our study demonstrated important contributions of the FW in both directions of gameplay (i.e., attack and defense). The same reasons likely contributed to the WM’s greater sprinting distance in the DP than in the AP of the game.
4.3. Associations between the RPs in the AP and DP of the Game and Teams’ Achievement
The results from our study indicate significant associations between points earned at the end of the group stage of the UCL, and the total distance covered and distances covered at the lower speeds during the AP of the game. Specifically, negative correlations for all playing positions were found between the total group points and total, walking and jogging distance covered when team had the ball in their possession. Furthermore, significantly lower values for total, walking and jogging distance covered in the AP were evidenced in won matches in compared to the lost matches. Although these findings are not in the line with previous studies which studied the same issues in German Bundesliga and Spanish La Liga [
19,
22], some similarities can be observed. In detail, previous studies have reported positive associations between the points obtained at the end of the season and the distances covered at higher intensities (>18 km/h and 21 km) when the team has the ball in their possession [
19,
22]. Most specifically, Brito Souza et al. evidenced the greater running distance at higher speeds with the ball in the possession of the successful team, indicating that successful teams play at a higher game pace when they have the ball in their possession. Basically, players are prone to run fast when their team is in possession of the ball to offer clear ways of passing or high-intensity actions to loss their marks [
19]. Logically, if players run slow down when their team has the ball in their possession, the player with ball will be limited in finding solutions to pass the ball. This may reduce the efficiency of attacking actions and lead to a negative match outcome, resulting in a lower number of points earned. In other words, playing at a lower game pace (i.e., covering the large distance in low intensities) in the ball possession phase may decrease the team’s possibility to win the match and to earn points in the group stage of the UCL. This can directly be supported with results from our study which indicated that lost matches were characterized by significantly greater amount of low intensity activities in AP of game when compared to the drew or won matches. For that reason, findings from our study support previous considerations that successful teams play at a higher game pace when have they have the ball in their possession [
19,
22].
Previous studies have predominantly analysed the offensive phase of the game [
41,
47]. Specifically, when analysing the associations between the RP and points earned, studies have mostly observed the RP when the team had the ball in their possession (i.e., during the AP of the game) and when they did not. However, knowledge about the RP when the opponent has the ball in their possession (i.e., during the DP of the game) is limited. The current investigation is innovative because it analysed the RP in the DP of the game in addition to the RP during the AP of the game. The results demonstrated positive associations between the earned points at the end of the group stage of the UCL and the total, walking, jogging and running distances covered in the DP of the game for all playing positions. Furthermore, since our results indicated significantly greatest total, walking, jogging and running distances covered in the DP in won matches, this may suggest that greater running efforts when the opponent has the ball in their possession, even when performed at lower and moderate speeds, may contribute in winning the matches, and consequently earning more points.
Although all previously discussed studies have suggested that successful teams played at a higher game pace in the AP of the game and presented greater running efforts in the DP of the game, it must be emphasized that all correlations between the RP and total group points were moderate. In addition, the RP in both the AP and DP of the game explained only 37.2% of the variance in the points earned at the end of the group stage of the UCL. Collectively, these results suggest that the RP in different phases of the game may be associated with only one-third of the ranking points obtained during the UCL group stage, while almost two-thirds of the variance in the ranking points may be associated with factors not directly related to the RP [
19]. Therefore, our study supports the idea that in elite soccer, the overall technical and tactical effectiveness likely has a greater impact on the team’s achievement, as already suggested by recent studies [
23,
48].
4.4. Limitations and Strengths
The most important limitation of this study is that this study did not analyse all matches from the group stage of the UCL. Specifically, only 20 randomly selected matches were observed. In addition, the study did not include the influence of specific factors that can affect the RPs in the AP and DP of the game, such as the team quality, tactical formation, quality of the opponent and information about sector of the playing field where the running actions were developed.
This was the first study to assess the RP separately in the AP and DP of the game in different teams in relation to their achievement in the UCL. Moreover, our study was the first to utilize five different speed categories and playing positions with respect to the RP. Specifically, previous studies have mostly included the total distance covered and one to two speed categories. In contrast, this study included the total distance covered, as well as the walking, jogging, running, high-speed running, and sprinting distances covered in the AP and DP of the game. In addition, previous studies have mostly included the team’s RP to analyse these issues, while this study included the RP of the players in different playing positions. This approach enabled a more detailed analysis of the RP and information about the individual contributions of the players.
5. Conclusions
This study demonstrated that the CD, FB and CM experienced a greater RP when the team had the ball in their possession, indicating the significant influence of defensive and midfield players in the AP. On the other hand, the FW and WM executed greater RP when the opponent had the ball in their possession, suggesting that elite players who play mainly in the AP largely contribute in the DP. Collectively, these findings emphasize the importance of playing in both directions of game play (i.e., attack and defense) at all playing positions in the highest level of soccer.
In addition, the results of this study indicate the influence of RP on team achievement in both the AP and DP of the game. Specifically, we found that successful teams played at a higher game pace in the AP of the game and presented greater running efforts in the DP of the game. However, the RP variables were attributed to a low portion (i.e., 37.2% of variance) of the earned points, indicating that the influence of RP on team achievement in both the AP and DP of the game is limited.
Ultimately, although RP with ball possession is often hypothesized to have a greater influence on team achievement in soccer than RP without ball possession, it seems that team achievement does not significantly correspond to these variables. It is likely that high levels of technical and tactical abilities, as well as the mental preparation of the players, produce the highest team achievement in the group stage of the UCL.
Author Contributions
Data curation, T.M., S.V., P.D. and Ł.R.; Formal analysis, Ł.R. and D.S.; Methodology, S.V., M.S.and T.A.; Project administration, T.M. and P.D.; Resources, S.V. and Cyril Bossard; Software, M.S.; Supervision, C.B.; Validation, P.D. and M.S.; Writing—original draft, T.M., T.A., M.S. and D.S. All authors have read and agreed to the published version of the manuscript.
Funding
This research was partially funded by Croatian Science Foundation, grant number DOK-2020-01-9298.
Institutional Review Board Statement
The study was conducted according to the guidelines of the Declaration of Helsinki, and approved by the Ethics Committee of University of Split, Faculty of Kinesiology (approval number: 2181-205-02-05-19-0020, 1 September 2019).
Informed Consent Statement
Informed consent was waived by Ethical Board, University of Split, Faculty of Kinesiology.
Data Availability Statement
Data will be provide to all interested parties upon reasonable request.
Acknowledgments
Support of the Croatian Science Foundation is gratefully acknowledged. Authors are particularly grateful to InStat Fitness, Moscow, Russia for providing the data used in the study.
Conflicts of Interest
The authors declare no conflict of interest.
References
- Paul, D.J.; Bradley, P.S.; Nassis, G.P. Factors affecting match running performance of elite soccer players: Shedding some light on the complexity. Int. J. Sports Physiol. Perform. 2015, 10, 516–519. [Google Scholar] [CrossRef] [PubMed] [Green Version]
- Mohr, M.; Krustrup, P.; Bangsbo, J. Match performance of high-standard soccer players with special reference to development of fatigue. J. Sports Sci. 2003, 21, 519–528. [Google Scholar] [CrossRef] [PubMed] [Green Version]
- Bradley, P.S.; Sheldon, W.; Wooster, B.; Olsen, P.; Boanas, P.; Krustrup, P. High-intensity running in English FA Premier League soccer matches. J. Sports Sci. 2009, 27, 159–168. [Google Scholar] [CrossRef] [PubMed]
- Vallance, E.; Sutton-Charani, N.; Imoussaten, A.; Montmain, J.; Perrey, S. Combining Internal- and External-Training-Loads to Predict Non-Contact Injuries in Soccer. Appl. Sci. 2020, 10, 5261. [Google Scholar] [CrossRef]
- Lambert, M.I.; Borresen, J. Measuring training load in sports. Int. J. Sports Physiol. Perform. 2010, 5, 406–411. [Google Scholar] [CrossRef] [PubMed]
- Rossi, A.; Perri, E.; Pappalardo, L.; Cintia, P.; Iaia, F.M. Relationship between External and Internal Workloads in Elite Soccer Players: Comparison between Rate of Perceived Exertion and Training Load. Appl. Sci. 2019, 9, 5174. [Google Scholar] [CrossRef] [Green Version]
- Modric, T.; Versic, S.; Sekulic, D. Does aerobic performance define match running performance among professional soccer players? A position-specific analysis. Res. Sports Med. 2021, 29, 336–348. [Google Scholar] [CrossRef]
- Konefał, M.; Chmura, P.; Zając, T.; Chmura, J.; Kowalczuk, E.; Andrzejewski, M. A new approach to the analysis of pitch-positions in professional soccer. J. Hum. Kinet. 2019, 66, 143. [Google Scholar] [CrossRef] [Green Version]
- Modric, T.; Versic, S.; Sekulic, D. Relations of the Weekly External Training Load Indicators and Running Performances in Professional Soccer Matches. Sport Mont 2021, 19, 31–37. [Google Scholar]
- Chmura, P.; Liu, H.; Andrzejewski, M.; Chmura, J.; Kowalczuk, E.; Rokita, A.; Konefał, M. Is there meaningful influence from situational and environmental factors on the physical and technical activity of elite football players? Evidence from the data of 5 consecutive seasons of the German Bundesliga. PLoS ONE 2021, 16, e0247771. [Google Scholar] [CrossRef]
- Modric, T.; Versic, S.; Sekulic, D. Aerobic fitness and game performance indicators in professional football players; playing position specifics and associations. Heliyon 2020, 6, e05427. [Google Scholar] [CrossRef] [PubMed]
- Redkva, P.E.; Paes, M.R.; Fernandez, R.; da-Silva, S.G. Correlation between match performance and field tests in professional soccer players. J. Hum. Kinet. 2018, 62, 213–219. [Google Scholar] [CrossRef] [PubMed] [Green Version]
- Modric, T.; Versic, S.; Sekulic, D. Position Specific Running Performances in Professional Football (Soccer): Influence of Different Tactical Formations. Sports 2020, 8, 161. [Google Scholar] [CrossRef] [PubMed]
- Baptista, I.; Johansen, D.; Figueiredo, P.; Rebelo, A.; Pettersen, S.A. A comparison of match-physical demands between different tactical systems: 1-4-5-1 vs. 1-3-5-2. PLoS ONE 2019, 14, e0214952. [Google Scholar] [CrossRef] [Green Version]
- Sæterbakken, A.; Haug, V.; Fransson, D.; Grendstad, H.N.; Gundersen, H.S.; Moe, V.F.; Ylvisaker, E.; Shaw, M.; Riiser, A.; Andersen, V. Match running performance on three different competitive standards in norwegian soccer. Sports Med. Int. Open 2019, 3, E82. [Google Scholar] [CrossRef]
- Lago-Peñas, C. The role of situational variables in analysing physical performance in soccer. J. Hum. Kinet. 2012, 35, 89–95. [Google Scholar] [CrossRef]
- Lago-Peñas, C.; Lago-Ballesteros, J. Game location and team quality effects on performance profiles in professional soccer. J. Sports Sci. Med. 2011, 10, 465. [Google Scholar]
- Castellano, J.; Blanco-Villaseñor, A.; Alvarez, D. Contextual variables and time-motion analysis in soccer. Int. J. Sports Med. 2011, 32, 415–421. [Google Scholar] [CrossRef] [PubMed] [Green Version]
- Brito Souza, D.; López-Del Campo, R.; Blanco-Pita, H.; Resta, R.; Del Coso, J. Association of match running performance with and without ball possession to football performance. Int. J. Perform. Anal. Sport 2020, 20, 483–494. [Google Scholar] [CrossRef]
- Rampinini, E.; Impellizzeri, F.M.; Castagna, C.; Coutts, A.J.; Wisløff, U. Technical performance during soccer matches of the Italian Serie A league: Effect of fatigue and competitive level. J. Sci. Med. Sport 2009, 12, 227–233. [Google Scholar] [CrossRef] [PubMed]
- Di Salvo, V.; Gregson, W.; Atkinson, G.; Tordoff, P.; Drust, B. Analysis of high intensity activity in Premier League soccer. Int. J. Sports Med. 2009, 30, 205–212. [Google Scholar] [CrossRef] [PubMed]
- Hoppe, M.; Slomka, M.; Baumgart, C.; Weber, H.; Freiwald, J. Match running performance and success across a season in German Bundesliga soccer teams. Int. J. Sports Med. 2015, 36, 563–566. [Google Scholar] [CrossRef] [PubMed]
- Asian Clemente, J.A.; Requena, B.; Jukic, I.; Nayler, J.; Hernández, A.S.; Carling, C. Is physical performance a differentiating element between more or less successful football teams? Sports 2019, 7, 216. [Google Scholar] [CrossRef] [PubMed] [Green Version]
- Tuo, Q.; Wang, L.; Huang, G.; Zhang, H.; Liu, H. Running performance of soccer players during matches in the 2018 FIFA World Cup: Differences among confederations. Front. Psychol. 2019, 10, 1044. [Google Scholar] [CrossRef] [Green Version]
- Sapp, R.M.; Spangenburg, E.E.; Hagberg, J.M. Trends in aggressive play and refereeing among the top five European soccer leagues. J. Sports Sci. 2018, 36, 1346–1354. [Google Scholar] [CrossRef]
- Sarmento, H.; Pereira, A.; Matos, N.; Campaniço, J.; Anguera, T.M.; Leitão, J. English Premier League, Spaińs La Liga and Italýs Seriés A—What’s Different? Int. J. Perform. Anal. Sport 2013, 13, 773–789. [Google Scholar] [CrossRef]
- Casal, C.A.; Anguera, M.T.; Maneiro, R.; Losada, J.L. Possession in football: More than a quantitative aspect–a mixed method study. Front. Psychol. 2019, 10, 501. [Google Scholar] [CrossRef] [Green Version]
- Kempe, M.; Vogelbein, M.; Memmert, D.; Nopp, S. Possession vs. direct play: Evaluating tactical behavior in elite soccer. Int. J. Sports Sci. 2014, 4, 35–41. [Google Scholar]
- Lago-Peñas, C.; Lago-Ballesteros, J.; Rey, E. Differences in performance indicators between winning and losing teams in the UEFA Champions League. J. Hum. Kinet. 2011, 27, 135–146. [Google Scholar] [CrossRef]
- Aquino, R.; Carling, C.; Palucci Vieira, L.; Martins, G.; Jabor, G.; Machado, J.; Puggina, E. Influence of situational variables, team formation, and playing position on match running performance and social network analysis in brazilian professional soccer players. J. Strength Cond. Res. 2018, 34, 808–817. [Google Scholar] [CrossRef]
- Ribeiro, J.; Silva, P.; Duarte, R.; Davids, K.; Garganta, J. Team sports performance analysed through the lens of social network theory: Implications for research and practice. Sports Med. 2017, 47, 1689–1696. [Google Scholar] [CrossRef]
- Konefał, M.; Chmura, P.; Zając, T.; Chmura, J.; Kowalczuk, E.; Andrzejewski, M. Evolution of technical activity in various playing positions, in relation to match outcomes in professional soccer. Biol. Sport 2019, 36, 181. [Google Scholar] [CrossRef]
- Kubayi, A.; Toriola, A. Physical demands analysis of soccer players during the extra-time periods of the UEFA Euro 2016. South. Afr. J. Sports Med. 2018, 30, 1–3. [Google Scholar] [CrossRef]
- Gabbett, T.J.; Polley, C.; Dwyer, D.B.; Kearney, S.; Corvo, A. Influence of field position and phase of play on the physical demands of match-play in professional rugby league forwards. J. Sci. Med. Sport 2014, 17, 556–561. [Google Scholar] [CrossRef]
- Modric, T.; Versic, S.; Sekulic, D. Playing position specifics of associations between running performance during the training and match in male soccer players. Acta Gymnica 2020, 50, 51–60. [Google Scholar] [CrossRef]
- Mallo, J.; Mena, E.; Nevado, F.; Paredes, V. Physical demands of top-class soccer friendly matches in relation to a playing position using global positioning system technology. J. Hum. Kinet. 2015, 47, 179–188. [Google Scholar] [CrossRef] [PubMed] [Green Version]
- Ferguson, C.J. An effect size primer: A guide for clinicians and researchers. In Methodological Issues and Strategies in Clinical Research; Kazdin, A.E., Ed.; American Psychological Association: Washington, DC, USA, 2016; pp. 301–310. [Google Scholar] [CrossRef]
- Taylor, R. Interpretation of the correlation coefficient: A basic review. J. Diagn. Med. Sonogr. 1990, 6, 35–39. [Google Scholar] [CrossRef]
- Di Salvo, V.; Baron, R.; Tschan, H.; Montero, F.C.; Bachl, N.; Pigozzi, F. Performance characteristics according to playing position in elite soccer. Int. J. Sports Med. 2007, 28, 222–227. [Google Scholar] [CrossRef]
- Modric, T.; Versic, S.; Sekulic, D.; Liposek, S. Analysis of the Association between Running Performance and Game Performance Indicators in Professional Soccer Players. Int. J. Environ. Res. Public Health 2019, 16, 4032. [Google Scholar] [CrossRef] [PubMed] [Green Version]
- Santos, P.; Lago-Peñas, C.; García-García, O. The influence of situational variables on defensive positioning in professional soccer. Int. J. Perform. Anal. Sport 2017, 17, 212–219. [Google Scholar] [CrossRef]
- Sampaio, J.; Maçãs, V. Measuring football tactical behaviour. Int. J. Sports Med. 2012, 33, 395–401. [Google Scholar] [CrossRef]
- Bangsbo, J.; Peitersen, B. Soccer Systems and Strategies; Human Kinetics: Champaign, IL, USA, 2000. [Google Scholar]
- Vigne, G.; Gaudino, C.; Rogowski, I.; Alloatti, G.; Hautier, C. Activity profile in elite Italian soccer team. Int. J. Sports Med. 2010, 31, 304–310. [Google Scholar] [CrossRef]
- Yi, Q.; Jia, H.; Liu, H.; Gómez, M.Á. Technical demands of different playing positions in the UEFA Champions League. Int. J. Perform. Anal. Sport 2018, 18, 926–937. [Google Scholar] [CrossRef]
- Van Lingen, B. Coaching Soccer: The Official Coaching Book of the Dutch Soccer Association; Reedswain: Spring City, PA, USA, 1998. [Google Scholar]
- Barreira, D.; Garganta, J.; Guimaraes, P.; Machado, J.; Anguera, M.T. Ball recovery patterns as a performance indicator in elite soccer. Proc. Inst. Mech. Eng. Part P J. Sports Eng. Technol. 2014, 228, 61–72. [Google Scholar] [CrossRef]
- Carling, C. Interpreting physical performance in professional soccer match-play: Should we be more pragmatic in our approach? Sports Med. 2013, 43, 655–663. [Google Scholar] [CrossRef] [PubMed]
| Publisher’s Note: MDPI stays neutral with regard to jurisdictional claims in published maps and institutional affiliations. |
© 2021 by the authors. Licensee MDPI, Basel, Switzerland. This article is an open access article distributed under the terms and conditions of the Creative Commons Attribution (CC BY) license (https://creativecommons.org/licenses/by/4.0/).


 ,
, 


