
Sport Performance Analysis with a Focus on Racket Sports: A Review


Abstract
1. Introduction
2. Research Methodology
- Research hypothesis 1 (R1): The number of publications has steadily increased over time.
- Research hypothesis 2 (R2): The relationship between the number of publications and the Summer Olympics is significant.
- Research hypothesis 3 (R3): In performance analysis processes, the observation method is the most commonly used method.
- Research hypothesis 4 (R4): Rackets Sports performance analysis research is primarily conducted in Europe.
- Research hypothesis 5 (R5): Performance analysis research necessitates the participation of multiple authors.
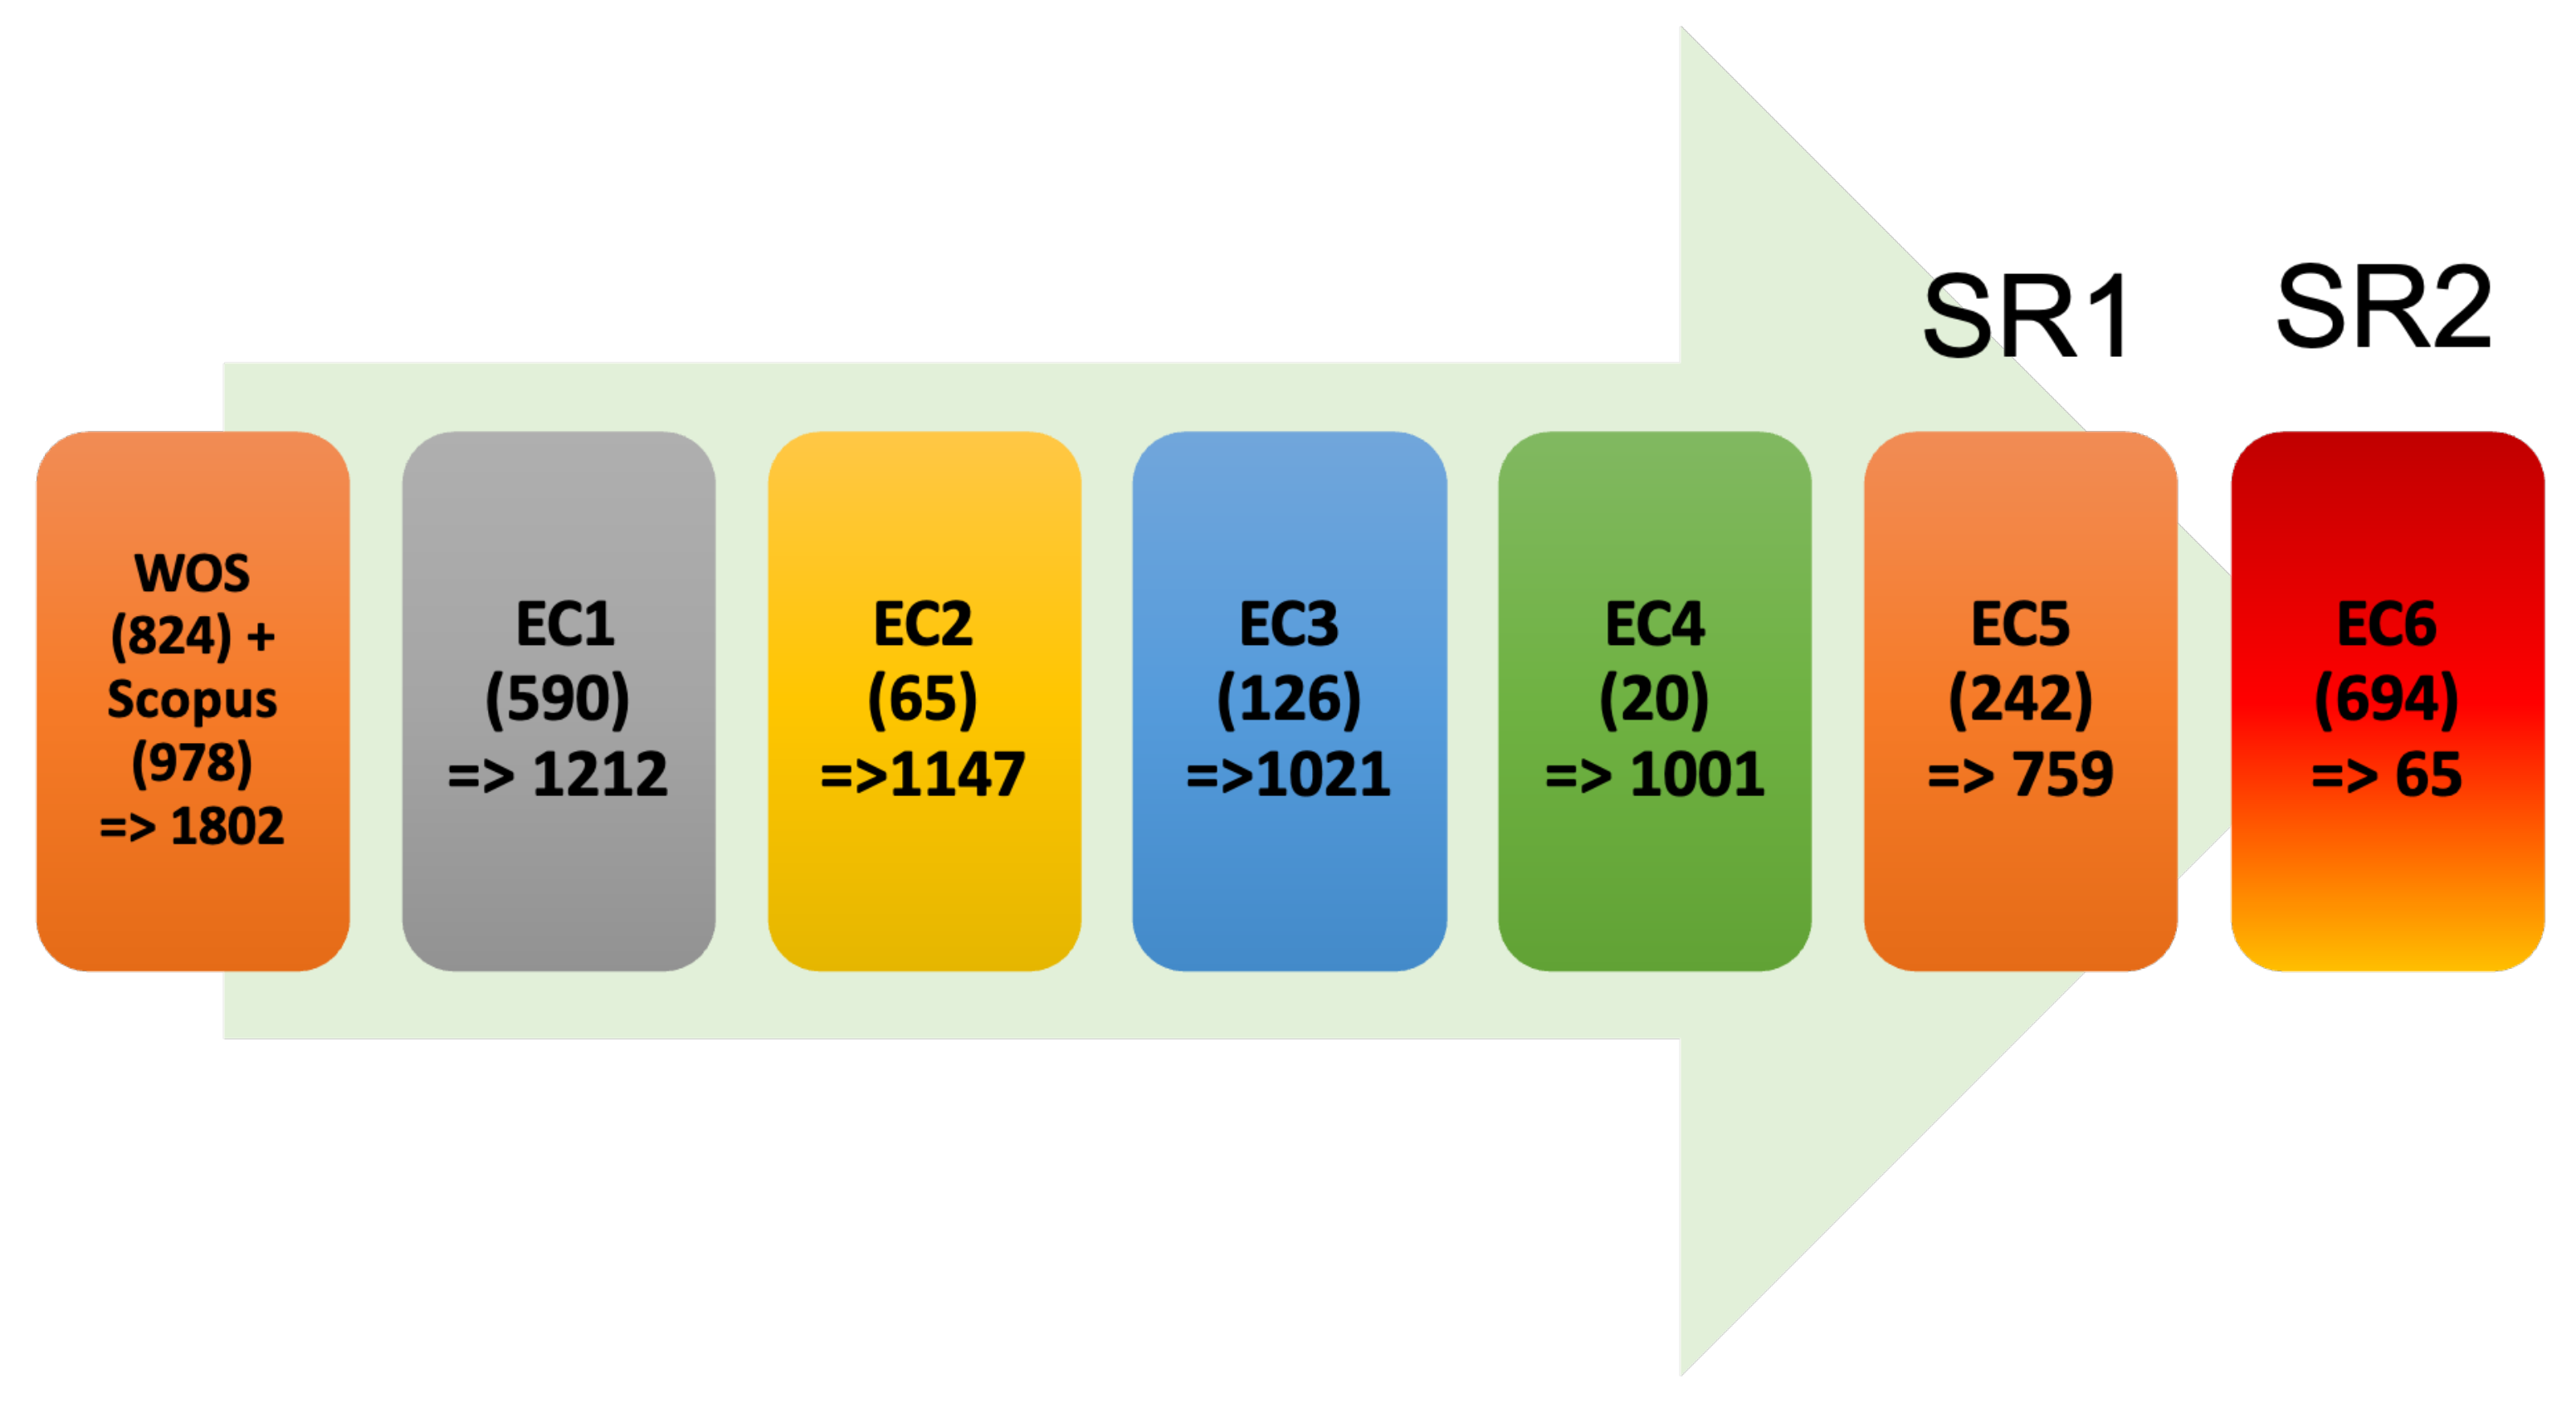
2.1. Eligibility Criteria
- •
- EC1 = The article is available in both databases.
- •
- EC2 = The publication is available in a language other than English.
- •
- EC3 = The publication is a specific type (Book Chapter, Data Paper, Book, Conference Review, Editorial, Editorial Material, Letter, Meeting Abstract, Note, Review, Short Survey).
- •
- EC4 = This publication does not have full access.
- •
- EC5 = The publication is unrelated to the topic of systematic research.
- =>
- SR1: An overview of sport performance analysis in general.
- •
- EC6 = No racket sports are mentioned in the article.
- =>
- SR2: A systematic review of publications on racket sports
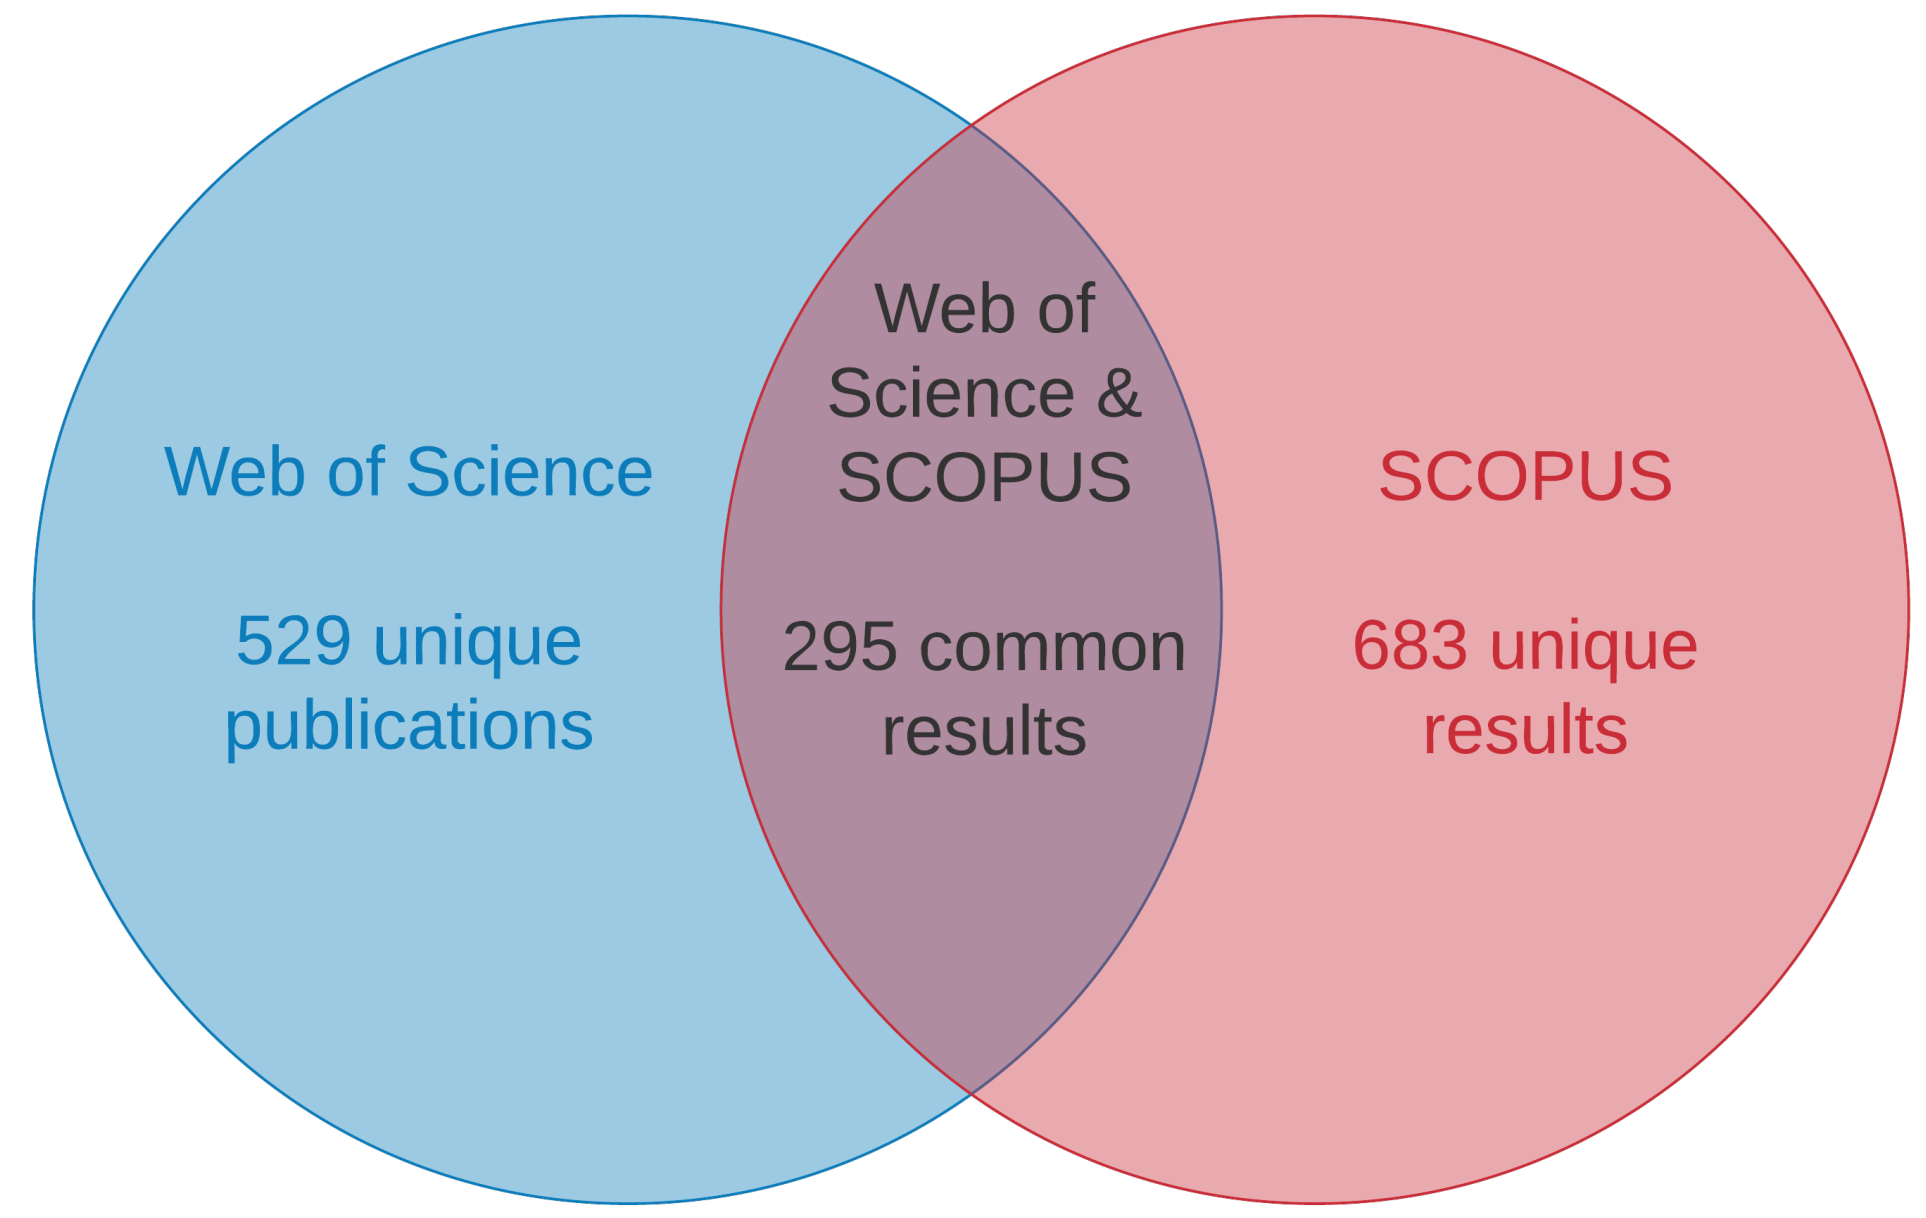
2.2. Information Sources and Search
2.3. Study Selection
2.4. Data Collection Process
3. Results
3.1. SR1: An Overview of Sport Performance Analysis in General
3.1.1. Performance Data
3.1.2. Tools Used for Data Collection/Automation Analysis
3.1.3. Methods of Performance Analysis
- Statistics methods including ANOVA, one-way ANOVA, two-way MANOVA, linear model, cluster analysis, k-means clustering, logistic regression, Chi-square analyses, Mann-Whitney U-test, discriminant analysis, Matched Paired t-test, mixed linear method and Markov chain: Waldron and Worsfold [4], Saavedra et al. [16], Castellano et al. [70], Torres-Luque et al. [71], Iván Fernández-García et al. [72], Ibanez et al. [73], Douglas et al. [74], Wedding et al. [75], Escobar-Molina et al. [76], Konings and Hettinga [77], Croft et al. [78], García-de Alcaraz and Marcelino [79], Gómez et al. [80], Sarajärvi et al. [81], Francis et al. [82], Liu et al. [83], Pawista and Saphie [84], Conte et al. [85], Vencúrik et al. [86], Leicht et al. [87];
3.1.4. Software Used to Analyze Performance
3.1.5. Performance Prediction
- Which performance indicator best predicts success?
- Can game statistics be used to forecast success?
- How can a successful player be identified?
- How much of an impact does travel/match location have on player/team performance?
Prediction of an Athlete’s Career Path
3.2. SR2: A Systematic Review of Publications on Racket Sports
3.2.1. Classification by Racket Sport and Methodology
- publications that use observation as the primary tool;
- publications that use a standard statistical approach;
- publications that use a combination of observation and statistics;
- non-statistic methods, primarily neural networks.
Observation
Statistical Approach
Combine Approach
Neural Networks
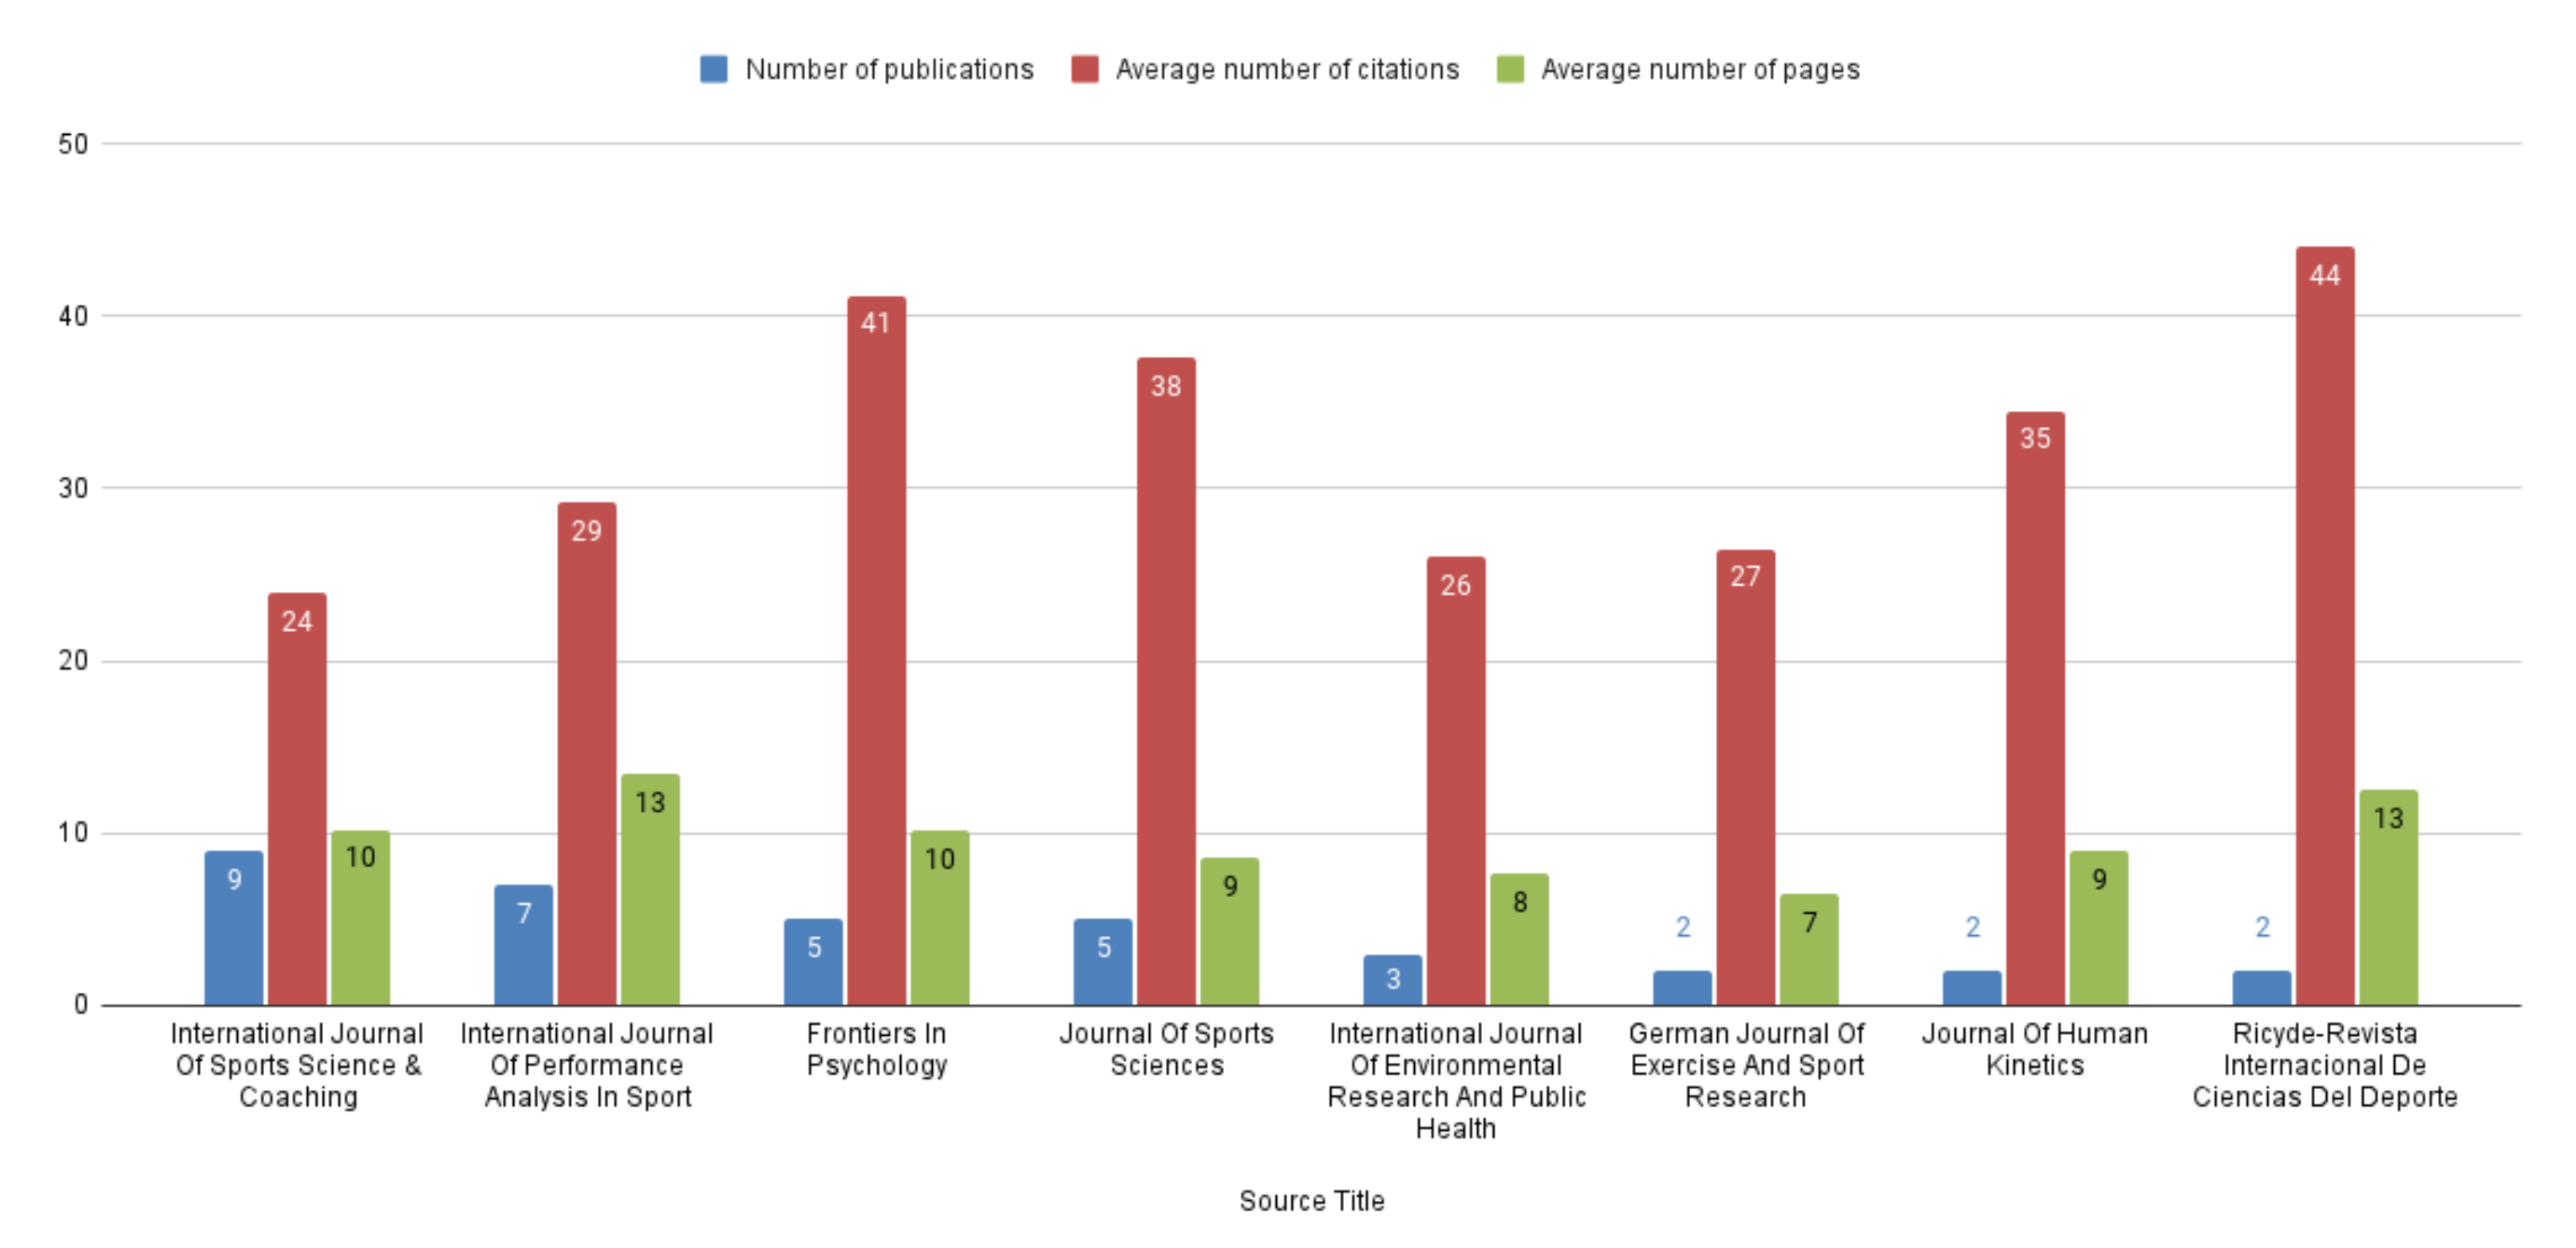
3.2.2. Source Title Categorization
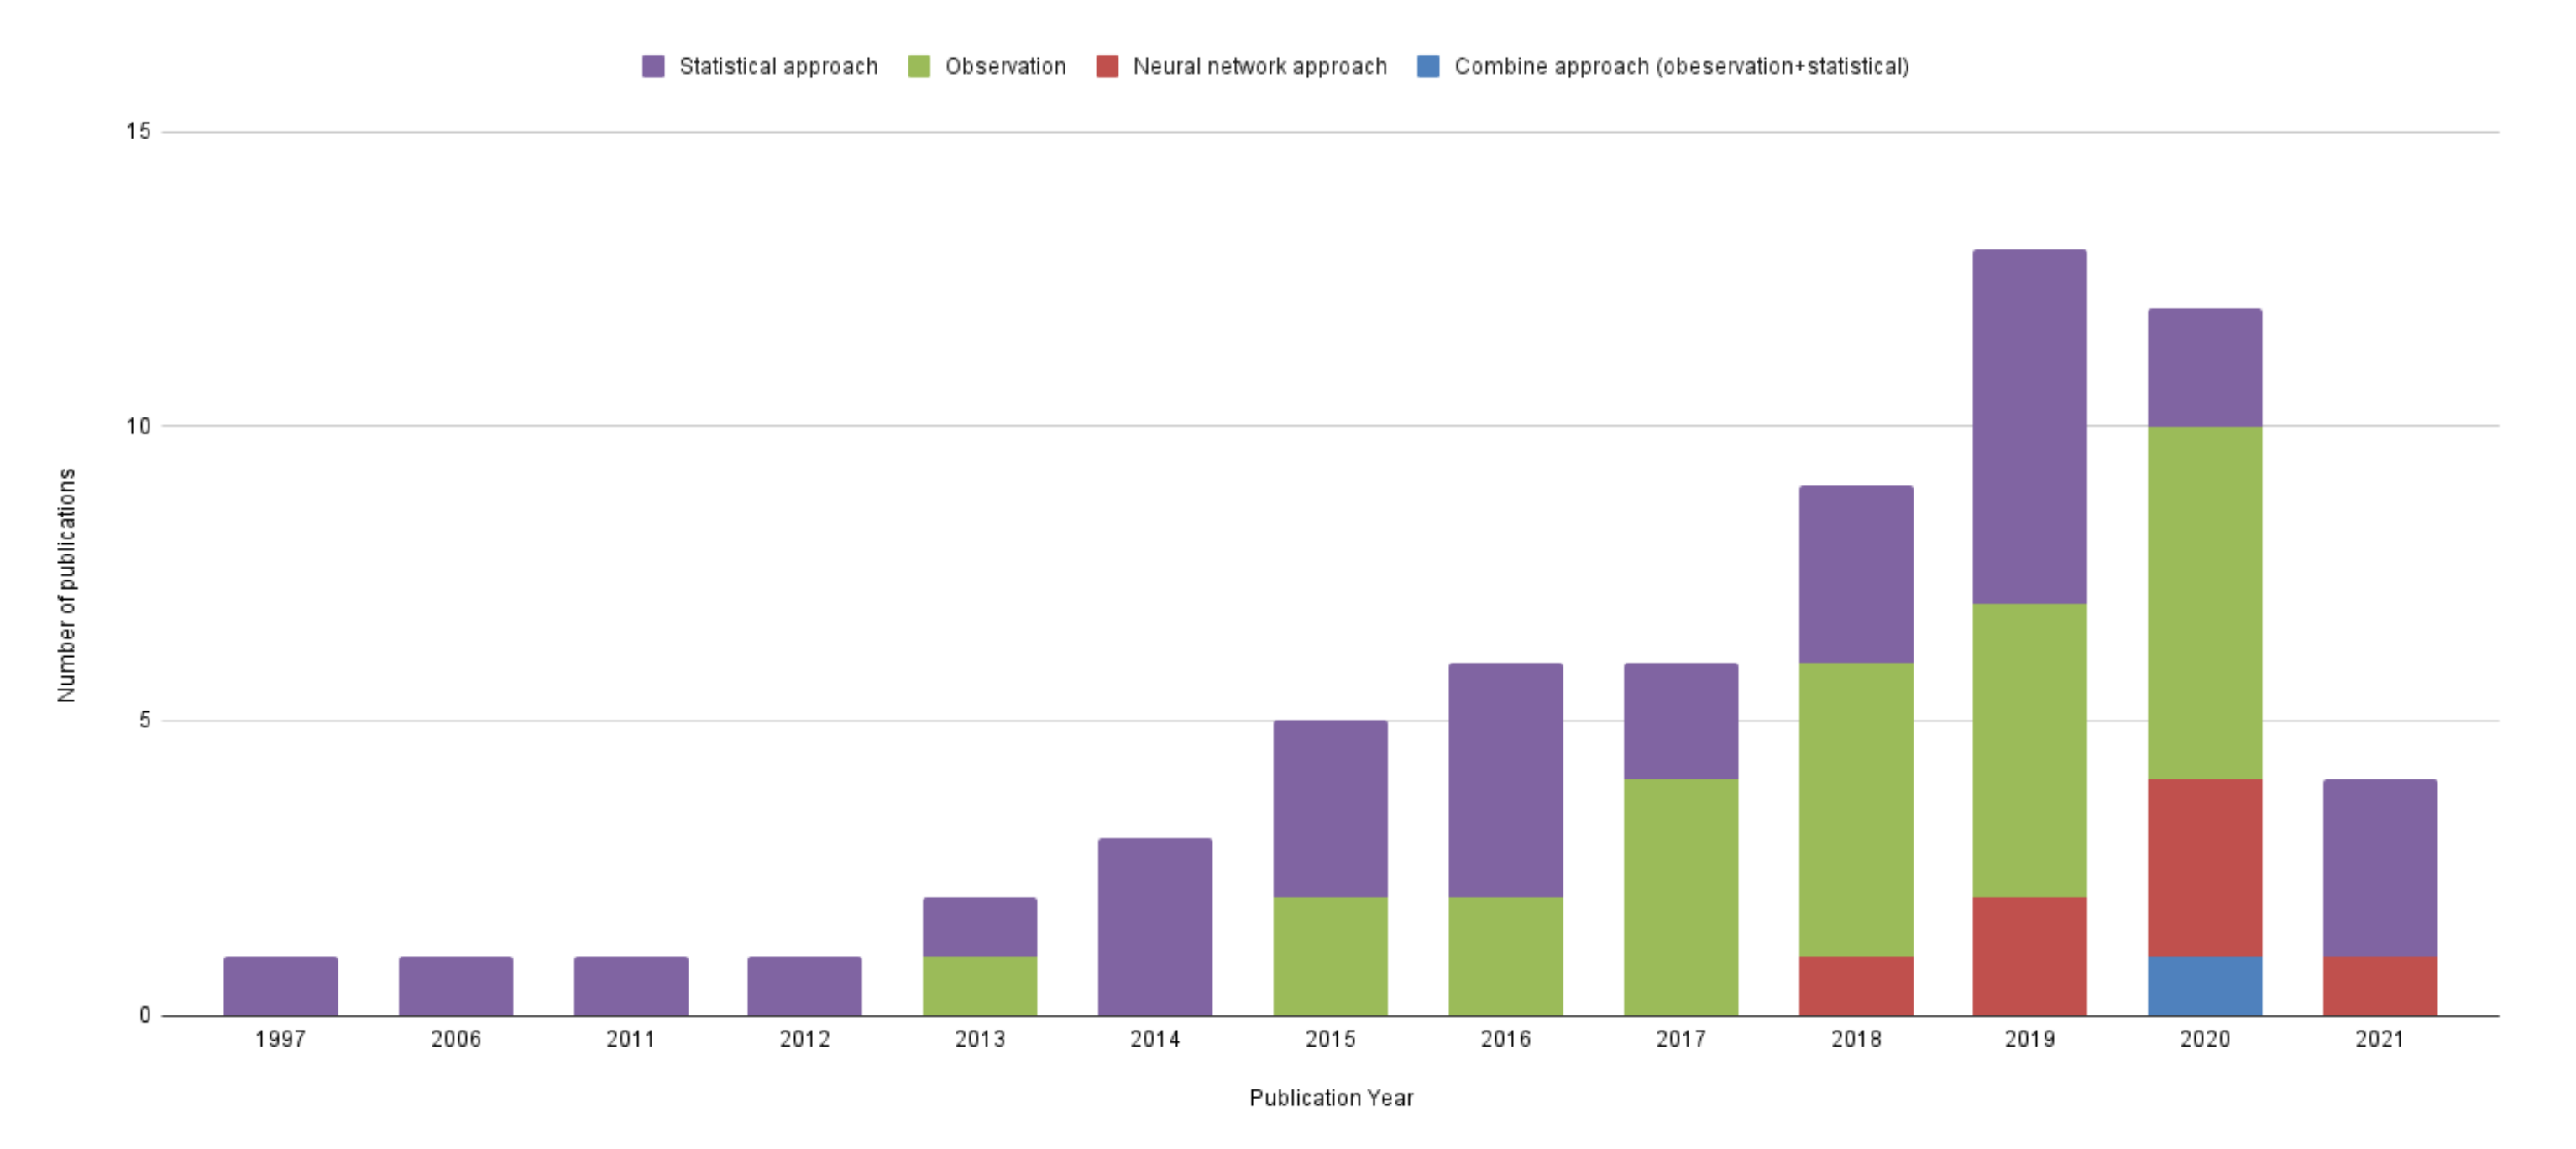
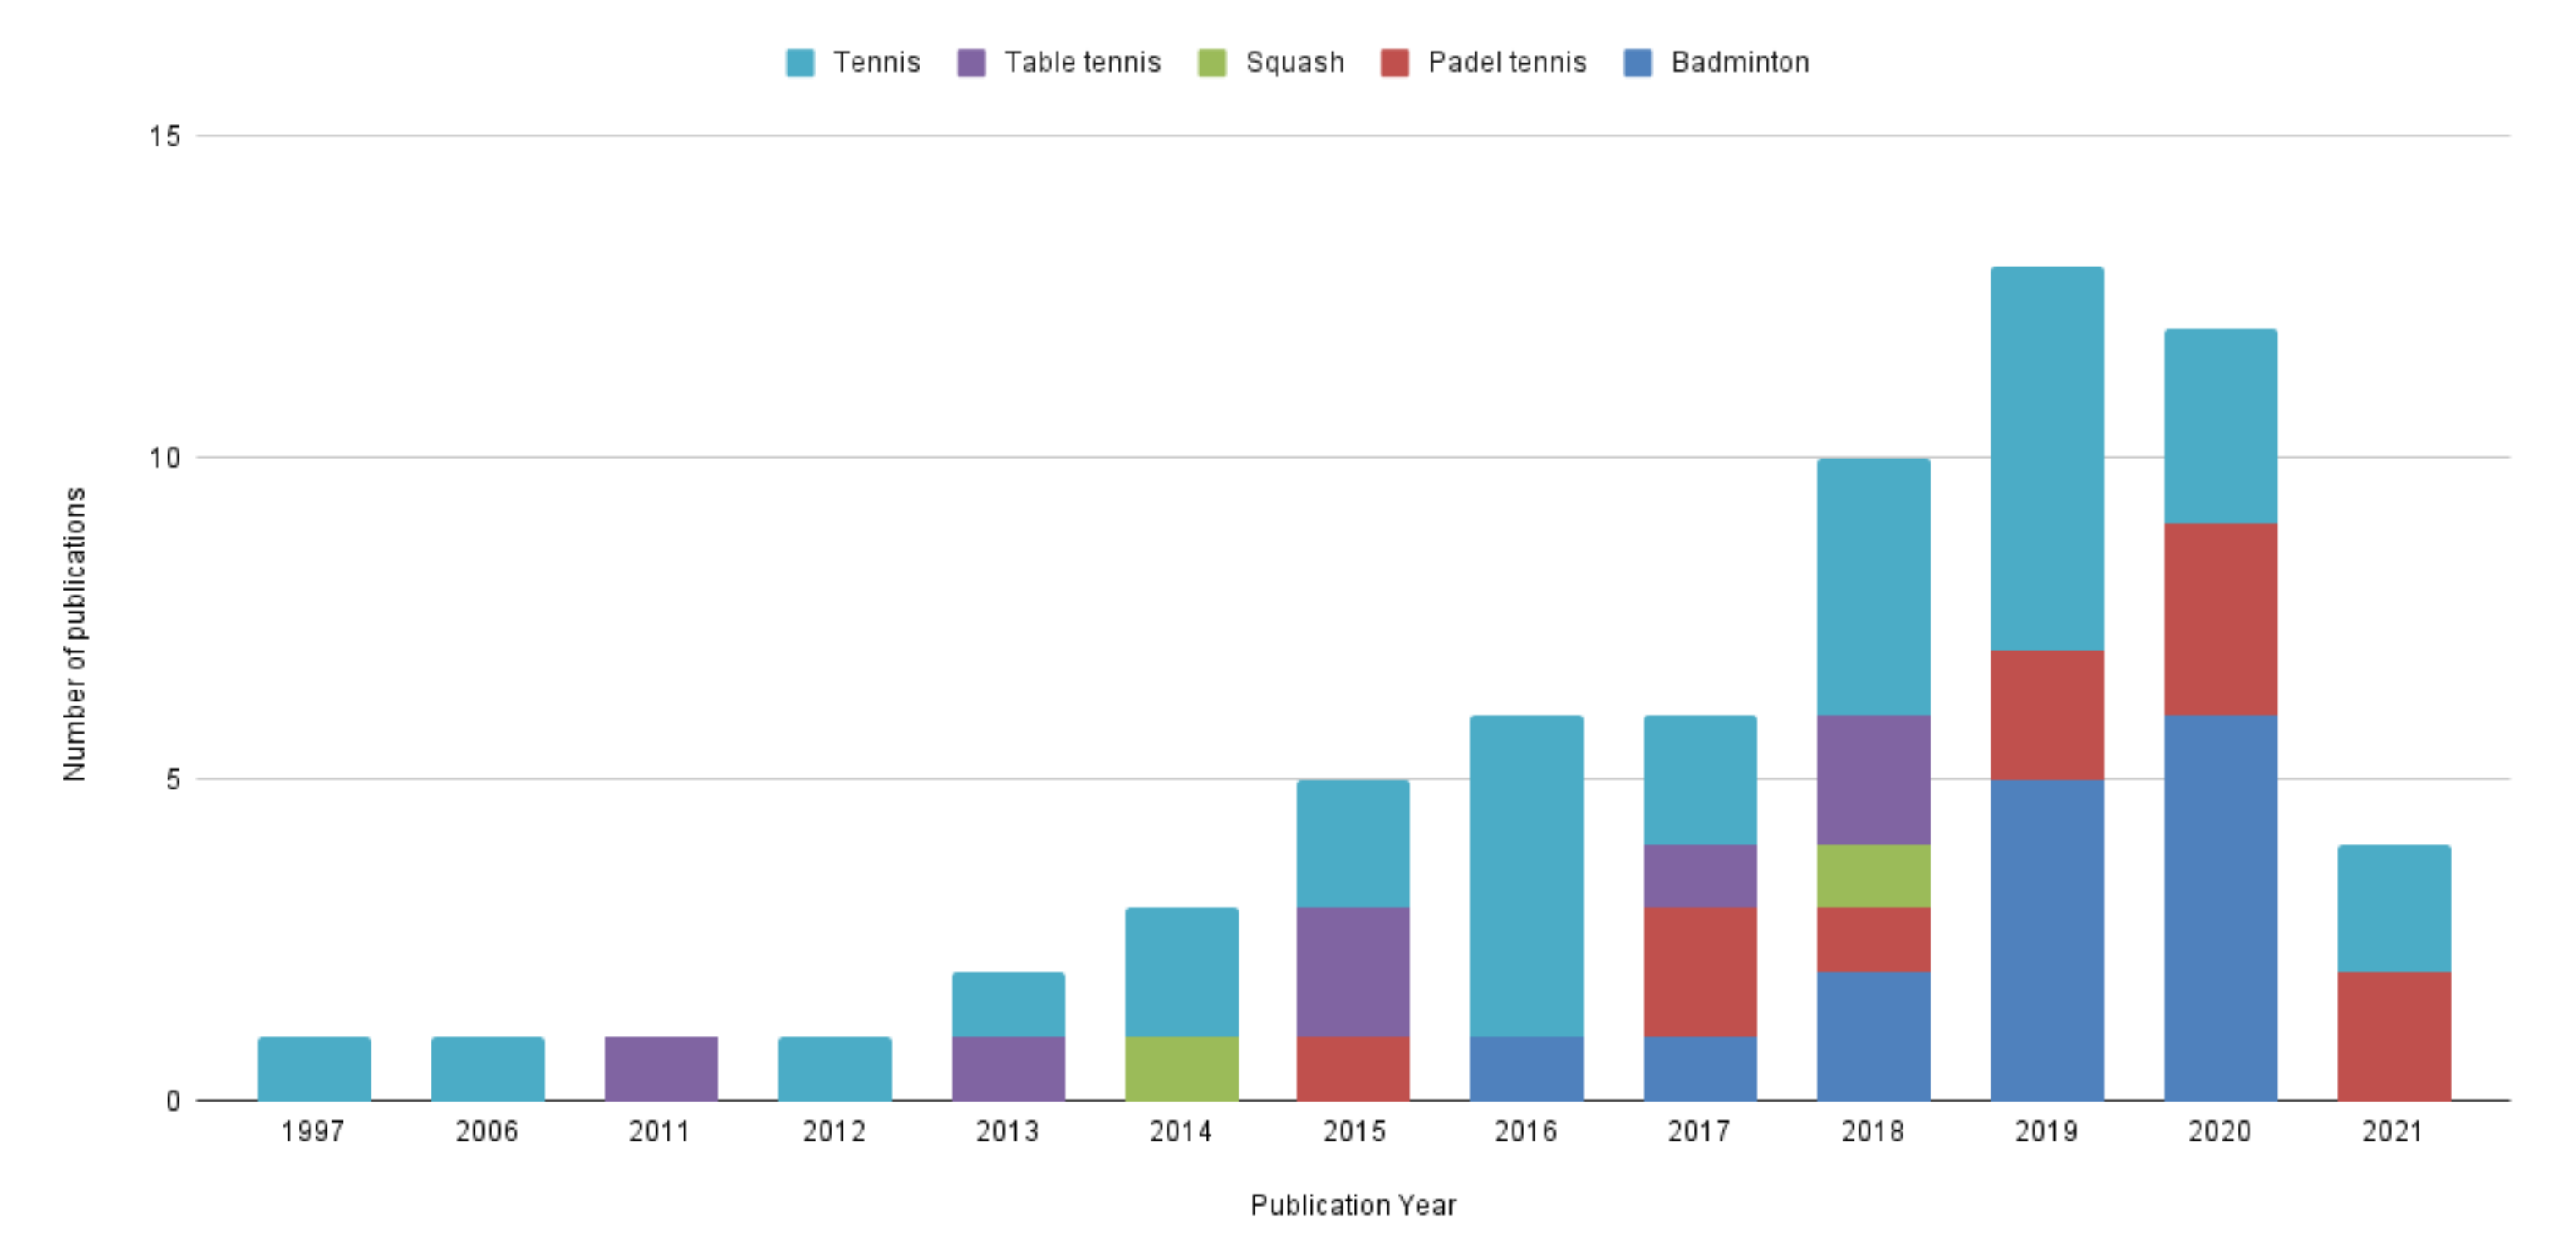
3.2.3. Analysis of Publication Year
- data are easily accessible to large groups;
- data are collected in a more advanced manner;
- more funding is available for performance analysis to achieve a gold medal;
- widespread public interest.
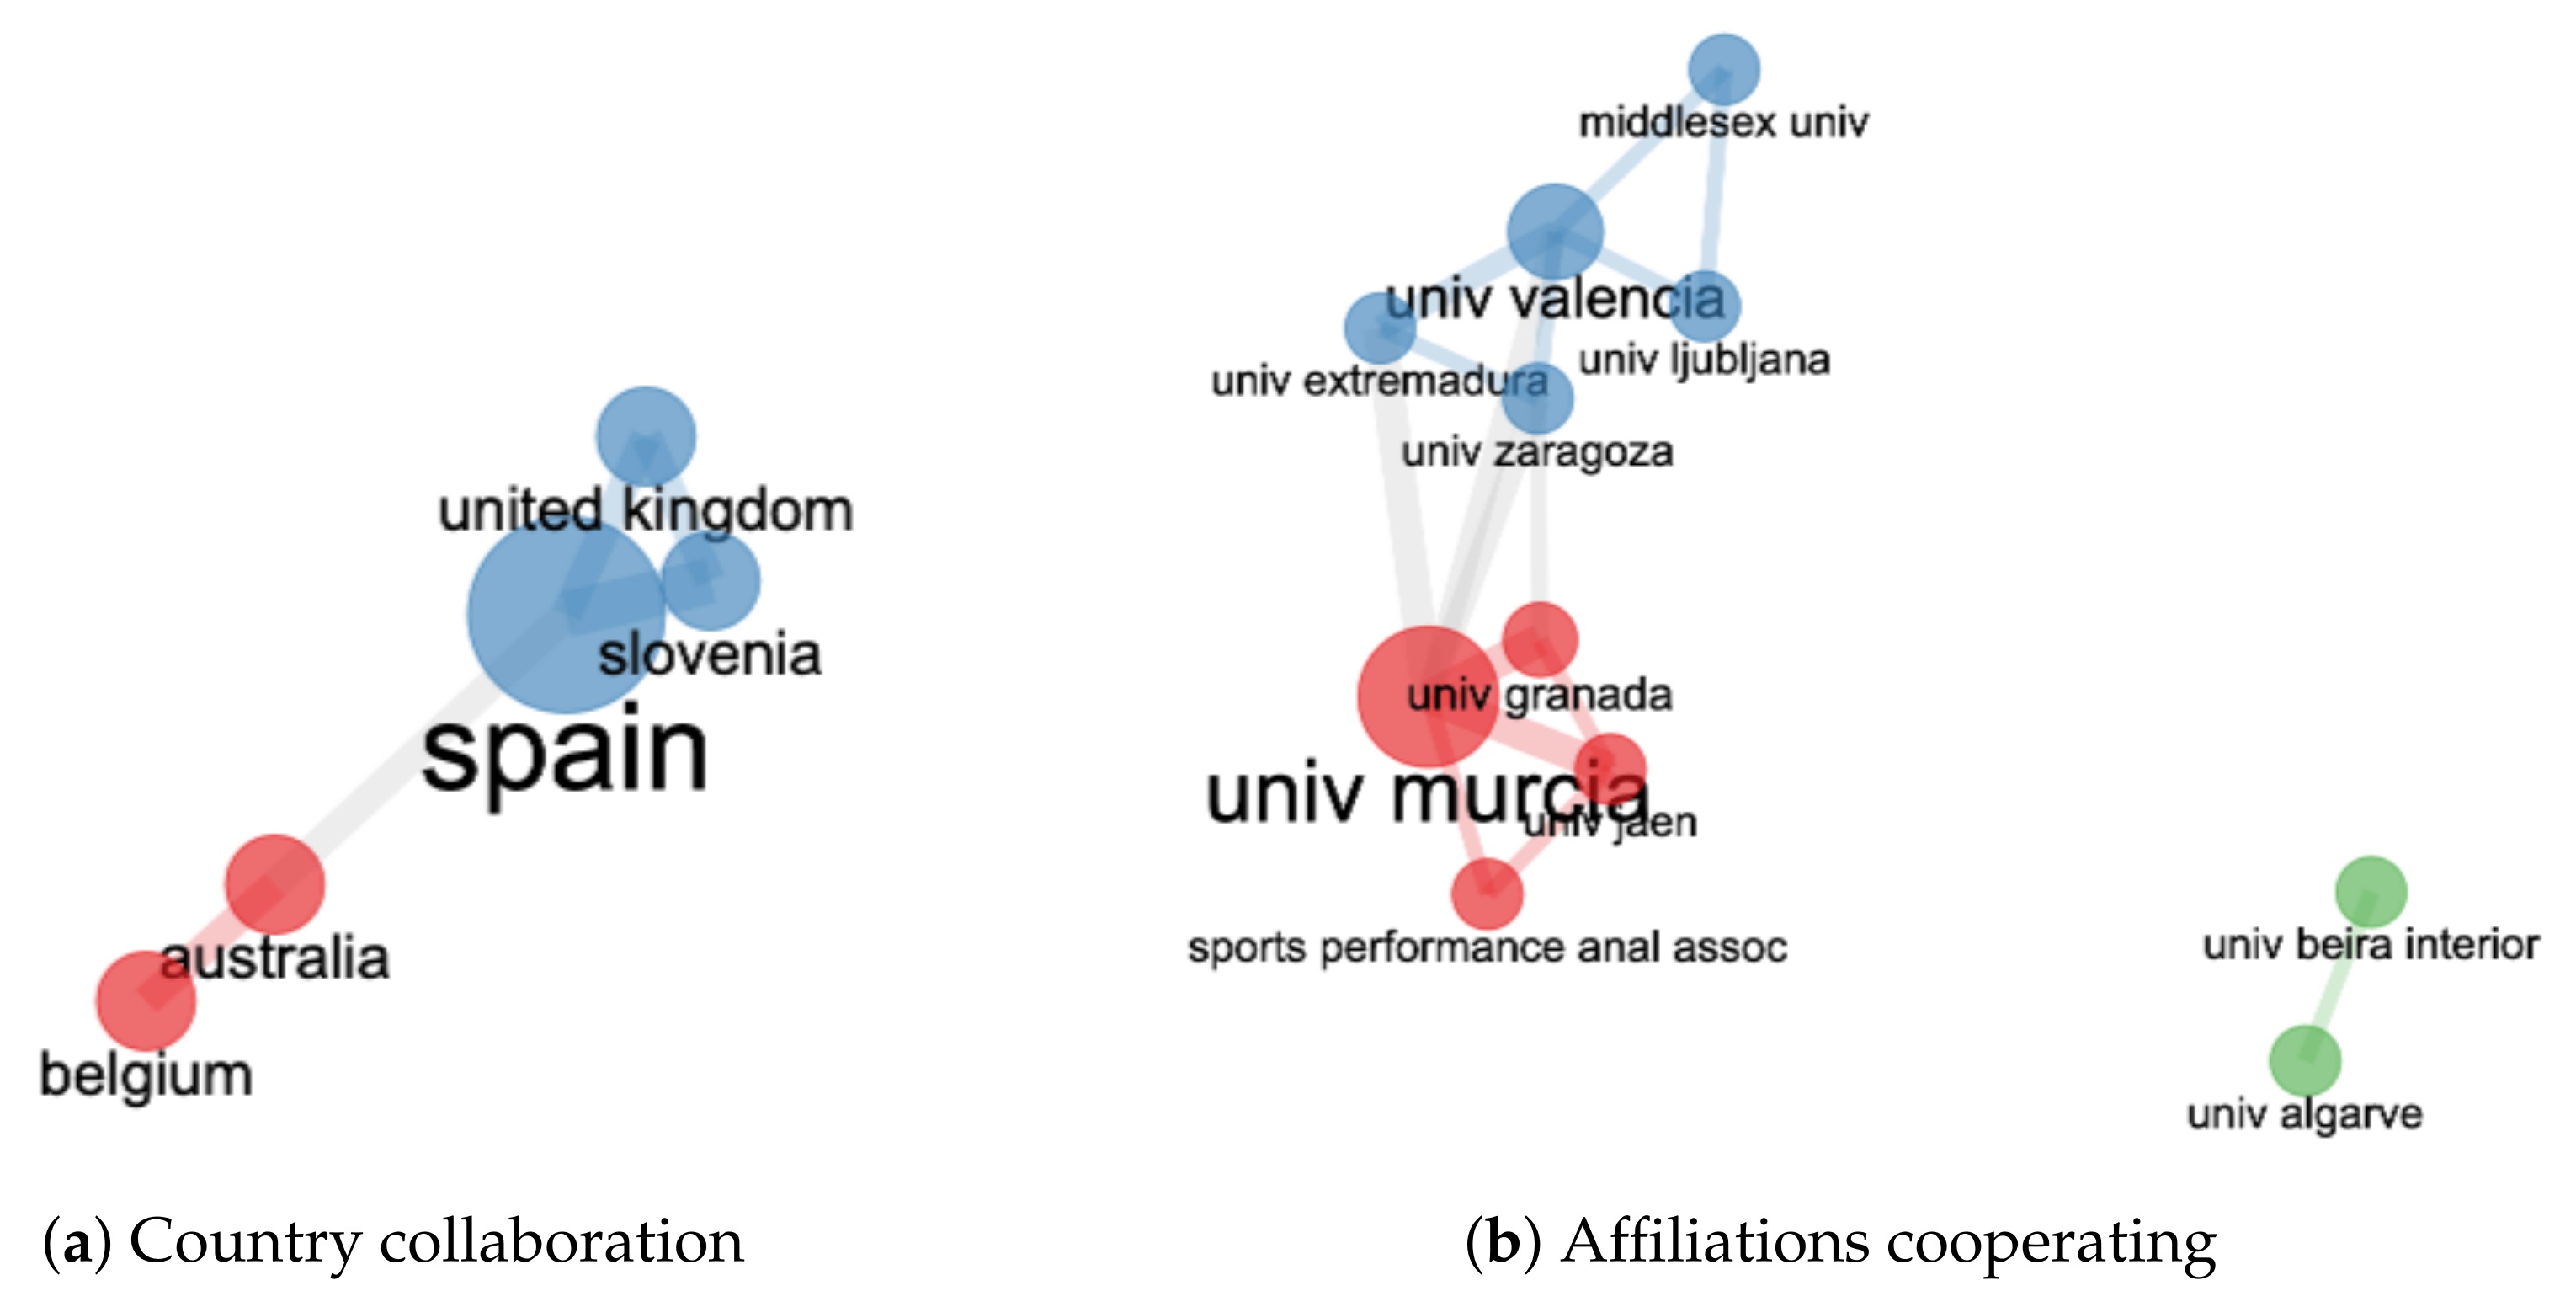
3.2.4. Analysis of the Authors’ Teams, Affiliations, and Countries
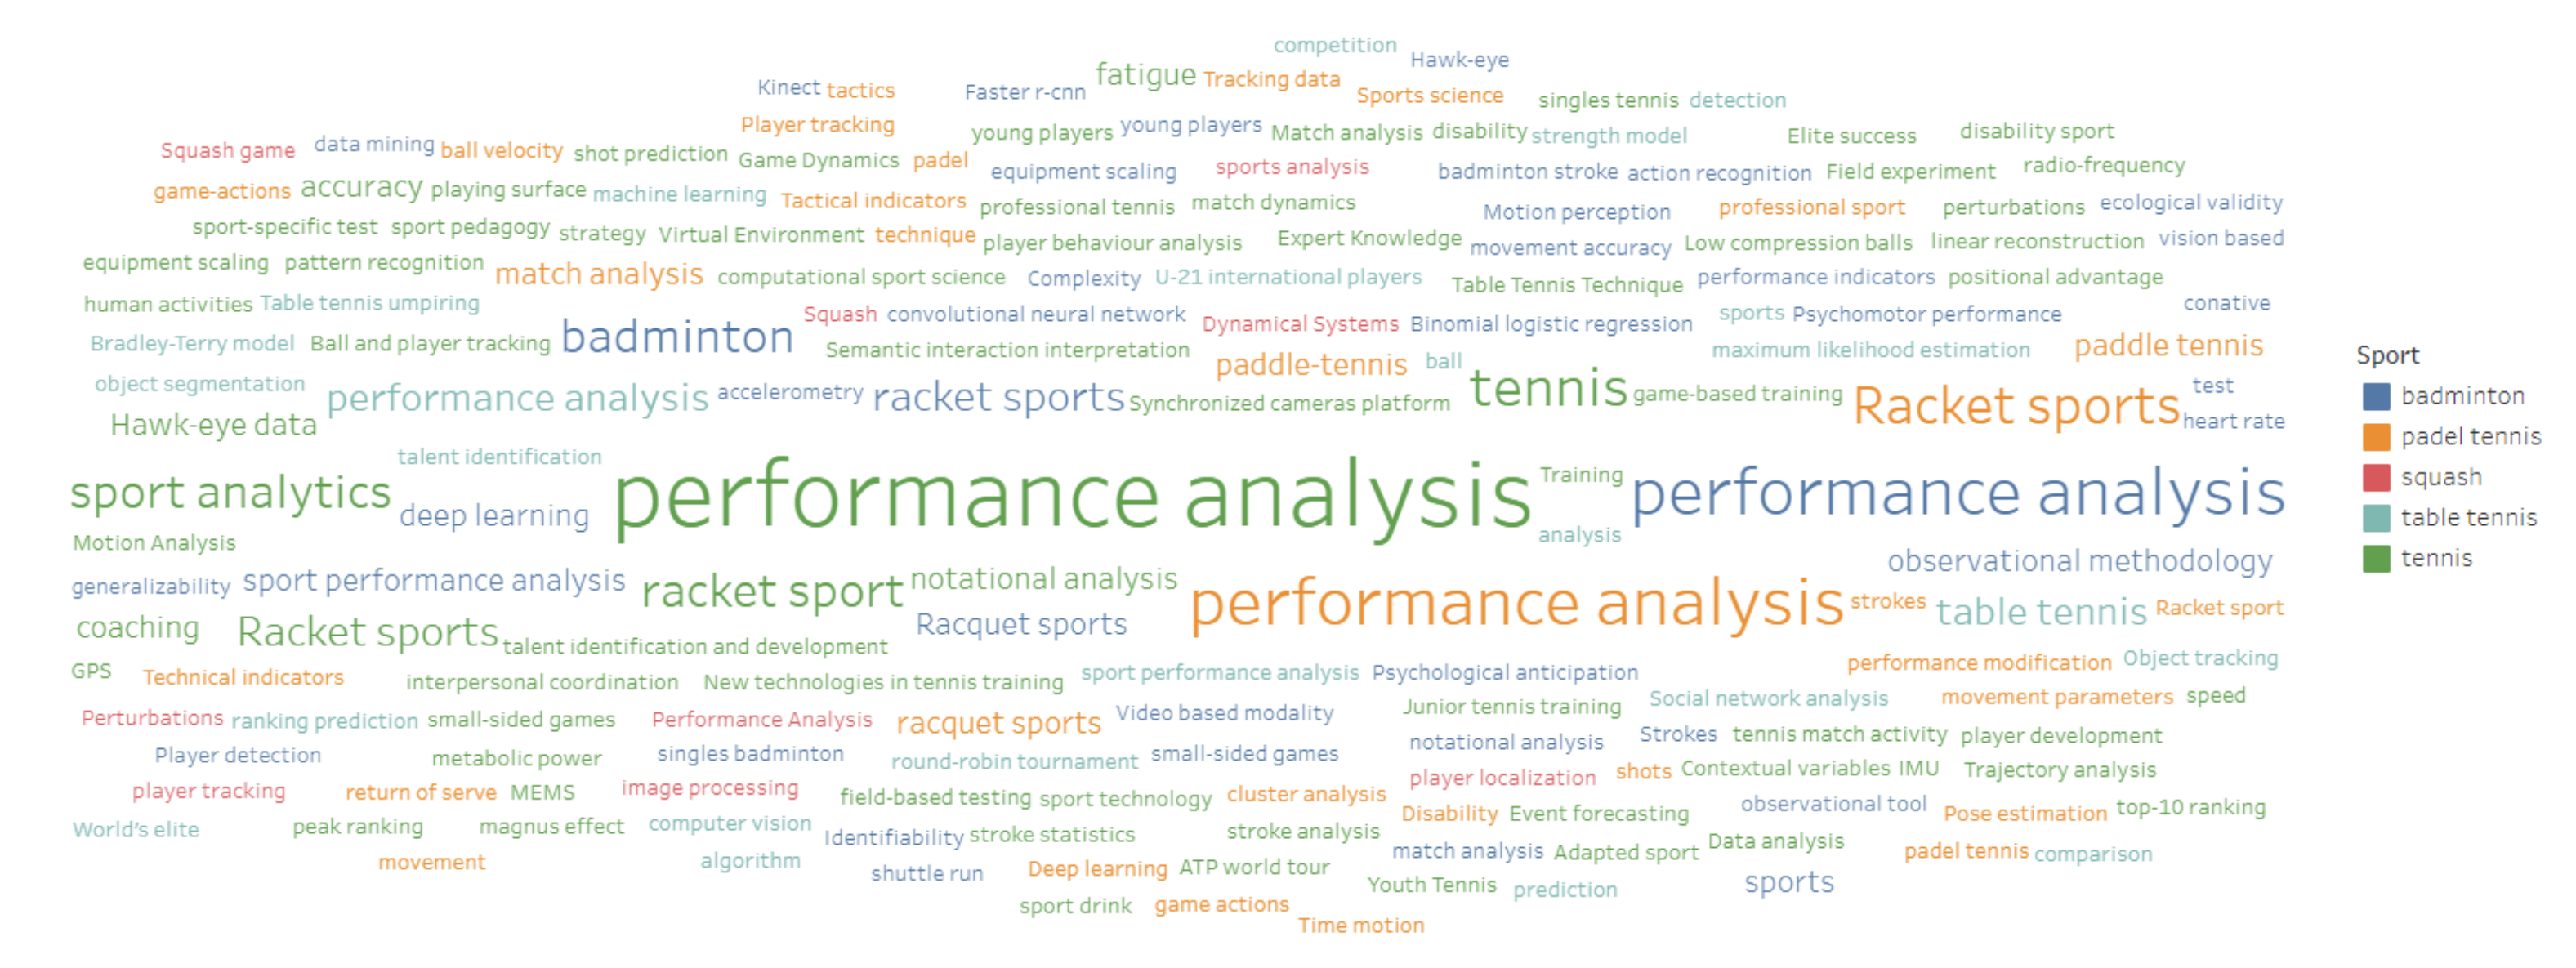
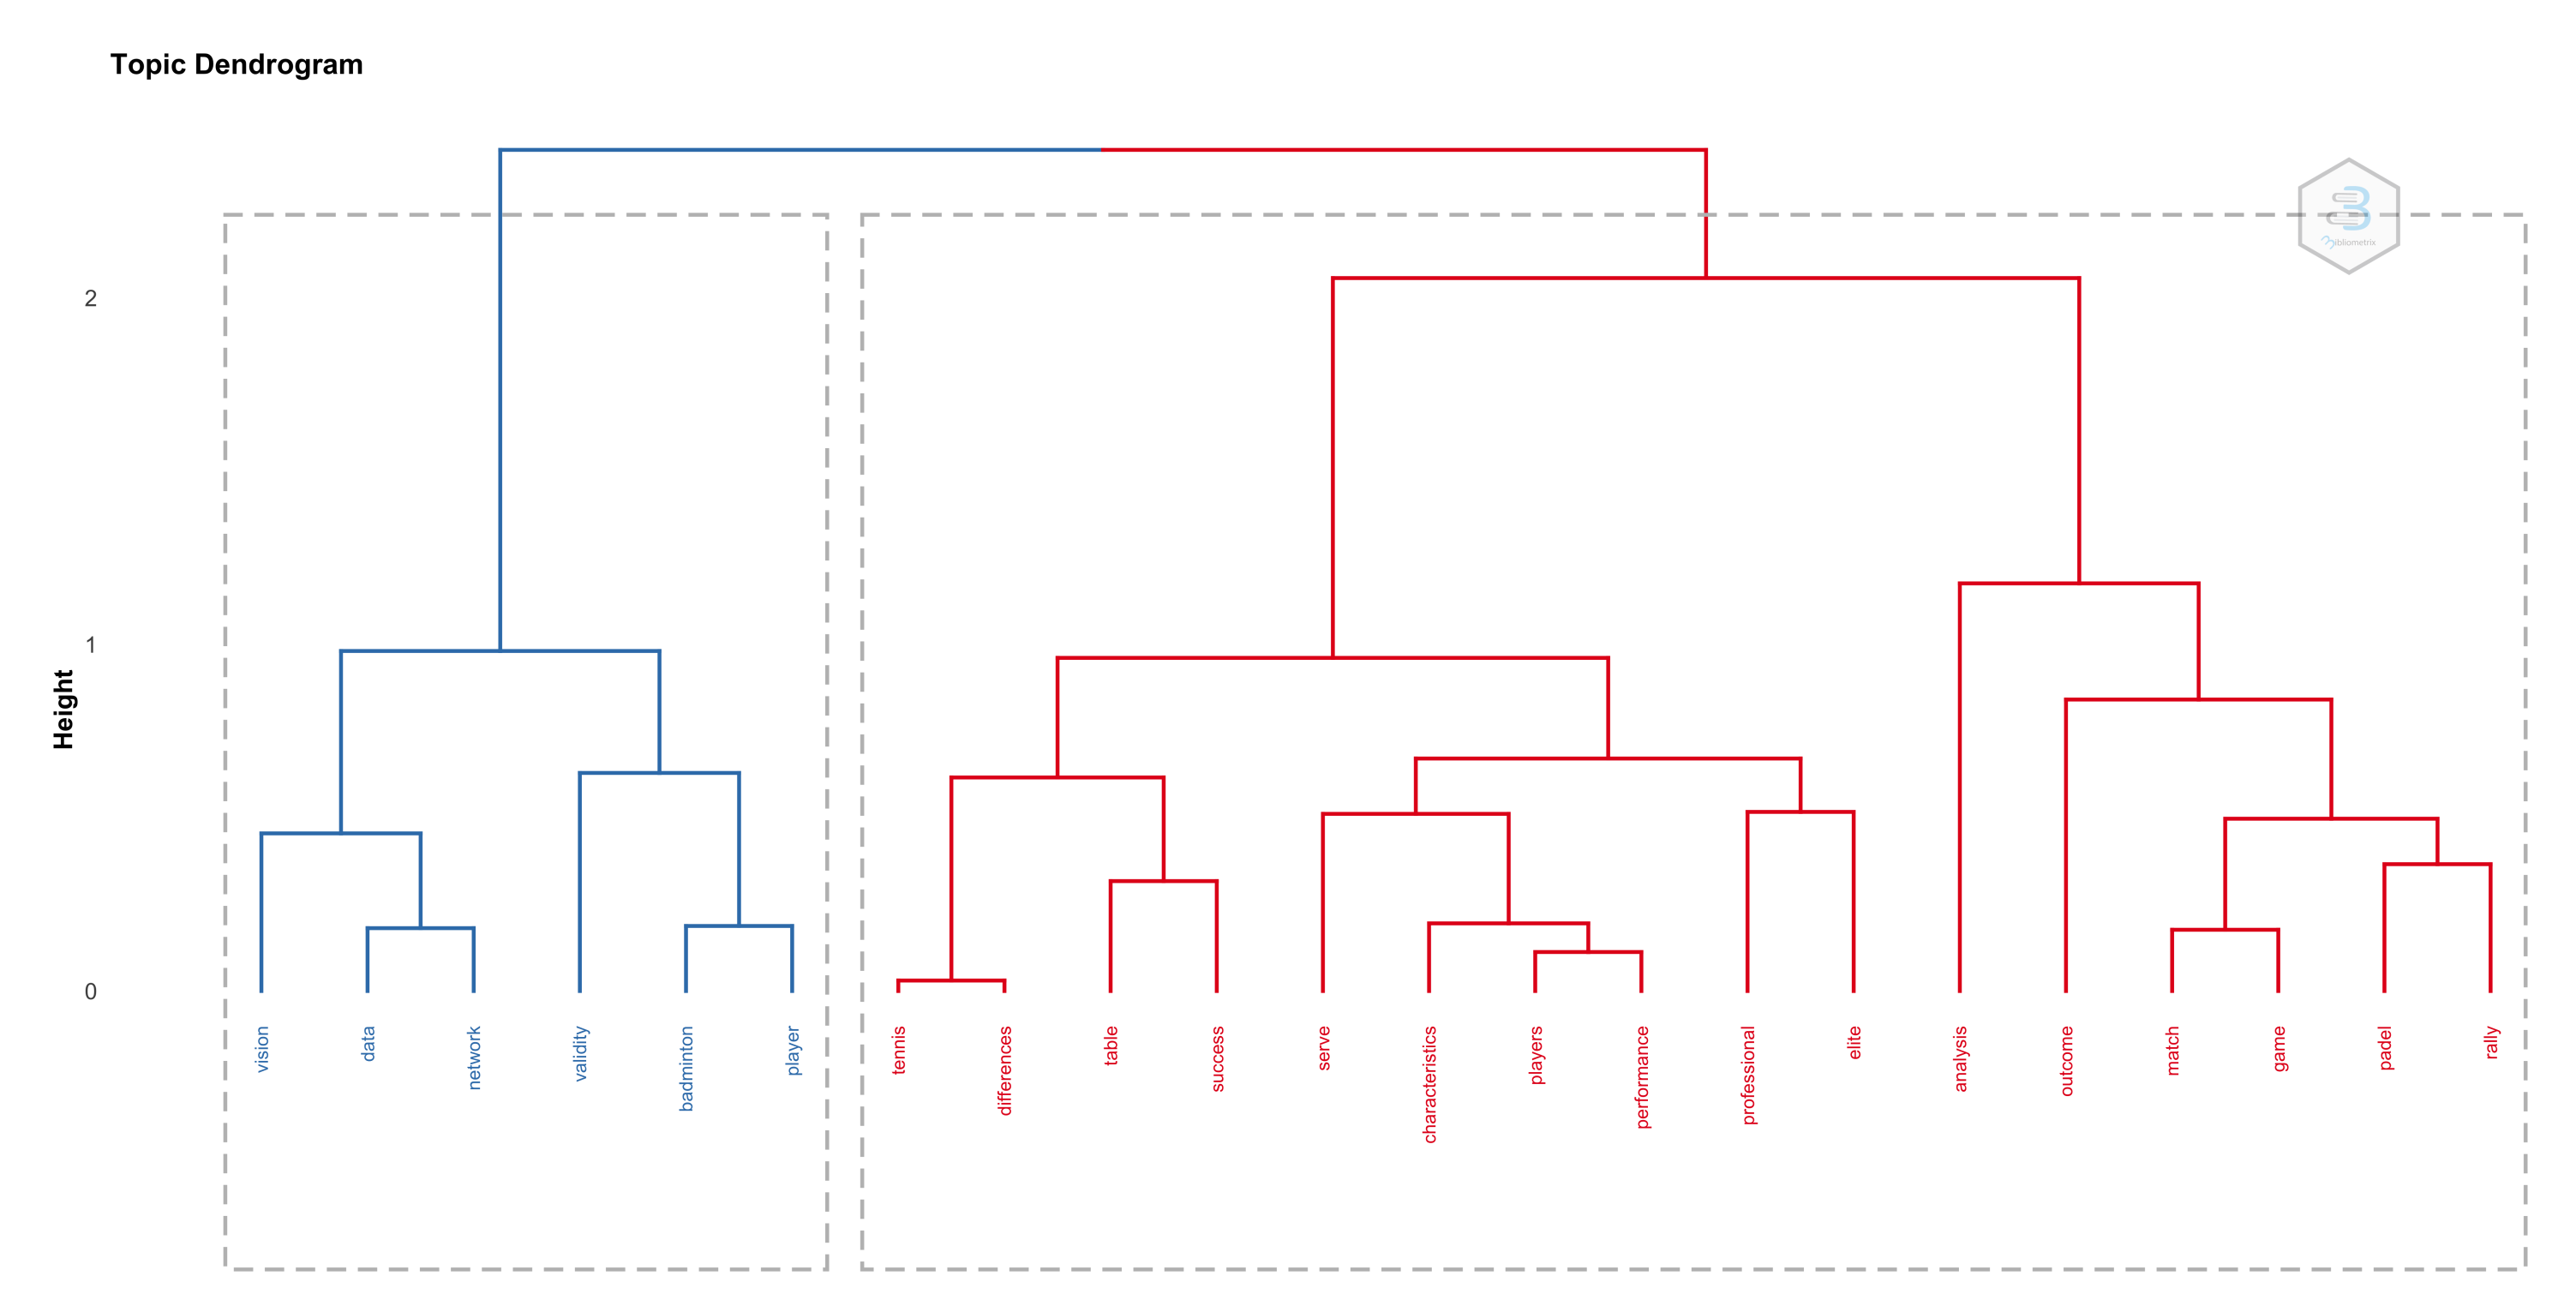
3.2.5. Keyword Analysis
3.2.6. Analysis of Citations
4. Discussion
E-Sport and Virtual Reality
5. Conclusions
Author Contributions
Funding
Institutional Review Board Statement
Informed Consent Statement
Acknowledgments
Conflicts of Interest
References
- Kitchenham, B.; Charters, S. Guidelines for Performing Systematic Literature Reviews in Software Engineering; Technical Report; Department of Computer Science University of Durham: Durham, UK, 2007; pp. 1–57. [Google Scholar]
- Arede, J.; Esteves, P.; Ferreira, A.P.; Sampaio, J.; Leite, N. Jump higher, run faster: Effects of diversified sport participation on talent identification and selection in youth basketball. J. Sport. Sci. 2019, 37, 2220–2227. [Google Scholar] [CrossRef] [PubMed]
- Woods, C.T.; Veale, J.P.; Collier, N.; Robertson, S. The use of player physical and technical skill match activity profiles to predict position in the Australian Football League draft. J. Sport. Sci. 2017, 35, 325–330. [Google Scholar] [CrossRef] [PubMed]
- Waldron, M.; Worsfold, P. Differences in the game specific skills of elite and sub-elite youth football players: Implications for talent identification. Int. J. Perform. Anal. Sport 2010, 10, 9–24. [Google Scholar] [CrossRef]
- Woods, C.T.; Veale, J.; Fransen, J.; Robertson, S.; Collier, N.F. Classification of playing position in elite junior Australian football using technical skill indicators. J. Sport. Sci. 2018, 36, 97–103. [Google Scholar] [CrossRef]
- Woods, C.T.; Bruce, L.; Veale, J.P.; Robertson, S. The relationship between game-based performance indicators and developmental level in junior Australian football: Implications for coaching. J. Sport. Sci. 2016, 34, 2165–2169. [Google Scholar] [CrossRef]
- Lago-Fuentes, C.; Rey, E.; Padrón-Cabo, A.; Prieto-Troncoso, J.; Garcia-Núñez, J. The relative age effect in professional futsal players. J. Hum. Kinet. 2020, 72, 173. [Google Scholar] [CrossRef]
- Saphie, M.N.M.; Jamsari, D.A.; Razi, A.M.; Kusrin, J.; Tumijan, W. Comparison of action performances and outcome between winners and losers in young female silat tempur matches. Rev. Artes Marciales Asiáticas 2019, 14, 21–24. [Google Scholar] [CrossRef]
- Brito, Â.; Roriz, P.; Garganta, J. Positioning and Displacement Patterns of Young Players during 5v5, 7v7, 9v9, and 11v11 Soccer Matches; Universidad de Alicante. Área de Educación Física y Deporte: Alicante, Spain, 2019. [Google Scholar]
- Brito, Â.; Roriz, P.; Silva, P.; Duarte, R.; Garganta, J. Effects of pitch surface and playing position on external load activity profiles and technical demands of young soccer players in match play. Int. J. Perform. Anal. Sport 2017, 17, 902–918. [Google Scholar] [CrossRef]
- Karakulak, I. Determination of running performance in young soccer players. Prog. Nutr. 2020, 22, 58–65. [Google Scholar]
- Gimenez-Egido, J.M.; Ortega-Toro, E.; Palao, J.M.; Verdú-Conesa, I.; Torres-Luque, G. Effect of modification rules in competition on technical–tactical action in young tennis players (under-10). Front. Psychol. 2020, 10, 2789. [Google Scholar] [CrossRef]
- Santos, S.; Mateus, N.; Sampaio, J.; Leite, N. Do previous sports experiences influence the effect of an enrichment programme in basketball skills? J. Sport. Sci. 2017, 35, 1759–1767. [Google Scholar] [CrossRef]
- Nassis, G.P. Effect of altitude on football performance: Analysis of the 2010 FIFA World Cup Data. J. Strength Cond. Res. 2013, 27, 703–707. [Google Scholar] [CrossRef]
- Mangan, S.; Collins, K.; Burns, C.; O’Neill, C. The positional technical and running performance of sub-elite Gaelic football. Sci. Med. Footb. 2020, 4, 182–191. [Google Scholar] [CrossRef]
- Saavedra, J.M.; Þorgeirsson, S.; Chang, M.; Kristjánsdóttir, H.; García-Hermoso, A. Discriminatory power of women’s handball game-related statistics at the olympic games (2004–2016). J. Hum. Kinet. 2018, 62, 221. [Google Scholar] [CrossRef]
- Challis, D.; Scruton, A.; Cole, M.; Callan, M. A time-motion analysis of lightweight women’s judo in the 2010 World Championships. Int. J. Sport. Sci. Coach. 2015, 10, 479–486. [Google Scholar] [CrossRef]
- Hökelmann, A.; Richter, K. New perspectives for performance analysis in gymnastics, handball and skiing. In Proceedings Book; Faculty of Kinesiology, University of Zagreb: Zagreb, Croatia, 2008; p. 858. [Google Scholar]
- Pereira, L.A.; Nakamura, F.Y.; Moraes, J.E.; Kitamura, K.; Ramos, S.P.; Loturco, I. Movement patterns and muscle damage during simulated rugby sevens matches in National team players. J. Strength Cond. Res. 2018, 32, 3456–3465. [Google Scholar] [CrossRef]
- Michael, I.; Serpell, B.G.; Colomer, C.M.; Mara, J.K. Analysing the short-term impact of substitutes vs. starters in international rugby. Int. J. Sport. Sci. Coach. 2019, 14, 667–674. [Google Scholar] [CrossRef]
- Caballero, P.; García-Rubio, J.; Ibáñez, S.J. Influence of situational variables on the U’18 soccer performance analysis. In RETOS. Nuevas Tendencias en Educación Física, Deporte y Recreación; Federación Española de Asociaciones de Docentes de Educación Física: Murcia, Spain, 2017; pp. 224–227. [Google Scholar]
- Slawson, S.; Justham, L.; West, A.; Conway, P.; Caine, M.; Harrison, R. Accelerometer profile recognition of swimming strokes. Eng. Sport 2008, 7, 81–87. [Google Scholar]
- Belli, T.; Misuta, M.S.; de Moura, P.P.R.; dos Santos Tavares, T.; Ribeiro, R.A.; dos Santos, Y.Y.S.; Sarro, K.J.; Galatti, L.R. Reproducibility and validity of a stroke effectiveness test in table tennis based on the temporal game structure. Front. Psychol. 2019, 10, 427. [Google Scholar] [CrossRef]
- Gal, A.M.; Douglas, T.; Chan, A.D.; Hay, D.C. Potential for autonomous linear, curvilinear, and phase detection in natural context para skating using IMU sledge motion data. In Proceedings of the 2020 IEEE International Symposium on Medical Measurements and Applications (MeMeA), Bari, Italy, 1 June–1 July 2020; pp. 1–6. [Google Scholar]
- Tromp, M.; Holmes, L. The effect of free-hit rule changes on match variables and patterns of play in international standard women’s field hockey. Int. J. Perform. Anal. Sport 2011, 11, 376–391. [Google Scholar] [CrossRef]
- Monteiro, L.F.; Gonçalves, J.; Chambel, L.; Abel, M. Evolution of the temporal structure of world high competition judo combat (2013 a 2017). Rev. Artes Marciales Asiáticas 2019, 14, 15–17. [Google Scholar] [CrossRef]
- Franchini, E.; Takito, M.Y.; Calmet, M. European Judo Championships: Impact of the new rule changes on points and penalties. Int. J. Perform. Anal. Sport 2013, 13, 474–479. [Google Scholar] [CrossRef]
- García-de Alcaraz, A.; Gómez-Ruano, M.A.; Papadopoulou, S.D. In search for volleyball entertainment: Impact of new game rules on score and time-related variables. J. Hum. Kinet. 2019, 70, 275–285. [Google Scholar] [CrossRef] [PubMed]
- Ortega-Toro, E.; García-Angulo, A.; Giménez-Egido, J.M.; García-Angulo, F.J.; Palao, J. Effect of modifications in rules in competition on participation of male youth goalkeepers in soccer. Int. J. Sport. Sci. Coach. 2018, 13, 1040–1047. [Google Scholar] [CrossRef]
- Young, C.M.; Luo, W.; Gastin, P.; Lai, J.; Dwyer, D.B. Understanding effective tactics in Australian football using network analysis. Int. J. Perform. Anal. Sport 2019, 19, 331–341. [Google Scholar] [CrossRef]
- Ortega, J.I.; Evangelio, C.; Clemente, F.M.; Martins, F.M.L.; González-Víllora, S. Analysis of physiological, technical, and tactical analysis during a friendly football match of elite U19. Sports 2016, 4, 35. [Google Scholar] [CrossRef] [PubMed]
- Travassos, B.; Bourbousson, J.; Esteves, P.; Marcelino, R.; Pacheco, M.; Davids, K. Adaptive behaviours of attacking futsal teams to opposition defensive formations. Hum. Mov. Sci. 2016, 47, 98–105. [Google Scholar] [CrossRef]
- Korte, F.; Lames, M. Passing network analysis of positional attack formations in handball. J. Hum. Kinet. 2019, 70, 209. [Google Scholar] [CrossRef]
- Clemente, F.M.; Silva, F.; Martins, F.M.L.; Kalamaras, D.; Mendes, R.S. Performance Analysis Tool for network analysis on team sports: A case study of FIFA Soccer World Cup 2014. Proc. Inst. Mech. Eng. Part P J. Sport. Eng. Technol. 2016, 230, 158–170. [Google Scholar] [CrossRef]
- Laporta, L.; Afonso, J.; Valongo, B.; Mesquita, I. Using social network analysis to assess play efficacy according to game patterns: A game-centred approach in high-level men’s volleyball. Int. J. Perform. Anal. Sport 2019, 19, 866–877. [Google Scholar] [CrossRef]
- Paulo, A.; Davids, K.; Araujo, D. Co-adaptation of ball reception to the serve constrains outcomes in elite competitive volleyball. Int. J. Sport. Sci. Coach. 2018, 13, 253–261. [Google Scholar] [CrossRef]
- Kusmakar, S.; Shelyag, S.; Zhu, Y.; Dwyer, D.; Gastin, P.; Angelova, M. Machine Learning Enabled Team Performance Analysis in the Dynamical Environment of Soccer. IEEE Access 2020, 8, 90266–90279. [Google Scholar] [CrossRef]
- Woods, C.T.; McKeown, I.; Shuttleworth, R.J.; Davids, K.; Robertson, S. Training programme designs in professional team sport: An ecological dynamics exemplar. Hum. Mov. Sci. 2019, 66, 318–326. [Google Scholar] [CrossRef]
- Araújo, D.; Davids, K. Team synergies in sport: Theory and measures. Front. Psychol. 2016, 7, 1449. [Google Scholar] [CrossRef]
- Vilar, L.; Araújo, D.; Davids, K.; Button, C. The role of ecological dynamics in analysing performance in team sports. Sport. Med. 2012, 42, 1–10. [Google Scholar] [CrossRef]
- Laporta, L.; Valongo, B.; Afonso, J.; Mesquita, I. Game-Centred Study Using Eigenvector Centrality in High-Level Women’s Volleyball: Play Efficacy is Independent of Game Patterns… Or is it? Montenegrin J. Sport. Sci. Med. 2021, 10, 19–24. [Google Scholar] [CrossRef]
- García-de Alcaraz, P.A.; Usero, L. Influence of contextual variables on performance of the libero player in Top-Level women’s volleyball. J. Hum. Kinet. 2019, 70, 199. [Google Scholar] [CrossRef]
- Marcelino, R.; Mesquita, I.; Sampaio, J. Effects of quality of opposition and match status on technical and tactical performances in elite volleyball. J. Sport. Sci. 2011, 29, 733–741. [Google Scholar] [CrossRef]
- Drikos, S.; Barzouka, K.; Balasas, D.G.; Sotiropoulos, K. Effect of quality of opposition on game performance indicators in elite male volleyball. Int. J. Sport. Sci. Coach. 2021. [Google Scholar] [CrossRef]
- Mertz, J.; Hoover, L.D.; Burke, J.M.; Bellar, D.; Jones, M.L.; Leitzelar, B.; Judge, W.L. Ranking the greatest NBA players: A sport metrics analysis. Int. J. Perform. Anal. Sport 2016, 16, 737–759. [Google Scholar] [CrossRef]
- Lemmer, H.H. Perspectives on the use of the Combined Bowling Rate in Cricket. Int. J. Sport. Sci. Coach. 2014, 9, 513–523. [Google Scholar] [CrossRef]
- Longo, U.G.; Sofi, F.; Candela, V.; Ambrogioni, L.R.; Pagliai, G.; Massaroni, C.; Schena, E.; Cimmino, M.; D’Ancona, F.; Denaro, V. The influence of athletic performance on the highest positions of the final ranking during 2017/2018 Serie A season. BMC Sport. Sci. Med. Rehabil. 2021, 13, 1–8. [Google Scholar] [CrossRef]
- Russomanno, T.; Linke, D.; Geromiller, M.; Lames, M. Performance of Performance Indicators in Football. In International Symposium on Computer Science in Sport; Springer: Berlin/Heidelberg, Germany, 2019; pp. 36–44. [Google Scholar]
- Hansen, C.; Sanz-Lopez, F.; Whiteley, R.; Popovic, N.; Ahmed, H.A.; Cardinale, M. Performance analysis of male handball goalkeepers at the World Handball championship 2015. Biol. Sport 2017, 34, 393. [Google Scholar] [CrossRef]
- Tian, L. Influence of fake passing in breakthrough to pull-up jumper in basketball competitions. J. Interdiscip. Math. 2018, 21, 1205–1209. [Google Scholar] [CrossRef]
- Raiola, G.; Parisi, F.; Giugno, Y.; Di Tore, P.A. Video Analysis Applied to Volleyball Didactics to Improve Sport Skills; Universidad de Alicante. Área de Educación Física y Deporte: Szombathely, Hungary, 2013. [Google Scholar]
- Callaway, A.J. Measuring kinematic variables in front crawl swimming using accelerometers: A validation study. Sensors 2015, 15, 11363–11386. [Google Scholar] [CrossRef]
- Stetter, B.J.; Buckeridge, E.; Nigg, S.R.; Sell, S.; Stein, T. Towards a wearable monitoring tool for in-field ice hockey skating performance analysis. Eur. J. Sport Sci. 2019, 19, 893–901. [Google Scholar] [CrossRef] [PubMed]
- Jahren, S.E.; Aakvaag, N.; Strisland, F.; Vogl, A.; Liberale, A.; Liverud, A.E. Towards Human Motion Tracking Enhanced by Semi-Continuous Ultrasonic Time-of-Flight Measurements. Sensors 2021, 21, 2259. [Google Scholar] [CrossRef]
- Caporaso, T.; Grazioso, S.; Panariello, D.; Di Gironimo, G.; Lanzotti, A. Understanding the human motor control for user-centered design of custom wearable systems: Case studies in sports, industry, rehabilitation. In Proceedings of the International Conference on Design, Simulation, Manufacturing: The Innovation Exchange, Lutsk, Ukraine, 11–14 June 2019; Springer: Berlin/Heidelberg, Germany, 2019; pp. 753–764. [Google Scholar]
- Goud, P.S.H.V.; Roopa, Y.M.; Padmaja, B. Player Performance Analysis in Sports: With Fusion of Machine Learning and Wearable Technology. In Proceedings of the 2019 3rd International Conference on Computing Methodologies and Communication (ICCMC), Erode, India, 27–29 March 2019; pp. 600–603. [Google Scholar]
- Büthe, L.; Blanke, U.; Capkevics, H.; Tröster, G. A wearable sensing system for timing analysis in tennis. In Proceedings of the 2016 IEEE 13th International Conference on Wearable and Implantable Body Sensor Networks (BSN), San Francisco, CA, USA, 14–17 June 2016; pp. 43–48. [Google Scholar]
- Mahmoud, I.; Othman, A.A.A.; Abdelrasoul, E.; Stergiou, P.; Katz, L. The reliability of a real time wearable sensing device to measure vertical jump. Procedia Eng. 2015, 112, 467–472. [Google Scholar] [CrossRef][Green Version]
- Yahya, U.; Senanayake, S.A.; Naim, A.G. Intelligent integrated wearable sensing mechanism for vertical jump height prediction in female netball players. In Proceedings of the 2017 Eleventh International Conference on Sensing Technology (ICST), Sydney, Australia, 4–6 December 2017; pp. 1–7. [Google Scholar]
- Reily, B.; Zhang, H.; Hoff, W. Real-time gymnast detection and performance analysis with a portable 3D camera. Comput. Vis. Image Underst. 2017, 159, 154–163. [Google Scholar] [CrossRef]
- Di Salvo, V.; Baron, R.; Tschan, H.; Montero, F.C.; Bachl, N.; Pigozzi, F. Performance characteristics according to playing position in elite soccer. Int. J. Sport. Med. 2007, 28, 222–227. [Google Scholar] [CrossRef]
- Beato, M.; Jamil, M.; Devereux, G. The reliability of technical and tactical tagging analysis conducted by a semi-automatic VTS in soccer. J. Hum. Kinet. 2018, 62, 103–110. [Google Scholar] [CrossRef] [PubMed]
- Ramón-Llin, J.; Guzmán, J.F.; Llana, S.; James, N.; Vučković, G. Analysis of padel rally characteristics for three competitive levels. Kinesiol. Slov. 2017, 23, 39–49. [Google Scholar]
- Tamaki, S.; Saito, H. Reconstruction of 3d trajectories for performance analysis in table tennis. In Proceedings of the IEEE Conference on Computer Vision and Pattern Recognition Workshops, Portland, OR, USA, 23–28 June 2013; pp. 1019–1026. [Google Scholar]
- Poureghbali, S.; Arede, J.; Rehfeld, K.; Schöllhorn, W.; Leite, N. Want to Impact Physical, Technical, and Tactical Performance during Basketball Small-Sided Games in Youth Athletes? Try Differential Learning Beforehand. Int. J. Environ. Res. Public Health 2020, 17, 9279. [Google Scholar] [CrossRef] [PubMed]
- Cockcroft, J.; Scheffer, C. Determining the feasibility of measuring outdoor road cycling kinematics using inertial motion capture technology. SAIEE Afr. Res. J. 2011, 102, 31–39. [Google Scholar] [CrossRef]
- Swarén, M.; Stöggl, T.; Supej, M.; Eriksson, A. Usage and validation of a tracking system to monitor position and velocity during cross-country skiing. Int. J. Perform. Anal. Sport 2016, 16, 769–785. [Google Scholar] [CrossRef]
- Llosa, J.; Vilajosana, I.; Vilajosana, X.; Navarro, N.; Surinach, E.; Marques, J.M. REMOTE, a wireless sensor network based system to monitor rowing performance. Sensors 2009, 9, 7069–7082. [Google Scholar] [CrossRef]
- Hampson, A.; Randle, H. The influence of an 8-week rider core fitness program on the equine back at sitting trot. Int. J. Perform. Anal. Sport 2015, 15, 1145–1159. [Google Scholar] [CrossRef]
- Castellano, J.; Blanco-Villaseñor, A.; Alvarez, D. Contextual variables and time-motion analysis in soccer. Int. J. Sport. Med. 2011, 32, 415–421. [Google Scholar] [CrossRef]
- Torres-Luque, G.; Fernández-García, Á.I.; Blanca-Torres, J.C.; Kondric, M.; Cabello-Manrique, D. Statistical differences in set analysis in badminton at the RIO 2016 Olympic Games. Front. Psychol. 2019, 10, 731. [Google Scholar] [CrossRef]
- Iván Fernández-García, Á.; María Giménez-Egido, J.; Torres-Luque, G. Differences in Grand Slam competition statistics between professional and U-18 players according to the sex. RICYDE Rev. Int. Cienc. Deporte 2021, 17, 25–37. [Google Scholar] [CrossRef]
- Ibañez, S.J.; García-Rubio, J.; Gómez, M.Á.; Gonzalez-Espinosa, S. The impact of rule modifications on elite basketball teams’ performance. J. Hum. Kinet. 2018, 64, 181. [Google Scholar] [CrossRef]
- Douglas, A.; Johnston, K.; Baker, J.; Rotondi, M.A.; Jamnik, V.K.; Macpherson, A.K. On-ice measures of external load in relation to match outcome in elite female ice hockey. Sports 2019, 7, 173. [Google Scholar] [CrossRef]
- Wedding, C.; Woods, C.; Sinclair, W.; Gomez, M.; Leicht, A. Examining the evolution and classification of player position using performance indicators in the National Rugby League during the 2015–2019 seasons. J. Sci. Med. Sport 2020, 23, 891–896. [Google Scholar] [CrossRef]
- Escobar-Molina, R.; Courel, J.; Franchini, E.; Femia, P.; Stankovic, N. The impact of penalties on subsequent attack effectiveness and combat outcome among high elite judo competitors. Int. J. Perform. Anal. Sport 2014, 14, 946–954. [Google Scholar] [CrossRef]
- Konings, M.J.; Hettinga, F.J. Objectifying tactics: Athlete and race variability in elite short-track speed skating. Int. J. Sport. Physiol. Perform. 2018, 13, 170–175. [Google Scholar] [CrossRef]
- Croft, H.; Willcox, B.; Lamb, P. Using performance data to identify styles of play in netball: An alternative to performance indicators. Int. J. Perform. Anal. Sport 2017, 17, 1034–1043. [Google Scholar] [CrossRef]
- García-de Alcaraz, A.; Marcelino, R. Influence of match quality on men’s volleyball performance at different competition levels. Int. J. Perform. Anal. Sport 2017, 17, 394–405. [Google Scholar] [CrossRef]
- Gómez, M.A.; Lorenzo, A.; Ibañez, S.J.; Sampaio, J. Ball possession effectiveness in men’s and women’s elite basketball according to situational variables in different game periods. J. Sport. Sci. 2013, 31, 1578–1587. [Google Scholar] [CrossRef]
- Sarajärvi, J.; Volossovitch, A.; Almeida, C.H. Analysis of headers in high-performance football: Evidence from the English Premier League. Int. J. Perform. Anal. Sport 2020, 20, 189–205. [Google Scholar] [CrossRef]
- Francis, J.; Owen, A.; Peters, D.M. Making every “point” count: Identifying the key determinants of team success in elite men’s wheelchair basketball. Front. Psychol. 2019, 10, 1431. [Google Scholar] [CrossRef]
- Liu, T.; García-De-Alcaraz, A.; Zhang, L.; Zhang, Y. Exploring home advantage and quality of opposition interactions in the Chinese Football Super League. Int. J. Perform. Anal. Sport 2019, 19, 289–301. [Google Scholar] [CrossRef]
- Pawista, J.A.; Saphie, M.N.M. Activity profile between winners and losers among female exponents in international silat olahraga competition. Rev. Artes Marciales Asiáticas 2019, 14, 25–27. [Google Scholar] [CrossRef]
- Conte, D.; Straigis, E.; Clemente, F.M.; Gómez, M.Á.; Tessitore, A. Performance profile and game-related statistics of FIBA 3x3 Basketball World Cup 2017. Biol. Sport 2019, 36, 149. [Google Scholar] [CrossRef]
- Vencúrik, T.; Nykodỳm, J.; Bokůvka, D.; Rupčić, T.; Knjaz, D.; Dukarić, V.; Struhár, I. Determinants of Dribbling and Passing Skills in Competitive Games of Women’s Basketball. Int. J. Environ. Res. Public Health 2021, 18, 1165. [Google Scholar] [CrossRef]
- Leicht, A.S.; Gómez, M.A.; Woods, C.T. Explaining match outcome during the men’s basketball tournament at the Olympic Games. J. Sport. Sci. Med. 2017, 16, 468. [Google Scholar]
- Wenninger, S.; Link, D.; Lames, M. Performance of machine learning models in application to beach volleyball data. Int. J. Comput. Sci. Sport 2020, 19. [Google Scholar] [CrossRef]
- García-Aliaga, A.; Marquina, M.; Coterón, J.; Rodríguez-González, A.; Luengo-Sánchez, S. In-game behaviour analysis of football players using machine learning techniques based on player statistics. Int. J. Sport. Sci. Coach. 2021, 16, 148–157. [Google Scholar] [CrossRef]
- Khan, M.A.; Habib, M.; Saqib, S.; Alyas, T.; Khan, K.M.; Al Ghamdi, M.A.; Almotiri, S.H. Analysis of the Smart Player’s Impact on the Success of a Team Empowered with Machine Learning; Tech Science Press: Henderson, NV, USA, 2021. [Google Scholar]
- Wang, S.W.; Hsieh, W.W. Performance Analysis of Basketball Referees by Machine Learning Techniques. In Proceedings of the International Congress on Sport Sciences Research and Technology Support, Funchal, Portugal, 30–31 October 2016; SCITEPRESS: Setúbal, Portugal, 2016; Volume 2, pp. 165–170. [Google Scholar]
- Metulini, R. Spatio-temporal movements in team sports: A visualization approach using motion charts. Dep. Econ. Manag. Univ. Brescia Italy Work. Pap. 2016, 8. [Google Scholar] [CrossRef]
- Rangel, W.; Ugrinowitsch, C.; Lamas, L. Basketball players’ versatility: Assessing the diversity of tactical roles. Int. J. Sport. Sci. Coach. 2019, 14, 552–561. [Google Scholar] [CrossRef]
- Lai, M.; Meo, R.; Schifanella, R.; Sulis, E. The role of the network of matches on predicting success in table tennis. J. Sport. Sci. 2018, 36, 2691–2698. [Google Scholar] [CrossRef] [PubMed]
- Rahmad, N.; As’ari, M. The new Convolutional Neural Network (CNN) local feature extractor for automated badminton action recognition on vision based data. J. Phys. Conf. Ser. 2020, 1529, 022021. [Google Scholar] [CrossRef]
- Brock, H.; Ohgi, Y.; Lee, J. Learning to judge like a human: Convolutional networks for classification of ski jumping errors. In Proceedings of the 2017 ACM International Symposium on Wearable Computers, Maui, HI, USA, 11–15 September 2017; pp. 106–113. [Google Scholar]
- Rahmad, N.A.; Sufri, N.A.J.; Muzamil, N.H.; As’ari, M.A. Badminton player detection using faster region convolutional neural network. Indones. J. Electr. Eng. Comput. Sci. 2019, 14, 1330–1335. [Google Scholar] [CrossRef]
- Xu, H.; Yan, R. Research on sports action recognition system based on cluster regression and improved ISA deep network. J. Intell. Fuzzy Syst. 2020, 39, 5871–5881. [Google Scholar] [CrossRef]
- Rahmad, N.; As’ari, M.; Soeed, K.; Zulkapri, I. Automated badminton smash recognition using convolutional neural network on the vision based data. In Proceedings of the IOP Conference Series: Materials Science and Engineering; IOP Publishing: Putrajaya, Malaysia, 2020; Volume 884, p. 012009. [Google Scholar]
- Fok, W.W.; Chan, L.C.; Chen, C. Artificial intelligence for sport actions and performance analysis using recurrent neural network (RNN) with long short-term memory (LSTM). In Proceedings of the 2018 4th International Conference on Robotics and Artificial Intelligence, Guangzhou, China, 17–19 November 2018; pp. 40–44. [Google Scholar]
- James, L.P.; Robertson, S.; Haff, G.G.; Beckman, E.M.; Kelly, V.G. Identifying the performance characteristics of a winning outcome in elite mixed martial arts competition. J. Sci. Med. Sport 2017, 20, 296–301. [Google Scholar] [CrossRef]
- McIntosh, S.; Kovalchik, S.; Robertson, S. Validation of the Australian football league player ratings. Int. J. Sport. Sci. Coach. 2018, 13, 1064–1071. [Google Scholar] [CrossRef]
- McIntosh, S.; Kovalchik, S.; Robertson, S. Examination of player role in the Australian Football League using match performance data. Int. J. Perform. Anal. Sport 2018, 18, 451–462. [Google Scholar] [CrossRef]
- McLean, S.; Salmon, P.M.; Gorman, A.D.; Dodd, K.; Solomon, C. The Communication and Passing Contributions of Playing Positions in a Professional Soccer Team. J. Hum. Kinet. 2021, 77, 223. [Google Scholar] [CrossRef]
- Ramos, J.; Lopes, R.J.; Marques, P.; Araújo, D. Hypernetworks reveal compound variables that capture cooperative and competitive interactions in a soccer match. Front. Psychol. 2017, 8, 1379. [Google Scholar] [CrossRef]
- Van Maarseveen, M.J.; Oudejans, R.R.; Savelsbergh, G.J. System for notational analysis in small-sided soccer games. Int. J. Sport. Sci. Coach. 2017, 12, 194–206. [Google Scholar] [CrossRef]
- Raiola, G.; Giugno, Y.; Scassillo, I.; Di Tore, P.A. An Experimental Study on Aerobic Gymnastic: Performance Analysis as an Effective Evaluation for Technique and Teaching of Motor Gestures; Universidad de Alicante. Área de Educación Física y Deporte: Szombathely, Hungary, 2013. [Google Scholar]
- Lupo, C.; Capranica, L.; Ammendolia, A.; Rizzuto, F.; Tessitore, A. Performance analysis in youth waterbasket–a physiological, time motion, and notational analysis of a new aquatic team sport. Int. J. Perform. Anal. Sport 2012, 12, 1–13. [Google Scholar] [CrossRef]
- Sampaio, J.; Leser, R.; Baca, A.; Calleja-Gonzalez, J.; Coutinho, D.; Gonçalves, B.; Leite, N. Defensive pressure affects basketball technical actions but not the time-motion variables. J. Sport Health Sci. 2016, 5, 375–380. [Google Scholar] [CrossRef] [PubMed]
- Folgado, H.; Bravo, J.; Pereira, P.; Sampaio, J. Towards the use of multidimensional performance indicators in football small-sided games: The effects of pitch orientation. J. Sport. Sci. 2019, 37, 1064–1071. [Google Scholar] [CrossRef] [PubMed]
- Winter, C.; Pfeiffer, M. Tactical metrics that discriminate winning, drawing and losing teams in UEFA Euro 2012®. J. Sport. Sci. 2016, 34, 486–492. [Google Scholar] [CrossRef]
- Chassy, P.; Malone, J.J.; Clark, D.P. A mathematical model of self-organisation in football. Int. J. Perform. Anal. Sport 2018, 18, 217–228. [Google Scholar] [CrossRef]
- Croft, H.; Lamb, P.; Middlemas, S. The application of self-organising maps to performance analysis data in rugby union. Int. J. Perform. Anal. Sport 2015, 15, 1037–1046. [Google Scholar] [CrossRef]
- Sherwood, M.; Lordanic, M.; Bandaragoda, T.; Sherry, E.; Alahakoon, D. A new league, new coverage? Comparing tweets and media coverage from the first season of AFLW. Media Int. Aust. 2019, 172, 114–130. [Google Scholar] [CrossRef]
- Moreira, P.E.D.; Barbosa, G.F.; Murta, C.D.C.F.; Pérez Morales, J.C.; Bredt, S.D.G.T.; Praça, G.M.; Greco, P.J. Network analysis and tactical behaviour in soccer small-sided and conditioned games: Influence of absolute and relative playing areas on different age categories. Int. J. Perform. Anal. Sport 2020, 20, 64–77. [Google Scholar] [CrossRef]
- Machado, G.; Bach Padilha, M.; González Víllora, S.; Clemente, F.M.; Teoldo, I. The effects of positional role on tactical behaviour in a four-a-side small-sided and conditioning soccer game. Kinesiology 2019, 51, 261–270. [Google Scholar] [CrossRef]
- Stensland, H.K.; Gaddam, V.R.; Tennøe, M.; Helgedagsrud, E.; Næss, M.; Alstad, H.K.; Mortensen, A.; Langseth, R.; Ljødal, S.; Landsverk, Ø.; et al. Bagadus: An integrated real-time system for soccer analytics. ACM Trans. Multimed. Comput. Commun. Appl. TOMM 2014, 10, 1–21. [Google Scholar] [CrossRef]
- Zhang, B.; Chen, C.Y.; Chan, L.C.; Fok, W. Intelligent Sports performance Scoring and Analysis system Based on Deep Learning Network. In Proceedings of the 2020 3rd International Conference on Artificial Intelligence and Big Data (ICAIBD), Chengdu, China, 21–31 May 2020; pp. 17–21. [Google Scholar]
- Wu, S.; Bornn, L. Modeling offensive player movement in professional basketball. Am. Stat. 2018, 72, 72–79. [Google Scholar] [CrossRef]
- Silva, F.G.; Gomes, A.J.; Nguyen, Q.T.; Martins, F.M.; Clemente, F.M. A new tool for network analysis on team sports the ultimate performance analysis tool. In Proceedings of the 2017 International Conference on Engineering, Technology and Innovation (ICE/ITMC), Madeira, Portugal, 27–29 June 2017; pp. 439–445. [Google Scholar]
- Wei, X.; Lucey, P.; Morgan, S.; Sridharan, S. Forecasting the next shot location in tennis using fine-grained spatiotemporal tracking data. IEEE Trans. Knowl. Data Eng. 2016, 28, 2988–2997. [Google Scholar] [CrossRef]
- Ley, C.; Dominicy, Y.; Bruneel, W. Mutual point-winning probabilities (MPW): A new performance measure for table tennis. J. Sport. Sci. 2018, 36, 2684–2690. [Google Scholar] [CrossRef] [PubMed]
- Dieu, O.; Schnitzler, C.; Llena, C.; Potdevin, F. Complementing subjective with objective data in analysing expertise: A machine-learning approach applied to badminton. J. Sport. Sci. 2020, 38, 1943–1952. [Google Scholar] [CrossRef] [PubMed]
- Lo, M.; Aughey, R.J.; Hopkins, W.G.; Gill, N.; Stewart, A.M. Out of your zone? 21 years of travel and performance in Super Rugby. J. Sport. Sci. 2019, 37, 2051–2056. [Google Scholar] [CrossRef]
- Linthorne, N.P.; Guzman, M.S.; Bridgett, L.A. Optimum take-off angle in the long jump. J. Sport. Sci. 2005, 23, 703–712. [Google Scholar] [CrossRef]
- Kłys, A.; Sterkowicz-przybycień, K.; Adam, M.; Casals, C. Performance analysis considering the technical-tactical variables in female judo athletes at different sport skill levels: Optimization of predictors. J. Phys. Educ. Sport 2020, 20, 1775–1782. [Google Scholar]
- Li, P.; De Bosscher, V.; Weissensteiner, J.R. The journey to elite success: A thirty-year longitudinal study of the career trajectories of top professional tennis players. Int. J. Perform. Anal. Sport 2018, 18, 961–972. [Google Scholar] [CrossRef]
- Phomsoupha, M.; Berger, Q.; Laffaye, G. Multiple repeated sprint ability test for badminton players involving four changes of direction: Validity and reliability (part 1). J. Strength Cond. Res. 2018, 32, 423–431. [Google Scholar] [CrossRef]
- Gómez, M.Á.; Rivas, F.; Leicht, A.S.; Buldú, J.M. Using network science to unveil badminton performance patterns. Chaos Solitons Fractals 2020, 135, 109834. [Google Scholar] [CrossRef]
- Roberts, J.W.; Keen, B.; Kawycz, S. Anticipation of badminton serves during naturalistic match-play: A case for the post-performance analysis of perceptual-cognitive skills. J. Sport. Med. Phys. Fit. 2019, 59, 1951–1955. [Google Scholar] [CrossRef]
- Torres-Luque, G.; Blanca-Torres, J.C.; Giménez-Egido, J.M.; Cabello-Manrique, D.; Ortega-Toro, E. Design, Validation, and Reliability of an Observational Instrument for Technical and Tactical Actions in Singles Badminton. Front. Psychol. 2020, 11, 3315. [Google Scholar] [CrossRef] [PubMed]
- Ortega-Toro, E.; Blanca-Torres, J.C.; Giménez-Egido, J.M.; Torres-Luque, G. Effect of Scaling Task Constraints on the Learning Processes of Under-11 Badminton Players during Match-Play. Children 2020, 7, 164. [Google Scholar] [CrossRef] [PubMed]
- Valldecabres, R.; de Benito, A.; Casal, C.; Pablos, C. Design and validity of a badminton observation tool (BOT). Rev. Int. Med. Cienc. Act. Fis. Del Deporte 2019, 19. [Google Scholar] [CrossRef]
- Chiminazzo, J.G.C.; Barreira, J.; Luz, L.S.; Saraiva, W.C.; Cayres, J.T. Technical and timing characteristics of badminton men’s single: Comparison between groups and play-offs stages in 2016 Rio Olympic Games. Int. J. Perform. Anal. Sport 2018, 18, 245–254. [Google Scholar] [CrossRef]
- Barreira, J.; Chiminazzo, J.G.C.; Fernandes, P.T. Analysis of point difference established by winners and losers in games of badminton. Int. J. Perform. Anal. Sport 2016, 16, 687–694. [Google Scholar] [CrossRef]
- Primo, L.; Gutiérrez-Suárez, A.; Gómez, M.Á. Analysis of challenge request success according to contextual variables in elite badminton. Ger. J. Exerc. Sport Res. 2019, 49, 259–265. [Google Scholar] [CrossRef]
- Yong, T.H.; Tan, D.Y.W. Preliminary investigation of movement-heart rate relationship using kinect-based badminton performance analysis. In Proceedings of the 2017 International Conference on robotics, automation and sciences (ICORAS), Melaka, Malaysia, 27–29 November 2017; pp. 1–5. [Google Scholar]
- Javadiha, M.; Andujar, C.; Lacasa, E.; Ric, A.; Susin, A. Estimating Player Positions from Padel High-Angle Videos: Accuracy Comparison of Recent Computer Vision Methods. Sensors 2021, 21, 3368. [Google Scholar] [CrossRef]
- Ramón-Llin, J.; Guzmán, J.; Martínez-Gallego, R.; Muñoz, D.; Sánchez-Pay, A.; Sánchez-Alcaraz, B.J. Stroke analysis in padel according to match outcome and game side on court. Int. J. Environ. Res. Public Health 2020, 17, 7838. [Google Scholar] [CrossRef]
- Sánchez-Alcaraz, B.J.; Perez-Puche, D.T.; Pradas, F.; Ramón-Llín, J.; Sánchez-Pay, A.; Muñoz, D. Analysis of performance parameters of the smash in male and female professional padel. Int. J. Environ. Res. Public Health 2020, 17, 7027. [Google Scholar] [CrossRef]
- Sánchez-Alcaraz, B.J.; Muñoz, D.; Pradas, F.; Ramón-Llin, J.; Cañas, J.; Sánchez-Pay, A. Analysis of serve and serve-return strategies in elite male and female padel. Appl. Sci. 2020, 10, 6693. [Google Scholar] [CrossRef]
- Navas Sanz, D.; Ramón-Llín, J.; Veiga, S. Match analysis of wheelchair padel players of different functional level. J. Hum. Sport Exerc. 2018, 13, 916–925. [Google Scholar] [CrossRef]
- Courel-Ibáñez, J.; Martínez, B.J.S.A.; Cañas, J. Game performance and length of rally in professional padel players. J. Hum. Kinet. 2017, 55, 161. [Google Scholar] [CrossRef]
- Ramón-Llin, J.; Guzmán, J.F.; Llana, S.; Martínez-Gallego, R.; James, N.; Vučković, G. The effect of the return of serve on the server pair’s movement parameters and rally outcome in padel using cluster analysis. Front. Psychol. 2019, 10, 1194. [Google Scholar] [CrossRef]
- Escudero-Tena, A.; Sánchez-Alcaraz, B.J.; García-Rubio, J.; Ibáñez, S.J. Analysis of Game Performance Indicators during 2015–2019 World Padel Tour Seasons and Their Influence on Match Outcome. Int. J. Environ. Res. Public Health 2021, 18, 4904. [Google Scholar] [CrossRef]
- Courel-Ibáñez, J.; Sánchez-Alcaraz, J.B.; Cañas, J. Effectiveness at the net as a predictor of final match outcome in professional padel players. Int. J. Perform. Anal. Sport 2015, 15, 632–640. [Google Scholar] [CrossRef]
- Rivilla-García, J.; Muñoz Moreno, A.; Lorenzo, J.; Van den Tillaar, R.; Navandar, A. Influence of the opposition on overhead smash velocity in padel players. Kinesiology 2019, 51, 206–212. [Google Scholar] [CrossRef]
- Tahan, O.; Rady, M.; Sleiman, N.; Ghantous, M.; Merhi, Z. A computer vision driven squash players tracking system. In Proceedings of the 2018 19th IEEE Mediterranean Electrotechnical Conference (MELECON), Marrakech, Morocco, 2–7 May 2018; pp. 155–159. [Google Scholar]
- Roddy, R.; Lamb, K.; Worsfold, P. The importance of perturbations in elite squash: An analysis of their ability to successfully predict rally outcome. Int. J. Perform. Anal. Sport 2014, 14, 652–679. [Google Scholar] [CrossRef][Green Version]
- Triamlumlerd, S.; Pracha, M.; Kongsuwan, P.; Angsuchotmetee, P. A table tennis performance analyzer via a single-view low-quality camera. In Proceedings of the 2017 International Electrical Engineering Congress (iEECON), Pattaya, Thailand, 8–10 March 2017; pp. 1–4. [Google Scholar]
- Oldham, K.M.; Chung, P.W.H.; Edirisinghe, E.A.; Halkon, B.J. Experiments in the application of computer vision for ball and event identification in indoor sports. In Computational Intelligence in Information Systems; Springer: Berlin/Heidelberg, Germany, 2015; pp. 275–284. [Google Scholar]
- Sindik, J.; Kondri, M. Correlation between the result efficiency indexes and success in table tennis. Int. J. Perform. Anal. Sport 2011, 11, 267–283. [Google Scholar] [CrossRef]
- Loh, T.C.; Krasilshchikov, O. Competition performance variables differences in elite and U-21 international men singles table tennis players. J. Phys. Educ. Sport 2015, 15. [Google Scholar] [CrossRef]
- Renò, V.; Mosca, N.; Nitti, M.; D’Orazio, T.; Guaragnella, C.; Campagnoli, D.; Prati, A.; Stella, E. A technology platform for automatic high-level tennis game analysis. Comput. Vis. Image Underst. 2017, 159, 164–175. [Google Scholar] [CrossRef]
- Munivrana, G.; Furjan-Mandić, G.; Kondrič, M. Determining the structure and evaluating the role of technical-tactical elements in basic table tennis playing systems. Int. J. Sport. Sci. Coach. 2015, 10, 111–132. [Google Scholar] [CrossRef]
- Raschke, A.; Lames, M. Video-based tactic training in tennis. Ger. J. Exerc. Sport Res. 2019, 49, 345–350. [Google Scholar] [CrossRef]
- Bačić, B.; Hume, P.A. Computational intelligence for qualitative coaching diagnostics: Automated assessment of tennis swings to improve performance and safety. Big Data 2018, 6, 291–304. [Google Scholar] [CrossRef]
- Saito, K.; Masai, K.; Sugiura, Y.; Kimura, T.; Sugimoto, M. Development of a virtual environment for motion analysis of tennis service returns. In Proceedings of the 1st International Workshop on Multimedia Content Analysis in Sports, Seoul, Korea, 26 October 2018; pp. 59–66. [Google Scholar]
- Myers, N.; Kibler, W.; Axtell, A.; Uhl, T. The Sony Smart Tennis Sensor accurately measures external workload in junior tennis players. Int. J. Sport. Sci. Coach. 2019, 14, 24–31. [Google Scholar] [CrossRef]
- Martin, C.; Bideau, B.; Touzard, P.; Kulpa, R. Identification of serve pacing strategies during five-set tennis matches. Int. J. Sport. Sci. Coach. 2019, 14, 32–42. [Google Scholar] [CrossRef]
- Carvalho, J.; Araújo, D.; Travassos, B.; Esteves, P.; Pessanha, L.; Pereira, F.; Davids, K. Dynamics of players’ relative positioning during baseline rallies in tennis. J. Sport. Sci. 2013, 31, 1596–1605. [Google Scholar] [CrossRef]
- McRae, K.A.; Galloway, S.D. Carbohydrate-electrolyte drink ingestion and skill performance during and after 2 hr of indoor tennis match play. Int. J. Sport Nutr. Exerc. Metab. 2012, 22, 38–46. [Google Scholar] [CrossRef]
- Houston, J.M.; Carter, D.; Smither, R.D. Competitiveness in elite professional athletes. Percept. Mot. Ski. 1997, 84, 1447–1454. [Google Scholar] [CrossRef]
- Carvalho, J.; Araújo, D.; Travassos, B.; Fernandes, O.; Pereira, F.; Davids, K. Interpersonal dynamics in baseline rallies in tennis. Int. J. Sport. Sci. Coach. 2014, 9, 1043–1056. [Google Scholar] [CrossRef]
- Fitzpatrick, A.; Stone, J.A.; Choppin, S.; Kelley, J. A simple new method for identifying performance characteristics associated with success in elite tennis. Int. J. Sport. Sci. Coach. 2019, 14, 43–50. [Google Scholar] [CrossRef]
- Ponzano, M.; Gollin, M. Movement analysis and metabolic profile of tennis match play: Comparison between hard courts and clay courts. Int. J. Perform. Anal. Sport 2017, 17, 220–231. [Google Scholar] [CrossRef]
- Prieto-Bermejo, J.; Gómez-Ruano, M.Á. Entering tennis men’s Grand Slams within the top-10 and its relationship with the fact of winning the tournament. [Acceder a los Grand Slams de tenis masculino desde el top-10 y su relación con el hecho de ganar el torneo]. RICYDE Rev. Int. Cienc. Del Deporte 2016, 12, 410–422. [Google Scholar] [CrossRef]
- Mecheri, S.; Rioult, F.; Mantel, B.; Kauffmann, F.; Benguigui, N. The serve impact in tennis: First large-scale study of big Hawk-Eye data. Stat. Anal. Data Min. ASA Data Sci. J. 2016, 9, 310–325. [Google Scholar] [CrossRef]
- Kilit, B.; Şenel, Ö.; Arslan, E.; Can, S. Physiological responses and match characteristics in professional tennis players during a one-hour simulated tennis match. J. Hum. Kinet. 2016, 51, 83. [Google Scholar] [CrossRef]
- Hizan, H.; Whipp, P.; Reid, M. Gender differences in the spatial distributions of the tennis serve. Int. J. Sport. Sci. Coach. 2015, 10, 87–96. [Google Scholar] [CrossRef]
- Kos, M.; Kramberger, I. Tennis stroke consistency analysis using miniature wearable IMU. In Proceedings of the 2018 25th International Conference on Systems, Signals and Image Processing (IWSSIP), Maribor, Slovenia, 20–22 June 2018; pp. 1–4. [Google Scholar]
- Hammond, J.; Smith, C. Low compression tennis balls and skill development. J. Sport. Sci. Med. 2006, 5, 575. [Google Scholar]
- Martínez-Gallego, R.; Salvador, S.M.; Luján, J.F.G.; Reid, M.; Ramón-Llin, J.; Crespo, M. Challenging serve myths in doubles tennis. Int. J. Sport. Sci. Coach. 2021. [Google Scholar] [CrossRef]
- Li, P.; Weissensteiner, J.R.; Pion, J.; Bosscher, V.D. Predicting elite success: Evidence comparing the career pathways of top 10 to 300 professional tennis players. Int. J. Sport. Sci. Coach. 2020, 15, 793–802. [Google Scholar] [CrossRef]
- Sánchez-Pay, A.; Torres-Luque, G.; Sanz-Rivas, D.; Courel-Ibáñez, J. The use of bounce in professional wheelchair tennis. Int. J. Sport. Sci. Coach. 2020, 15, 375–381. [Google Scholar] [CrossRef]
- Cui, Y.; Liu, H.; Liu, H.; Gómez, M.Á. Data-driven analysis of point-by-point performance for male tennis player in Grand Slams. Motricidade 2019, 15, 49–61. [Google Scholar]
- Rhodes, J.; Mason, B.; Perrat, B.; Smith, M.; Goosey-Tolfrey, V. The validity and reliability of a novel indoor player tracking system for use within wheelchair court sports. J. Sport. Sci. 2014, 32, 1639–1647. [Google Scholar] [CrossRef] [PubMed]


| Query | Nb. of Outcomes |
|---|---|
| TS = (“performance analysis” AND sport) | 824 |
| TITLE-ABS-KEY = (“performance analysis” AND sport) | 978 |
| Tools | Sports | No. of Articles |
|---|---|---|
| Amisco Pro | football, running | 2 |
| Babolat Play | tennis | 1 |
| Digital.Stadium (R) | football | 1 |
| Garmin (TM) Heart Rate Band | basketball | 1 |
| GPS | cycling, horse racing, sailing, running, surfing, tennis, basketball, football (13), handball (3), hockey, netball, rugby (6), volleyball | 32 |
| IMSs | cycling | 1 |
| Microsoft Kinect 2 | gymnastics | 1 |
| Pliance (TM) electronic saddle mat, Casio high speed camera with Quintic (TM) biomechanical software | horse racing | 1 |
| Remote, RowX | rowing | 1 |
| RGB camera | skeleton, table tennis | 2 |
| RTLS | skiing | 1 |
| SAGIT | table tennis | 1 |
| Sony Smart Tennis | tennis | 1 |
| VERT | volleyball | 1 |
| Vicon Motion Systems | football | 1 |
| Wimu (TM) | basketball | 1 |
| Sports | Performance Analysis Method | Publications |
|---|---|---|
| badminton | combine approach (observation+statistical) | [123] |
| n/a | [128] | |
| neural network | [95,97,99,129,130] | |
| observation | [131,132,133,134] | |
| statistical approach | [71,135,136,137] | |
| padel tennis | neural network | [138] |
| observation | [139,140,141,142,143] | |
| observation (tracking software) | [63,144] | |
| statistical approach | [145,146,147] | |
| squash | observation (tracking software) | [148] |
| statistical approach | [149] | |
| table tennis | neural network | [94] |
| observation | [150,151] | |
| observation (tracking software) | [64] | |
| statistical approach | [122,152,153] | |
| tennis | observation | [12,23,57,121,154,155,156,157,158] |
| observation (tracking software) | [159] | |
| statistical approach | [72,127,160,161,162,163,164,165,166,167,168,169,170,171,172,173,174,175,176] |
| Sources | Articles |
|---|---|
| International Journal of Sports Science and Coaching | 9 |
| International Journal of Performance Analysis In Sport | 7 |
| Frontiers In Psychology | 5 |
| Journal of Sports Sciences | 5 |
| International Journal of Environmental Research And Public Health | 3 |
| German Journal of Exercise And Sport Research | 2 |
| Journal of Human Kinetics | 2 |
| Ricyde-Revista Internacional De Ciencias Del Deporte | 2 |
| 2013 IEEE Conference on Computer Vision And Pattern Recognition Workshops | 1 |
| 2016 IEEE 13th International Conference on Wearable And Implantable Body Sensor Networks | 1 |
| 2017 International Conference on Robotics Automation And Sciences | 1 |
| 2017 International Electrical Engineering Congress | 1 |
| 2018 19th IEEE Mediterranean Electrotechnical Conference | 1 |
| 2018 25th International Conference on Systems Signals And Image Processing | 1 |
| Applied Sciences-Basel | 1 |
| Big Data | 1 |
| Computational Intelligence In Information Systems | 1 |
| Computer Vision And Image Understanding | 1 |
| Chaos Solitons and Fractals | 1 |
| Children-Basel | 1 |
| Authors | Articles | Authors | Articles |
|---|---|---|---|
| Ramon-Llin J | 7 | Kondric M | 3 |
| Torres-Luque G | 6 | Martinez-Gallego R | 3 |
| Sanchez-Alcaraz B | 5 | Munoz D | 3 |
| Gimenez-Egido J | 4 | Ortega-Toro E | 3 |
| Sanchez-Pay A | 4 | Rahmad N | 3 |
| As’ari M | 3 | Araujo D | 2 |
| Blanca-Torres J | 3 | Barreira J | 2 |
| Canas J | 3 | Cabello-Manrique D | 2 |
| Courel-Ibanez J | 3 | Carvalho J | 2 |
| Guzman J | 3 | Davids K | 2 |
| Country | A | SCP | MCP | Affiliations | A |
|---|---|---|---|---|---|
| Spain | 17 | 12 | 5 | Univ Murcia | 12 |
| United Kingdom | 6 | 6 | 0 | Univ Valencia | 10 |
| Australia | 4 | 1 | 3 | Univ Estadual Campinas | 6 |
| France | 4 | 4 | 0 | Univ Granada | 5 |
| Malaysia | 4 | 4 | 0 | Univ Jaen | 5 |
| Argentina | 3 | 3 | 0 | Univ Ljubljana | 5 |
| Belgium | 3 | 1 | 2 | Univ Extremadura | 4 |
| Brazil | 3 | 3 | 0 | Univ Politecn Madrid | 4 |
| Italy | 3 | 2 | 1 | Univ Zaragoza | 4 |
| Slovenia | 3 | 2 | 1 | Universiti Teknologi Malaysia | 4 |
| Portugal | 2 | 0 | 2 | Sheffield Hallam Univ | 3 |
| USA | 2 | 2 | 0 | Univ Caen Normandy | 3 |
| Croatia | 1 | 0 | 1 | Univ Ghent | 3 |
| Germany | 1 | 1 | 0 | Univ Loughborough | 3 |
| China | 1 | 1 | 0 | Univ Politecn Catalunya | 3 |
| Japan | 1 | 1 | 0 | Auckland Univ Technol | 2 |
| Lebanon | 1 | 1 | 0 | Catholic Univ Valencia San Vicente | 2 |
| New Zealand | 1 | 1 | 0 | Middlesex Univ | 2 |
| Switzerland | 1 | 1 | 0 | Queensland Univ Technol | 2 |
| Thailand | 1 | 1 | 0 | So Cross Univ | 2 |
| Author Keywords | Occurrences | Title Words | Occurrences |
|---|---|---|---|
| performance analysis | 44 | tennis | 35 |
| racket sports | 13 | analysis | 20 |
| tennis | 8 | players | 16 |
| racket sport | 7 | badminton | 15 |
| badminton | 5 | performance | 13 |
| match analysis | 5 | padel | 11 |
| racquet sports | 4 | professional | 9 |
| sport analytics | 4 | elite | 8 |
| deep learning | 3 | match | 8 |
| notational analysis | 3 | table | 8 |
| sport performance analysis | 3 | serve | 6 |
| sports | 3 | success | 6 |
| table tennis | 3 | data | 5 |
| accuracy | 2 | game | 5 |
| coaching | 2 | network | 5 |
| disability | 2 | outcome | 5 |
| elite success | 2 | vision | 5 |
| equipment scaling | 2 | differences | 4 |
| fatigue | 2 | characteristics | 4 |
| hawk-eye data | 2 | player | 4 |
| Paper | Total Citations | TC per Year | Normalized TC |
|---|---|---|---|
| Courel-Ibánez et al. [143] | 42 | 8.4 | 3.761 |
| Courel-Ibánez et al. [146] | 38 | 5.429 | 2.676 |
| Rhodes et al. [177] | 36 | 4.5 | 2.25 |
| Mecheri et al. [168] | 19 | 3.167 | 1.754 |
| Carvalho et al. [161] | 18 | 2 | 1.636 |
| Houston et al. [163] | 17 | 0.68 | 1 |
| Hammond and Smith [172] | 16 | 1 | 1 |
| Hizan et al. [170] | 15 | 2.143 | 1.056 |
| Ramón-Llin et al. [144] | 14 | 4.667 | 2.676 |
| McRae and Galloway [162] | 14 | 1.4 | 1 |
| Kilit et al. [169] | 13 | 2.167 | 1.2 |
| Büthe et al. [57] | 13 | 2.167 | 1.2 |
| Chiminazzo et al. [134] | 12 | 3 | 3.529 |
| Munivrana et al. [155] | 11 | 1.571 | 0.775 |
| Sánchez-Alcaraz et al. [141] | 10 | 5 | 3.243 |
| Reno et al. [154] | 10 | 2 | 0.896 |
| Barreira et al. [135] | 10 | 1.667 | 0.923 |
| Carvalho et al. [164] | 10 | 1.25 | 0.625 |
| Rahmad et al. [97] | 9 | 3 | 1.721 |
| Sánchez-Alcaraz et al. [140] | 9 | 4.5 | 2.919 |
Publisher’s Note: MDPI stays neutral with regard to jurisdictional claims in published maps and institutional affiliations. |
© 2021 by the authors. Licensee MDPI, Basel, Switzerland. This article is an open access article distributed under the terms and conditions of the Creative Commons Attribution (CC BY) license (https://creativecommons.org/licenses/by/4.0/).
Share and Cite
Krizkova, S.; Tomaskova, H.; Tirkolaee, E.B. Sport Performance Analysis with a Focus on Racket Sports: A Review. Appl. Sci. 2021, 11, 9212. https://doi.org/10.3390/app11199212
Krizkova S, Tomaskova H, Tirkolaee EB. Sport Performance Analysis with a Focus on Racket Sports: A Review. Applied Sciences. 2021; 11(19):9212. https://doi.org/10.3390/app11199212
Chicago/Turabian StyleKrizkova, Sarka, Hana Tomaskova, and Erfan Babaee Tirkolaee. 2021. "Sport Performance Analysis with a Focus on Racket Sports: A Review" Applied Sciences 11, no. 19: 9212. https://doi.org/10.3390/app11199212
APA StyleKrizkova, S., Tomaskova, H., & Tirkolaee, E. B. (2021). Sport Performance Analysis with a Focus on Racket Sports: A Review. Applied Sciences, 11(19), 9212. https://doi.org/10.3390/app11199212