Article

Experimental Campaign to Verify the Suitability of Ultrasound Testing Method for Steel Fiber Reinforced Concrete Fortification Structures

1
Faculty of Military Technology, University of Defence, Kounicova 65, 602 00 Brno, Czech Republic
2
Faculty of Military Leadership, University of Defence, Kounicova 65, 602 00 Brno, Czech Republic
3
Faculty of Civil Engineering, Brno University of Technology, Veveří 331/95, 602 00 Brno, Czech Republic
*
Author to whom correspondence should be addressed.
Appl. Sci. 2021, 11(18), 8759; https://doi.org/10.3390/app11188759
Submission received: 30 August 2021 / Revised: 16 September 2021 / Accepted: 18 September 2021 / Published: 20 September 2021
(This article belongs to the Special Issue Non-Destructive Testing of Materials and Structures)

Abstract

:
Fortification structures, both military and civilian, are designed to resist a blast explosion to some extent. Their technical condition after a blast load must be assessed in a fast and reliable way to enable the users’ decision about the future use of the structure. Preferably, for the assessment of the protective structure, the non-destructive testing method should be used. To assess the suitability of ultrasound testing method for fortification structures built from steel fiber reinforced concrete, an investigation in a laboratory and in situ was conducted, together with numerical simulation and statistical evaluation. The numerical simulation of the blast load of a steel fiber reinforced concrete slab was conducted using multiphysics simulation software with the aim to verify basic parameters of the field experiment. During the field tests, several slabs were loaded by plastic explosive and changes in the structure of the slabs, before and after the blast load, were examined using the ultrasound pass-through method. After the field tests, the slabs were subjected to a destructive laboratory test to determine their residual strength. Subsequently, the data sets obtained from the measurements were tested using functional data analysis. The results from the ultrasound pulse method show that specimens after a dynamic blast load can in some cases increase the strength of their cement matrix.

1. Introduction

The change in the safety environment is an increasingly topical issue of design and construction of structures that would be able to withstand not only permanent and variable load but especially accidental action, which acts briefly. Their value is significant [1,2], particularly the ability to withstand loads such as t military fortifications and defense infrastructure. At the same time, it can be stated that, due to the current threats, it is possible to extend the term of fortification structures not only to the military area of force protection, but also to the area of civil defense. Buildings with parameters of fortification structures belong not only to the group of military defense infrastructure, but also to a group of critical public infrastructure.
For military fortifications, the issue of reusability of structures while maintaining their protective properties is also hugely important. The assessment of the condition of critical infrastructure usually does not take into account repeated blast load, as this kind of load is considered rare. For these reasons, design evaluation methods are based on a combination of non-destructive and semi-destructive methods [3]. However, if it is assumed, in the case of military fortifications, that their further availability can sustain repeated load, it is not possible to disrupt the integrity of the envelope of the structure, for example, by a core bore. Because of these reasons, a method of evaluating the condition of these structures using a combination of non-destructive methods that could be used in situ was sought [4,5].
This article follows up on the study [5] which documents the preparatory phase of experimental measurement. It describes the material batch A2, which consists of rectangular thin slabs with dimensions of 700 × 700 × 60 mm and made of SFRC (steel fiber reinforced concrete). The mixture and mechanical properties of the testing specimens were also published in [5]. Six specimens (A2_1 to A2_6) were produced in this batch. Three specimens (A2_1 to A2_3) were taken to the military training area and loaded with a blast, and specimens A2_3 to A2_6 were tested in a laboratory. This article describes a field experiment of blast load of test specimens made of SFRC. The SFRC is a material with a high-energy absorption capacity and high toughness due to its high ductility. Understanding of the behavior of SFRC for blast loads is crucial for finding a method suitable for evaluating the condition of fortification structures subjected to a blast load.
The dispersed reinforcement in the form of fibers significantly affects the working diagram of the material in compression but especially in tension. As a result, the SFRC differs qualitatively from plain concrete, as it achieves higher strengths and it is characterized by higher toughness. Thanks to these material properties, the SFRC is very resistant to shocks, and therefore is used in dynamically loaded structures. The toughness and associated properties of SFRC are based on the fracture process of the composite material during loading, during which the fibers are pulled out and torn at the same time as the number and width of cracks in the brittle matrix increase. The even distribution of the fibers leads to the effect of their spatial action in the structure of the composite and to the stiffening of its entire structure [6,7].

2. Numerical Simulation of Experimental Measurements

Before the experimental measurement itself, a numerical simulation of the slab load in the LS-DYNA software environment was performed at the Department of Engineering Technologies. The simulation tied the experimental layout in all essential aspects of the experiment, i.e., the dimensions of the slabs, their static scheme and the material composition of individual specimens. The computational model was as follows: a concrete slab specimen (Figure 1) is freely laid on the rectangular frame support with rectangular inner hole (Figure 2). A blast loading from the specified distance (Figure 3) caused structural damage to the specimen (Figure 4). The aim of the simulation was the first assessment of the amount of explosive needed for the experiment so that cracks would develop in a substantial part of the slabs from explosion loading and which could be subsequently assessed by NDT methods.

2.1. Computational Model

As mentioned above, the simulation was performed in LS-Dyna, which was developed as an explicit numerical analysis code and has since been widely used to solve high strain-rate problems or dynamic and impulsive problems with its advanced Eulerian, Lagrangian and Arbitrary Lagrangian-Eulerian (ALE) solvers [8]. The setup of the simulations follows the steps and recommendations from [8,9,10,11,12,13,14], while using values of input parameters from previous works of the authors [5].
From the CAD model of the slab with dimensions of 700 × 700 × 60 mm, a mesh of finite elements was generated. The Solid type hexahedron elements with an edge length of 2.5 mm were used to discretize the model (Figure 1), [10].
The idealized discretized model of the supporting frame was created from the Shell type elements of Rigid material with a size of 2.5 mm without degrees of freedom (Figure 1), [10]. To simplify the boundary conditions, it was assumed that the friction between the surfaces of the test slab and the supporting frame did not allow the slab to move or rotate horizontally during the pressure wave load.
Mat_Winfrith_Concrete was chosen as the material model of the concrete. This nonlinear material model is intended for modeling plain and reinforced concrete [11,12,13]. The influence of the deformation rate on the mechanical-physical properties of concrete is covered in the Mat_Winfirth_Concrete material model via dynamic coefficients of material parameters, which change the basic material parameters of concrete acquired from quasi-static tests. As described in [12], this option can be activated on the material model card by setting rate = 0.0 (Table 1).
When modeling the reinforcement of the slabs of batches A2, explicit modeling of the fiber reinforcement (Table 2, Figure 2) was used. Interaction of the reinforcement with concrete mesh was controlled by the Constrain_Beam_In_Solid card.
Table 1 describes the Winfrith material model of concrete with cubic compressive strength ucs = 69.7 MPa, tensile strength uts = 5.9 MPa, density ro = 2365 kg·m−3, maximum aggregate size asize = 5 mm, fracture energy fe = 500 J·m−2 with strain rate effects turned on (rate = 0.0).
Table 2 describes the material properties of the steel fiber reinforcement, where den-sity ro = 7860 kg·m−3, Young’s modulus e = 203 GPa, Poisson’s ratio pr = 0.3, yield stress sigy = 950 MPa and tangent modulus etan = 3 GPa. The fibers were generated according to specification of the batch A_2. An idealized model of the reinforcement as 60 mm long steel fibers of the quantity of 60 kg·m−3 of the concrete mix was generated. The fibers in the computational model were generated in a way, where the concrete mesh completely encapsulated the fibers, the fibers were uniformly distributed in the concrete mix, and there was no preferential orientation of the fibers.
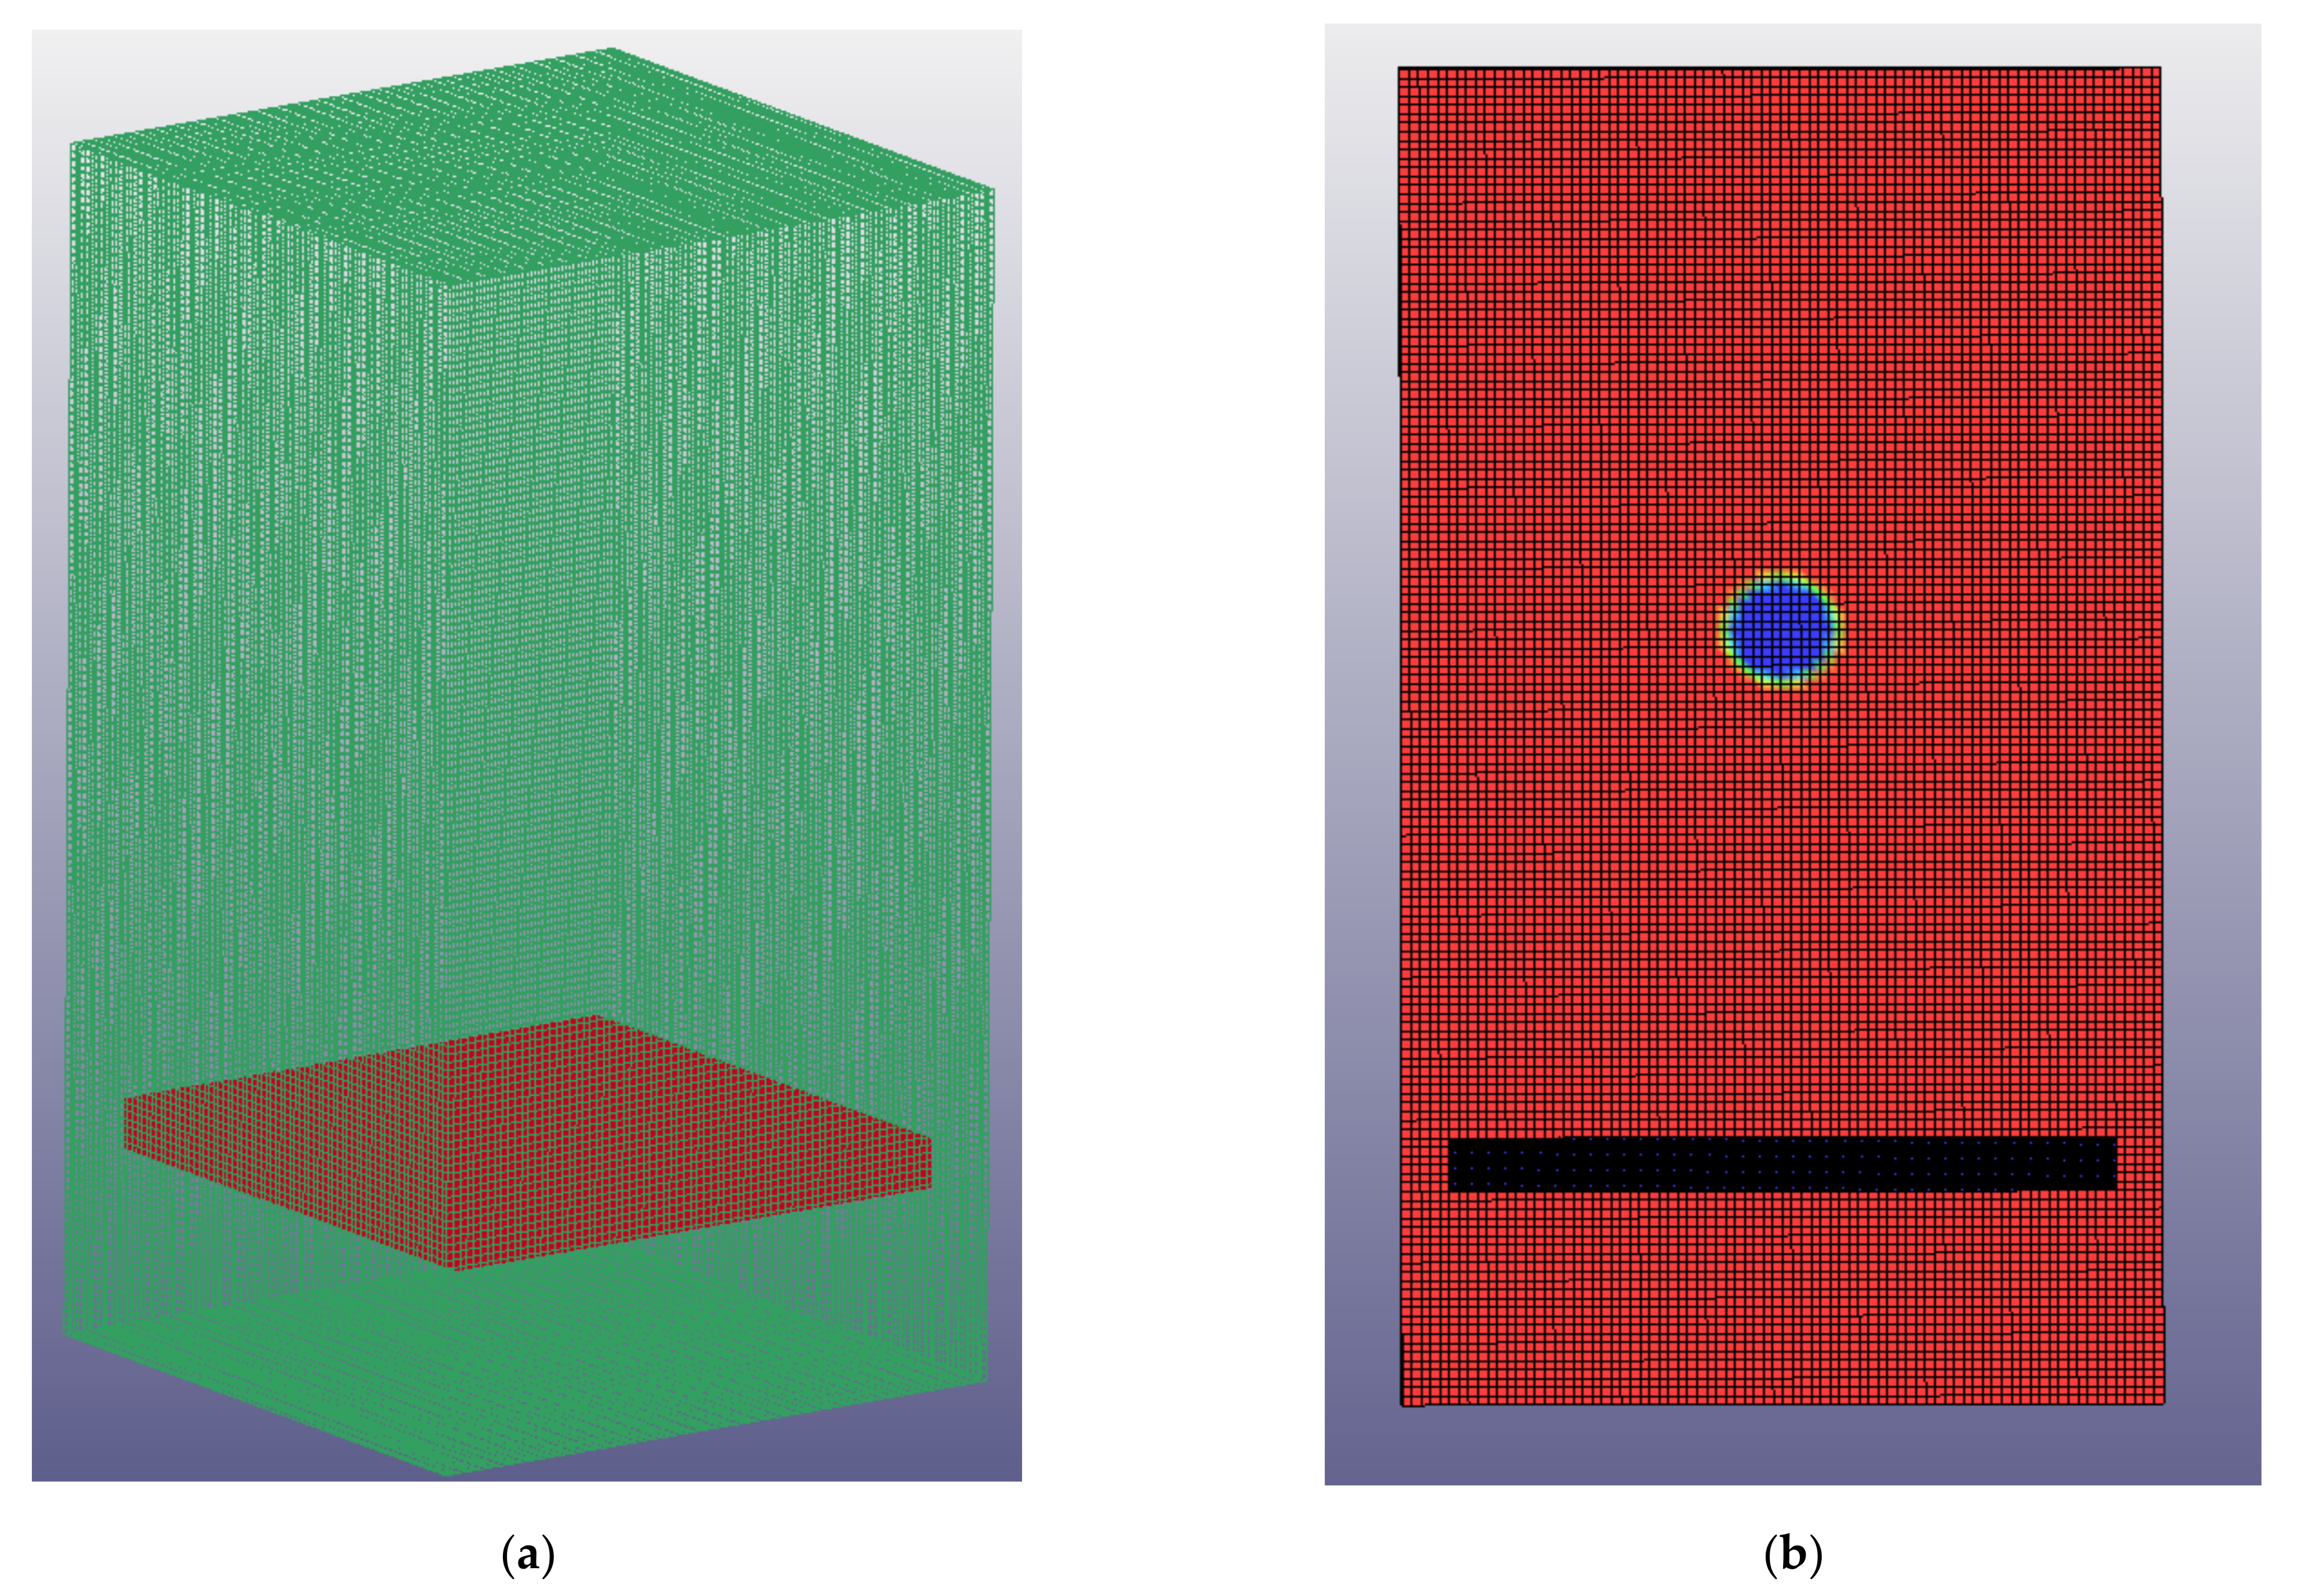
To simulate the explosion itself, an approach of explicit air and explosive modeling was used together with the usage of multi-material ALE formulation of elements with the assignment of appropriate equations of state (EOS) to the materials and a combustion model controlling the detonation behavior. In the initialization phase, the entire ALE network was filled with air (EOS_Linear_Polynomial, Mat_Null), (Figure 3), [14]. Next, the volume part of the spherical elements was filled with explosive (EOS_Wilkinson_Lee, Mat_High_Explosive_Burn), (Figure 3), [10]. The center of the sphere at a distance of 600 mm was equal to the height of the specimen located on the upper part of the stand. The interaction between a solid structure representing a concrete element defined by Lagrange-type elements and the ALE network was specified using the Constrain_Lagrange_In_Solid card [10]. The calculation time of the simulation was set to 3.5 ms.

2.2. Simulation Results

A parametric simulation was performed for a slab of the batch A2. The only changing input parameter in this simulation was the amount of explosives. Due to the objectives of the work, the development of cracks in the slab, caused by the loading from the explosion, was set as the output parameter. Table 3 shows the result of the simulations, i.e., the amount of TNT sufficient to damage the slab (Figure 4). Based on these results, an experimental measurement during the field tests could have been subsequently performed.

3. Experiment Setup

Based on the determination of the amount of explosives using mathematical simulation, a plan of testing was proposed, as shown in Table 4.
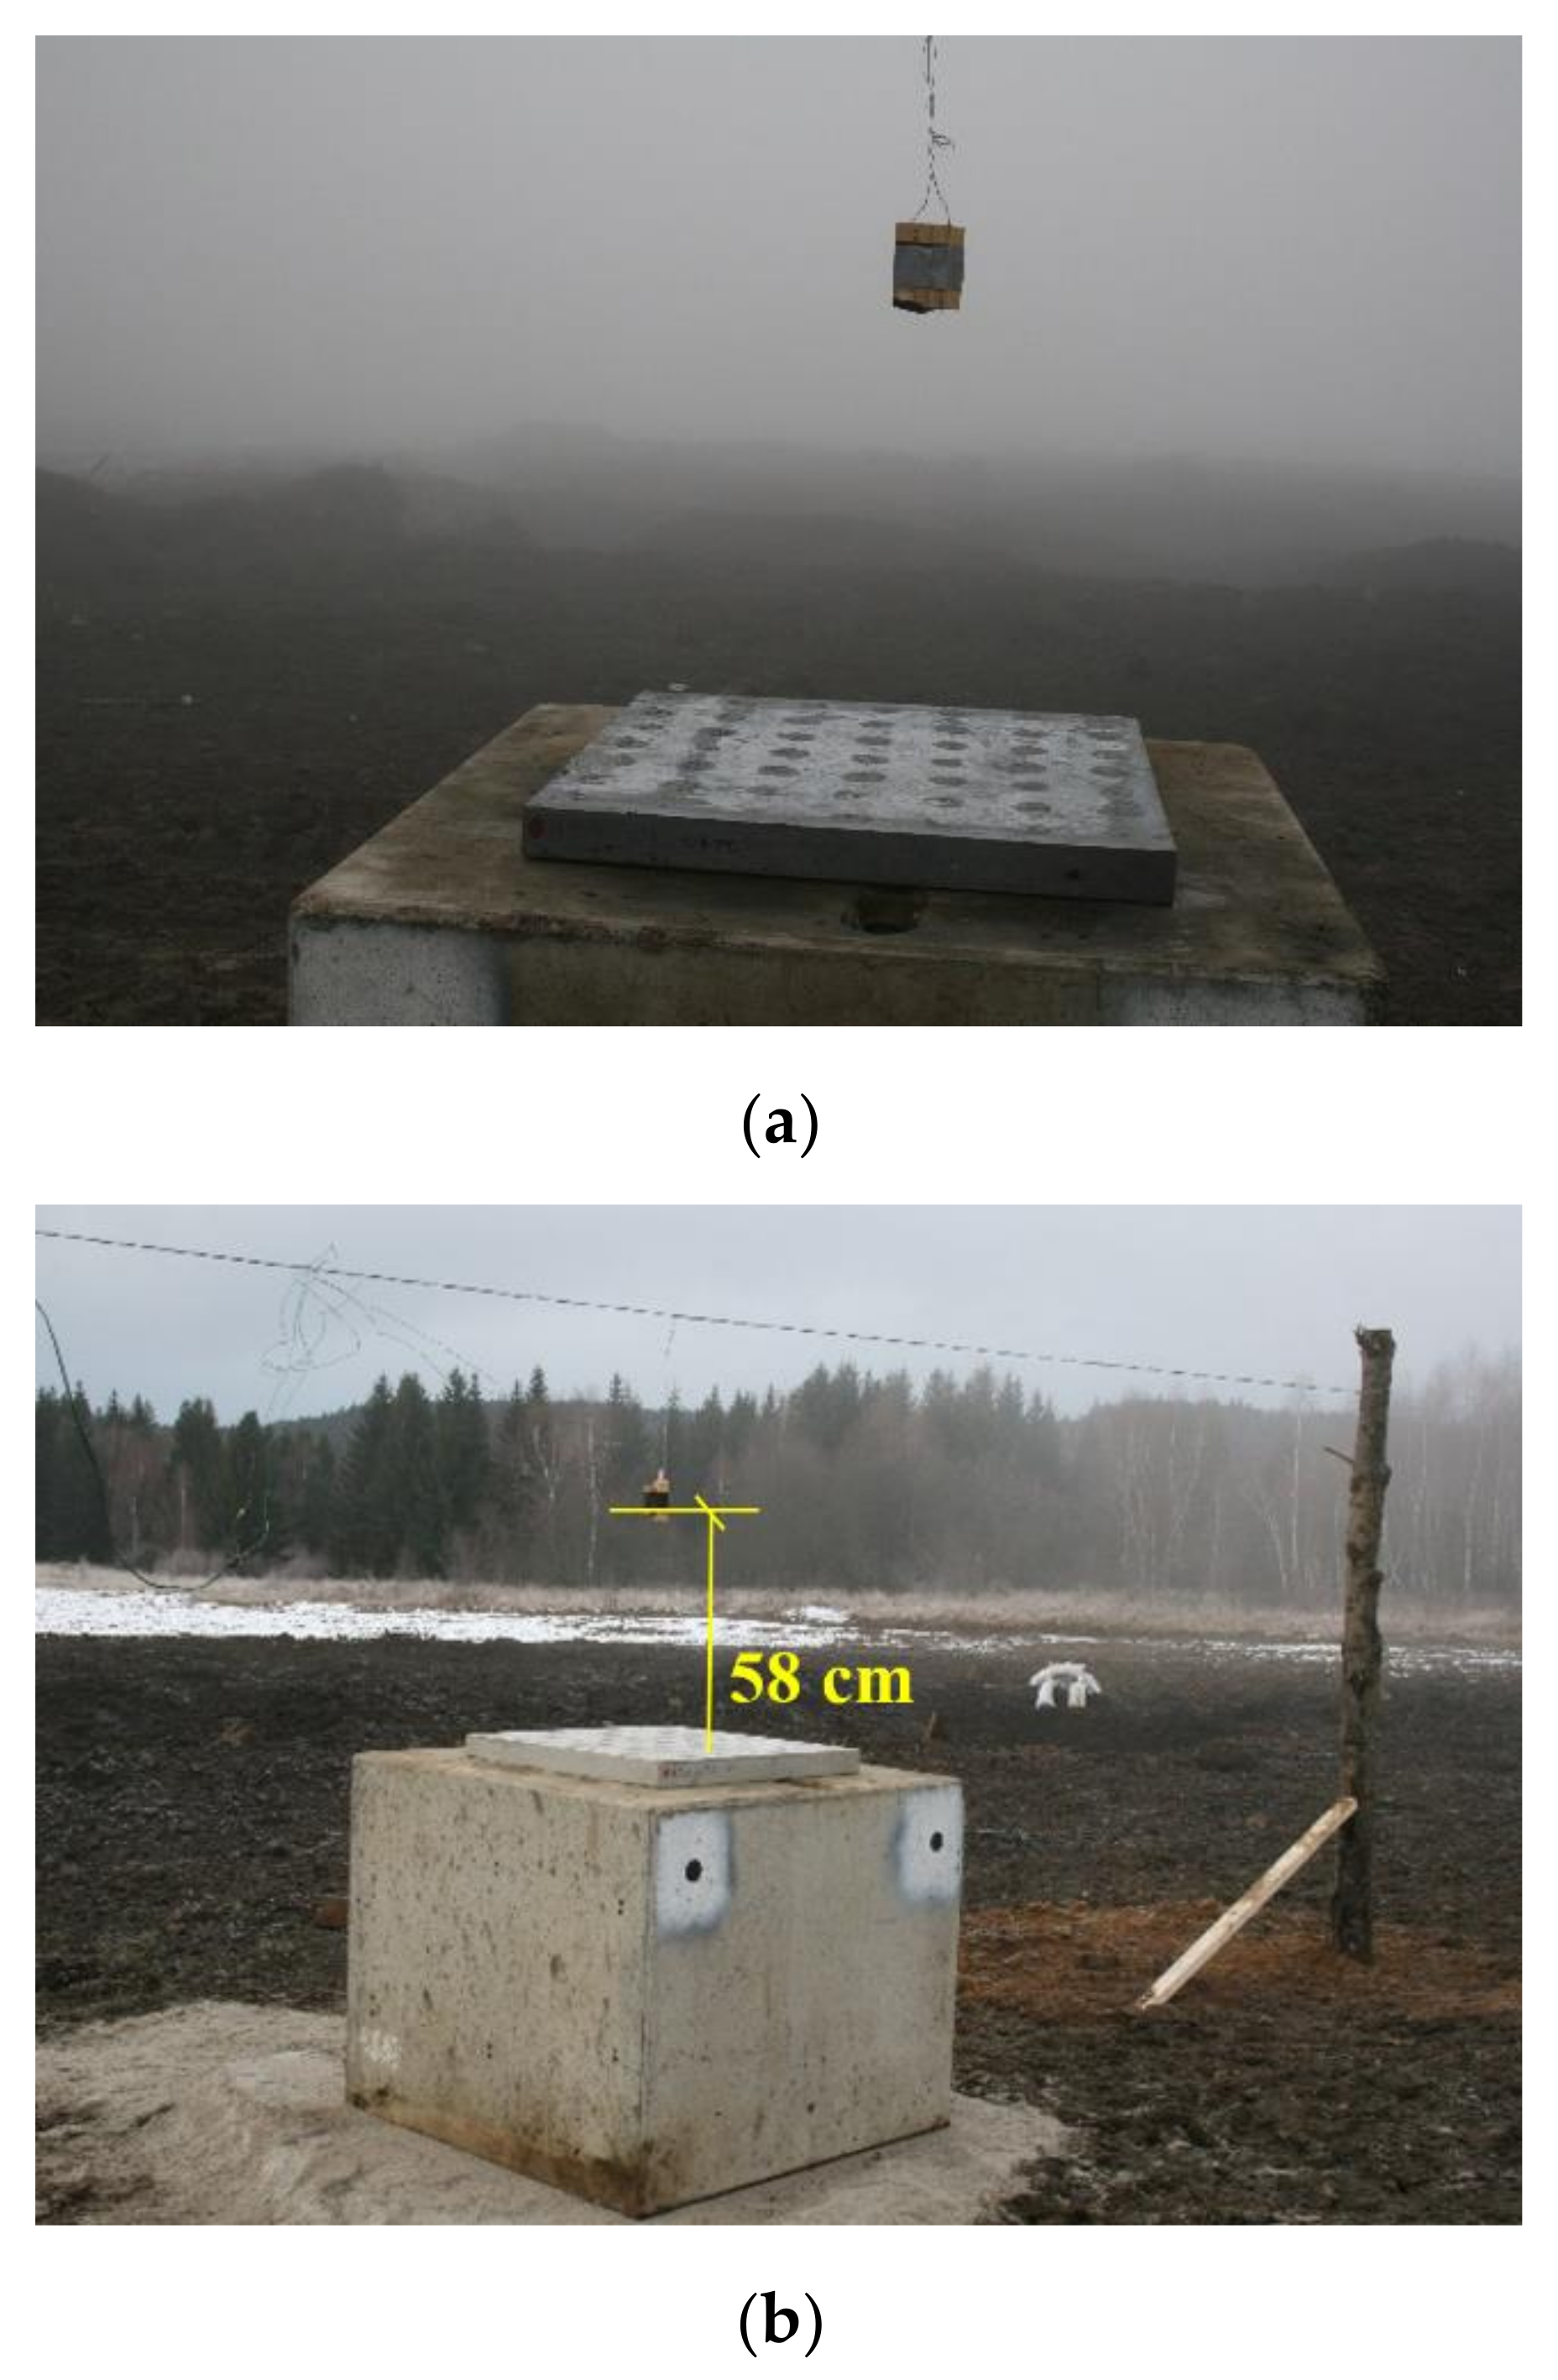
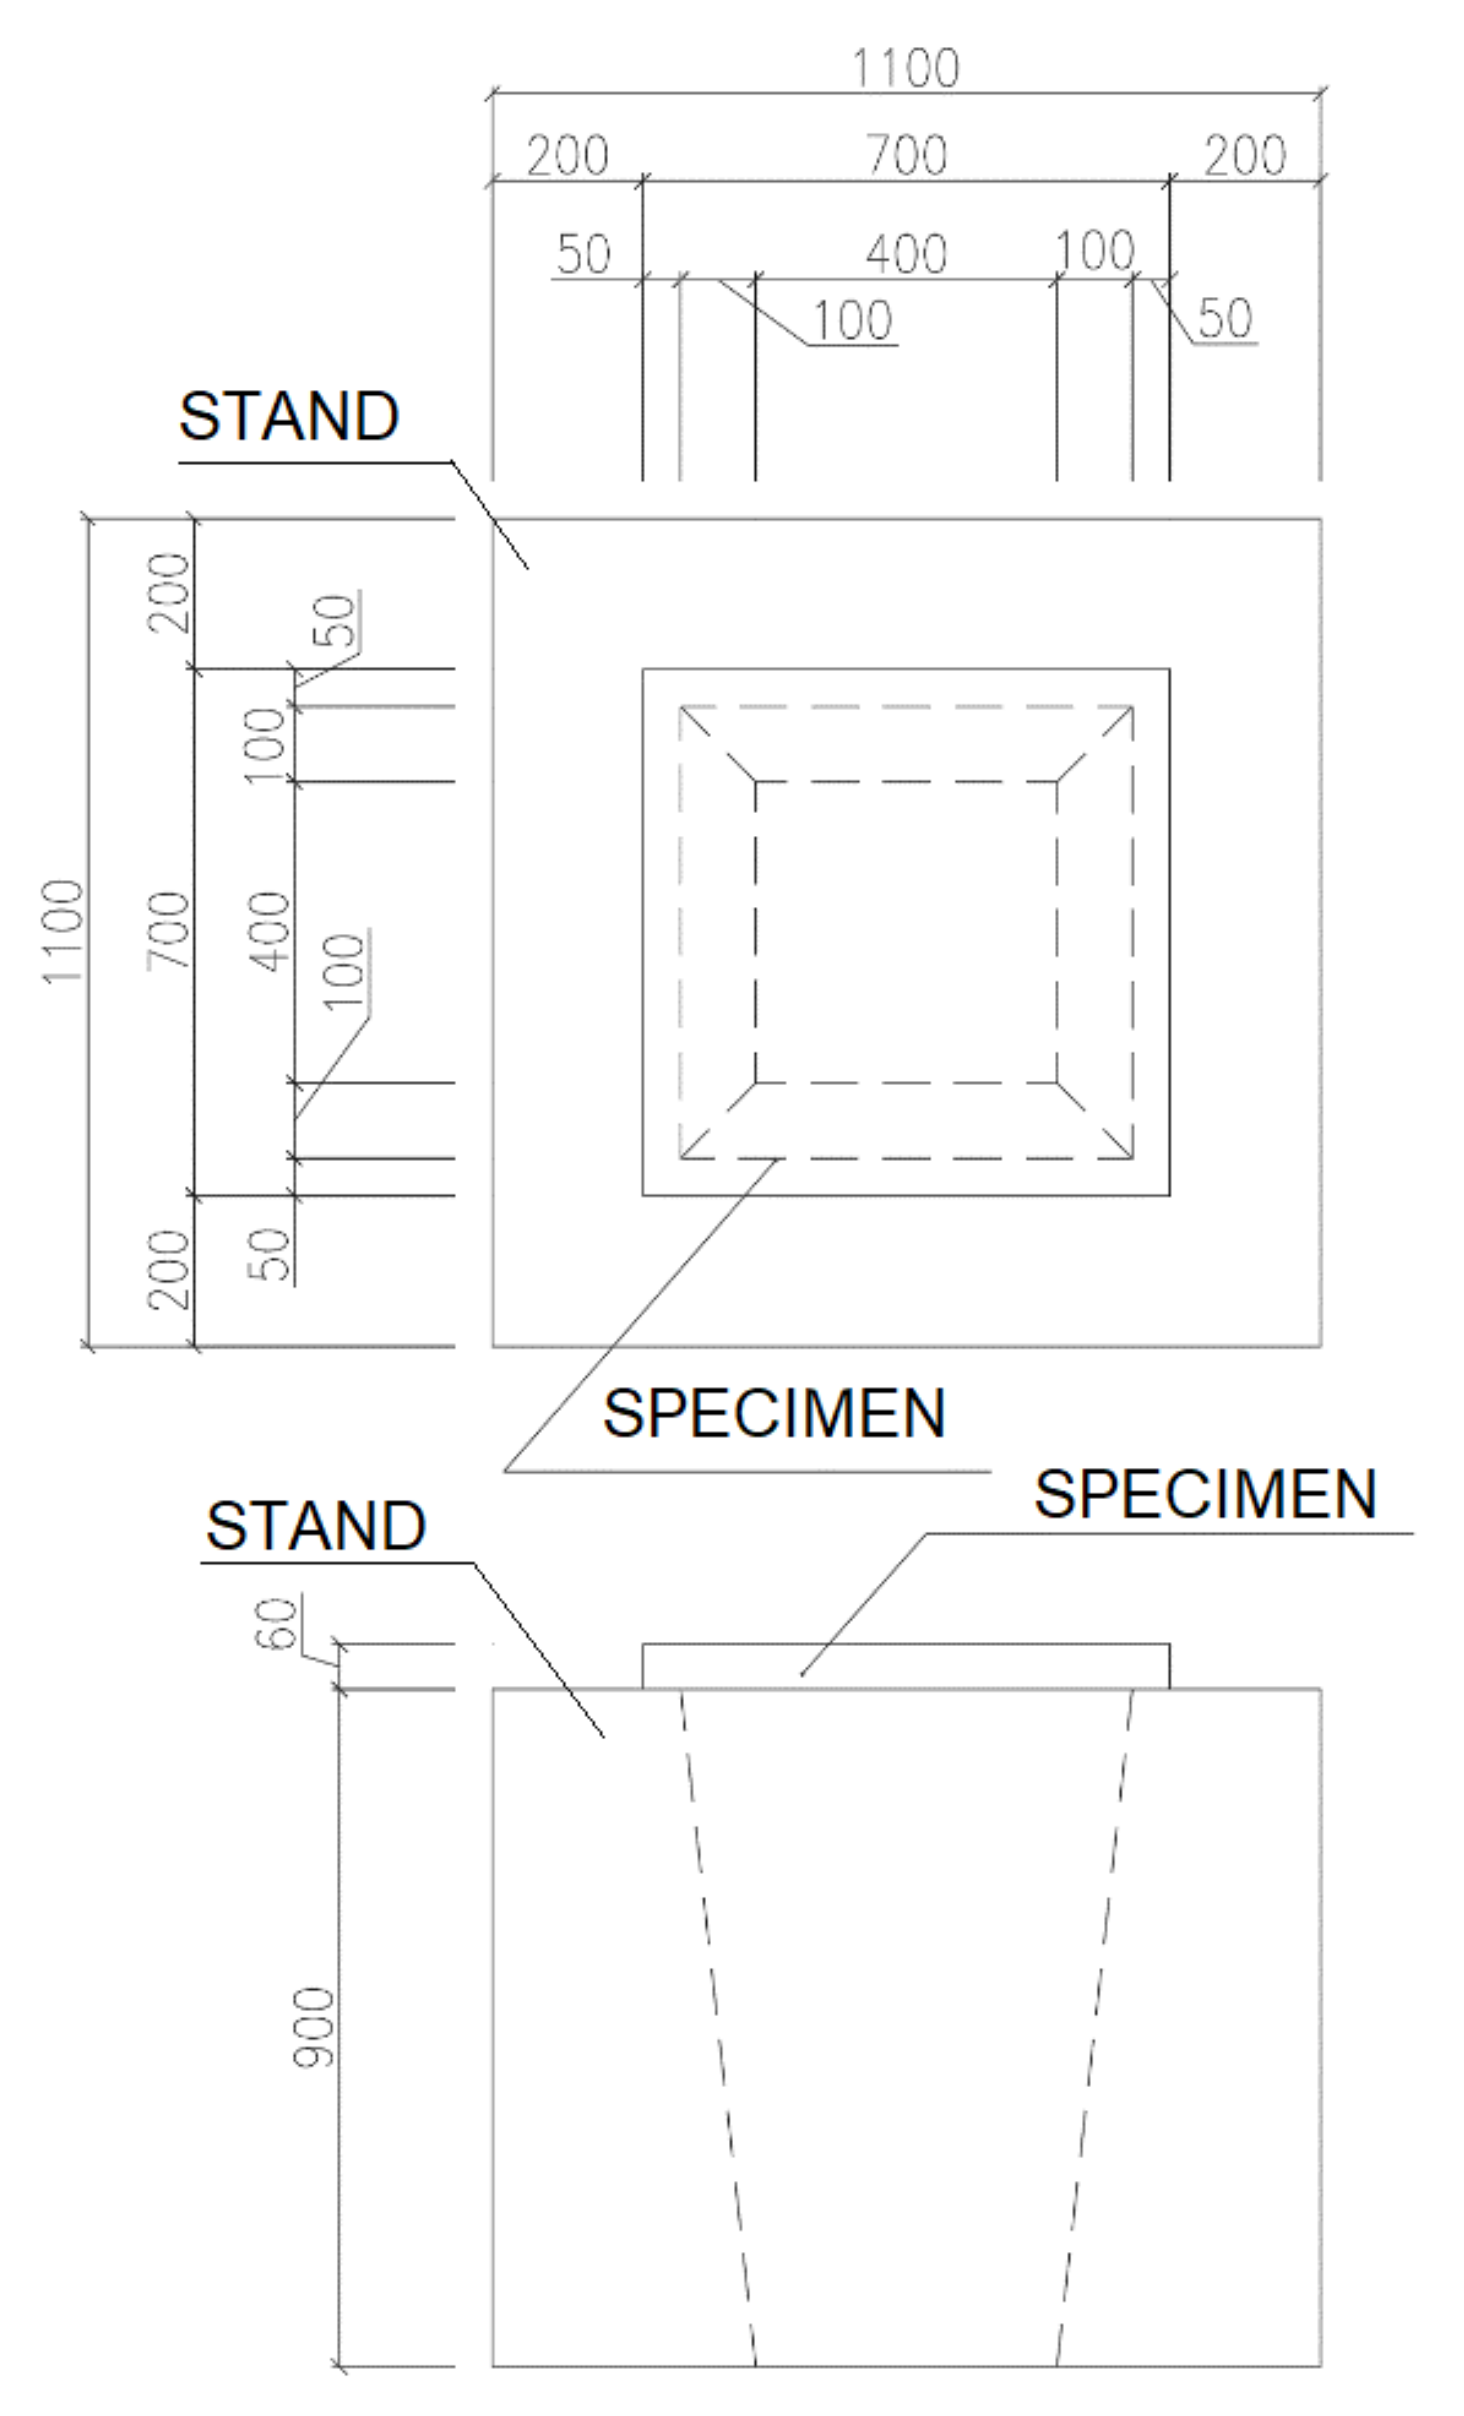
To simulate the load of the structure by the blast, an improvised stand was chosen. It simulated the behavior of the specimen in the real structure so that the slab was supported along the entire circumference and the explosive was suspended above the specimen at a height of 560–580 mm (Figure 5). The stand was made from a precast foundation block (Figure 6).

4. Verification of Changes in Material Properties of Loaded Specimens by Ultrasound Direct Pass Method

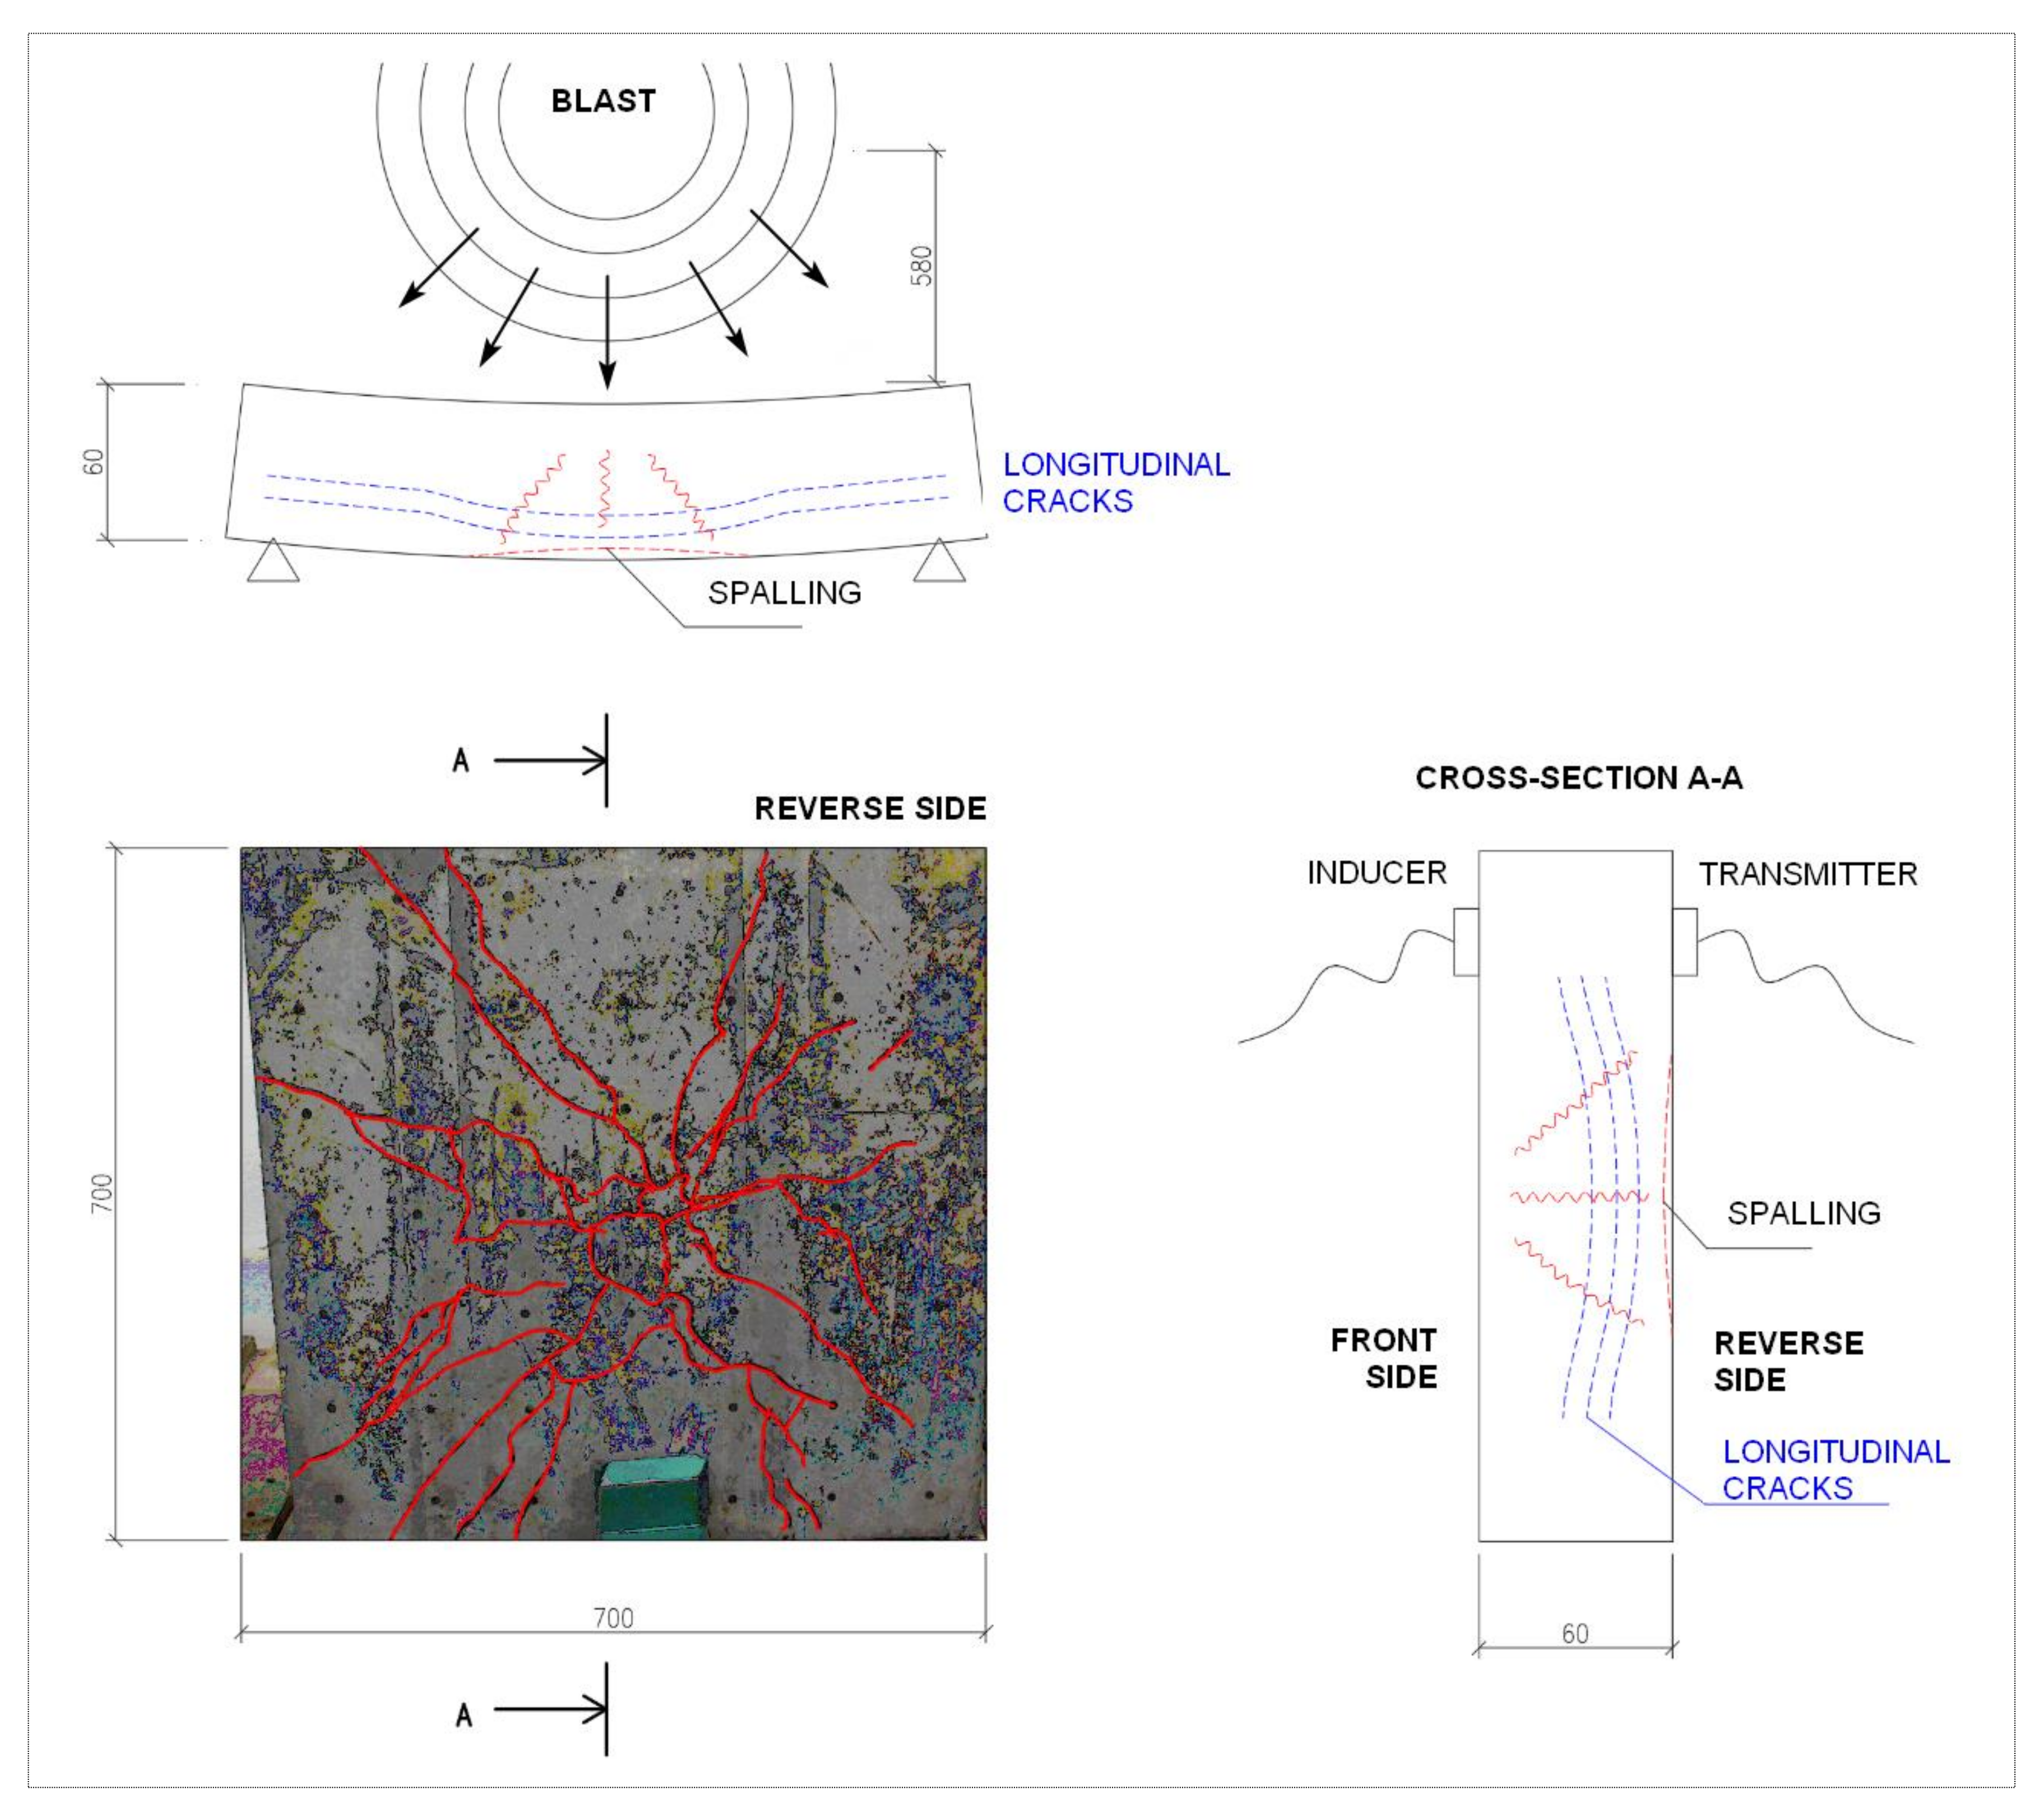
To determine the changes between the condition of the specimens before and after the blast load, an ultrasound pass-through method was used. A prerequisite for the use of this method was the fact that longitudinal cracks would develop after the blast load. When ultrasound waves pass through the concrete-air interface, the velocity of passage through the specimen is reduced (Figure 7). For the sake of clarity, only the differences in measured velocities of passage of the ultrasound waves through the specimens, before and after blast load, are shown.

4.1. Specimen A2_1 Made from SFRC

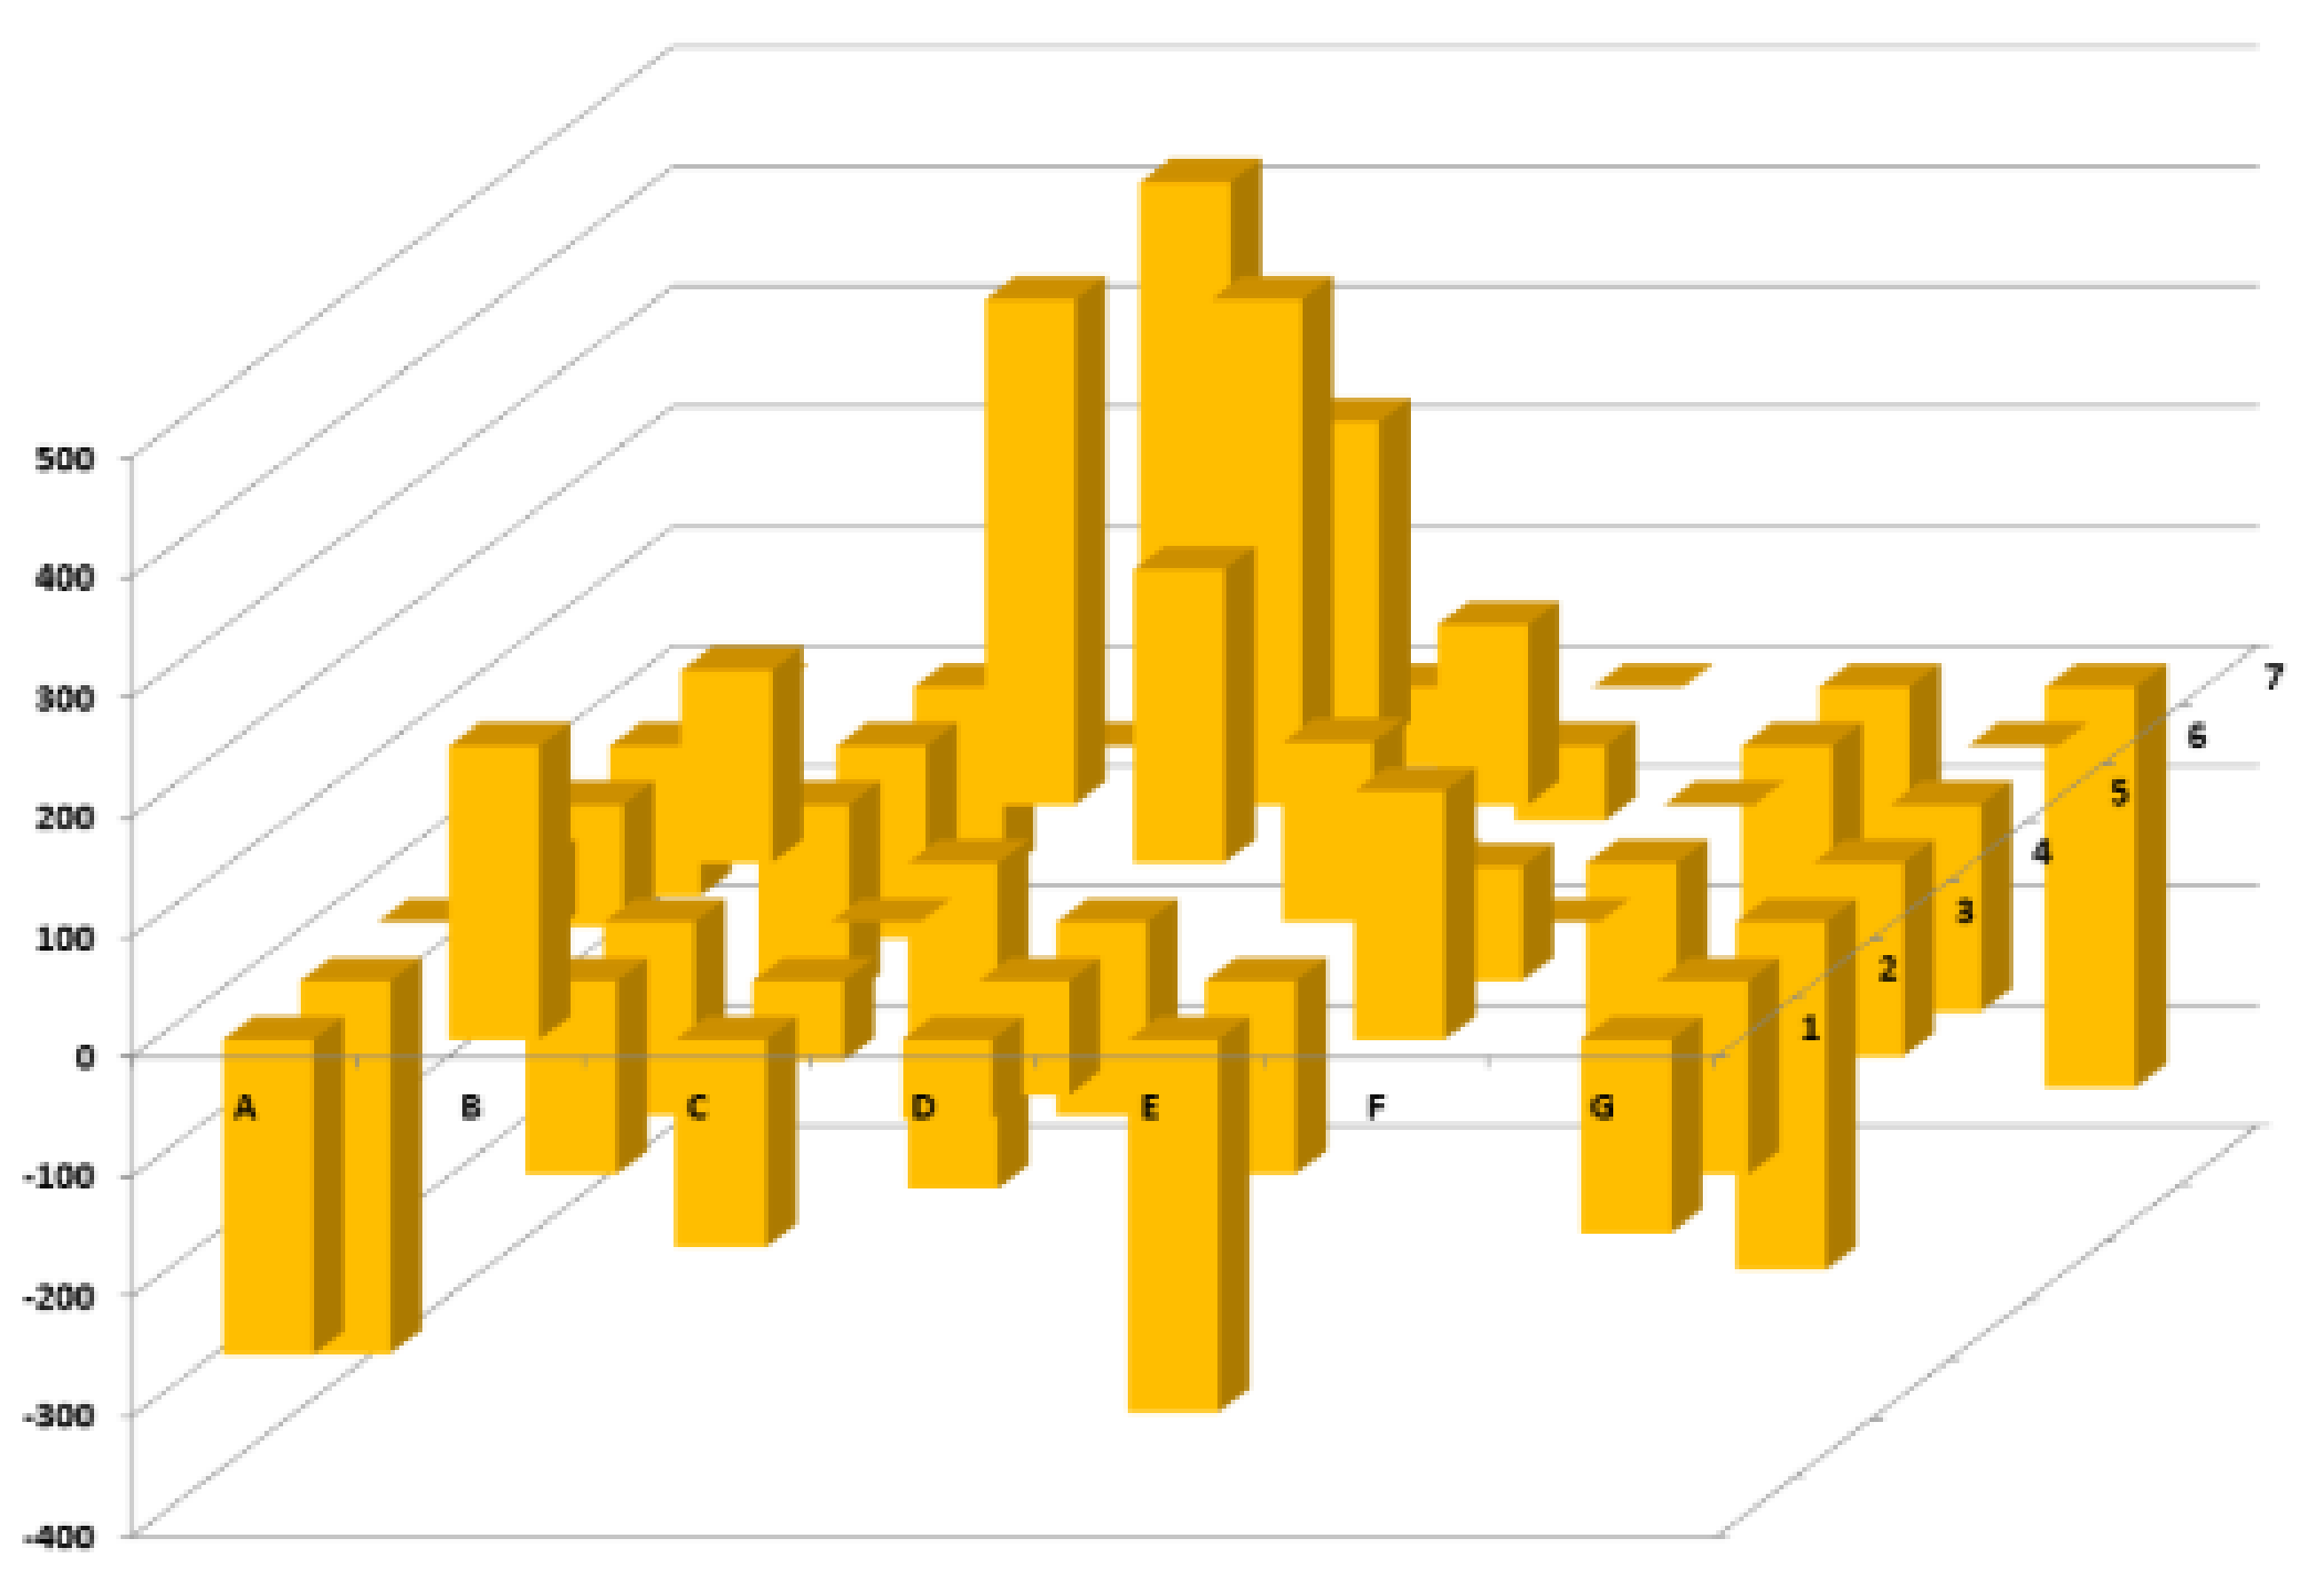
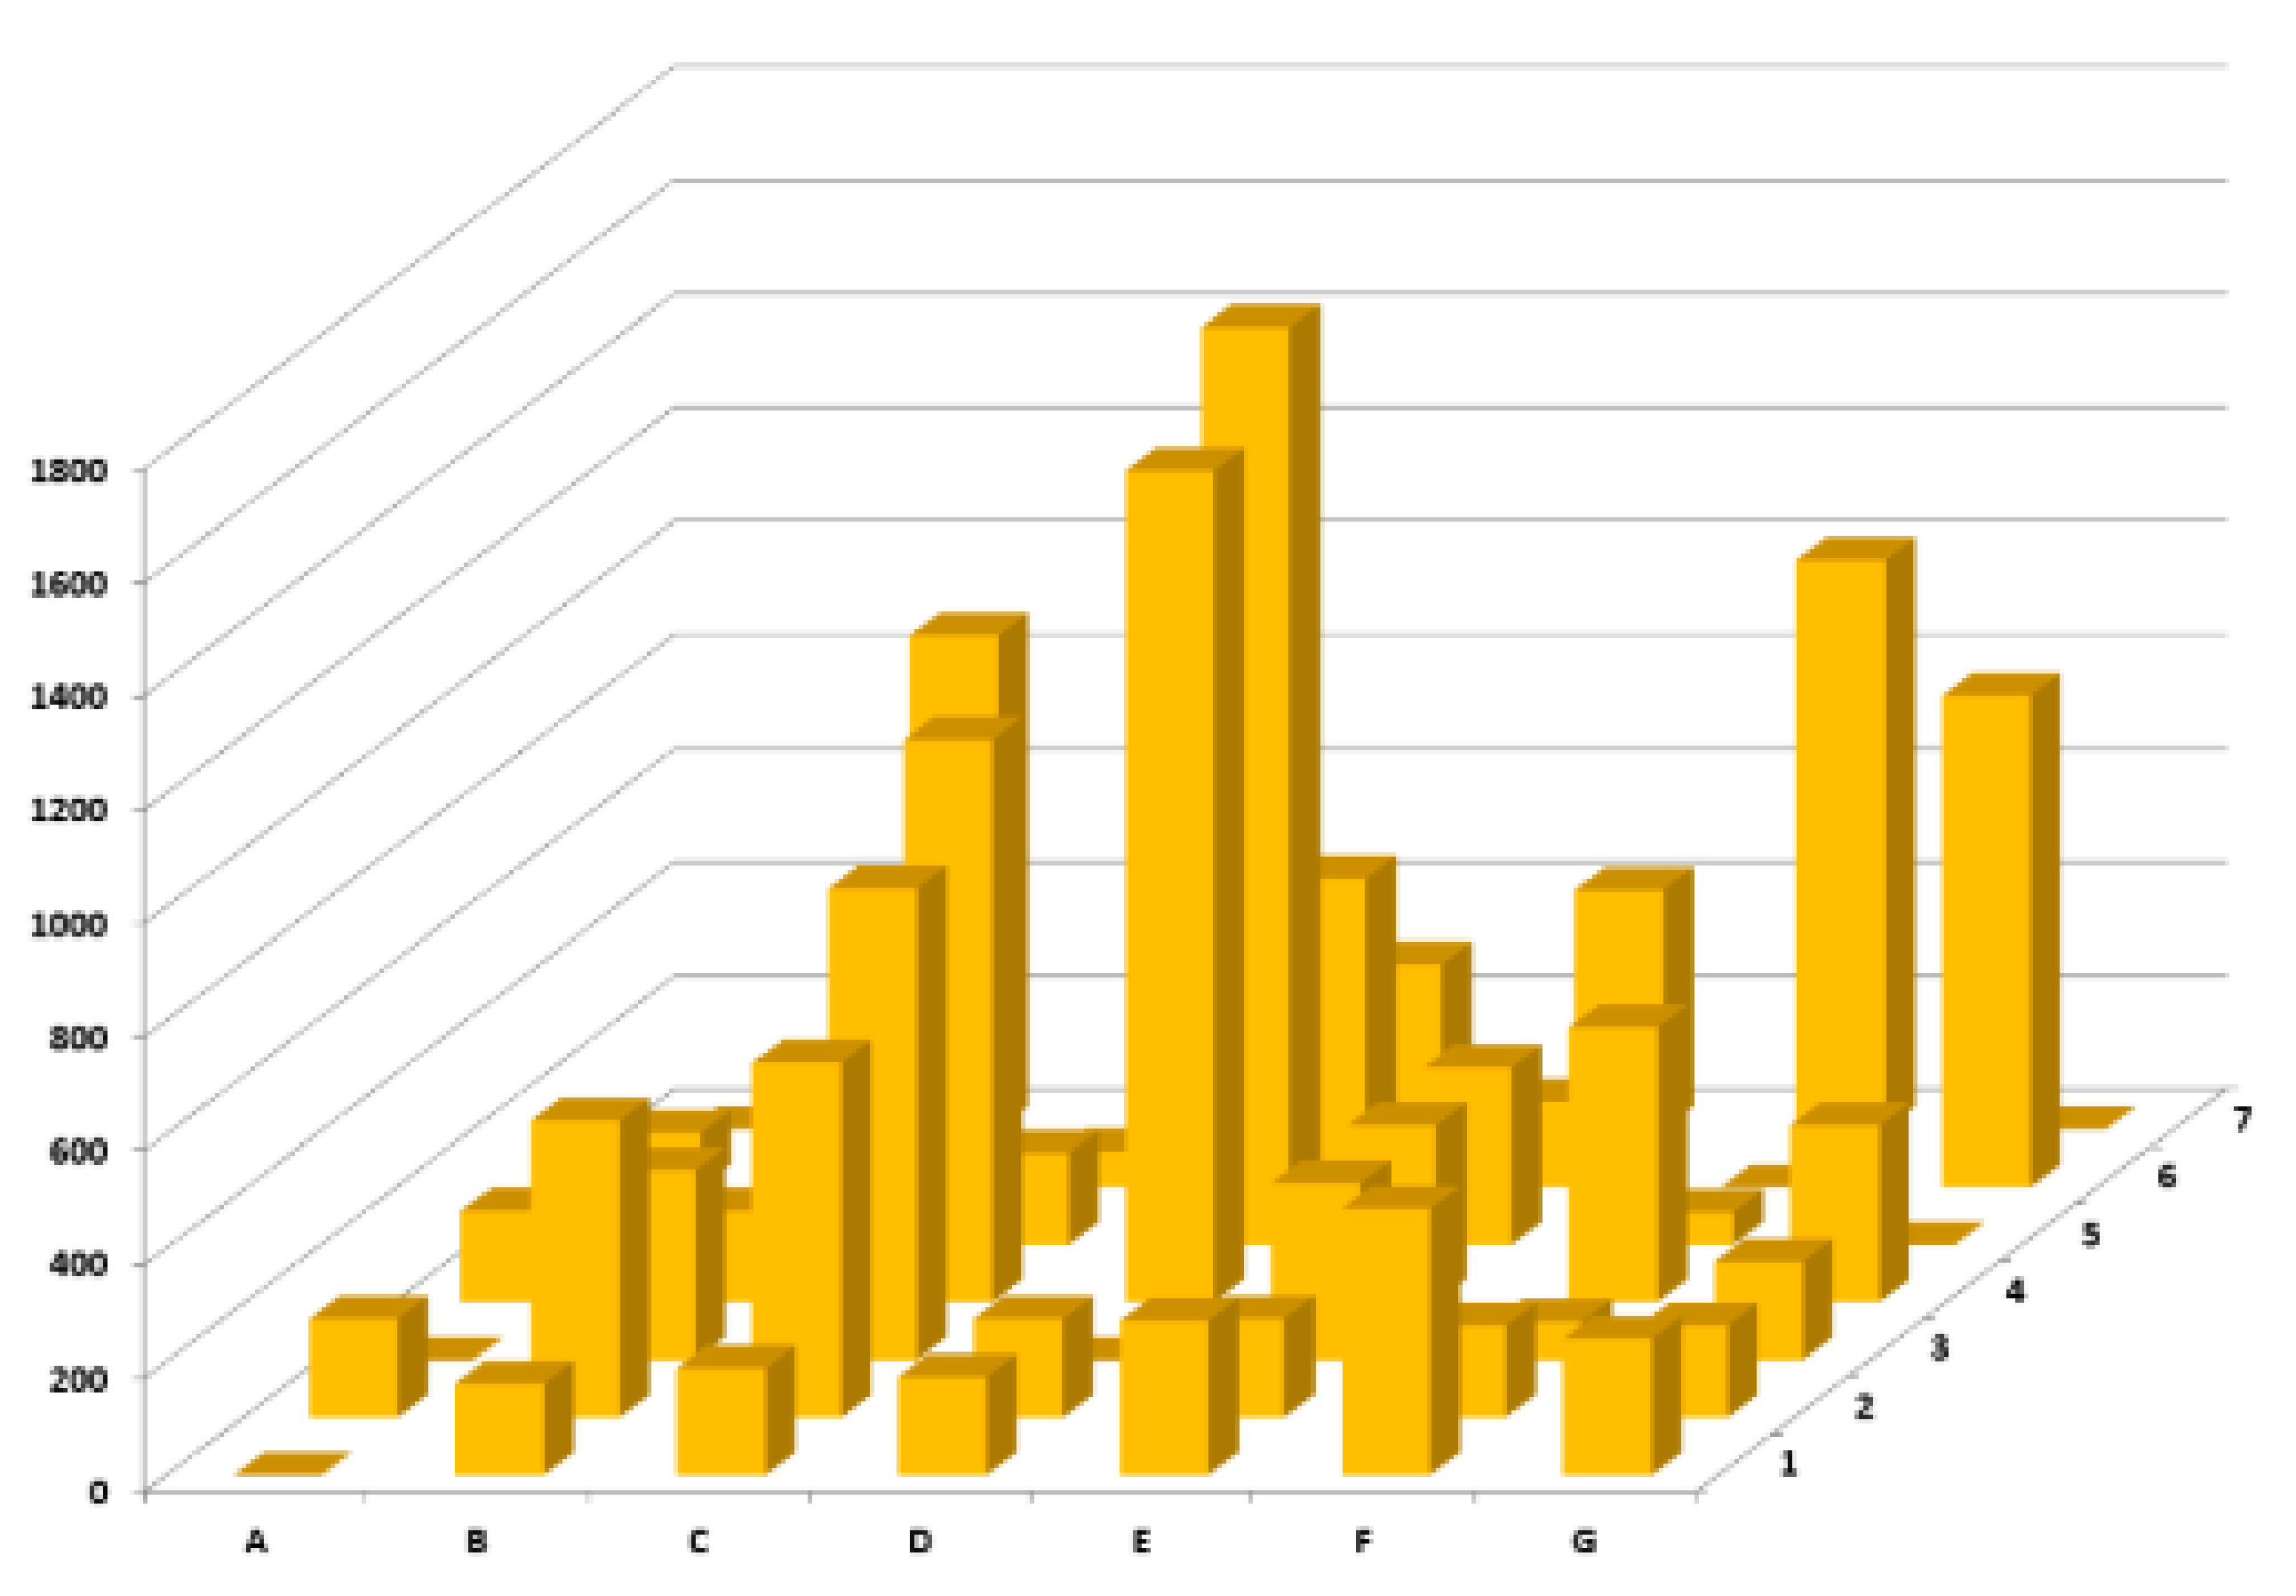
The graph of differences in measured velocities [m·s−1] of ultrasound waves for specimen A2_1 before and after blast load of 475 g TNT is shown in Figure 8. It can be seen from the graph that negative values were measured (when the passage of the ultrasound waves accelerated through the specimen), but the number and distribution of these values is better seen in Figure 9. The number of points where the acceleration of the passage of ultrasound waves through the material was measured, compared to the expected deceleration, and was 52.9% of all measured points. Figure 9 shows the reverse side of the specimen with visible transverse cracks oriented from the center to the corners of the specimen, which is characteristic for a fast dynamic load.

4.2. Specimen A2_2 Made from SFRC

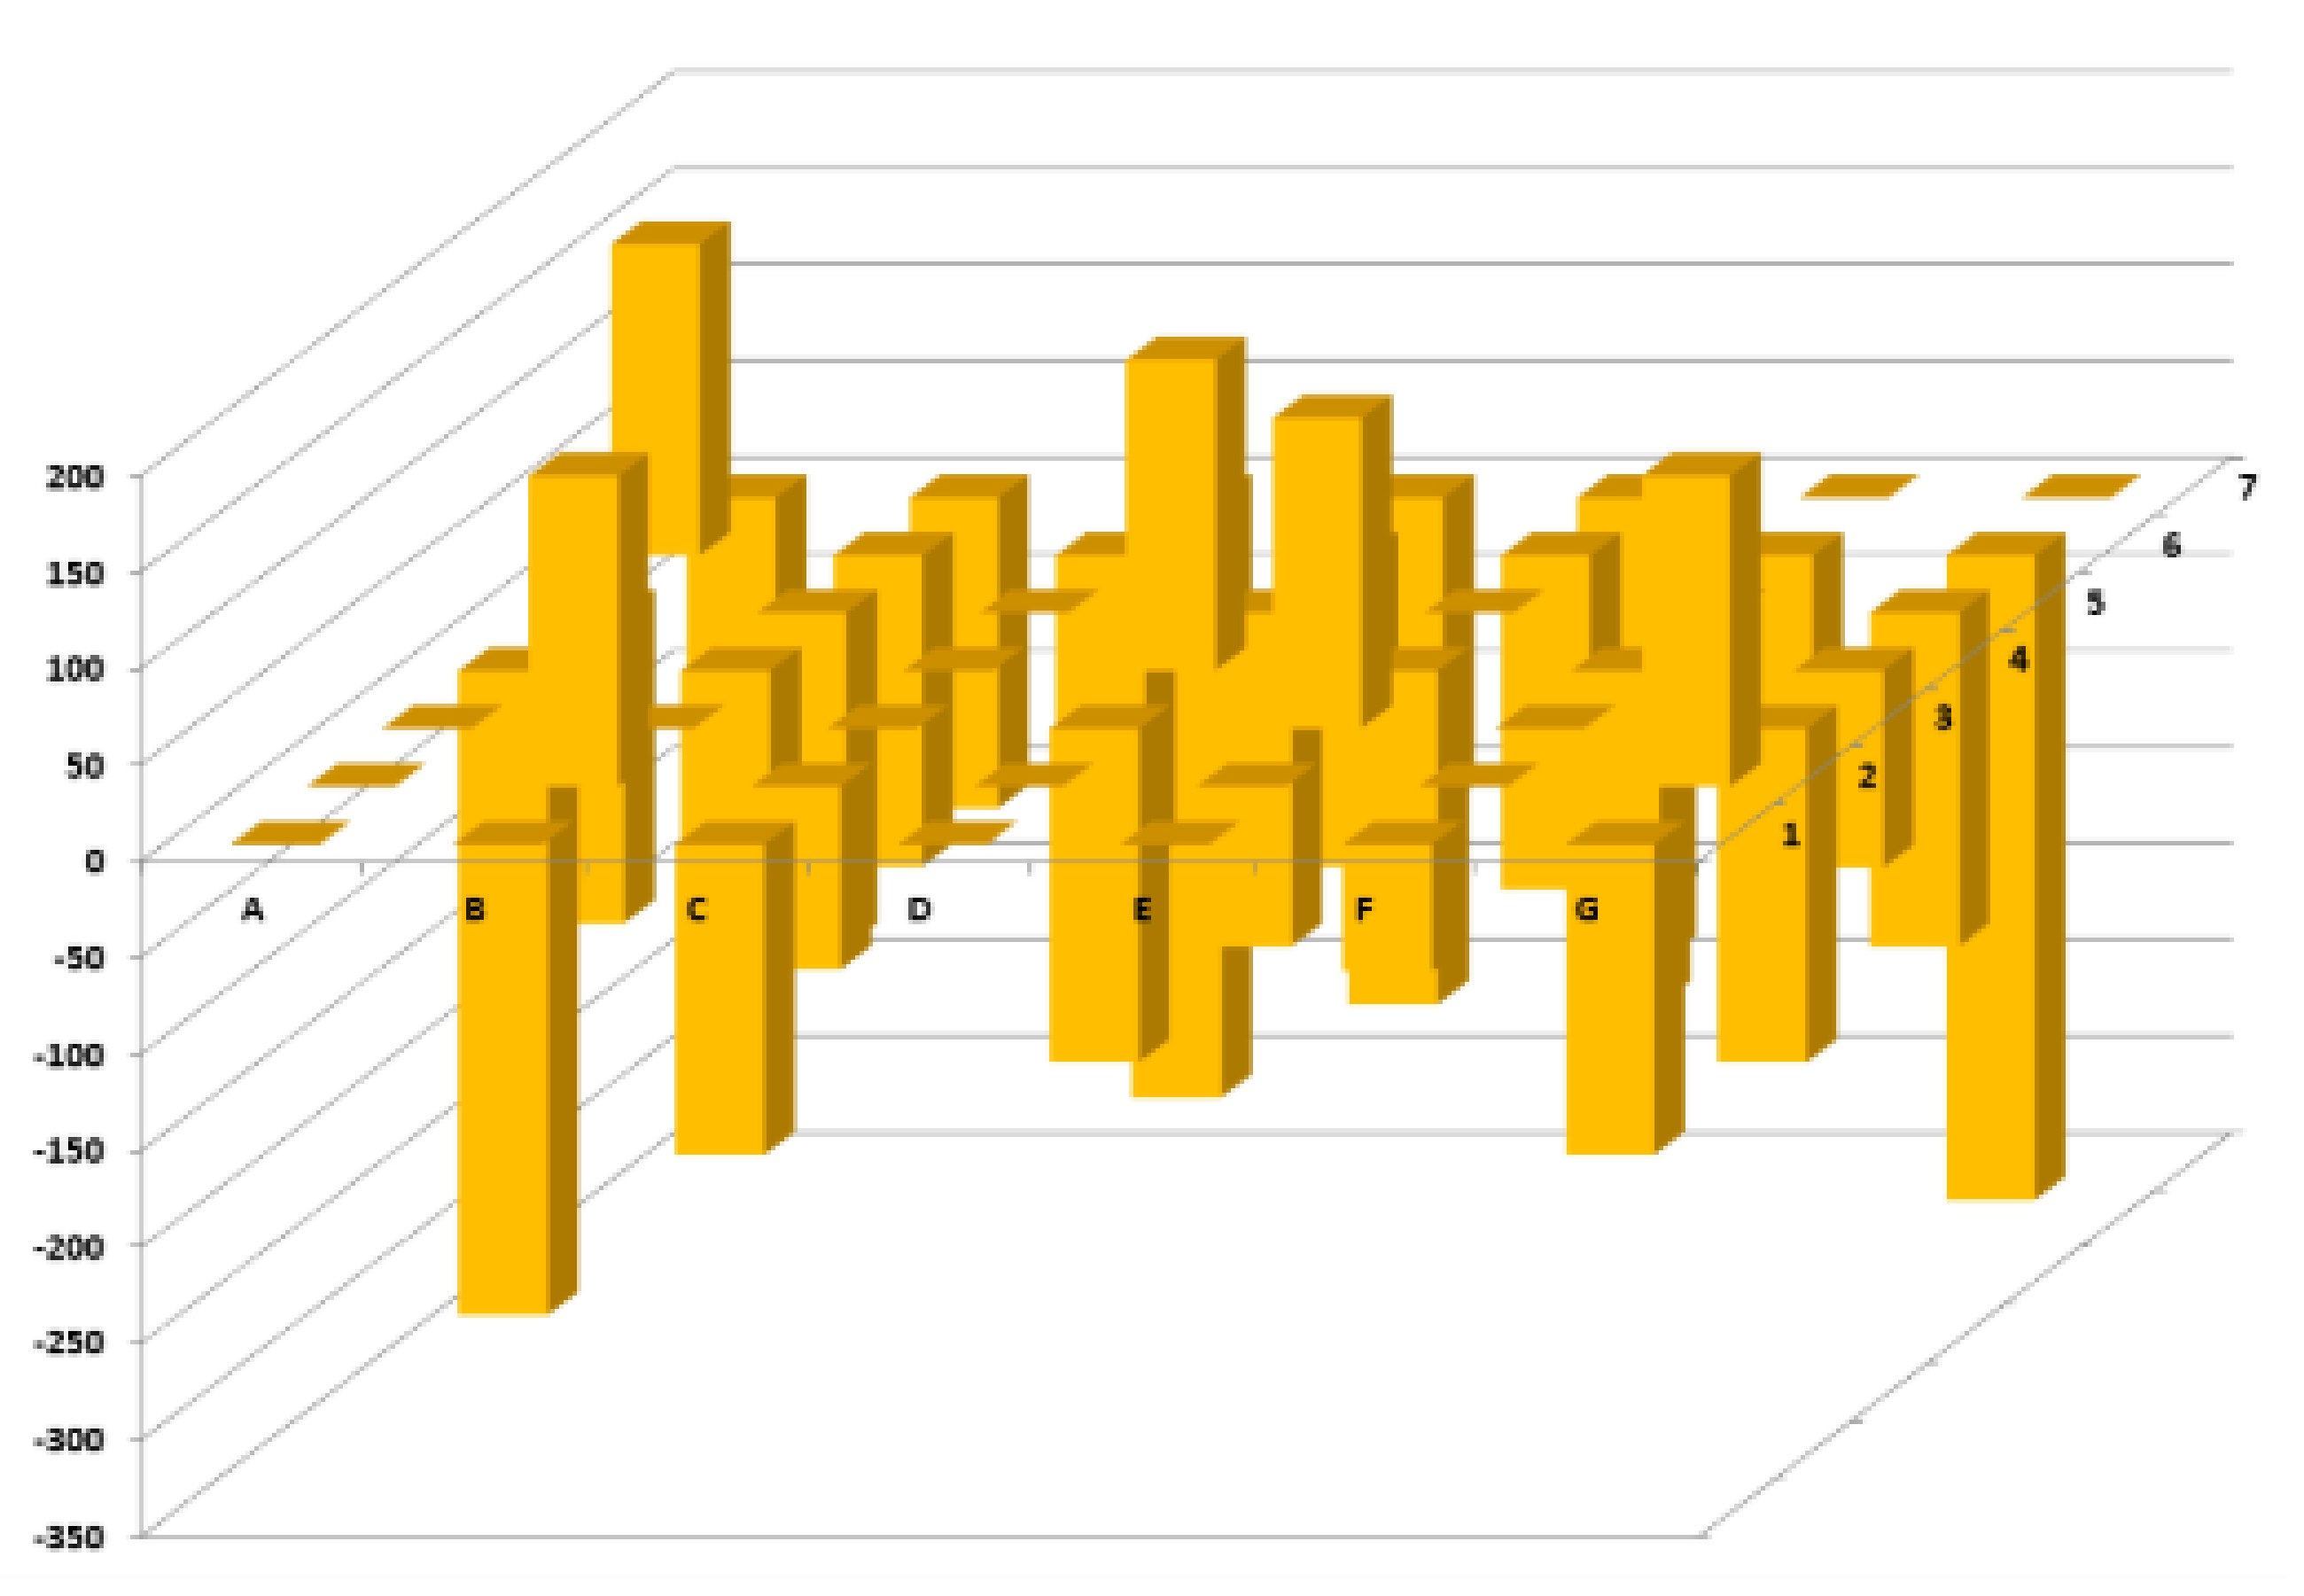
The graph of differences in measured velocities [m·s−1] of ultrasound waves for specimen A2_2 before and after blast load of 350 g TNT is shown in Figure 10. It can be seen from the graph that negative values were measured (when the passage of the ultrasound waves accelerated through the specimen), but the number and distribution of these values is better seen in Figure 11. The number of points where the acceleration of the passage of ultrasound waves through the material was measured, compared to the expected deceleration, was 42.9% of all measured points. Figure 11 shows the reverse side of the specimen without any visible transverse cracks oriented from the center to the corners of the specimen, which is characteristic for a fast dynamic load.

4.3. Specimen A2_3 Made from SFRC

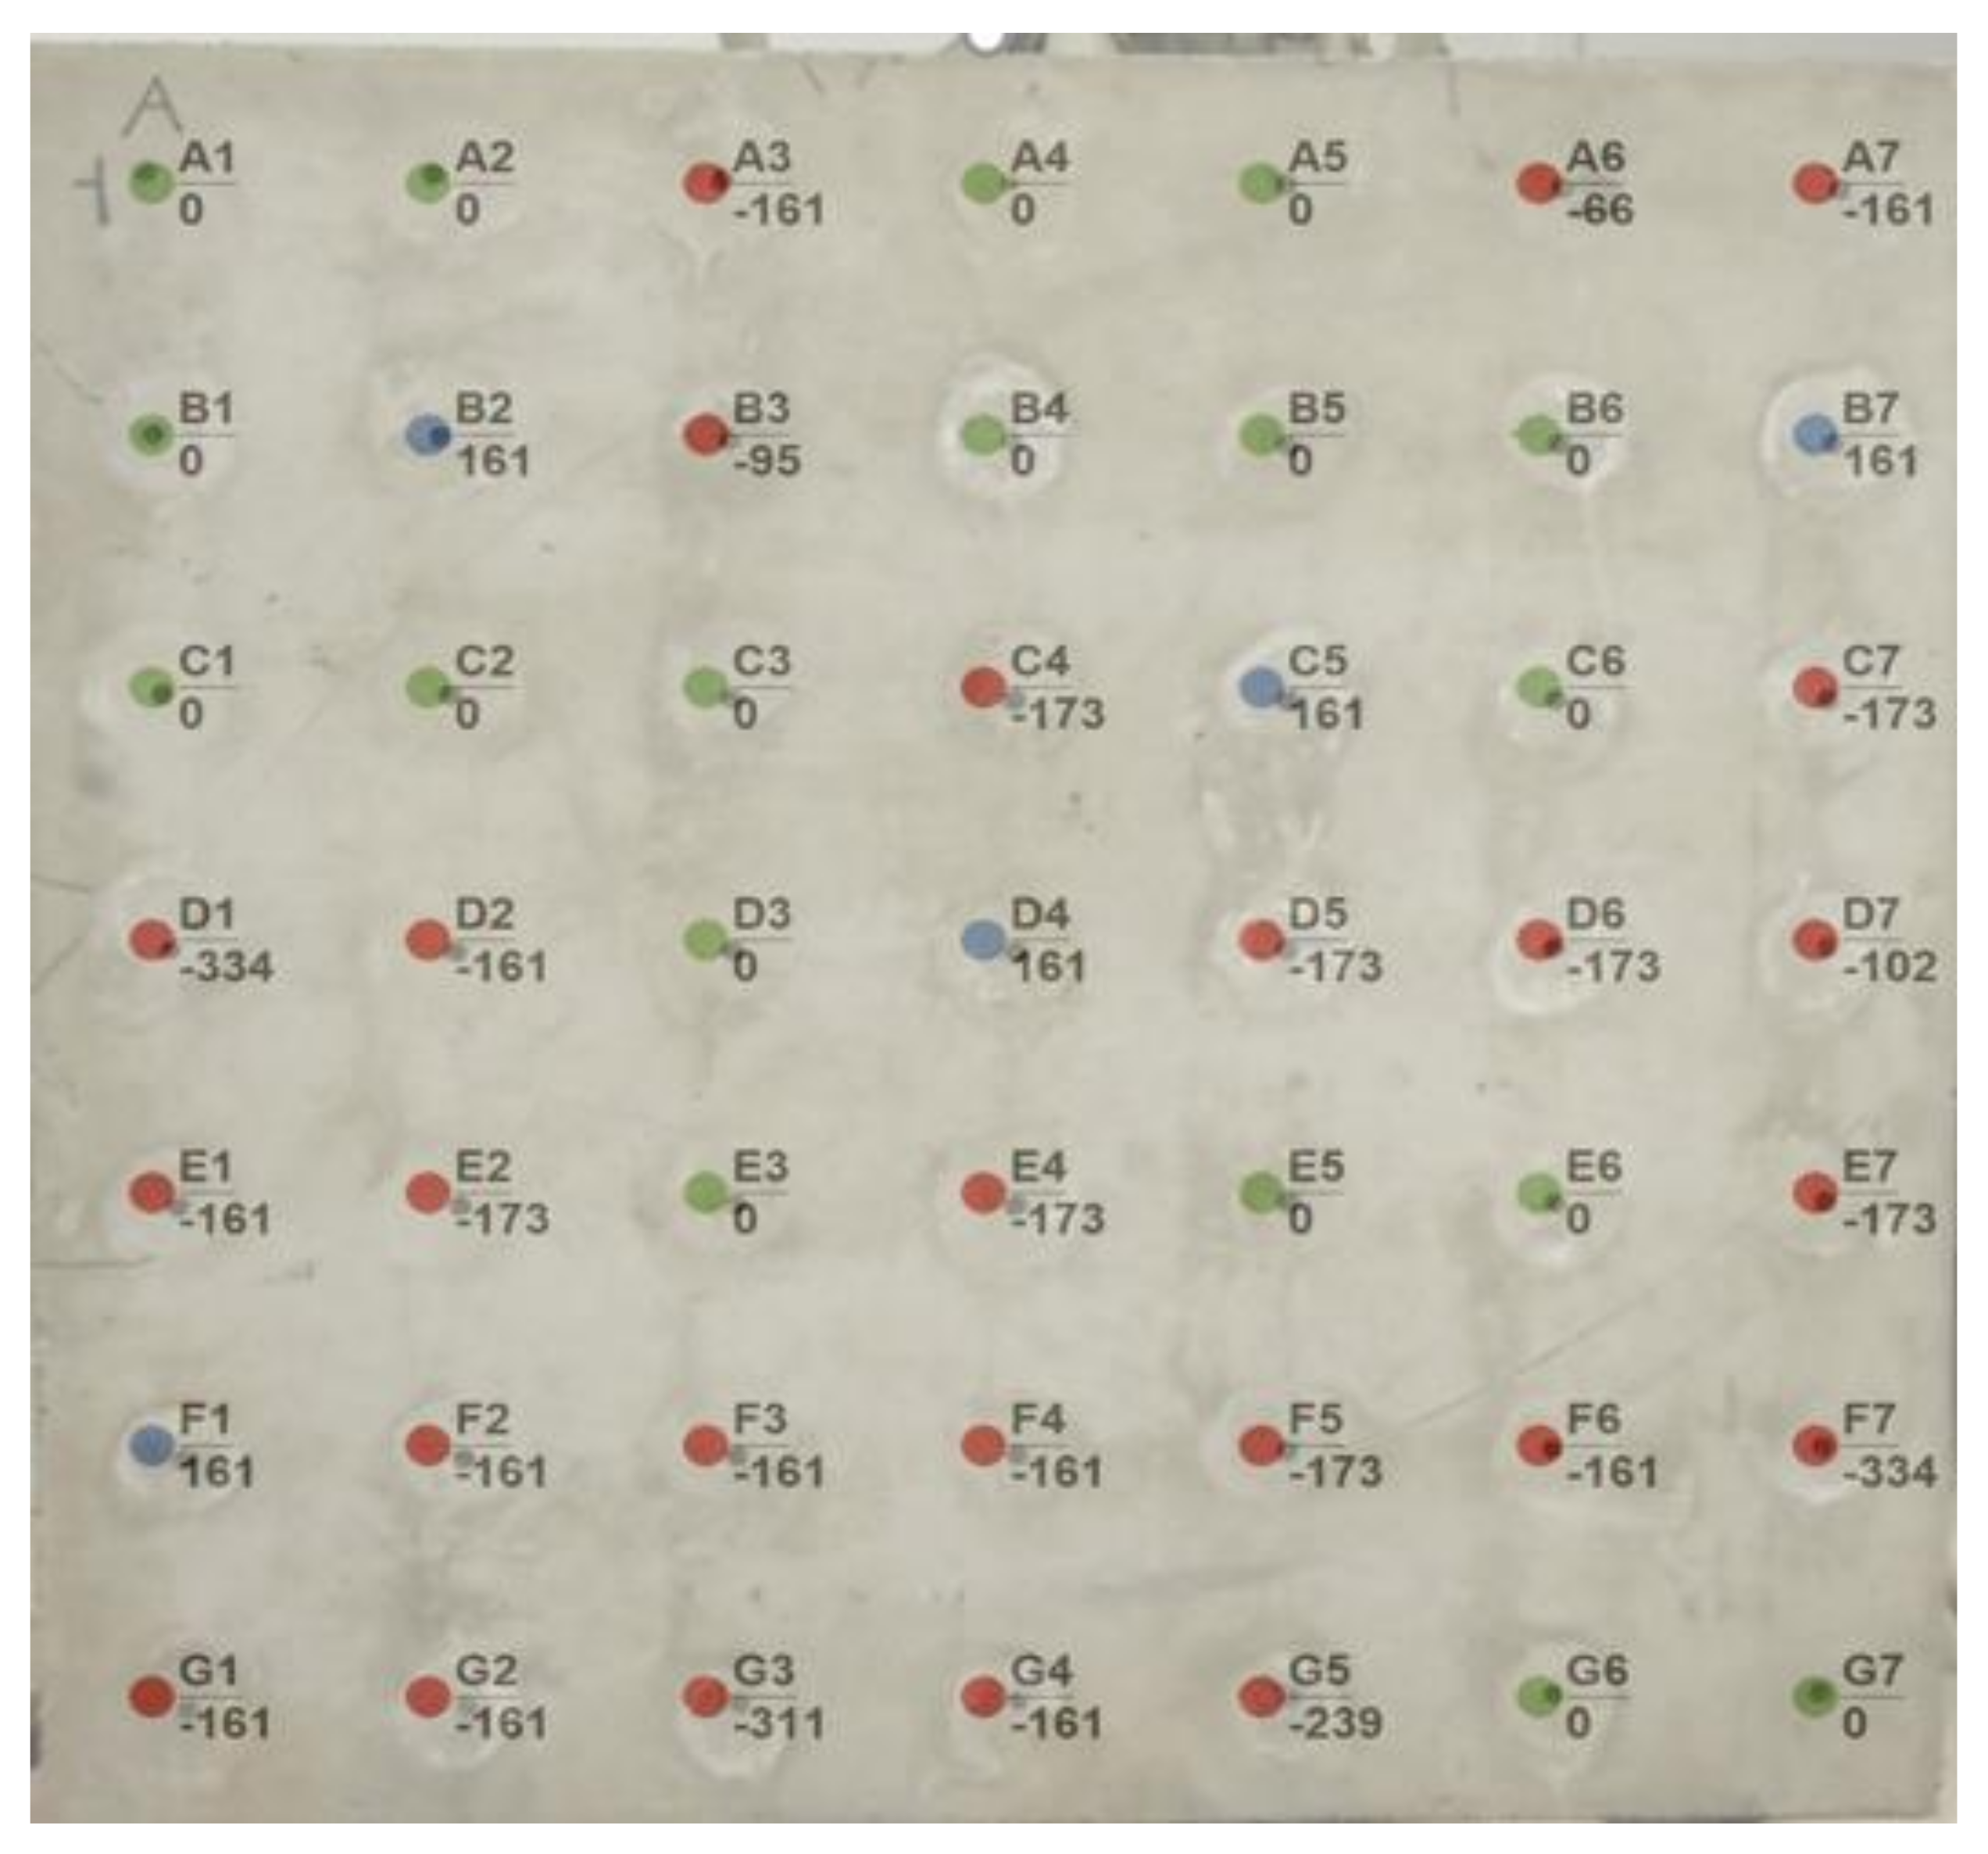
The graph of differences in measured velocities [m·s−1] of ultrasound waves for specimen A2_3 before and after blast load of 600 g TNT is shown in Figure 12. It can be seen from the graph that negative values were not measured at all (when the passage of the ultrasound waves accelerated through the specimen). The number and distribution of measured values is better seen in Figure 13. The expected deceleration of the ultrasound waves occurred in the majority of measuring points (41 out of 45 points). There was no change in measured velocities in eight points (points of green color). Figure 13 shows the reverse side of the specimen with visible transverse cracks oriented from the center to the corners of the specimen, which is characteristic for a fast dynamic load.

4.4. Evaluation of Differences in the Results of Ultrasound Wave Velocity Measurement, Batch of Specimens A2_1 to A2_3

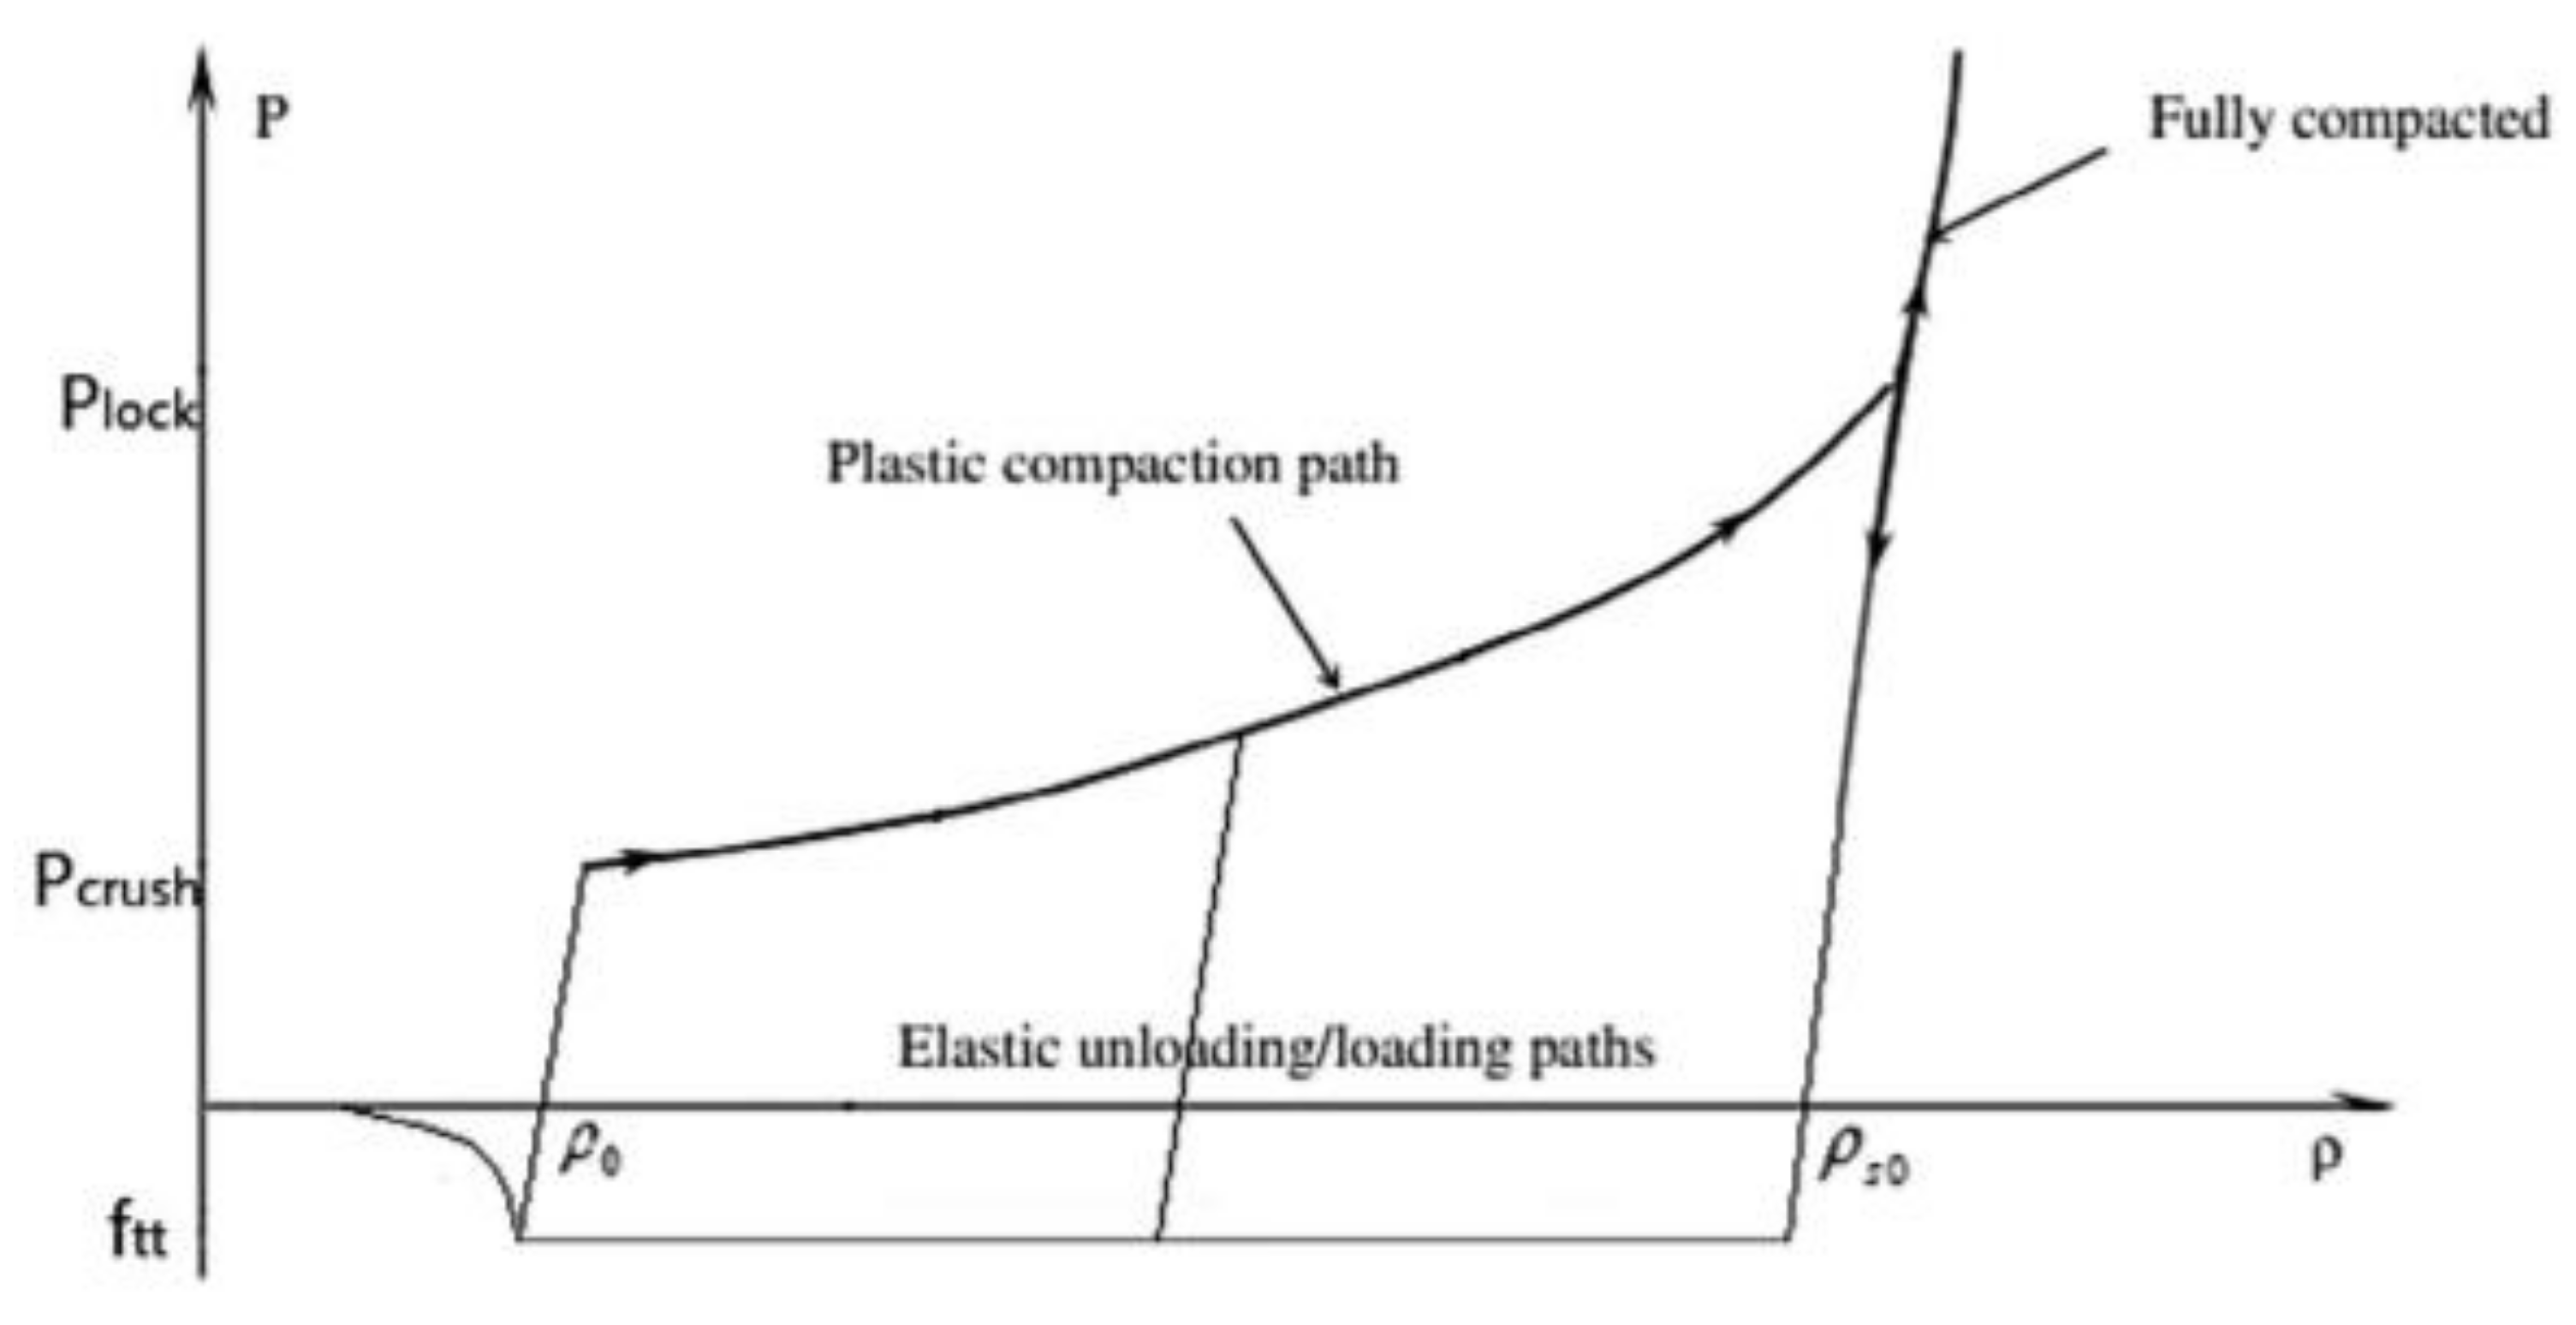
A characteristic feature of porous materials, which includes concrete [15,16], is the ability to compact themselves under compressive loading, i.e., reducing the porosity or increasing their density. The course of such compaction can be described by an idealized curve of porosity dependence, resp. density of material at applied pressure [17,18]. The initial compaction of the material has an elastic character due to the elastic deflection of the cell walls of the material. After exceeding this limit of compressive stress, a permanent plastic deformation occurs, resulting in a volume change of the material accompanied by an increase in the density of the material until complete compaction (Figure 14).
When using the ultrasound method, the dependence of the velocity of ultrasound passage on the properties of the material can be described by the formula [19]:
v u = 10 3 · k · E ρ
where v u [m·s−1] is the speed of signal propagation, E [MPa] is the modulus of elasticity, ρ [kg·m−3] is the density of the material and k is the coefficient of environmental dimensionality [–].
As can be seen from Equation (1), the rate at which the ultrasound signal passes through the material depends on the modulus of elasticity and the density of the material. As shown in [20,21,22], the modulus of elasticity of porous materials is also dependent on the porosity itself, i.e., E = f (ρ). With a decreasing value of porosity, as the density of the material increases, the value of the modulus of elasticity increases also.
The increasing value of the ratio of the terms below the square root in Equation (1) therefore results in an overall increase of the value of the speed of propagation of the ultrasound signal in the evaluated specimens. This fact was found after evaluating the measured values on specimens A2_1 and A2_2 (Figure 8, Figure 9, Figure 10, Figure 11). The average percentage increase in the rate of propagation of the ultrasound signal in the specimen A2_1 was 0.97%. For specimen A2_2 it was 1.77%. For sample A2_3, no increase in velocity was detected at any point. On the contrary, a decrease in passage velocity was measured at most points (Figure 12 and Figure 13). In this specimen, it can be stated that the failure of the material, i.e., the development of cracks in the specimen are so large in the whole volume of material that it caused the ultrasound signal to propagate along a path longer than the smallest possible, i.e., perpendicular to the cross section of the specimen, in contrast to the first two cases [5,23,24]. This fact is confirmed by the lowest value of the residual strength of the material in the specimen A2_3 (Figure 13).

5. Destructive Determination of the Residual Strength of Specimens in a Laboratory for Extrusion

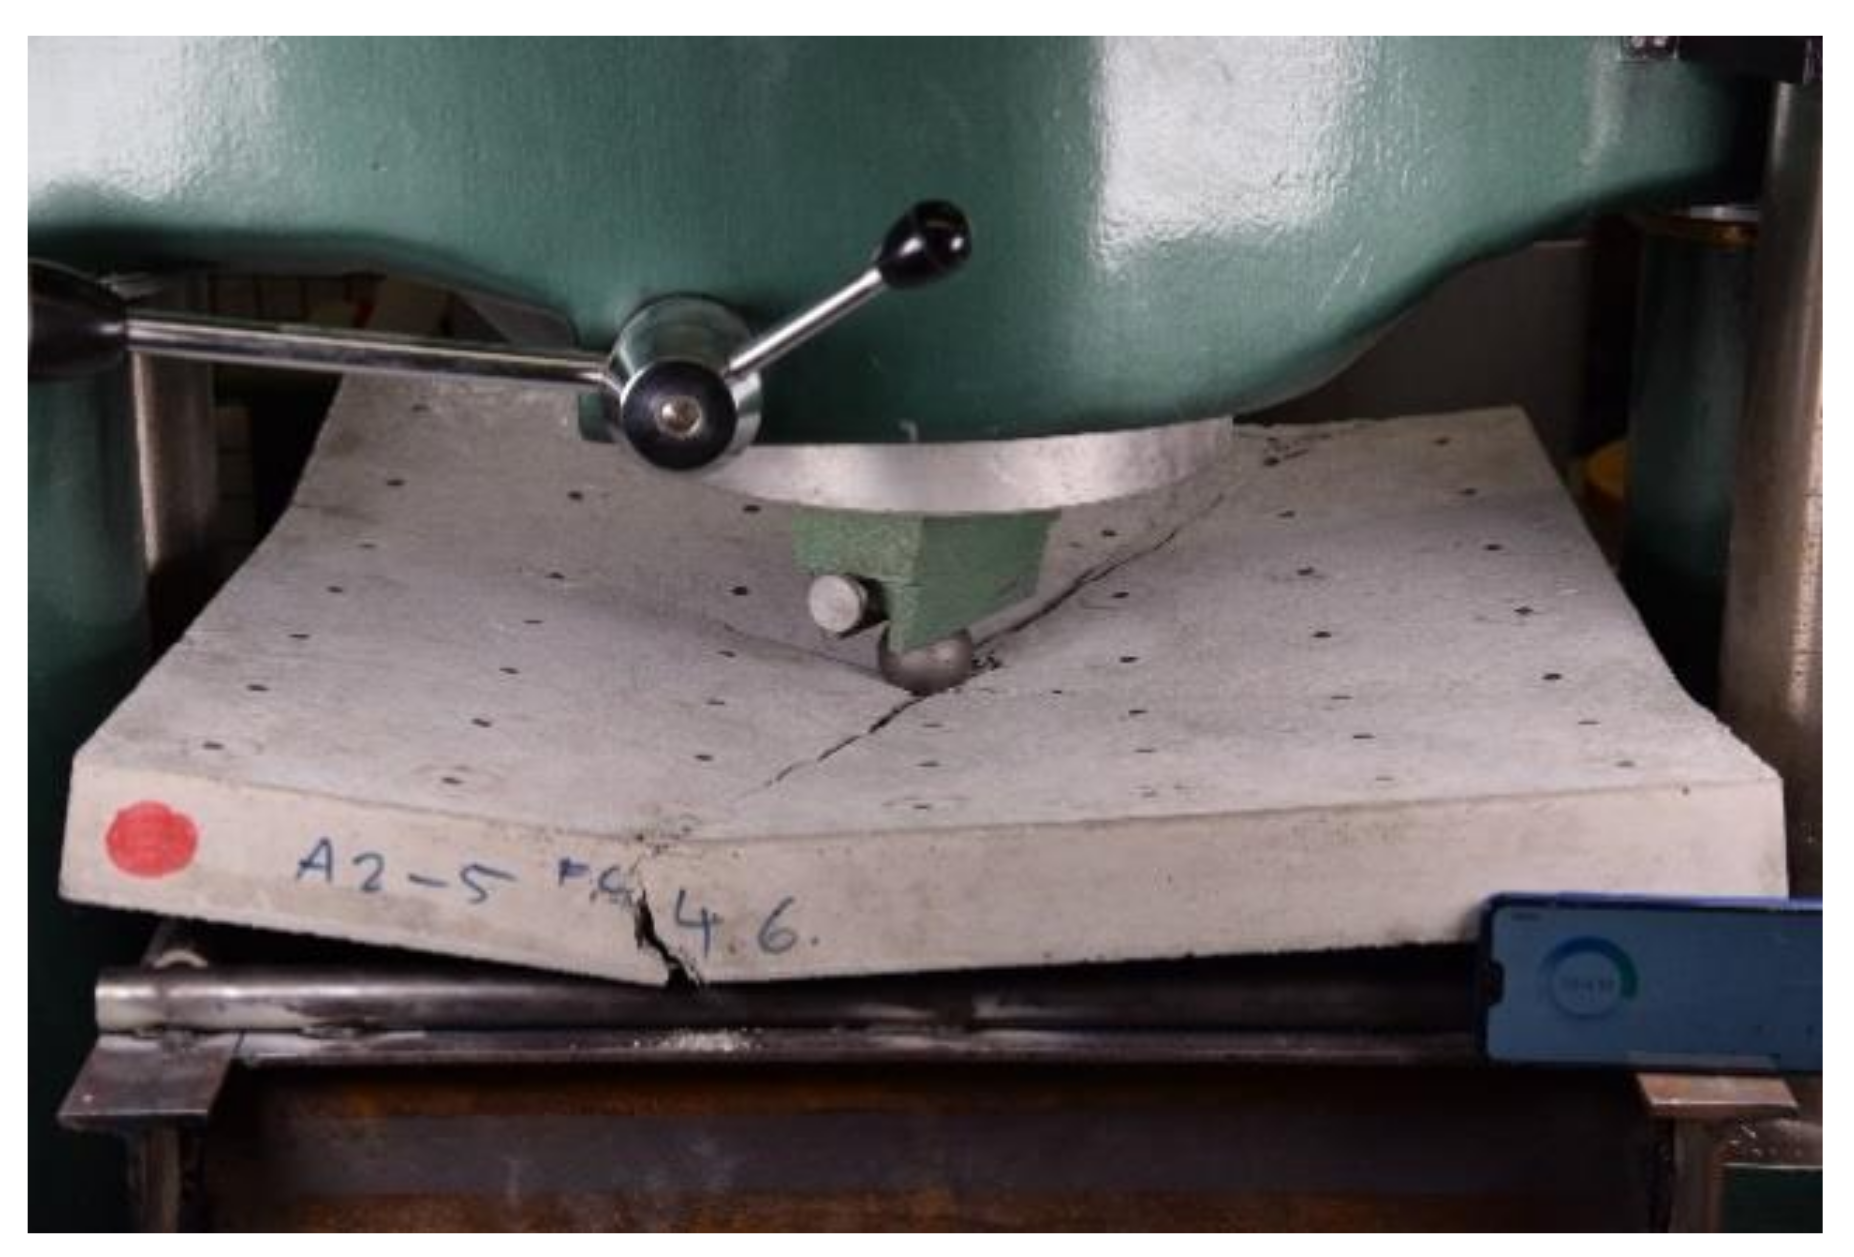
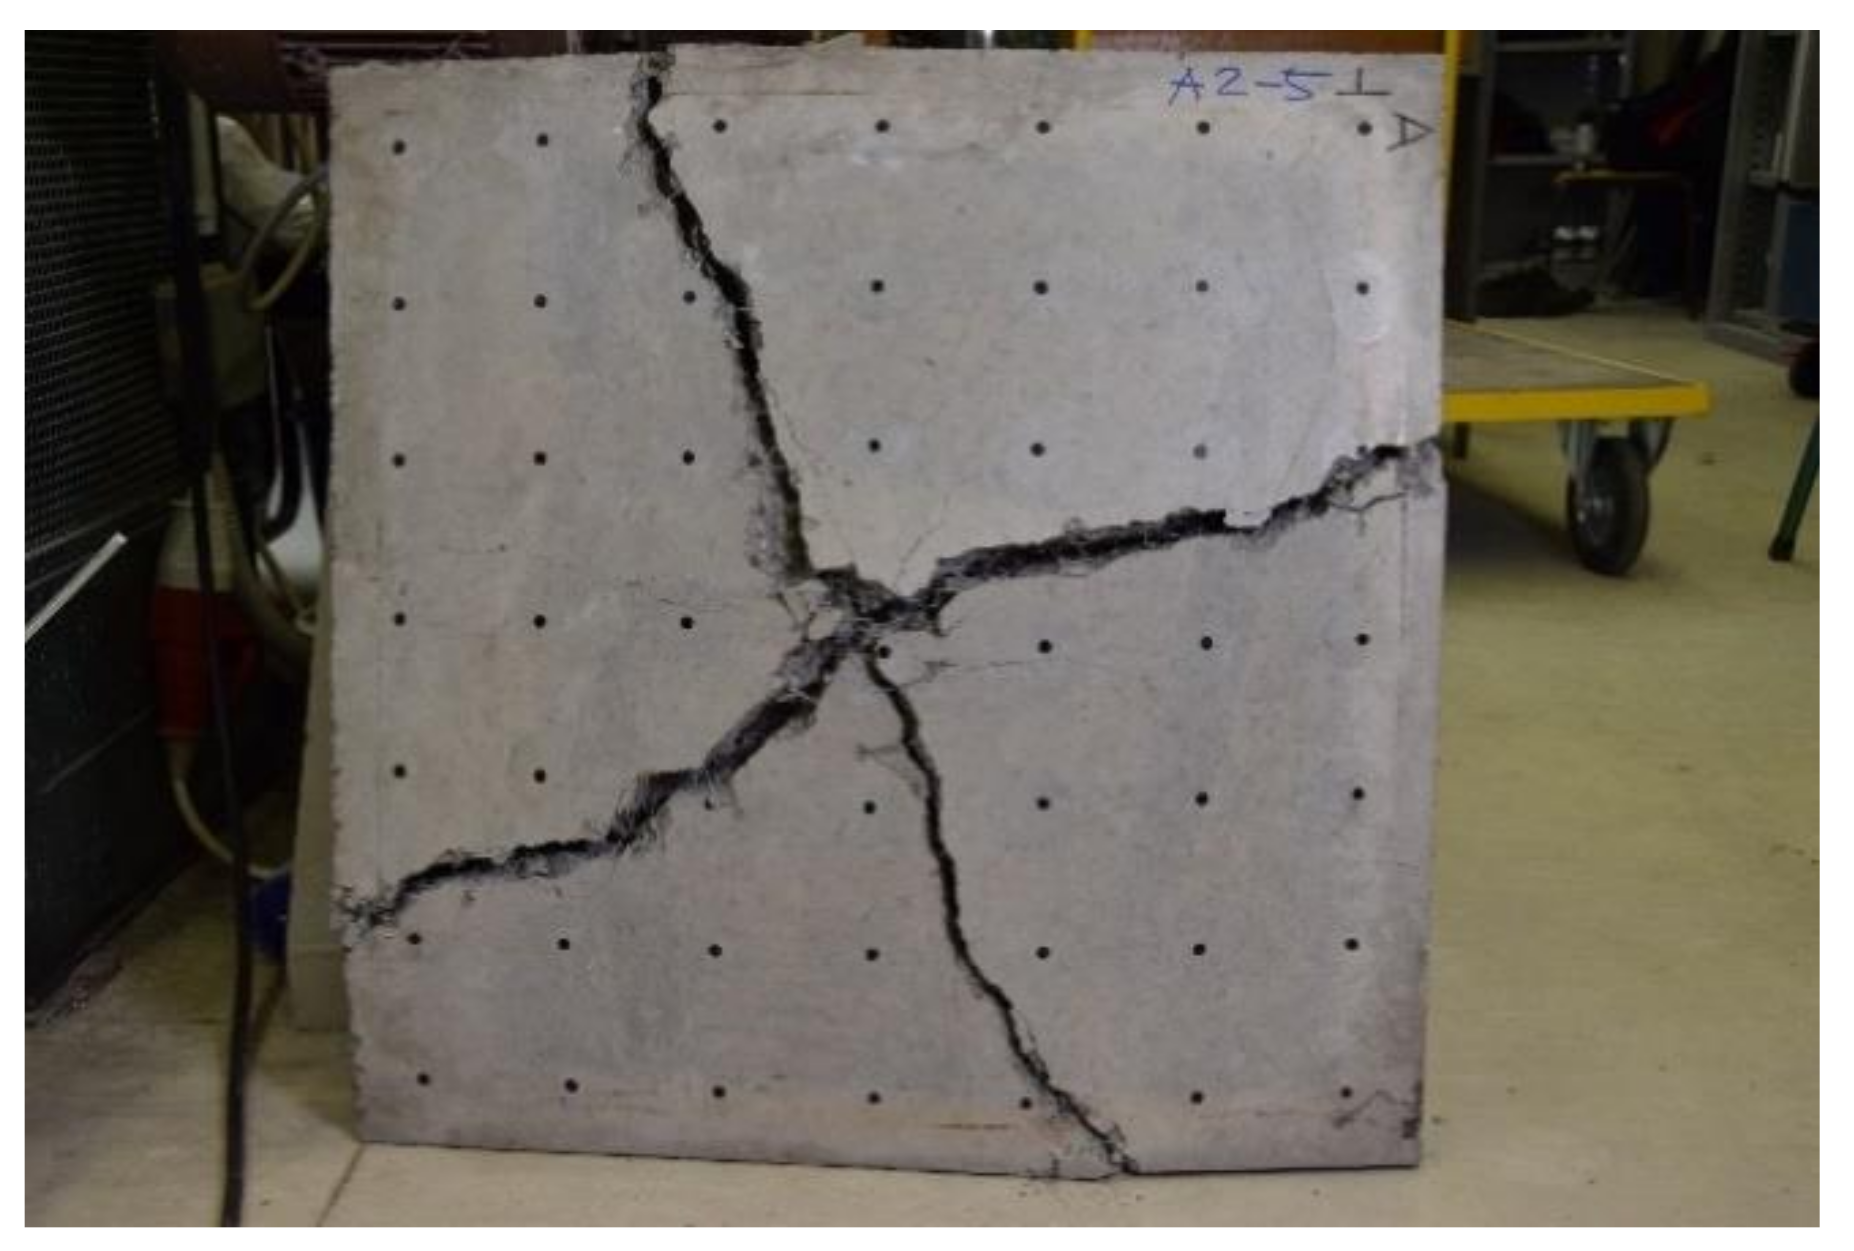
For the determination of difference in the residual strength of loaded specimens compared to unloaded ones, a non-standardized test was prepared. Static tests were designed to follow a static load of the specimens. The specimens were supported along their circumference and the loading, of a spherical shape, acted in the middle of the slab (Figure 15). The main difference was the speed of the load test. Figure 16 shows the typical development of cracks in a statically loaded slab supported along its circumference where cracks tend to form in the shortest direction to the circumference of the slab. In contrast, Figure 17 and Figure 18 show a typical crack development for fast dynamic loading, where cracks tend to form diagonally.

5.1. Batch of Specimens A2 Made from SFRC

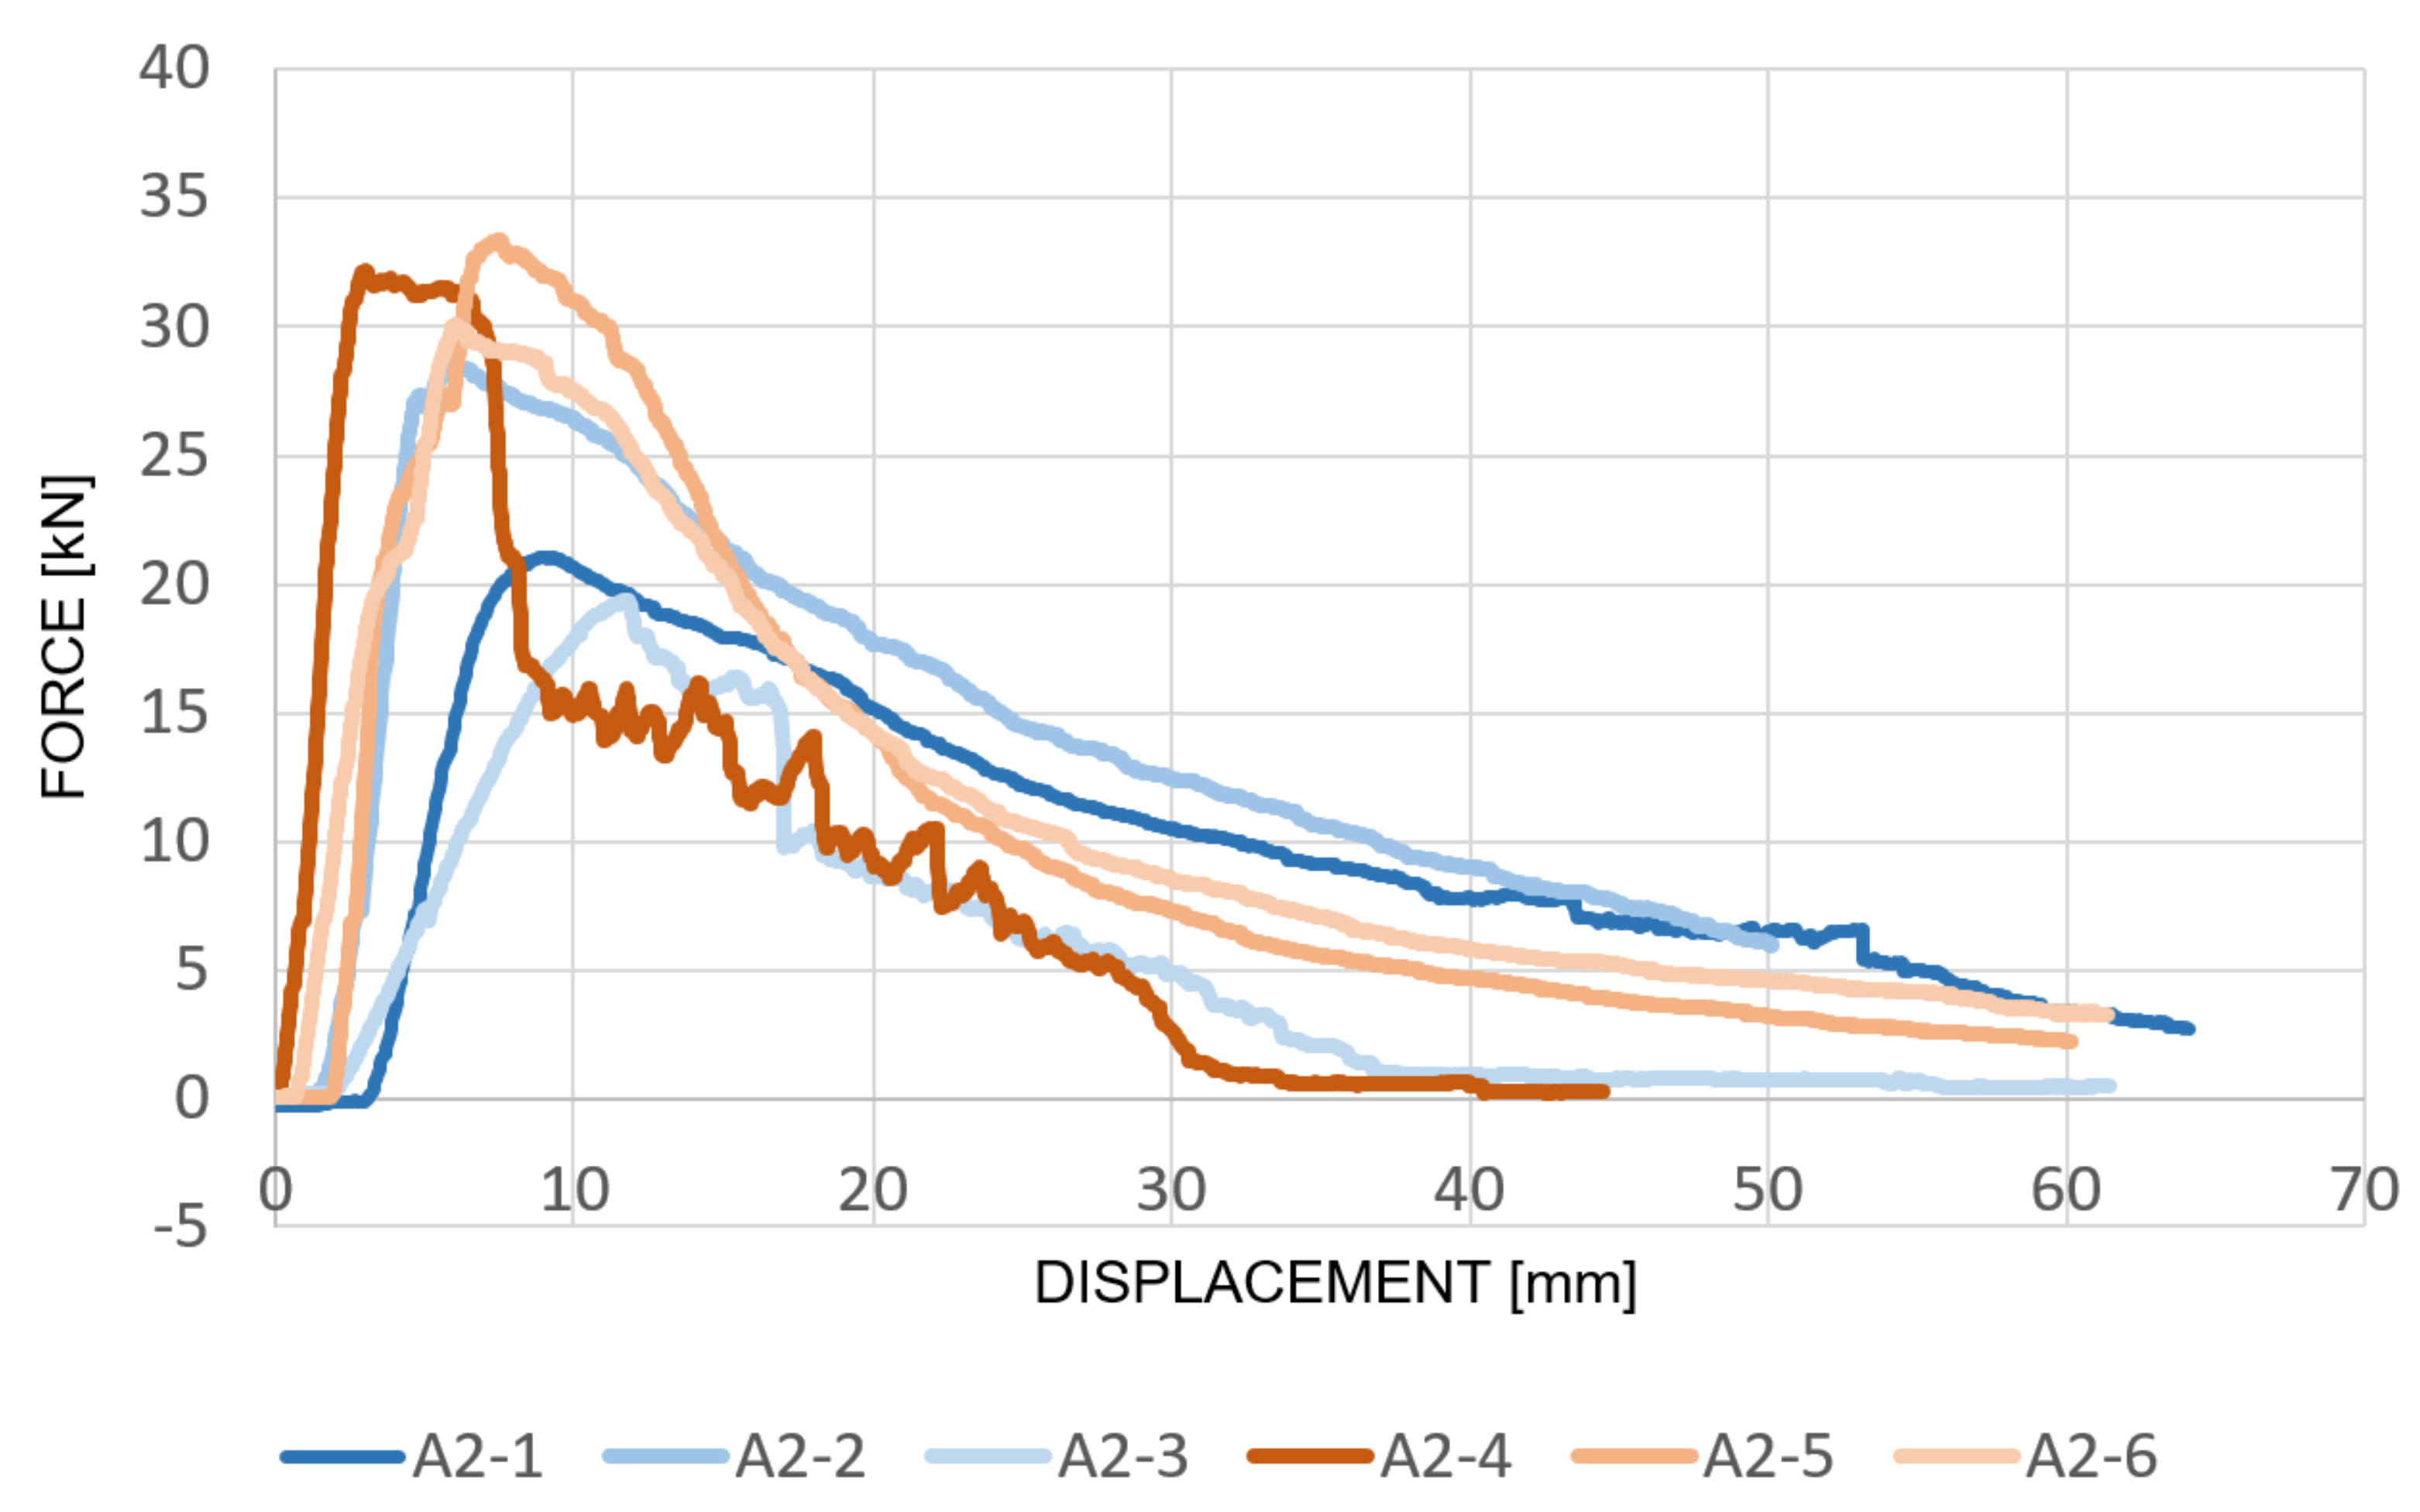
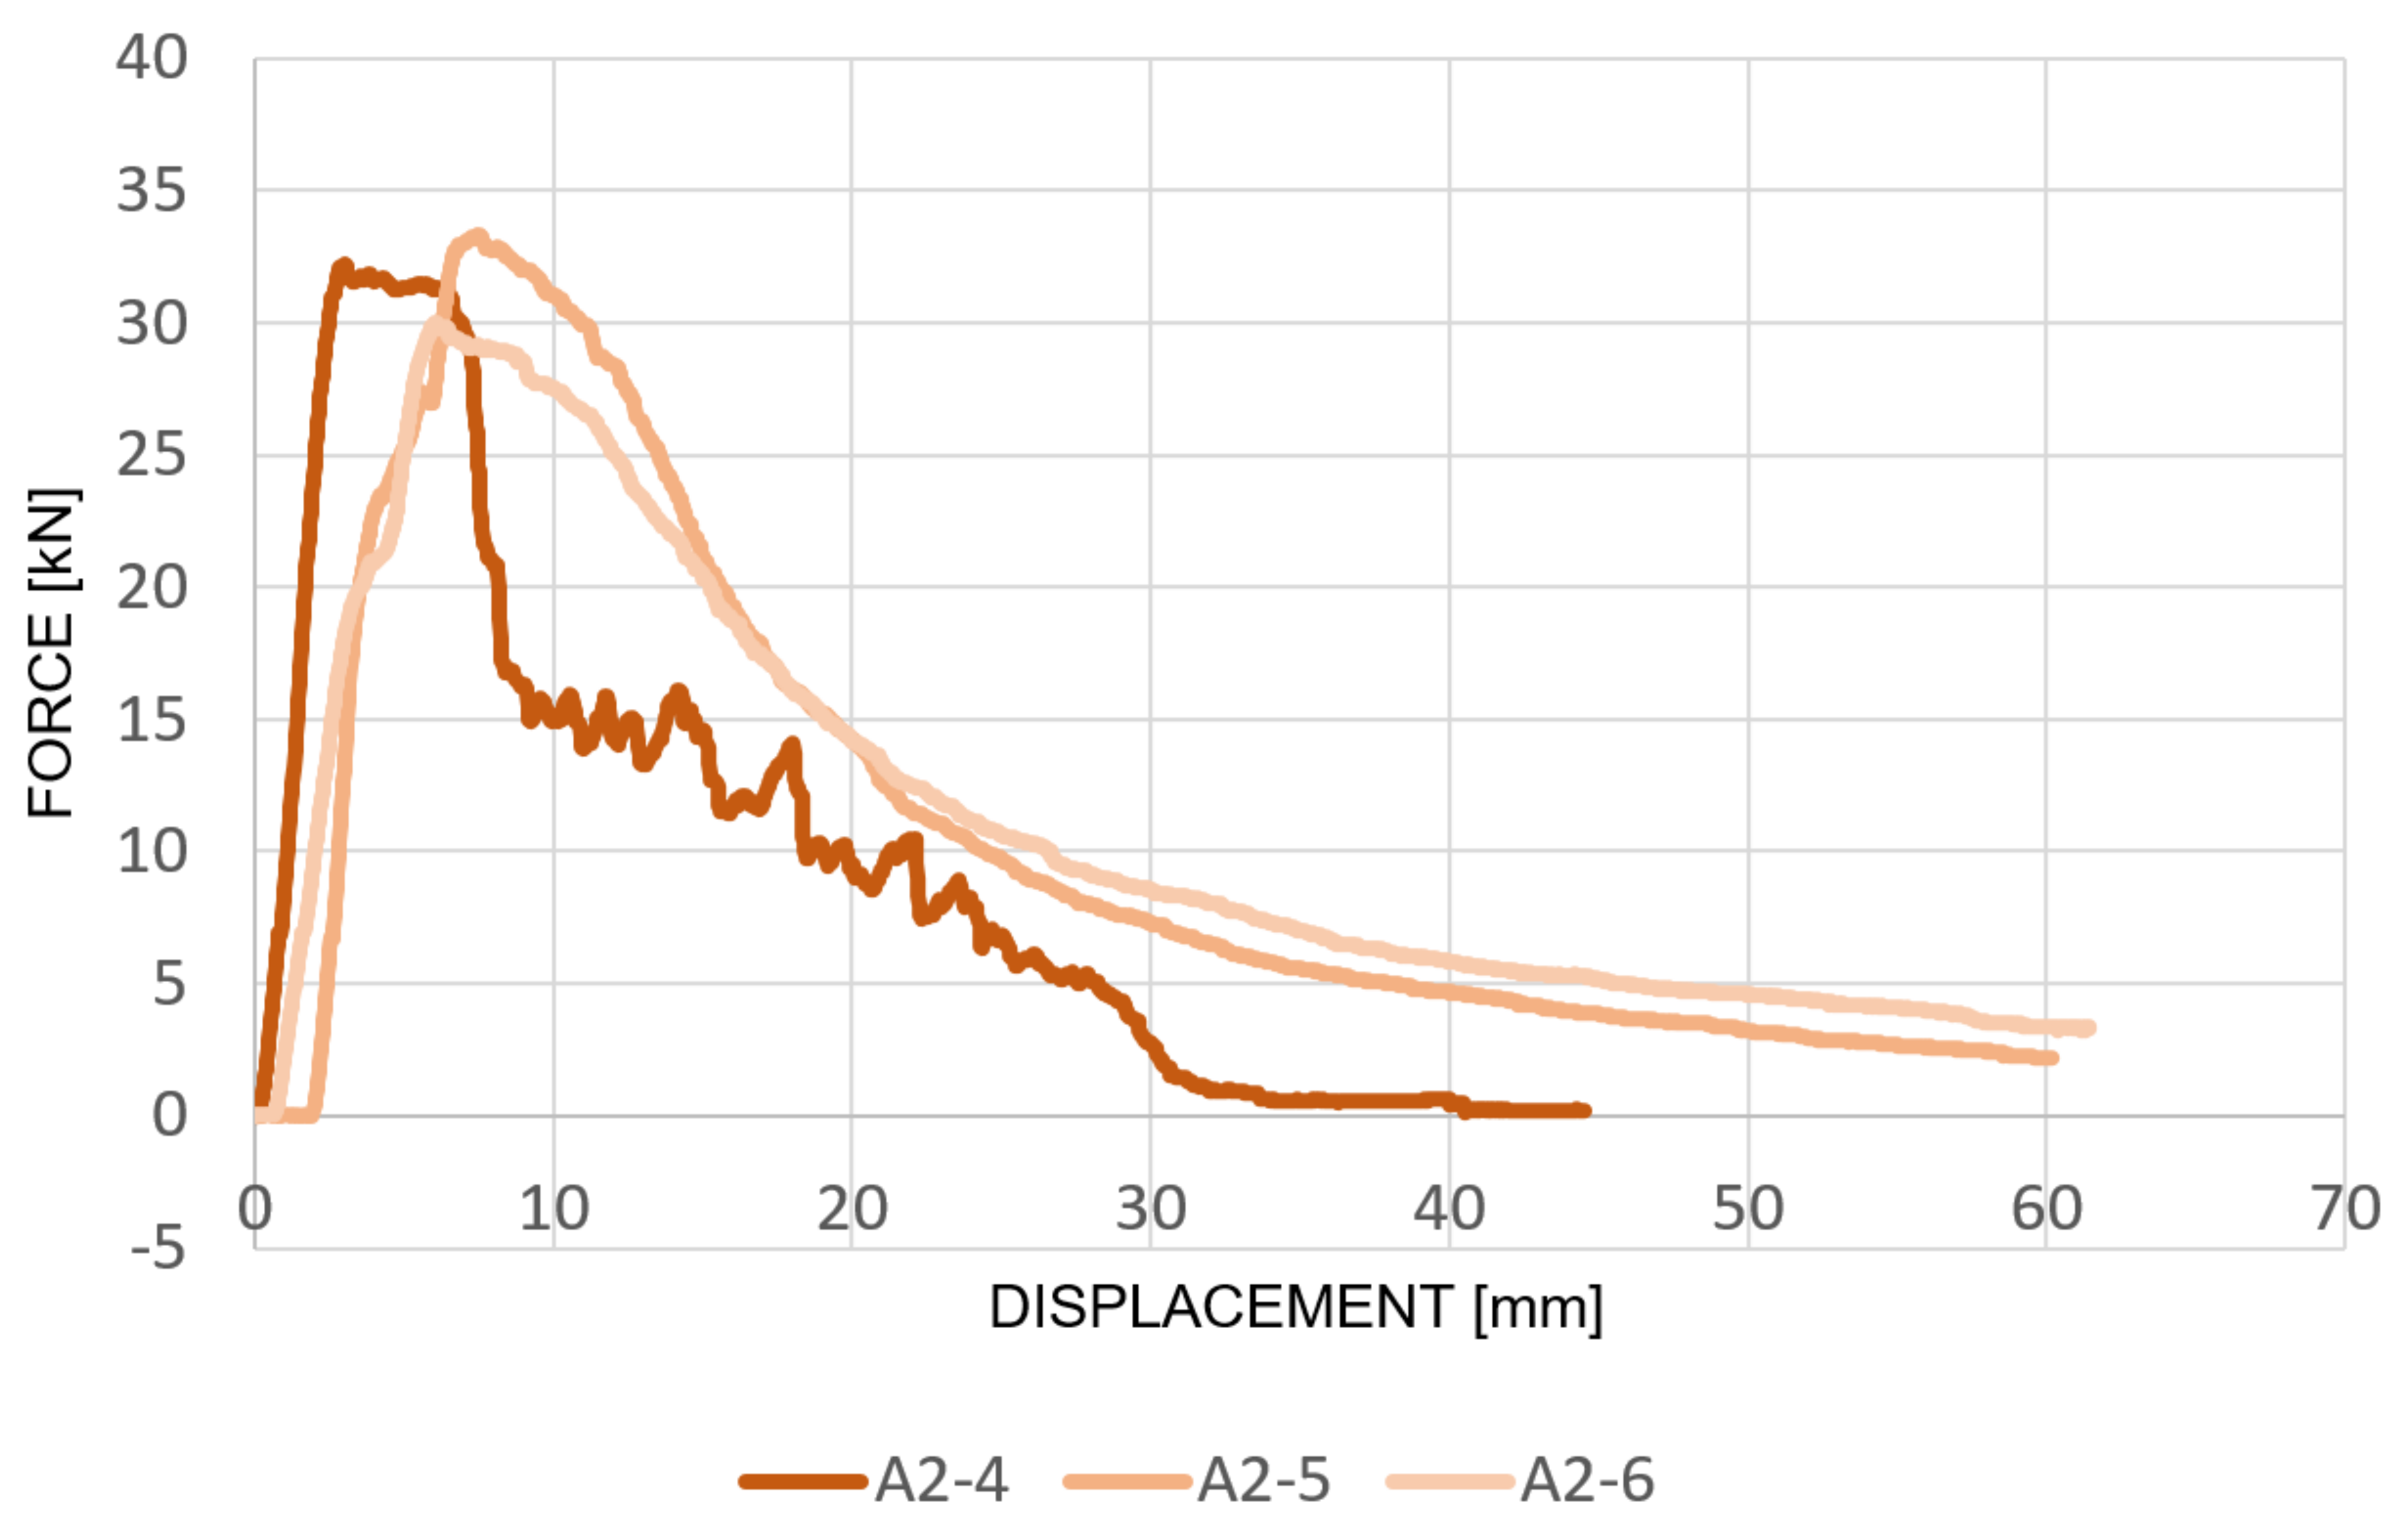
Six slabs made from SFRC were divided into two sets: A2_1 to A2_3, which were subjected to dynamic load before the load test, and a set of slabs A2_4 to A2_6, which were tested without prior dynamic load (Figure 19). Mechanical and physical parameters were first determined on the accompanying elements of the same recipe and age. The compressive strength fc = 70 MPa and the bulk density ρ = 2410 kg·m−3 were determined. In Figure 19, the individual loading curves of all fiber reinforced concrete slabs are shown. At first glance, it is clear that the loading force reached half the value compared to the results performed on UHPC slabs (ultra-high performance concrete). The assumption was that after reaching the maximum loading force, the fibers would provide a very gradually decreasing value of the loading force and that the assumption of the toughness of this material would be confirmed.
The fibers that are usually used in SFRC, e.g., steel or plastic, do not connect very well with hardened concrete due to very low fiber-concrete bond. Most of the fibers that are used in civil engineering have an elastic modulus adequately higher than concrete itself, guaranteeing good reinforcement qualities, and the SFRC products are of a high quality with appropriate properties, e.g., strength and toughness. However, one of the problems is due to insufficient fiber-concrete bond, where in many cases fibers during the load and the deformation of the building element pull out from the hardened concrete without using their high strength.
As it can be seen in Figure 20, the specimen A2_4 showed a significant decrease in force, almost 50%, after reaching the maximum force. In comparison with other slabs, the maximum value was reached relatively earlier, as the displacement of the crossbar was already around 4 mm (8 mm was value for the other slabs). Fiber reinforced concrete testing elements are generally very susceptible to the quality of the design, where the distribution of steel fibers in the entire volume of the element is very important, with emphasis on its homogeneity or uniformity of distribution. This difference in the graphical assessment of the obtained data from the load test may be caused by local inhomogeneity in the area around the point load. In load tests, where the load is transmitted only pointwise, and especially in fiber reinforced concrete, the arrangement of the fibers in the internal structure is very important. Another factor is the relatively small thickness of the test specimens (60 mm), which could affect the homogeneity of the testing elements. For the next planned experiments, it was therefore appropriate to produce more test specimens than the required minimal number of three samples in order to capture possible defects and inhomogeneity resulting from the production. For the remaining two fiber reinforced concrete slabs, almost the same trend of decreasing residual strength was observed.
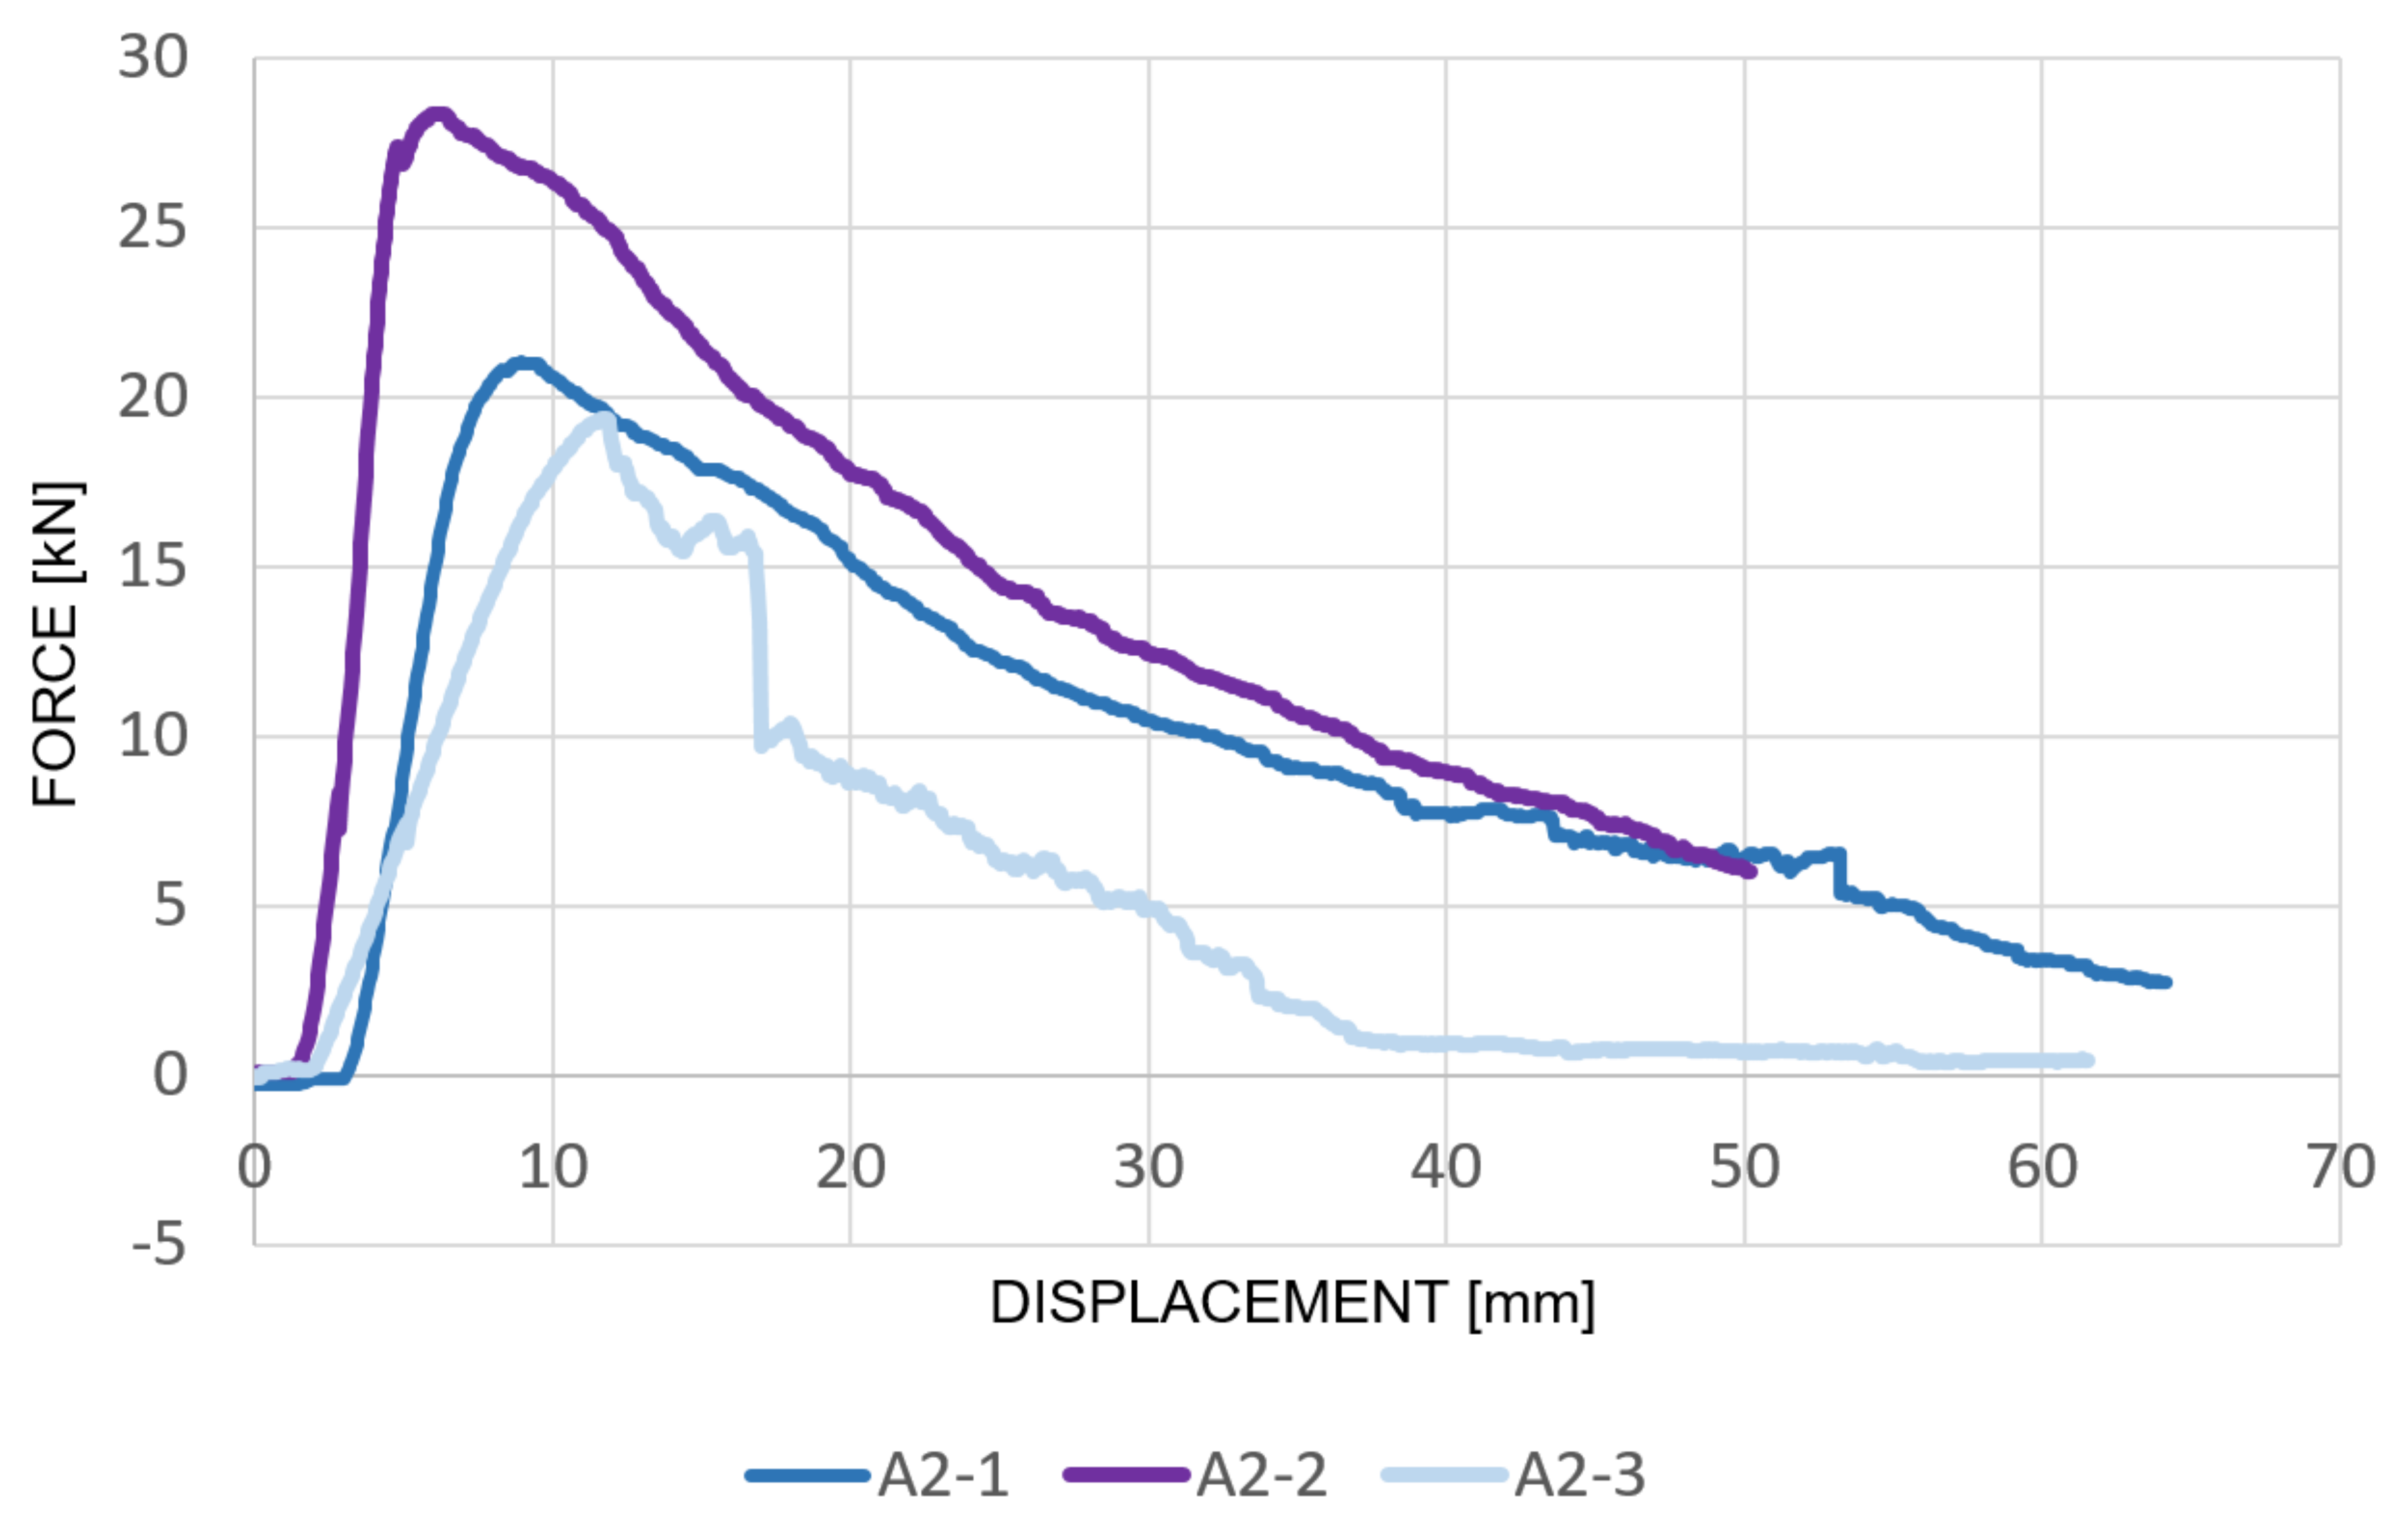
Figure 21 shows the evaluation of specimens A2_1 to A2_3 separately from unloaded slabs. In the specimen A2_3, a noticeable sudden decrease in force can be seen, which, however, occurred only after a certain time from reaching the maximum value. Table 5 shows the values of the weights of the individual TNT charges with which the slabs were tested during the previous field tests. The achieved maximum forces corresponded very well with the values of the weights of the charges. It can therefore be stated that fiber reinforced concrete appears to be a suitable material for the purposes of implementation in protective structures with emphasis on the requirements of minimum residual load-bearing capacity.
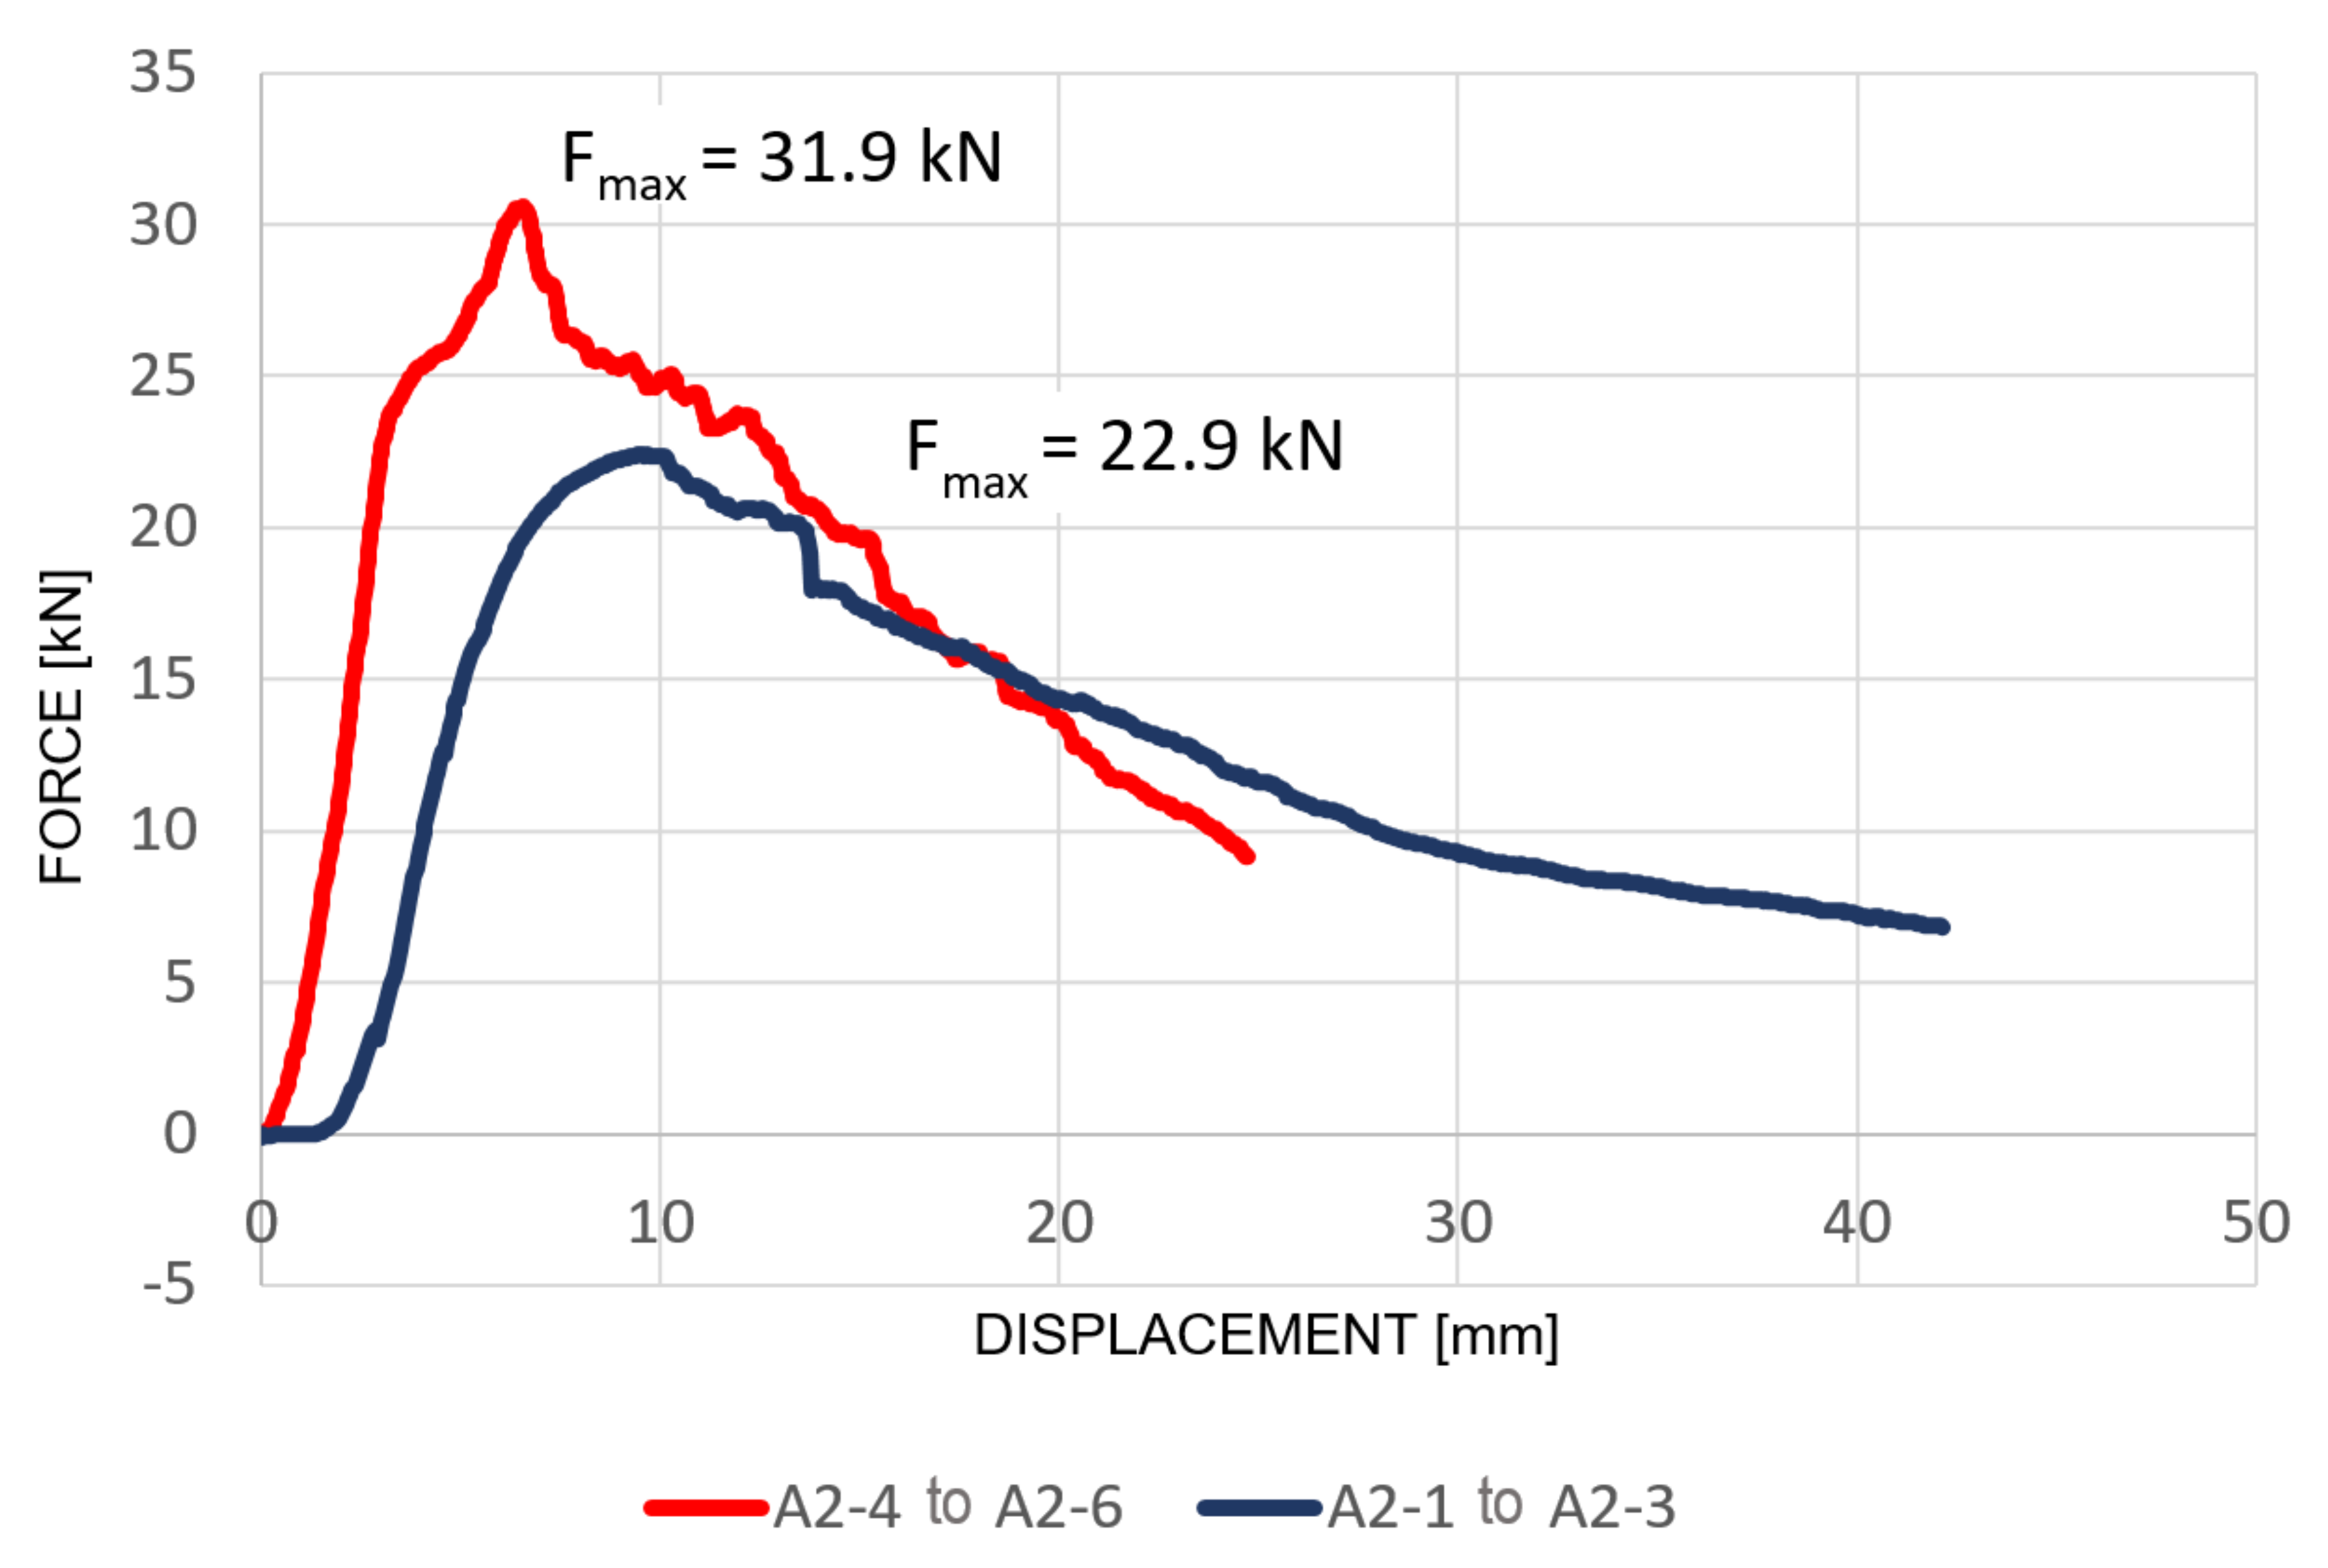
When comparing the maximum forces for both sets of specimens, the maximum force decreased by 9 kN, which is roughly a decrease of less than 30%. It was 28.2% compared to the average value of the maximum forces on non-explosive slabs (Figure 22). It can be stated that this is a relatively large reduction in the maximum load-bearing capacity, but based on the graph, the activation of steel fibers is obvious, and this ensures a more gradual increase of deformations with increasing load. Therefore, the assumption of high toughness of this material is confirmed.

5.2. Evaluation of the Results of Measuring the Residual Strength of the Batch of Specimens A2_1 to A2_3

Based on Figure 19 showing the evaluation of laboratory tests of static point loading of the batch of specimens A2, we can assume that specimens after blast loading (A2_1 to A2_3) and specimens without blast loading (A2_4 to A2_6) show different curves of the force with respect to the displacement. However, the graphical comparison may not be conclusive, so we used a statistical test that compared both groups of curves. The test was based on the idea that each individual curve represents one observation.
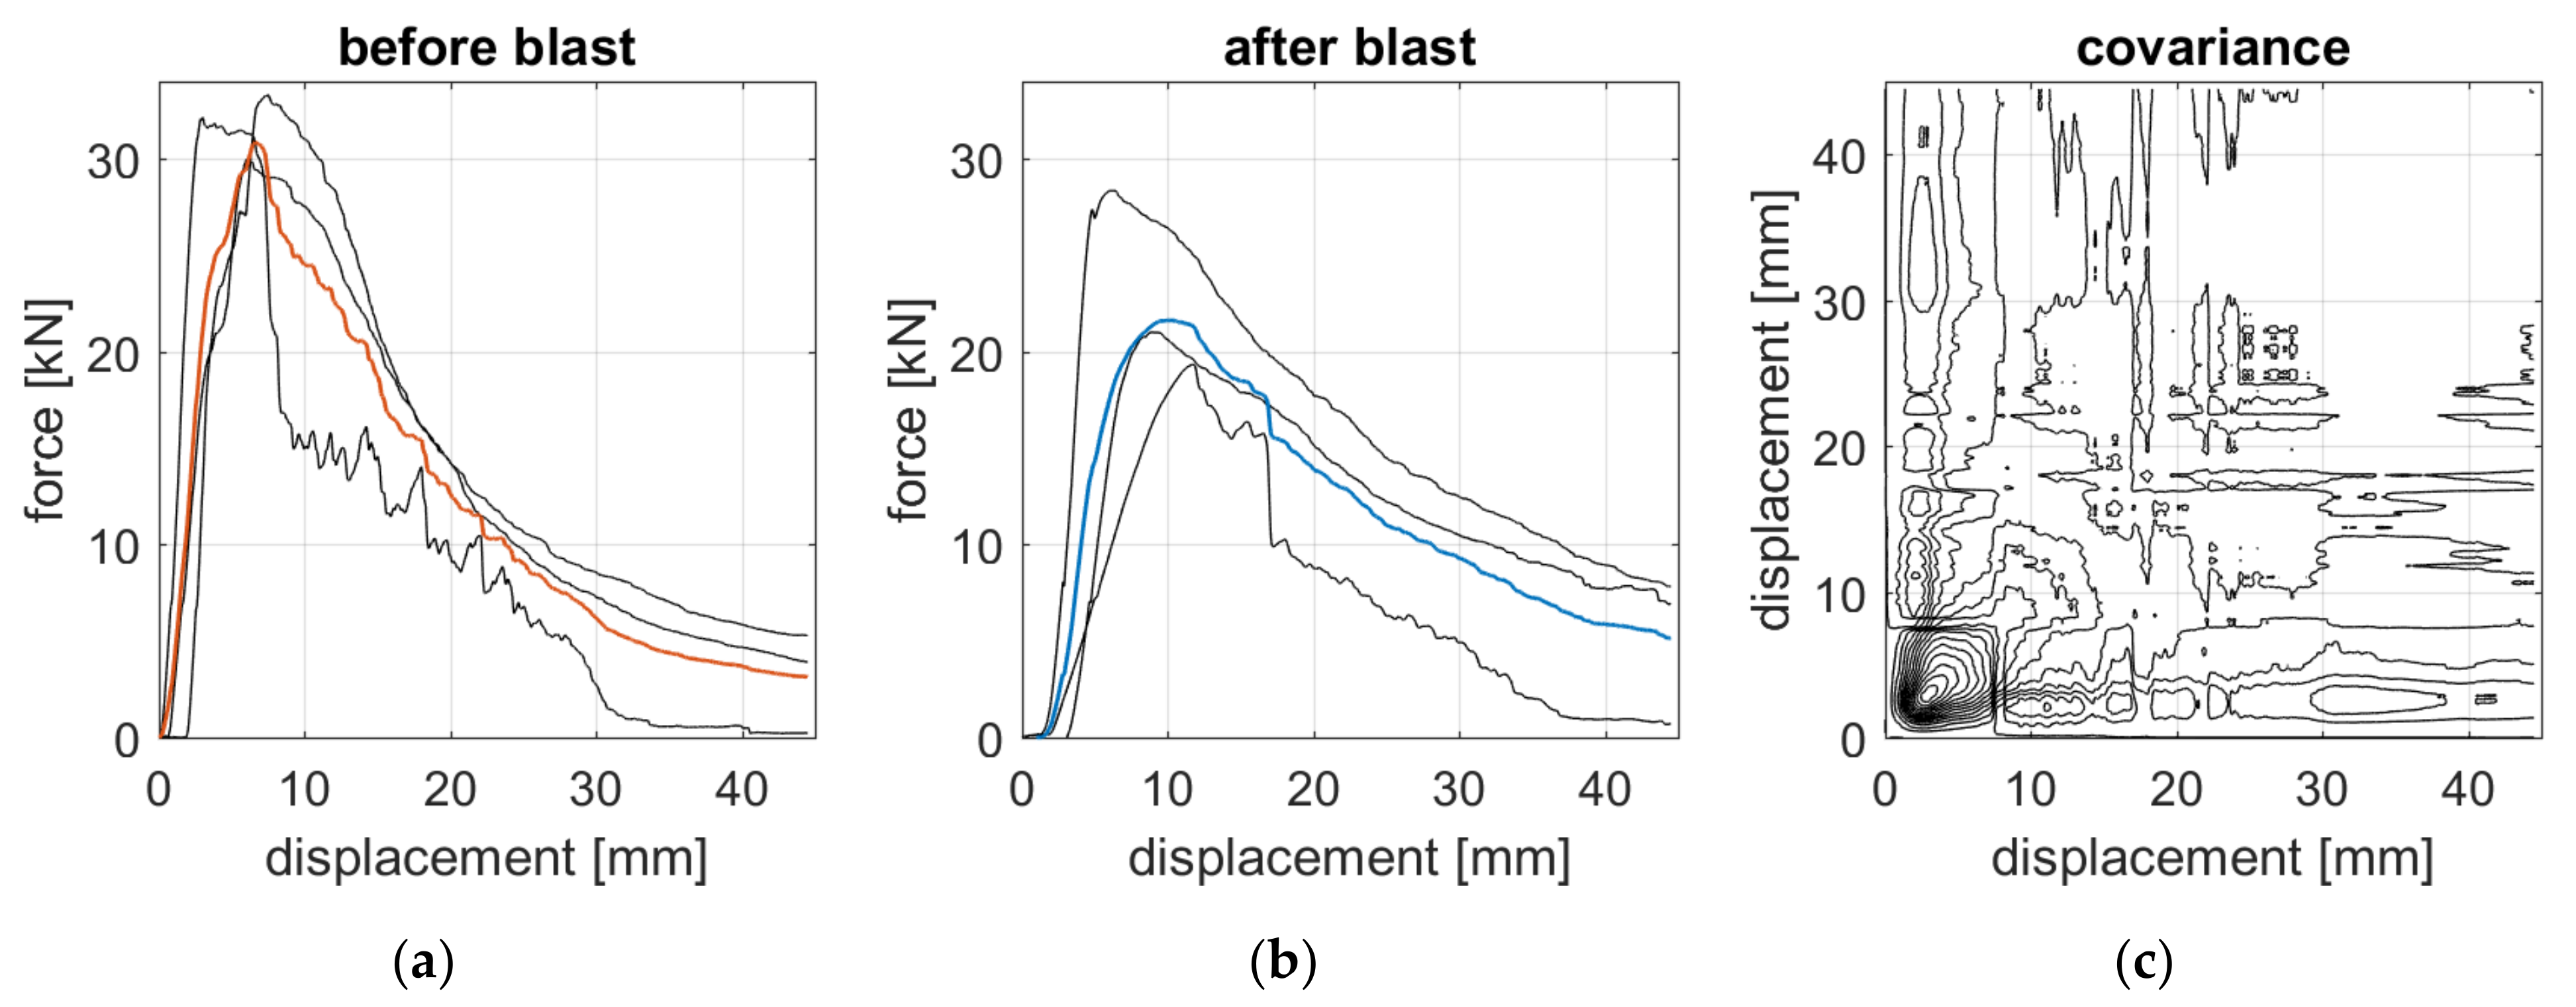
The measurement records in Figure 23 represent a continuous process which is measured at discrete points. Therefore, functional data analysis is a suitable tool for the representation and subsequent data testing [25]. Functional comparison is usually performed on data sets that can be transformed into curves. Several different methods can be used, and we will used local polynomial kernel smoothing [26]. For pairs (xi, yi), i = 1, …, n, where x denotes displacement, y is force and n stands for total number of measuring points, we assume that there exists regression model E(yi | xi) = f(xi), where E is the expectation operator. The function f(x) is estimated using the weighted sum of observation:
f x = i = 1 n W x , x i , h · y i
where W(x,xi,h) is a weight function that depends on observed displacements xi and on parameter h which affects smoothness of the resulting estimate [27].
To assess the similarity of both groups of measurements, i.e., before and after blast loading, we tested the hypothesis that the mean functions are the same against the alternative hypothesis that there is a displacement for which the curves differ. Therefore, we first calculated the mean functions and common covariance function of these functional data groups. Calculations are similar to the one-dimensional case [25]. The mean function for an individual group (k = 1, 2) is given by the formula:
μ k x = 1 n k i = 1 n k f i k x
and the covariance function is given by the formula.
γ x , u = 1 n 1 i = 1 2 j = 1 n i f i j x μ j x · f i j u μ i u
where n1 = n2 = 3, because we have three specimens measured before blast loading and three specimens measured after blast loading. Figure 23 shows individual curves together with the respective mean functions and their common covariance function.
As for the test of the statistical hypothesis, it proceeds in the same way as in the one-dimensional case. Therefore, we formulated the null hypothesis H: μ1(x) = μ2(x), and the alternative hypothesis A: μ1(x) ≠ μ2(x) for some x. The test statistic is then takes the following form
T x = μ 1 x μ 2 x 1 n 1 + 1 n 2 γ x , x
Test statistics T(x) follows Student’s t distribution with n − 2 degrees of freedom [28]. Since we have a very small number of curves, we use the permutation test to calculate the p-value [29]. The resulting p-value is equal to 0.10, which, compared to the significance level of 0.05, gives the result that the hypothesis H of equality of the mean functions cannot be rejected. Therefore, we did not prove that there is a difference between specimens exposed to blast loading and those without blast loading.
However, when evaluating the test, we have to take into account that the set of observations contains only six measurements, three in each group, which is a very small number. This was reflected in the calculation of the mean functions and covariance. With such a small number of observations, there was a strong influence of individual measurements, especially measurements with slightly different shape, such as specimens A2_3 and A2_4. It can be seen from Figure 23 that specimens without blast load require higher strength load for displacement, but at the same time, we can see that the covariance gains at the very beginning, i.e., at small displacement values, have a value that is quite high. This fact led to the nonrejection of the hypothesis of identical curves of strength with regard to the displacement for both groups of specimens.
In this case, it would be necessary to evaluate the influence of the quality of the material in order to be approximately the same within the individual groups, i.e., to ensure the homogeneity of the distribution of the fibers in the concrete. Most importantly, it would be necessary to perform measurements with a larger number of specimens in both groups, which would mitigate the effect of remote observations, which may be caused by the variety of fiber reinforced concrete and by other circumstances (e.g., humidity).

6. Discussion

Based on the results of measurement by the ultrasound pulse method, there were observable changes in the velocity of the ultrasound wave passing through the specimens after the previous blast load, i.e., there was an increase in the speed of the ultrasound waves. This phenomenon was not expected at the beginning of the experiment, but from the previous evaluation, it is clear that these changes are not negligible because of the high number of measuring points, where the increase in the velocity was demonstrated. The graphical evaluation of destructive laboratory tests shows a gradual decrease in strength after reaching the maximum load-bearing capacity, which affirms high stiffness of the material and its quality. Only for the specimen A2_3, was there a decrease in the velocity of the ultrasound wave after blast loading in all measuring points, i.e., there was no strengthening of SFRC. At the same time, from the evaluation of the decrease of the force depending on the increasing deflection, a faster decrease of the residual force after reaching the maximum bearing capacity is visible. It is possible to deduce a partial conclusion that there was a blast loading failure, and simultaneously the formation of cracks in the internal structure of the concrete slab was confirmed by NDT. After subsequent static load, and reaching Fmax, cracks opened and steel fibers were activated, which due to their hooked ends were not torn out from concrete but still were able to bear tensile stress. This result was expected for all three testing specimens, but was not proven.
The obtained measurement results show that in the case of SFRC slabs evaluated using the NDT ultrasound pulse method, after dynamic blast load, the cement matrix was strengthened in combination with a possible change in the orientation of steel fibers. As the SFRC recipe had a relatively high concentration of fibers, which is more often used for the production and assembly of military protective structures, rather than for civil engineering buildings, there could also be clusters of fibers, and this would subsequently affect the velocity of passage of ultrasound.
Another possible aspect explaining the increase in the velocity of ultrasound waves is, of course, the quality control of the production technology of the testing specimens themselves. This can be verified using other NDT methods such as radiography and computed tomography, which were not used in the initial phase of the experiment due to financial demands.
With regard to the designated concentration of steel fibers in concrete mixture, it is also possible to argue about the significance of the suggested dimensions of the specimens. The specimens with 60 mm of thickness can also affect the result of the ultrasound measurement with respect to the wavelength and the setup of the ultrasound device itself. In the subsequent phases of the experiment, further tests will be planned regarding the aspects described above, as they may have significantly influenced the obtained results.

7. Conclusions

From the achieved measurement results, it is possible to draw the following partial conclusions:
The ultrasound measurement method is very suitable for evaluating the degree of damage to the structures from SFRC exposed to a non-traditional dynamic load.
For the complexity of the methodology of evaluation of military structures built from the SFRC, it is necessary to perform more experiments with a higher number of specimens and to determine the extent of influence of specimen thickness, based on a non-uniform trend of ultrasonic velocity change before and after blast load.
For more accurate conclusions, it would be appropriate to use other NDT methods, i.e., the radiography for visual inspection of the uniformity of the distribution of steel fibers, which proved to be a very important parameter due to the selected high concentrations of steel fibers in the tested SFRC.
As already mentioned by the authors, this is a small part of the experiment aimed at creating a comprehensive methodology for the evaluation of military protective structures build from the SFRC in situ. Other planned measurements will be carried out based on the presented outputs.

Author Contributions

Conceptualization, E.Z. and T.K.; methodology, E.Z. and T.K.; software, B.D., K.H. and E.Z.; validation, E.Z., J.Š. and T.K.; formal analysis K.H., T.K. and B.D.; investigation, E.Z. and T.K.; resources, T.K. and E.Z.; data curation, E.Z., T.K., J.Š., K.H. and B.D.; writing—original draft preparation, E.Z., B.D., K.H. and T.K.; writing—review and editing, E.Z., T.K., J.Š., K.H. and P.D.; visualization, E.Z. and T.K.; supervision, J.Š.; project administration, E.Z. All authors have read and agreed to the published version of the manuscript.

Funding

This research received no external funding.

Acknowledgments

The presented work has been prepared with the support of the Ministry of Defence of the Czech Republic, Partial Project for Institutional Development, VARoPs-Military Autonomous and Robotic Systems.

Conflicts of Interest

The authors declare no conflict of interest.

References

  1. Maňas, P. The Protection of Critical Infrastructure Objects—Technical Principles. In Durability of Critical Infrastructure, Monitoring and Testing; Springer: Singapore, 2017; pp. 239–248. [Google Scholar]
  2. Leitner, B.; Dvořák, Z. Special Railway Crane PKP 25/20i-Dynamics Loads and a Fatigue Life Prediction of its Load-Bearing Structure. In Proceedings of the 17th International Conference on Transport Means 2013, Kaunas, Lithuania, 24–25 October 2013; pp. 262–265. [Google Scholar]
  3. Kaplan, V.; Školoud, M. Evaluation of the Technical State of Construction Structures. Procedia Eng. 2016, 134, 394–401. [Google Scholar] [CrossRef] [Green Version]
  4. Epasto, G.; Distefano, F.; Mozafari, H.; Linul, E.; Crupi, V. Nondestructive Evaluation of Aluminium Foam Panels Subjected to Impact Loading. Appl. Sci. 2021, 11, 1148. [Google Scholar] [CrossRef]
  5. Zezulová, E.; Hasilová, K.; Komárková, T.; Stoniš, P.; Štoller, J.; Anton, O. NDT Methods Suitable for Evaluation the Condition of Military Fortification Construction in the Field. Appl. Sci. 2020, 10, 8161. [Google Scholar] [CrossRef]
  6. Brandt, A.M. Fibre reinforced cement-based (FRC) composites after over 40 years of development in building and civil engineering. Compos. Struct. 2008, 86, 3–9. [Google Scholar] [CrossRef]
  7. Bartoš, J.M.P. Fibre Reinforced Concrete. Beton: Technologie, Konstrukce, Sanace; Czech Concrete Society: Praha, Czech, 2012; Volume 2012, pp. 69–77. ISSN 1213-3116. Available online: https://www.betontks.cz/sites/default/files/2012-7-68.pdf (accessed on 21 August 2021).
  8. Sherkar, P.; Whittaker, A.S.; Aref, A.J. Modeling the Effects of Detonations of High Explosives to Inform Blast-Resistant Design; Technical Report MCEER-10-0009; University at Buffalo, State University of New York: Buffalo, NY, USA, 2010. [Google Scholar]
  9. Puryear, J.M.H.; Stevens, D.J.; Marchand, K.A.; Williamson, E.B.; Crane, C.K. ALE Modeling of Explosive Detonation on or near Reinforced-Concrete Columns. In Proceedings of the 12th International LS-DYNA Users Conference, Detroit, MI, USA, 3–5 June 2012; pp. 1–11. [Google Scholar]
  10. LS-DYNA Keyword User’s Manual, Volume I, 05/06/21 (r:13750); Livermore Software Technology Corporation: Livermore, CA, USA, 2021.
  11. LS-DYNA Keyword User’s Manual, Volume II Material models, 04/30/21 (r:13740); Livermore Software Technology Corporation (LSTC): Livermore, CA, USA, 2021.
  12. Schwer, L. The Winfrith Concrete Model: Beauty or Beast? Insights into the Winfrith Concrete Model. In Proceedings of the 8th European LS-DYNA Users Conference, Strasbourg, France, 23–24 May 2011; Livermore Technology Software Corporation: Livermore, CA, USA, 2011. [Google Scholar]
  13. Schwer, L. Modelin Rebar: The Forgottern Sister in Reinforced Concrete Modeling. In Proceedings of the 13th International LS-DYNA Conference, Detroit, MI, USA, 8–10 June 2014; LSTC: Wien, Austria, 2014. [Google Scholar]
  14. LS-DYNA, Theory Manual; Livemore Software Technology Corporation: Livemore, CA, USA, 2015.
  15. Key Engineering Materials. Key Eng. Mater. 2009, 594–595, 433–438. [CrossRef]
  16. Lian, C.; Zhuge, Y.; Beecham, S. The relationship between porosity and strength for porous concrete. Constr. Build. Mater. 2011, 25, 4294–4298. [Google Scholar] [CrossRef]
  17. Xu, H.; Wen, H. A computational constitutive model for concrete subjected to dynamic loadings. Int. J. Impact Eng. 2016, 91, 116–125. [Google Scholar] [CrossRef]
  18. Herrmann, W.A. Constitutive Equation for the Dynamic Compaction of Ductile Porous Materials. J. Appl. Phys. 1969, 40, 2490–2499. [Google Scholar] [CrossRef]
  19. Czech Technical Standard 73 1371 Ultrasound Pulse Method of Concrete Testing; ÚNM Publishing: Prague, Czech Republic, 1982.
  20. Liu, D.; Šavija, B.; Smith, G.E.; Flewitt, P.; Lowe, T.; Schlangen, E. Towards understanding the influence of porosity on mechanical and fracture behaviour of quasi-brittle materials: Experiments and modelling. Int. J. Fract. 2017, 205, 57–72. [Google Scholar] [CrossRef] [PubMed] [Green Version]
  21. Ridengaoqier, E.; Hatanaka, S. Prediction of porosity of pervious concrete based on its dynamic elastic modulus. Results Mater. 2021, 10, 100192. [Google Scholar] [CrossRef]
  22. Alam, A.; Haselbach, L. Estimating the Modulus of Elasticity of Pervious Concrete Based on Porosity. Adv. Civ. Eng. Mater. 2014, 3, 256–269. [Google Scholar] [CrossRef]
  23. Zezulová, E.; Hejmal, Z.; Stoniš, P.; Komárková, T.; Holub, J. The Exponential Probe Measurement Using the Direct Ultra-Sonic Pass-Through Method. In Proceedings of the 2021 International Conference on Military Technologies (ICMT), Brno, Czech Republic, 8–11 June 2021; IEEE: Brno, Czech Republic, 2021; Volume 2021, pp. 8–23, ISBN 978-1-6654-3724-0. [Google Scholar]
  24. Zezulová, E.; Kroupa, L. On Diagnostics of Military Fortification Constructions. In Proceedings of the Challenges to National Defence in Contemporary Geopolitical Situation (CNDCGS’2020), Vilnius, Lithuania, 14–16 October 2020; General Jonas Žemaitis Military Academy of Lithuania: Vilnius, Lithuania, 2020; Volume 2, pp. 32–42. [Google Scholar]
  25. Zhang, J.-T. Analysis of Variance for Functional Data; CRC Press: Boca Raton, FL, USA, 2013. [Google Scholar]
  26. Horová, I.; Koláček, J.; Zelinka, J. Kernel Smoothing in Matlab: Theory and Practice of Kernel Smoothing; World Scientific: Singapore, 2012. [Google Scholar]
  27. Hayfield, T.; Racine, J.S. Nonparametric Econometrics: The np Package. J. Stat. Softw. 2008, 27, 1–32. Available online: www.jstatsoft.org/v27/i05/ (accessed on 26 January 2021). [CrossRef] [Green Version]
  28. Cuevas, A.; Febrero-Bande, M.; Fraiman, R. An anova test for functional data. Comput. Stat. Data Anal. 2004, 47, 111–122. [Google Scholar] [CrossRef]
  29. Wilcox, R.R. Introduction to Robust Estimation and Hypothesis Testing, 4th ed.; Academic Press: Cambridge, MA, USA, 2017. [Google Scholar]
Figure 1. CAD models: (a) The mesh of the concrete slab: 700 × 700 × 6 mm; (b) The supporting frame: outer dimensions 700 × 700 mm, inner dimensions 400 × 400 mm.
Applsci 11 08759 g001
Figure 2. Explicitly modelled beam reinforcement of MAT_PLSTIC_KINEMATIC, constrained in 700 × 700 × 60 mm concrete mesh.
Applsci 11 08759 g002
Figure 3. The ALE mesh of the dimensions 850 × 850 × 1400 mm: (a) Filled with air (green) encapsulating the meshed slab (red); (b) Filled with explosive material (blue) in the 600 mm distance from the slab (black).
Applsci 11 08759 g003
Figure 4. Reverse side of a damaged slab from the batch A2: (a) Cracks; (b) Cracks and crack opening strain color contours.
Applsci 11 08759 g004
Figure 5. Experiment setup: (a) Stand with suspended explosive of 600 g TNT; (b) Stand with suspended explosive of 275 g TNT, 58 cm above the specimen.
Applsci 11 08759 g005
Figure 6. Drawing of the stand and the specimen.
Applsci 11 08759 g006
Figure 7. Assumption of the formation of longitudinal and transverse cracks, after blast load, affecting the velocity of passage of ultrasound waves through the specimen.
Applsci 11 08759 g007
Figure 8. Graph of differences in measured velocities [m·s−1] of ultrasound wave for specimen A2_1 before and after blast load of 475 g TNT.
Applsci 11 08759 g008
Figure 9. Schema of differences in measured velocities [m·s−1] of ultrasound wave for specimen A2_3 before and after blast load of 600 g TNT: acceleration (red color)–52.9% of points.
Applsci 11 08759 g009
Figure 10. Graph of differences in measured velocities [m·s−1] of ultrasound wave for specimen A2_2 before and after blast load of 350 g TNT.
Applsci 11 08759 g010
Figure 11. Schema of differences in measured velocities [m·s−1] of ultrasound waves for specimen A2_2 before and after blast load of 350 g TNT: acceleration (red color)–42.9% of points.
Applsci 11 08759 g011
Figure 12. Graph of differences in measured velocities [m·s−1] of ultrasound wave for specimen A2_3 before and after blast load of 600 g TNT.
Applsci 11 08759 g012
Figure 13. Schema of differences in measured velocities [m·s−1] of ultrasound waves for specimen A2_3 before and after blast load of 600 g TNT: acceleration (red color)–no point; no change (green color)–8 points; deceleration (blue color)–41 points.
Applsci 11 08759 g013
Figure 14. Pressure-volume response for concrete. Reprinted with the permission from [17], 2021, Elsevier.
Applsci 11 08759 g014
Figure 15. Specimen A2_5 loaded in a laboratory.
Applsci 11 08759 g015
Figure 16. Specimen A2_5 after load test with cracks development typical after static loading.
Applsci 11 08759 g016
Figure 17. Development of cracks in the specimen A2_3 after dynamic blast load by 600 g TNT.
Applsci 11 08759 g017
Figure 18. Assumed damage to batch of specimens A2, made from SFRC, based on numerical simulation; cracks and deformation of the material ion the reverse side.
Applsci 11 08759 g018
Figure 19. Graphic evaluation of laboratory tests of static point loading of the batch of specimens A2. Specimens A2_1 to A2_3 were tested after blast load, specimens A2_4 to A2_6 were tested before blast load.
Applsci 11 08759 g019
Figure 20. Graphic evaluation of laboratory tests of static point loading of the batch of specimens A2 tested after 251 days after production.
Applsci 11 08759 g020
Figure 21. Graphic evaluation of laboratory tests of static point loading of the batch of specimens A2 tested after blast load.
Applsci 11 08759 g021
Figure 22. Graph of average values of monitored quantities for both sets of slabs made from SFRC.
Applsci 11 08759 g022
Figure 23. Individual curves together with their mean function and common covariance function: (a) Mean function of specimens before blast loading; (b) Mean function of specimens after blast loading; (c) Contour plot of common covariance function of the two groups.
Applsci 11 08759 g023
Table 1. Material model card used in LS-Dyna for Winfrith Concrete for batch A2 (kg, mm, ms, kN, GPa).
MAT_WINFRITH_CONCRETE
midrotmprucsutsfeasize
12.37 × 10−6400.20.0690.00590.00055
eysehuelongrateconmconlcont
0.000.000.000.000.0−50.00.0
Table 2. Material card for fiber reinforcement (kg, mm, ms, kN, GPa).
MAT_PLSTIC_KINEMATIC
midroeprsigyetanbetasrcsrpfsvp
37.86 × 10−6203.00.30.953.00.00.00.00.450.0
Table 3. Mass of explosives for batch A2.
BatchMaterialMass of Explosive
[g]
A2SFRC450
Table 4. Overview of testing for a batch of specimens A2.
Batch
Material
SpecimenMass of Explosive
[g]
RadiographyUltrasound
Measurement
Laboratory
Testing 1
A2
SFRC
A2_1475YesBefore and after
blast
After blast
A2_2350YesBefore and after
blast
After blast
A2_3600YesBefore and after
blast
After blast
A2_4No28 days after
production
28 days after
production
A2_5No28 days after
production
28 days after
production
A2_6No28 days after
production
28 days after
production
1 Determination of the strength along the circumference of specimen for ball extrusion.
Table 5. Load weight values for field tests of SFRC slabs.
Batch
Material
SpecimenMass of Explosive
[g]
A2
SFRC
A2_1475
A2_2350
A2_3600
Publisher’s Note: MDPI stays neutral with regard to jurisdictional claims in published maps and institutional affiliations.