
Determination of the Conservation State of Some Documents Written on Cellulosic Support in the Poni-Cernătescu Museum, Iași City in Romania

 ,
,  ,
,  and
and
Abstract
:1. Introduction
2. Materials and Methods
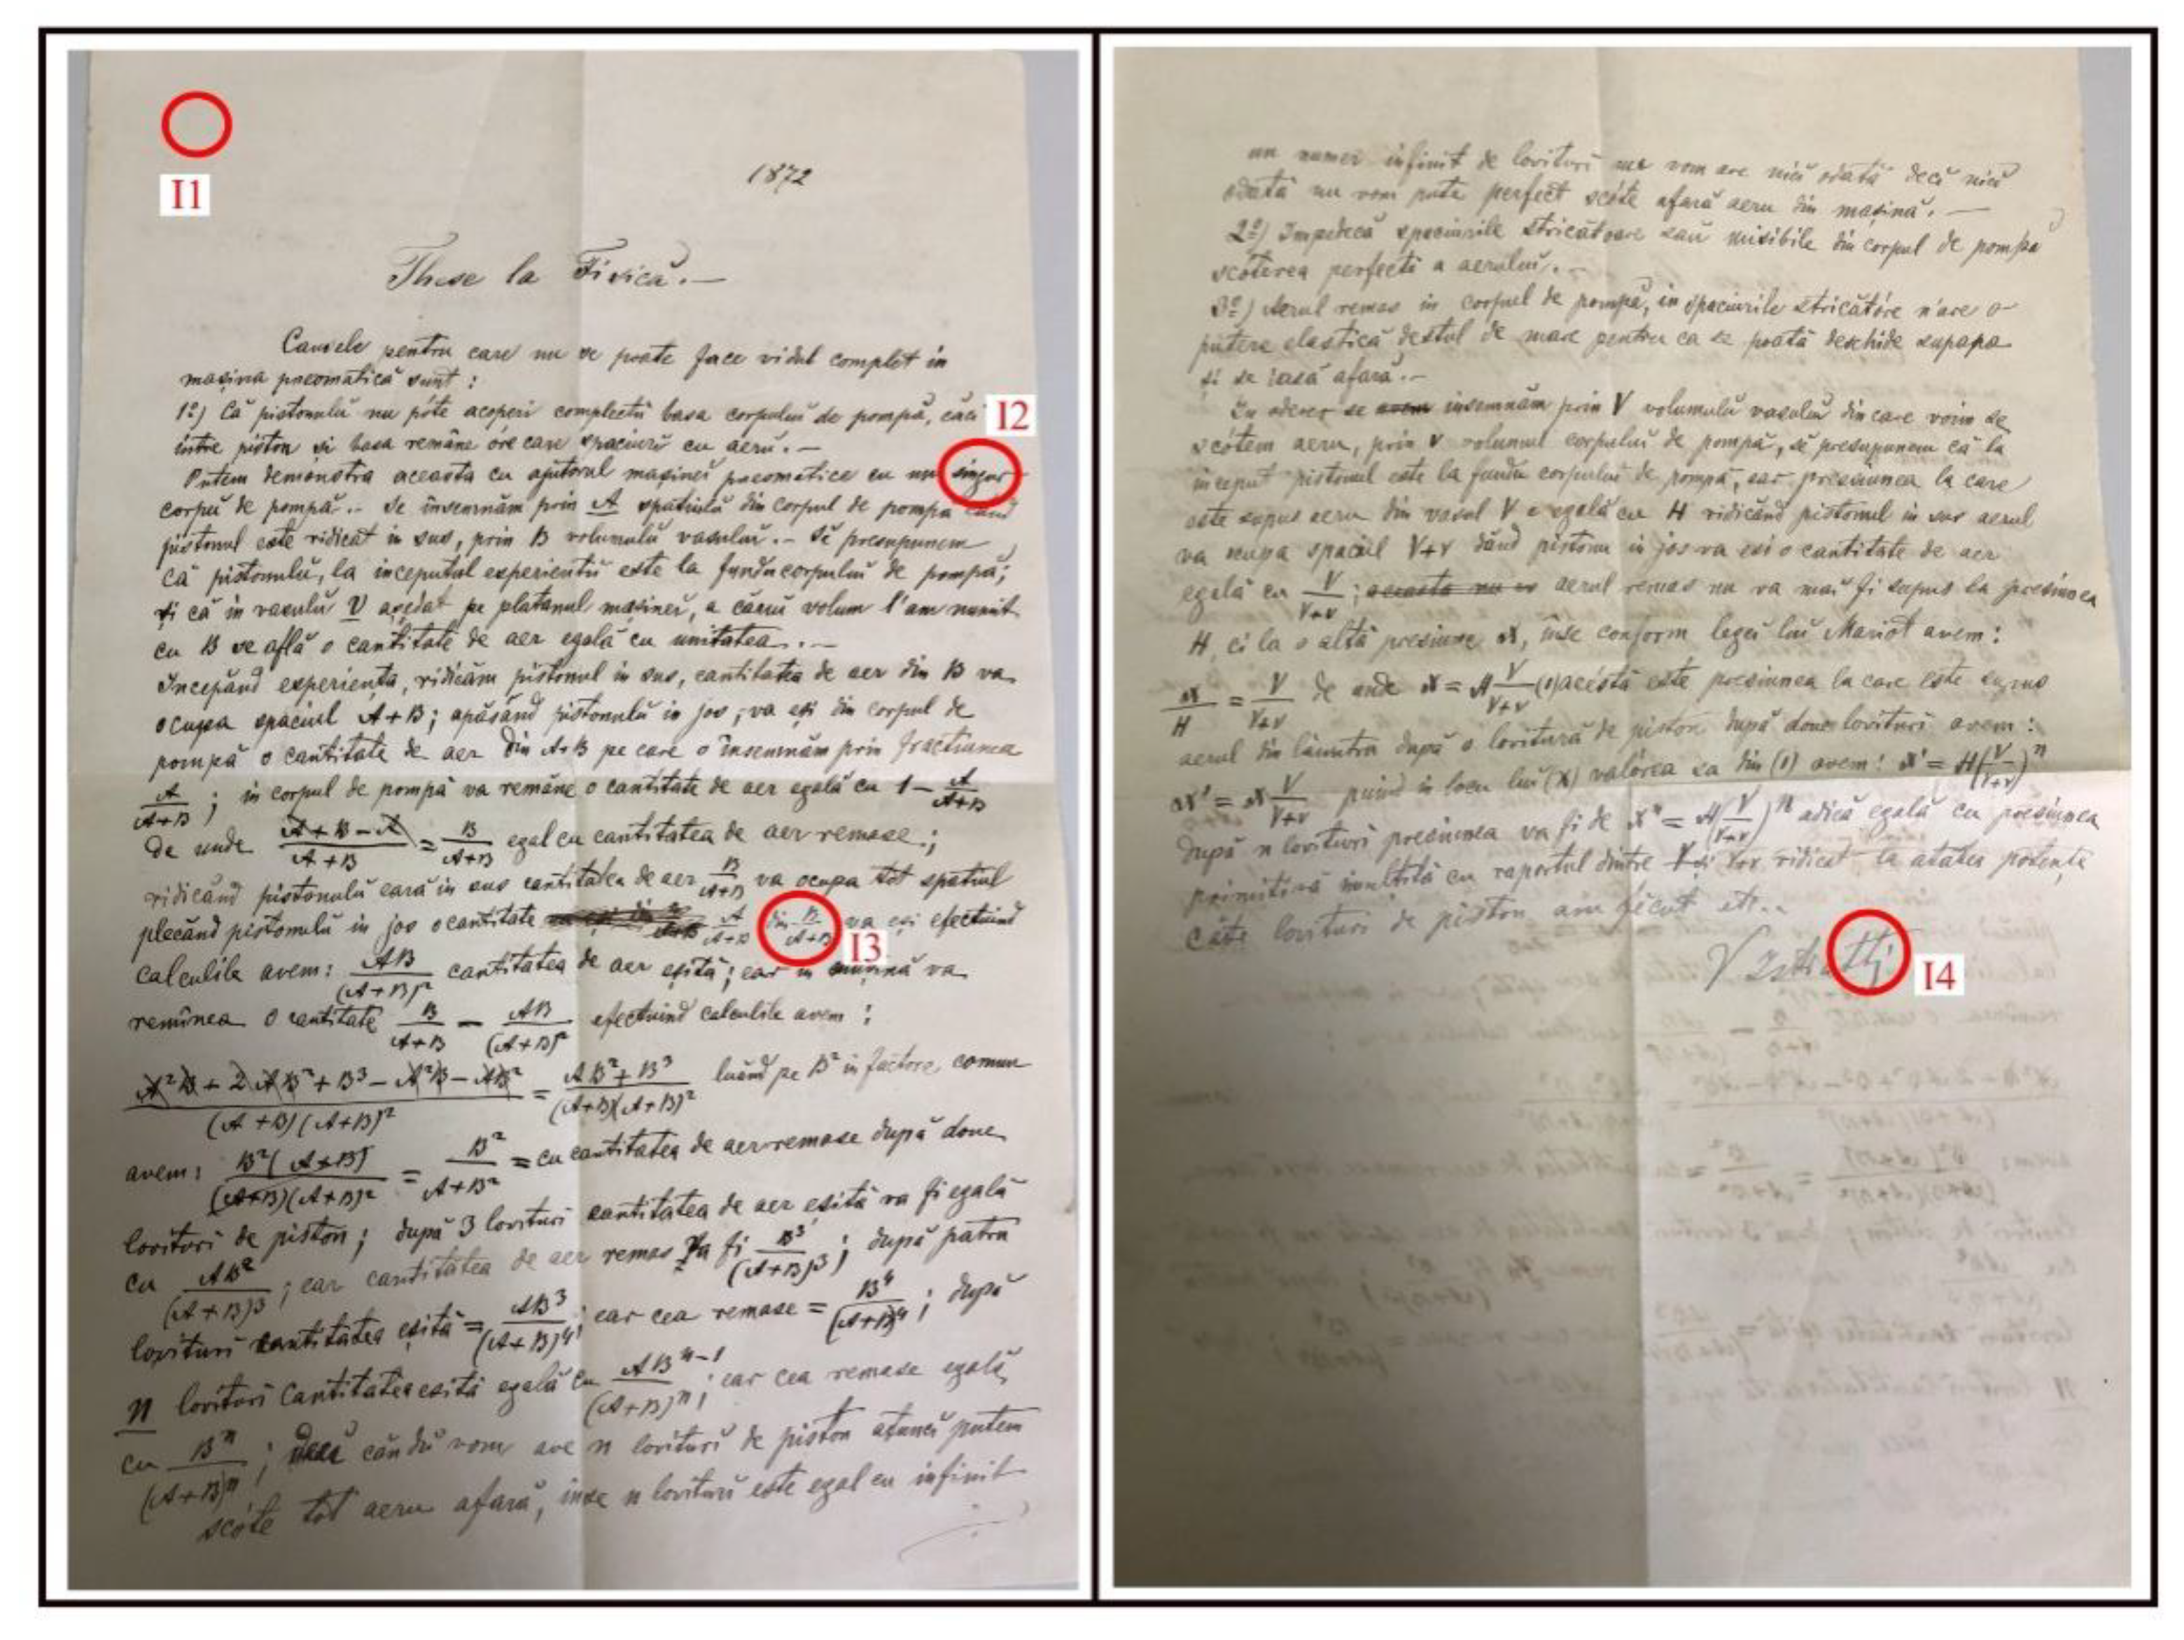
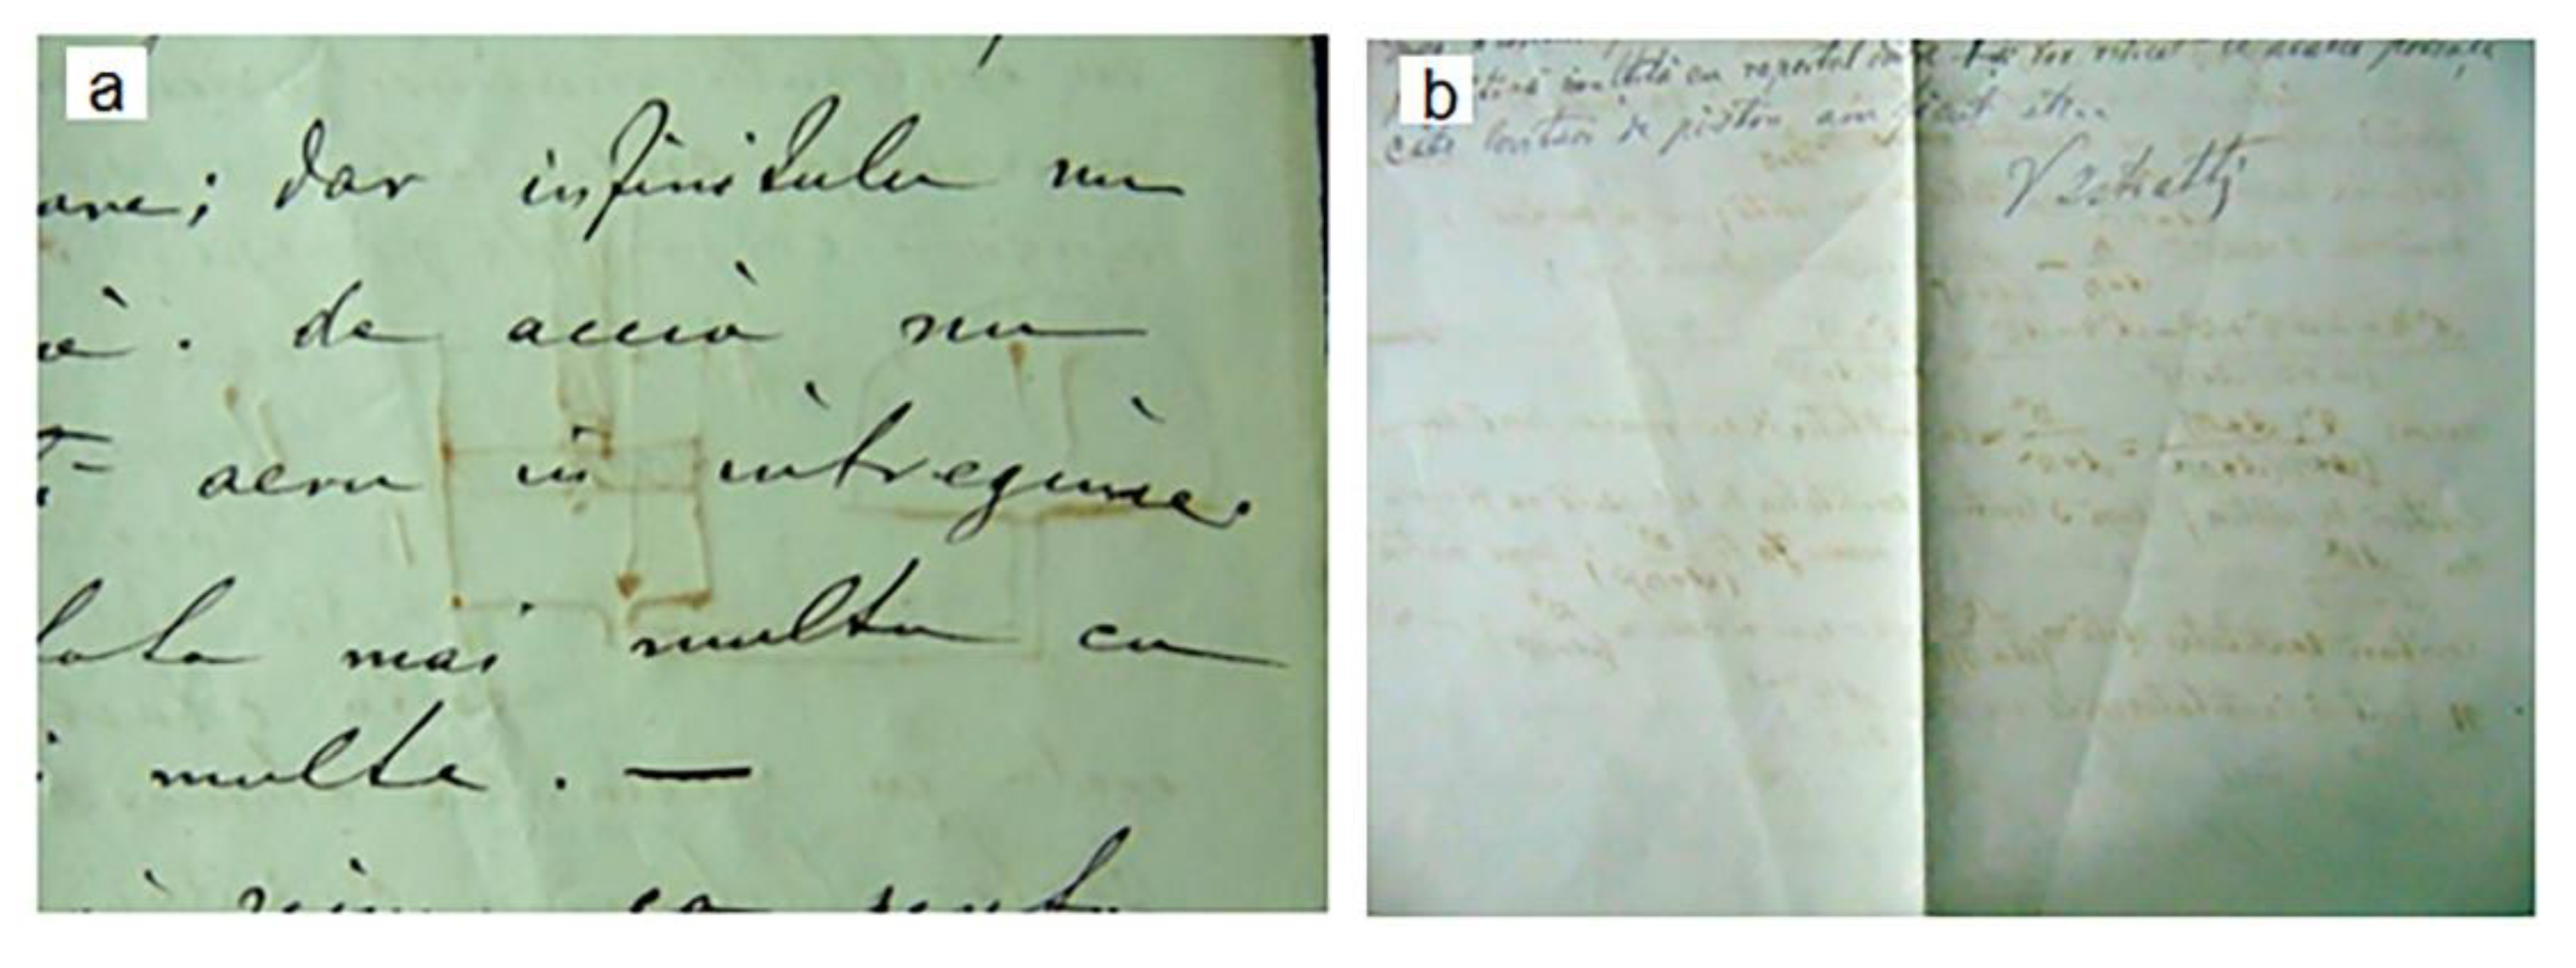
2.1. Materials
2.2. Analytical Methods
2.2.1. OM
2.2.2. SEM-EDX
2.2.3. Micro-FTIR
2.2.4. FT-Raman
2.2.5. Chemometric Analysis of FTIR Data
3. Results and Discussions
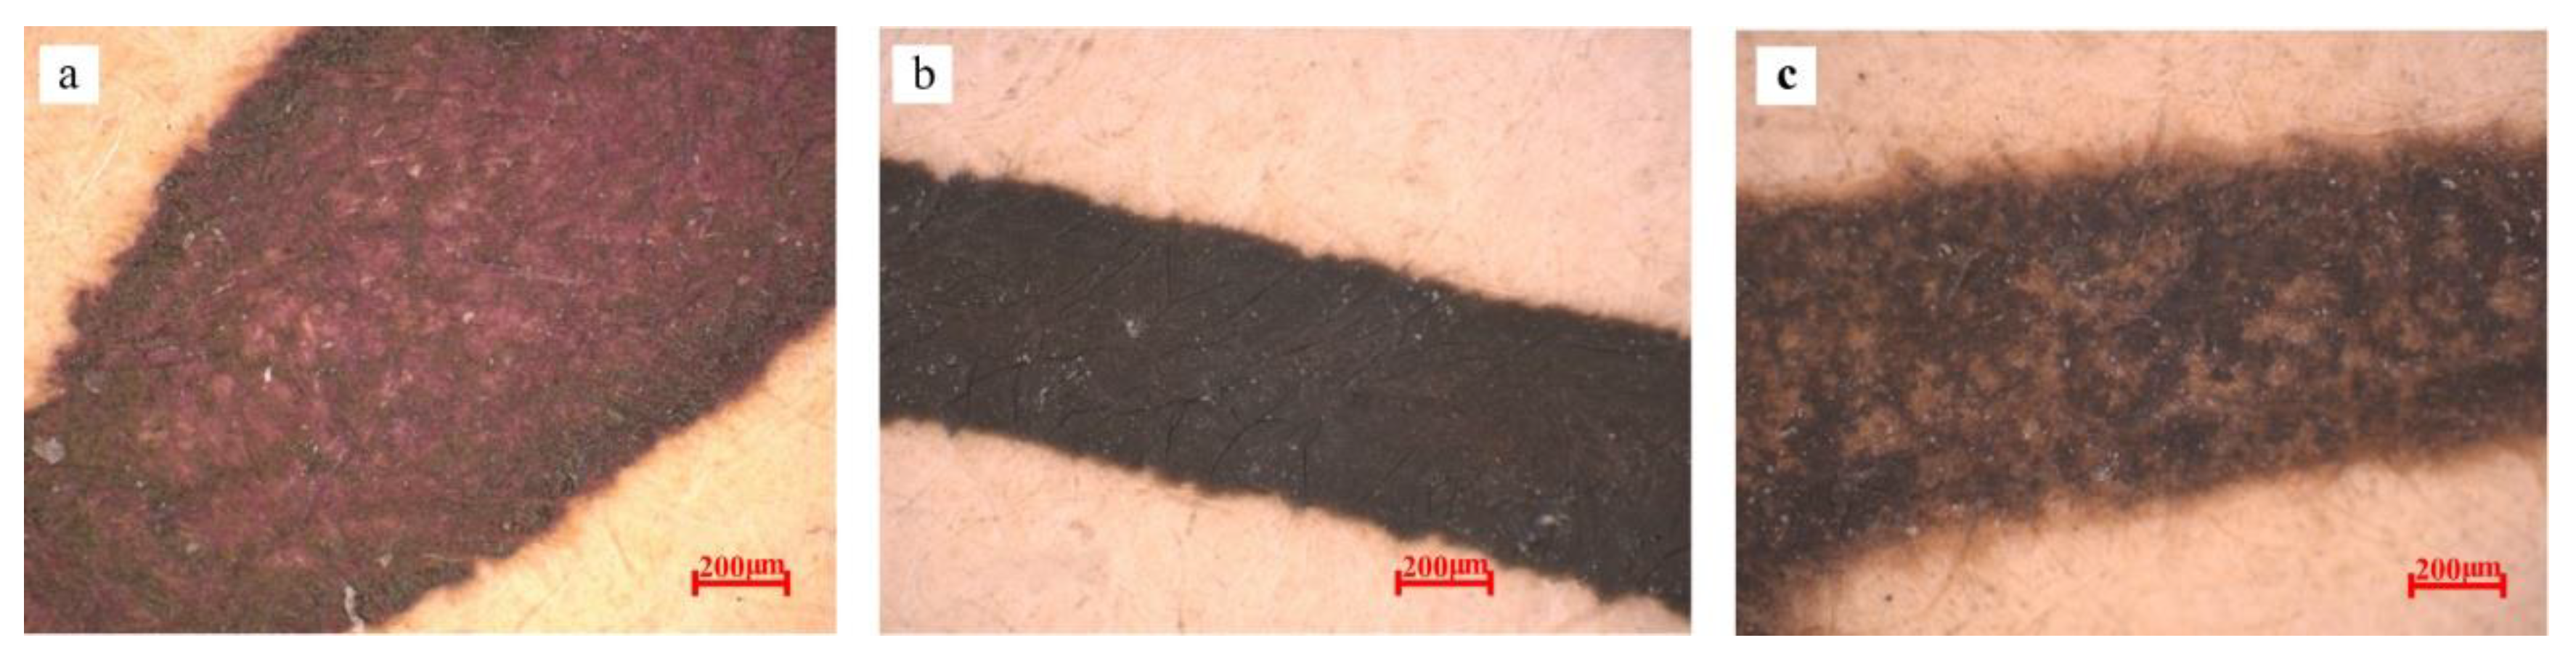
3.1. OM Analysis
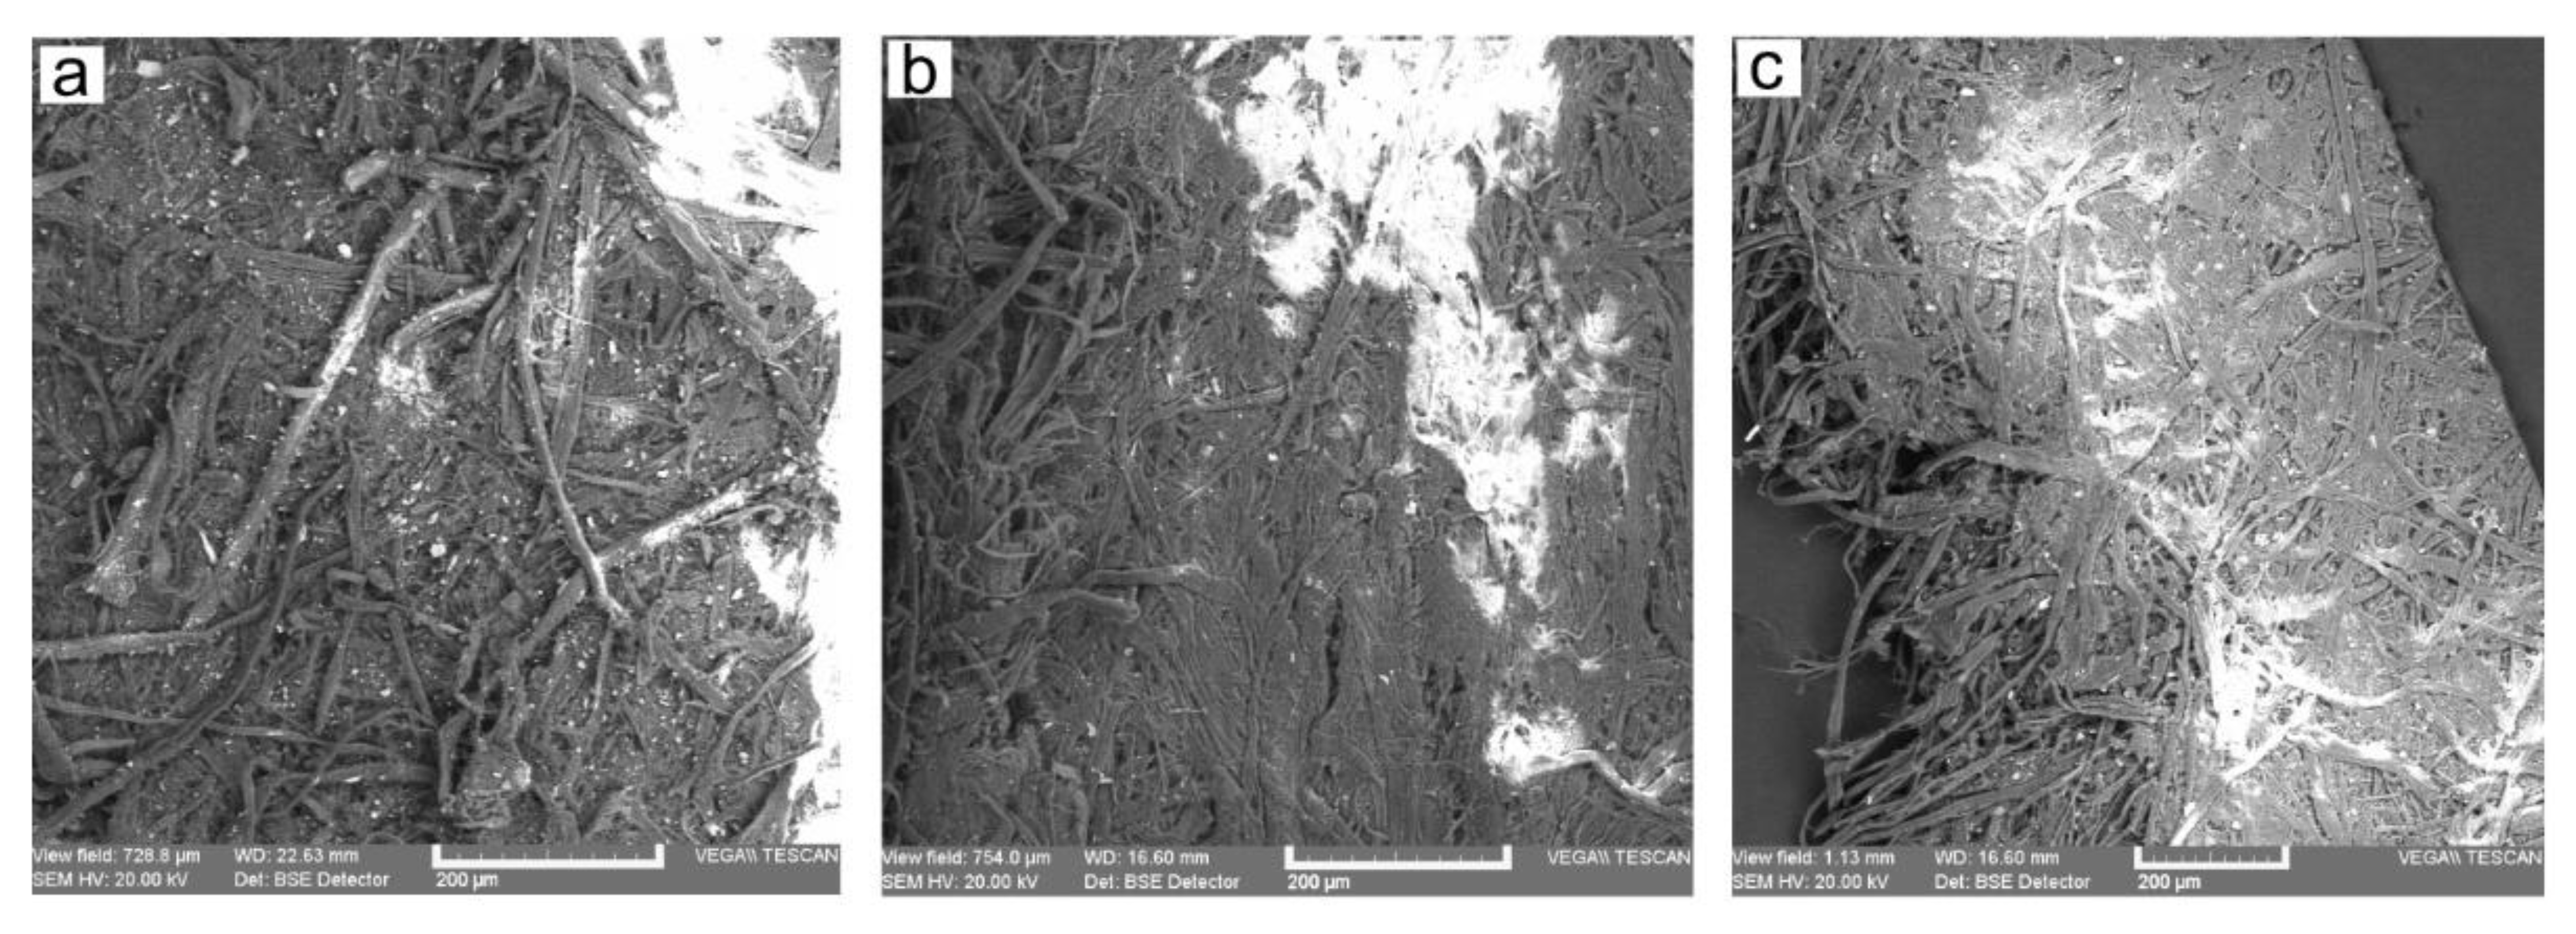
3.2. SEM Analysis
- -
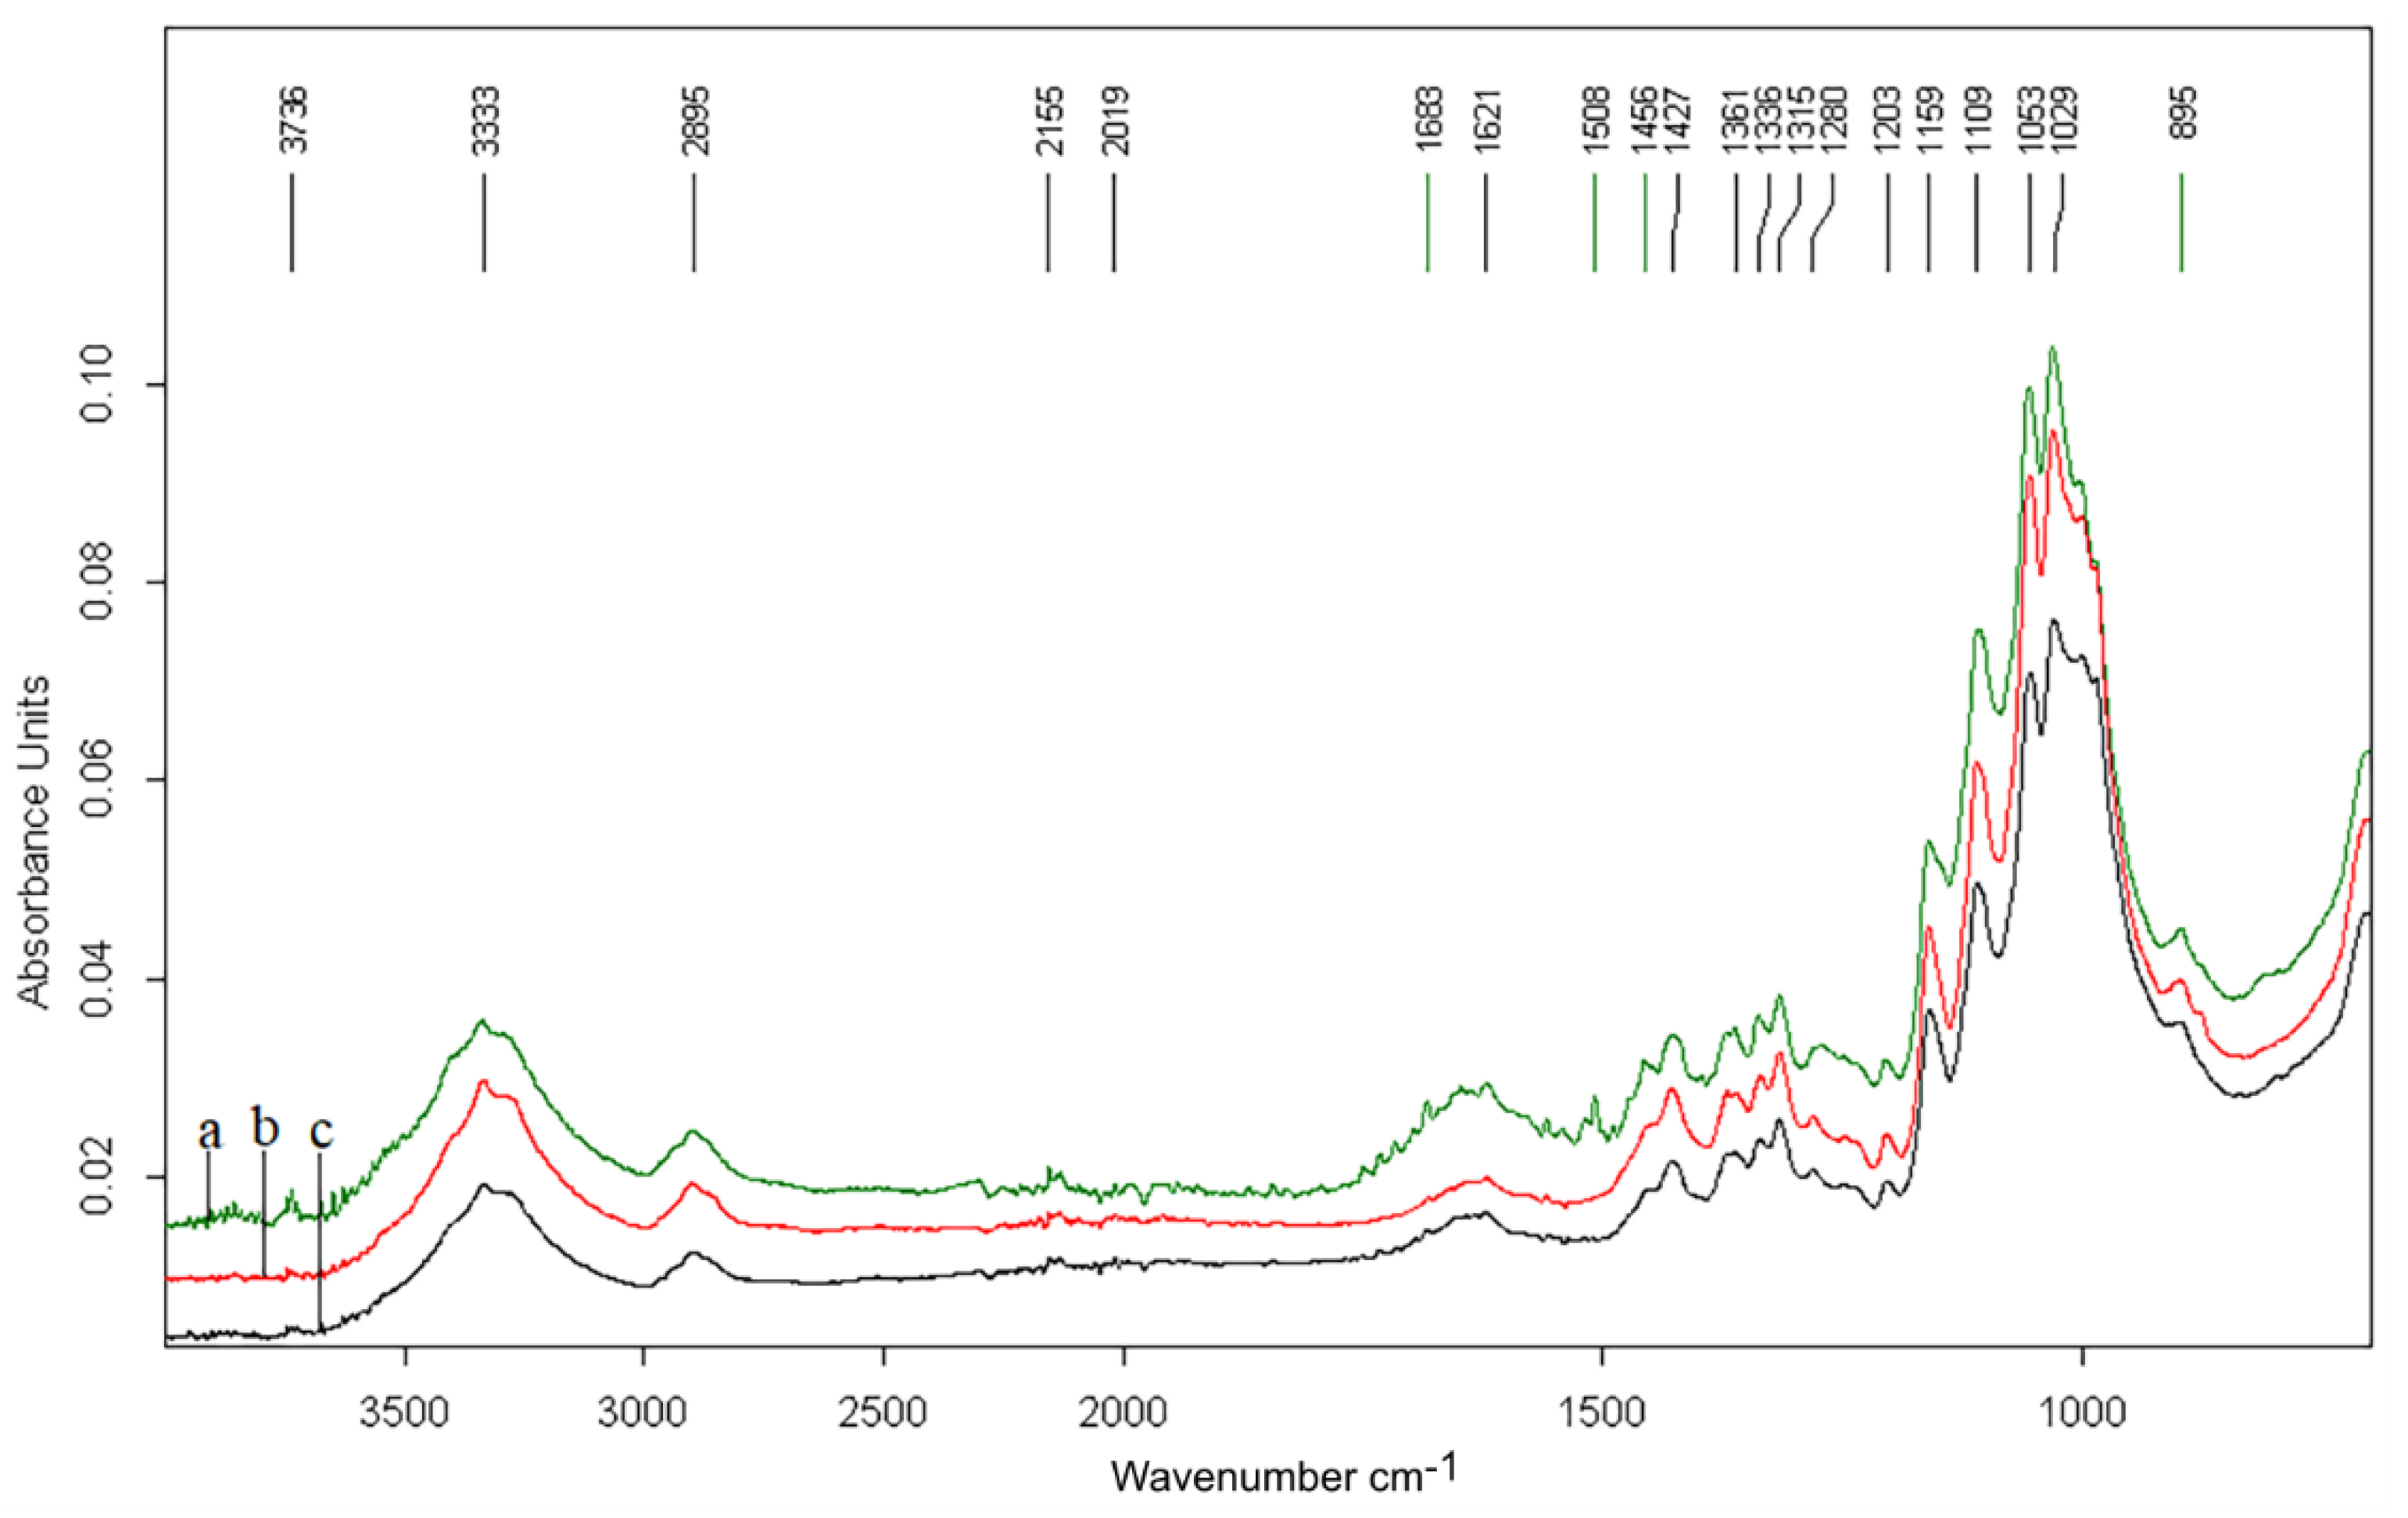
- The lack of Mg in sample S1 is proof of the fact that the filling material does not contain talc, a material used to achieve an opaque and smooth paper surface [14]. Calcium carbonate (CaCO3) was used as a filler, which was also confirmed by the characteristic band within the 1400–1500 cm−1 range revealed by micro-FTIR analysis (Figure 7). Calcium carbonate stabilizes the carboxylic groups of cellulose and makes it possible to increase paper aging stability [25].
- -
- The presence of Si and Al accounts for the use of kaolinite (Al4[(OH)8|Si4O10]) to increase paper opaqueness and whiteness, which was also confirmed by the 1029 cm−1 peak. Sample S1 has the smallest amount of kaolinite.
- -
- Documents S2 and S3 were treated with calcium hydroxide and with lye/caustic soda (NaOH), which is accounted for by the Ca and Na contents.
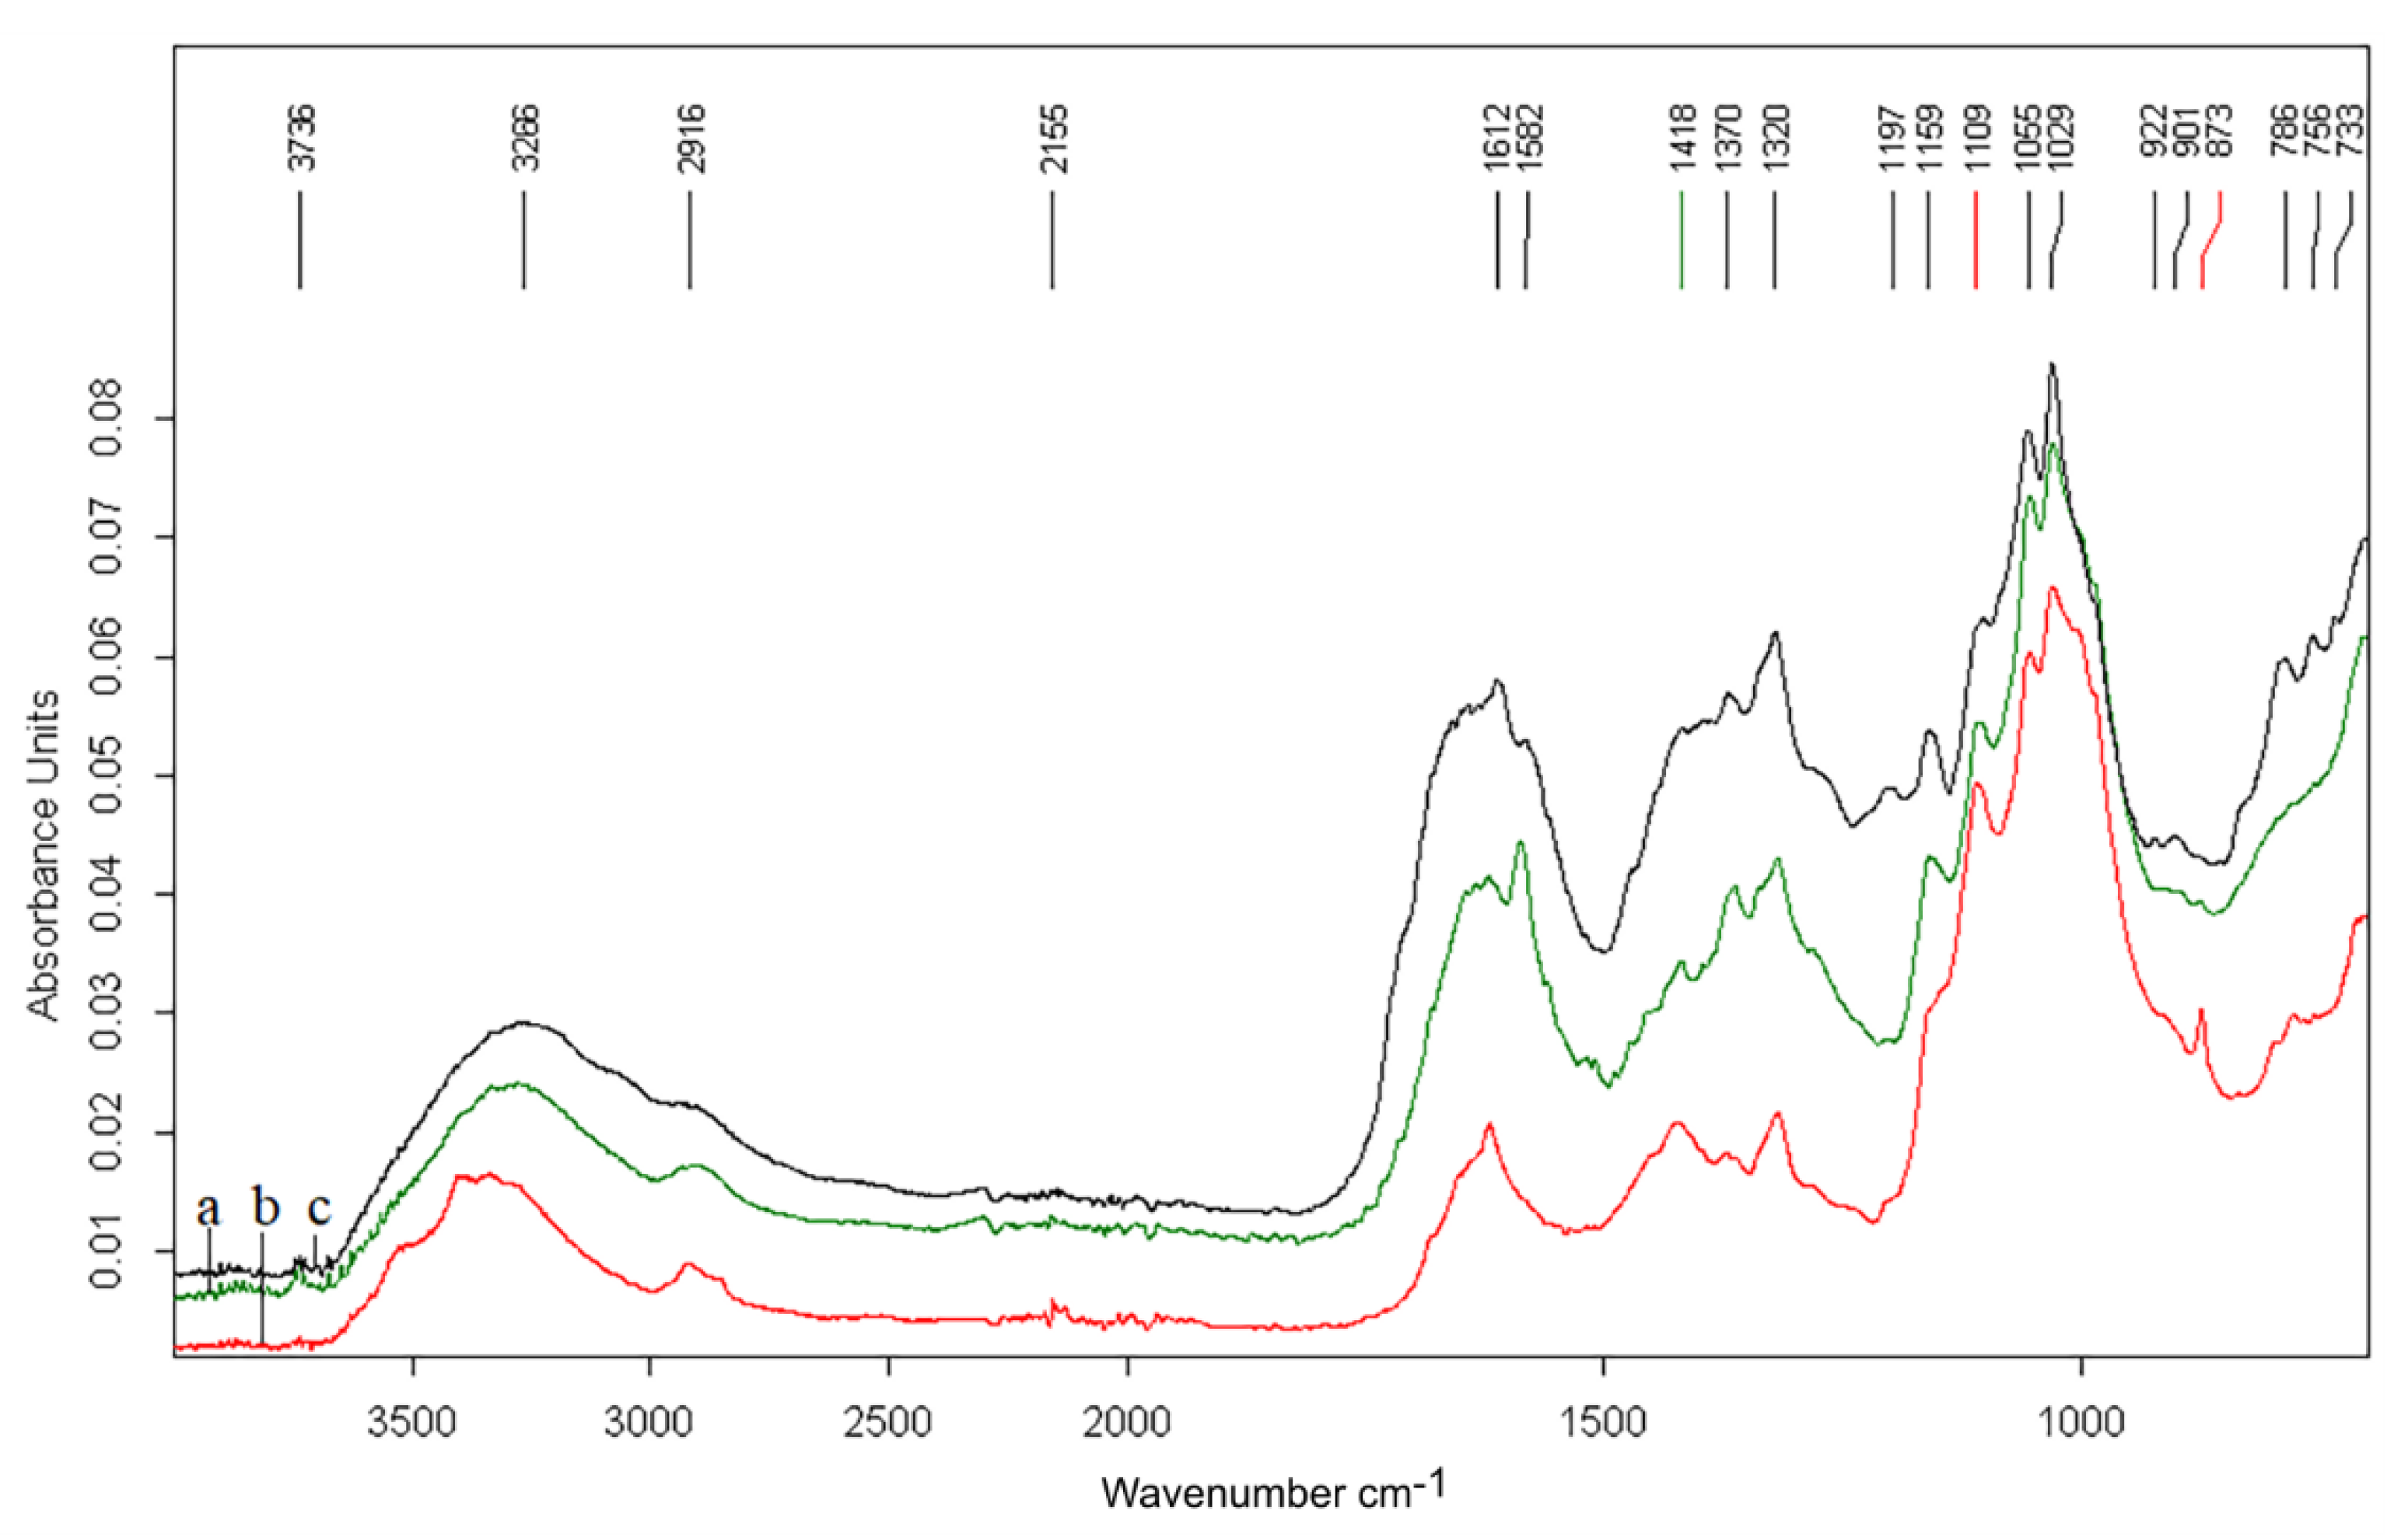
3.3. Micro-FTIR
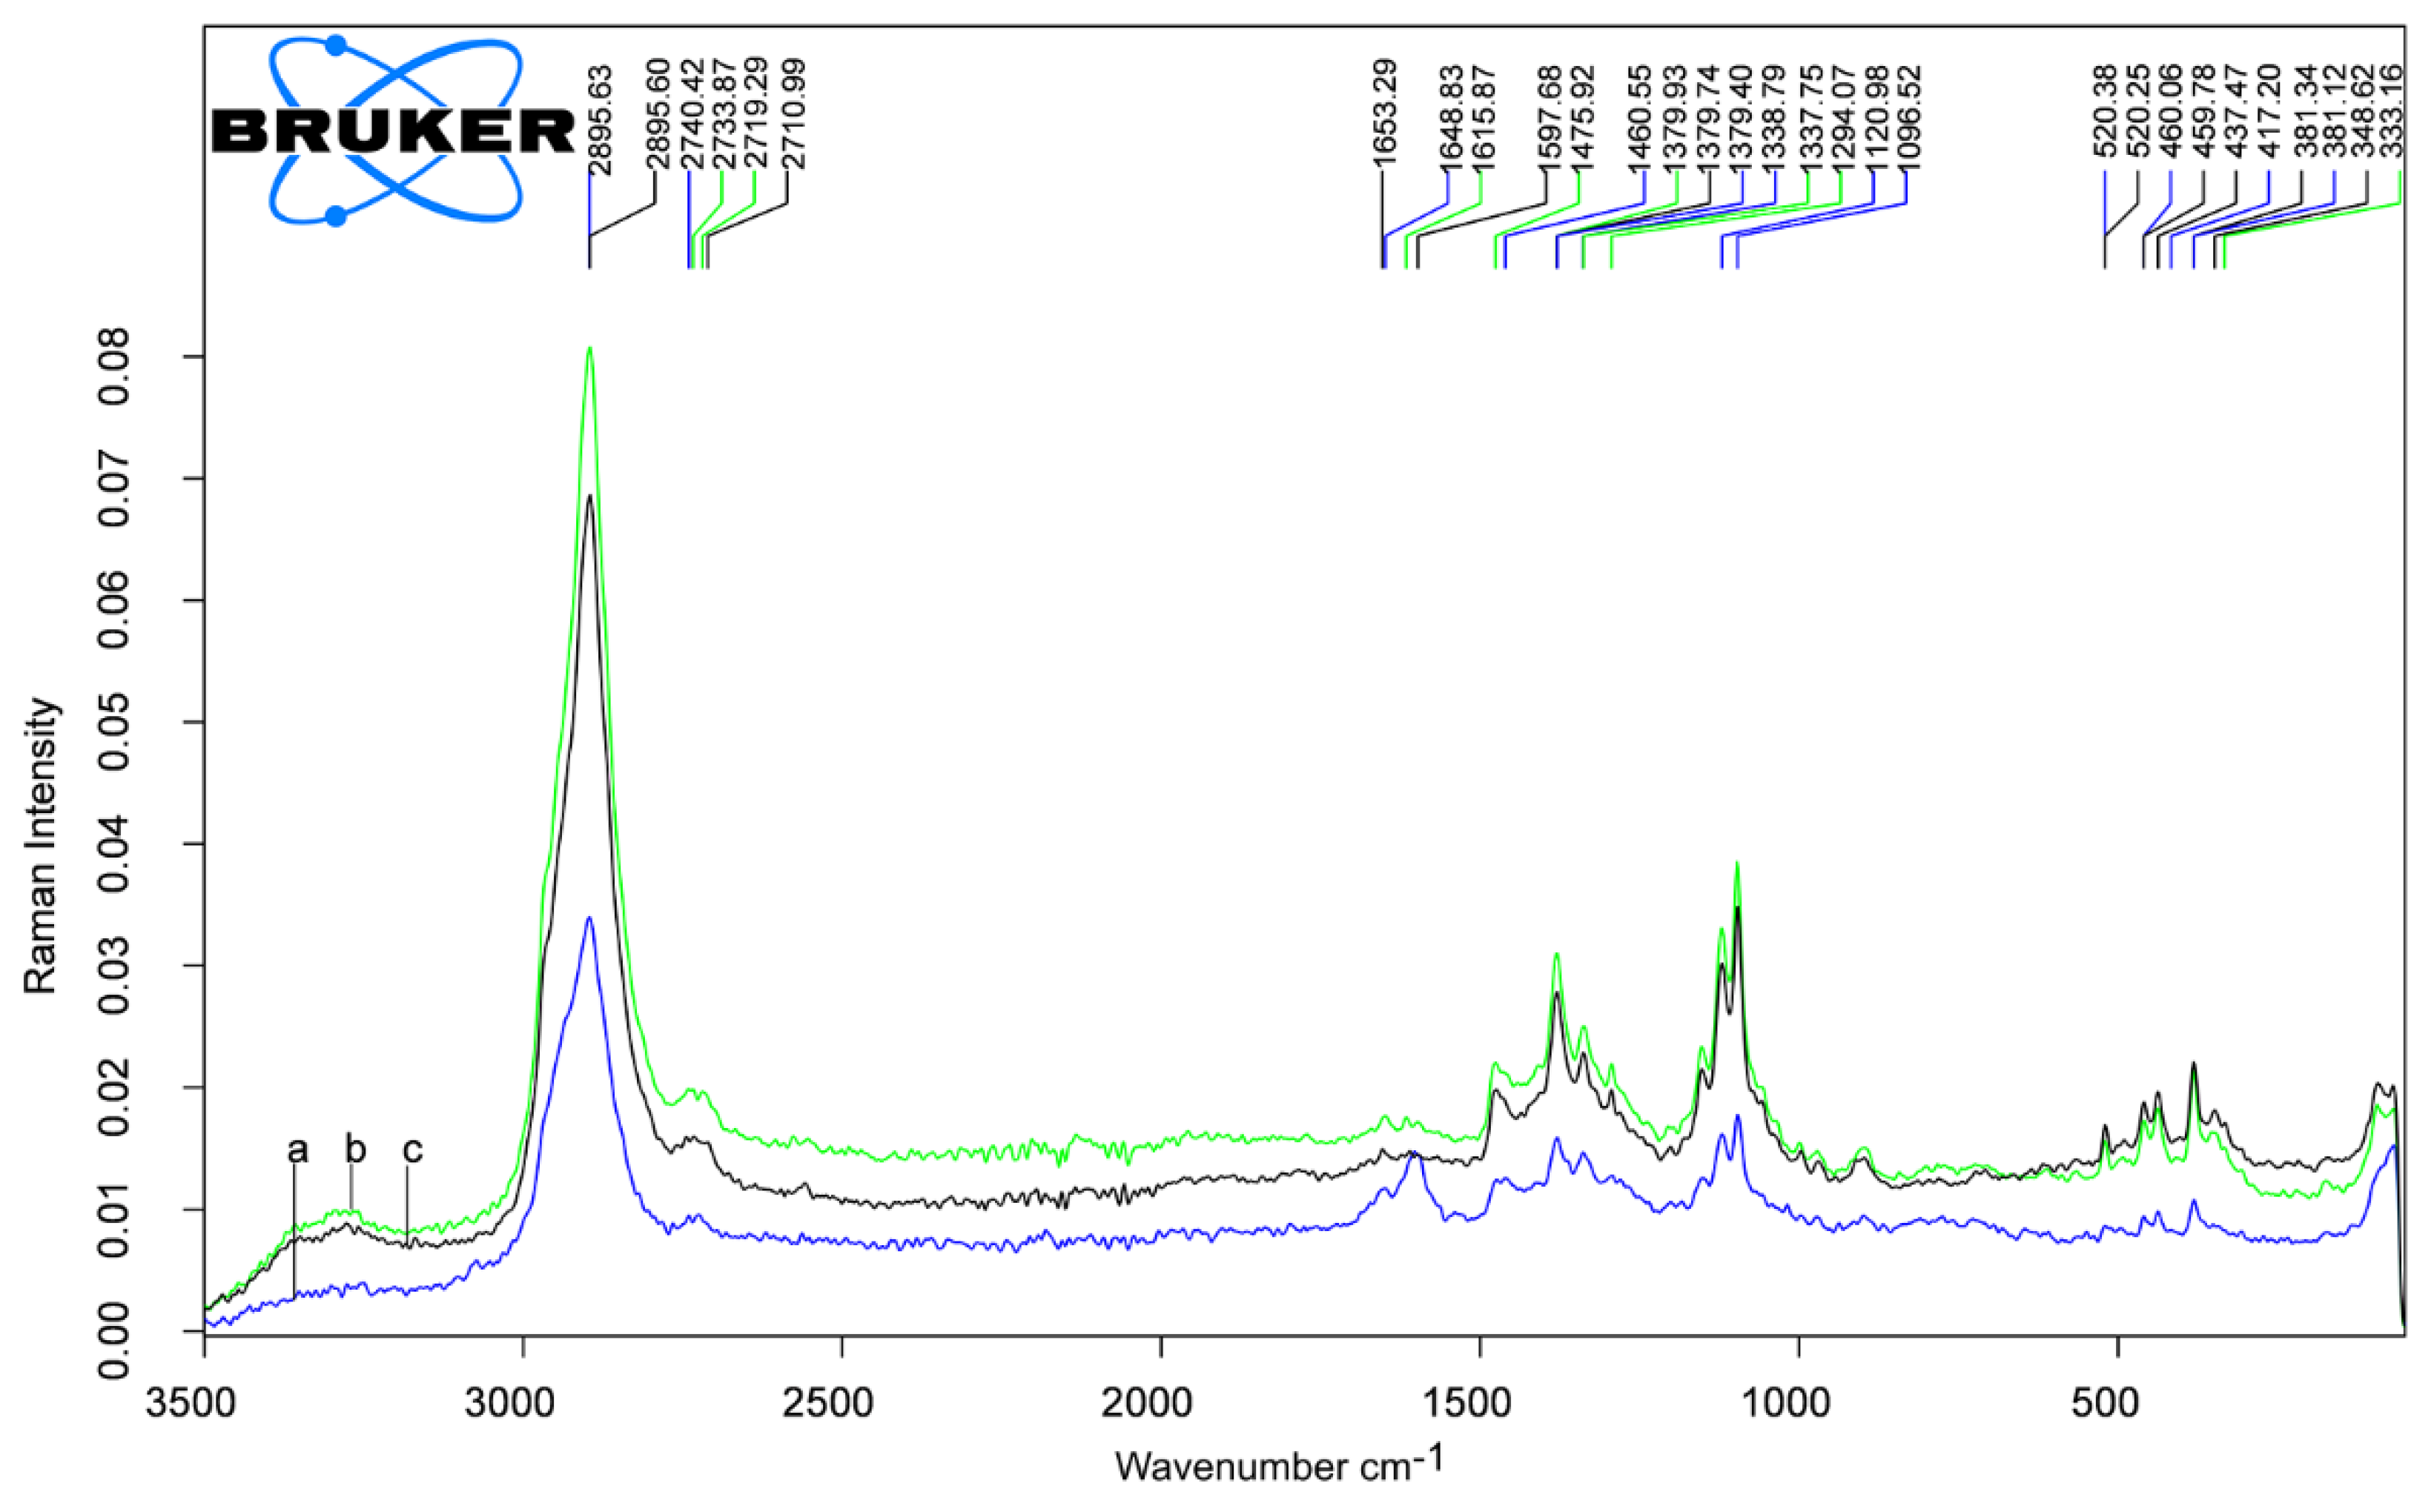
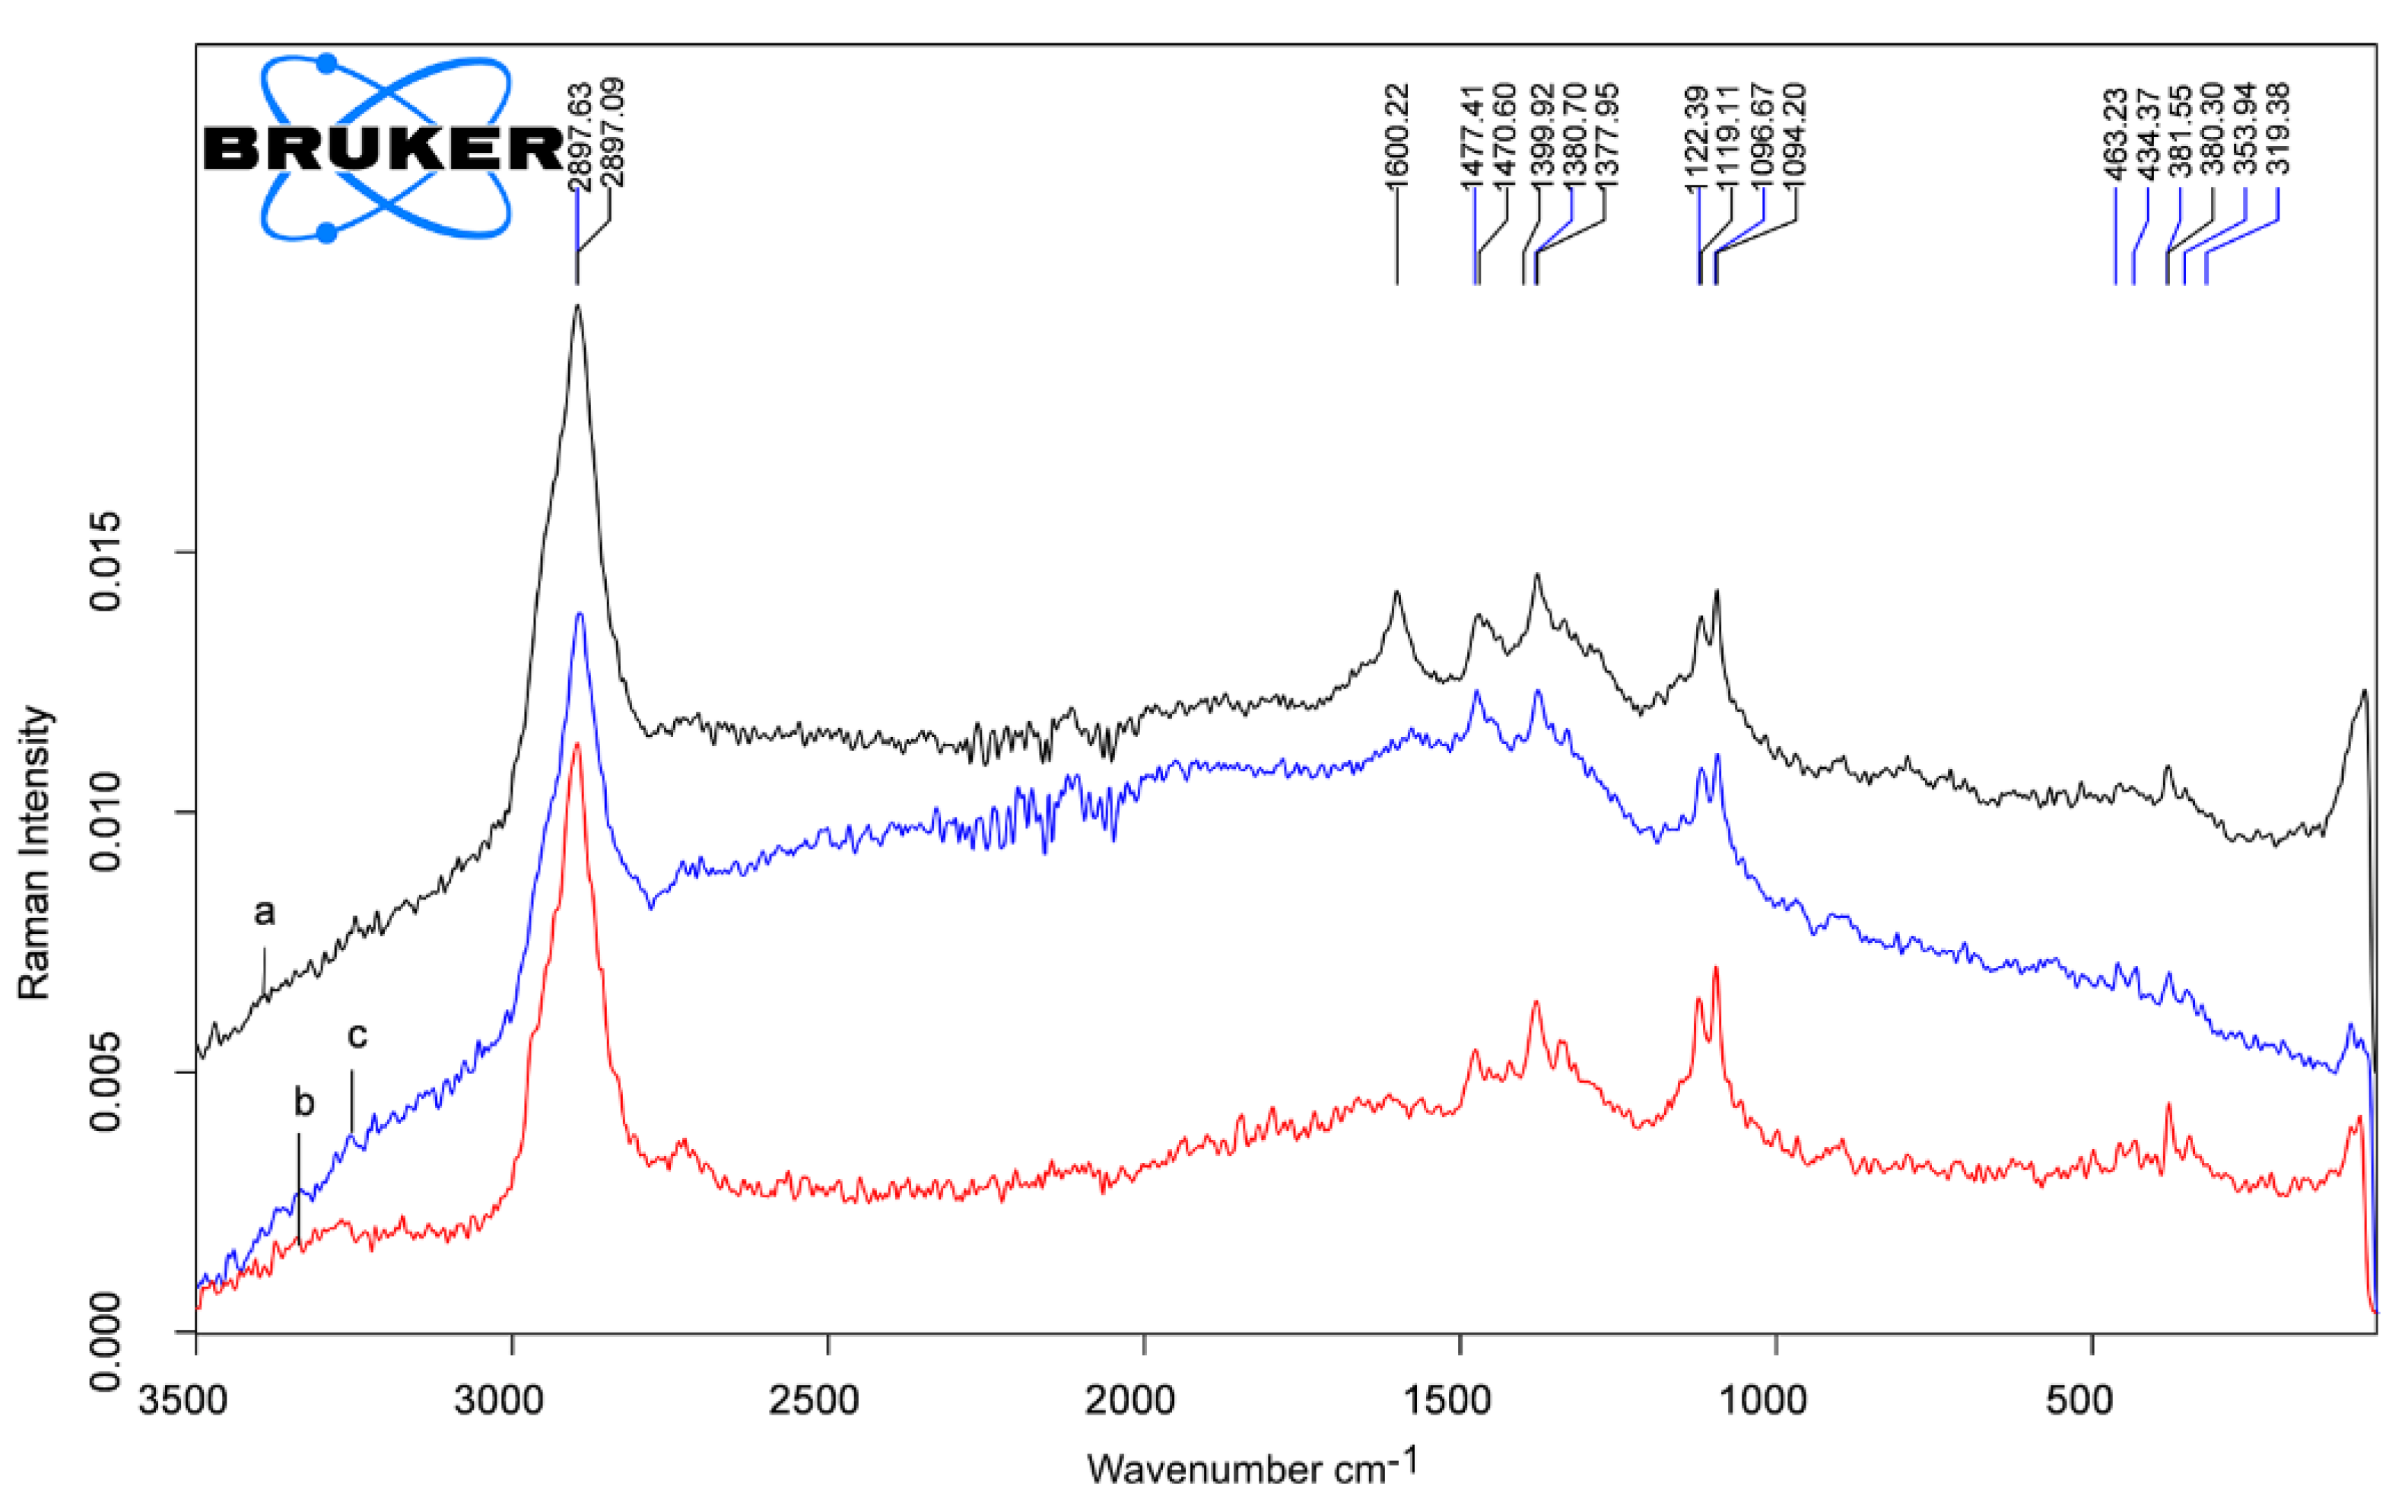
3.4. FT-Raman Spectroscopy
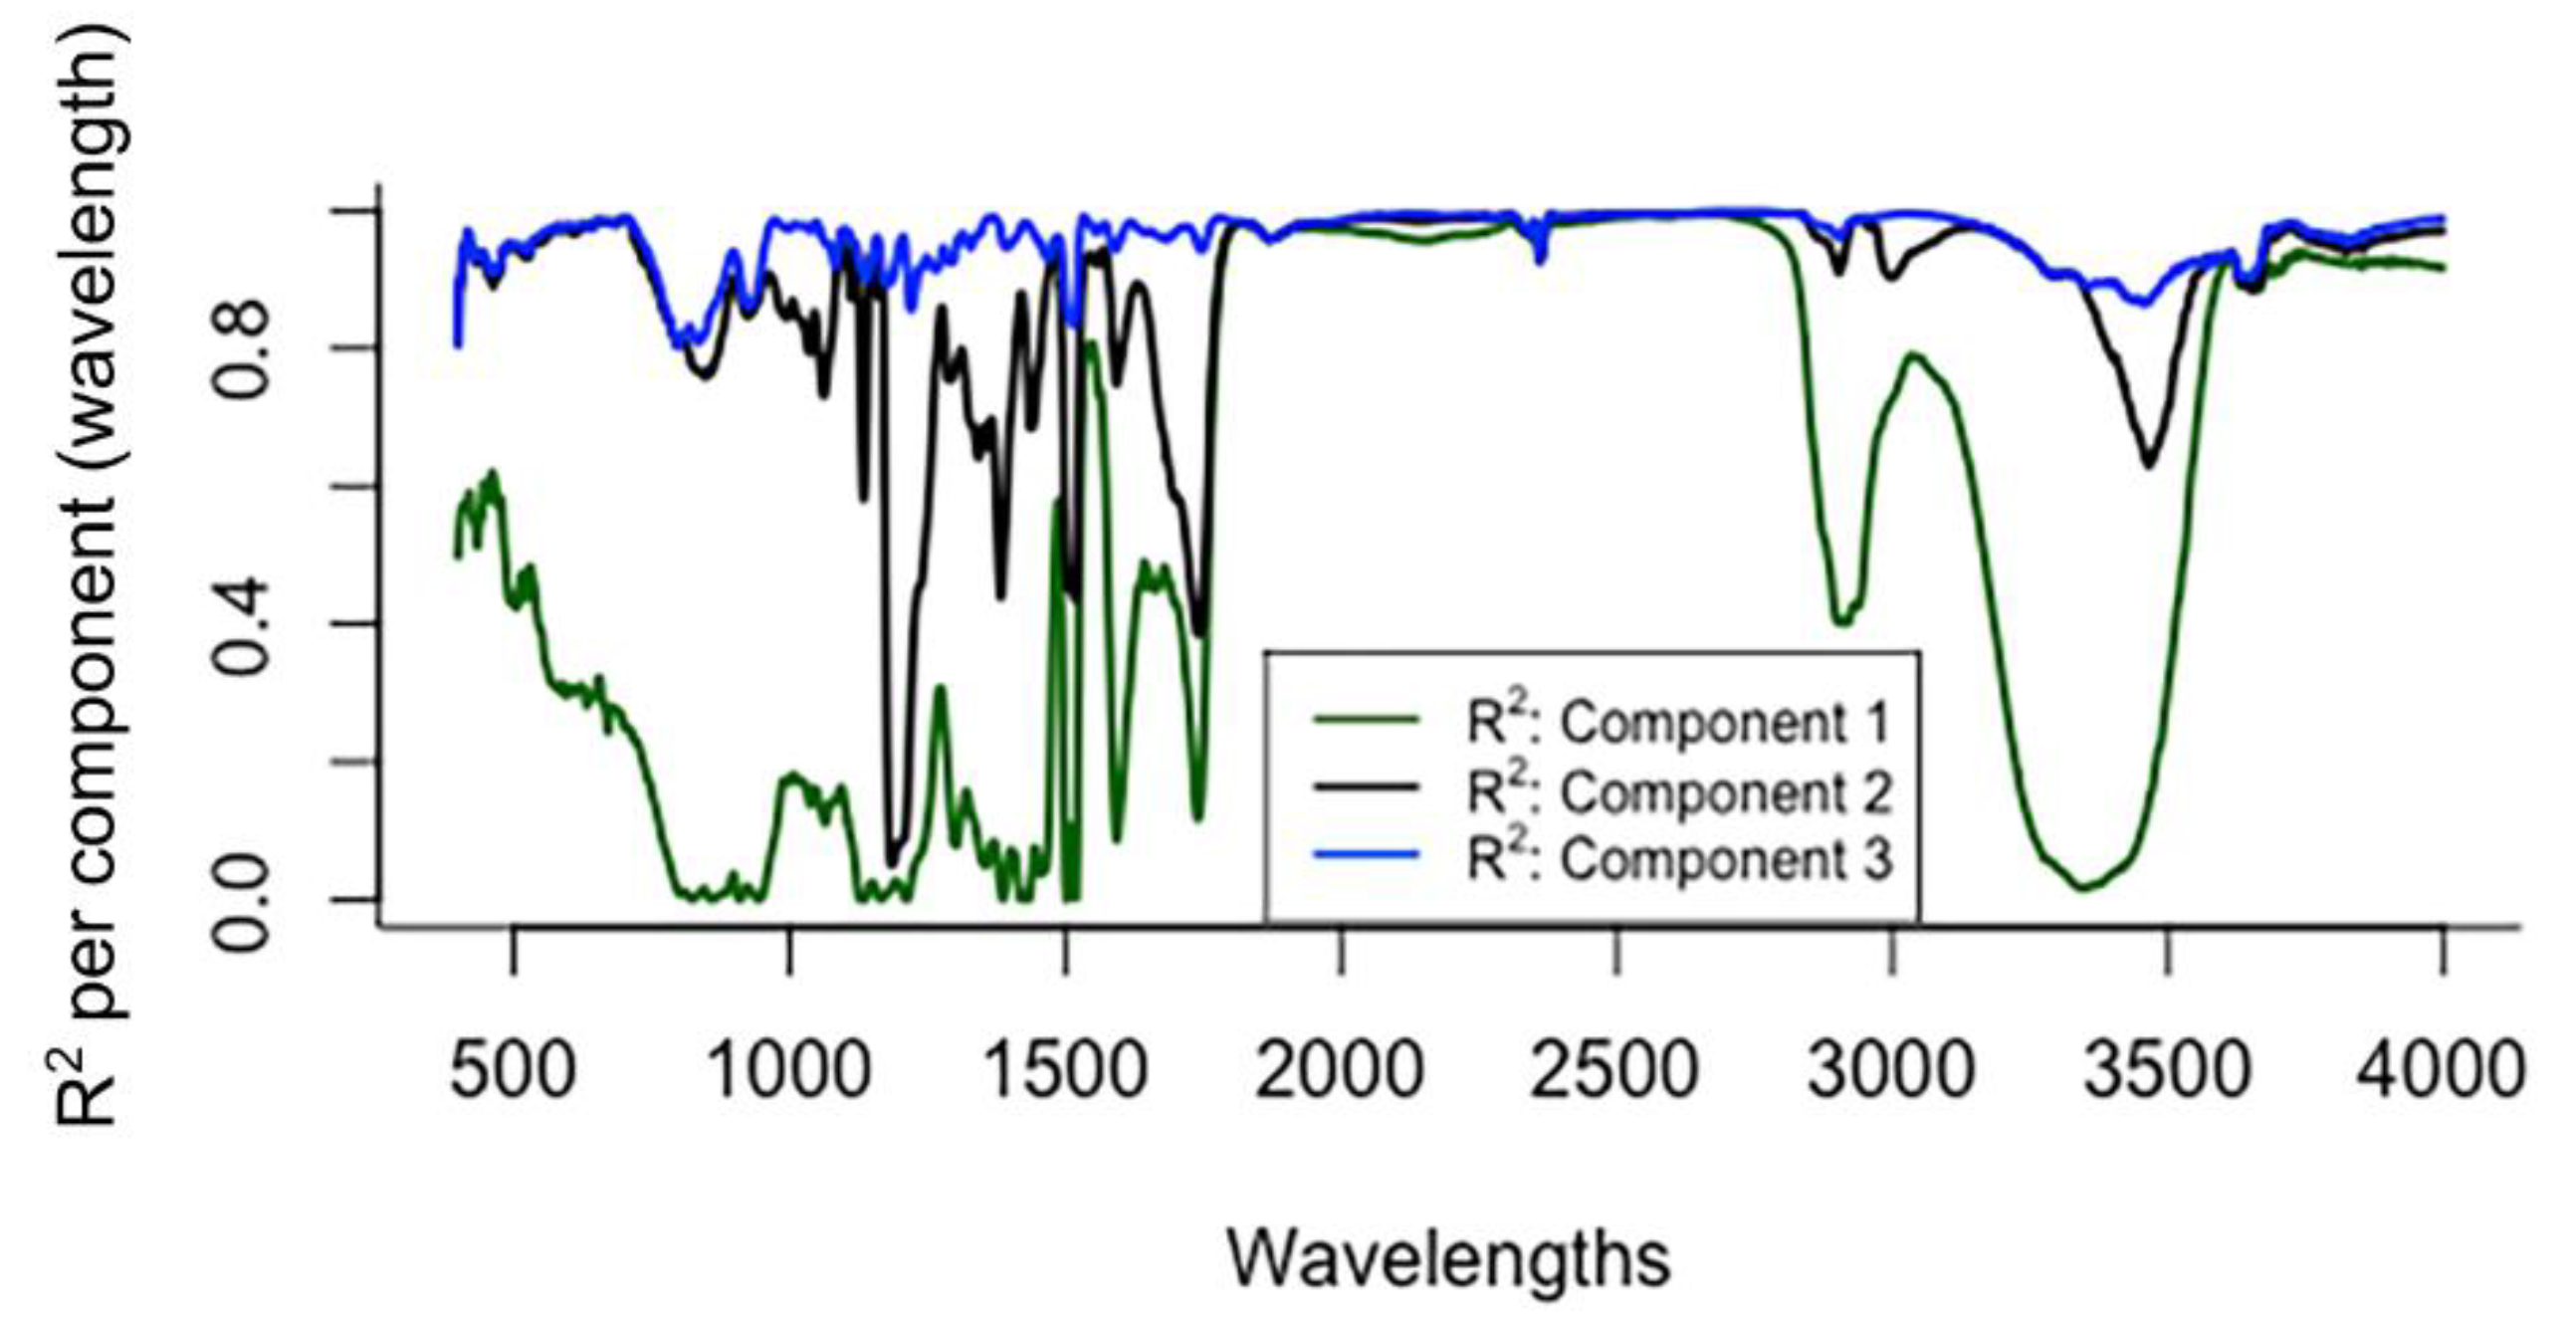
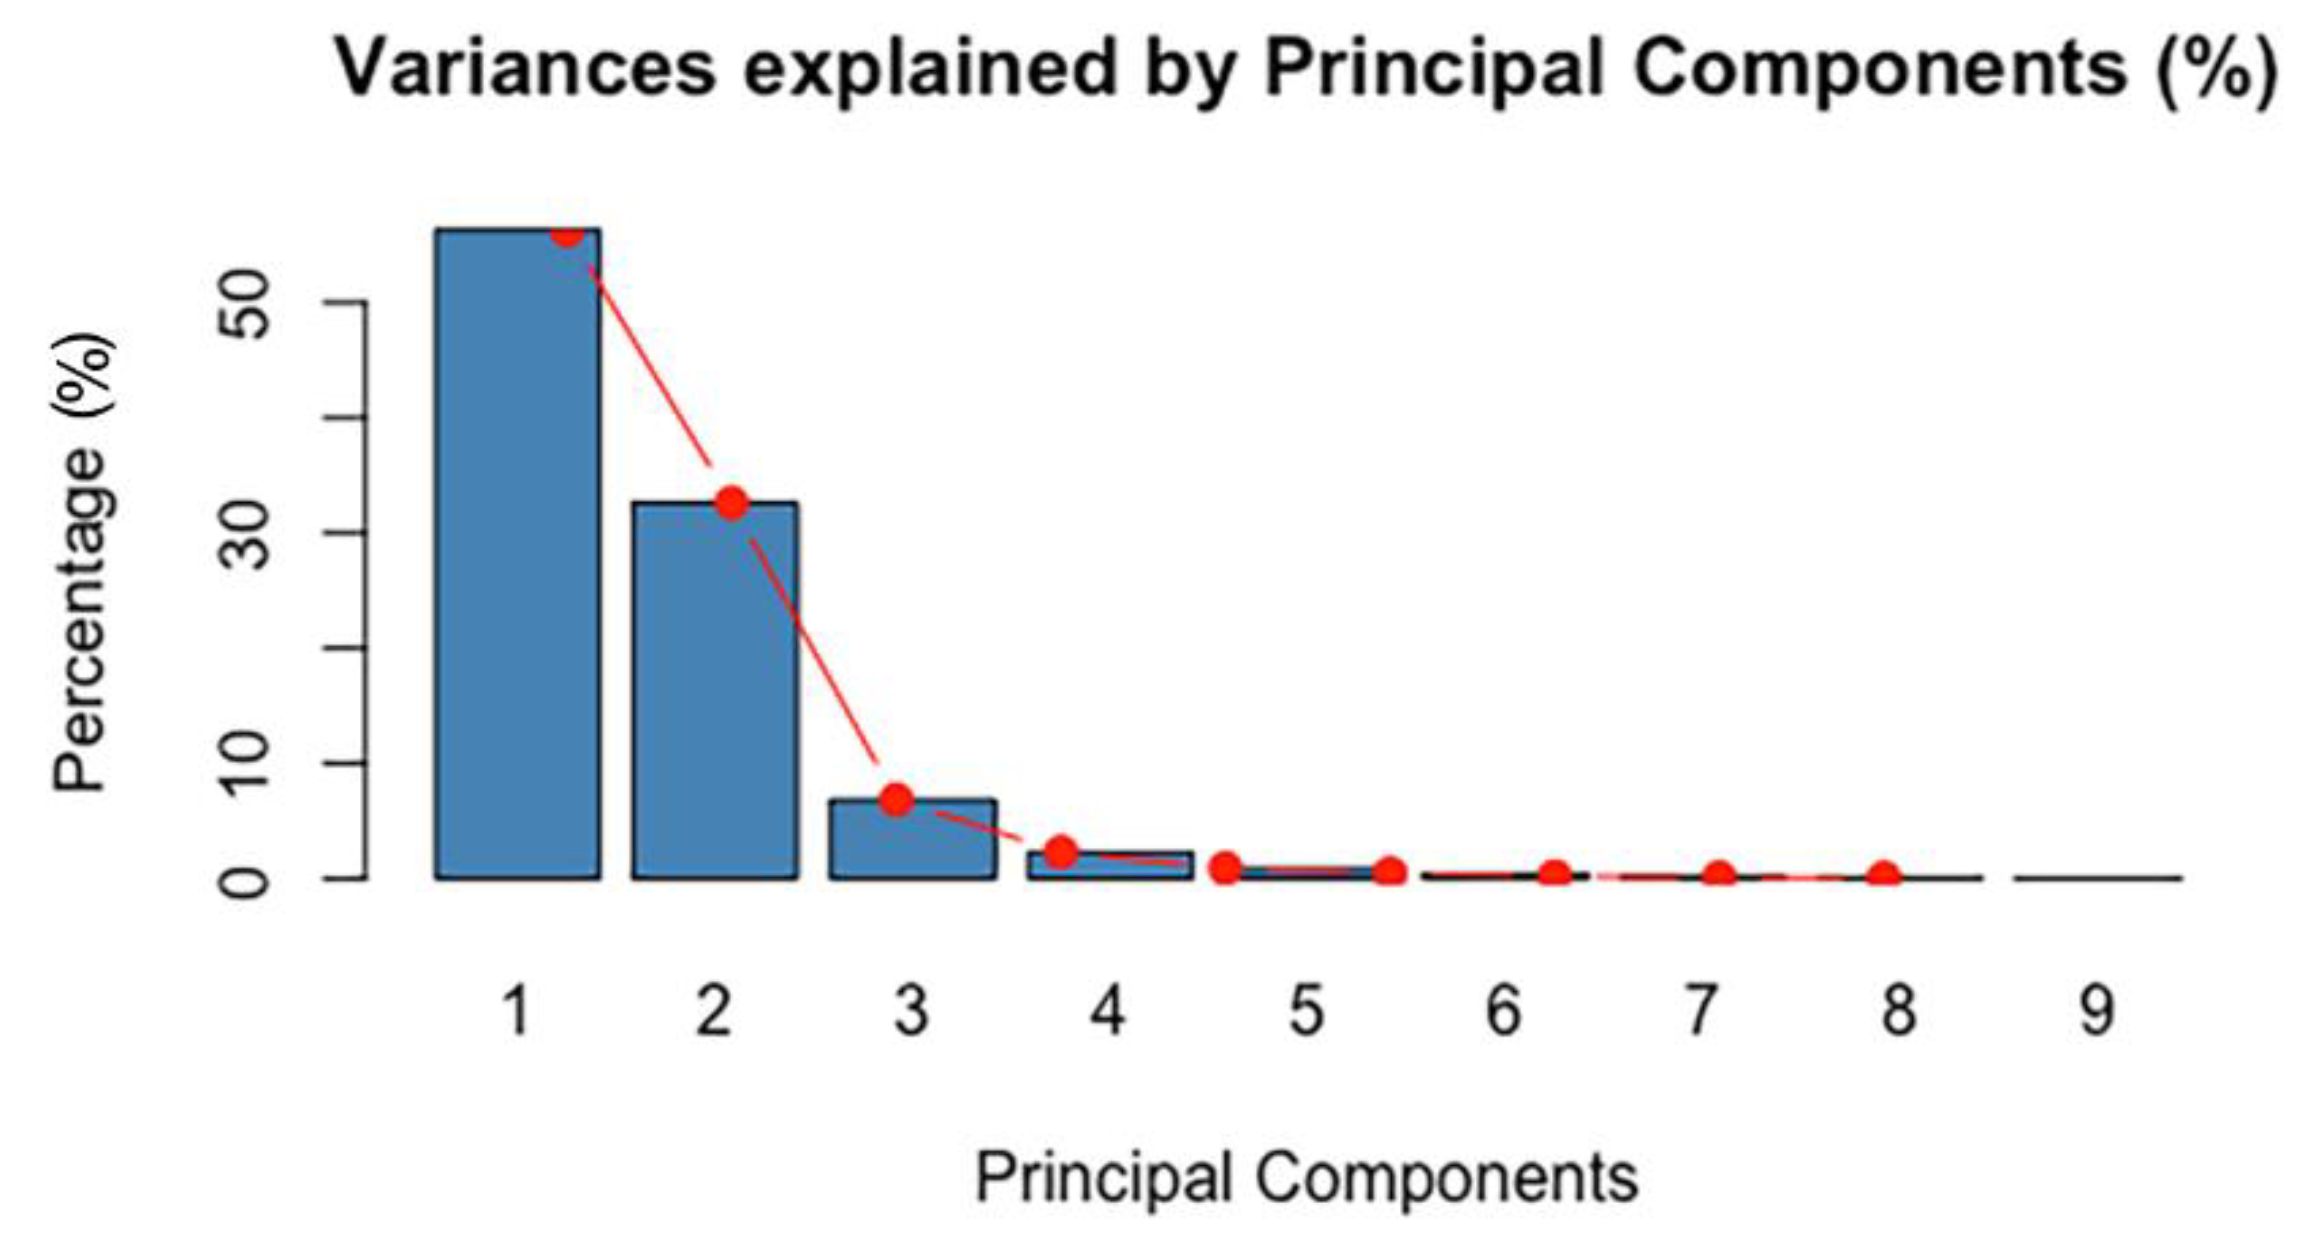
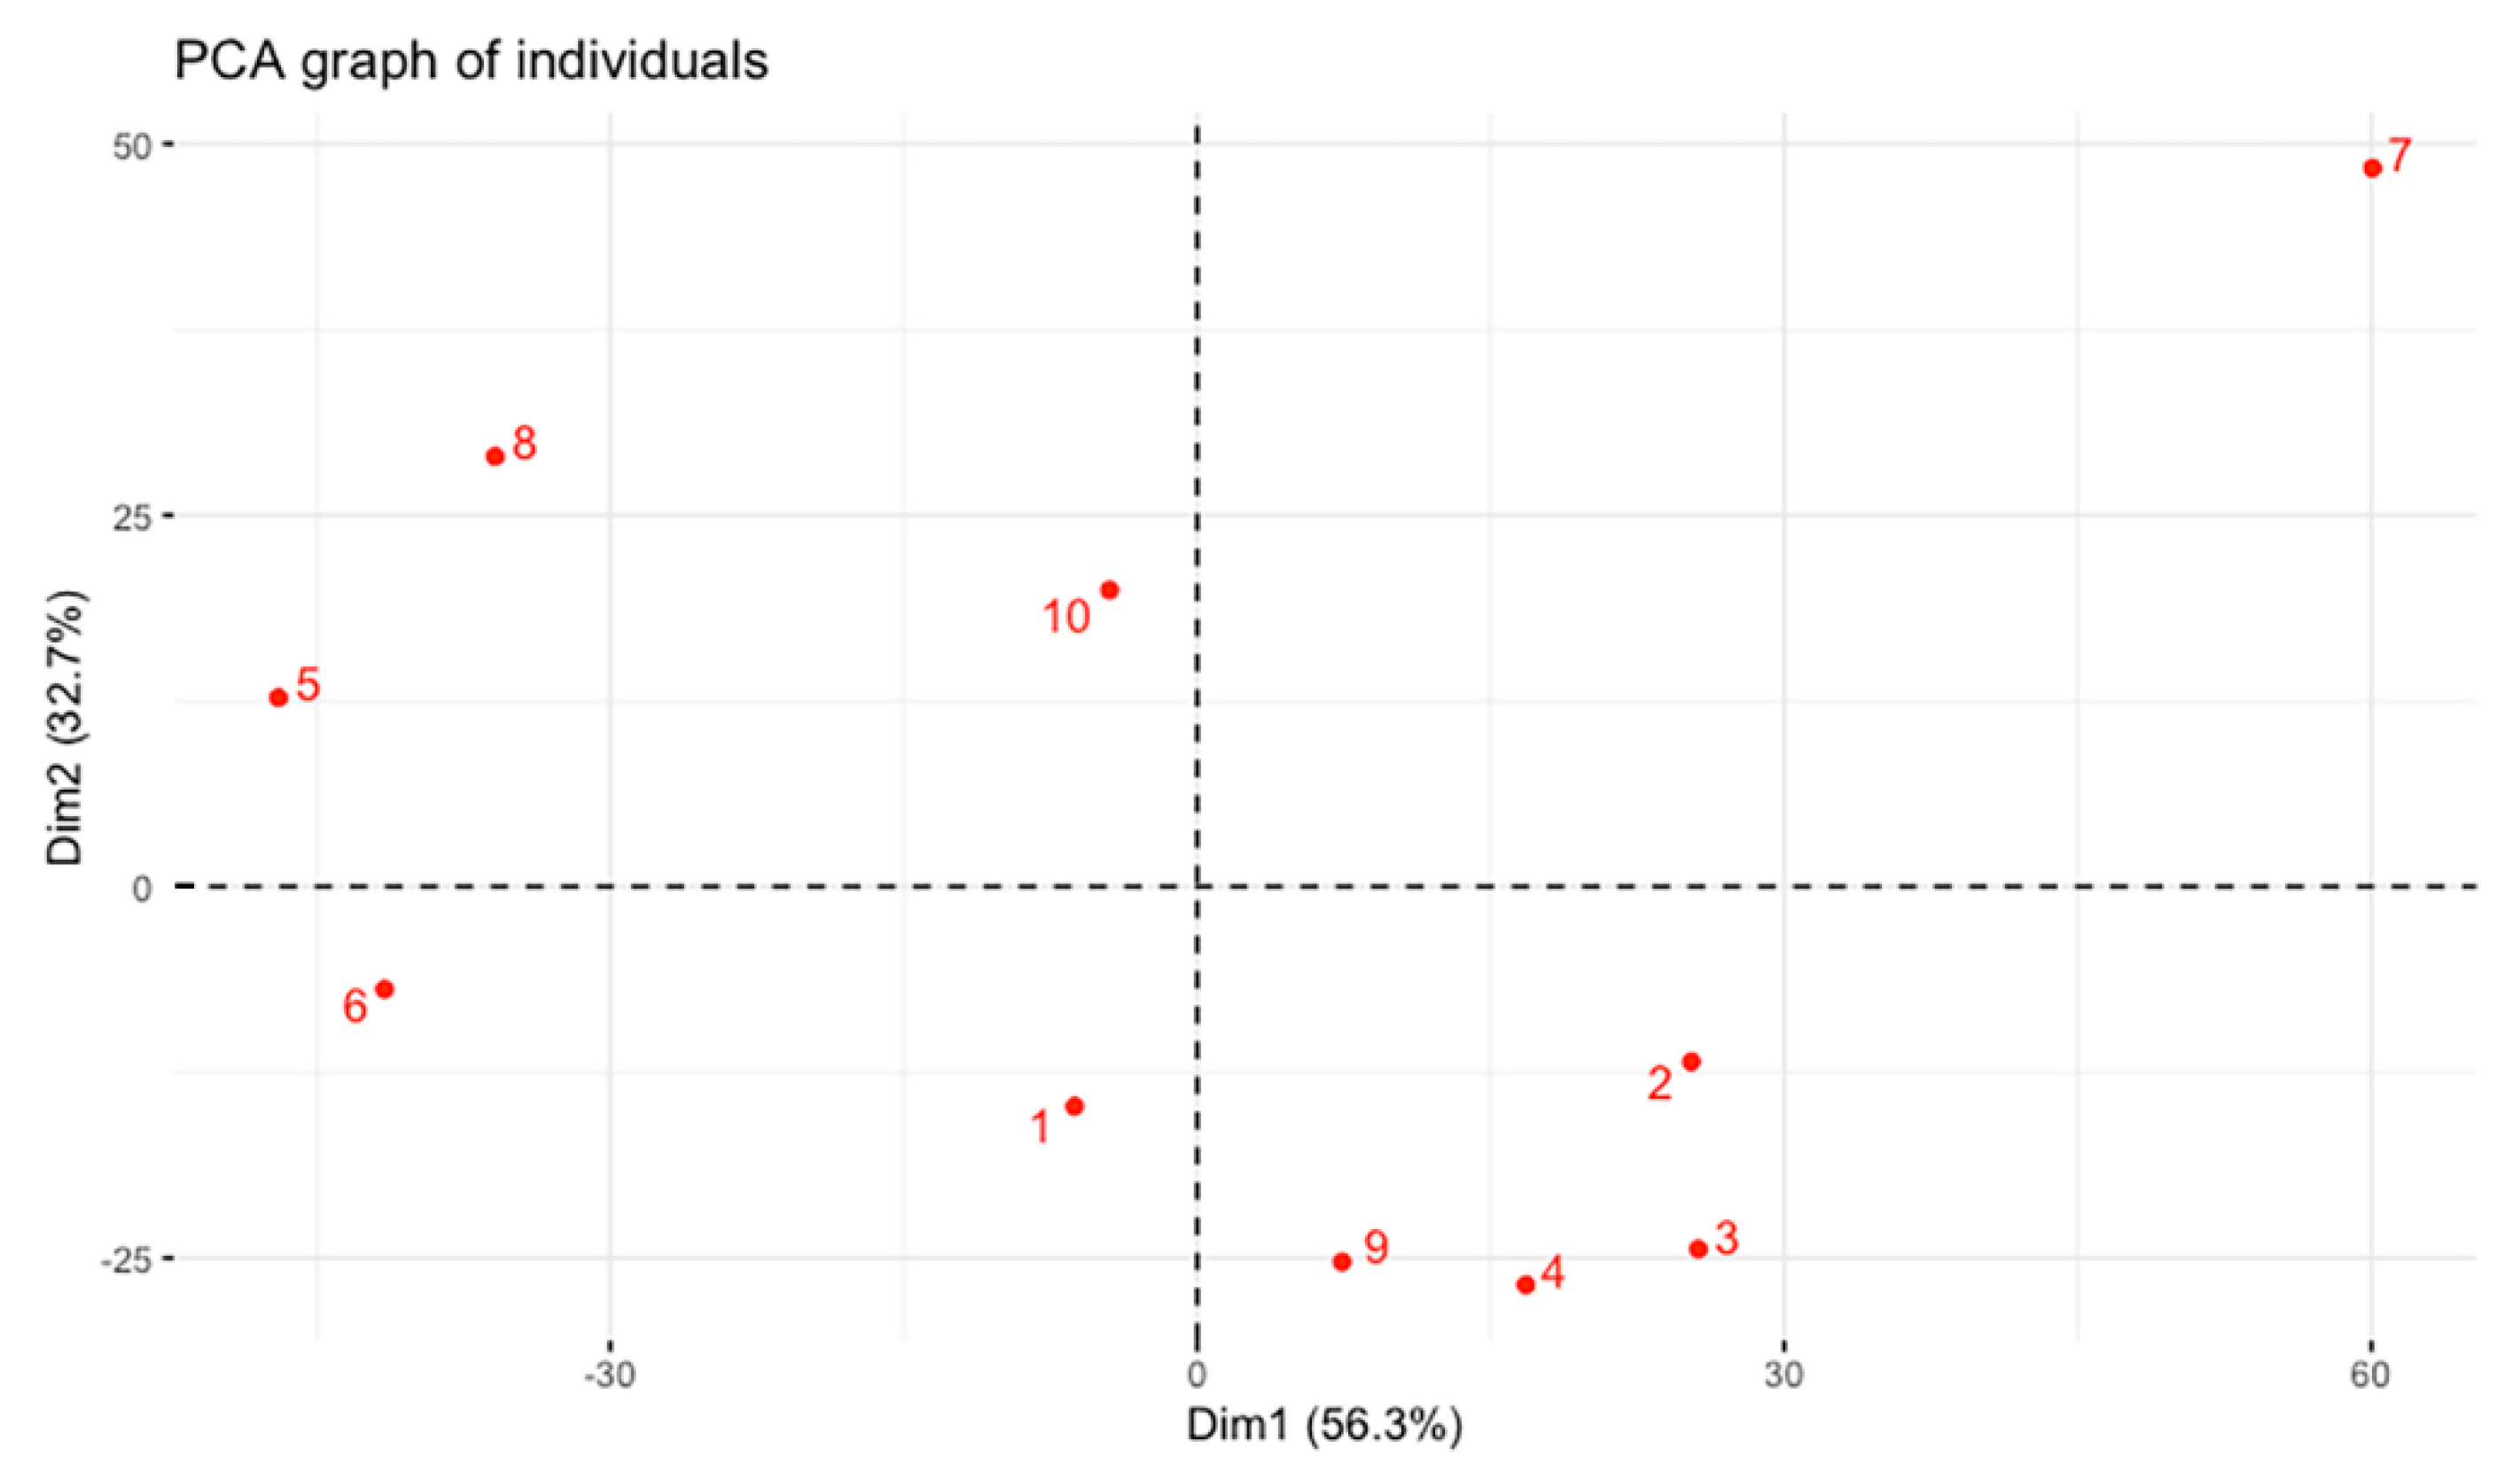
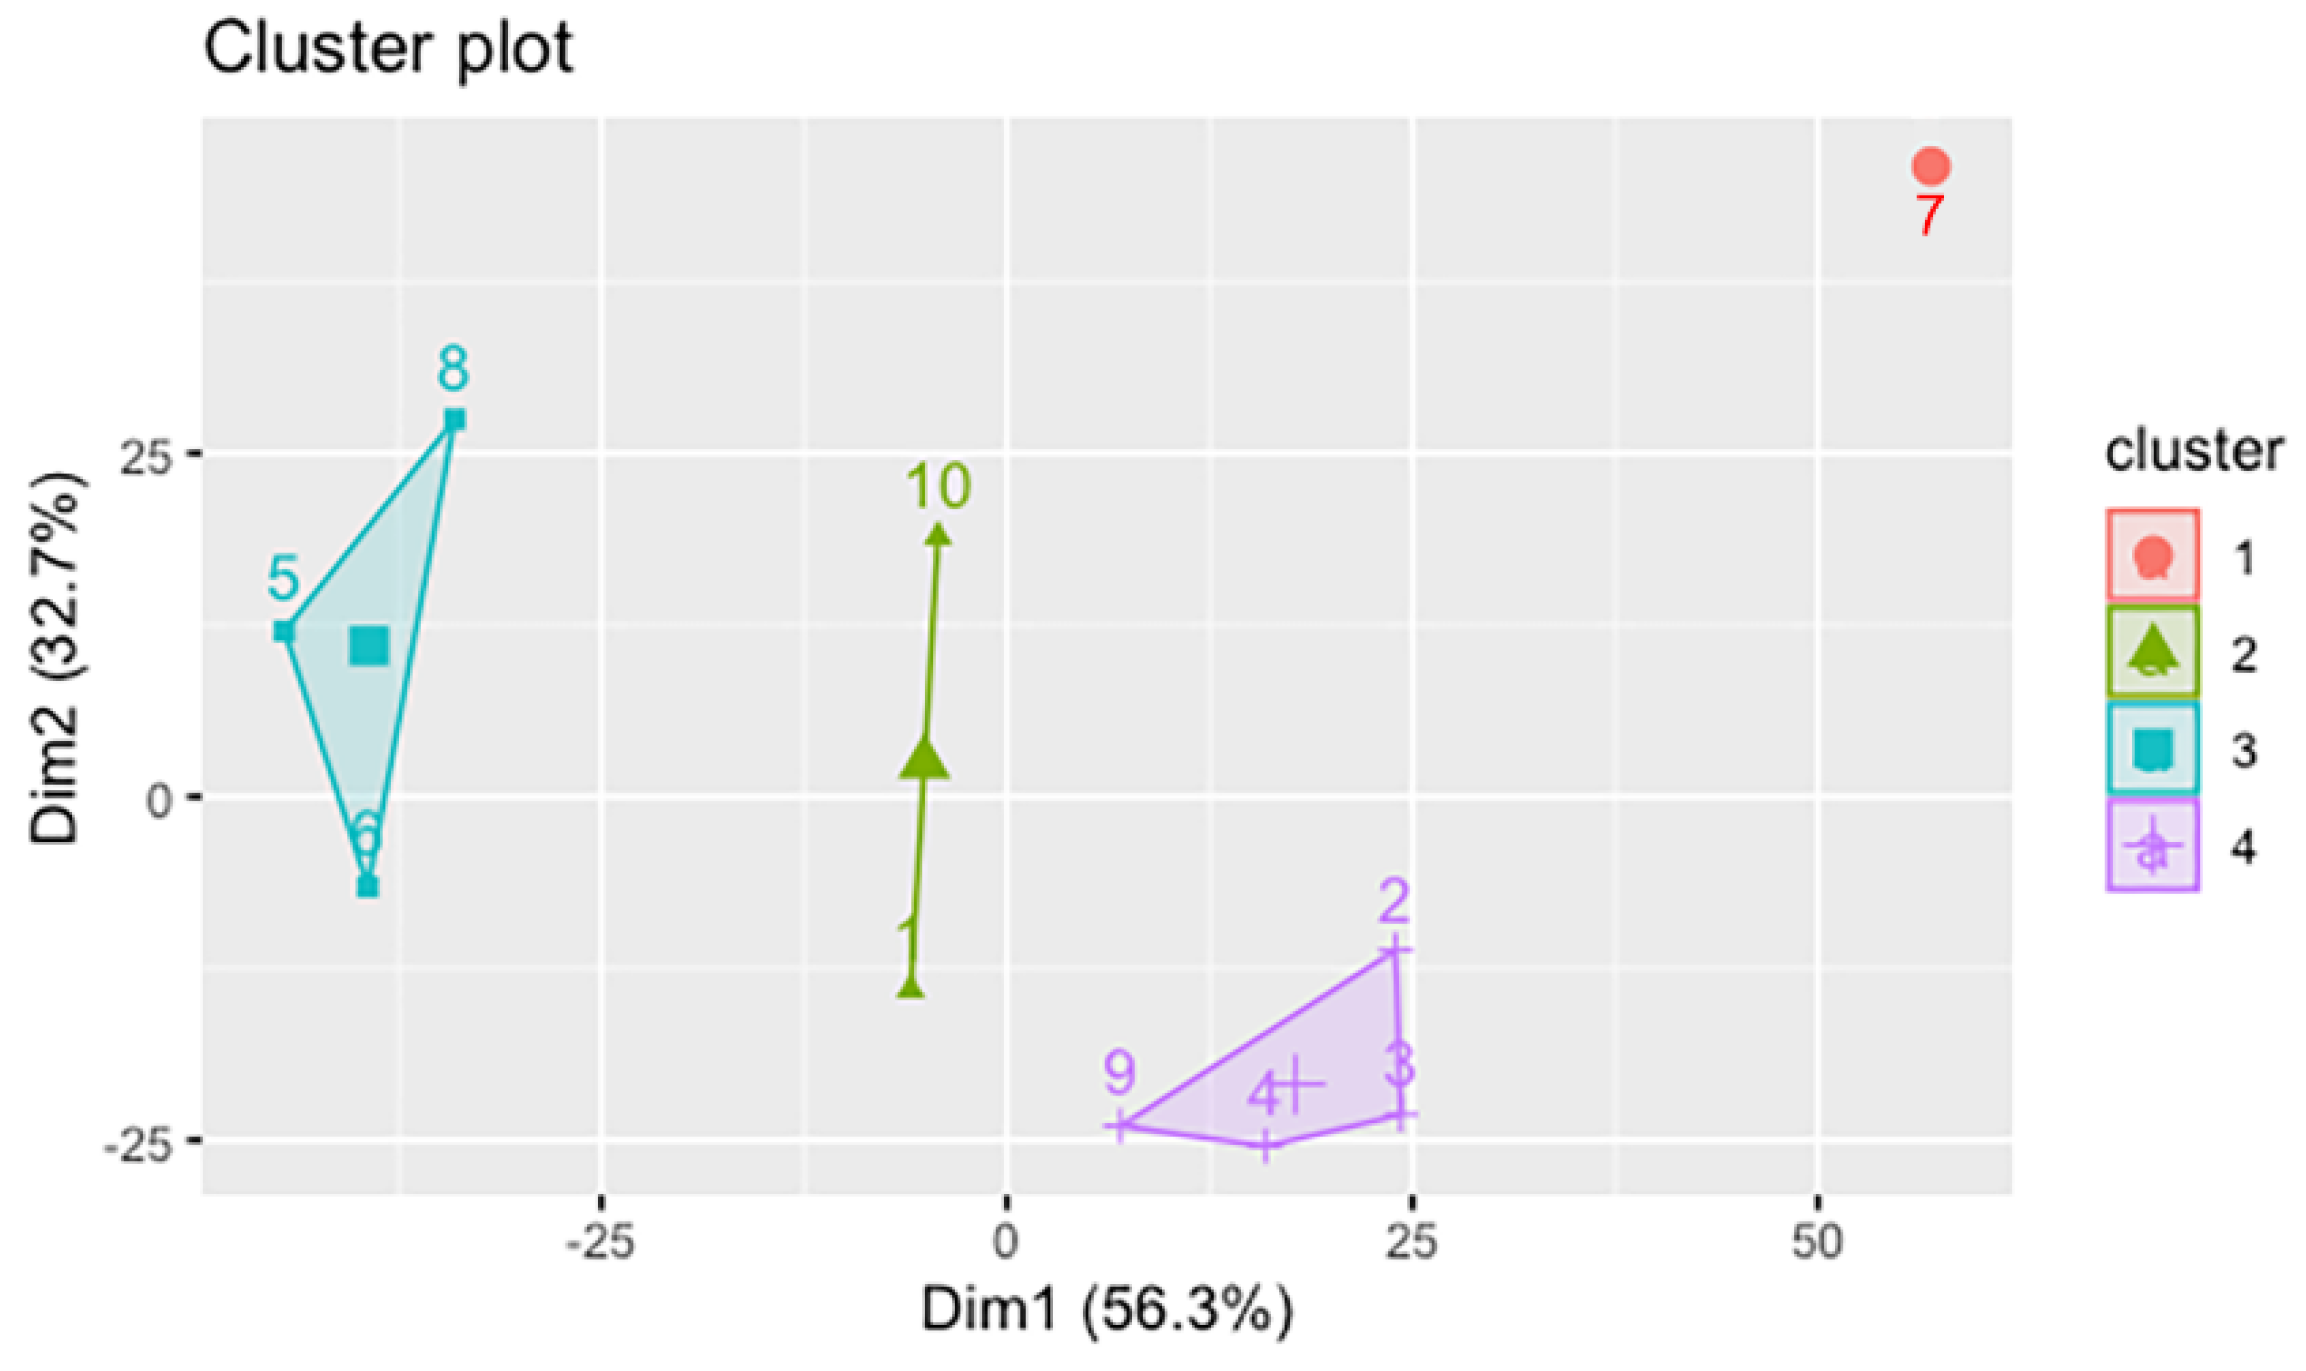
3.5. Chemometric Analysis of FTIR Data
3.6. Recommendations for the Preservation of the Studied Documents
4. Conclusions
Author Contributions
Funding
Institutional Review Board Statement
Informed Consent Statement
Data Availability Statement
Conflicts of Interest
References
- Garside, P.; Knight, B. Strengthening the links between conservation analysis and conservation practice at the British Library. In Proceedings of the ICOM Committee for Conservation 17th Triennial Meeting, Melbourne, Australia, 19–23 September 2014. [Google Scholar]
- Da Costa, P.L.L. European Coated Papers 1850–1975: Their Identification for Conservation Purposes. In Proceedings of the ICOM Committee for Conservation 16th Triennial Meeting, Lisbon, Portugal, 19–23 September 2011. [Google Scholar]
- Boutiuc (Haulică), M. Aspecte moderne de prezervare a documentelor din arhive. In Teză de Doctorat; Universitatea Alexandru Ioan Cuza din Iasi: Iasi, Romania, 2020. [Google Scholar]
- Sandu, I. Deteriorarea și Degradarea Bunurilor de Patrimoniu Cultural, Volume II; Editura Universității “Al.I.Cuza”: Iași, Romania, 2009. [Google Scholar]
- Librando, V.; Minniti, Z.; Lorusso, S. Ancient and modern paper characterization by FTIR and micro-RAMAN spectroscopy. Conserv. Sci. Cult. Herit. 2011, 1, 249–268. [Google Scholar]
- Nica-Badea, D. Factori și Procese Implicate în Degradarea Suporturilor Celulozice ale Bunurilor Culturale; din Târgu, J., Seria Mens Sana, N., Eds.; Analele Universității “Constantin Brâncuși”: Târgu Jiu, Romania, 2010; Volume 2, pp. 51–70. [Google Scholar]
- Pasquarella, C.; Pasquariello, G.; Balocco, C.; Tarsitani, G.; Moroni, C.; Maggi, O.; Albertini, R. Preventive conservation of graphic collections; an integrated system of biologica land microclimatic monitoring. In Proceedings of the 5th International Congress on Science and Technology for the Safeguard of Cultural Heritage in the Mediterranean Basin, Istanbul, Turkey, 22–25 November 2011; pp. 321–326. [Google Scholar]
- Stirbescu, N.M.; Ion, R.M.; Radu, A.; Teodorescu, S.; Bucurica, I.A.; Stirbescu, R.M.; Geba, M.; Dulama, I.D. Complex analitical investigations of old wax—Sealed Romanian paper documents. Rev. Chim. 2018, 69, 1608–1611. [Google Scholar] [CrossRef]
- Da Costa, A.C.A.; Corrêa, F.D.N.; Sant’Anna, G.; Hannesch, O.; Tonietto, G.B.; Godoy, J.M.; Gonçalves, R.A.; Lutterbach, M.T.S. Iron-gall ink studies on acid and alkaline papers and their relation to cellulose microbiological degradation. Int. J. Conserv. Sci. 2018, 9, 413–428. [Google Scholar]
- Viegas, R.; Corregidor, V.; Peña, M.T.; Alves, E.; Alves, L.C. Preliminary studies on iron gall inks composition using an external ion beam. Int. J. Conserv. Sci. 2013, 4, 593–602. [Google Scholar]
- Stijnman, A. Iron-gall inks in history: Ingredients and production. In Iron Gall Inks: On Manufacture, Characterization, Degradation and Stabilization; Kolar, J., Strlič, M., Eds.; National and University Library: Ljubljana, Slovenia, 2006; pp. 25–167. [Google Scholar]
- Ponce, A.; Brosto, L.B.; Gibbons, S.K.; Zavalij, P.; Viragh, C.; Hooper, J.; Gaskell, K.J.; Eichhorn, B. Elucidation of the Fe(III) Gallate Structure in Historical Irongall Inks. Anal. Chem. 2016, 88, 5152–5158. [Google Scholar] [CrossRef] [PubMed] [Green Version]
- Díaz Hidalgo, R.J.; Córdoba, R.; Nabais, P.; Silva, V.; Melo, M.J.; Pina, F.; Teixeira, N.; Freitas, V. New insights into iron-gall inks through the use of historically accurate reconstructions. Herit. Sci. 2018, 6, 63. [Google Scholar] [CrossRef]
- Doncea, S.M.; Ion, R.M.; Fierascui, R.C.; Bacalum, E.; Bunaciu, A.; Abdul-Enein, H.Y. Spectral Methods for Historical Paper Analysis: Composition and Age Approximation. Instrum. Sci. Tech. 2010, 38, 96–106. [Google Scholar] [CrossRef]
- Kolar, J.; Strlič, M.; Lojewski, T.; Havermans, J.; Steemers, T.; de Bruin, G.; Knight, B.; Palm, J.; Hanus, J.; Perminova, O.; et al. Papertreat project—Preserving our paper-based collections. Durab. Paper Writ. 2008, 2, 5–7. [Google Scholar]
- Gorassini, A.; Calvini, P.; Baldin, A. Fourier Transform Infrared Spectroscopy (FTIR) Analysis of Historic Paper Documents as a Preliminary Step for Chemometrical Analysis. In Multivariate Analysis and Chemometry Applied to Environment and Cultural Heritage, 2nd ed.; Bentham Science Publishers: Sharjah, United Arab Emirates, 2008. [Google Scholar]
- Wang, J.; Ren, J.; Yuan, C.; Shen, Y.; Gan, Q.; Shi, J.; Liu, Q.; Shi, J. Non-invasive optical micro-identification of ink verification in penink handwriting. Results Chem. 2020, 2, 100025. [Google Scholar] [CrossRef]
- Zadora, G.; Brozek-Mucha, Z. SEM-EDX—A useful tool for forensic examinations. Mater. Chem. Phys. 2003, 82, 345–348. [Google Scholar] [CrossRef]
- Mohamed, M.A.; Jaafar, J.; Ismail, A.F.; Othman, M.H.D.; Rahman, M.A. Chapter 1—Fourier Transform Infrared (FTIR) Spectroscopy. Membr. Charact. 2017, 3–29. [Google Scholar] [CrossRef]
- McCreery, R.L. Raman Spectroscopy for Chemical Analysis; John Wiley & Sons: New York, NY, USA, 2000. [Google Scholar]
- Ferrer, N.; Sistach, M.C. Characterisation by FTIR Spectroscopy of Ink Components in Ancient Manuscripts. Restaurator 2005, 26, 105–117. [Google Scholar]
- Poggi, G.; Giorgi, R.; Toccafondi, N.; Katzur, V.; Baglioni, P. Hydroxide Nanoparticles for Deacidification and Concomitant Inhibition of Iron-Gall Ink Corrosion of Paper. Langmuir 2010, 26, 19084–19090. [Google Scholar] [CrossRef] [PubMed]
- Boutiuc (Haulica), M.; Florescu, O.; Vasilache, V.; Sandu, I. The Comparative Study of the State of Conservation of Two Medieval Documents on Parchment from Different Historical Periods. Materials 2020, 13, 4766. [Google Scholar] [CrossRef] [PubMed]
- Sandu, I.C.A.; Sandu, I.; Popoiu, P.; van Saanen, A. Aspecte Metodologice Privind Conservarea Ştiinţifică a Patrimoniului Cultural; Corson: Iaşi, Romania, 2001. [Google Scholar]
- Baglioni, P.; Chelazzi, D.; Giorgi, R. Deacidification of Paper, Canvas and Wood. In Nanotechnologies in the Conservation of Cultural Heritage; Springer: Dordrecht, The Netherlands, 2015; Volume 4, pp. 117–144. [Google Scholar] [CrossRef]
- Barrow, W.Y. Deterioration of Book Stock. Causes and Remedies; Peter Peregrinus Ltd.: London, UK, 1959. [Google Scholar]
- Gess, J.M. The sizing of paper with rosin and alaun at acid pHs. In Paper Chemistry, 2nd ed.; Roberts, J.C., Ed.; Blackie Academic & Profesional: London, UK, 1996; pp. 120–139. [Google Scholar]
- Area, M.C.; Cheradame, H. Paper aging and degradation: Recent findings and research methods. Bioresources 2011, 6, 5307–5337. [Google Scholar]
- Stephens, C.H.; Barrett, T.; Whitmore, P.M.; Wade, J.A.; Mazurek, J.; Schilling, M. Composition and condition of naturally aged papers. J. Am. Inst. Conserv. 2008, 47, 201–215. [Google Scholar] [CrossRef]
- Malutan, T.; Pui, A.; Obrocea, P.P. Spectroscopia IR a celulozelor obtinute prin procedeul sulfat cu aditivi. Rev. De Celul. Si Hârtie 2002, 51, 17–20. [Google Scholar]
- Kruer-Zerhusen, N.; Cantero-Tubilla, B.; Wilson, D.B. Characterization of cellulose crystallinity after enzymatic treatment using Fourier transform infrared spectroscopy (FTIR). Cellulose 2017, 25, 37–48. [Google Scholar] [CrossRef]
- Laserna, J.J. Modern Techniques in Raman Spectroscopy; John Wiley and Sons Ltd.: Chichester, NY, USA, 1996. [Google Scholar]
- Zidan, Y.; El-Shafei, A.; Noshy, W.; Salim, E. A comparative study to evaluate conventional and nonconventional cleaning treatments of cellulosic supports. Mediterr. Archaeol. Archaeom. 2017, 3, 337–353. [Google Scholar]
- Chiriu, D.; Ricci, P.C.; Cappellini, G. Raman characterization of XIV-XVI centuries Sardinian documents: Ink, paper and parchments. Vib. Spectrosc. 2017, 92, 70–81. [Google Scholar] [CrossRef]
- Castro, K.; Perez-Alonso, M.; Rodriguez-Laso, M.D.; Etxebarria, N.; Madariaga, J.M. Non-invasive and non-destructive micro-XRF and micro-Raman analysis of a decorative wall paper from the beginning of the 19th century. Anal. Bioanal. Chem. 2007, 387, 847–860. [Google Scholar] [CrossRef] [PubMed]
- Buzgar, N.; Apopei, A.I.; Buzatu, A. Romanian Database of Raman Spectroscopy. 2009. Available online: http://rdrs.ro (accessed on 25 January 2020).
- Chiriu, D.; Ricci, P.C.; Cappellini, G.; Salis, M.; Loddo, G.; Carbonaro, C.M. Ageing of ancient paper: A kinetic model of cellulose degradation from Raman spectra. J. Raman Spectrosc. 2018, 49, 1802–1811. [Google Scholar] [CrossRef]
- Agarwal, U. 1064 nm FT-Raman spectroscopy for investigations of plant cell walls and others biomass materials. Front. Plant Sci. 2014, 5, 490. [Google Scholar] [CrossRef]
- Zięba Palus, J.; Weselucha-Birczyńska, A.; Trzcińska, B.; Kowalski, R.; Moskal, P. Analysis of degraded papers by infrared and Raman spectroscopy for forensic purposes. J. Mol. Struct. 2017, 1140, 154–162. [Google Scholar] [CrossRef]
- Parida, C.; Dash, S.K.; Pradhan, C. FTIR and Raman studies of cellulose fibers of Luffacylindrica. J. Compos. Mater. 2015, 5, 5–10. [Google Scholar]
- Cortea, I.M. Contribuții la studiul proceselor de îmbătrânire în straturile picturale pe bază de rășini sintetice. In Teză de Doctorat; Universitatea Politehnica din București: București, Romania, 2017. [Google Scholar]
- Silva, C.; Pimentel, M.F.; Amigo, J.M.; Garcia-Ruiz, C.; Ortega-Ojeda, F. Infrared spectroscopy and chemometrics to evaluate paper variability in document dating. Spectroscopy 2018, 30, 12–15. [Google Scholar]
- Kumar, R.; Sharma, V. Chemometrics in forensic science. Trends Anal. Chem. 2018, 105, 191–201. [Google Scholar] [CrossRef]
- Wilks, D. Statistical Methods in the Atmospheric Sciences, 2nd ed.; Academic Press: Amsterdam, The Netherlands; Boston, MA, USA, 2005. [Google Scholar]


| Sample | Elemental Composition in Gravimetric Percentages (%) | |||||||||
|---|---|---|---|---|---|---|---|---|---|---|
| C | O | Si | Al | Ca | Mg | Na | P | Cl | S | |
| S1 | 36.62 | 60.50 | 0.42 | 0.77 | 1.02 | - | - | - | - | 0.67 |
| S2 | 29.93 | 63.02 | 1.01 | 1.59 | 0.67 | 0.93 | 1.39 | 0.42 | 0.58 | 0.46 |
| S3 | 30.92 | 62.52 | 1.08 | 1.84 | 0.72 | 0.70 | 1.25 | 0.27 | 0.32 | 0.38 |
| Document | Crystallinity Index (Ic) | Degree of Lateral Order (GOL) | Intensity of Hydrogen Bonds (IlegH) |
|---|---|---|---|
| S1 | A1363/A2905 = 1.82 | A1424/A896 = 0.67 | A3337/A1315 = 0.95 |
| S2 | A1370/A2904 = 1.53 | A1429/A896 = 0.34 | A3334/A1316 = 1.03 |
| S3 | A1363/A2899 = 1.66 | A1429/A893 = 0.55 | A3335/A1317 = 1 |
| Document | Crystallinity Indices % |
|---|---|
| S1 | 95.83 |
| S2 | 81.12 |
| S3 | 92.52 |
Publisher’s Note: MDPI stays neutral with regard to jurisdictional claims in published maps and institutional affiliations. |
© 2021 by the authors. Licensee MDPI, Basel, Switzerland. This article is an open access article distributed under the terms and conditions of the Creative Commons Attribution (CC BY) license (https://creativecommons.org/licenses/by/4.0/).
Share and Cite
Florescu, O.; Hrițac, R.; Haulică, M.; Sandu, I.; Stănculescu, I.; Vasilache, V. Determination of the Conservation State of Some Documents Written on Cellulosic Support in the Poni-Cernătescu Museum, Iași City in Romania. Appl. Sci. 2021, 11, 8726. https://doi.org/10.3390/app11188726
Florescu O, Hrițac R, Haulică M, Sandu I, Stănculescu I, Vasilache V. Determination of the Conservation State of Some Documents Written on Cellulosic Support in the Poni-Cernătescu Museum, Iași City in Romania. Applied Sciences. 2021; 11(18):8726. https://doi.org/10.3390/app11188726
Chicago/Turabian StyleFlorescu, Oana, Robert Hrițac, Maria Haulică, Ion Sandu, Ioana Stănculescu, and Viorica Vasilache. 2021. "Determination of the Conservation State of Some Documents Written on Cellulosic Support in the Poni-Cernătescu Museum, Iași City in Romania" Applied Sciences 11, no. 18: 8726. https://doi.org/10.3390/app11188726
APA StyleFlorescu, O., Hrițac, R., Haulică, M., Sandu, I., Stănculescu, I., & Vasilache, V. (2021). Determination of the Conservation State of Some Documents Written on Cellulosic Support in the Poni-Cernătescu Museum, Iași City in Romania. Applied Sciences, 11(18), 8726. https://doi.org/10.3390/app11188726