Article

Irregularity of the Distribution of Masonry Infill Panels and Its Effect on the Seismic Collapse of Reinforced Concrete Buildings

1
Civil Engineering School, Pontificia Universidad Católica de Valparaíso, Valparaíso 2340000, Chile
2
Department of Earth and Construction Sciences, Universidad de las Fuerzas Armadas, Sangolquí 171103, Ecuador
3
Regional Center for Technological Developments for Construction, Seismology and Seismic Engineering (CEREDETEC), Universidad Tecnológica Nacional, Mendoza 5500, Argentina
4
Engineering Faculty, Universidad Laica Eloy Alfaro de Manabí, Manta 130203, Ecuador
*
Author to whom correspondence should be addressed.
Appl. Sci. 2021, 11(18), 8691; https://doi.org/10.3390/app11188691
Submission received: 28 July 2021 / Revised: 10 September 2021 / Accepted: 14 September 2021 / Published: 17 September 2021
(This article belongs to the Special Issue Seismic Assessment and Design of Structures)

Abstract

:
On 16 April 2016, an earthquake of Mw 7.8 shook the coast of Ecuador, causing the destruction of buildings and a significant number of casualties. Following a visit by the authors to the city of Portoviejo during the debris removal and recovery stage, it was noted that several reinforced concrete buildings located on corners had collapsed in the central part of the city. These buildings were characterized by the presence of masonry at the edges of the buildings but not between the two mostly open-plan facades on the corner for practical reasons. This article reviews the effect of masonry infill panels on the seismic response of reinforced concrete structures. For this, a model that contains the geometric and mechanical characteristics typical of collapsed buildings was generated and subjected to nonlinear analysis, with both static and dynamic increments. The results show the clear influence of the masonry infill panels on the structural response through the torsional behavior that is reflected in the evolution of the floor rotations. Finally, dynamic incremental analysis is used to obtain the collapse fragility curve of the building, and a new damage measure based on floor rotations is proposed.

1. Introduction

At present, design standards prescribe few or no recommendations aimed at considering the contribution of masonry to the response of a structure. This is especially important in regard to structures that are located in areas of high seismic hazard. On the other hand, in Latin America and in other regions of the world with developing countries, reinforced concrete buildings are frequently built with informal construction practices given the low technological level required [1,2,3]. Such buildings have a low ductility, which makes them vulnerable to damage [4]. The difference between masonry infilled frames and confined masonry lies in the construction methodology, resulting in completely different load transfer mechanisms [5].
Recent reports, produced after the inspection of areas affected by strong earthquakes, have concluded that informally constructed reinforced concrete buildings responded with a low level of damage or did not collapse due to the contribution of the masonry [6]. Notably, it has been determined that the contribution of masonry is beneficial when the construction process is carried out with confined masonry structural systems, which present an acceptable performance even for modified Mercalli intensities between VIII and IX [7]. This acceptable performance contrasts with the precarious performance of other informal construction typologies that include unreinforced masonry or adobe buildings, which have presented much more severe damage or even collapse [8].
Following the Wenchuan earthquake [9], various problems associated with the damage and even collapse of confined masonry buildings were detected, including floor diaphragm failure, excessive floor deformation failure, and local failure by debonding in beams and columns as a result of cyclical loads. The authors of this work have previously highlighted the adequate behavior of buildings designed in accordance with modern codes, without achieving a notable improvement in the global ductility. Similarly, based on observations of buildings damaged during the Jaya (Indonesia) earthquake, the following types of failures in confined masonry buildings were identified: loss of anchor, failure due to in-plane shear, failure due to out-of-plane action, and differential settlement [10].
In another post-earthquake building survey campaign, this time in Sumatra, the team identified the causes of failure of confined masonry structures to be shear column failure, longitudinal reinforcement buckling, and premature masonry collapse [11]. Likewise, the earthquake that affected Ludian Province in 2014 [12] provided an opportunity for the authors to corroborate that the confined masonry buildings designed, according to current standards demonstrated adequate performance, especially those with a uniform distribution of masonry.
However, the beneficial effect of masonry on the seismic response of a reinforced concrete structure can produce a detrimental effect if the contribution of its stiffness and resistance is not taken into consideration [6]. In the event that the distribution of the masonry in the structure does not follow the uniformity and symmetry criteria in both plan and elevation, it can produce an irregular structure, whose dynamic response is completely different from the dynamic response of the concrete structures analyzed alone, causing torsional effects that mainly affect the columns of the outer frames [13]. Additionally, an inadequate distribution of masonry can produce harmful effects, such as changes in the dissipated energy and the generation of local failure mechanisms, such as the effects of a short column [6].
This detrimental effect of masonry can be described by taking the Ecuador earthquake of 16 April 2016, as an example [14]. In the city of Portoviejo, several buildings collapsed, among which it was possible to identify buildings with reinforced concrete frames in which the presence of masonry presumably caused an irregularity in the plan, producing a predominant torsional seismic response, and consequently the collapse of buildings located on corners. In previous work [15], some of these corner buildings were observed to have undergone extensive damage or even collapse. Among the possible causes of extensive damage and collapse, the authors point out that the level of acceleration far exceeded the acceleration of normative design, the excessive flexibility of the structures, the construction of vertical extensions, the existence of ground floors with open plans (commercial space) and the effect of siege in some locations in the city. Notably, the capacity of buildings subjected to corrosive environments rapidly degrades [15], a situation that may have affected damaged buildings but is not addressed in this research. Figure 1 shows two buildings located on Chile Street in Portoviejo that are currently damaged; note the predominant structural typology based on columns and slabs with flat beams and open facades. Figure 2 shows pre-earthquake and post-earthquake images of the Marinero building, which is also located on Chile Street in Portoviejo and had to be demolished because it collapsed under the effect of torsion.
This article studies the influence of masonry on the response of a model that attempts to reproduce the typology and the mechanical and geometric characteristics of the corner buildings of Portoviejo, obtaining the nonlinear response through incremental push (pushover) analysis and incremental dynamic analysis (IDA), with some records corresponding to the Ecuador earthquake of 16 April 2016.

2. Numerical Model for Confined Masonry Buildings

It is well documented that today, fewer tools are available for the analysis of confined masonry structures than there are for the analysis of reinforced concrete or steel structures. In the formulation of calculation programs for confined masonry structures, a compromise between the precision and the complexity of the model is necessary [16].
The use of macroscale finite element models (macro-models) is common in the numerical study of structures based on confined masonry [1,5,17,18,19,20]. The authors developed a macro-model for simple masonry and confined masonry based on smeared-crack total strain, validated with experimental results [21]. In the study of [22], the dependence of the seismic behavior of the macro-models on the following parameters was described in detail:
  • The strength of the masonry;
  • The density of the masonry walls;
  • The level of axial compression of the masonry walls;
  • The characteristics of the confining elements.
It was detected in this work that the computational models reviewed to date could not be considered appropriate to carry out the conventional evaluation of the capacity of this type of structure, especially due to their numerical instability [22]. In [23], the aspects that influence the seismic response of masonry structures were studied and determined using pushover analysis, especially for cases that can be classified as exhibiting soft-floor behavior:
  • Critical floor drift;
  • The total number of floors in the building;
  • The configuration of the applied lateral loads.
Among the models used for the analysis of masonry walls, whether simple, reinforced, or confined, the work of [19] incorporated the size of the masonry units (bricks) as a variable. The joint model was obtained by considering a connection with two nonlinear springs, one longitudinal and the other transverse, connected in parallel, and a contact element connected in series with the other springs. The study of [18] considered a constitutive model at the cohesion interface to simulate the behavior of cracks both in the concrete and in the masonry units and mortar joints, adopting an elastic-plastic model. During the numerical analysis of the cyclical response of masonry buildings, the influence of the following parameters has been determined: meshing, dilation angle, and boundary conditions [1].
The consideration of window and door openings in masonry walls introduces a number of additional modeling complications [5]. These openings have not been considered in this work. The presence of masonry has been included along only the perimeters of the studied building.
Most of the models used to numerically simulate the cyclical response of confined masonry buildings have been validated using laboratory tests in which the specimens were subjected to gravity loads and lateral loads in the masonry plane [1,24,25,26].

Inelastic Infill Panel Element

Among the finite element macro-models used to model inelastic infill masonry panels within frame structures, the one presented in the original work [27] and implemented by other authors [
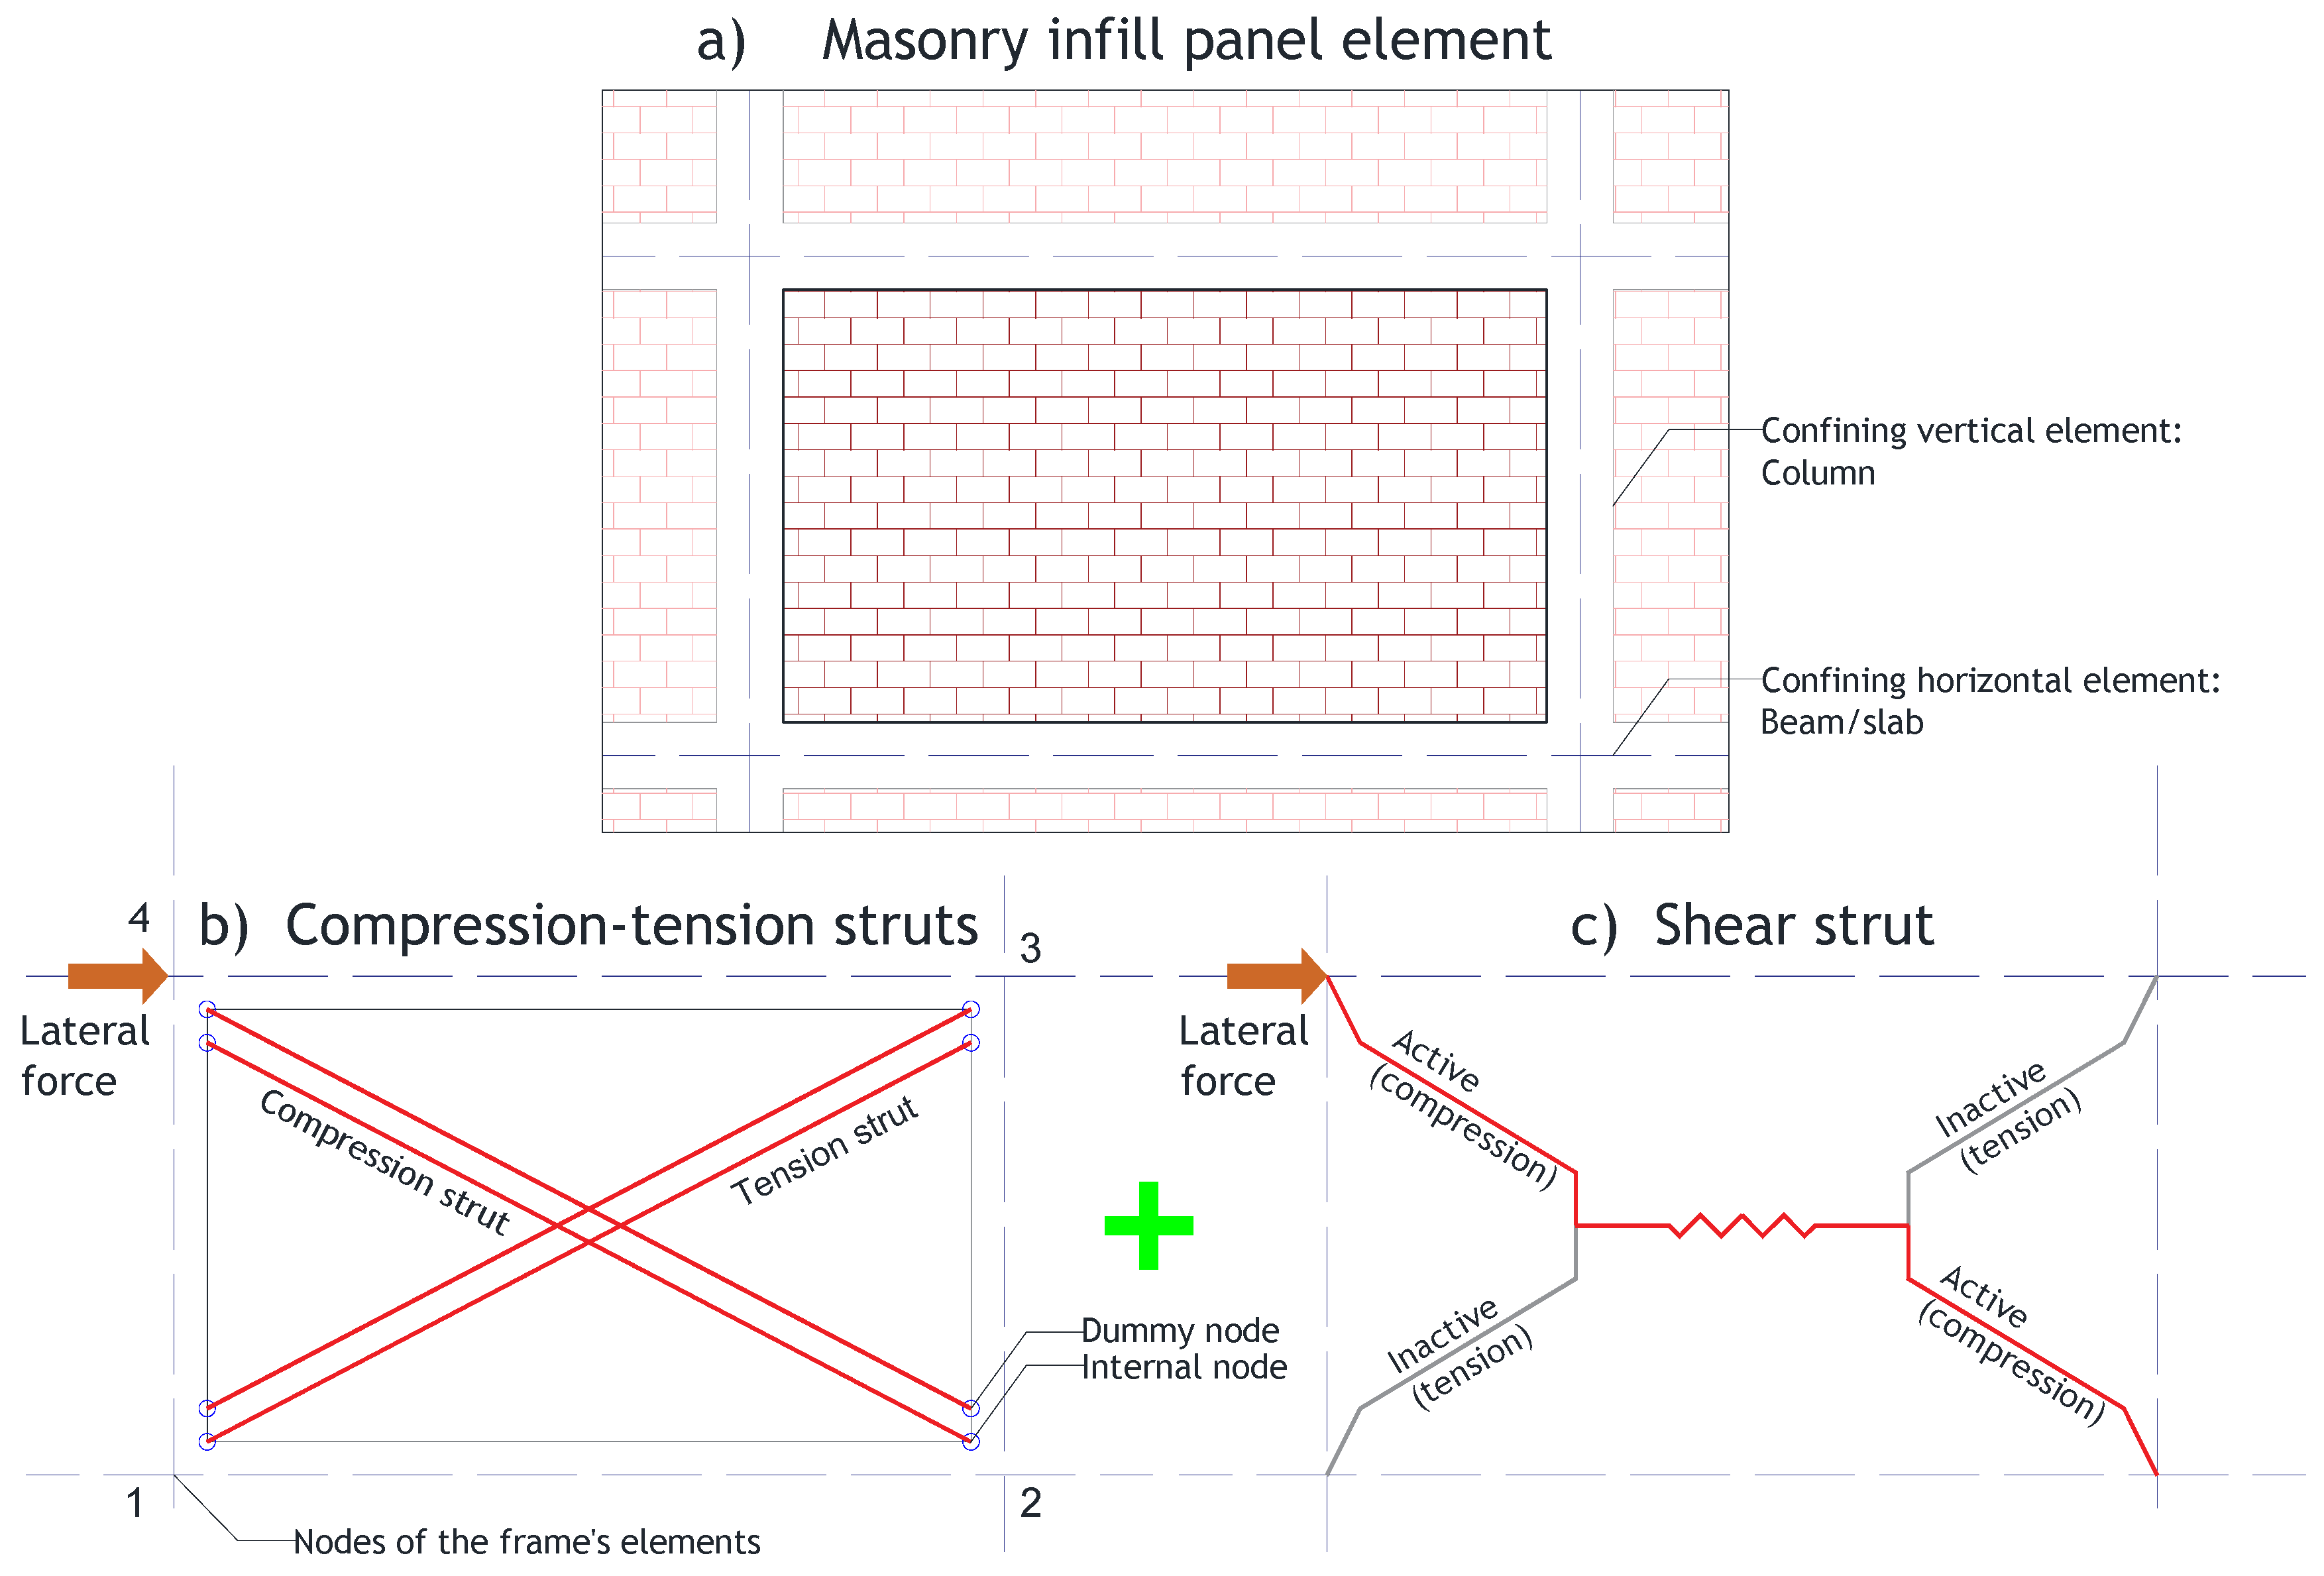
28], consisting of a four-node element, is highlighted here. In this macro-model, the structural elements of the frames act in association with the masonry infill panels, trying to reproduce what happens with these structural typologies when they are subjected to lateral displacements. In this macro-model, each masonry infill panel is represented by six struts that allows the interaction that occurs between the cracked masonry infill panels and the structural elements (beams and columns) that confine them to be captured (see Figure 3a). Each diagonal direction is represented by two parallel struts that receive the axial forces along the entire length of these diagonals, and a third diagonal that supports the shear that is transmitted from the top to the bottom of the masonry panel. This last strut acts in only the direction of the strut that works in compression, depending on the activation of the deformations reached in the panel (Figure 3c). The compression struts use a hysteretic strut model, and the shear strut uses a bilinear hysteretic model.
For the parallel struts, four internal nodes that allow the points of contact between the panel and the frame elements were set (Figure 3b), considering the dimensions of the cross-section of the columns and the beams that confine the panel. In addition, four dummy nodes were used to take into consideration the contact length between the panel and the structural frame. All the internal forces were transferred to the four outer nodes, which are defined as the common nodes where the beams and columns of the frame meet. By defining the internal nodes and the dummy nodes, the area of the compression or tension strut shown in Figure 3b was obtained. This area represents the cracking condition of the masonry infill panels, which reduces the contact between the panels and the frame elements that confine them.
The thickness of the masonry infill panels is defined from the width of the masonry units arranged in the analyzed structure, ignoring the contribution of the mortar used to bond the units. Finally, in this model, it is important to define the interstory drift that indicates the failure of the panel under the action of out-of-plane forces. This leads to the panels of the model being deactivated when this interstory drift is reached, so that the panels are unable to provide stiffness and resistance to the structure anymore, although the masonry continues to add weight to the structure.

3. Damage in Structures with Masonry Infill Panels

It is important to characterize the failure of masonry infill panels. To do so, the results of post-earthquake surveys were consulted, where it was determined that global plasticization in confined masonry buildings occurs with drifts of approximately 0.5% and 0.9% [9]. In a numerical study [4], the authors reported the following drifts for confined masonry buildings: for formal buildings, drifts of 0.4% and 0.8% correspond to the maximum response and collapse, respectively, while for informal buildings, these drifts are 0.25% and 0.5%, respectively. On the other hand, the sudden loss of stiffness that affects the overall stiffness of buildings is achieved at very low floor drifts. The authors [15] have indicated that for a drift of 0.1%, 50% of the stiffness of the walls is lost, while for a drift of 0.5%, up to 84% of the stiffness of the walls is lost.
The type of failure of confined masonry buildings designed according to industry standards shows adequate resistance to strong seismic actions, as was demonstrated in [16], in which a value of up to 0.8 g was reached in shaking table tests, producing global collapse through the weak ground floor mechanism. In terms of damage to confined masonry buildings, two main types must be distinguished: out-of-plane stress failures and in-plane stress failures. For this last type of failure, numerous researchers have proposed certain displacements or drifts associated with certain behavioral states [6].
On the other hand, in [29], it was proposed that for interstory drifts between 0.4% and 1.5%, the masonry is expected to fail, while in [30], it was considered that cracking occurs in masonry walls at lower drifts of approximately 0.25%. An extreme state of damage in masonry walls has been reported in [5], indicating that the experimental results show that the bricks undergo crushing when an interstory drift of 1.4% occurs. This value is very close to that indicated in [6], where a value of 1.5% is set for the limit at which the masonry collapses. The improvement in the behavior of masonry walls can be achieved by increasing the presence of confining elements (especially columns) and placing steel meshes in the seat of the masonry walls [15]. Finally, in [9], the maximum lateral resistance of confined masonry structures subjected to the action of earthquakes was reached at values between 0.5% and 0.9%.
The following section provides a concise and precise description of the numerical results, their interpretation, and the conclusions that were drawn.

4. Case Study

The case study focuses on an archetype of buildings that suffer extensive damage during earthquakes due to being located on corners. The fragility of these buildings was due to not only the aspects indicated above but also the inadequate interaction of the masonry infill panels with a very fragile structure, which caused torsion that ultimately resulted in the collapse of the buildings. According to [17], the irregular distribution of masonry infill panels in reinforced concrete buildings contributes to their collapse during earthquakes; however, the irregular distribution studied did not induce torsion. In the generated model, the irregular distribution of the masonry panels that existed in the collapsed corner buildings of Portoviejo is reproduced. This masonry panels were on the sides that adjoined neighboring buildings, while the other sides presented openings in the case of windows of the residential floors and accesses in the case of the commercial first floor. Clearly, the regular distribution of the masonry panels can generate a completely different dynamic response; however, the study focuses on the response of the representative model of the collapse, suggesting that the response of buildings with a regular distribution of masonry panels should be studied in the future.

Description of the Corner Building

The frames of the structure are made up of reinforced concrete beams and columns. The slabs are ribbed in two directions with a thickness of 0.20 m and are filled with blocks of clay. The beams have inverted sections with dimensions of 0.50 × 0.20 m, and six longitudinal reinforcement bars 10 mm in diameter, and stirrups 6 mm in diameter separated every 0.15 m. According to these dimensions, the beams are embedded within the slabs. The columns have cross-sections with dimensions of 0.35 × 0.35 m, with six longitudinal reinforcement bars 16 mm in diameter and stirrups 8 mm in diameter separated every 0.20 m. Both the dimensions of the sections and the reinforcement considered for the elements correspond to conditions similar to those existing in the collapsed buildings in Portoviejo before the earthquake. Figure 4 shows the floor plan of the studied building, with four structural axes in each direction equally spaced every 3.5 m. The masonry infill panels are included toward the north and east ends of the plan. Figure 5 shows elevation views of the building’s frames, where the height of the first floor is dedicated to commerce (3.5 m), while the rest of the floors have heights of 2.8 m since they are residences. The resulting model has similar geometric and mechanical characteristics in both the X and Y directions.
The characteristics of the materials used in the numerical model are summarized in Table 1. The resistance values of the concrete and steel used in the model are typical of the structures present in Portoviejo when the earthquake occurred. The behavior curve of Mander et al. is used for the model concrete [31], and the Menegotto and Pinto curve is used for the steel [32], which are available in the SeismoStruct program [33]. The resistance of the masonry units is estimated by taking into account that they are of the ceramic type and manufactured with low-quality control [4,17].
Traditionally, the analysis of this type of building is carried out neglecting the stiffness provided by the masonry, only considering its weight, or its mass in the dynamic analysis.
To perform the nonlinear analysis, the characteristics of the macro-model struts are defined, and the compression strut parameters are summarized in Table 2. Of these parameters, the most relevant is the compressive strength, which corresponds to the strength of the masonry infill panel as a whole, not just the masonry units. This parameter shows high variability among the relevant studies consulted [1,2,4,9,15,16,17,18,19,21] and is determined based on the shear strength calculated under diagonal compression. The initial Young’s modulus also exhibits high variability and has been determined to be 1000 times the value of the compressive strength, as recommended in previous works [34,35].
The parameters of the shear strut are summarized in Table 3. The shear bond strength also tends to vary. Among those reported by different authors, a value of 0.3 MPa is selected for this work, which is the minimum reported in [36] and is within the range of values from 0.1 to 1.5 MPa suggested in [37]. The maximum shear strength depends on the masonry shear failure mode (shear friction failure, diagonal tensile failure, and compressive failure). It is estimated by adding an additional resistance to the already defined shear bond strength, reaching a value of 0.5 MPa.
The model of the building studied is shown in Figure 6. In this figure, the masonry infill panels are located on the sides of the building that face other buildings, while the sides without masonry infill panels correspond to open facades due to the presence of windows (residential levels) and doors (commercial first level).
To obtain an approximation of the dynamic behavior of the model with masonry infill panels, modal analysis of the structure was performed, obtaining the values of the periods and the percentages of the participating masses of the first nine vibration modes, which are presented in Table 4. The second vibration mode corresponds to a translational mass with equal participatory masses in both directions, which gives rise to a similar behavior of the structure in both the X and Y directions due to the correspondence in the geometry in these directions. In turn, this allows the characterization of the seismic response by performing one-way analysis. The deformed shapes of the first three modes are shown in Figure 7. These first three modes of vibration concentrate the largest participatory mass in each direction of analysis.

5. Determination of the Seismic Response of the Case Studied

With the structural model, two types of analyses are carried out in a nonlinear range that is the most appropriate to determine the seismic response of buildings [37]. The first is the analysis with incremental thrust, both conventional and adaptive, while the second is the IDA, using records of the seismic event that occurred on the Ecuadorian coast and that caused the failure of the buildings located in Portoviejo. The details of these analyses are provided below.

5.1. Nonlinear Static Analysis

Nonlinear static analysis (pushover) has been applied to the model considering the distribution of lateral loads corresponding to the distribution of the first mode of vibration [38], although it is evident that the structural axis with masonry infill panels (axis D) has a stiffness greater than that of a structural axis without masonry infill panels (axes A, B, and C) (Figure 4). In this way, the effect of the irregularity in the stiffness distribution on the torsional behavior of the structure can be captured. The nonlinear static analysis is carried out in both the conventional and adaptive modes, since the validity of the first type of analysis is limited by the irregular nature of the structure, conferred by the presence of unevenly distributed masonry infill panels. The advantage of adaptive nonlinear static analysis is that it allows the variations in the lateral stiffness of the model to be captured when it undergoes alterations in its elements. The capacity curves of the conventional nonlinear static analysis are shown in Figure 8, in which the curves corresponding to the X direction of analysis change in both the positive and negative directions (see Figure 8a,b, respectively). The capacity curves show the evolution of the normalized basal shear with respect to the seismic weight vs. the normalized ceiling displacement with respect to the total height of the building (global drift). Additionally, note that the nonlinear analysis is carried out in only the X direction since the Y direction is similar in both the geometric and mechanical characteristics adopted. These curves show how the failure of the masonry infill panels affects the overall response of the structure (for a global drift close to 0.8%); however, this failure is not well defined in the curves obtained from the conventional analysis.
On the other hand, the capacity curves obtained when applying adaptive pushover analysis, which are presented as variants of the vector of lateral forces applied to the structure by virtue of the changes that take place in the modal shapes as different levels of element damage occur as the simulation progresses, are interesting. The capacity curves in Figure 9a,b are shown with the idealized curves, which are determined using the method proposed in [39,40]. With the ultimate displacement and the yield displacement of the idealized curve, the ductility ( μ ) of the model is determined according to Equation (1) with the ultimate displacement ( Δ u ) and the yield displacement ( Δ y ), and is summarized in Table 5. Note that, although the results of the ductility calculated with the conventional and adaptive curves are quite similar, the adaptive nonlinear static analysis has allowed the curves for which the global drift resulted in the failure of the masonry infill panels to be clearly identified.
μ = Δ u Δ y
Another of the characteristics of the response that is interesting to evaluate is the variation in the rotations with respect to the displacements at the center of gravity of the roof level during the pushover analysis. Figure 10a,b show the results of the rotations at the centers of gravity ( C G ) of each floor for both the conventional and adaptive incremental pushover analyses. Beyond the similarity of these curves, it can be seen that, at the beginning of the analysis, there is a linear increase in the rotations of the centers of gravity of each floor, but once a global drift of 0.8% is reached, there is a significant reduction in these rotations. However, residual rotations remain that cannot be recovered due to the displacement caused by the collapse of the building; thus, the failure mechanism clearly includes significant rotations in levels 3 and 4 of the building. This reduction in rotation is produced by the failure of the masonry infill panels, which cease to provide strength and stiffness to the structure, thereby reducing the eccentricity caused by torsion. Additionally, each floor reaches the maximum rotation at different displacements, although these displacements are very similar. On the other hand, the maximum rotation is reached at the roof level of the building (0.0074 rad). This implies that the columns farthest from the center of mass of this level reach global drifts approximately 0.3% higher than the previously mentioned global drift of 0.8%, which implies that the frames associated with these columns (perimeter frames) undergo greater damage as the lateral displacements increase.

5.2. Incremental Dynamic Analysis

IDA is an analysis that is carried out in the nonlinear range using a set of registers or synthetic accelerograms as dynamic excitation to obtain the performance of structures [41]. IDA is applied to the studied structure using a set of four records with a double component of the earthquake of 16 April 2016, obtained at different seismological stations in Ecuador [42]. Table 6 shows the main characteristics of these records, while Figure 11 and Figure 12 show the seismic records and their response spectra, respectively. Note the different durations of the records, as well as the maximum acceleration values achieved [43]. IDA makes it possible to determine the seismic capacity of the structures considering the variability in the records used [44,45,46] and to objectively obtain the seismic performance factors of structural typologies [47].
Regarding the cyclical behavior of confined masonry structures, the energy dissipation capacity is determined by the throttling of the hysteresis loops [39,40]. This behavior is reflected in the IDA curves in Figure 13, obtained by plotting the values of the maximum interstory drifts ( I D m a x ) obtained in the centers of gravity of the floors of the building vs. the spectral acceleration ( S a )   corresponding to the predominant period in the direction of analysis. Note that the average curve has a collapse threshold value lower than 0.2 g. The collapse threshold S C T is defined on the average curve at the point where it undergoes a reduction in stiffness, such that the current stiffness is less than 20% of the initial stiffness of the curve. This criterion for capturing the collapse threshold, based on stiffness reduction, corresponds to the criterion originally formulated in [41]. By including the interstory drift as a damage measure ( D M ) of the analysis, when an increase in the drift occurs, the reduction in the slope of the curve also occurs; therefore, the criterion adopted preserves a relationship with the overall damage of the structure.
Finally, with the S C T value resulting from the set of IDA curves and with the total deviation calculated from the data recommended in FEMA P-695 [47], the collapse fragility curve that gives the probability values of exceedance for a horizontal acceleration of the ground is obtained. The total system collapse uncertainty β T O T is computed with
β T O T = β R T R 2 + β D R 2 + β T D 2 + β M D L 2 0.95
where β R T R is the record-to-record collapse uncertainty, β D R is the design requirement-related collapse uncertainty, β T D is the test data-related collapse uncertainty, and β M D L is the modeling-related collapse uncertainty. The values of the different types of uncertainty recommended according to the specific conditions of the building studied are summarized in Table 7.
The collapse fragility curve is obtained using a lognormal distribution in which the mean value of the collapse spectral acceleration is S C T = 0.165   g and the total system collapse uncertainty is β T O T = 0.95 (Figure 14). The fragility curves are especially useful for determining the seismic vulnerability of structures [45,46] since they give the probability of exceeding a limit state of the specific behavior, in this particular case, the limit state of collapse. With the collapse fragility curve, it is possible to determine the exceedance probability corresponding to the acceleration demands introduced by the components of the Portoviejo record for the predominant period of the structure (1.01 g in the northeast direction and 2.13 g in the southwest direction). For these values, a probability of exceedance greater than 96% is reached, which explains the collapse of this type of structure during the earthquake of 16 April 2016.

5.3. Rotational Incremental Dynamic Analysis

IDA is usually performed by taking into consideration damage measures that have special significance from a performance point of view. This is how the use of global drift interstory drift has become widespread, which is related to the advance of the damage to the structures. However, given the special conditions exhibited by the building studied here, and similar buildings, it is necessary to ask whether the aforementioned parameters are the most appropriate to carry out an IDA that truly captures the effect of the torsion experienced by this type of building.
For this reason, as a result of this research, two candidates for damage measurement are explored and compared. First, the relative rotation of the center of gravity of each floor with respect to the foundation level is used as an engineering demand parameter. Thus, the curve of Figure 15a is obtained according to the evolution of the rotations of the centers of gravity as the value of the spectral acceleration is increased by 5% of the critical damping. The other candidate for the damage measure is the relative rotation of successive floors (see Figure 15b), which, although they result in curves similar to those of the floor rotations, do not show a trend as defined by the curves obtained using this last parameter as a damage measure.

6. Discussion of the Results

Nonlinear static analysis provides a good characterization of the seismic response of regular structures. In the present research, this analysis is used, considering its limitations, to capture the torsional behavior of a complete structure and to use the results as a basis for characterization before applying IDA. The results of this analysis show that the structure presents a low displacement ductility, calculated from the capacity curves determined by applying conventional and adaptive procedures. On the other hand, it is possible to observe the influence of the stiffness and resistance of the masonry infill panels on the lateral deformations of the structure. Upon reaching a global drift of the center of gravity at the roof of approximately 1%, the masonry infill panels cease to provide stiffness, and there is a sudden loss in the overall stiffness of the structure, which affects the sharp reduction in rotation as the lateral loading increases, since the structure loses much of its eccentricity. In addition, upon reaching the maximum rotation of the roof’s center of gravity, additional lateral displacements are imposed on the columns farthest from it, which implies an increase in the global drift of approximately 0.3%. This increase reflects a higher concentration of rotations in the frames than in the columns (perimeter frames) and is introduced due to the displacements with a component normal to the plane, which especially affects the masonry infill panels.
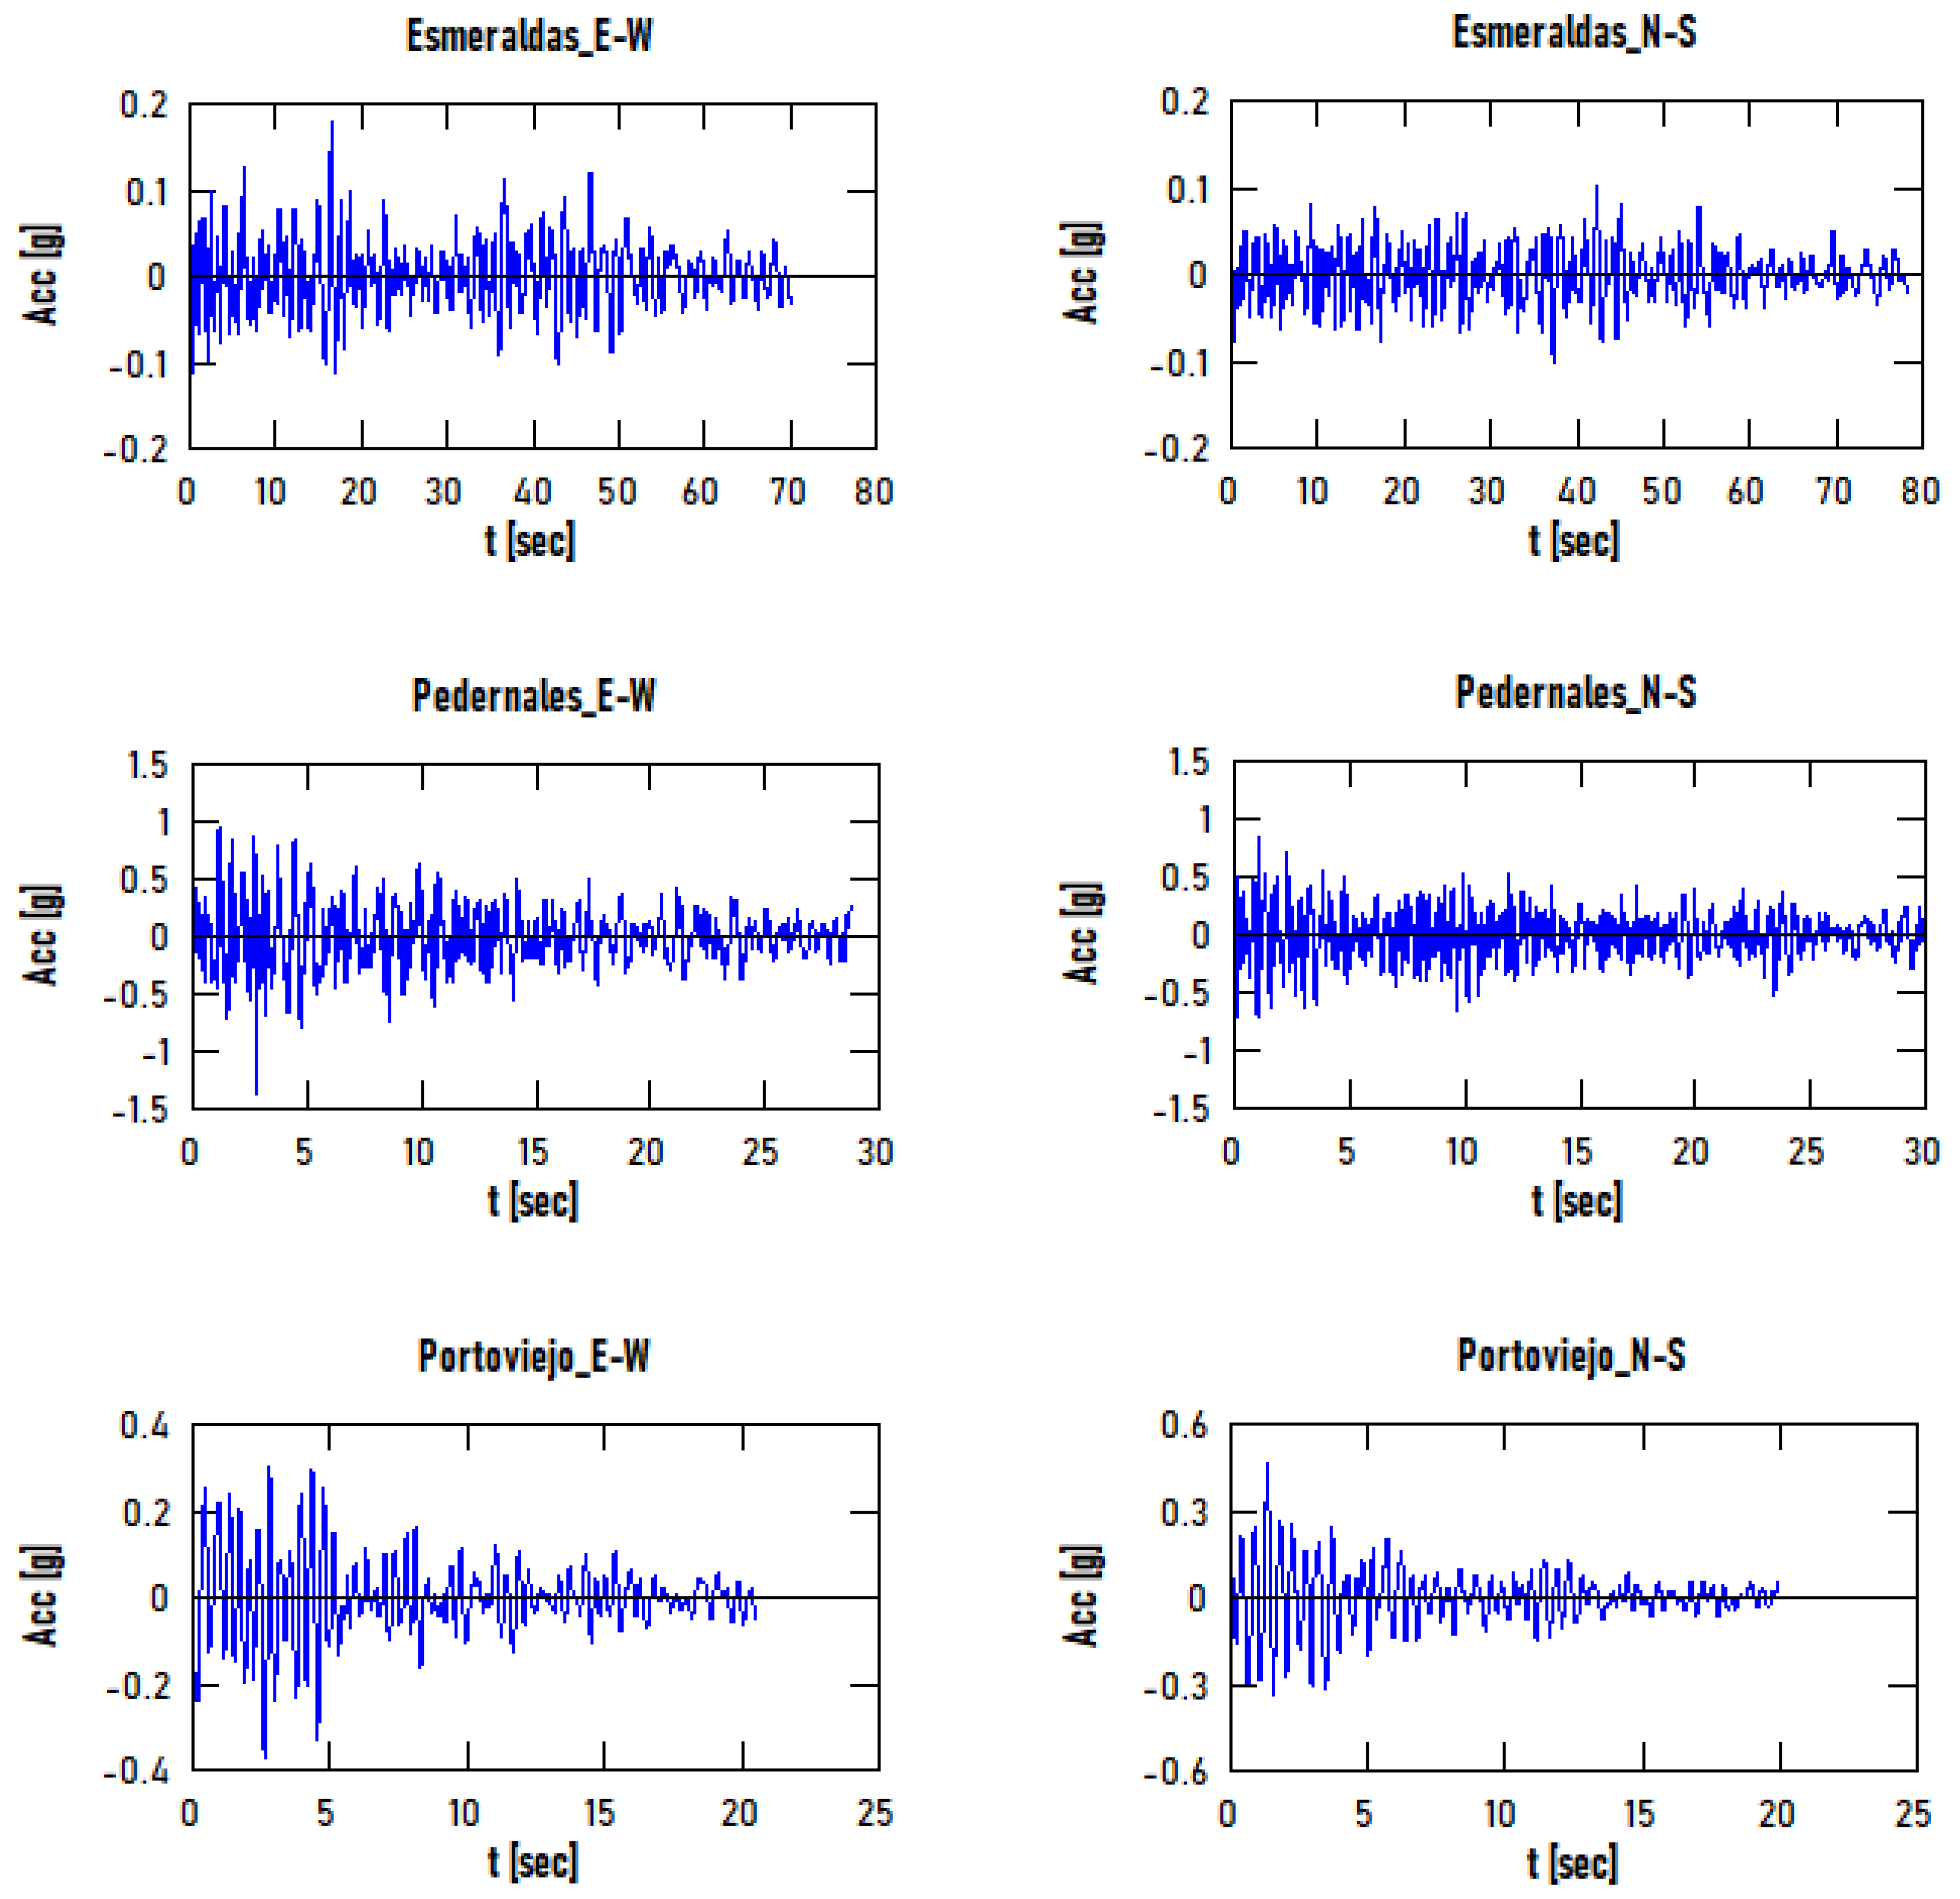
The IDA applied using accelerograms recorded during the Ecuador earthquake of 16 April 2016, results in curves that are not very dispersed, with very well defined points of collapse for the sections in which at least 20% of the initial stiffness has been lost.
Regarding the fragility curve obtained for this type of building, it is evident that, for moderate accelerations, for example, 0.2 g, the building would reach a high probability of exceeding the collapse limit state (approximately 60%). However, if the probability of exceedance is calculated for the basic acceleration of the current design for the coastal zone of Ecuador [48], which contains the city of Portoviejo (0.5 g), the probability of exceedance of the collapse limit state is approximately 90%. If the accelerations achieved in the response spectra of the two components of the record obtained in Portoviejo are taken into account, exceedance probabilities very close to 100% are obtained.
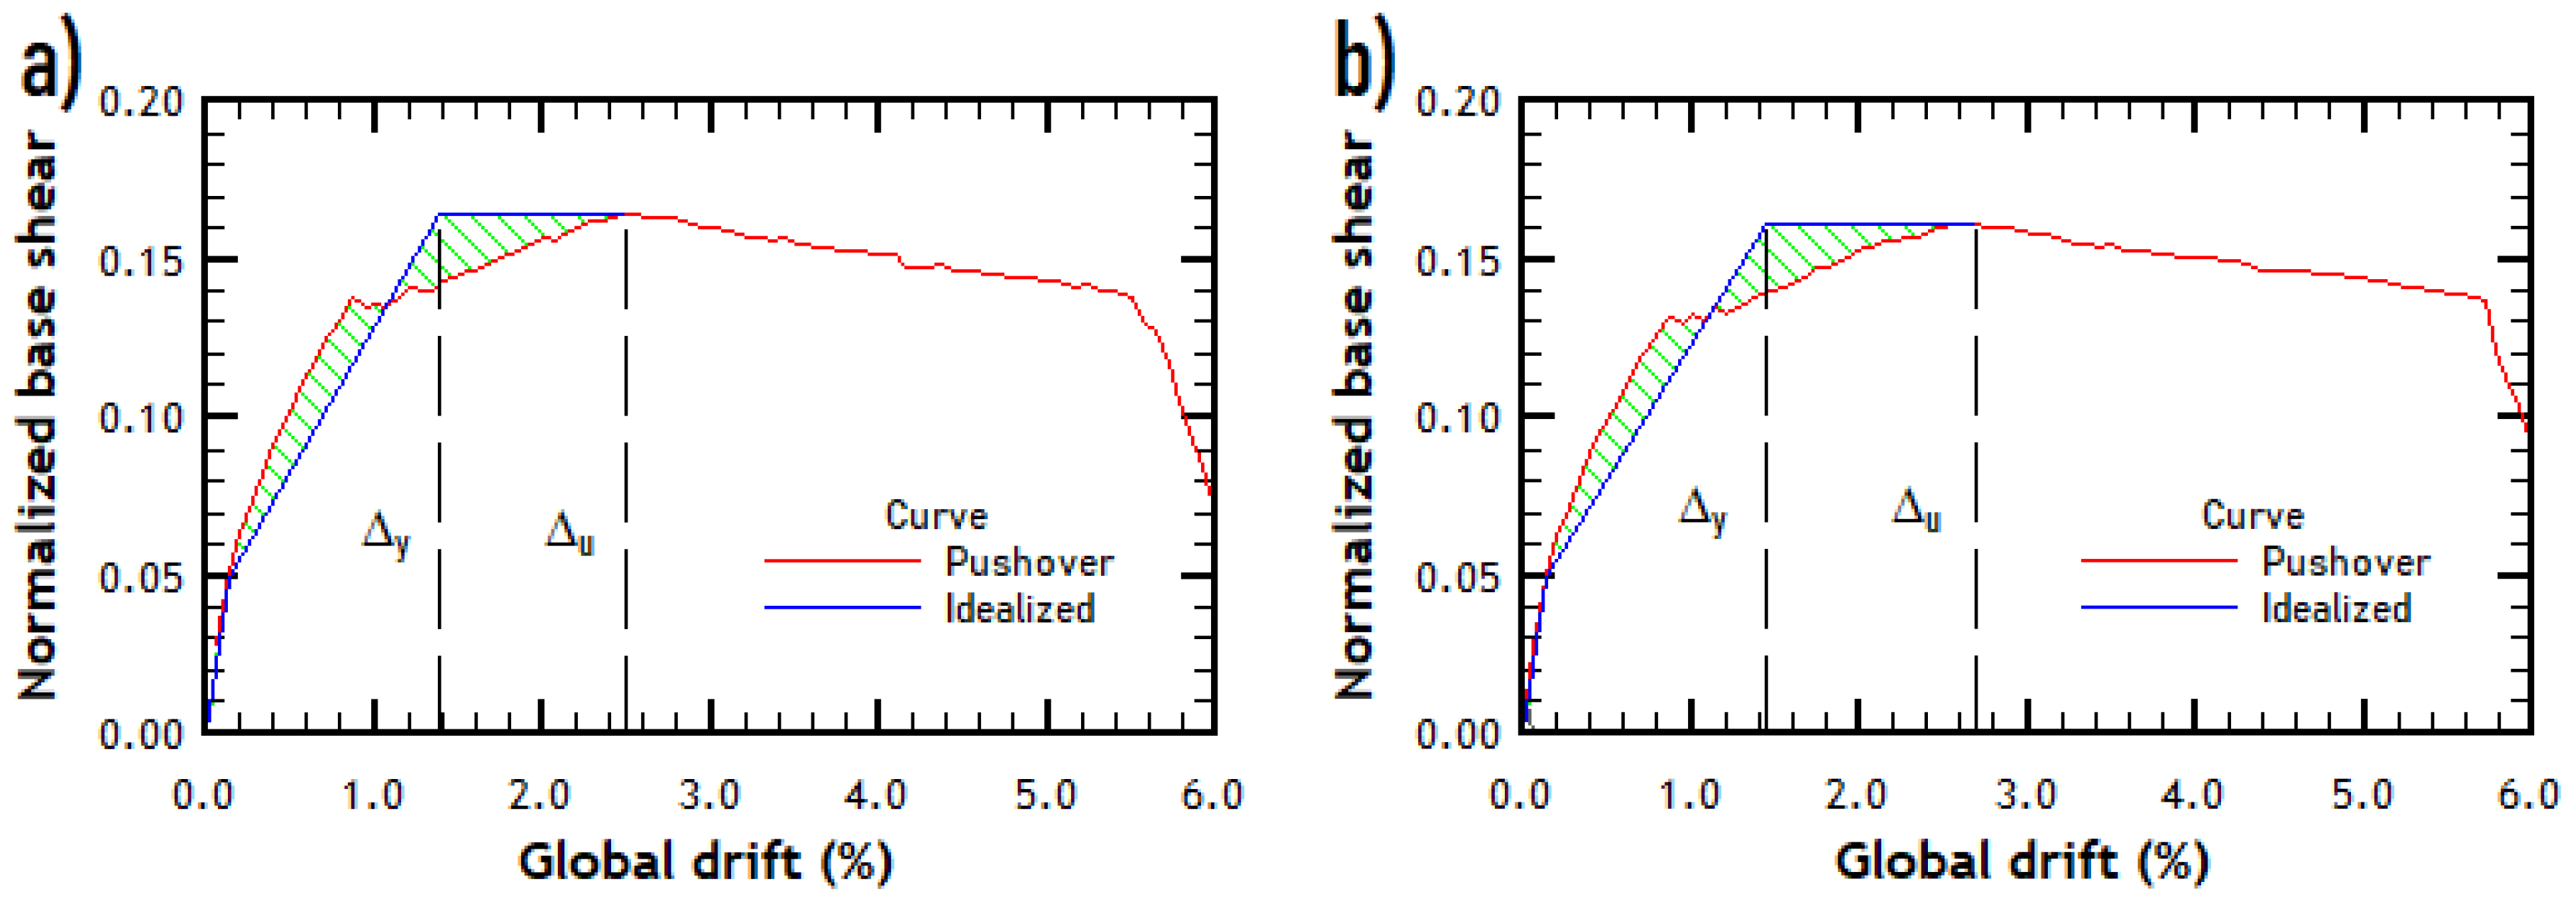
Based on the floor rotations obtained from the IDA, it can be clearly seen that, for both the negative and positive maximum rotations, the floors show an increase up to a certain value of spectral acceleration slightly higher than 0.10 g. At this threshold, the seismic action causes the collapse of the masonry infill panels, and without that contribution to the stiffness of the extreme frames, this change drastically reduces the torsional behavior of the building; all the rotations reduce to a minimum value corresponding to a spectral acceleration of approximately 0.17 g. After this, an increase in rotations is again experienced due to the increase in lateral displacements induced by the application of accelerograms with ordinates of greater amplitude and the presence of the weight of the masonry, which remains, although it no longer contributes to the lateral stiffness of the building. This behavior is similar to that experienced by the rotations of the centers of gravity when applying the different types of pushover analyses reported in Figure 8a,b.
On the other hand, the relative rotation of the centers of gravity between successive floors is considered applicable to measure the damage concentrated in a specific floor, considering a kind of local concentration of rotations similar to that observed when determining the interstory drifts based on the relative displacements. However, the curves shown in Figure 15b do not exhibit a clear trend in the evolution of these relative rotations, for which it is recommended to use the relative rotation of the center of gravity with respect to the foundation level as a damage measure (see Figure 15b), providing new possibilities for the study of the dynamic behavior of buildings that, due to their irregularity, are prone to a response dominated by torsion instead of translation.

7. Concluding Remarks

First, the need to incorporate the contribution of masonry infill panels to the strength and stiffness of the structure in design is evident, since at present, seismic codes take into account the contribution of only the seismic weight of buildings. The results presented above show how the response of the structure in the case study was altered by the presence of the masonry infill panels.
The model used here captured the failure mode of the corner buildings that failed in Portoviejo as a consequence of the earthquake that shook the Ecuadorian coast in 2016. The behavior of these buildings was clearly torsional due to the effect of the eccentricity introduced by the resistance and stiffness contributions of the masonry infill panels located on the boundaries of the buildings.
Although nonlinear static analysis (pushover) is not the most effective method of obtaining the nonlinear response of irregular structures, it provided certain indications that allow cataloging the seismic behavior of the case studied. On the one hand, it provided global ductility values lower than 2, which are characteristic of fragile buildings, and on the other hand, it provided evidence of the occurrence of the loss of lateral stiffness of corner buildings. Adaptive nonlinear static analysis was shown to be more suitable for capturing the masonry panel failure threshold than conventional analysis.
The incremental dynamic analysis of the model revealed the inadequate resistance of this type of building, which may result in an inadequate performance under dynamic action. The fragility curve obtained by applying a set of records obtained from the seismic event that triggered the failure of the Portoviejo buildings indicated a high probability that the limit state of collapse of this type of building was exceeded when considering the basic acceleration indicated by the Ecuadorian Construction Code for the site area or the values of the spectral acceleration corresponding to the response spectra of the components of the Ecuador earthquake of 16 April 2016, recorded in Portoviejo.
The results of the incremental dynamic analysis using the relative rotation of the centers of gravity with respect to the floor level as a damage measure show that the floor rotations, instead of the interstory drifts or the global drift, can provide useful indicators of the threshold at which significant changes in stiffness occur in buildings that are irregular in plan due to the presence of masonry infill panels. Further studies are required on different configurations of irregular buildings to validate the use of floor rotation as a damage measure. Based on the results obtained, it is suggested that studies are carried out on the effect of uniformly distributed masonry panels on the response of buildings.

Author Contributions

Conceptualization, J.C.V., R.A., C.F. and A.Z.; methodology, A.Z. and J.C.V.; software, J.C.V.; validation, R.A., C.F. and A.Z.; formal analysis, J.C.V.; investigation, J.C.V.; resources, A.Z.; data curation, A.Z. and C.F.; writing—original draft preparation, J.C.V.; writing—review and editing, J.C.V., R.A., C.F. and A.Z.; visualization, J.C.V.; supervision, R.A.; project administration, C.F.; funding acquisition, C.F., A.Z. and J.C.V. All authors have read and agreed to the published version of the manuscript.

Funding

This research was funded by the Pan-American Institute of Geography and History (grant number IPGH GEOF 01-2018), and the article processing charge (APC) was funded by Pontificia Universidad Católica de Valparaíso.

Data Availability Statement

The data is available in the google-drive of the corresponding author.

Acknowledgments

The authors are grateful to the destructive potential project work in response to the earthquake in Ecuador on 16 April 2016, presented to the Technical Assistance Program (PAT) of the Pan American Institute of Geography and History, IPGH GEOF 01-2018.

Conflicts of Interest

The authors declare no conflict of interest. The funders had no role in the design of the study; in the collection, analyses, or interpretation of data; in the writing of the manuscript; or in the decision to publish the results.

References

  1. Borah, B.; Kaushik, H.B.; Singhal, V. Finite element modelling of confined masonry wall under in-plane cyclic load. IOP Conf. Ser. Mater. Sci. Eng. 2020, 936, 012020. [Google Scholar] [CrossRef]
  2. Mebarki, A.; Boukri, M.; Laribi, A.; Farsi, M.; Belazougui, M.; Kharchi, F. Seismic vulnerability: Theory and application to Algerian buildings. J. Seismol. 2014, 18, 331–343. [Google Scholar] [CrossRef]
  3. Piroglu, F.; Ozakgul, K. Site investigation of masonry buildings damaged during the 23 October and 9 November 2011 Van Earthquakes in Turkey. Nat. Hazards Earth Syst. Sci. 2013, 13, 689–708. [Google Scholar] [CrossRef] [Green Version]
  4. Lovon, H.; Tarque, N.; Silva, V.; Yepez-Estrada, C. Development of fragility curves for confined masonry buildings in Lima, Peru. Earthq. Spectra 2018, 34, 1339–1361. [Google Scholar] [CrossRef]
  5. Singhal, V.; Rai, D.C. Behavior of confined masonry walls with openings under in-plane and out-of-plane loads. Earthq. Spectra 2018, 34, 817–841. [Google Scholar] [CrossRef]
  6. Vicente, R.S.; Rodrigues, H.; Varum, H.; Costa, A.; da Silva, J.A.R.M. Performance of masonry enclosure walls: Lessons learned from recent earthquakes. Earthq. Eng. Eng. Vib. 2012, 11, 23–34. [Google Scholar] [CrossRef]
  7. Ademović, N.; Hadzima-Nyarko, M.; Zagora, N. Seismic vulnerability assessment of masonry buildings in Banja Luka and Sarajevo (Bosnia and Herzegovina) using the macroseismic model. Bull. Earthq. Eng. 2020, 18, 3897–3933. [Google Scholar] [CrossRef]
  8. Preciado, A.; Ramirez-Gaytan, A.; Santos, J.C.; Rodriguez, O. Seismic vulnerability assessment and reduction at a territorial scale on masonry and adobe housing by rapid vulnerability indicators The case of Tlajomulco Mexico. Int. J. Disaster Risk Reduct. 2019, 44, 101425. [Google Scholar] [CrossRef]
  9. Su, R.K.L. Typical Collapse Modes of Confined Masonry Buildings under Strong Earthquake Loads. Open Constr. Build. Technol. J. 2011, 5, 50–60. [Google Scholar] [CrossRef] [Green Version]
  10. Idris, Y.; Cummins, P.; Rusydy, I.; Muskin, U.; Syamsidik, M.Y.H.; Meilianda, E. Post-Earthquake Damage Assessment after the 6.5 Mw Earthquake on December, 7th 2016 in Pidie Jaya, Indonesia. J. Earthq. Eng. 2019, 1–17. [Google Scholar] [CrossRef]
  11. Sanada, Y. Investigation and analysis of buildings damaged during the september 2007 Sumatra, Indonesia earthquakes. J. Asian Archit. Build. Eng. 2008, 7, 371–378. [Google Scholar] [CrossRef]
  12. Chen, H.; Xie, Q.; Dai, B.; Zhang, H.; Chen, H. Seismic damage to structures in the M s6.5 Ludian earthquake. Earthq. Eng. Eng. Vib. 2016, 15, 173–186. [Google Scholar] [CrossRef]
  13. Fardis, M.N. Seismic design issues for masonry- infilled rc frames. In Proceedings of the First European Conference on Earthquake Engineering and Seismology, Geneve, Switzerland, 3–8 September 2006. Paper 313. [Google Scholar]
  14. Aguiar, R.; Mieles, Y. Analysis of buildings that collapsed of Portoviejo during the earthquake of 16 april 2016. Rev. Int. Ing. Estruct. 2016, 21, 257–282. [Google Scholar] [CrossRef]
  15. Niu, L.H.; Zheng, S.S.; Li, L. Experimental study on the seismic behavior of masonry walls under offshore environment. Structures 2020, 28, 433–445. [Google Scholar] [CrossRef]
  16. Marques, R.; Pereira, J.M.; Lourenço, P.B. Lateral in-plane seismic response of confined masonry walls: From numerical to backbone models. Eng. Struct. 2020, 221, 111098. [Google Scholar] [CrossRef]
  17. Tomaževič, M.; Klemenc, I. Verification of seismic resistance of confined masonry buildings. Earthq. Eng. Struct. Dyn. 1997, 26, 1073–1088. [Google Scholar] [CrossRef]
  18. Koutromanos, I.; Stavridis, A.; Shing, P.B.; Willam, K. Numerical modeling of masonry-infilled RC frames subjected to seismic loads. Comput. Struct. 2011, 89, 1026–1037. [Google Scholar] [CrossRef]
  19. Campbell, J.; Durán, M. Numerical model for nonlinear analysis of masonry walls. Rev. La Constr. 2017, 16, 189–201. [Google Scholar] [CrossRef] [Green Version]
  20. Angelillo, M.; Cardamone, L.; Fortunato, A. A numerical model for masonry-like structures. J. Mech. Mater. Struct. 2010, 5, 583–615. [Google Scholar] [CrossRef] [Green Version]
  21. Medeiros, P.; Vasconcelos, G.; Lourenço, P.B.; Gouveia, J. Numerical modelling of non-confined and confined masonry walls. Constr. Build. Mater. 2013, 41, 968–976. [Google Scholar] [CrossRef]
  22. Ahmed, A.; Shahzada, K. Seismic vulnerability assessment of confined masonry structures by macro-modeling approach. Structures 2020, 27, 639–649. [Google Scholar] [CrossRef]
  23. Su, R.K.L.; Tang, T.O.; Lee, C.L. Evaluation of local and global ductility relationships for seismic assessment of regular masonry-infilled reinforced concrete frames using a coefficient-based method. Earthq. Struct. 2013, 5, 1–22. [Google Scholar] [CrossRef]
  24. Chourasia, A.; Singhal, S.; Parashar, J. Seismic performance evaluation of full-scale confined masonry building using light weight cellular panels. J. Build. Eng. 2020, 32, 101473. [Google Scholar] [CrossRef]
  25. Xu, H.; Wu, H.; Gentilini, C.; Su, Q.; Zhao, S. Experimental study on seismic failure modes of confined masonry structures with different enhancements. Key Eng. Mater. 2017, 747, 594–603. [Google Scholar] [CrossRef]
  26. Nader, A.; Galal, K. Experimental investigation of axial load and detailing effects on the inelastic response of reinforced concrete masonry structural walls with boundary elements. J. Struct.-Eng. 2020, 146, 04020259. [Google Scholar] [CrossRef]
  27. Crisafulli, F.J. Seismic Behaviour of Reinforced Concrete Structures with Masonry Infills. Ph.D. Thesis, University of Canterbury, Christchurch, New Zealand, 1997. [Google Scholar]
  28. Smyrou, E.; Blandon, C.A.; Antoniou, S.; Pinho, R.; Crisafulli, F. Implementation and verification of a masonry panel model for nonlinear dynamic analysis of infilled RC frames. Bull. Earthq. Eng. 2011, 9, 1519–1534. [Google Scholar] [CrossRef]
  29. Magenes, G.; Pampanin, S. Seismic response of gravity-load design frames with masonry infills. In Proceedings of the 13th World Conference on Earthquake Engineering, Vancouver, BC, Canada, 1–6 August 2004. [Google Scholar]
  30. Bell, D.K.; Davidson, B.J. Evaluation of Earthquake Risk Buildings with Masonry Infill Panels. In Proceedings of the 2001 Technical Conference, Future Directions: A Vision for Earthquake Engineering in New Zealand, New Zealand Society for Earthquake Engineering Taupo, Taupo, New Zealand, 23–25 March 2001. [Google Scholar]
  31. Menegotto, M.; Pinto, P.E. Method of analysis for cyclically loaded R.C. plane frames including changes in geometry and non-elastic behaviour of elements under combined normal force and bending. In Symposium on the Resistance and Ultimate Deformability of Structures Acted on by Well Defined Repeated Loads; International Association for Bridge and Structural Engineering: Zurich, Switzerland, 1973; pp. 15–22. [Google Scholar]
  32. Mander, J.B.; Priestley, M.J.N.; Park, R. Theoretical stress-strain model for confined concrete. J. Struct. Eng. 1988, 114, 1804–1826. [Google Scholar] [CrossRef] [Green Version]
  33. Seismosoft, SeismoStruct 2018—A Computer Program for Static and Dynamic Nonlinear Analysis of Framed Structures. 2018. Available online: http://www.seismosoft.com (accessed on 1 May 2018).
  34. Sahlin, S. Structural Masonry; Prentice-Hall Inc.: Hoboken, NJ, USA, 1971. [Google Scholar]
  35. Paulay, T.; Priestley, M.J.N. Seismic Design of Reinforced Concrete and Masonry Buildings; John Wiley & Sons Inc.: New York, NY, USA, 1992. [Google Scholar]
  36. Hendry, A.W. Structural Masonry; Macmillan Education Ltd: London, UK, 1990. [Google Scholar]
  37. Porcu, M.C.; Vielma, J.C.; Panu, F.; Aguilar, C.; Curreli, G. Seismic retrofit of existing buildings led by non-linear dynamic analyses. Int. J. Saf. Secur. 2019, 9, 201–212. [Google Scholar] [CrossRef]
  38. Vielma, J.C.; Barbat, A.H.; Oller, S. Seismic performance of waffled-slab floor buildings. Proc. Inst. Civ. Eng. Struct. Build. 2009, 162, 169–182. [Google Scholar] [CrossRef] [Green Version]
  39. Vielma, J.C.; Mulder, M. Improved procedure for determining the ductility of buildings under seismic loads. Rev. Int. De Métodos Numéricos Para Cálculo y Diseño en Ing. 2018, 34, 1–27. [Google Scholar]
  40. Vielma, J.C.; Mulder, M. Seismic performance factors of buildings with irregularity in plan. In Monograph CIMNE IS 76, Earthquake Engineering Monographs; CIMNE: Barcelona, Spain, 2018. [Google Scholar]
  41. Vamvatsikos, D.; Cornell, A. Incremental dynamic analysis. Earthq. Eng. Struct. Dyn. 2002, 31, 491–514. [Google Scholar] [CrossRef]
  42. RENAC. Accelerograms of the Earthquake of April 16 2016; National Accelerometer Network of the Geophysical Institute of the National Polytechnic School: Quito, Ecuador, 2016. [Google Scholar]
  43. Martineau, M.O.; Lopez, A.F.; Vielma, J.C. Effect of earthquake ground motion duration on the seismic response of a low-rise RC building. Adv. Civ. Eng. 2020, 2020, 1–12. [Google Scholar] [CrossRef]
  44. Vielma, J.C.; Barbat, A.H.; Oller, S. Seismic safety of low ductility structures used in Spain. Bull. Earthq. Eng. 2010, 8, 135–155. [Google Scholar] [CrossRef]
  45. Vielma, J.C.; Porcu, M.C.; López, N. Intensity measure based on a smooth inelastic peak period for a more effective incremental dynamic analysis. Appl. Sci. 2020, 10, 8632. [Google Scholar] [CrossRef]
  46. Vielma, J.C.; Cando, M. Calibration of the response reduction factors used in Ecuador for steel SMRF. Bull. Int. Inst. Seismol. Earthq. Eng. 2018, 52, 22–37. [Google Scholar]
  47. FEMA P-695. Quantification of Building Seismic Performance Factors; FEMA: Washington, DC, USA, 2009. [Google Scholar]
  48. NEC-15. Ecuadorian Construction Standard, SE-DS, Seismic Loads. In Earthquake Resistant Design; MIDUVI: Quito, Ecuador, 2015. (In Spanish) [Google Scholar]
Figure 1. Current status of damaged buildings located on the corners of Chile Street, Portoviejo (a) building in use and (b) building closed.
Applsci 11 08691 g001
Figure 2. Marinero building located on Chile Street in Portoviejo, (a) before the earthquake and (b) after the earthquake.
Applsci 11 08691 g002
Figure 3. Confined masonry model (a) masonry infill panel and frame scheme, (b) compression-tension struts and (c) shear strut. Adapted from [27,28].
Applsci 11 08691 g003
Figure 4. Typical plan of the studied building.
Applsci 11 08691 g004
Figure 5. Elevation views: (a) west and (b) east.
Applsci 11 08691 g005
Figure 6. Perspective view of the model.
Applsci 11 08691 g006
Figure 7. Perspective, plan, and front views of the deformed shapes corresponding to the (a) first mode, (b) second mode, and (c) third mode.
Applsci 11 08691 g007
Figure 8. Resulting capacity and idealized curves obtained from conventional pushover: (a) lateral forces (+) and (b) lateral forces (−).
Applsci 11 08691 g008
Figure 9. Resulting capacity and idealized curves obtained from adaptive pushover analysis: (a) lateral forces (+) and (b) lateral forces (−).
Applsci 11 08691 g009
Figure 10. Variation in the rotations of the centers of gravity of each floor with respect to the lateral displacement according to different pushover analyses: (a) conventional pushover analysis and (b) adaptive pushover analysis.
Applsci 11 08691 g010
Figure 11. Acceleration records from the four stations reported.
Applsci 11 08691 g011aApplsci 11 08691 g011b
Figure 12. Response, mean, and elastic design spectra corresponding to the accelerograms used for the IDA.
Applsci 11 08691 g012
Figure 13. IDA curves obtained by applying the set of accelerograms.
Applsci 11 08691 g013
Figure 14. Collapse fragility curve obtained from the IDA analysis of the analyzed building.
Applsci 11 08691 g014
Figure 15. Variations in the (a) maximum rotations and (b) relative rotations of the center of gravity for each floor calculated for various values of spectral acceleration and 5% critical damping.
Applsci 11 08691 g015
Table 1. Strengths of the model materials.
StrengthValue
Concrete20.6 (MPa)
Reinforcement412 (MPa)
Masonry unit14 (MPa)
Table 2. Parameters of the compression strut implemented in the masonry model.
Curve ParametersAssumed Value
Initial Young’s modulus3500 (MPa)
Compressive strength3.5 (MPa)
Tensile strength0.0 (MPa)
Strain at maximum stress0.0012 (m/m)
Ultimate strain0.024 (m/m)
Closing strain0.004 (m/m)
Strut area reduction strain0.0006 (m/m)
Residual strut area strain0.001 (m/m)
Table 3. Parameters of the shear strut implemented in the masonry model.
Curve ParametersAssumed Value
Shear bond strength0.3 (MPa)
Friction coefficient0.7
Maximum shear strength0.5 (MPa)
Reduction shear factor1.5
Table 4. Dynamic parameters with masonry infill panels included in the model.
ModePeriod (s)UxUyRz
10.45826.79%26.79%29.20%
20.45842.16%42.16%0.00%
30.40215.01%15.01%54.93%
40.1323.48%3.48%3.79%
50.1184.60%4.60%0.00%
60.0651.41%1.41%5.40%
70.0651.10%1.10%1.20%
80.0591.30%1.30%0.00%
90.0390.33%0.33%0.00%
Table 5. Ductility values obtained from the idealized capacity curves.
Analysis Type Δ u   [ % ] Δ y   [ % ] μ
Conventional (+)2.48741.38961.7900
Conventional (−)2.68911.45511.8481
Adaptive (+)2.15121.11761.9248
Adaptive (−)2.42011.21851.9861
Table 6. Information from the records used for IDA.
EarthquakeDateStation IDLocationEpicentral Distance [km]ComponentPeak Ground Acceleration [g]
Ecuador 7.8 Mw16 April 2016AES2Esmeraldas76E–W0.1706
N–S0.1122
APEDPedernales36E–W1.3413
N–S0.8258
APO1Portoviejo167E–W0.348
N–S0.4196
AMNTManta171E–W0.4226
N–S0.5111
Table 7. Uncertainty values assumed for the determination of total system collapse uncertainty. Adapted from [47].
UncertaintyAssumed Value
β R T R 0.40
β D R 0.50
β T D 0.50
β M D L 0.50
Publisher’s Note: MDPI stays neutral with regard to jurisdictional claims in published maps and institutional affiliations.

