
An Analytical Study on the Pull-Out Strength of Anchor Bolts Embedded in Concrete Members by SPH Method


Abstract
:1. Introduction
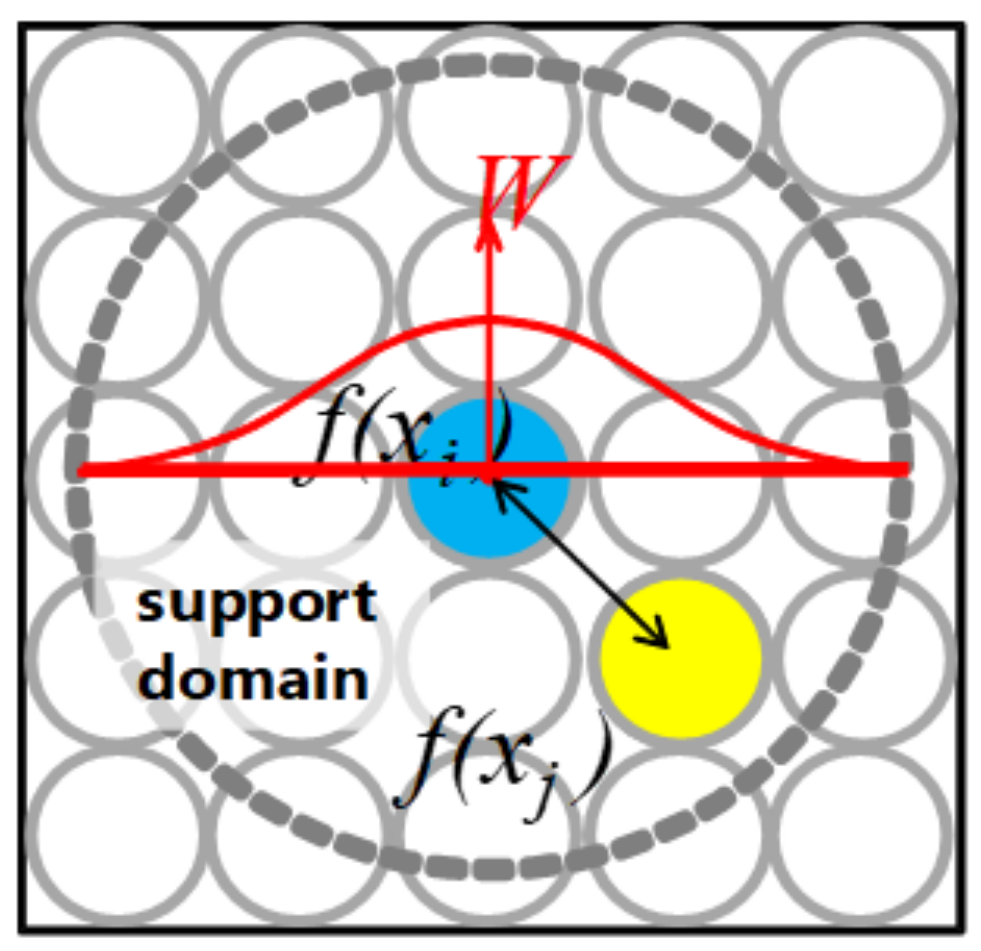
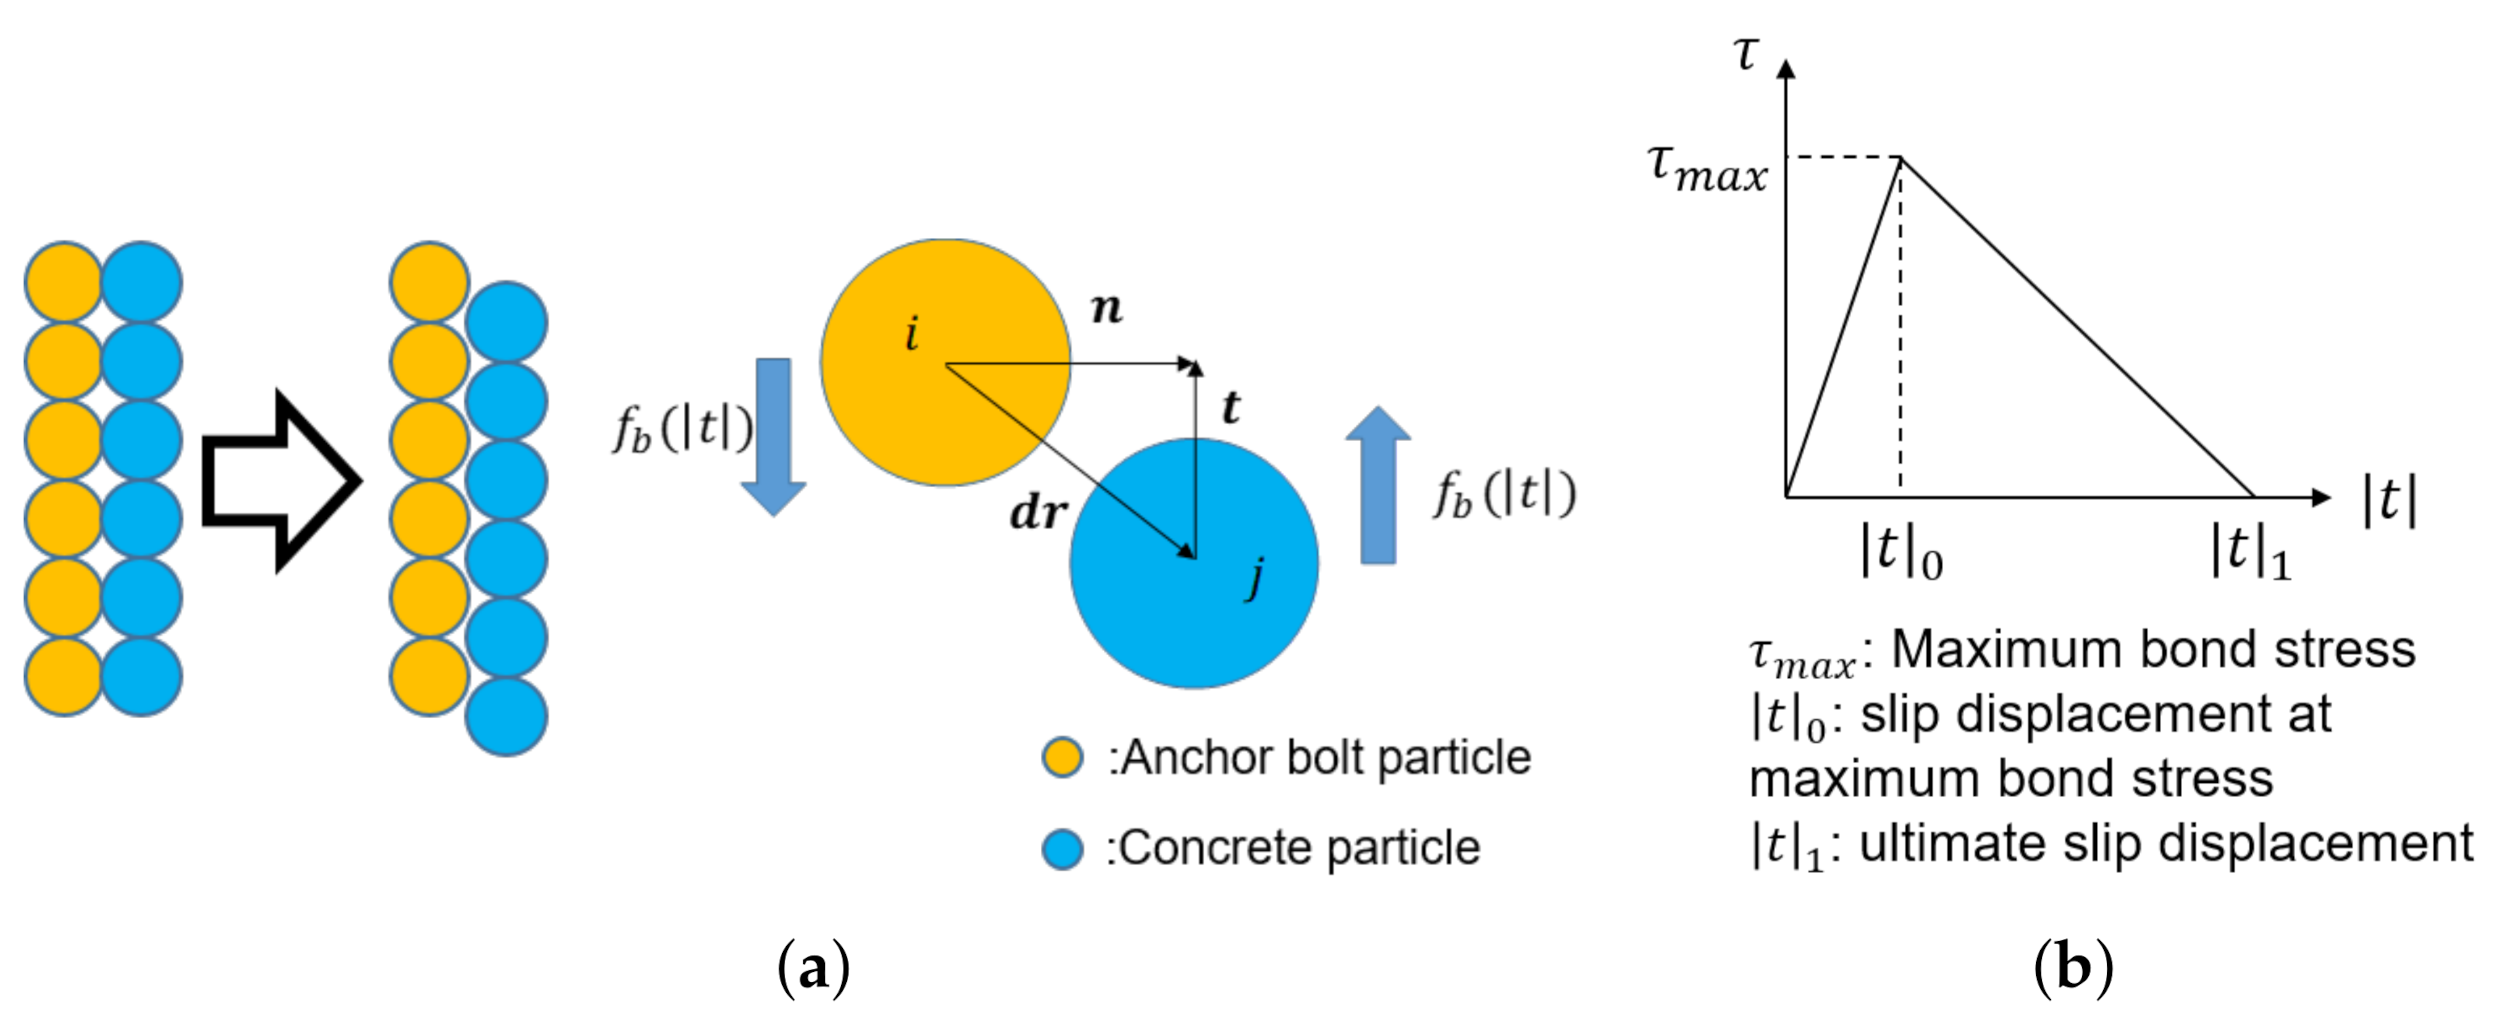
2. Analysis Method in This Study
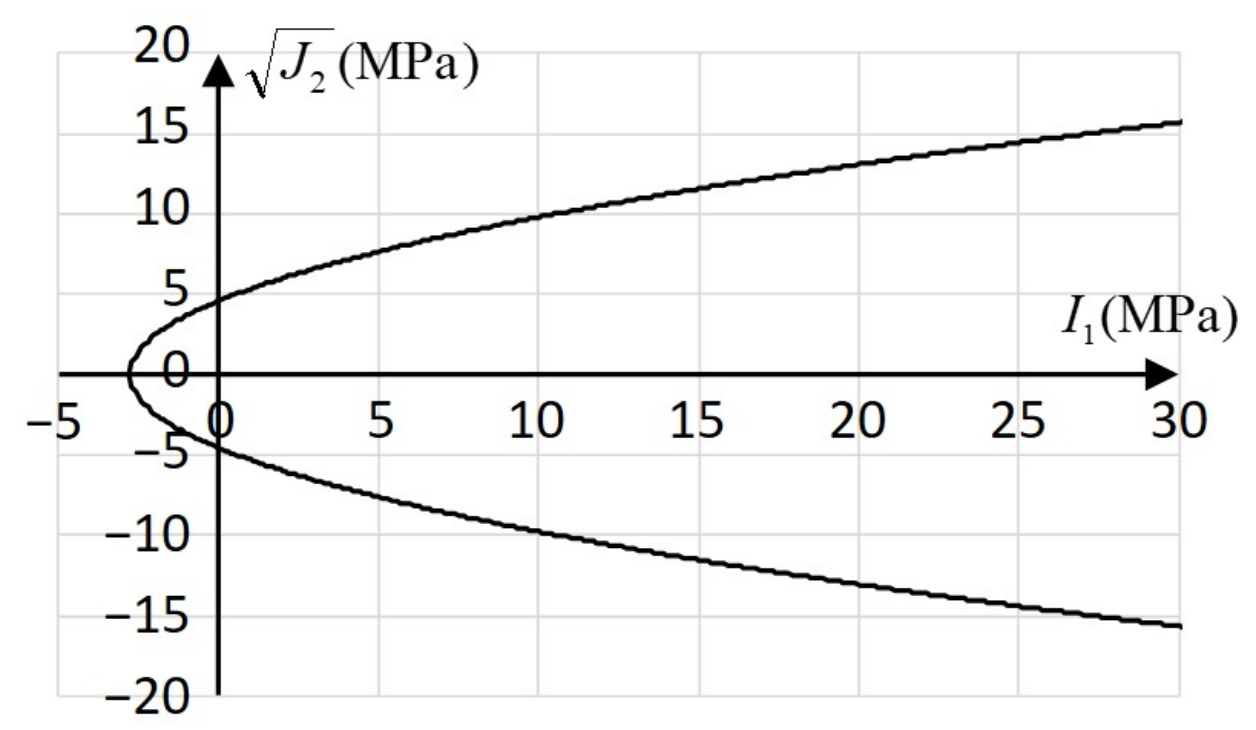
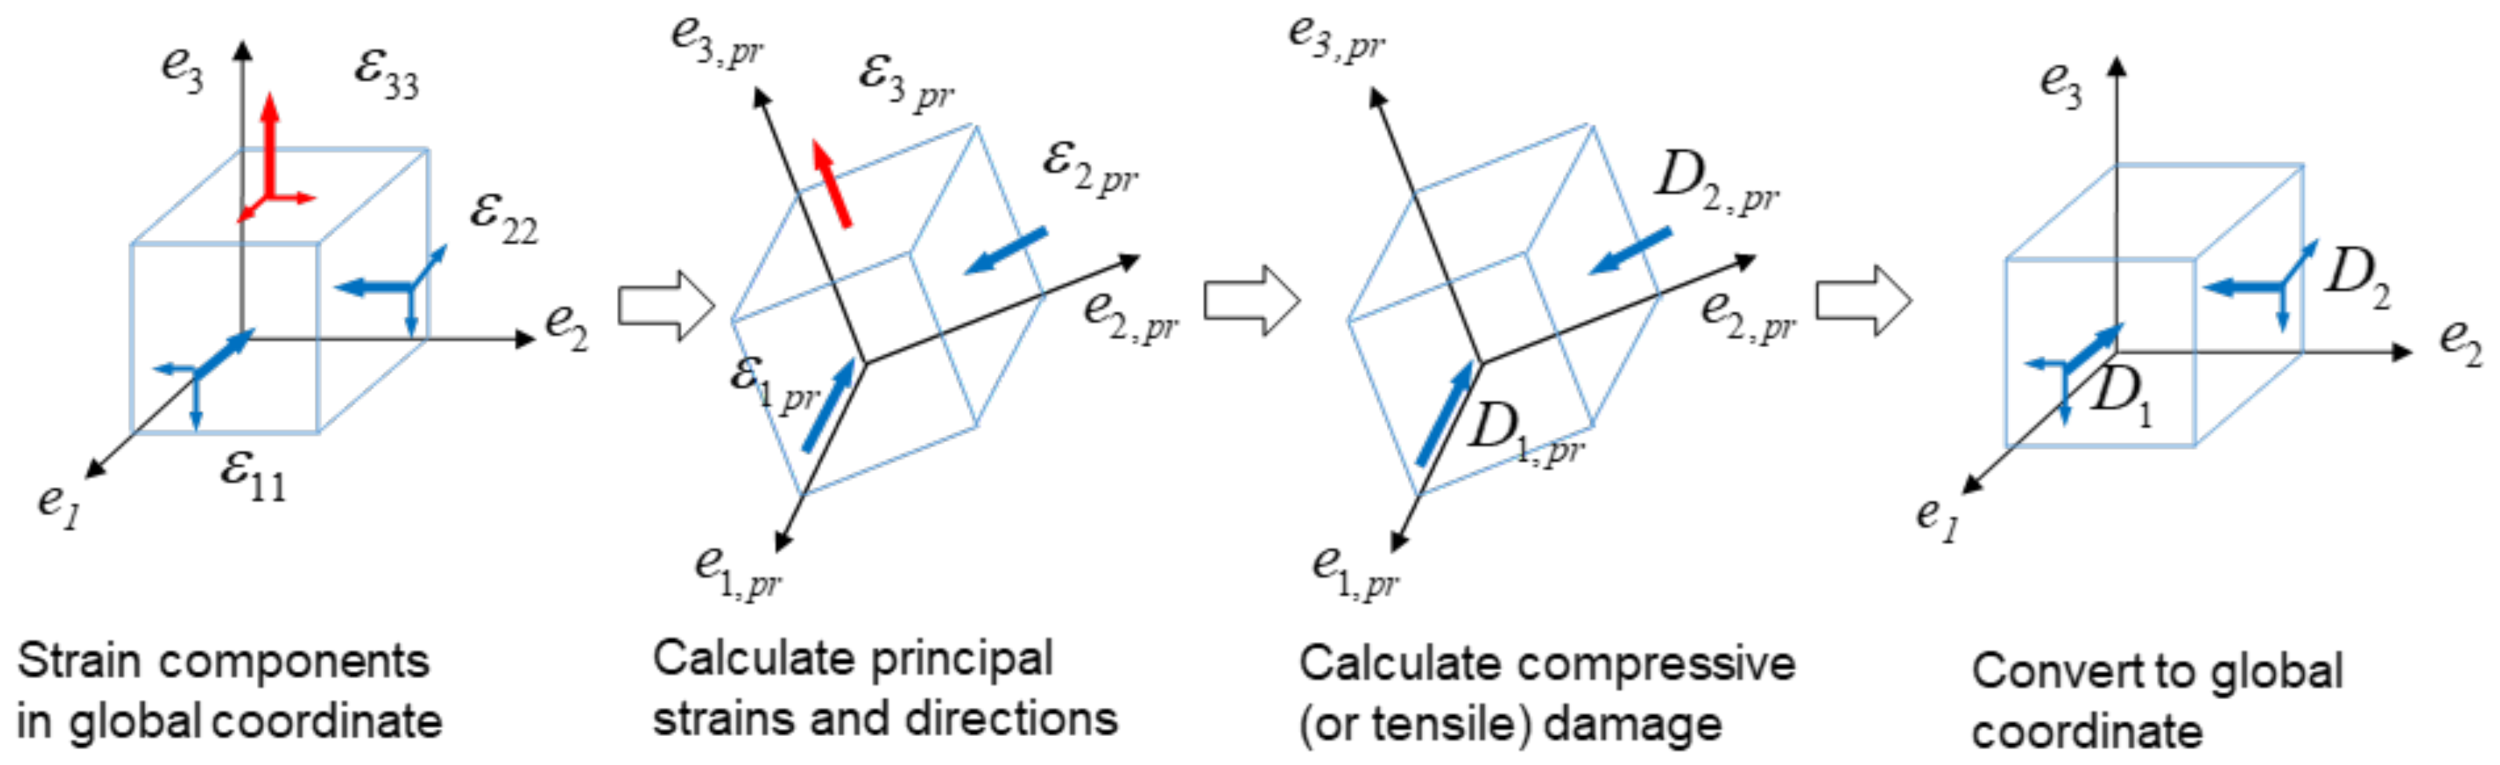
3. Overview of Crack Growth Analysis
4. Anchor Bolt Pull-Out Analysis
4.1. Verification of the Proposed Method
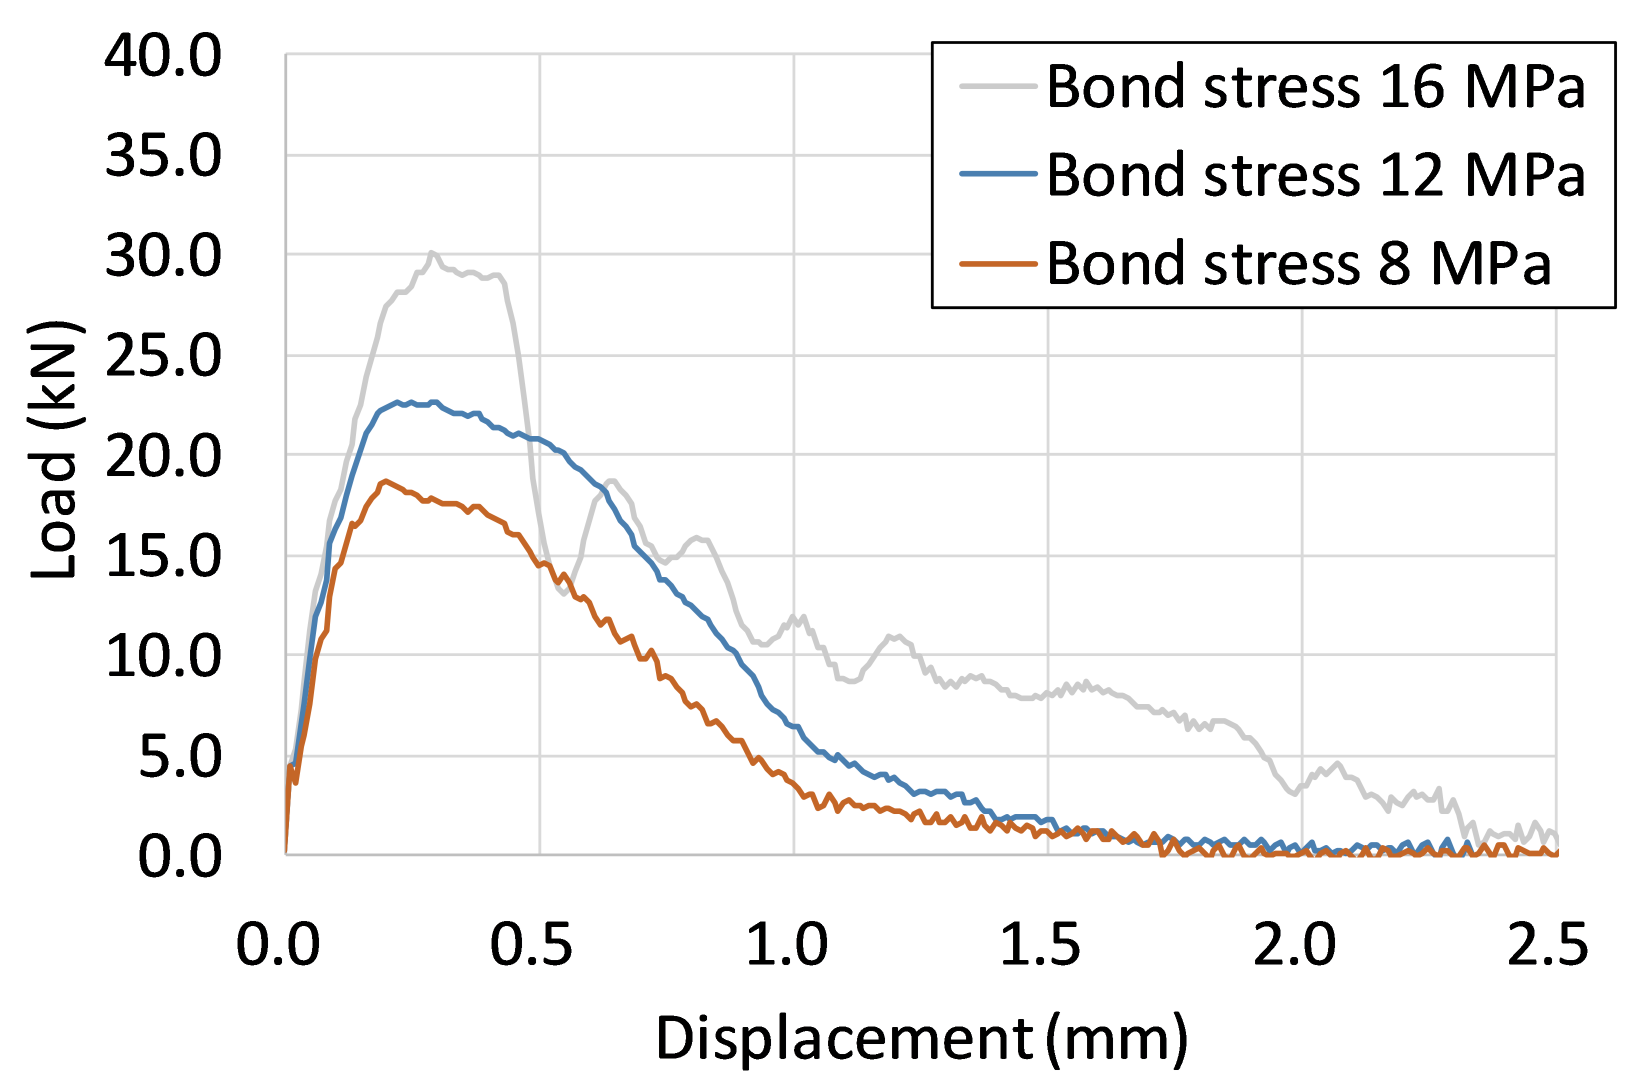
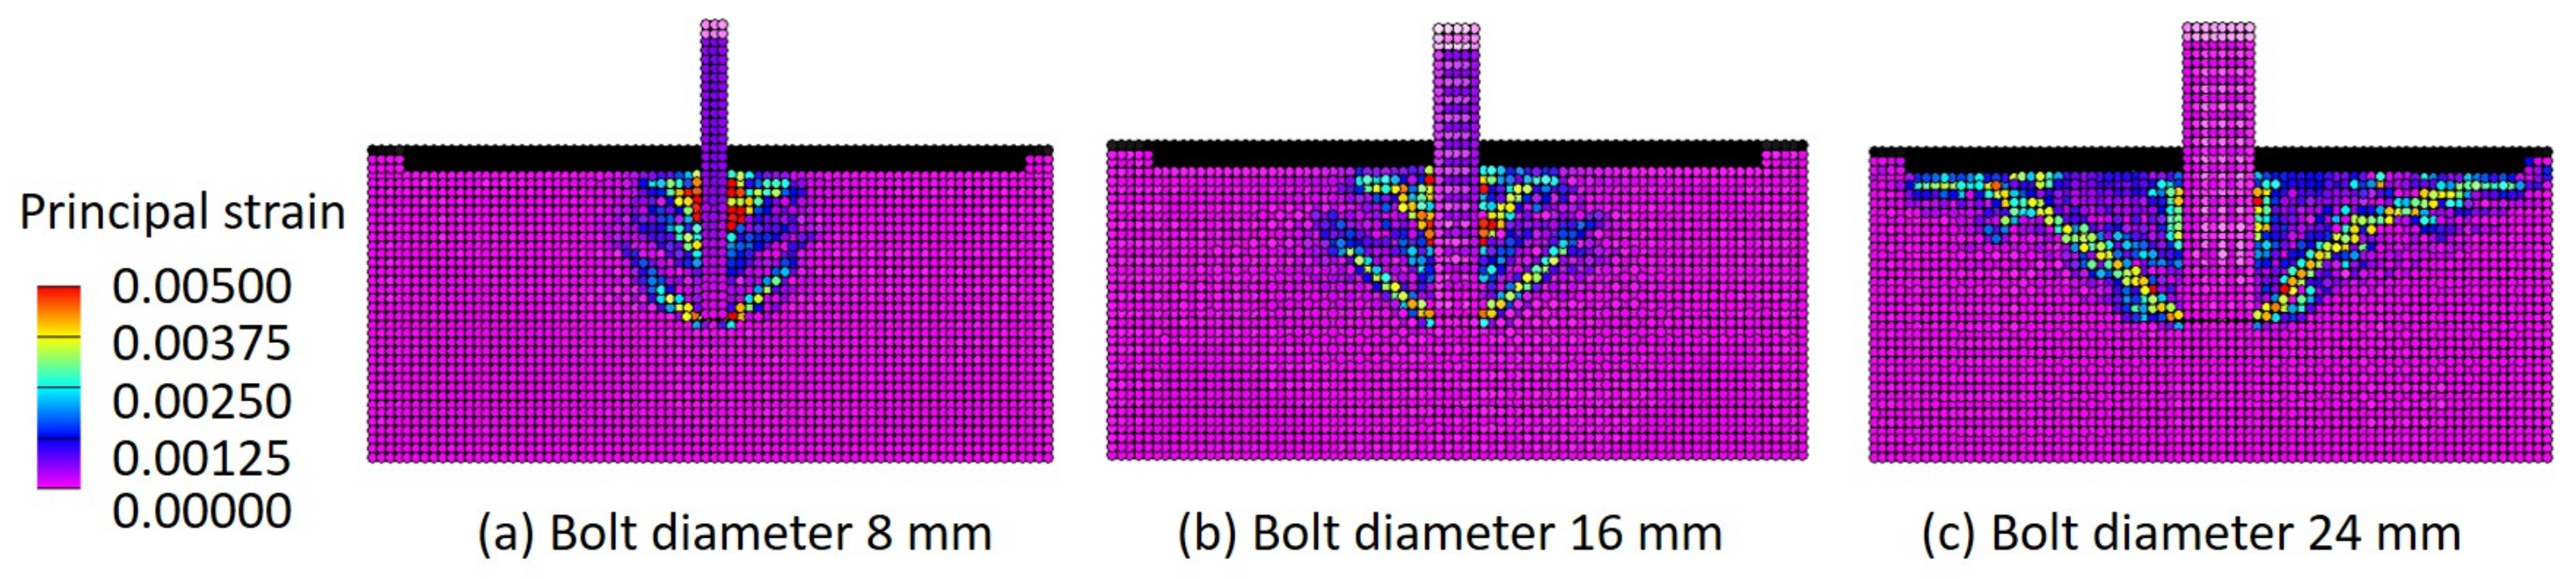
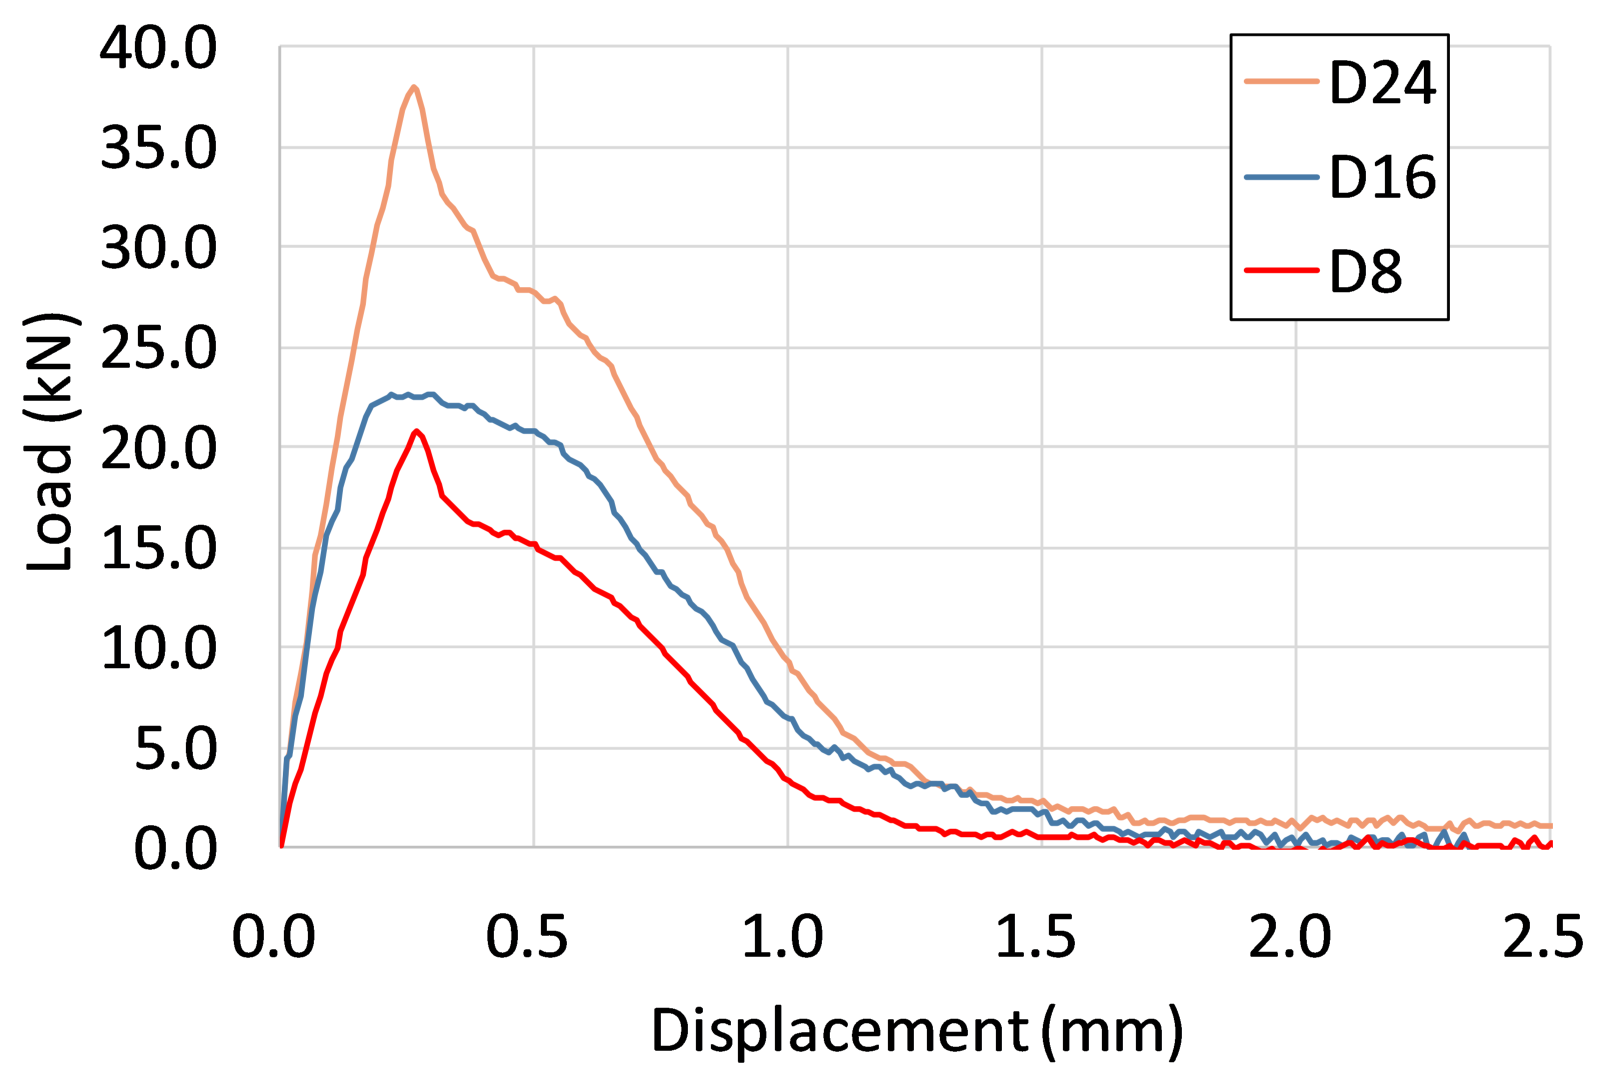
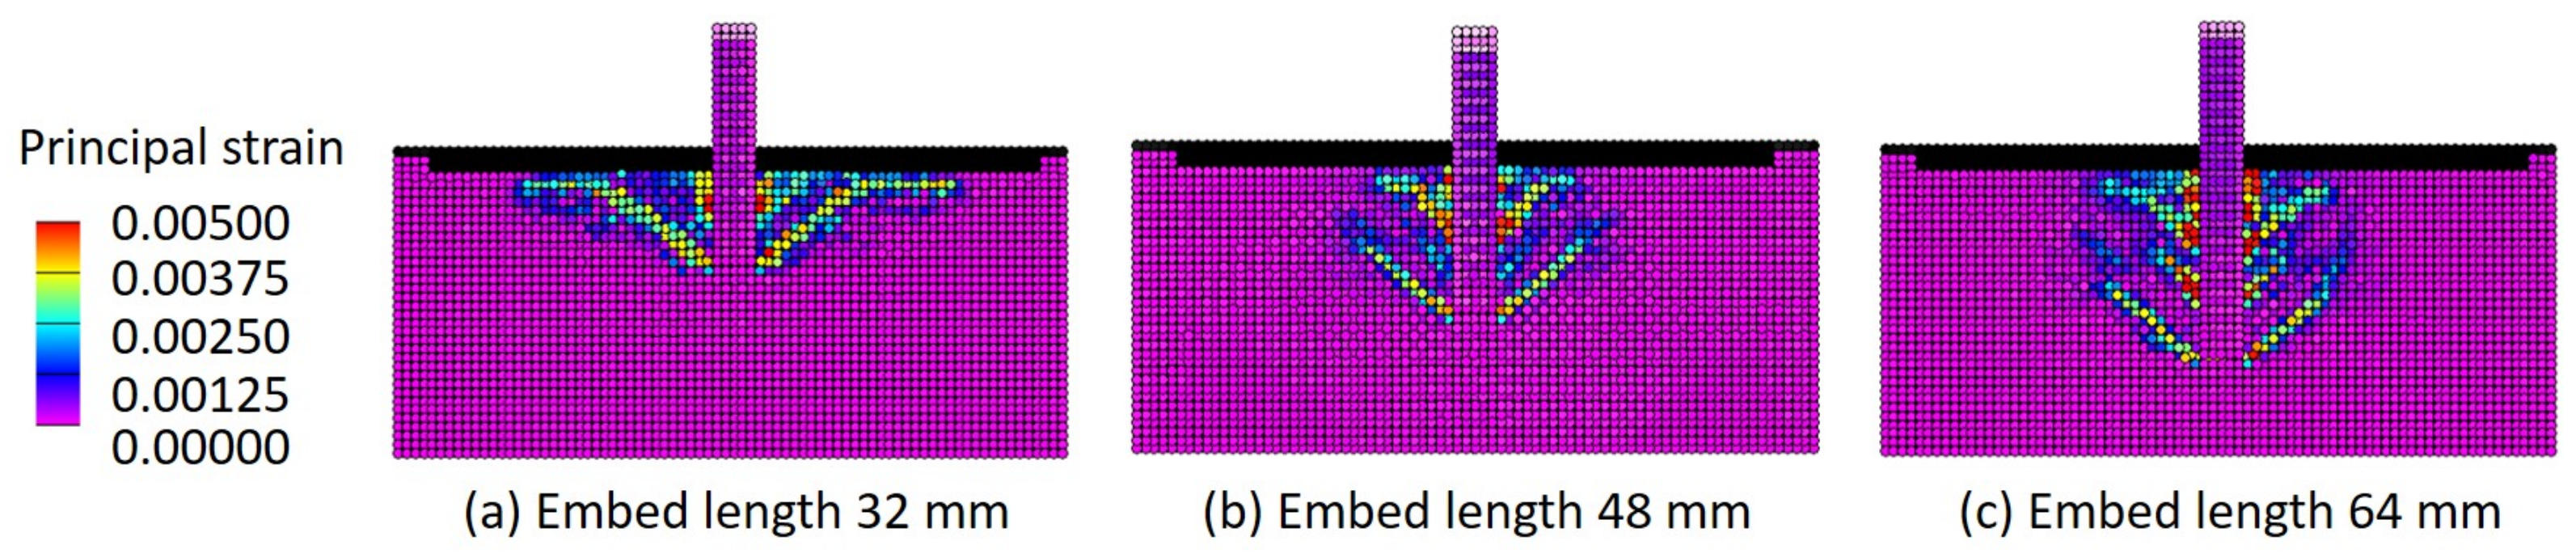
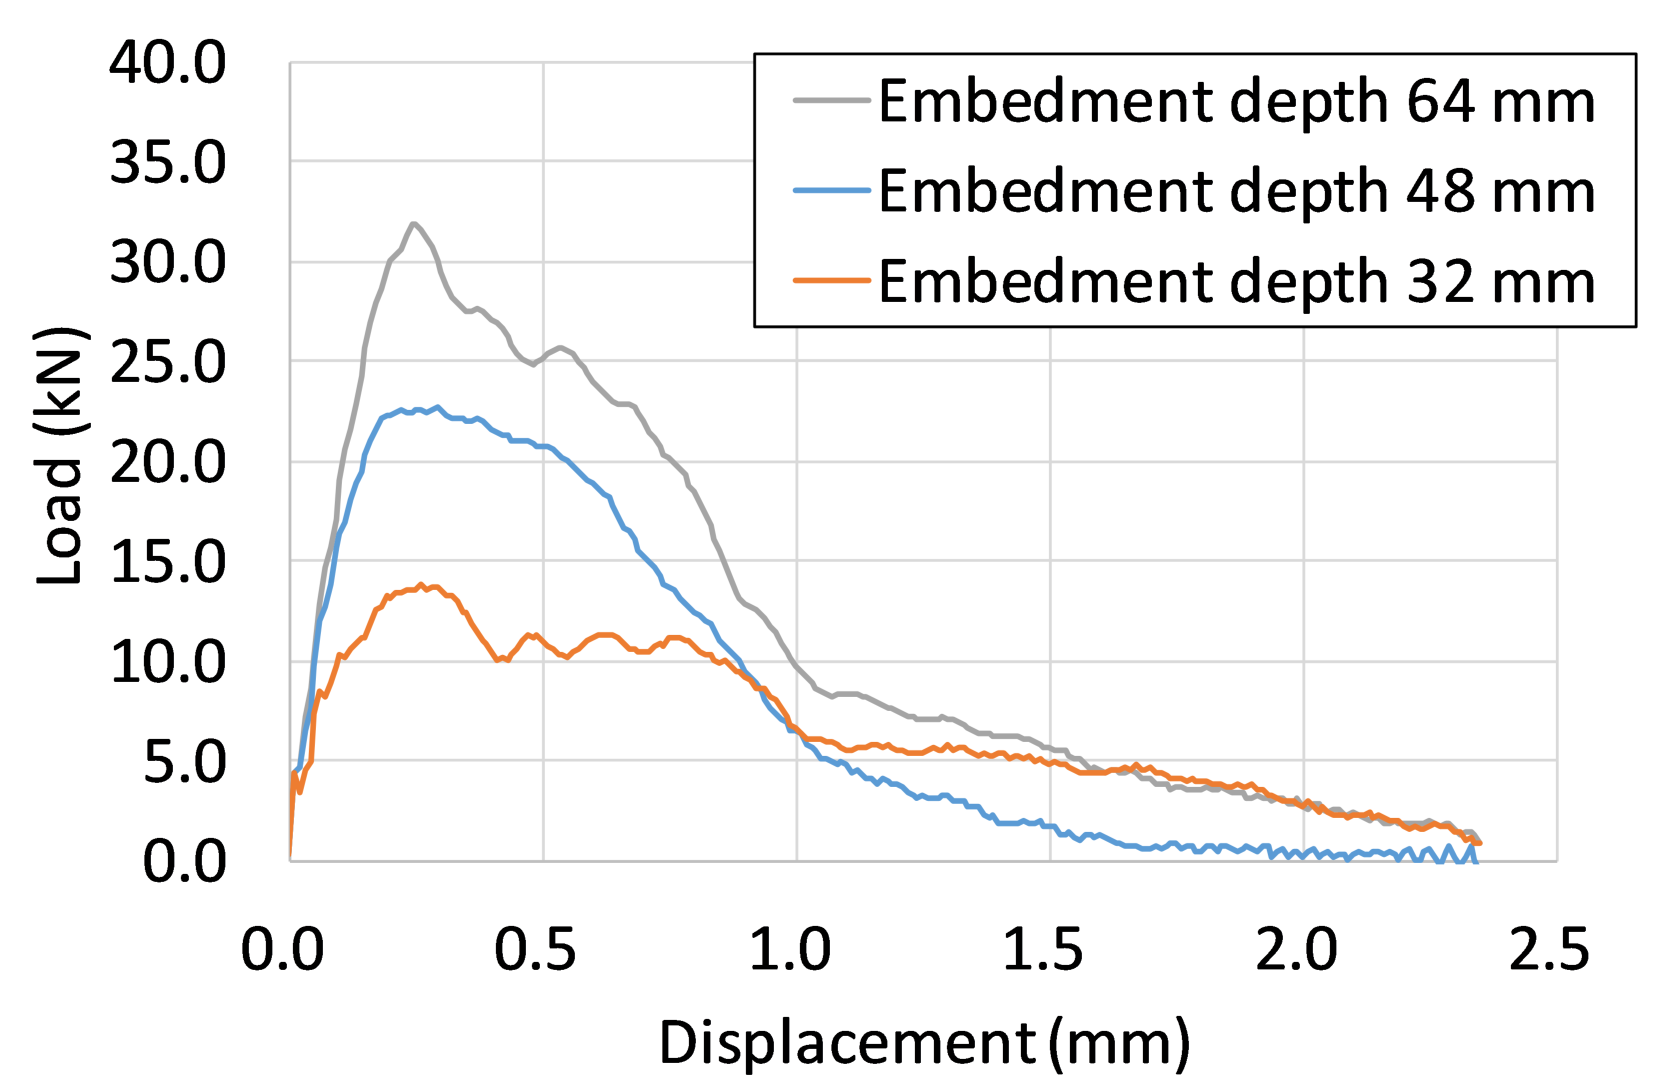
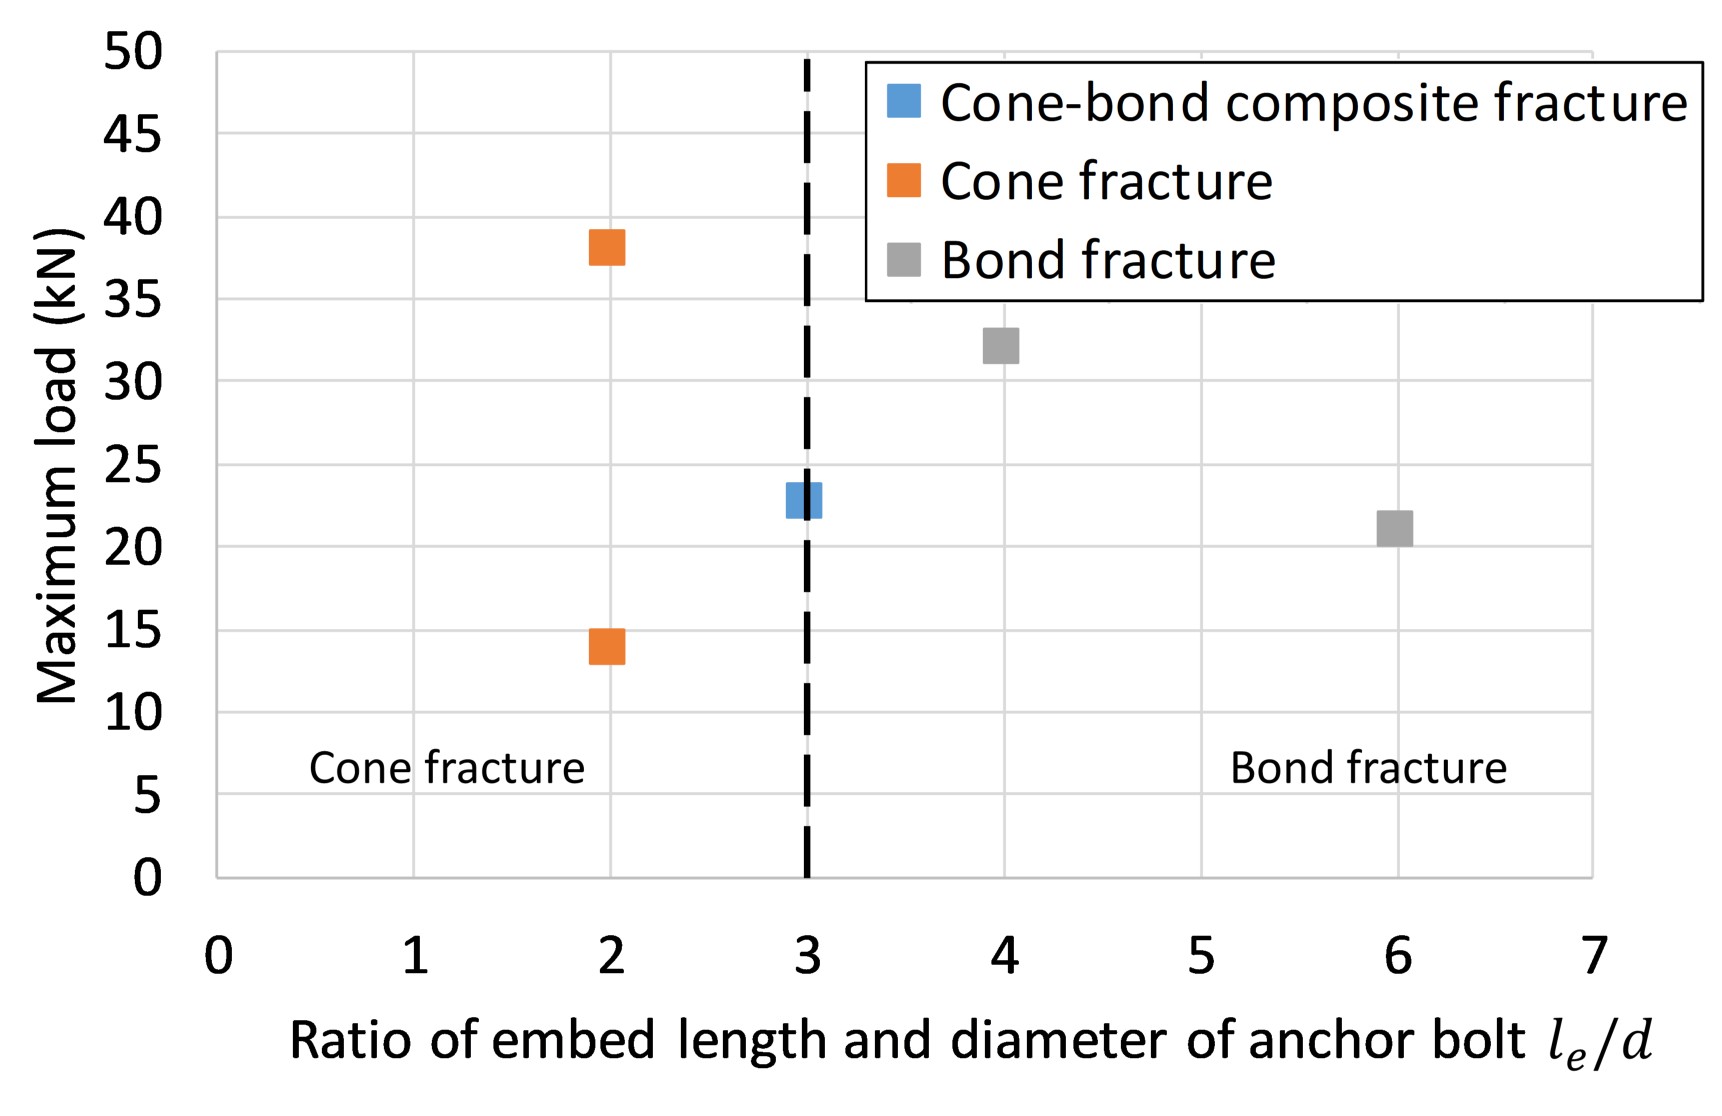
4.2. Effect of Installation Conditions on the Fracture Mode
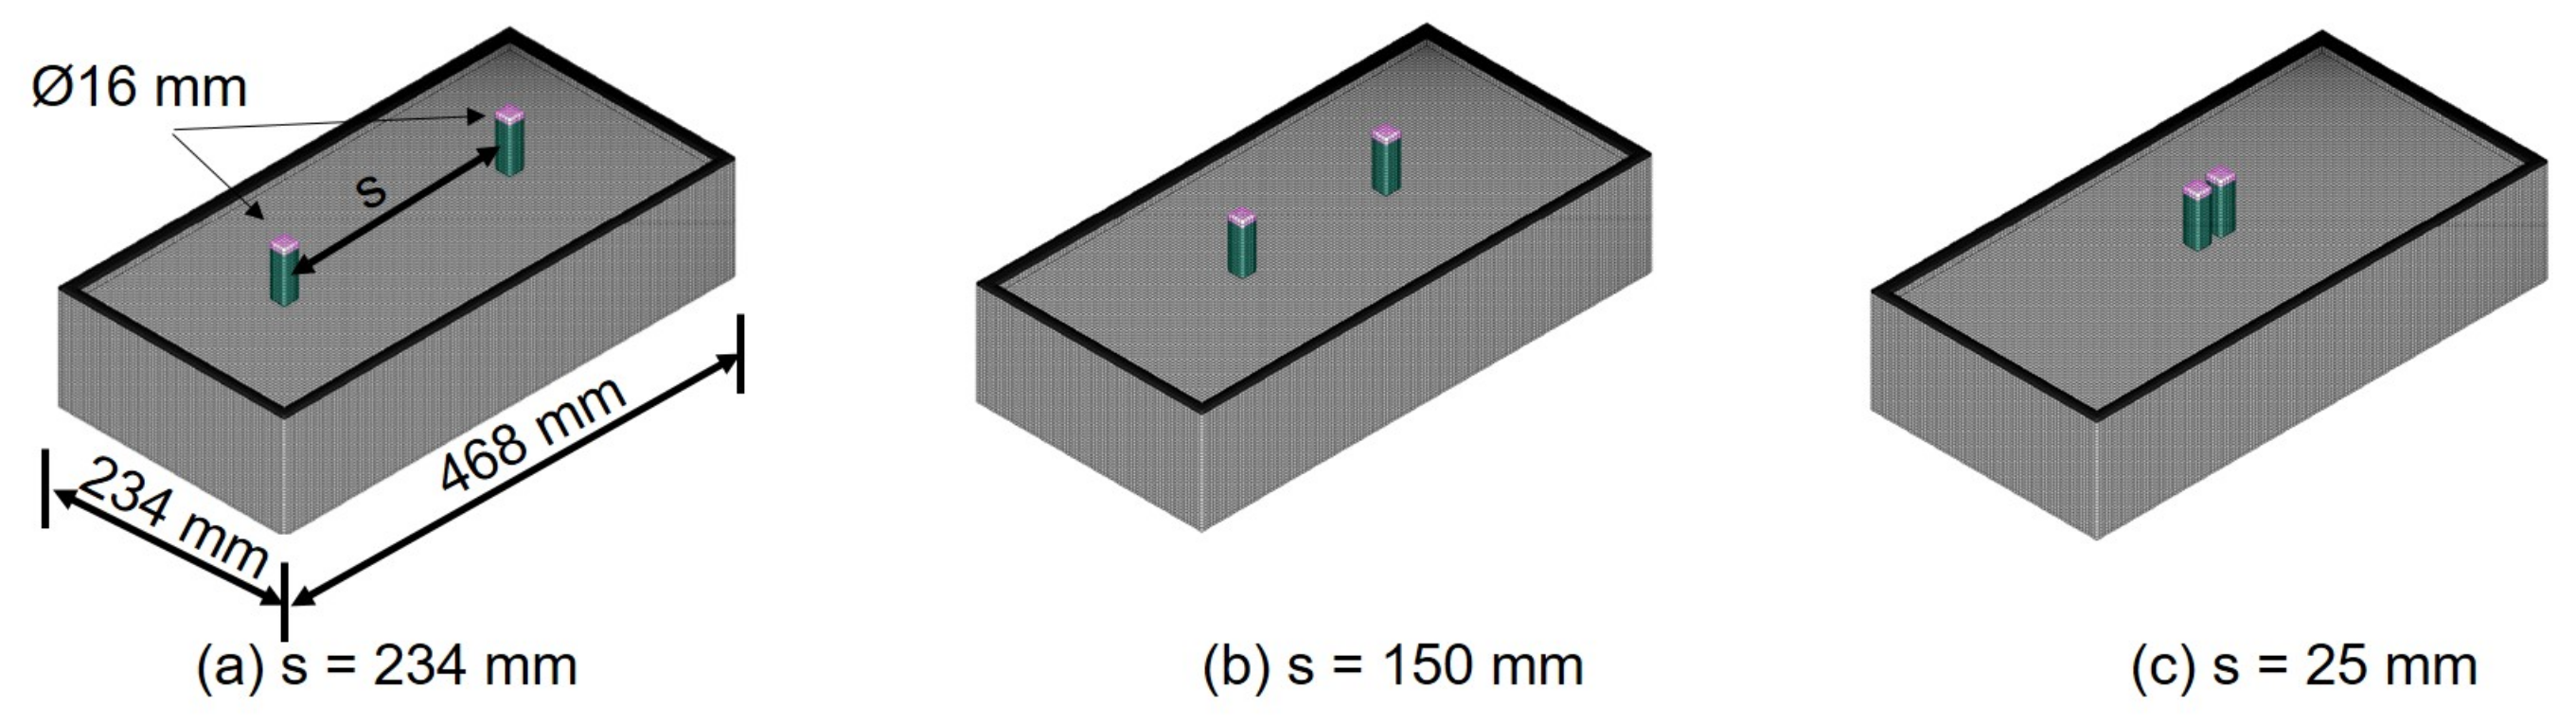
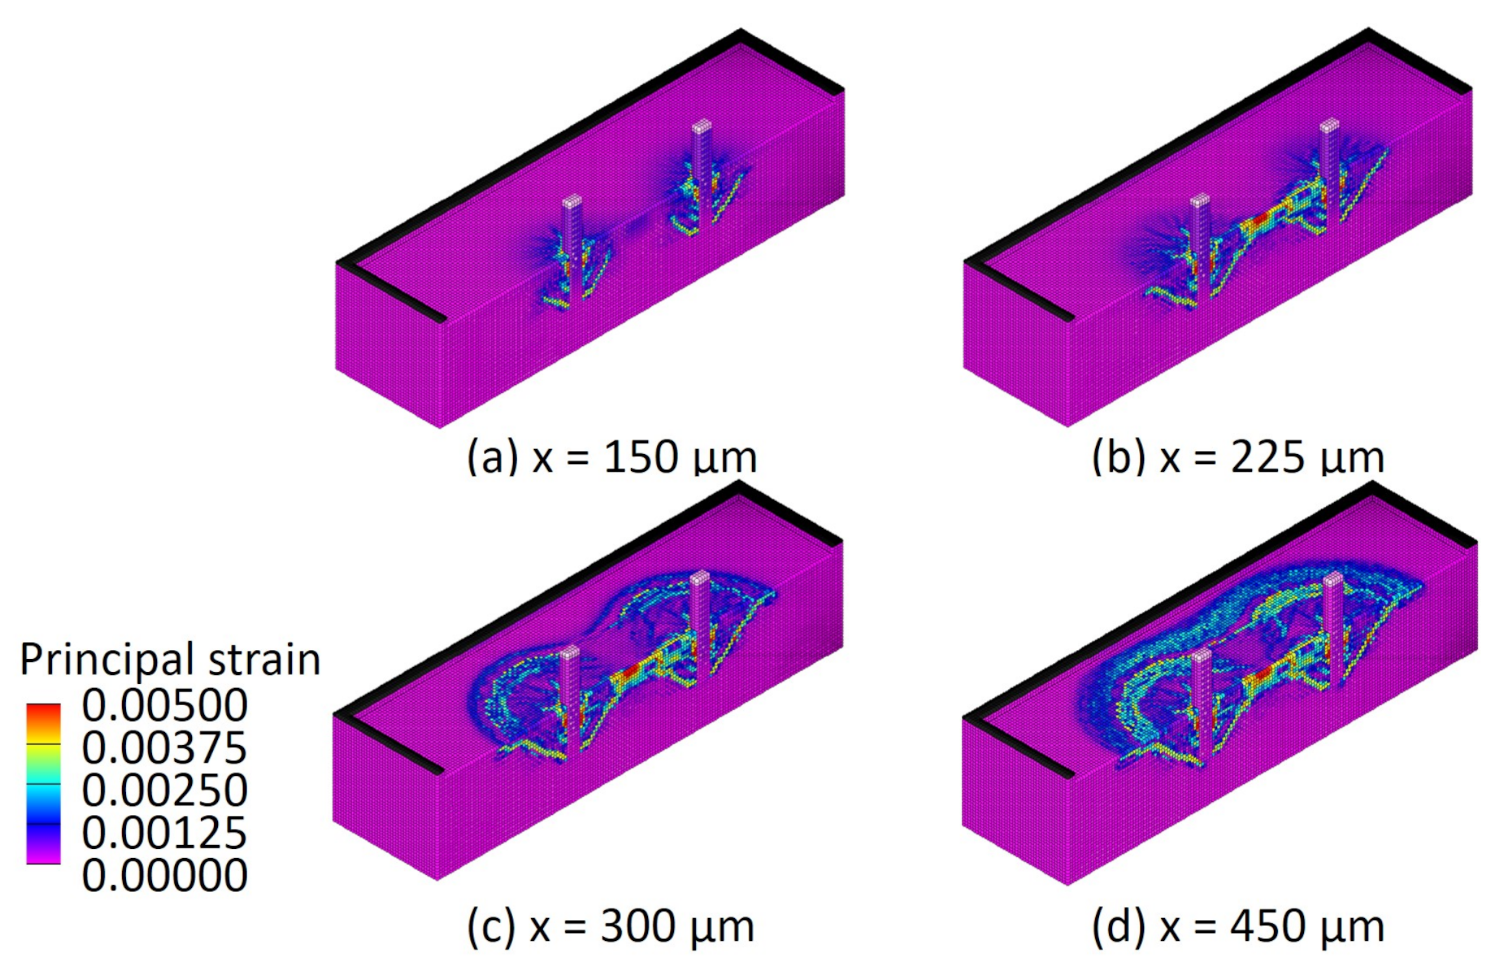
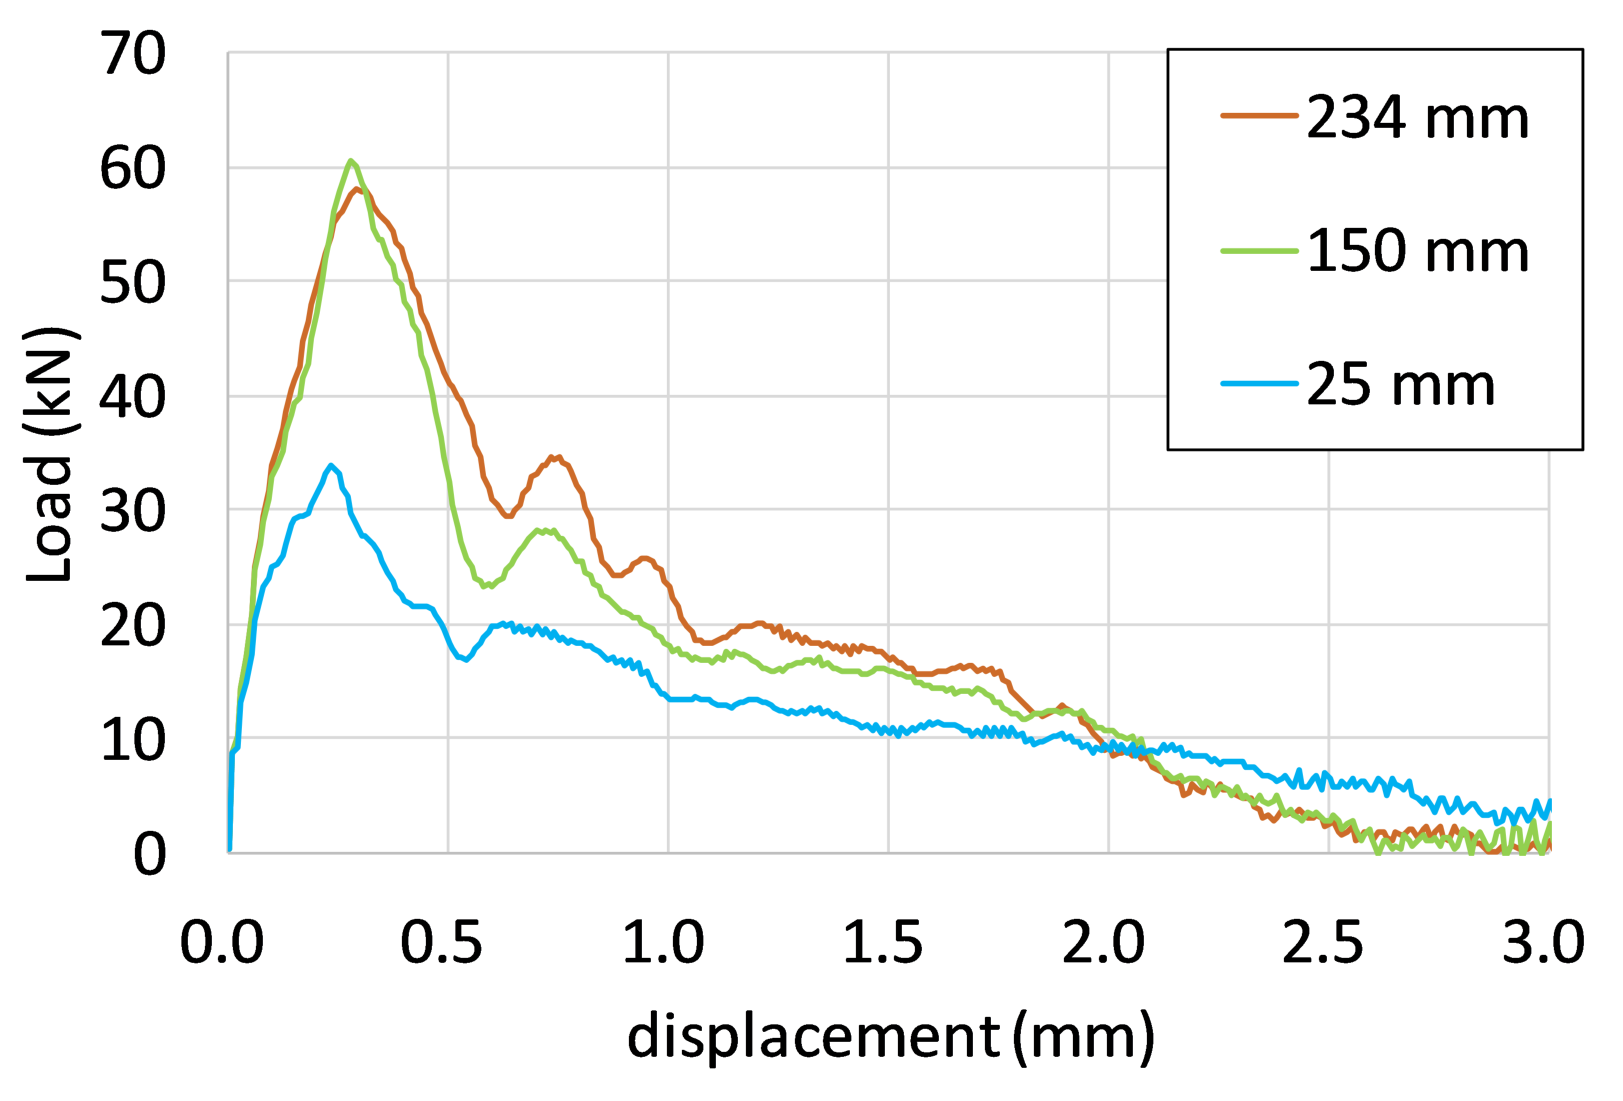
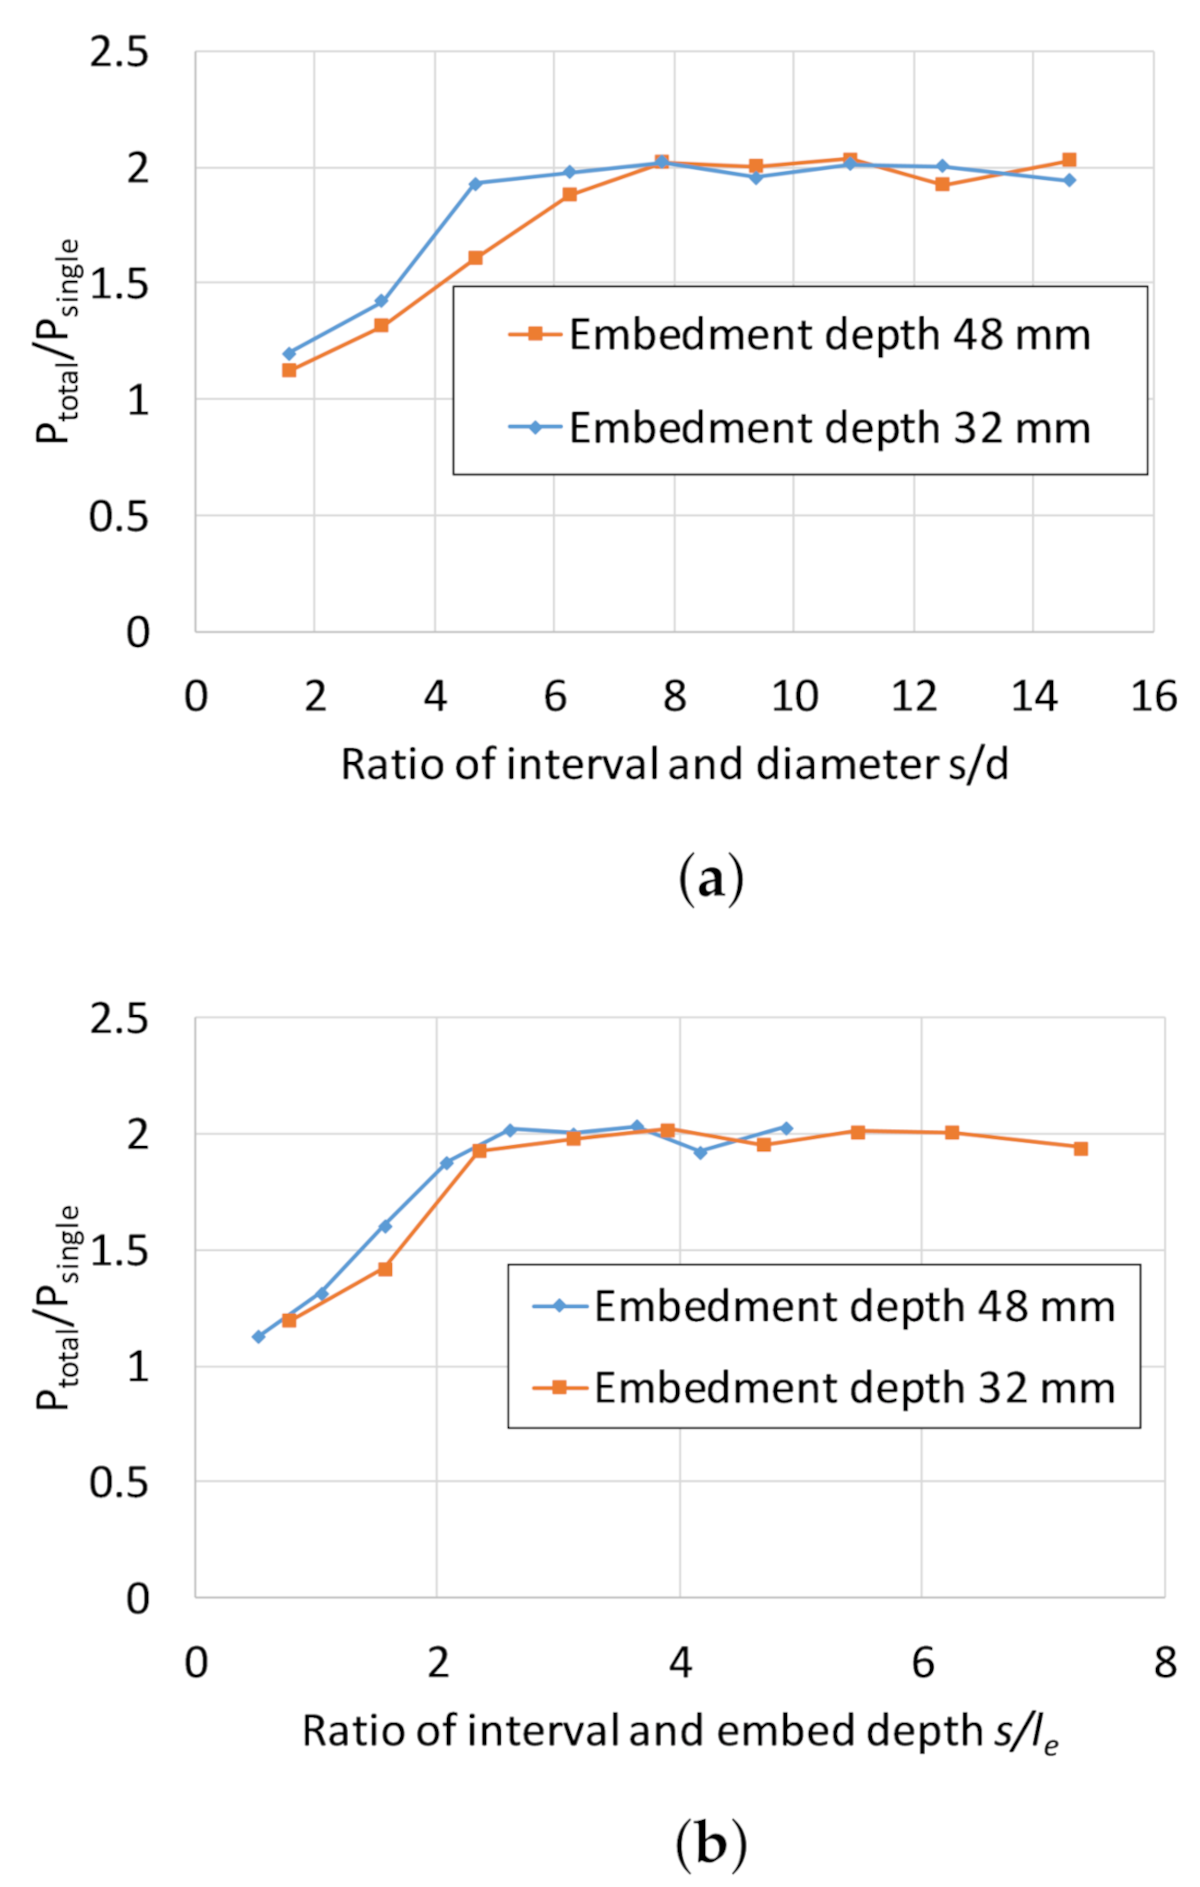
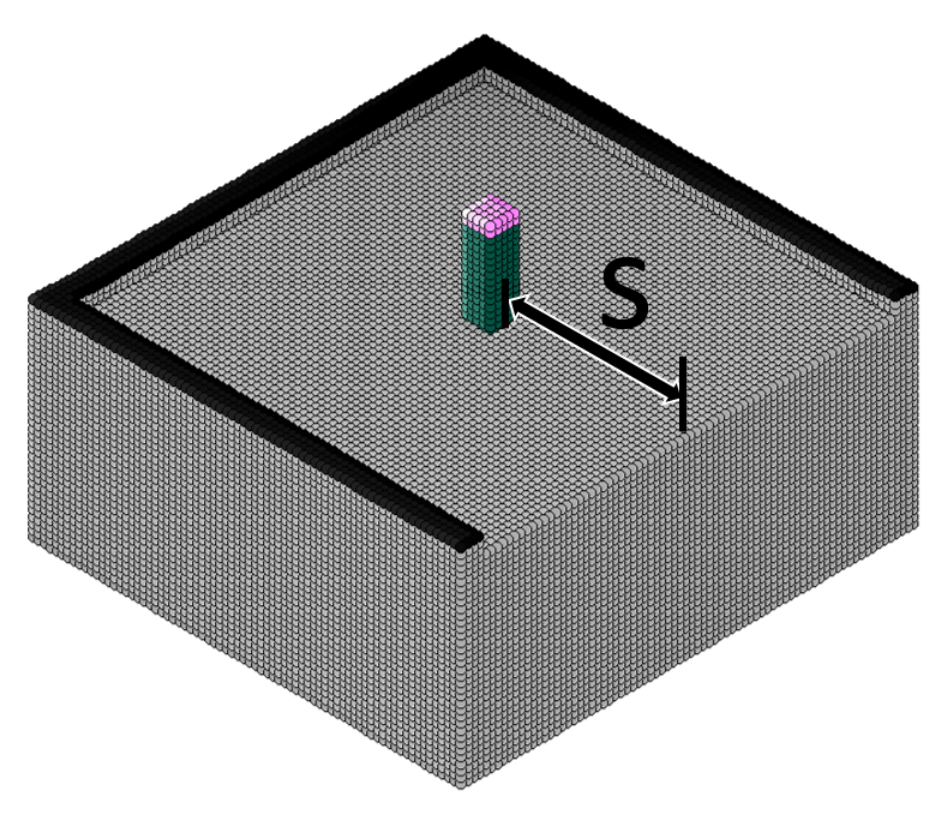
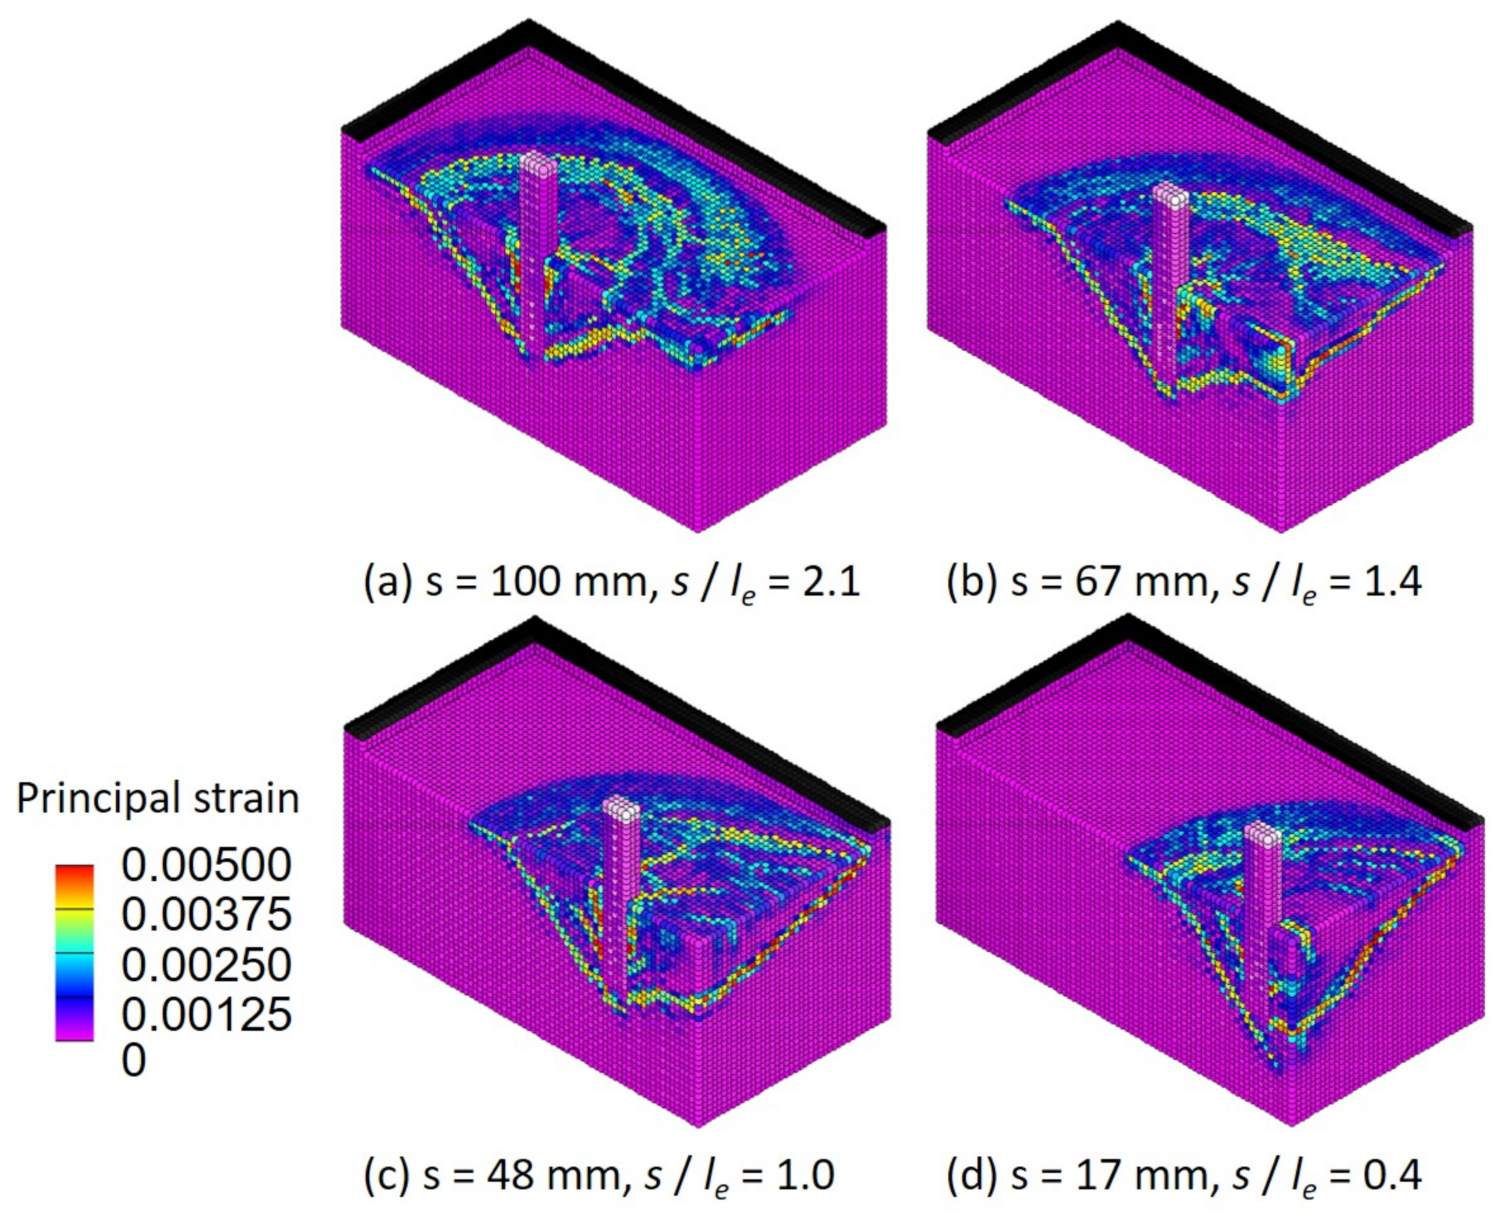
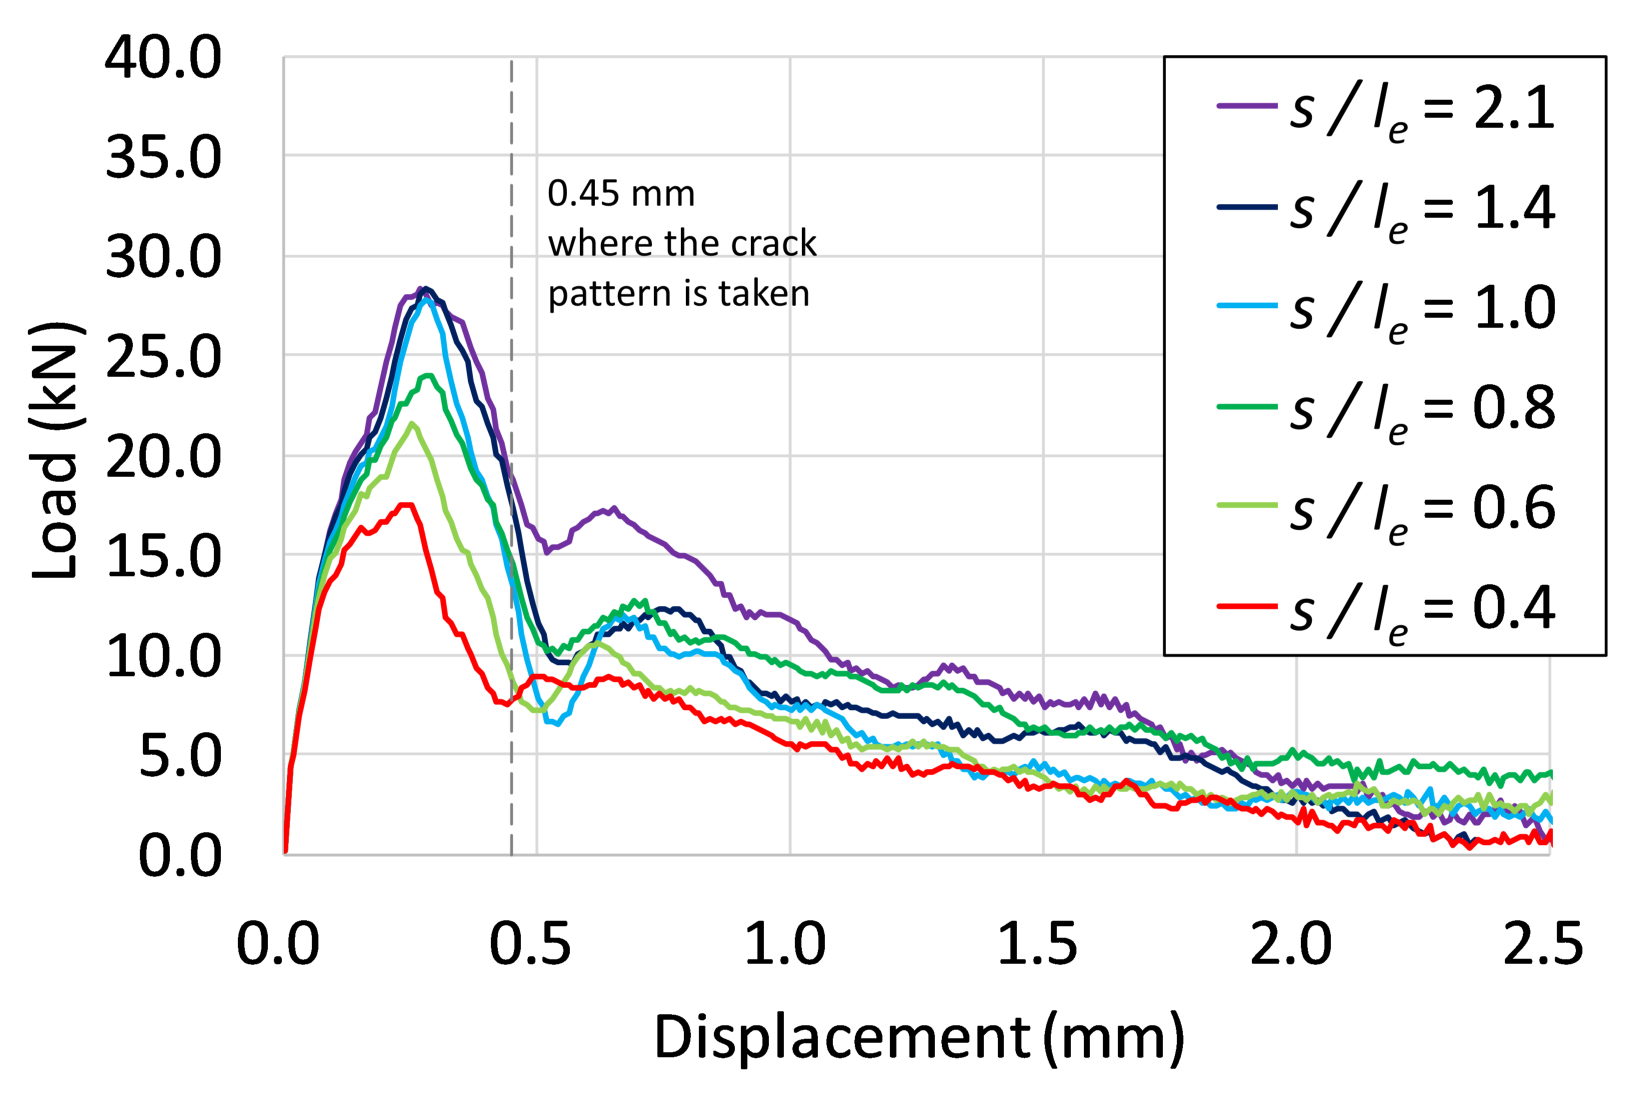
4.3. Influence of the Spacing between Anchor Bolts
4.4. Influence of the the Distance from Free Edge
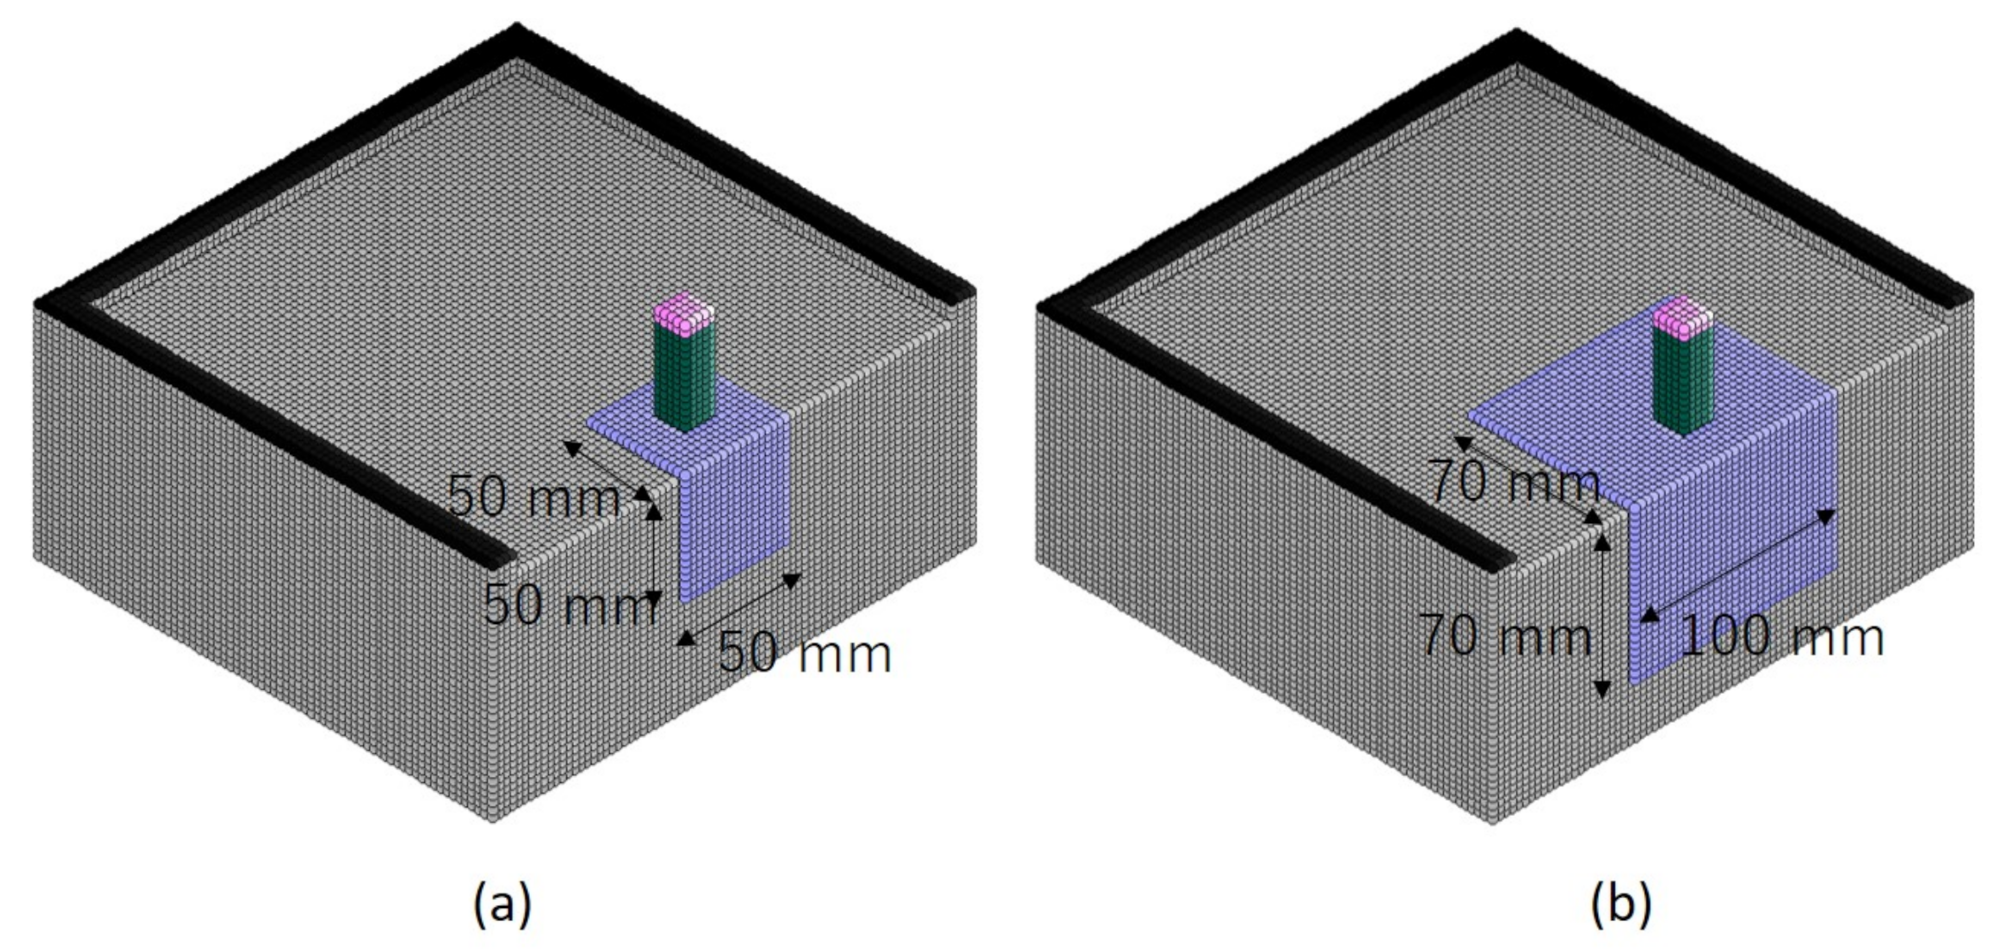
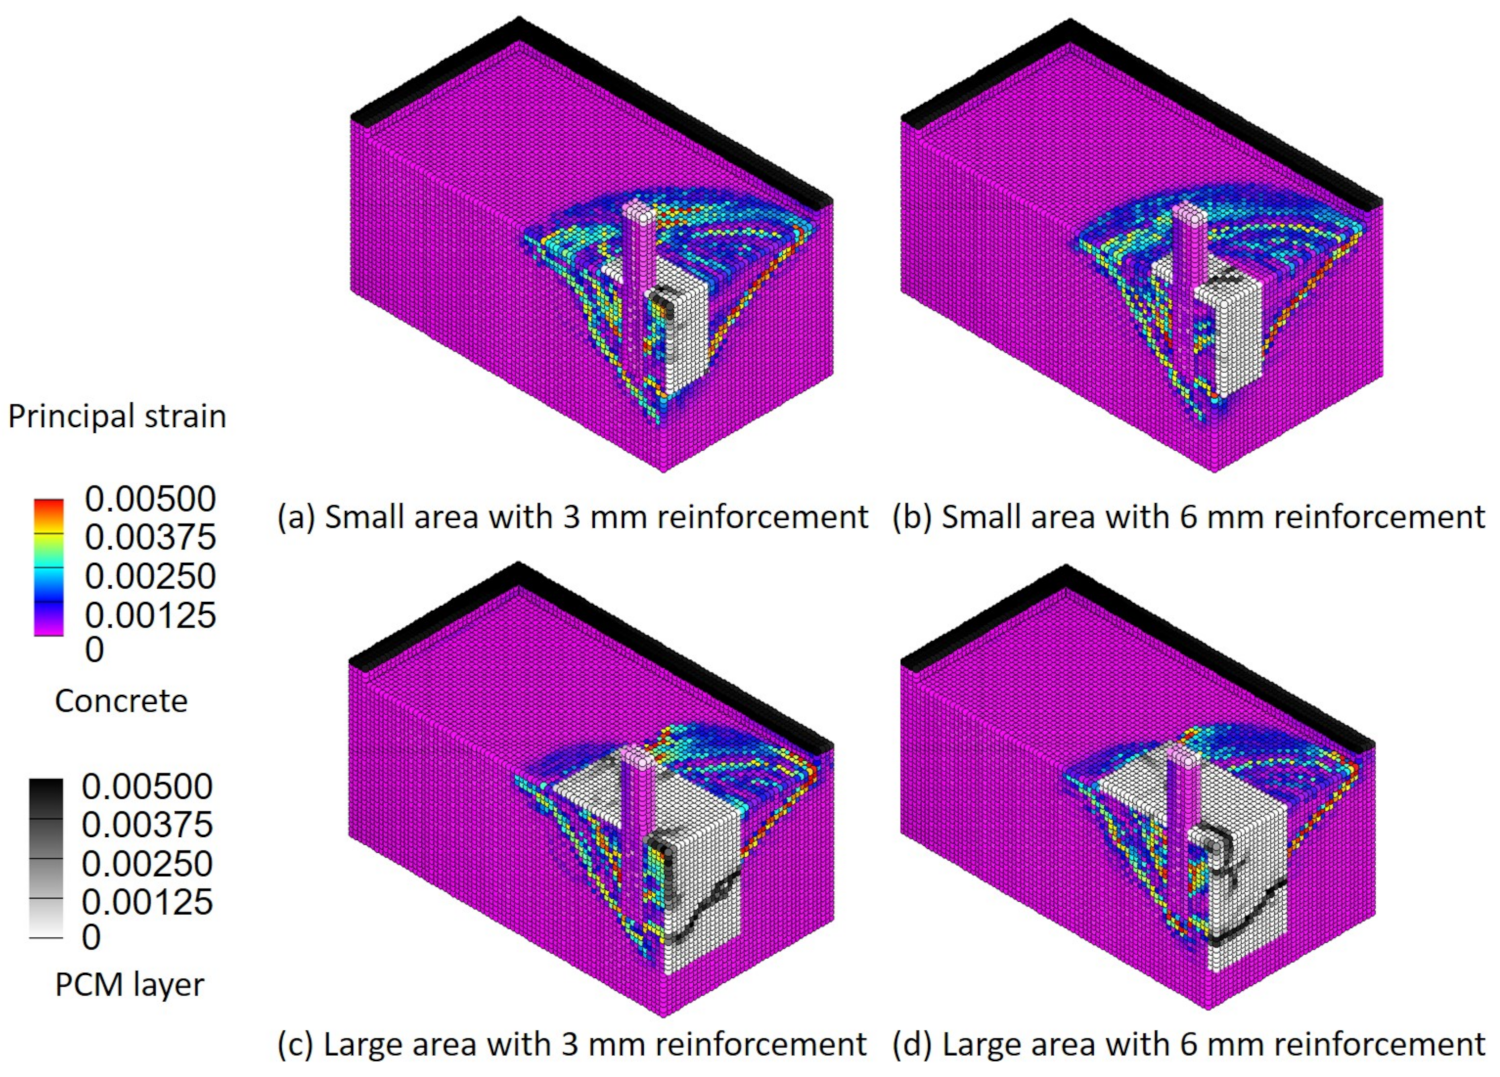
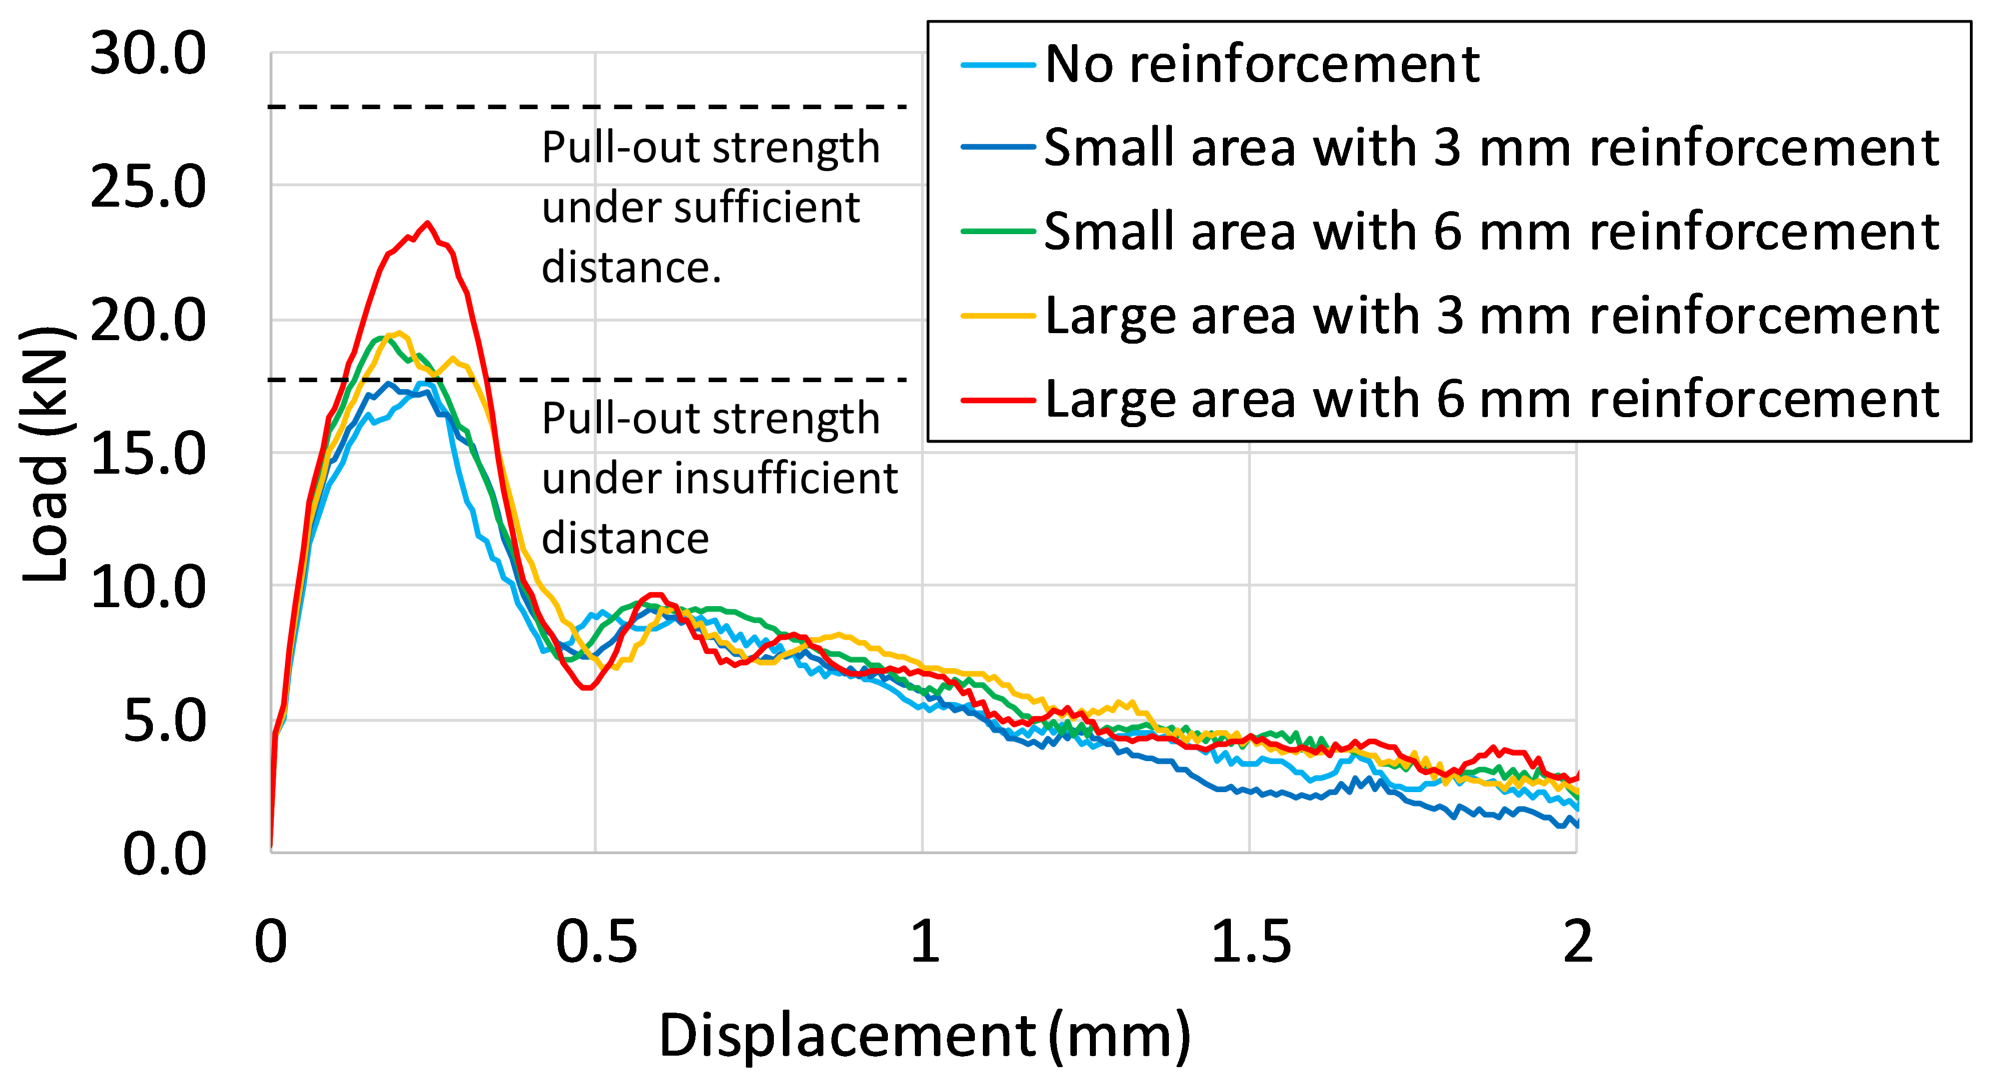
4.5. Measures against Insufficient Distance from the Free End with PCM
5. Conclusions
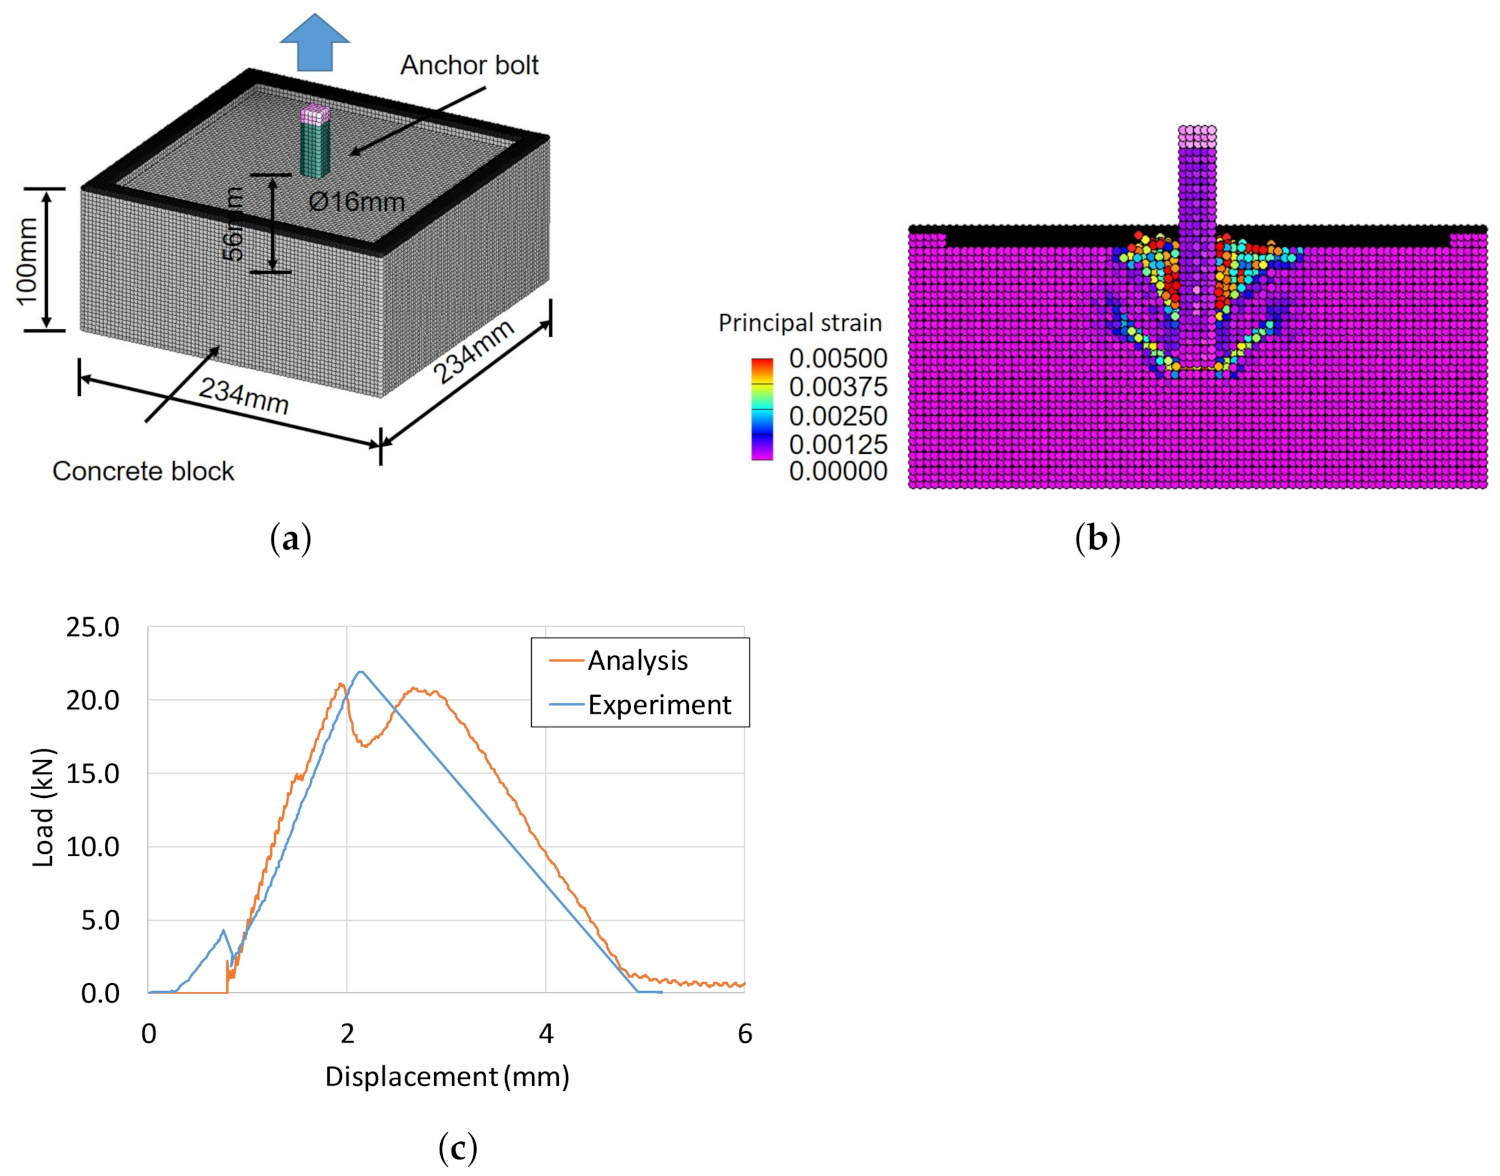
- As a result of comparison with the existing experimental values, it was confirmed that the crack growth analysis using the SPH method proposed in this study was very effective on the accurate estimation of ultimate pull-out strength of anchor bolt.
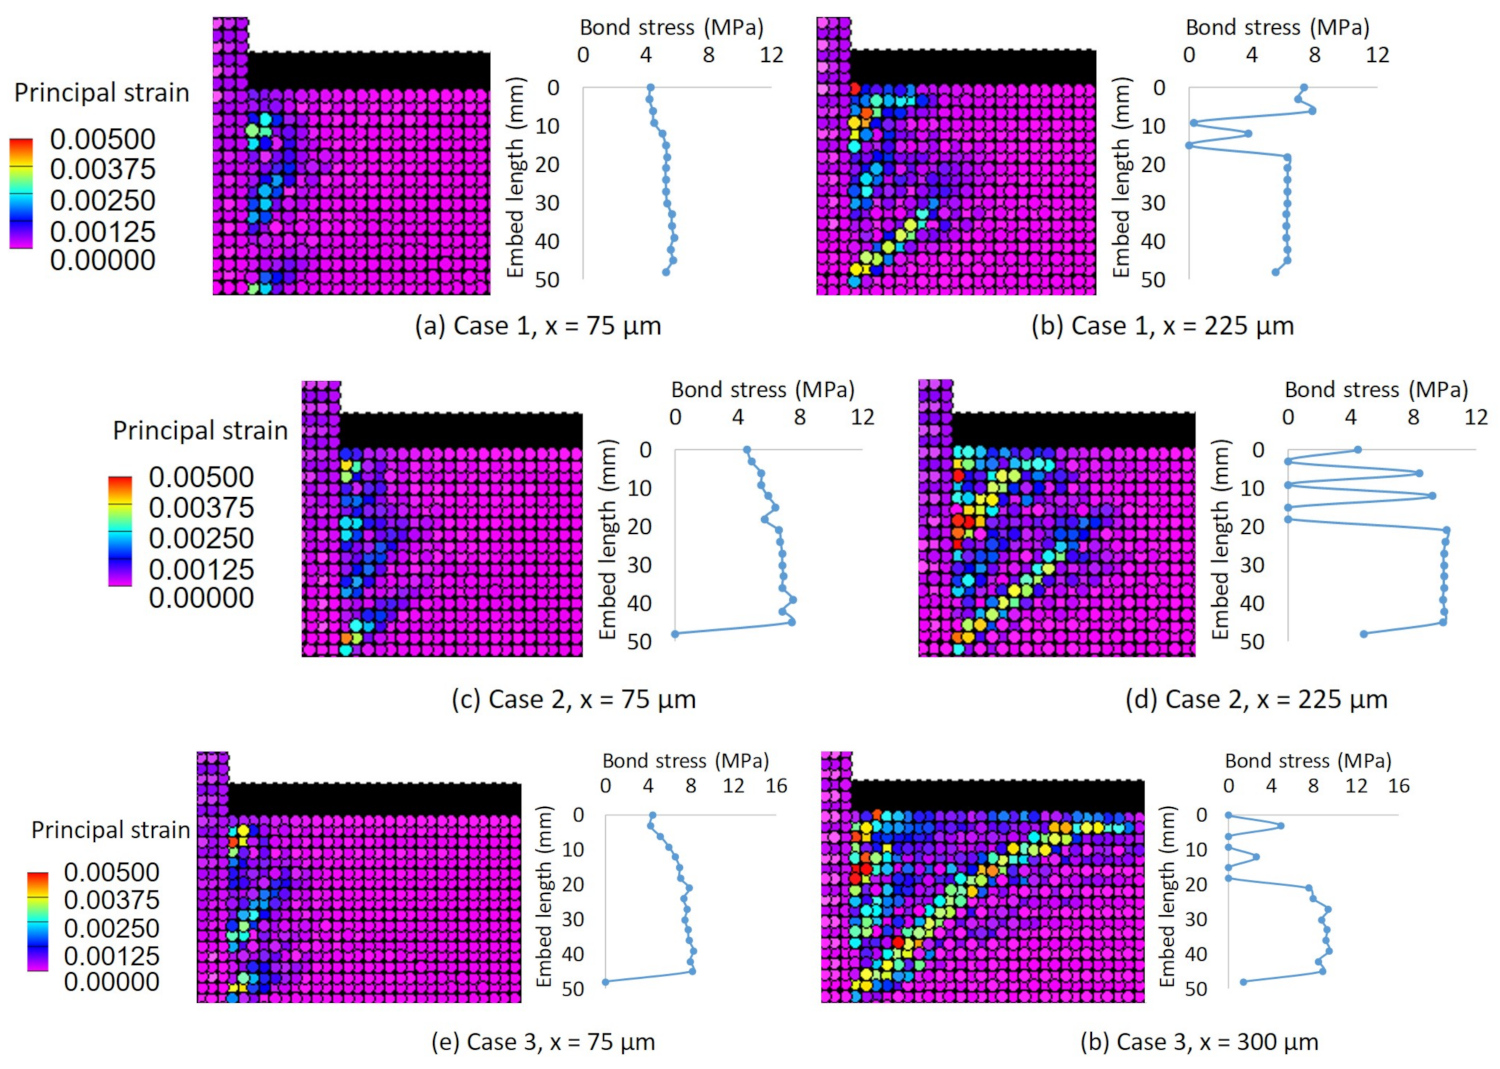
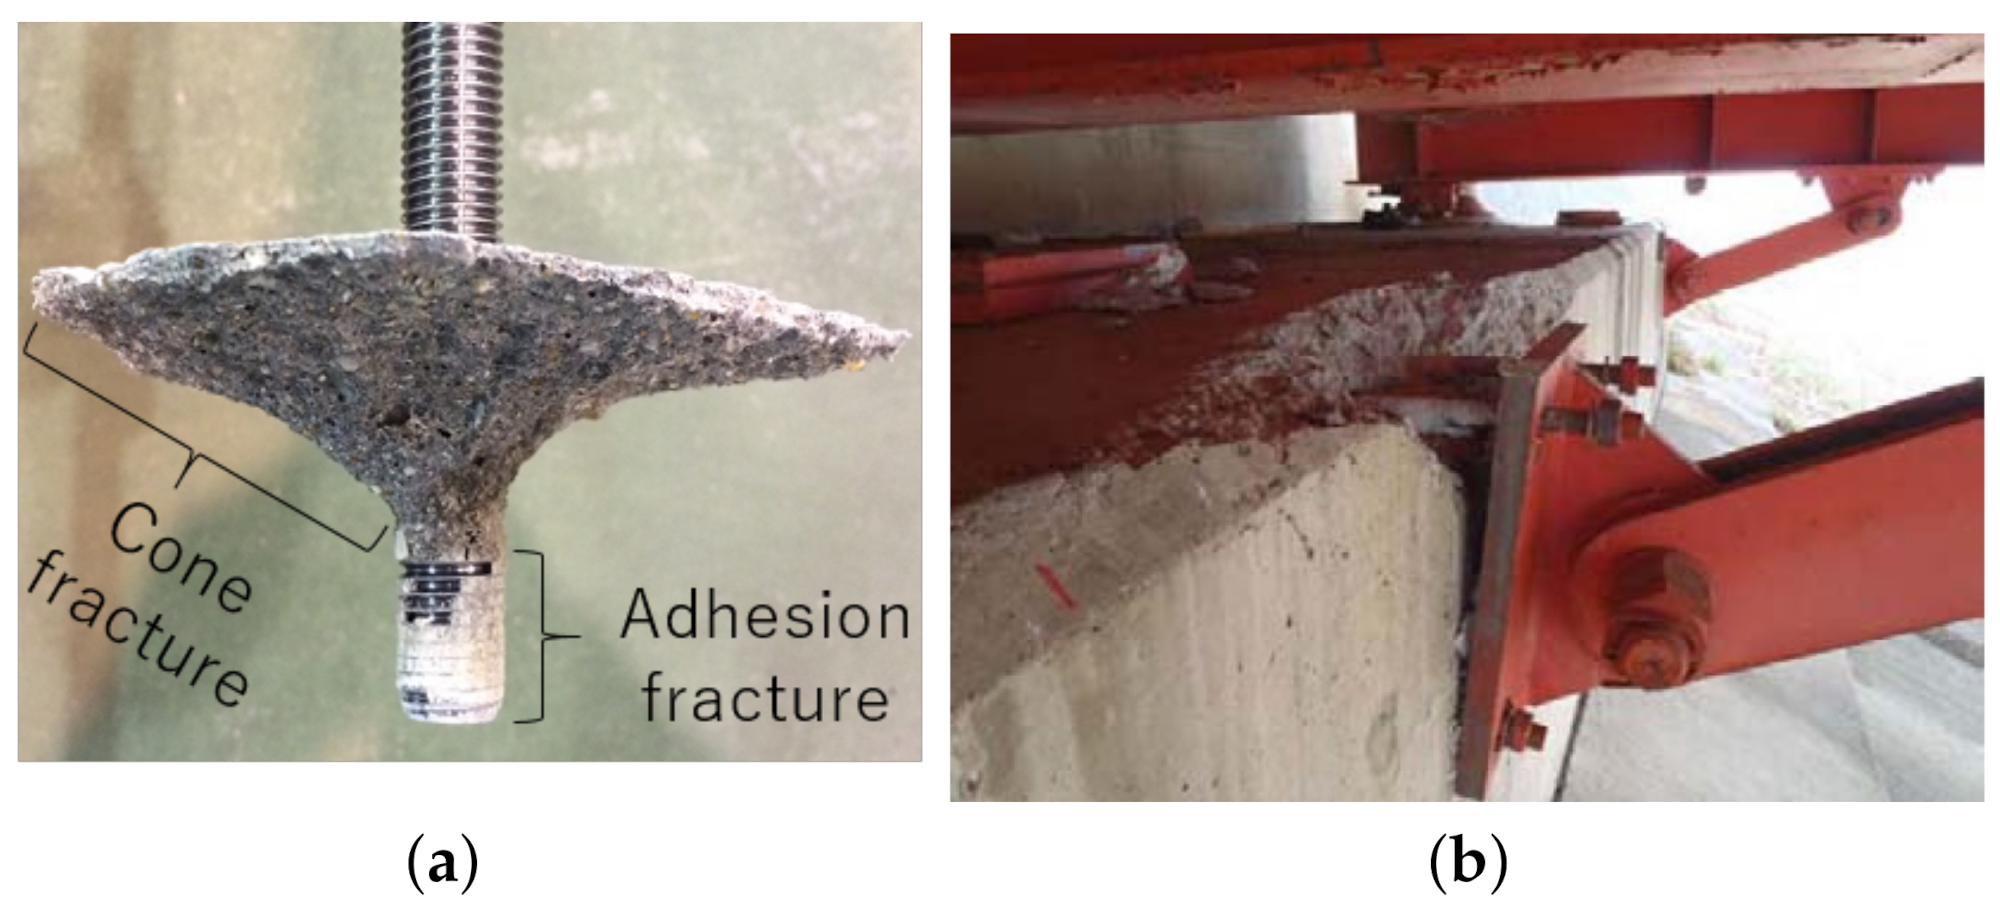
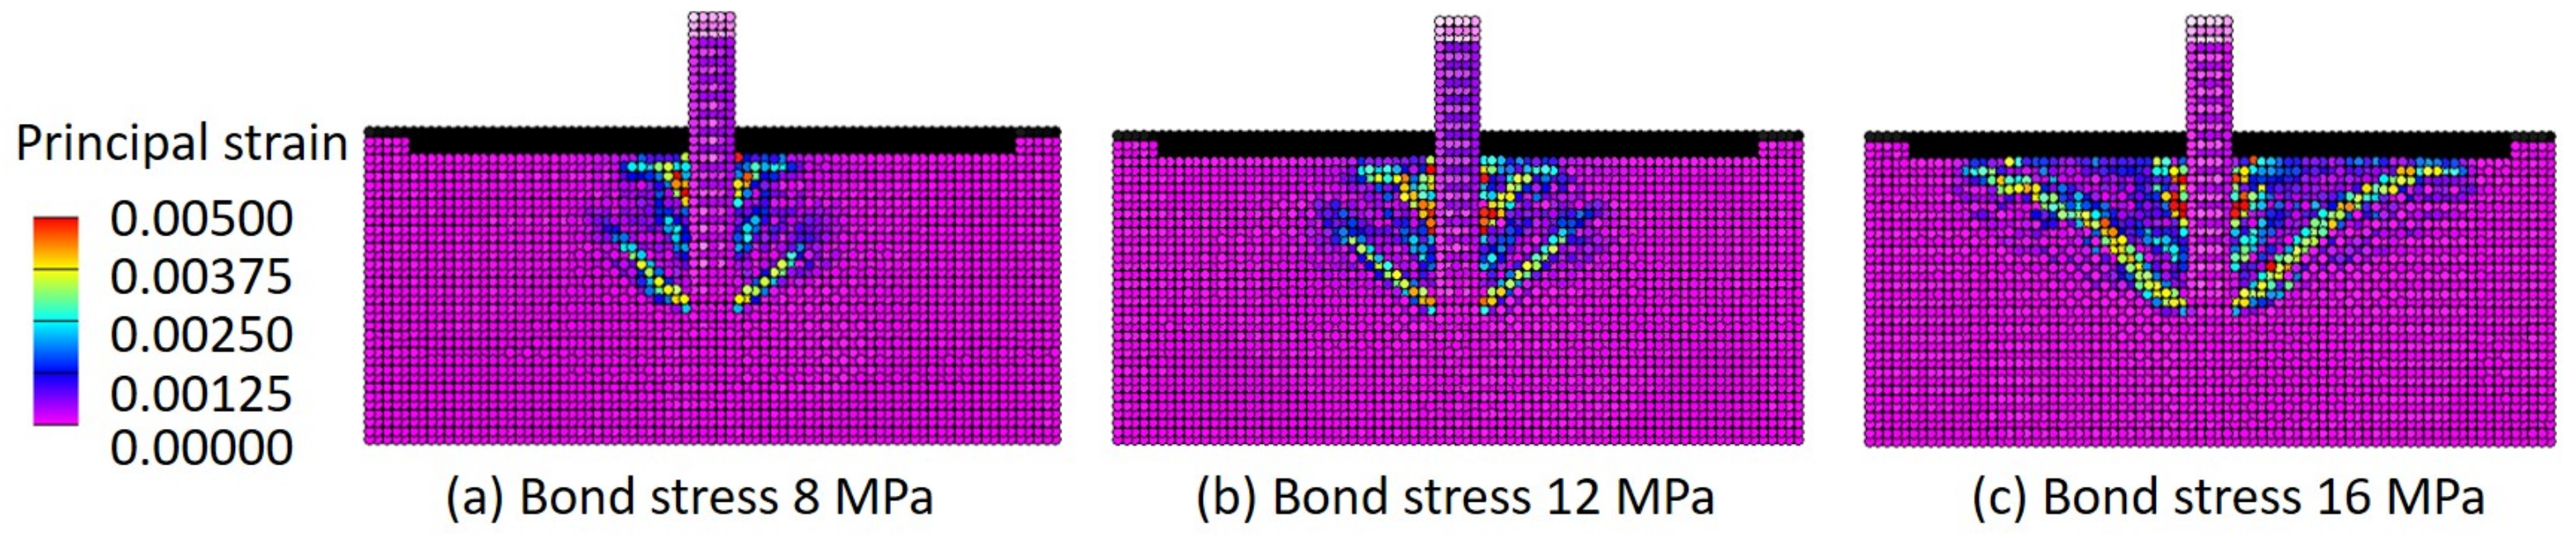
- When changing the parameters of the analysis cases, concrete base fractures are likely to occur with lower embedding depth and higher bond stress, and bond fractures are likely to occur with deeper embedding depth and lower bond stress.
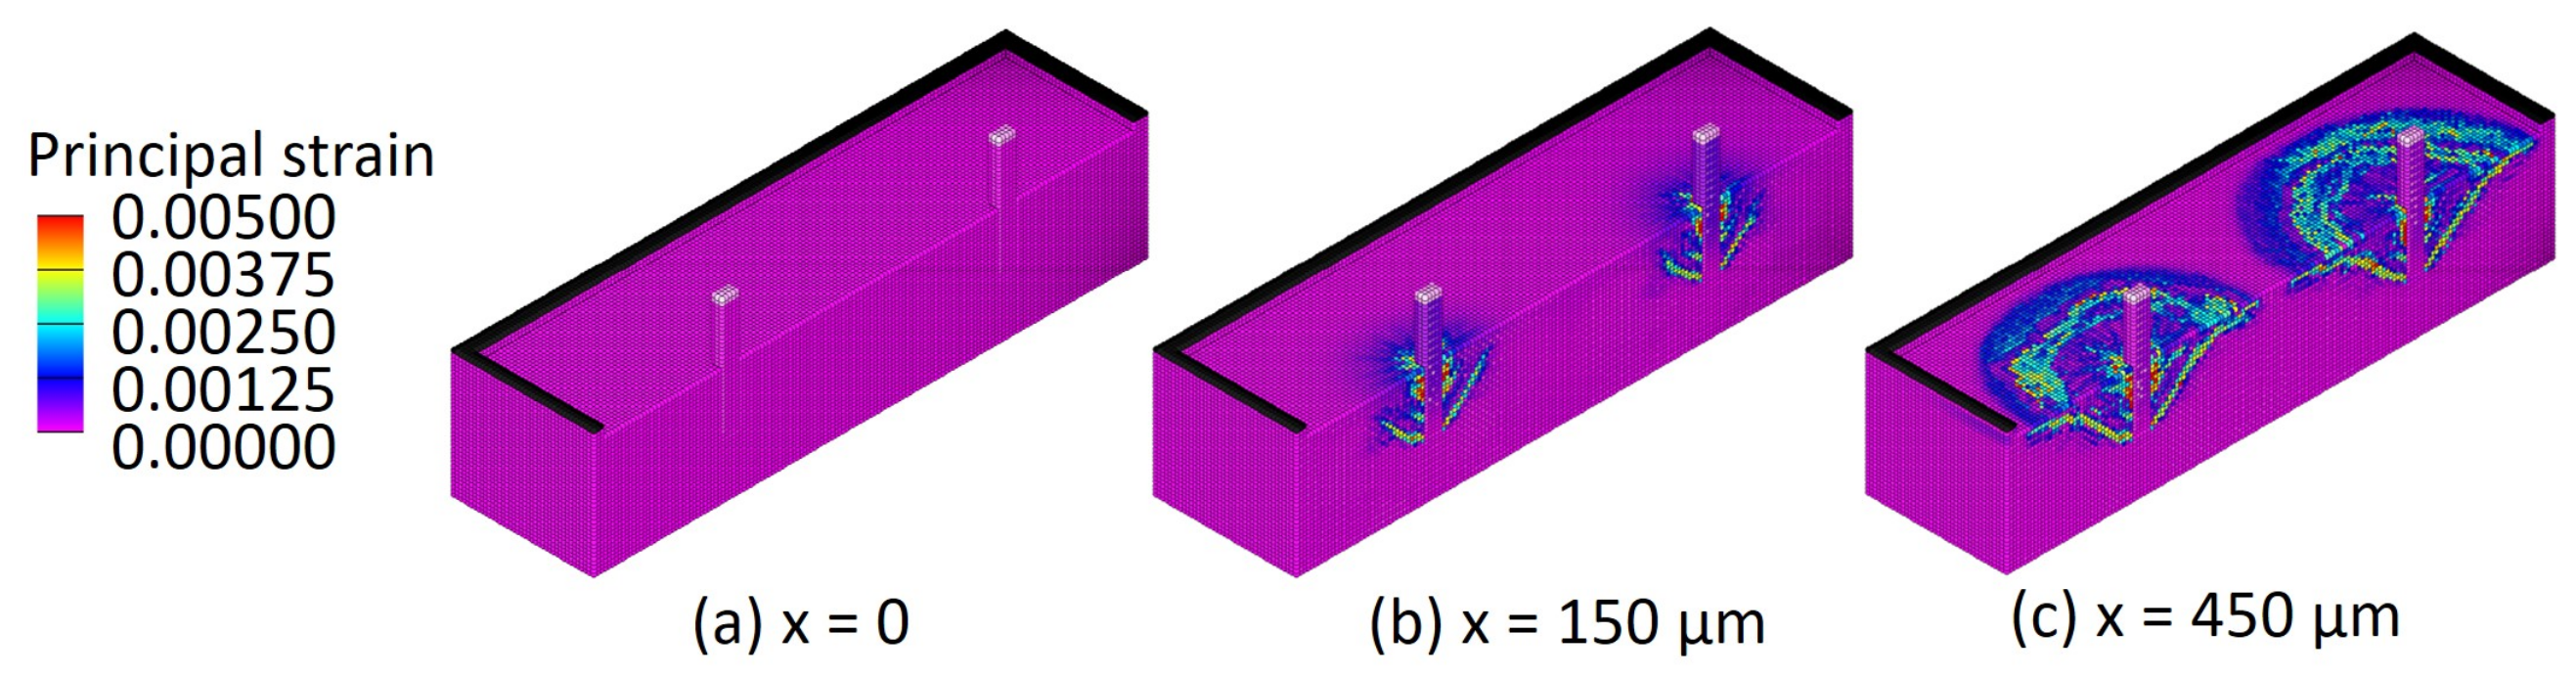
- It was found that, if the distance between two adjacent bolts was shortened under the installation conditions where cone fracture occurred, the cone fracture regions of the individual bolts overlapped, and the total pull-out strength of the two bolts decreased. According to the analysis results, if the distance between two adjacent bolts was smaller than embedded depth, the total pull-out strength decreases around 50% compared to the sufficient distance condition.
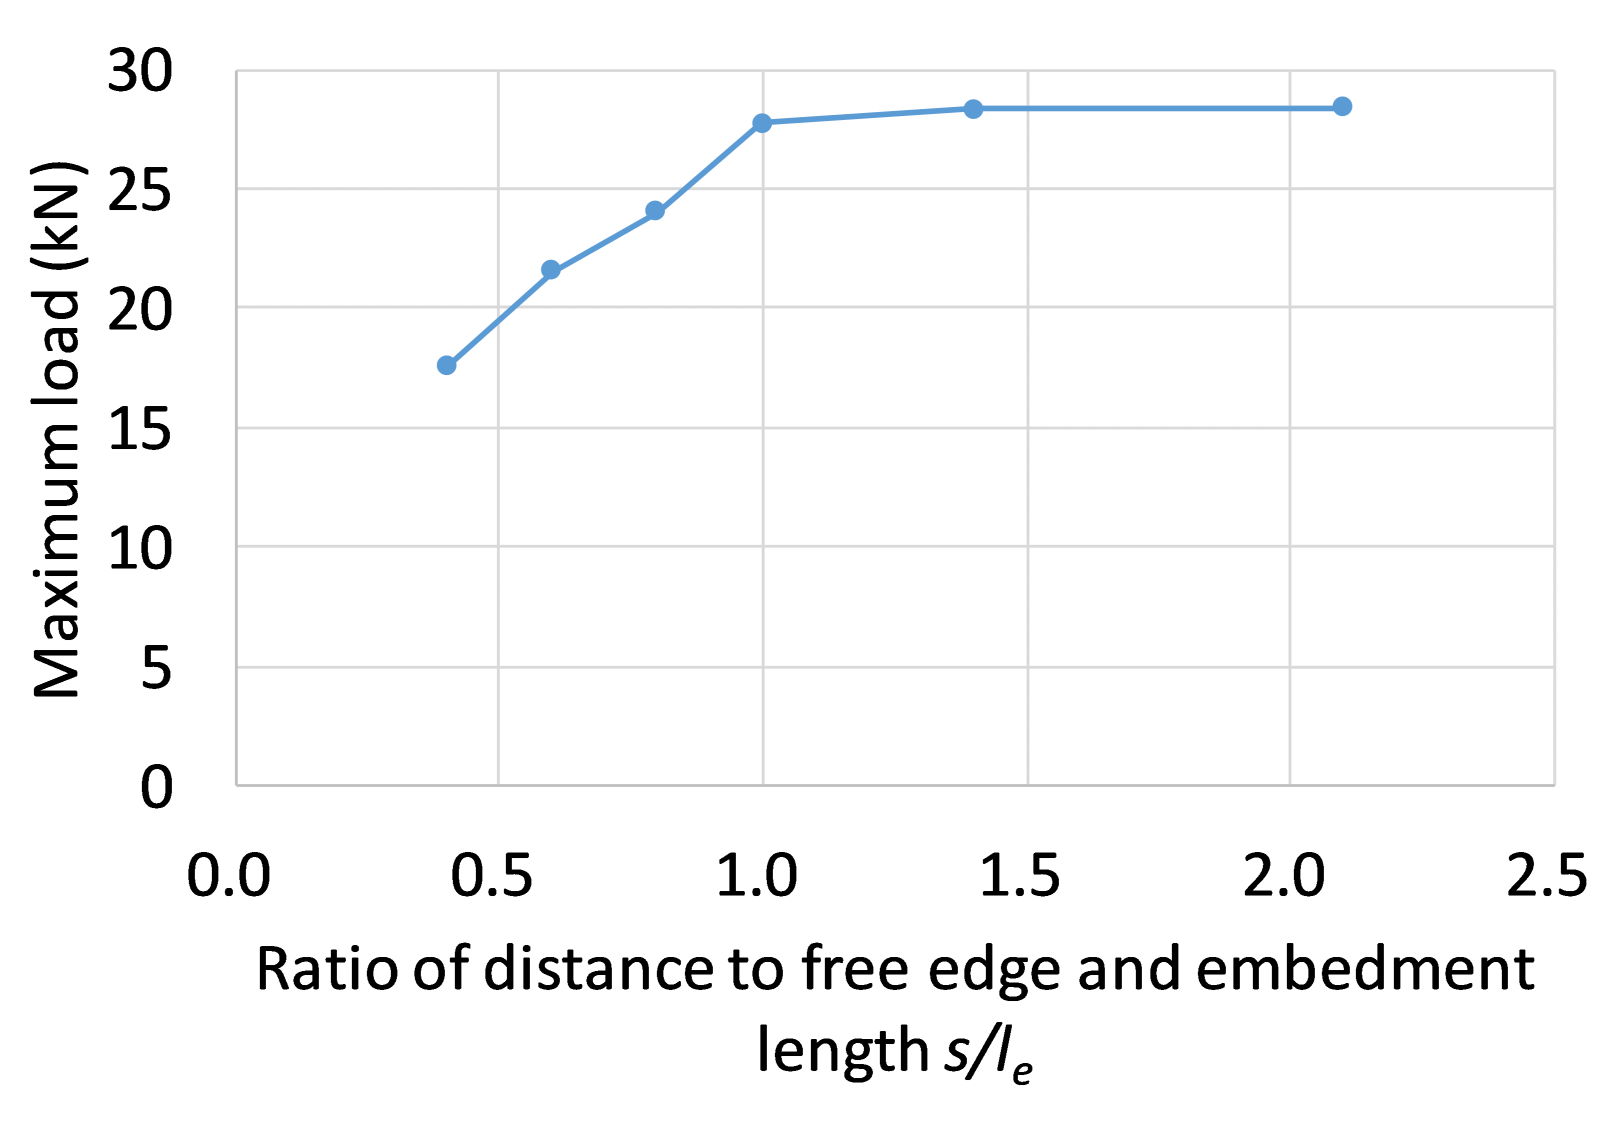
- It was also recognized that, when the distance from the edge was larger than the embedment depth, the pull-out strength could maintain the certain level. However, if the distance from the edge becomes smaller than embedded depth, the pull-out strength decreases with the distance.
- This research simulation shows that, when the distance from the anchor bolt to the edge is about half the embedding depth, the pull-out strength drops to about 50% of the original strength. However, even in such a case, it was confirmed from the analysis results that it is possible to prevent a decrease in the pull-out strength of the anchor bolt by using a PCM material.
Author Contributions
Funding
Institutional Review Board Statement
Informed Consent Statement
Data Availability Statement
Conflicts of Interest
References
- Xiang, N.; Alam, M.S. Comparative seismic fragility assessment of an existing isolated continuous bridge retrofitted with different energy dissipation devices. J. Bridge Eng. 2019, 24, 04019070. [Google Scholar] [CrossRef]
- Yu, P.; Manalo, A.; Ferdous, W.; Salih, C.; Abousnina, R.; Heyer, T.; Schubel, P. Failure analysis and the effect of material properties on the screw pull-out behaviour of polymer composite sleeper materials. Eng. Fail. Anal. 2021, 128, 105577. [Google Scholar] [CrossRef]
- Sharda, A.; Manalo, A.; Ferdous, W.; Bai, Y.; Nicol, L.; Mohammed, A.; Benmokrane, B. Axial compression behaviour of all-composite modular wall system. Compos. Struct. 2021, 268, 113986. [Google Scholar] [CrossRef]
- Yuan, C.; Fan, L.; Cui, J.F.; Wang, W.J. Numerical simulation of the supporting effect of anchor rods on layered and nonlayered roof rocks. Adv. Civ. Eng. 2020, 2020, 4841658. [Google Scholar] [CrossRef] [Green Version]
- Hashimoto, J.; Takiguchi, K. Experimental study on pullout strength of anchor bolt with an embedment depth of 30 mm in concrete under high temperature. Nucl. Eng. Des. 2004, 229, 151–163. [Google Scholar] [CrossRef]
- Munemoto, S.; Sonoda, Y. Experimental analysis of anchor bolt in concrete under the pull-out loading. Procedia Eng. 2017, 171, 926–933. [Google Scholar]
- Richardson, A.; Dawson, S.; Campbell, L.; Moore, G.; Mc Kenzie, C. Temperature related pull-out performance of chemical anchor bolts in fibre concrete. Constr. Build. Mater. 2019, 196, 478–484. [Google Scholar] [CrossRef]
- Yilmaz, S.; Özen, M.A.; Yardim, Y. Tensile behavior of post-installed chemical anchors embedded to low strength concrete. Constr. Build. Mater. 2013, 47, 861–866. [Google Scholar] [CrossRef]
- Epackachi, S.; Esmaili, O.; Mirghaderi, S.R.; Behbahani, A.A.T. Behavior of adhesive bonded anchors under tension and shear loads. J. Constr. Steel Res. 2015, 114, 269–280. [Google Scholar] [CrossRef]
- Nilforoush, R.; Nilsson, M.; Elfgren, L. Experimental evaluation of tensile behaviour of single cast-in-place anchor bolts in plain and steel fibre-reinforced normal-and high-strength concrete. Eng. Struct. 2017, 147, 195–206. [Google Scholar] [CrossRef]
- Eligehausen, R.; Bouska, P.; Cervenka, V.; Pukl, R. Size effect of the concrete cone failure load of anchor bolts. In Fracture Mechanics of Concrete Structures; Bažant, Z.P., Ed.; Elsevier Science: London, UK, 1992; pp. 517–525. [Google Scholar]
- Bajer, M.; Barnat, J. The glue—Concrete interface of bonded anchors. Constr. Build. Mater. 2012, 34, 267–274. [Google Scholar] [CrossRef]
- Liu, Q.; Chai, J.; Chen, S.; Zhang, D.; Yuan, Q.; Wang, S. Monitoring and correction of the stress in an anchor bolt based on Pulse Pre-Pumped Brillouin Optical Time Domain Analysis. Energy Sci. Eng. 2020, 8, 2011–2023. [Google Scholar] [CrossRef]
- Delhomme, F.; Debicki, G.; Chaib, Z. Experimental behaviour of anchor bolts under pullout and relaxation tests. Constr. Build. Mater. 2010, 24, 266–274. [Google Scholar] [CrossRef]
- Satoh, A.; Takeda, K.; Murakami, K. FEM analysis on combined bond-cone fracture of a post-installed adhesive anchor filled with UHPFRC. Theor. Appl. Fract. Mech. 2019, 100, 46–54. [Google Scholar] [CrossRef]
- Obata, M.; Inoue, M.; Goto, Y. The failure mechanism and the pull-out strength of a bond-type anchor near a free edge. Mech. Mater. 1998, 28, 113–122. [Google Scholar] [CrossRef]
- Soparat, P.; Nanakorn, P. Analysis of anchor bolt pullout in concrete by the element-free Galerkin method. Eng. Struct. 2008, 30, 3574–3586. [Google Scholar] [CrossRef]
- Lu, J.; Zhang, Y.; Muhammad, H.; Chen, Z.; Xiao, Y.; Ye, B. 3D analysis of anchor bolt pullout in concrete materials using the non-ordinary state-based peridynamics. Eng. Fract. Mech. 2019, 207, 68–85. [Google Scholar] [CrossRef]
- Saleem, M. Assessing the load carrying capacity of concrete anchor bolts using non-destructive tests and artificial multilayer neural network. J. Build. Eng. 2020, 30, 101260. [Google Scholar] [CrossRef]
- Lucy, L.B. A numerical approach to the testing of the fission hypothesis. Astron. J. 1977, 82, 1013–1024. [Google Scholar] [CrossRef]
- Libersky, L.D.; Petschek, A.G. Smooth particle hydrodynamics with strength of materials. In Advances in the Free-Lagrange Method Including Contributions on Adaptive Gridding and the Smooth Particle Hydrodynamics Method; Springer: Berlin/Heidelberg, Germany, 1991; pp. 248–257. [Google Scholar]
- Libersky, L.D.; Petschek, A.G.; Carney, T.C.; Hipp, J.R.; Allahdadi, F.A. High strain Lagrangian hydrodynamics: A three-dimensional SPH code for dynamic material response. J. Comput. Phys. 1993, 109, 67–75. [Google Scholar] [CrossRef]
- Monier, A.; Zhe, X.; Huang, H.; Zhishen, W. External flexural strengthening of rc beams using BFRP grids and PCM. J. Jpn. Soc. Civ. Eng. Ser. A2 (Appl. Mech. (AM)) 2017, 73, I_417–I_427. [Google Scholar] [CrossRef] [Green Version]
- Higashi, Y.; Li, B.; Jiang, Y. Reinforcement effect of PCM shotcrete method using FRP grid for tunnel maintenance. In Proceedings of the 2012 International Conference on Renewable Energy Research and Applications (ICRERA), Nagasaki, Japan, 11–14 November 2012; IEEE: Piscataway, NJ, USA, 2012; pp. 1–5. [Google Scholar]
- Liu, G.R.; Liu, M.B. Smoothed Particle Hydrodynamics: A Meshfree Particle Method; World Scientific: Singapore, 2003. [Google Scholar]
- JSCE (Japan Society of Civil Engineers). Standard Specifications for Concrete Structures: Design; JSCE: Tokyo, Japan, 2012; pp. 37–38. [Google Scholar]
- Popovics, S. A numerical approach to the complete stress-strain curve of concrete. Cem. Concr. Res. 1973, 3, 583–599. [Google Scholar] [CrossRef]
- Eligehausen, R.; Cook, R.A.; Appl, J. Behavior and design of adhesive bonded anchors. ACI Struct. J. 2006, 103, 822. [Google Scholar]


| Anchor Bolt Fracture | Cone Fracture | Bond Fracture |
|---|---|---|
 | 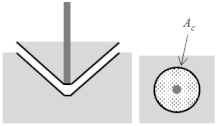 |  |
| Steel | Concrete | |
|---|---|---|
| Compressive strength (MPa) | 408.2 | 48.0 |
| Tensile strength (MPa) | 408.2 | 3.1 |
| Poisson’s ratio | 0.30 | 0.20 |
| Density (kg/m) | 79,000 | 2350.0 |
| Young’s modulus (MPa) | 214,000 | 21,430 |
| Steel | Concrete | |
|---|---|---|
| Compressive strength (MPa) | 408.2 | 25.0 |
| Tensile strength (MPa) | 408.2 | 2.5 |
| Poisson’s ratio | 0.30 | 0.20 |
| Density (kg/m) | 79,000 | 2350.0 |
| Young’s modulus (MPa) | 214,000 | 21,430 |
| Case | Maximum Bond Stress (MPa) | Anchor Bolt Diameter d (mm) | Anchor Bolt Embedment Depth (mm) |
|---|---|---|---|
| 1 | 8 | 16 | 48 |
| 2 | 12 | 16 | 48 |
| 3 | 16 | 16 | 48 |
| 4 | 12 | 8 | 48 |
| 5 | 12 | 24 | 48 |
| 6 | 12 | 16 | 32 |
| 7 | 12 | 16 | 64 |
| Case | Maximum Bond Stress (MPa) | Anchor Bolt Diameter (mm) | Anchor Bolt Embedment Depth (mm) | Final Crack Pattern |
|---|---|---|---|---|
| 2 | 12 | 16 | 48 | Bond-cone complex fracture |
| 4 | 12 | 8 | 48 | Bond fracture |
| 5 | 12 | 24 | 48 | Cone fracture |
| 6 | 12 | 16 | 32 | Cone fracture |
| 7 | 12 | 16 | 64 | Bond fracture |
| Compressive Strength (MPa) | Tensile Strength (MPa) | Poisson’s Ratio | Density (kg/m) | Young’s Modulus (MPa) |
|---|---|---|---|---|
| 60.0 | 6.0 | 0.2 | 2300 | 27,000 |
Publisher’s Note: MDPI stays neutral with regard to jurisdictional claims in published maps and institutional affiliations. |
© 2021 by the authors. Licensee MDPI, Basel, Switzerland. This article is an open access article distributed under the terms and conditions of the Creative Commons Attribution (CC BY) license (https://creativecommons.org/licenses/by/4.0/).
Share and Cite
Lu, C.; Sonoda, Y. An Analytical Study on the Pull-Out Strength of Anchor Bolts Embedded in Concrete Members by SPH Method. Appl. Sci. 2021, 11, 8526. https://doi.org/10.3390/app11188526
Lu C, Sonoda Y. An Analytical Study on the Pull-Out Strength of Anchor Bolts Embedded in Concrete Members by SPH Method. Applied Sciences. 2021; 11(18):8526. https://doi.org/10.3390/app11188526
Chicago/Turabian StyleLu, Chi, and Yoshimi Sonoda. 2021. "An Analytical Study on the Pull-Out Strength of Anchor Bolts Embedded in Concrete Members by SPH Method" Applied Sciences 11, no. 18: 8526. https://doi.org/10.3390/app11188526
APA StyleLu, C., & Sonoda, Y. (2021). An Analytical Study on the Pull-Out Strength of Anchor Bolts Embedded in Concrete Members by SPH Method. Applied Sciences, 11(18), 8526. https://doi.org/10.3390/app11188526