Article

Corrosion Behavior of Corrosion-Resistant Spring Steel Used in High Speed Railway

1
State Key Laboratory of Rolling and Automation, Northeastern University, Shenyang 110819, China
2
HBIS Group Hansteel Company, Handan 056015, China
3
HBIS Group Technology Research Institute, Shijiazhuang 050023, China
4
Shijiazhuang Iron and Steel Co., Ltd., HBIS Group, Shijiazhuang 050031, China
*
Author to whom correspondence should be addressed.
Appl. Sci. 2021, 11(18), 8668; https://doi.org/10.3390/app11188668
Submission received: 6 August 2021 / Revised: 4 September 2021 / Accepted: 10 September 2021 / Published: 17 September 2021

Abstract

:
Corrosion behavior of 60Si2Mn-A and 60Si2Mn-B in simulated industrial atmospheric environment was investigated by alternate immersion corrosion test and electrochemical method. The phase, morphology, characteristics of corrosion products, and the distribution of Cr, Cu, and Ni in the corrosion products of experimental steel were studied by X-ray diffraction (XRD), scanning electron microscopy (SEM), and electron probe microanalyzer (EPMA). The results show that the phase of rust layer is Fe3O4 and γ-FeOOH in the early stage and then changes to α-FeOOH and γ-FeOOH in the later stage; the size of the rust layer with corrosion resistance of 60Si2Mn is less than 60Si2Mn; the Cr element accumulates in the rust layer of the experimental steel in the early stage of corrosion resistance; and Cu, Ni, and Cr in the corrosion resistance 60Si2Mn are concentrated in the rust layer near the substrate In the later stage of corrosion. As the corrosion cycle is prolonged, the corrosion potential and the resistance of the rust layer of the experimental steel increases, and the corrosion current decreases; in the same corrosion cycle, the corrosion potential and corrosion resistance of 60Si2Mn-B are greater than 60Si2Mn, and the corrosion current is less than 60Si2Mn.

1. Introduction

In recent years, the high-speed railway has developed rapidly. With the expansion of railway network scale, with more and more extensive coverage and more and more complex effects on the environment, such as air pollution, acid rain, and other phenomena, the problems caused by the corrosion of railway fastener groups are more and more prominent, especially the hidden danger caused by the corrosion of elastic bar, the core component of railway fastener group; this has attracted more and more attention in the industry [1,2,3].
The high-speed railway runs fast, and the amplitude and load of the elastic bar in use are greater than those of ordinary lines. Therefore, even small surface defects, such as corrosion pits, are extremely sensitive. At present, the solution is to improve the service safety by passively replacing the spring bars before the service period. The spring bars are also faced with many problems, such as missing inspection, false inspection, large amount of replacement, and so on, which not only causes the waste of manpower and material resources but also causes great hidden danger to the driving safety of the high-speed railway.
Some methods, for example, are the coating of high-speed rail spring and use of stainless steel material to improve the corrosion-fatigue performance of high-speed rail springs [4,5]. However, due to the man-made damage caused by the installation process, long-term exposure to the atmosphere and continuous rain and snow erosion, and the underground humid environment, such as tunnels and culverts, the corrosion-resistant layer on the surface of the high-speed railway elastic bar is prone to local damage, resulting in local pitting corrosion on the surface of the elastic bar, which leads to early failure of the elastic bar [6,7,8,9,10]. The comprehensive mechanical properties of the spring are not as good as those of high carbon steel, and the service life of the spring is limited. Compared with the stainless steel spring bar, the corrosion-resistant spring bar has the following advantages: it maintains good mechanical properties (such as elastic limit and strength limit), elastic reduction resistance (i.e., anti elastic reduction performance), low production cost, and good fatigue performance of conventional spring steel. The corrosion-fatigue properties of spring steel can be improved by reducing and inhibiting the initiation and growth of corrosion pits.
Spring steel 60Si2Mn is widely used in railway elastic bar fasteners, locomotive leaf springs, suspension springs, and freight car bogies [11,12,13,14,15,16]. As the key material of important parts, it is of great significance to improve the service life of spring steel in harsh environments, such as corrosion, in addition to considering the fatigue performance and the ability of anti-elasticity degradation [17,18,19,20,21,22,23,24].
In this paper, based on the chemical composition of 60Si2Mn-A spring steel, the chemical composition design was carried out, adding a certain amount of micro alloying elements Cu and Ni to improve the corrosion resistance and increasing the content of Cr to improve the corrosion resistance of spring steel. Chromium can form a dense Cr2O3 film on its surface. This oxide film can not only prevent the diffusion of oxygen, sulfur, and nitrogen into steel but also hinder the outward diffusion of metal ions. Within a certain temperature range, it can also form a spinel type composite oxide film with good protection. Increasing Ni content can improve the pitting potential of steel so as to control the generation and growth of corrosion pits and improve the overall corrosion resistance of the material. Ni can effectively prevent the invasion of Cl and improve the corrosion resistance of matrix and corrosion-fatigue properties of materials. Adding an appropriate amount of copper into steel can significantly improve the corrosion resistance of steel. Because in the corrosion process of steel, copper plays the role of activating cathode, promoting the passivation of steel anode, so as to slow down the corrosion. In addition, a thin, copper-rich layer is generated on the surface of the steel during the corrosion process. A tight, thin, copper-oxide intermediate layer if formed between the surface corrosion layer of the steel and the copper enrichment layer to form a dense and complete double rust layer. The rust layer has strong adhesion and can slow down the corrosion medium to further corrode the interior of the steel. The corrosion behavior of conventional spring steel and new corrosion-resistant spring steel in simulated industrial atmospheric environment was compared. The mechanism of corrosion behavior of spring steel was comprehensively discussed through observation of corrosion morphology, analysis of microstructure and chemical composition of rust layer, and testing of electrochemical characteristics so as to provide basis for developing economic corrosion resistant spring steel with good corrosion resistance in industrial atmospheric environments.

2. Materials and Methods

2.1. Experimental Materials

The experimental materials are 60Si2Mn-B and 60Si2Mn-A after the same rolling and heat-treatment process. The chemical composition is shown in Table 1. Experiments of steel-rolling technology use Φ450 mm hot rolling experiments on two-phase control rolling. In the first stage, the 80-mm-thick raw material billet is rolled into a 30-mm-thick intermediate billet; the total deformation is 62.5%, the opening rolling temperature is 1160–1150 °C, and the final rolling temperature is 1000–980 °C. After the completion of the first stage of rolling, air is cooled to 970–960 °C for the second stage of rolling. In the second stage, the 30-mm-thick intermediate billet is rolled into 6-mm-thick steel plate in six passes. The opening rolling temperature is 970–960 °C, and the final rolling temperature is 880–850 °C. After the final rolling, air cooling is performed. The heat-treatment process of the experimental steel was 870 °C for 45 min hardening and 440 °C for 60 min tempering. The heat-treatment process of the experimental steel was 870 °C for 45 min hardening and 440 °C for 60 min tempering.

2.2. Experimental Methods

The corrosion-resistant sample size is 60 mm × 40 mm × 5 mm, and the surface roughness is 0.7 m. The sample was cleaned by ultrasonic wave with acetone, then washed with anhydric ethanol and blow-dried. After being placed in a dryer for 24 h, the initial mass of the sample was weighed with an electronic balance, with the precision of 0.1 mg. Zqfs-1200 z type periodic infiltrating corrosion test box was used for accelerated corrosion test. The experimental method was based on railway standard TB/T 2375-1993 (test method for periodic infiltrating corrosion of weathering steel for railway use). The test solution was NaHSO3 solution with a concentration of (1.0 ± 0.05) ×10−2 mol/L, solution temperature (45 ± 2) °C, and humidity (70 ± 5)%. NaHSO3 solution with 0.02 mol/L was used as the make-up solution. The pH value of the solution was controlled within the range of 4.4~4.8 to simulate the corrosive environment of industrial atmosphere. Each cycle of the test was 60 min, with the infiltration time of 12 min, and the rest of the time, it was baked by infrared lamp. After baking, the maximum surface temperature of the sample was (70 ± 10) °C. A total of 360 h was carried out in the test, and samples were taken in cycles of 24 h, 72 h, 144 h, 216 h, and 360 h. After the samples were taken out, they were washed in anhydrous ethanol, then cleaned with acetone and dried by hot air and stored in a dryer.
The corrosion rate was calculated by weight loss method. At the end of each cycle, the samples were taken out, and the rust layer was removed with a chemical reagent prepared by mixing 250 mL hydrochloric acid +250 mL distilled water +3 g hexamethylenetetramine. After the sample was cleaned, it was washed in anhydrous ethanol, then cleaned with acetone and dried by hot air and then dried in a dryer for 24 h, then weighed and recorded.
X-ray diffractometer was used for phase analysis of the sample’s rust layer. Cu target was selected, and the scanning angle of 2θ ranged from 10° to 70°. The peak positions of the corrosion phases were identified with PDF-2 (2004) database using MDI jade software. FEI QUANTA 600 electron scanning microscope (SEM) was used to observe the surface morphology of rust layer. JEOL JXA -8530F electron probe micro-analyzer (EPMA) was used to analyze the cross-sectional morphology and element-mapping distribution of rust layer with WDS.
For the determination of the polarization curve and electrochemical AC impedance of the rusty samples, CS2350 double-cell electrochemical workstation was adopted. The motor system was a three-electrode system, and the working electrode was rusty samples. The area with a surface radius of 5 mm of the rusty samples was taken as the measuring work area; reference electrode (SCE), auxiliary electrode (Pt), working electrode, and reference electrode were connected by a salt bridge. The electrolyte of NaHSO3 solution was 0.01 mol/L, and the solution temperature was 25 °C. In the experiment, the polarization curve was measured by potentiometric scanning method, and the scanning rate was 0.5 mV/s. The test frequency range of electrochemical impedance spectrum was 10−2~105 Hz, and a disturbance voltage of 10 mV was applied during the test.

3. Results and Discussion

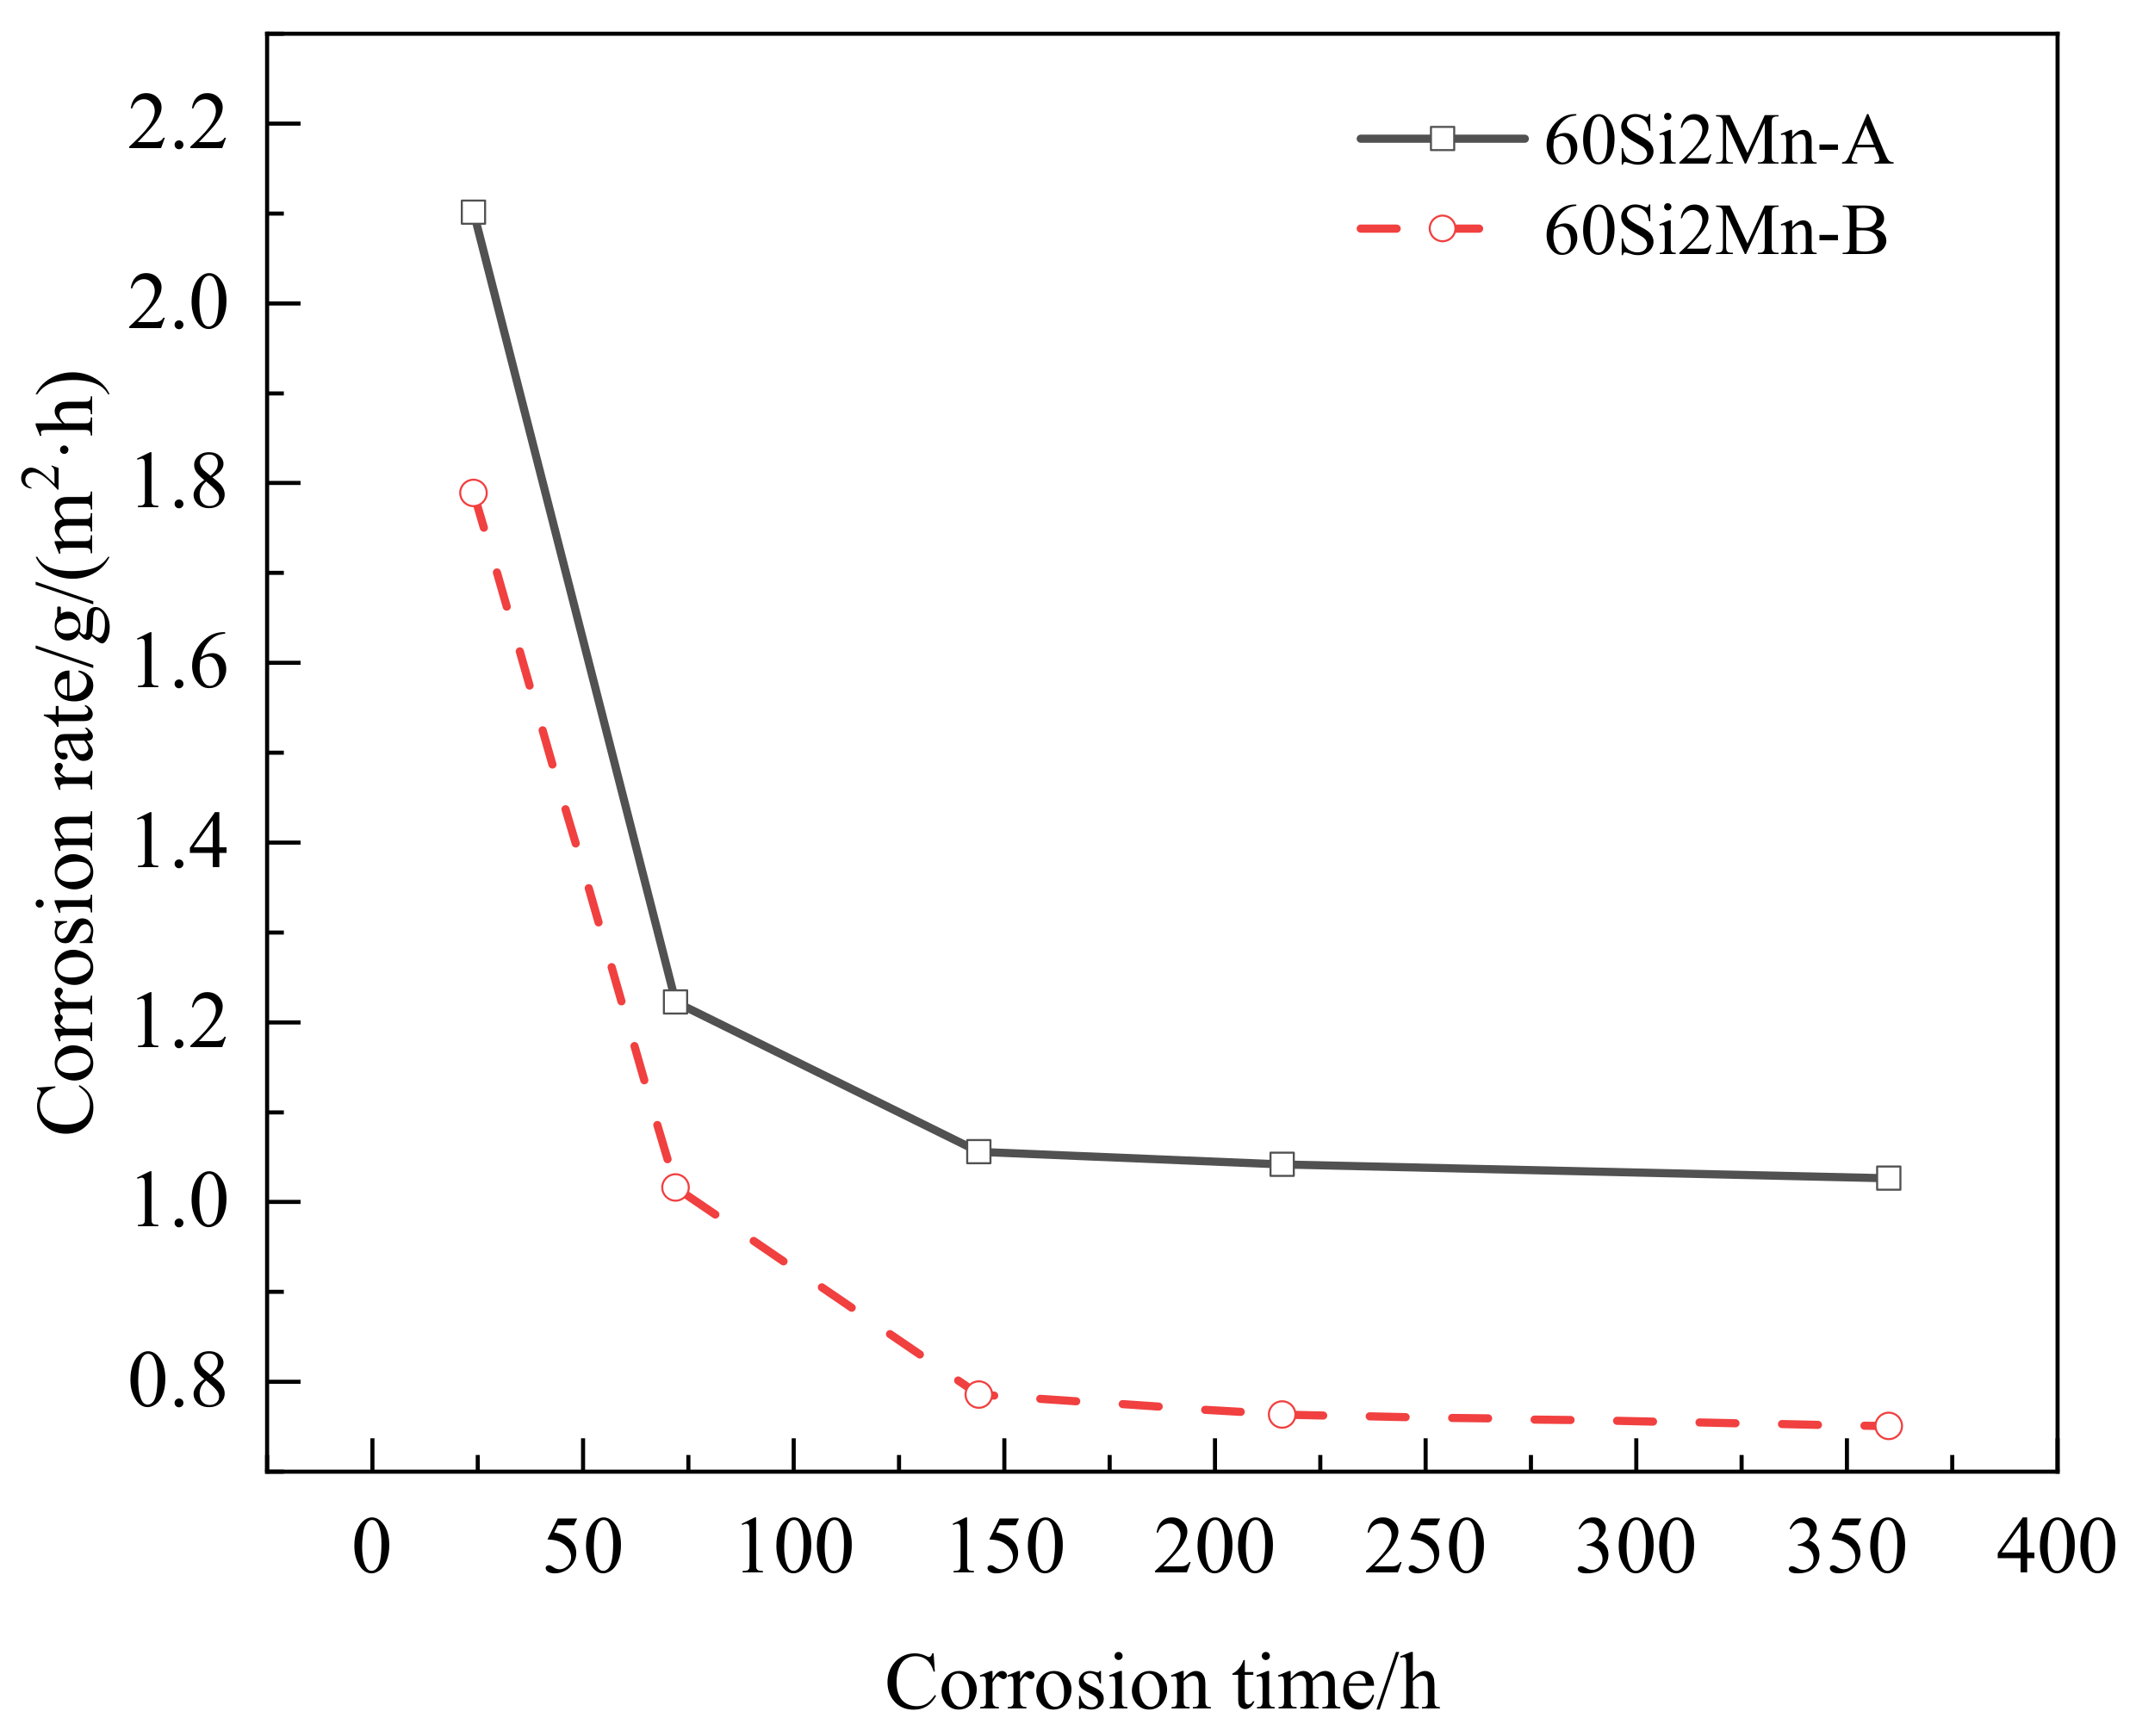
3.1. Law of Corrosion Rate Variation

The corrosion rate of the samples is calculated by weight loss method, and the calculation formula of corrosion weight loss rate is shown in Formula (1):
W = G 0 G 1 2 a × b + b × c + a × c t × 10 6
where: W—corrosion weight loss rate, g/(m2·h); G0—original mass of sample, g; G1—mass after corrosion and rust removal, g; a—length of sample, mm; b—sample width, mm; c—sample thickness, mm; and t—experimental time, h.
According to Formula (1), the corrosion weight loss rate of the sample in different corrosion cycles can be calculated, as shown in Figure 1. Figure 1 shows the relationship between corrosion rates and corrosion time of the two types of steel. It can be seen from the figure that the corrosion rate of the experimental steel decreases gradually with the extension of time and decreases slowly after 150 h of corrosion. This indicates that with the progress of the experiment, the rust layer formed on the surface of the experimental steel plays a certain role in preventing the corrosion. Under different test periods, the corrosion rate of 60Si2Mn-B is lower than that of the 60Si2Mn-A, and the corrosion resistance of 60Si2Mn-B is higher than that of the 60Si2Mn-A, which indicates that the increase of Cr and the addition of Ni and Cu can improve the corrosion resistance of spring steel.

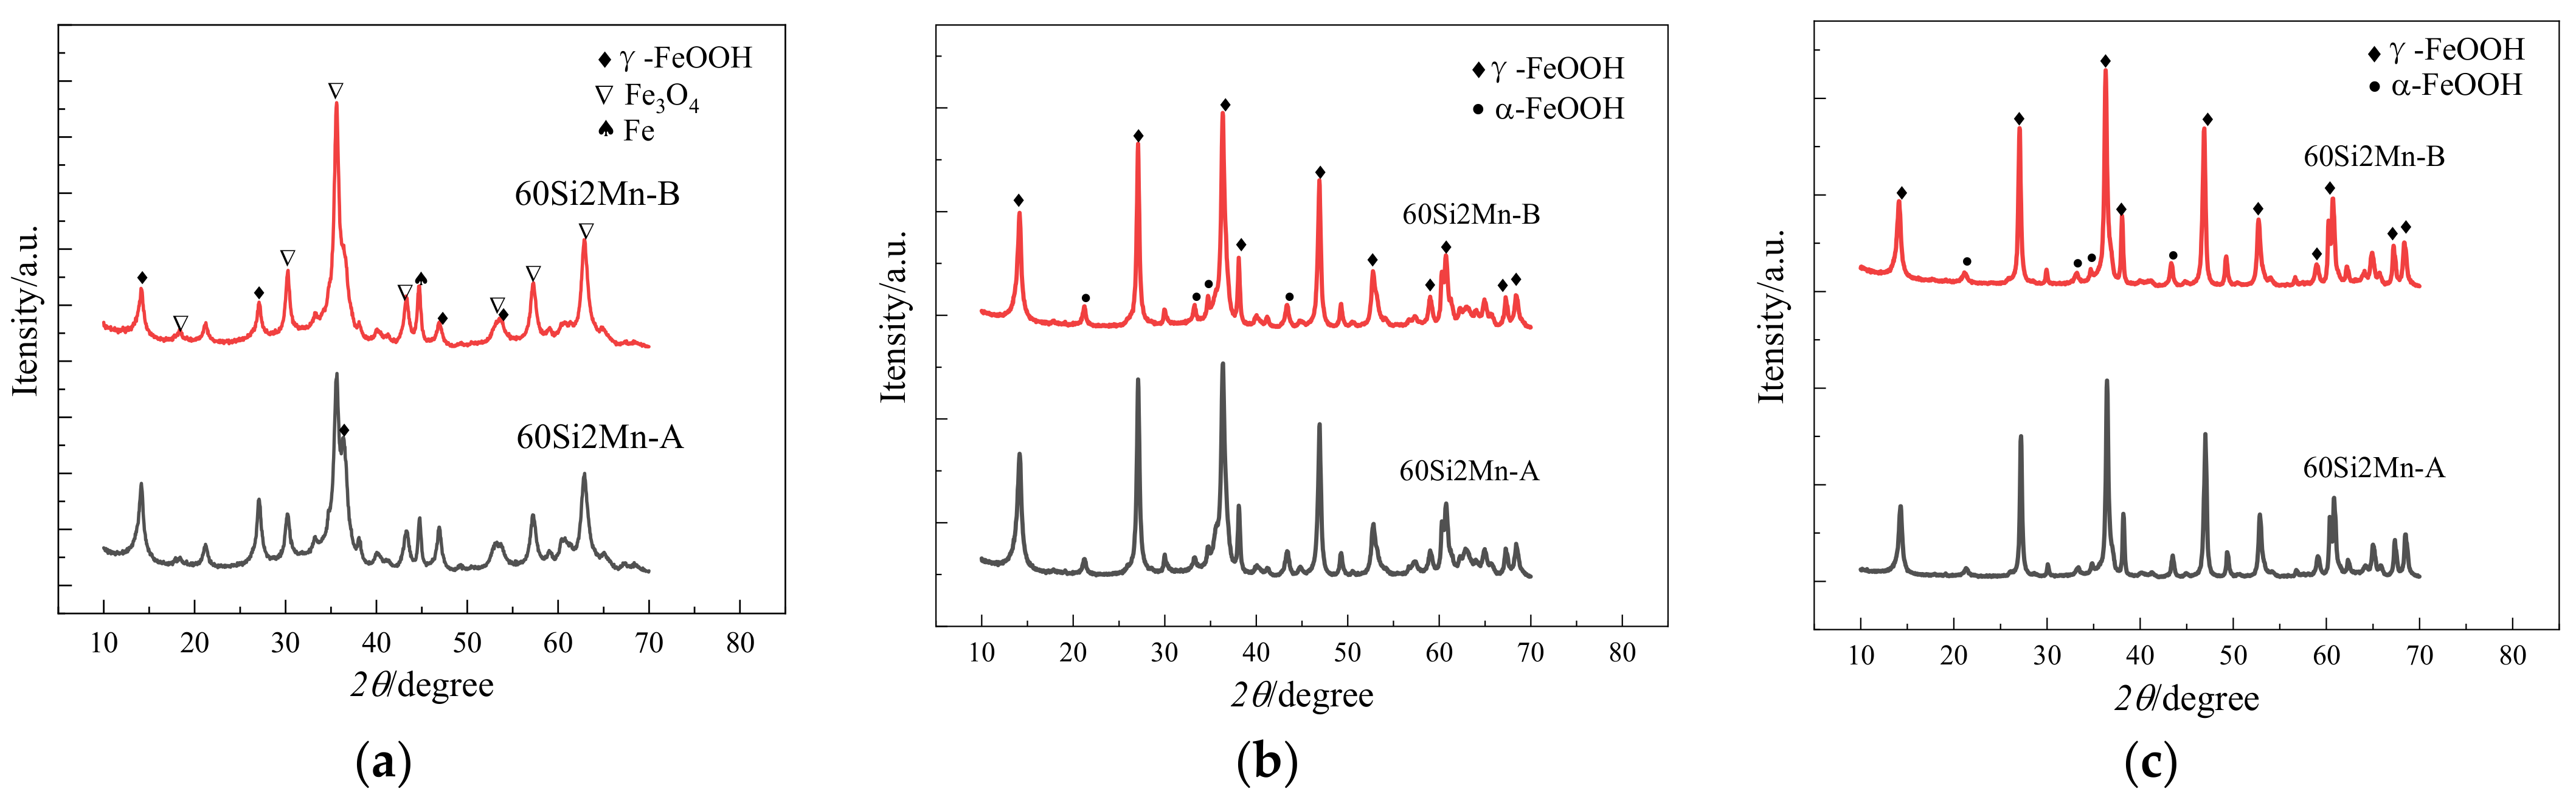
3.2. Phase Analysis of Corroded Rust Layer

Figure 2 shows the XRD patterns of 60Si2Mn-B and 60Si2Mn-A at different corrosion cycles of 24 h, 72 h, and 360 h. Figure 2 shows that in the same corrosion period, 60Si2Mn-B and 60Si2Mn-A corrosion rust layer products are the same. The addition of corrosion resistant elements Cu, Ni, and Cr has no effect on the type of phase in the spring steel rust layer. After 24 h of corrosion, the surface corrosion rust layer is mainly composed of Fe3O4 and γ-FeOOH, and the Fe peak is caused by the thin surface rust layer and partially exposed matrix in the early corrosion stage. The corroded rust layers are γ-FeOOH and α-FeOOH at 72 h and 360 h, respectively, and the phase diffraction peak intensity at 360 h is higher than that at 72 h, indicating that the number of corroded rust layers increases with the extension of the corrosion time.
γ-FeOOH is the first metastable product with a tendency of spontaneous transition to thermodynamic stable phase. As the corrosion cycle increases, γ-FeOOH first dissolves and precipitates to form amorphous ferric hydroxide, which is then deprotonated by hydroxyl ions supplied by water to form α-FeOOH [2], the rust layer at the later stage of corrosion. α-FeOOH is the most stable insulator phase in the rust layer, with fine grain and strong corrosion resistance, which plays a good protective role on the matrix. When simulating the corrosion experiment of industrial atmosphere environment, the corrosion solution is slightly acidic, and the acidic solution will also promote the transition from γ-FeOOH to α-FeOOH [25].

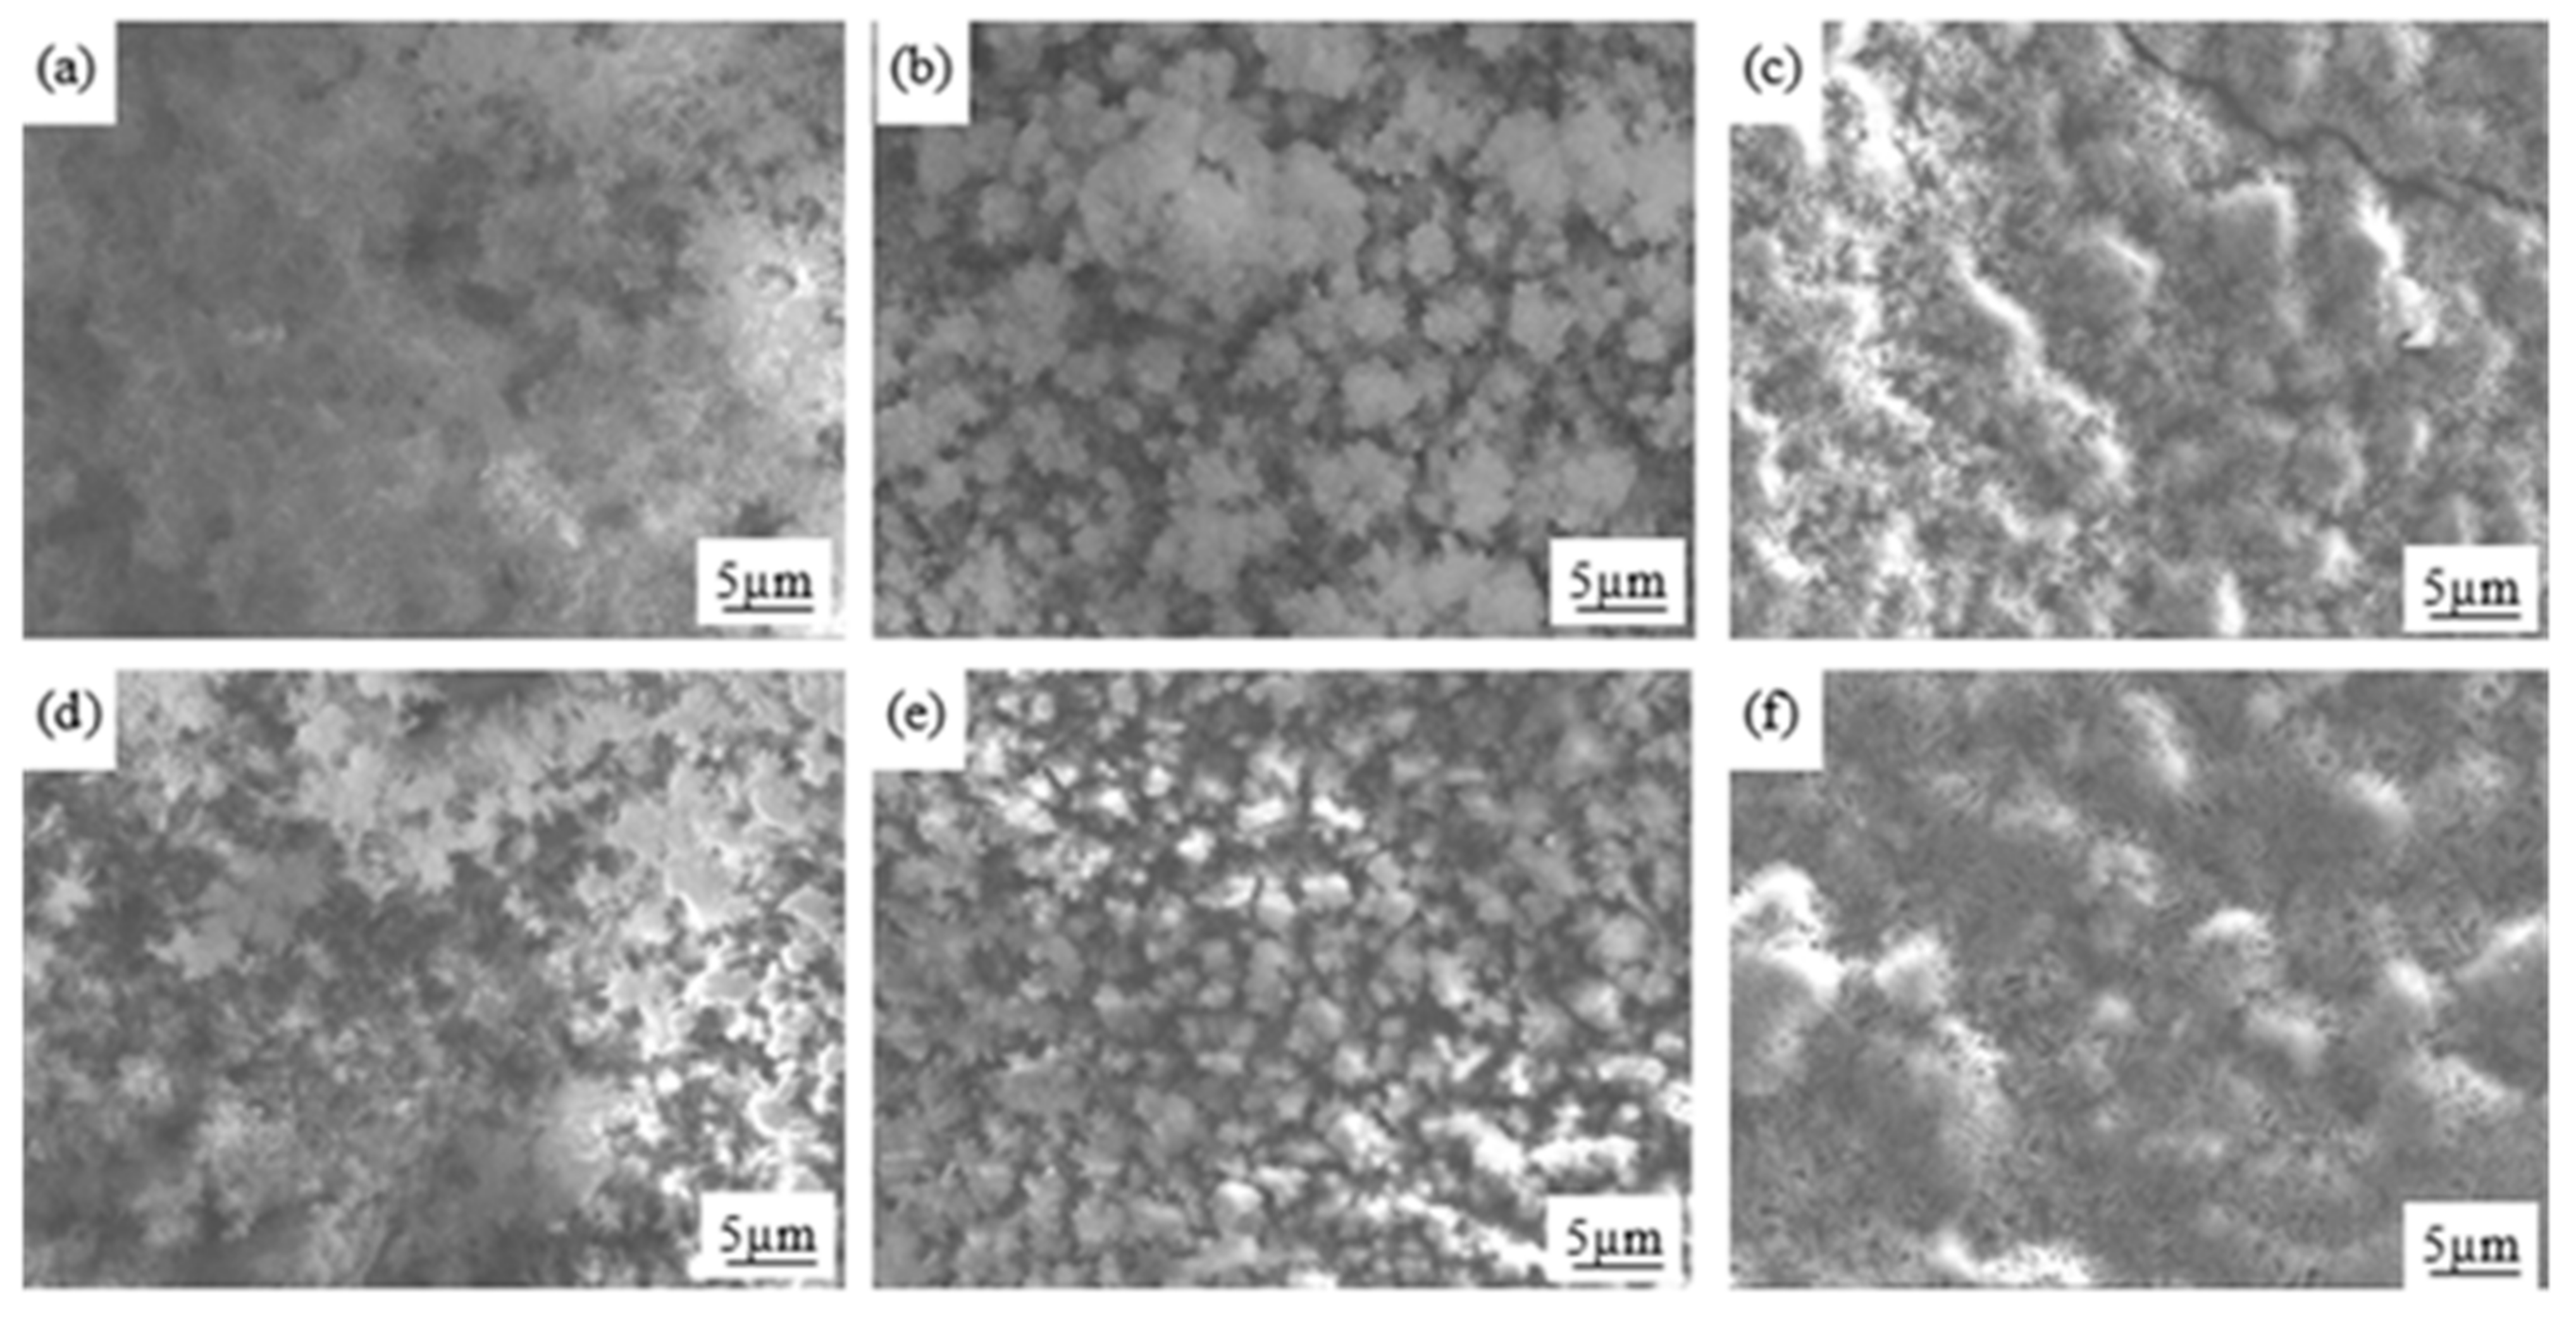
3.3. Rust Layer Morphology

After periodic infiltration corrosion, the surface rust layer of the sample was brownish yellow. Scanning electron microscope was used to observe the surface morphology of the rust layer after 24 h, 72 h, and 360 h corrosion of the sample, as shown in Figure 3. It can be seen from the figure that, with the extension of corrosion time, the rust layer gradually accumulates into globular clusters with small gaps from loose flocs. In the same period, the 60Si2Mn-B rust layer flocculent and the holes and gaps between them are smaller than the 60Si2Mn-A. The conjugation phase analysis shows that the floccular rust layer should be γ-FeOOH. With the extension of corrosion time, γ-FeOOH gradually changes to α-FeOOH, and α-FeOOH increases continuously. In the rust layer, there are more spherical clusters formed by rod-shaped heap rolling, which is a typical α-FeOOH morphology. The spherical clusters have larger monomers in the corrosive rust layer and smaller gaps between the rust layer, which can prevent the matrix from contacting with the corrosive medium in the corrosive environment and thus improve the resistance of the rust layer.

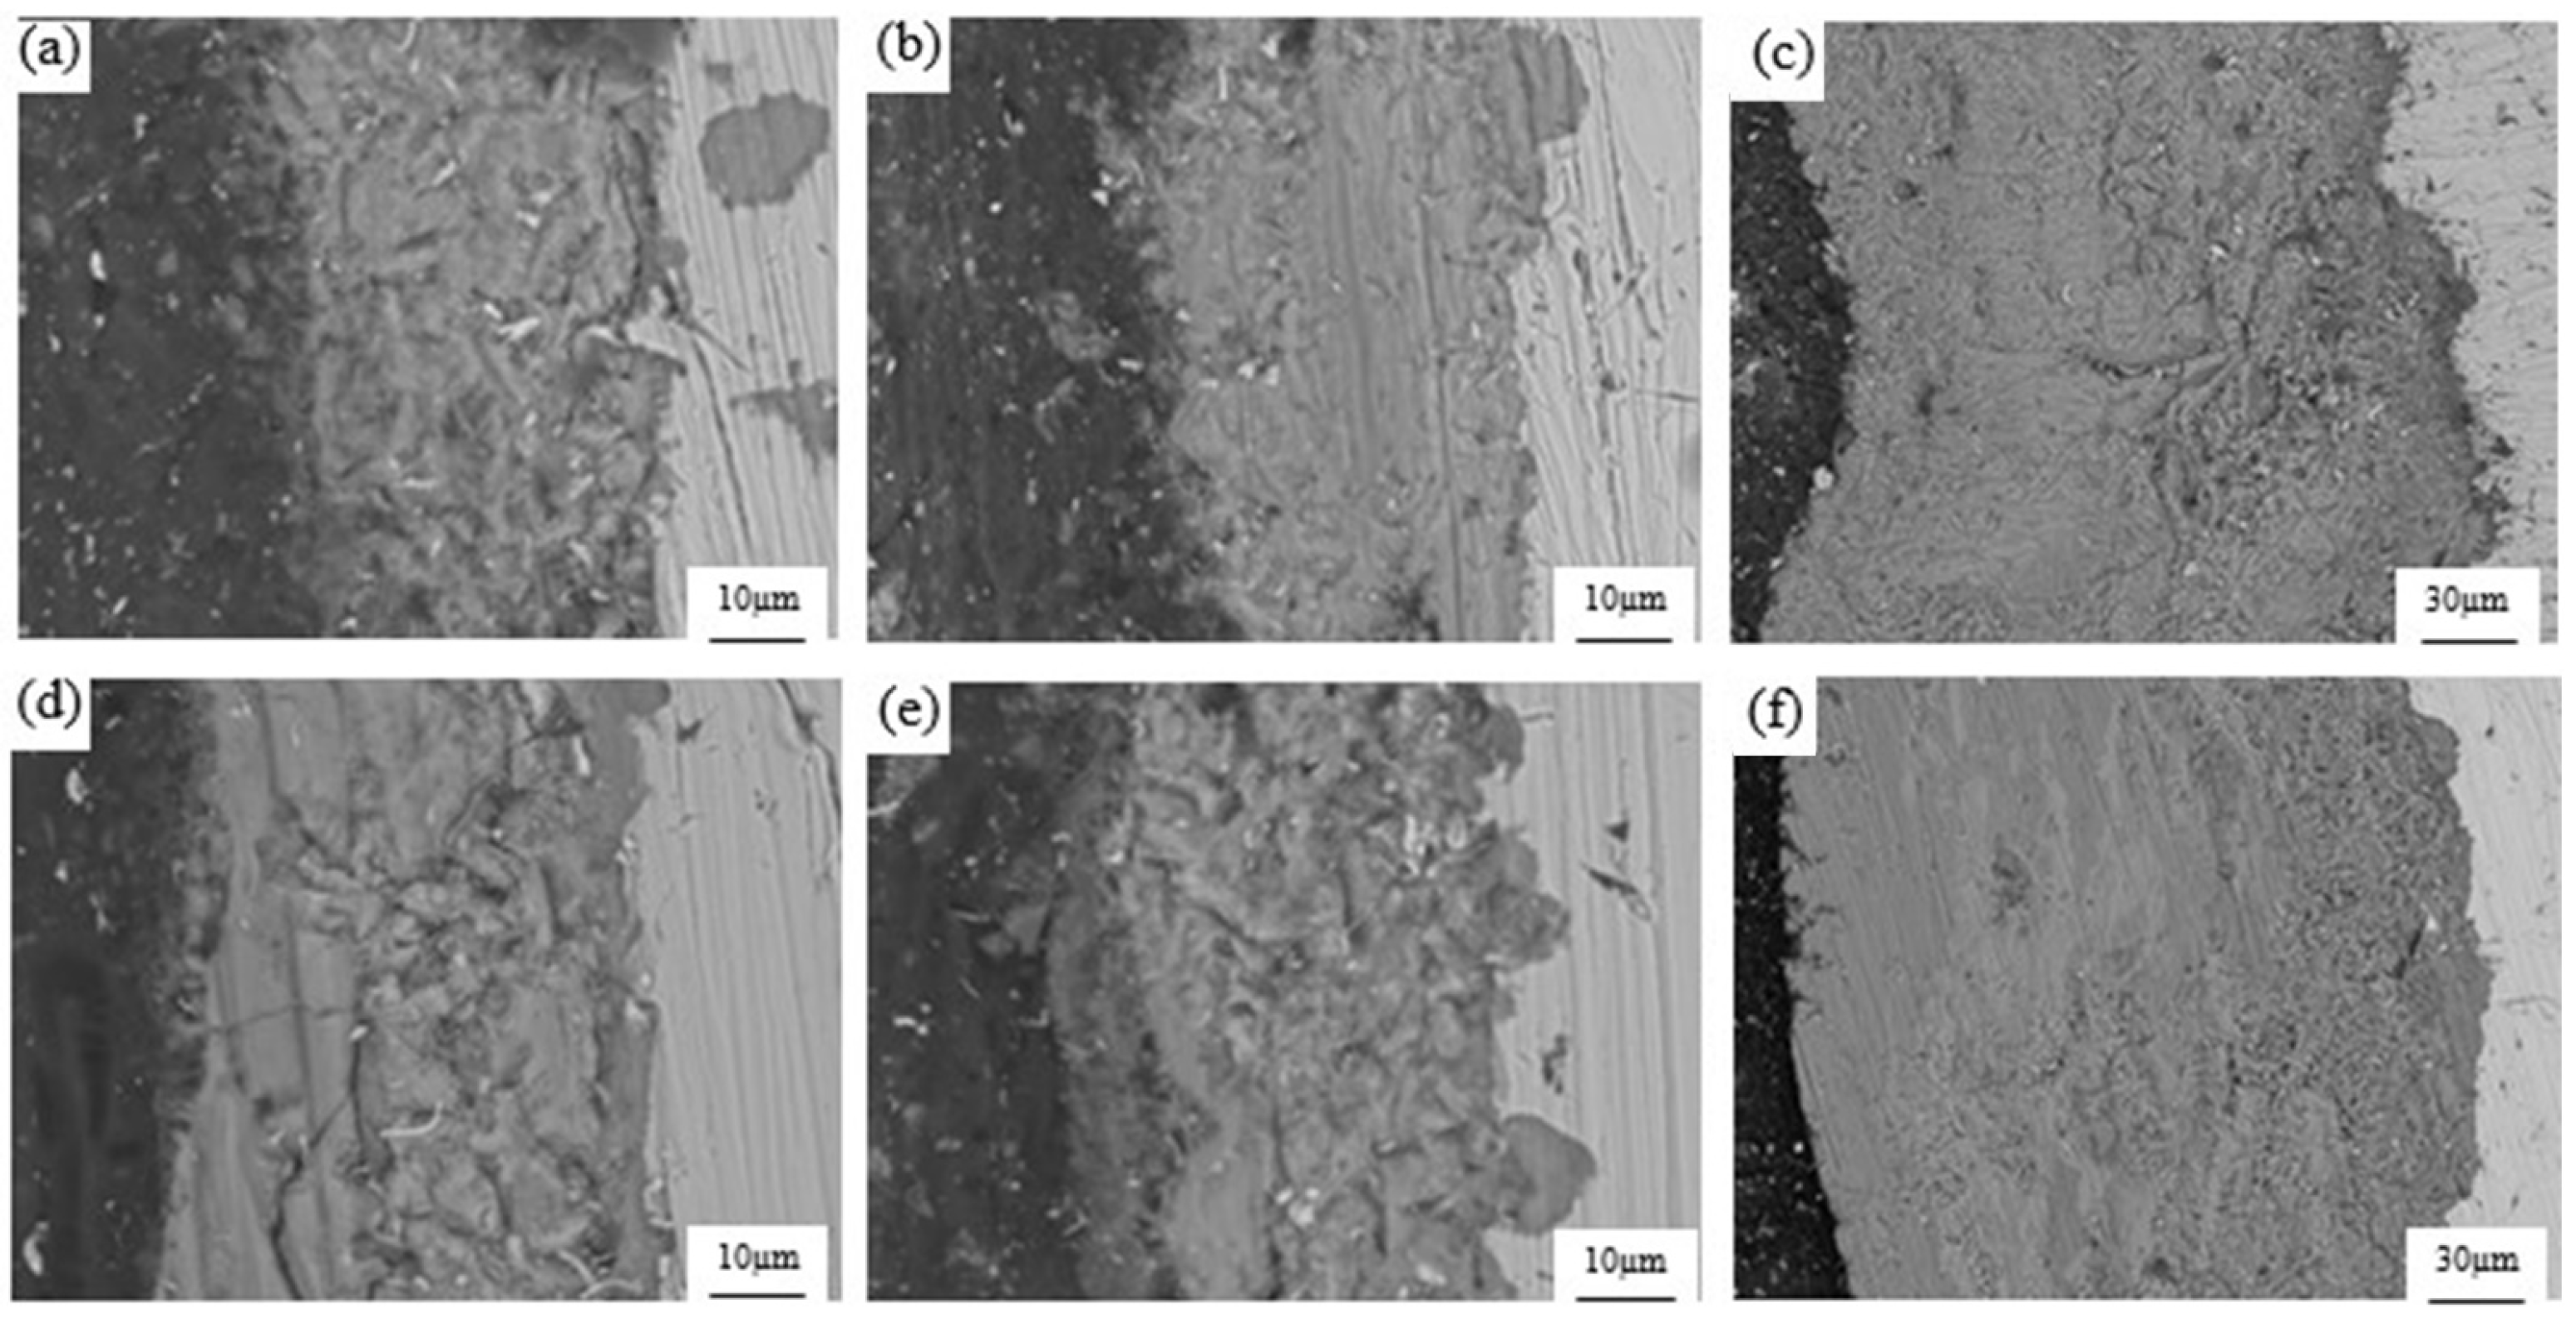
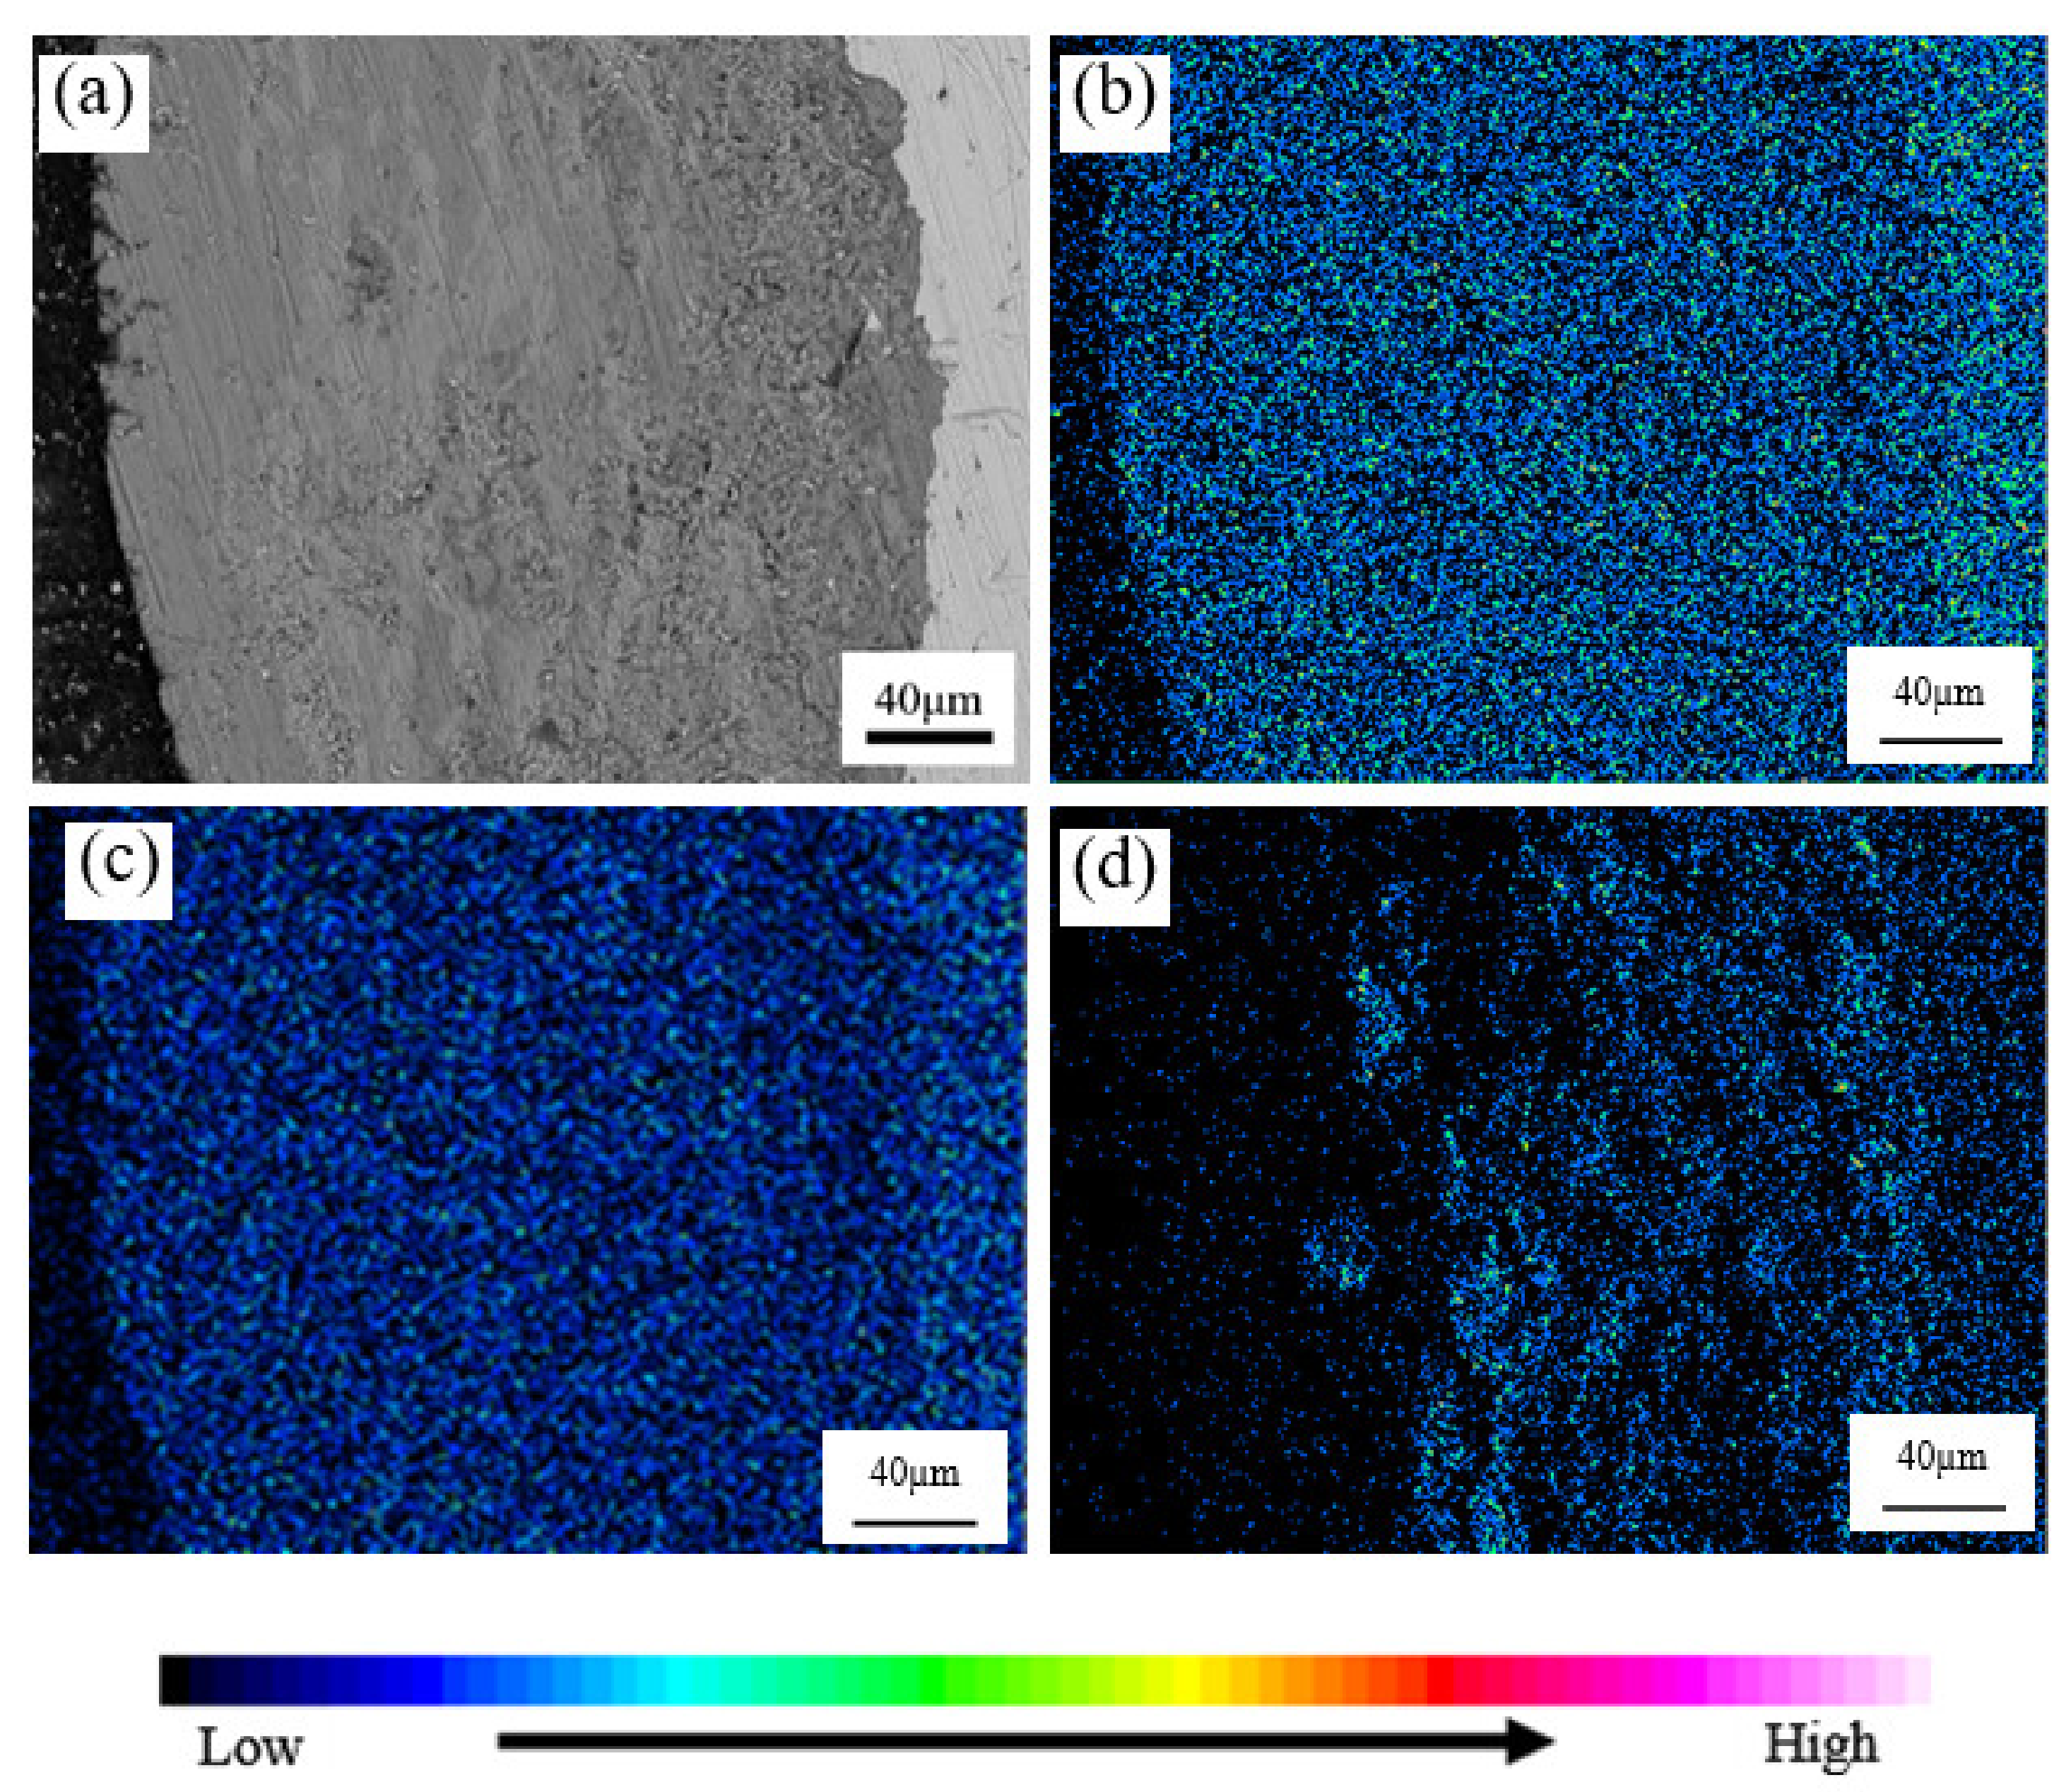
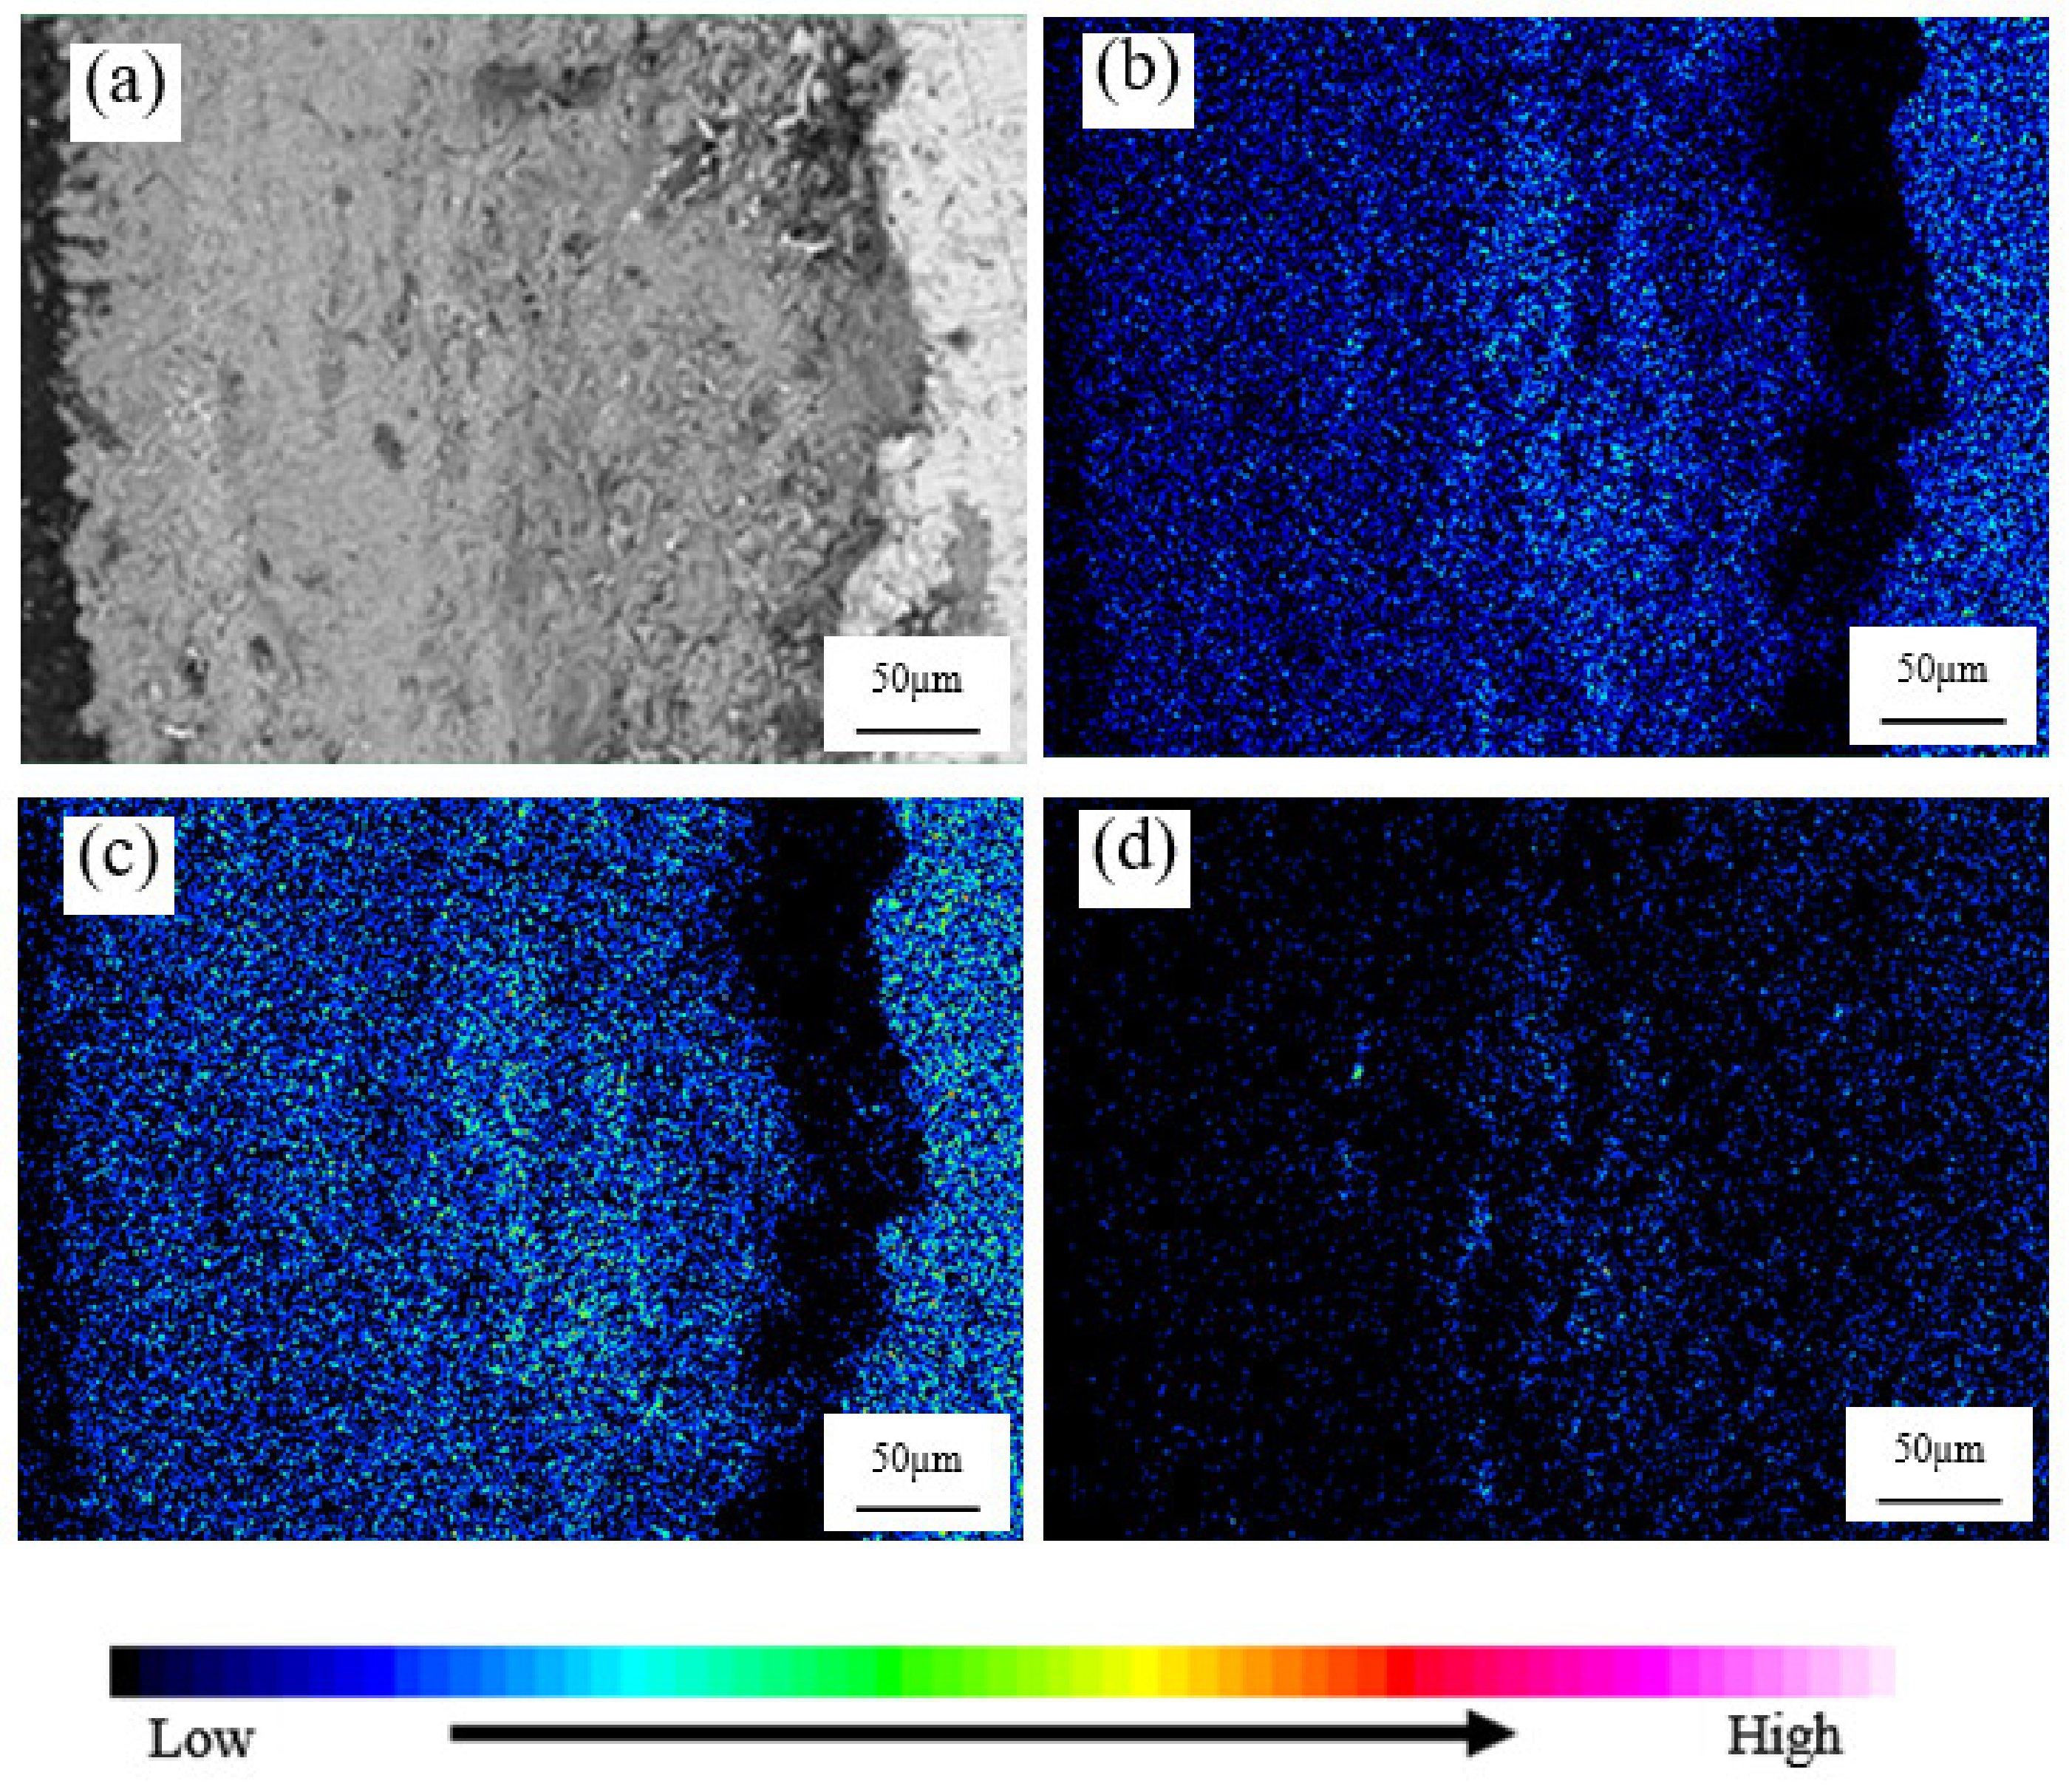
3.4. The Cross-Section Morphology and Chemical Element Distribution of Rust Layer

The cross-section morphology and thickness of rust layer of samples corroded by 60Si2Mn-A and 60Si2Mn-B for 24 h, 72 h, and 360 h were observed by JXA 8530F electron probe. The results are shown in Figure 4 and Table 2. The light-colored part is the metal matrix, the gray part is the rust layer, and the dark part is the Mosaic. It can be seen from Figure 4 that the thickness of the rust layer of the experimental steel increases with the corrosion time, and the structure of the rust layer also changes from loose to dense, especially close to the rust layer on one side of the matrix. At the corrosion time of 360 h, the 60Si2Mn-B cross-section rust layer can be seen to have a relatively obvious boundary in the rust layer, forming the inner rust layer and the outer rust layer. As can be seen from Table 2, with the same corrosion period, the thickness of the 60Si2Mn-A rust layer is greater than that of the 60Si2Mn-B, and with the increase of corrosion time, the thickness difference increases, indicating that the corrosion rate of the 60Si2Mn-B is lower.
The distribution of Cu, Ni, and Cr elements in the cross-sections of the rust layer of 60Si2Mn-A and 60Si2Mn-B for 72 h and 360 h were analyzed. In order to distinguish the rust layer from the matrix, Fe elements were scanned for reference. At the time of 72 h corrosion, due to the small content of Cu and Ni in the 60Si2Mn-A, there was no significant difference between the matrix and the rust layer. The Cu and Ni elements in the 60Si2Mn-B are dispersed in the rust layer. In the experimental steel, Cr element was partially enriched on the side close to the inner rust layer for 72 h after corrosion. As the weight loss rate decreased in the early corrosion stage, the contribution of Cr element was the most obvious. This was mainly because Cr element formed composite oxides with other metals on the steel surface to protect the matrix [26]. As its content increases, it forms α-(Fe1-x, Crx)OOH (Cr-Goethite) in the rust layer. The finer crystals make the rust layer denser, causing the rust layer to open up and the potential to move forward, weakening the corrosion tendency of the material. Moreover, the OXIDE containing Cr has cationic selectivity, which can effectively prevent corrosive media, such as Cl and SO42−, from invading from the outer rust layer to the inner rust layer [27].
The element distribution of rust layer after 360 h corrosion is shown in Figure 5 and Figure 6. The elements Cu and Ni in 60Si2Mn-A are the same as those in 72 h. There is no obvious difference between the matrix and the outer layer. In 60Si2Mn-B, element Cr has obvious bias and is uniformly distributed in the rust layer close to the matrix, and elements Cu and Ni also produce enrichment in the rust layer close to the matrix. In addition to the corrosion resistance mechanism mentioned in chemical element design, Cu can also promote the transformation from γ-FeOOH to the most stable α-FeOOH. According to the surface enrichment theory, Cu enriched in the matrix precipitates from the matrix and forms oxides together with Fe, which increases the impedance of the rust layer, causes anodic passivation, and slows down electrochemical corrosion. The oxide formed can repair the holes and other defects of the rust layer and improve the densification of the rust layer. The thermodynamic stability of element Ni is greater than that of Element Fe, which can improve the electrode potential of matrix and reduce the corrosion tendency. In the process of electrochemical corrosion reaction, Ni ions can also hinder the reaction between corrosive ions and the matrix and reduce the corrosion rate [28]. Therefore, in the late corrosion stage, under the synergetic effect of Cu, Ni, and Cr elements, 60Si2Mn-B has a denser rust layer, which can better prevent the contact between corrosive media and the matrix so as to avoid further corrosion of the matrix.

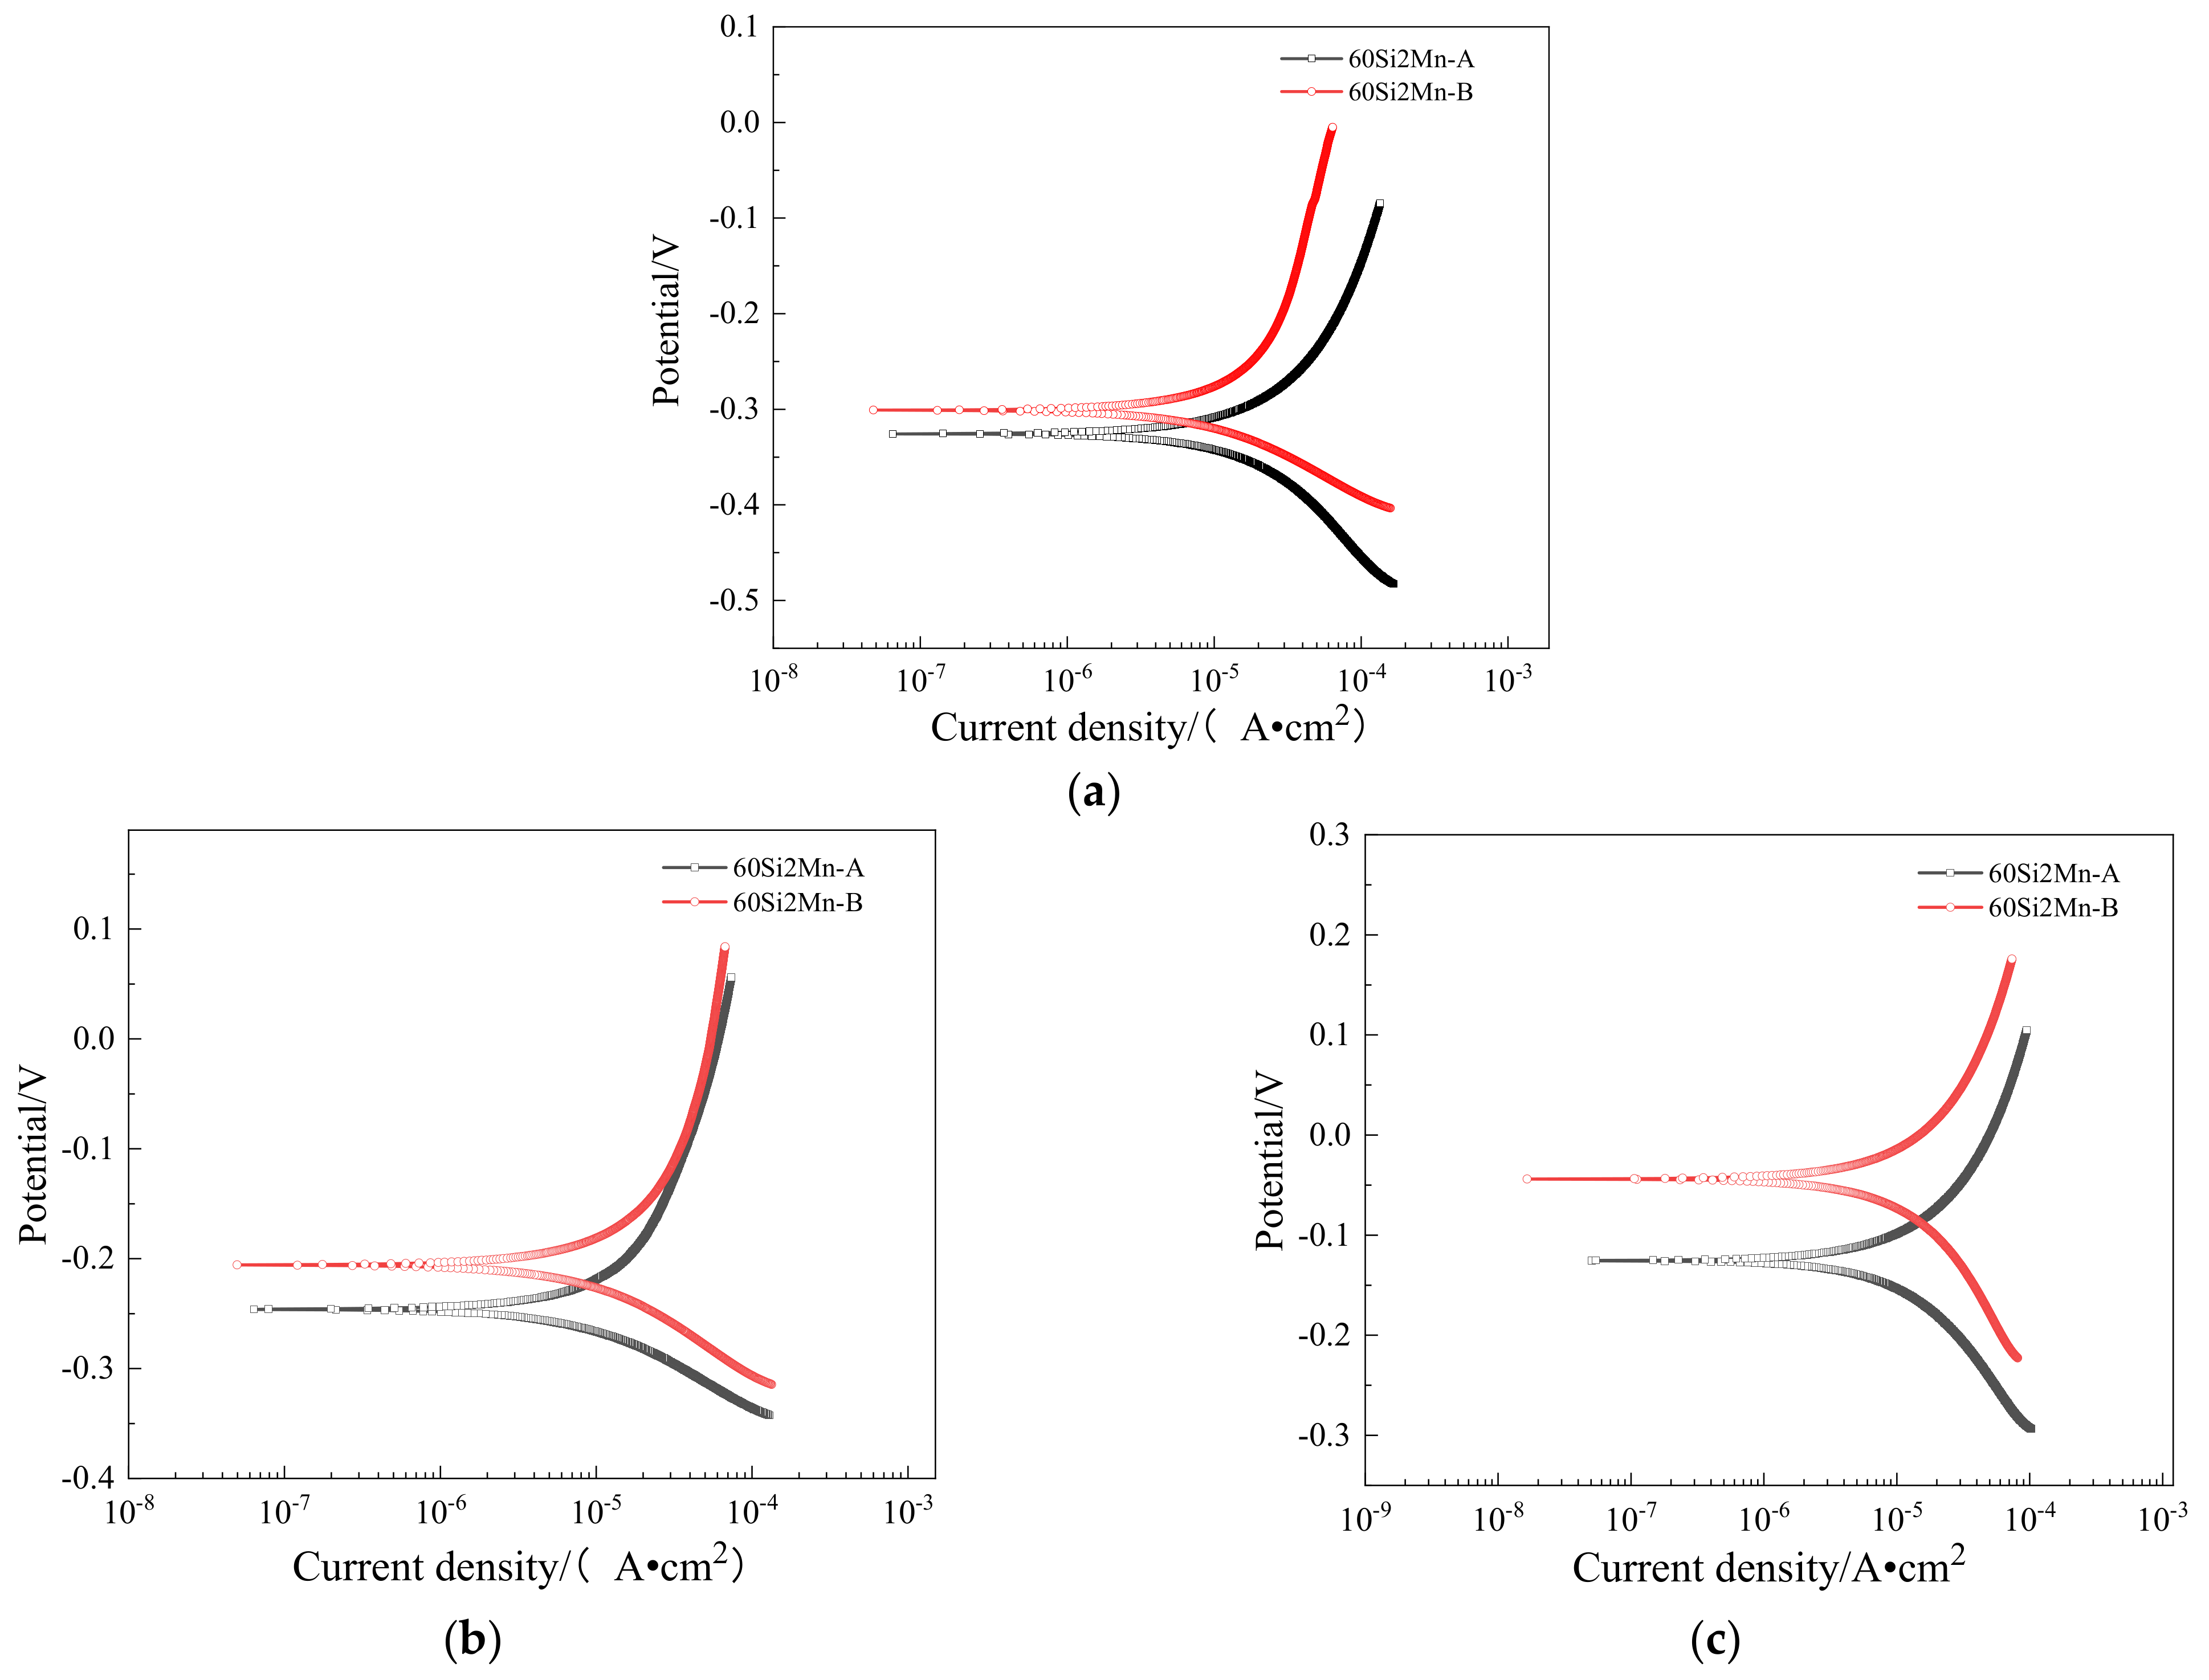
3.5. Polarization Curve of the Sample after Corrosion

Figure 7 shows the polarization curve of 60Si2Mn-B and 60Si2Mn-A samples after various times of the corrosion. The polarization curve represents the relationship between the potential of self-etching electrode and the current density. As can be seen from the figure, the corrosion potential of 60Si2Mn-B is higher than that of 60Si2Mn-A in any period. With the extension of the corrosion period, the corrosion potential of the experimental steel also keeps increasing, which is due to the increase of the thickness of the rust layer and the improvement of the structure, which further hinders the electrochemical corrosion; the resistance to corrosion becomes higher, and the corrosion tendency decreases. In addition, it can be seen from the figure that both polarization curves violate the linear law in the strongly polarized region. The reason is that charge transfer is not the only control step in the electrochemical reaction. When the polarization current density is high, the solution between the reference electrode and the metal electrode will produce a large ohmic potential drop [29].
The polarization curve was fitted using C view software and traditional Tafel method, and the fitting results were shown in Table 3. It can be seen from the table that the range of corrosion potential of the experimental steel is −0.3 V~−0.04 V, and the variation rule is the same as the polarization curve. The corrosion current density at 24 h is on the order of 10−5 A/cm2, and at 360 h, it is on the order of 10−6 A/cm2. The corrosion current decreases with the extension of the corrosion cycle. The corrosion rate of 60Si2Mn-B in the same period is lower than the 60Si2Mn-A, which is consistent with the change rule of weight loss rate. As mentioned in the preceding section, corrosion-resistant elements are enriched in the rust layer on the side near the matrix to form a protective layer between the matrix and the rust layer, which hinders the corrosion electrochemical reaction between the matrix and electrolyte solution, reduces the reaction rate, and then reduces the corrosion current. The corrosion-resistant element also promotes the production of α-FeOOH, which is an insulator and increases the resistance of the rust layer.

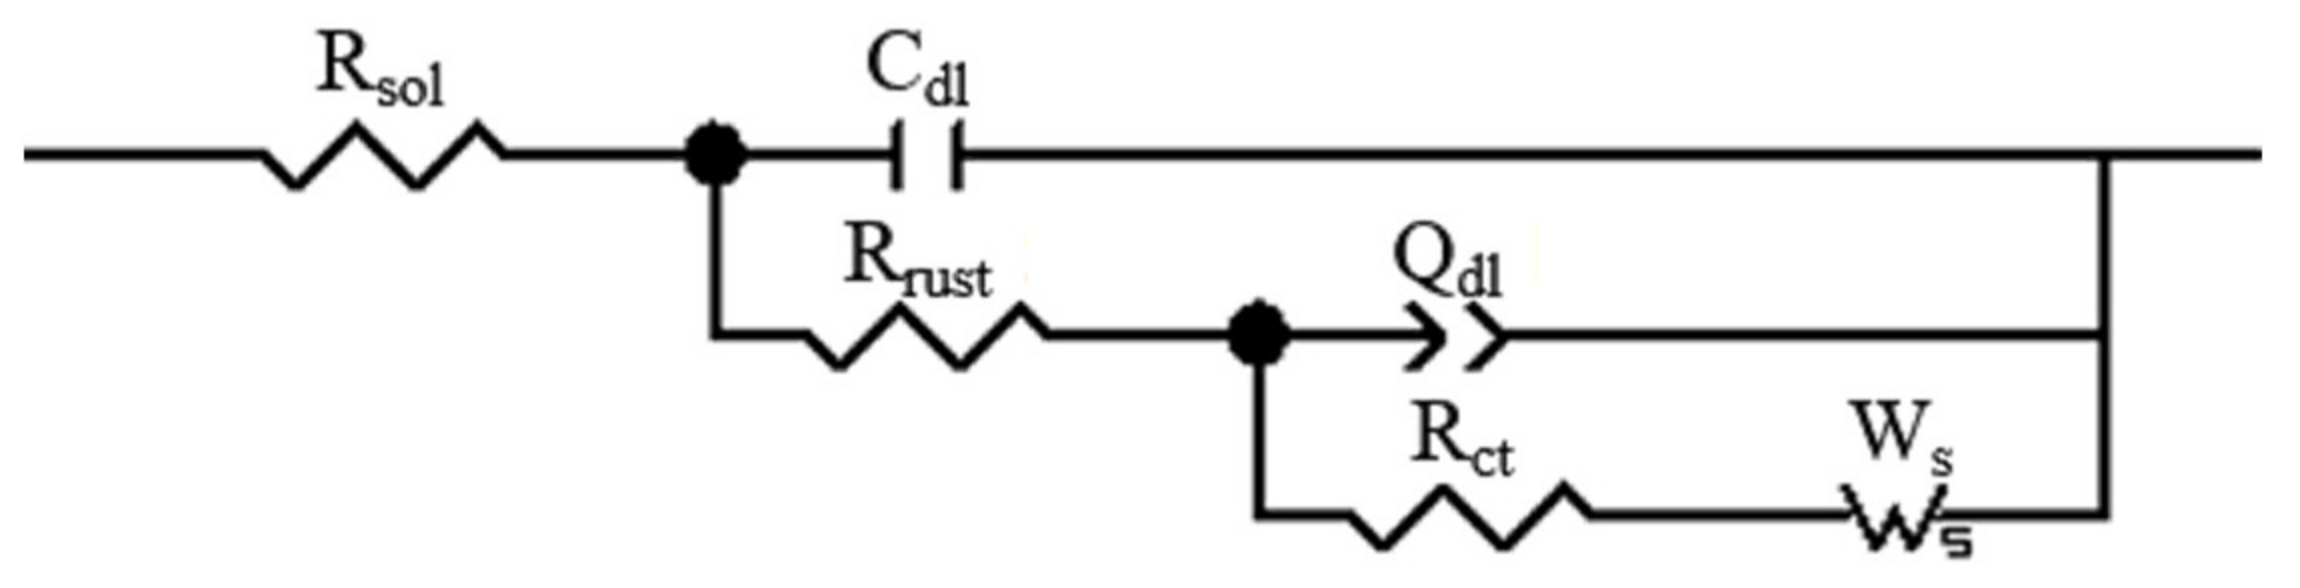
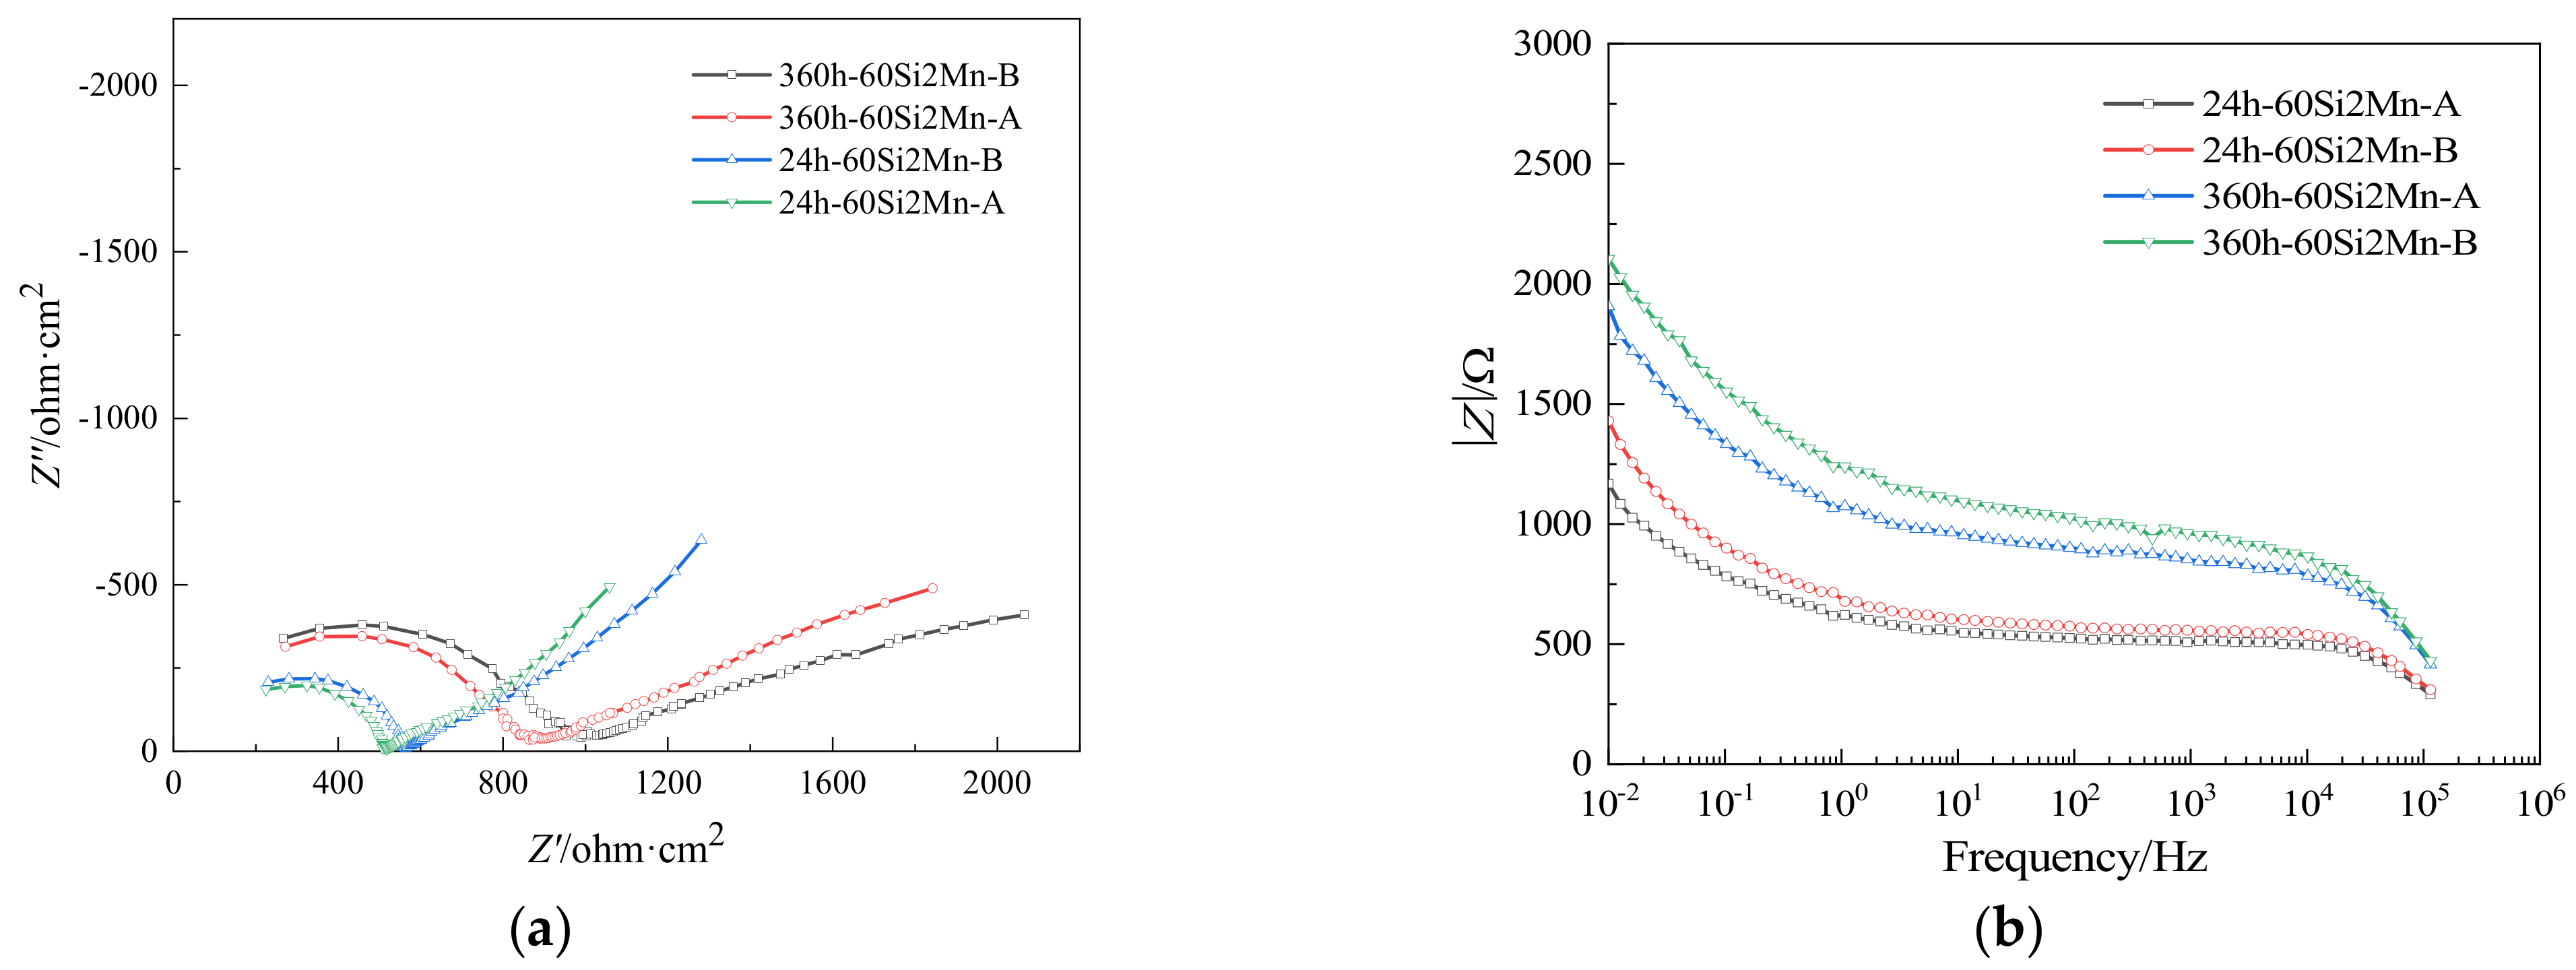
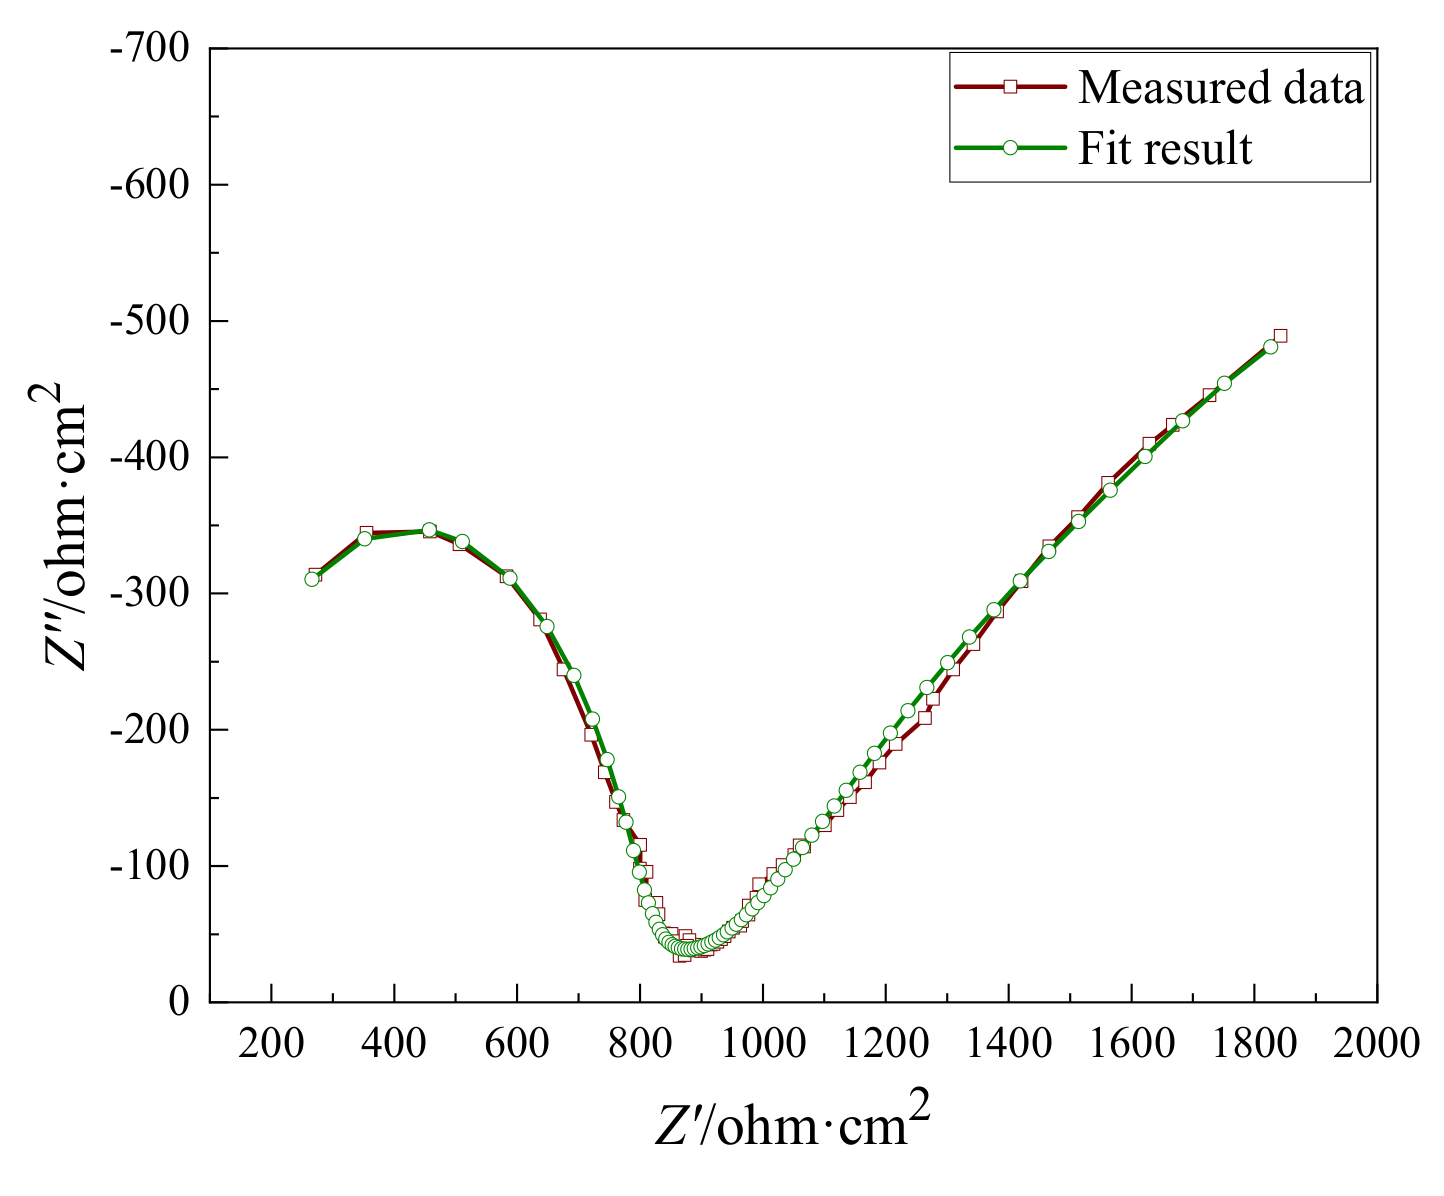
3.6. Ac Impedance Spectroscopy

Figure 8 shows the impedance spectra of the rusty samples with 60Si2Mn-A and 60Si2Mn-B at 24 h and 360 h and the corresponding Bode diagram. The impedance spectra of rusty samples include high-frequency compression capacitive reactance arc and low-frequency diffusion arc. The radius of the capacitive reactance arc reflects the difficulty of charge transfer. In the same period, the radius of 60Si2Mn-B is larger than the 60Si2Mn-A. With the increase of corrosion time, the radius also increases, indicating that 60Si2Mn-B has good corrosion resistance. In its corresponding Bode diagram (a), on the left side of the intersection with the vertical axis is the sum of Faraday resistance, solution resistance, rust resistance, and charge-transfer resistance between layers and solution; the general solution resistance in the same electrolyte solution is under little change, so the intersection-point height can reflect the rust layer resistance between the solution and relative size. It can be seen that 60Si2Mn-B after 360 h of corrosion due to the density of the rust layer has good value maximum.
Z view software and Evans model of rust layer under wet atmosphere corrosion [30] were used to fit the experimental measurement data combined with the equivalent circuit shown in Figure 9. Figure 10 and Table 4 show the fitted curve and measured curve of 60Si2Mn-B after 360 h of corrosion. It can be seen from the figure that the coincidence degree of the two curves is relatively high, and the error between the fitting data and the measured data is relatively small. The equivalent circuit can reasonably explain the electrochemical corrosion phenomenon. Table 5 shows the fitting data of ac impedance spectrum after the corrosion of the experimental steel for 24 h and 360 h. The impedance of the rust layer of the two kinds of steel is greater than 24 h at the corrosion of 360 h. The impedance of 60Si2Mn-B rust layer under the same corrosion period is larger than the 60Si2Mn-A, and the impedance of charge transfer also has the same trend. This is because the 60Si2Mn-B rust layer is relatively dense, and the oxides formed by corrosion-resistant elements in the rust layer are cationic selective, making it more difficult for ions in the reaction to diffuse, increasing the reaction resistance of corrosion electrochemical and increasing the impedance value.

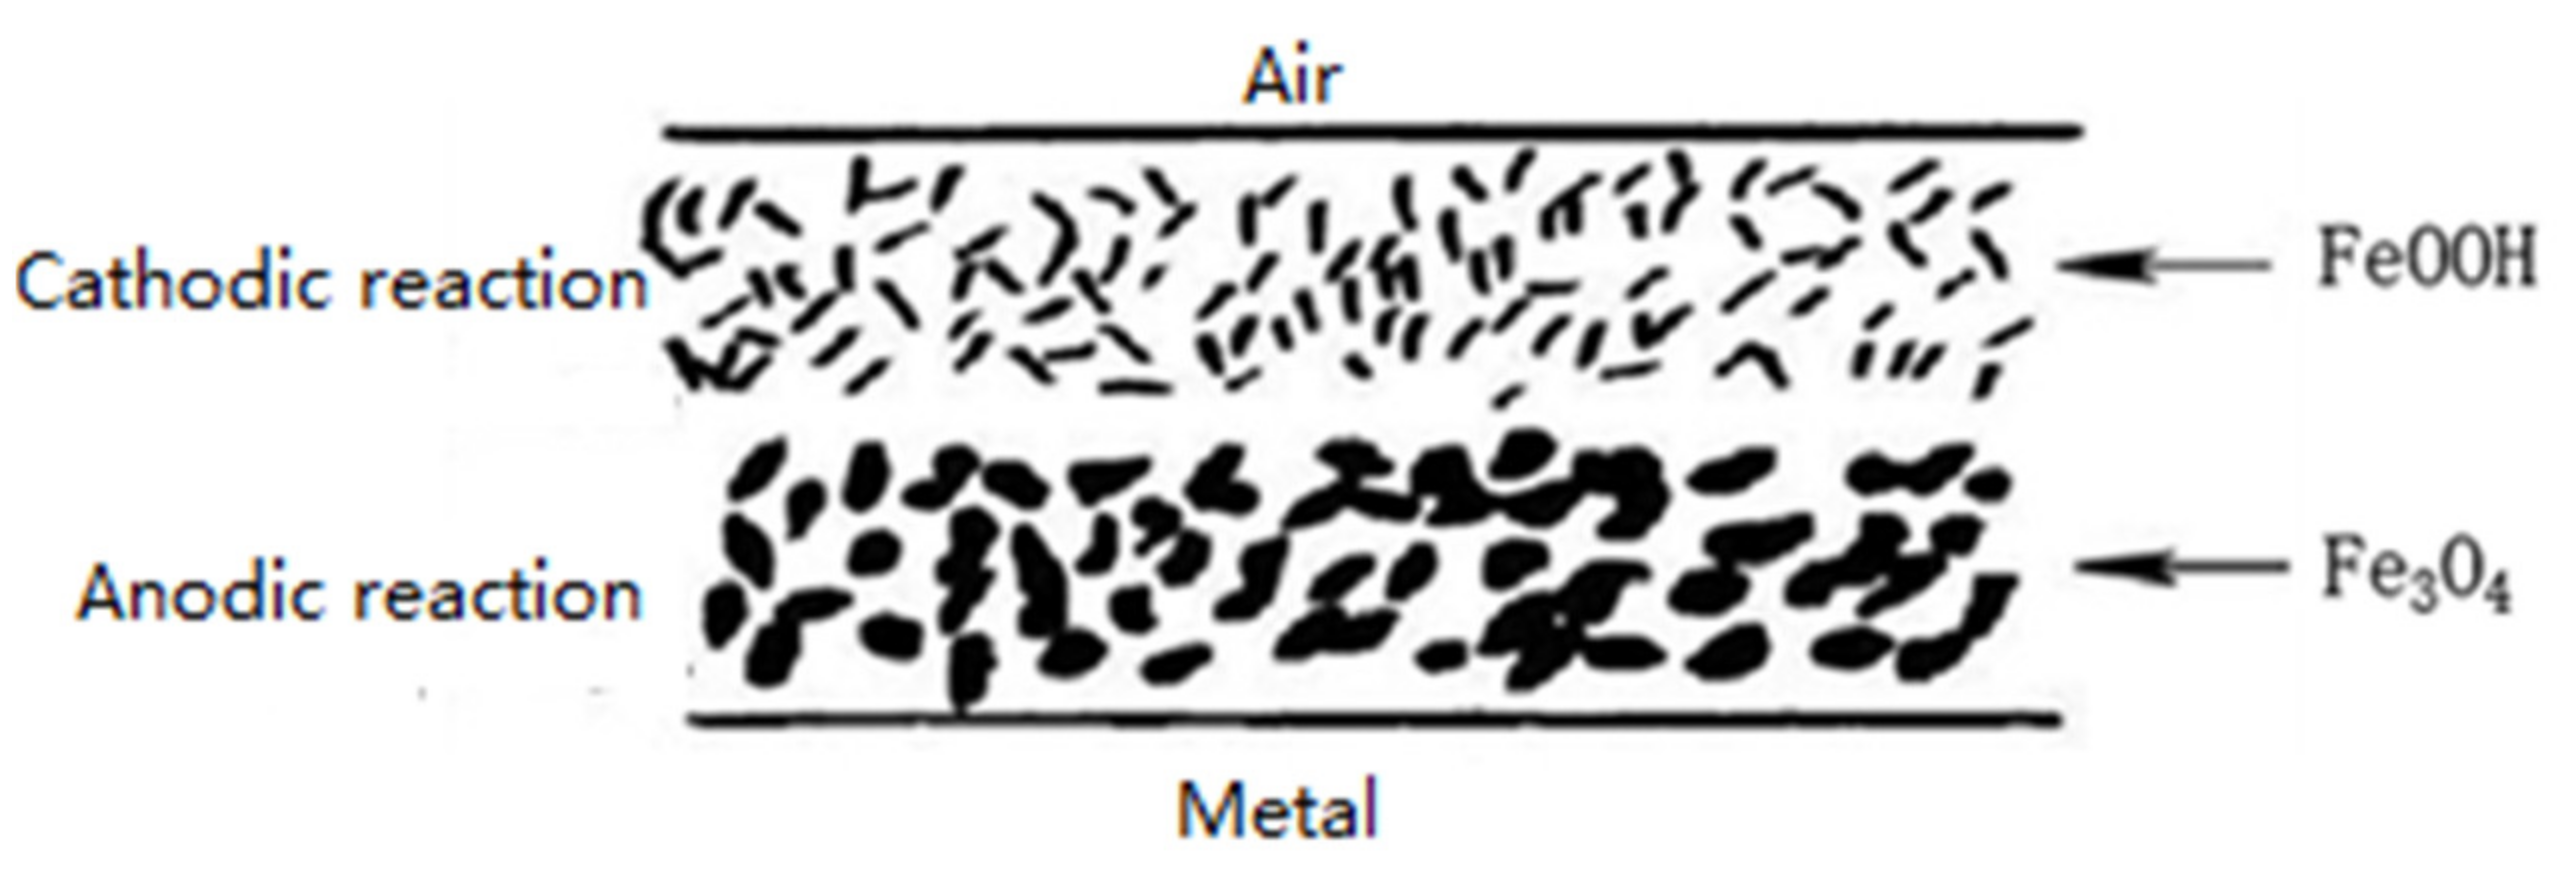
3.7. Corrosion Mechanism

When steel is exposed to the atmosphere, chemical corrosion occurs on the surface of steel under extremely dry air conditions. When the atmospheric relative humidity is high (generally more than 60%), a layer of liquid film is formed on the steel surface due to the adsorption of water, and the corrosion medium is dissolved in the liquid film. The formed electrolyte liquid film creates conditions for the electrochemical corrosion of steel in the atmospheric environment.
Corrosion mechanism of steel in atmospheric environments without a rust layer is as follows:
Cathodic reaction of electrochemical reaction:
O2 + 2H2O + 4e→4OH
Cathodic reaction of electrochemical reaction: in the heavily polluted industrial atmospheric environment, the following reactions occur:
SO2 + O2 + 2e→SO42−
The anodic reaction is:
Fe + nH2O→Fen + ·H2O + ne
The anodic reaction is that FeSO4 in the rust layer will undergo hydrolysis reaction to form FeOOH:
FeSO4 + 2H2O→FeOOH + SO42− + 3H + +e
When the rust layer is formed on the steel surface, the corrosion electrochemical reaction is different from the initial stage of corrosion. Evans [31] proposed the corrosion model of steel in the atmospheric environment, as shown in Figure 11.
The anodic reaction is between matrix Fe and Fe3O4:
Fe→Fe2+ +2e
The cathode reaction is between Fe3O4 and FeOOH:
6FeOOH + 2e→2Fe3O4 + 2H2O + 2OH
The rust layer participates in the cathodic reaction. Fe3+ in the rust layer is reduced to Fe2+, and after the rust layer is dried, the Fe/Fe3O4 interface changes to open circuit, and the oxygen in the air oxidizes Fe2+ in the rust layer to Fe3+:
4Fe3O4 + O2 + 6H2O→6FeOOH
With the extension of corrosion time, the corrosion in the rust layer in the later stage of corrosion α- FeOOH can effectively improve the density of the rust layer, and the isolation effect of the rust layer on the corrosive medium in water and atmosphere becomes stronger and stronger, thus reducing the area where the corrosion reaction can occur. At the same time, due to the thickening of the rust layer and the accumulation of corrosion-resistant elements in the rust layer near the substrate, the impedance value of the whole corrosion electrochemical-reaction system increases, and corrosion electrochemical reaction becomes more and more difficult. The role of corrosion-resistant elements Cu, Cr, and Ni is mainly to improve the electrode potential of the matrix and accelerate the corrosion resistance. The formation of α-FeOOH makes the rust layer cation selective, thus reducing the rate of corrosion reaction.

4. Conclusions

The corrosion behavior of 60Si2Mn-B in an industrial atmospheric environment was studied, and the following conclusions were obtained:
  • The corrosion weight loss rate of 60Si2Mn-B is lower than that of 60Si2Mn-A in the same corrosion period. The phase of corrosion rust layer is Fe3O4 and γ-FeOOH in the early stage but changes to α-FeOOH and γ-FeOOH in the late stage. The size of corrosion rust layer of 60Si2Mn-B is smaller than that of 60Si2Mn-A. In the early corrosion stage, Cr elements are biased to the corrosion-resistant rust layer of 60Si2Mn-A and 60Si2Mn-B, while in the late corrosion-resistant rust layer of 60Si2Mn-B, Cu, Ni, and Cr are biased to the rust layer close to the matrix. The addition of corrosion-resistant elements does not change the phase type of the rust layer, but it can refine the size of the corrosion rust layer, which plays a crucial role in the formation of dense rust layer in the late corrosion stage.
  • With the extension of the corrosion period, the corrosion potential increased and the corrosion current density decreased. In the same corrosion cycle, corrosion resistance of 60Si2Mn-B corrosion potential >60Si2Mn-A, and corrosion resistance of 60Si2Mn-B corrosion current <60Si2Mn-A. The electrochemical corrosion of rust samples is affected by the diffusion of reactants. According to the ac impedance data at the equivalent circuit fitting point, the impedance of rust layer increases with the extension of corrosion time. For the same corrosion period, the impedance of rust layer with corrosion resistance of 60Si2Mn-B is higher. The addition of corrosion-resistant alloy elements increases the impedance of rust layer.

Author Contributions

Conceptualization, J.L. and Z.Z.; methodology, H.W.; validation, S.L.; formal analysis, L.D.; investigation, H.C.; data curation, L.S.; writing—original draft preparation, Z.Z. and J.L.; writing—review and editing, J.L. and X.G.; project administration, X.G.; funding acquisition, H.C. All authors have read and agreed to the published version of the manuscript.

Funding

This work was supported by National High Technology Research and Development Program of China (Grant No. 2015AA03A501).

Conflicts of Interest

The authors declare no conflict of interest.

References

  1. Xie, Y.; Kou, J.; Jiang, M.; Yu, H. Development and technical prospect of China railway. High. Speed Railw. Technol. 2020, 11, 11–16. [Google Scholar]
  2. Chen, L. Development of seamless line paver set in high-speed railway at home and abroad. Constr. Mech. 2005, 8, 10–13. [Google Scholar]
  3. Du, S.; Wang, K.; Hu, F. Overview and prospect of axle technology for high speed trains at home and abroad. Mater. China 2019, 38, 641–650. [Google Scholar]
  4. Zhang, X. Study on Coparison of High-Speed Railway Metal Pieces of Fastener Anti-Corrosion Technology; Southwest Jiaotong University: Chengdu, China, 2017. [Google Scholar]
  5. Li, T.T.; Bai, Y.H.; Liu, Z.R.; Liu, J.F.; Zhang, G.S.; Li, J.L. Air quality in passenger cars of the ground railway transit system in Beijing, China. Sci. Total Environ. 2006, 367, 89–95. [Google Scholar] [CrossRef] [PubMed]
  6. Zhang, J. Reasons for fatigue fracture of ω-shaped spring rod for a railway. Mater. Mech. Eng. 2014, 38, 96–98. [Google Scholar] [CrossRef]
  7. Wang, Y.; Cui, D. Fracture analysis of spring in fatigue test. Phys. Test. Chem. Anal. Part A Phys. Test. 2012, 48, 68–70. [Google Scholar]
  8. Zhang, Y.; Wu, L.; Wang, Z.; Xu, Z. Corrosion fatigue cracking research of rail fastenings. J. Jianghan Univ. Nat. Sci. Ed. 2014, 42, 57–62. [Google Scholar]
  9. Yu, Z.-r.; Yuan, Y.; Zhang, Y.-q.; Shi, J. Fatigue properties of elastic bars of fastenting systems installed with high-speed railways. J. China Railw. Soc. 2014, 36, 90–95. [Google Scholar]
  10. Wang, W.; Wang, Z.; Zhao, L.; Cai, Z.; Zhu, M. Failure analysis of SKl15 spring fasteners for high-speed railway. Heat Treat. Met. 2013, 38, 108–112. [Google Scholar]
  11. Xu, D.; Yin, Z. High strengthening spring steels and effect of alloying elements. Heat Treat. Met. 2003, 28, 30–36. [Google Scholar]
  12. Xu, D.; Yin, Z. Effect of heat treatment process on structure and properties of spring steel. Spec. Steel 2003, 24, 1–4. [Google Scholar]
  13. Xu, Q.; Hui, W.; Long, J.; Liang, M.; Chen, H. Effect of tempering temperature on high-cycle fatigue properties of 60Si2MnA spring steel. Heat Treat. Met. 2012, 37, 8–12. [Google Scholar]
  14. Yu, B.; Liu, B.; Jing, Q. Effect of hardening temperature on propagation rate of fatigue crack of steel 60Si2Mn and steel GCr15. Spec. Steel 2001, 22, 20–21. [Google Scholar]
  15. Xu, L.; Chen, L.; Chen, G.; Ma, X. Oxidation decarburization characteristics and fatigue properties of 65Si2MnW spring steel. Heat Treat. Met. 2018, 43, 83–89. [Google Scholar]
  16. Misawa, T.; Asami, K.; Hashimoto, K.; Shimodaira, S. The mechanism of atmospheric rusting and the protective amorphous rust on low alloy steel. Corros. Sci. 1974, 14, 279–289. [Google Scholar] [CrossRef]
  17. Das, S.; Talukdar, S.; Solanki, V.; Kumar, A.; Mukhopadhyay, G. Breakage of Spring Steel During Manufacturing: A Metallurgical Investigation. J. Fail. Anal. Prev. 2020, 20, 1462–1469. [Google Scholar] [CrossRef]
  18. Uchiyama, M.; Kamishohara, K.; Seki, F. Relationship between Slack-Quenched Structure and Mechanical Properties of Spring Steel. Tetsu-to-Hagané Overseas 1962, 2, 9–17. [Google Scholar] [CrossRef]
  19. Kumar, S.R.; Sreearravind, M.; Sainathan, S.; Venkat, A.; Rahulram, S. Low Cycle Fatigue behavior of heat treated EN-47 Spring Steel. Mater. Today Proc. 2020, 22, 2191–2198. [Google Scholar] [CrossRef]
  20. Królicka, A.; Radwański, K.; Ambroziak, A.; Zak, A. Analysis of grain growth and morphology of bainite in medium-carbon spring steel. Mater. Sci. Eng. A 2019, 768, 138446. [Google Scholar] [CrossRef]
  21. Sun, W.; Zhang, W.; Zhang, H.; Hu, X.; Du, H. Study on control of continuous cooling structure of 60Si2Mn spring steel. China Meas. Test 2020, 46, 137–142. [Google Scholar]
  22. Yang, J.; Li, Y.; Zhang, L.; Wang, X.; Wang, E. A study on the effect of second tempering process on the microstructure and properties of 51CrV4 spring steel. Jiangxi Metall. 2020, 40, 18–21. [Google Scholar]
  23. Gao, W. Study on heat treatment process of high strength spring steel. Sci. Technol. Vis. 2020, 1, 152–155. [Google Scholar]
  24. Yang, D. Study on phase change law of 50CrVA spring steel. Mech. Eng. 2019, 3, 101–102. [Google Scholar]
  25. Ishikawa, T.; Takeuchi, K.; Kandori, K.; Nakayama, T. Transformation of γ-FeOOH to α-FeOOH in acidic solutions containing metal ions. Colloids Surf. A Physicochem. Eng. Asp. 2005, 266, 155–159. [Google Scholar] [CrossRef]
  26. Qian, Y.; Niu, D.; Xu, J.; Li, M. The influence of chromium content on the electrochemical behavior of weathering steels. Corros. Sci. 2013, 71, 72–77. [Google Scholar] [CrossRef]
  27. Cui, W.F.; Shao, C.J.; Liu, C.M. Corrosion behavior of new weathering steel in the environment simulating coastal industrial atmosphere. Adv. Mater. Res. 2012, 479, 322–326. [Google Scholar] [CrossRef]
  28. Yamashita, M.; Miyuki, H.; Matsuda, Y.; Nagano, H.; Misawa, T. The long term growth of the protective rust layer formed on weathering steel by atmospheric corrosion during a quarter of a century. Corros. Sci. 1994, 36, 283–299. [Google Scholar] [CrossRef]
  29. Jin, K. Research on Detection Method and Application of Metal Corrosion Strong Polarization; Chongqing University: Chongqing, China, 2018. [Google Scholar]
  30. Evans, U.R. Dry oxidation and wet corrosion. Nature 1951, 168, 853–855. [Google Scholar] [CrossRef]
  31. Lin, Y.; Yang, D. Corrosion and Corrosion Control Principles; China Petrochemical Press: Beijing, China, 2014; pp. 28–31. [Google Scholar]
Figure 1. Curves of corrosion miss-loss rate of tested steels as a function of cycling time.
Applsci 11 08668 g001
Figure 2. X-ray analysis of corrosion products of experimental steel after different corrosion time: (a) 24 h; (b) 72 h; and (c) 360 h.
Applsci 11 08668 g002
Figure 3. Micromorphology of rust layer of experimental steel after corrosion for different time: (ac) 60Si2Mn-A after corrosion for 24 h, 72 h, and 360 h; (df) corrosion resistant 60Si2Mn-B after corrosion for 24 h, 72 h, and 360 h.
Applsci 11 08668 g003
Figure 4. Section micromorphology of rust layer of experimental steel after corrosion for different time: (ac) common 60Si2Mn-B after corrosion for 24 h, 72 h, and 360 h; (df) 60Si2Mn-A after corrosion for 24 h, 72 h, and 360 h.
Applsci 11 08668 g004
Figure 5. Cross-section morphology and element mapping distribution of rust layer section of 60Si2Mn-A sample in the period of 360 h: (a) cross-section of rust layer; (bd) element-mapping distribution of Cu, Ni, and Cr.
Applsci 11 08668 g005
Figure 6. Chemical analysis of rust section of 60Si2Mn-B sample in the period of 360 h: (a) cross-section of rust layer; (b) Cu, (c) Ni, and (d) Cr.
Applsci 11 08668 g006
Figure 7. Polarization curves of experimental steels with different corrosion cycles: (a) 24 h, (b) 72 h, and (c) 360 h.
Applsci 11 08668 g007
Figure 8. The Nyquist curve and Bode curve of the rusty samples at different corrosion time: (a) Nyquist plots; (b) Bode plots.
Applsci 11 08668 g008
Figure 9. Equivalent circuit of the rusty samples in 0.01 mol/L NaHSO3.
Applsci 11 08668 g009
Figure 10. Fitting curve for the equivalent circuit of 60Si2Mn-B of the rusty sample.
Applsci 11 08668 g010
Figure 11. Corrosion process.
Applsci 11 08668 g011
Table 1. Chemical composition of experimental steels (mass %).
SampleCMnSiPSNiCrCuFe
60Si2Mn-A0.5570.8121.5420.0130.003-0.265-Bal.
60Si2Mn-B0.560.771.670.0160.0040.2–0.40.3–0.40.2–0.4Bal.
Table 2. Thickness of rust layer of experimental steel after corrosion for different time.
Corrosion Time24 h72 h360 h
Rust layer thickness60Si2Mn-A26 μm63 μm290 μm
60Si2Mn-B22 μm48 μm232 μm
Difference in rust thickness4 μm15 μm58 μm
Table 3. Values of parameters fitted from polarization curves of steels.
Corrosion Time/hSteelCorrosion Current/(A/cm2)Corrosion Potential/VCorrosion Rate/(mm/a)
24 h60Si2Mn-B1.6571 × 10−5−0.33910.19367
60Si2Mn-A1.3934 × 10−5−0.300910.16285
72 h60Si2Mn-B1.0056 × 10−5−0.246080.13839
60Si2Mn-A9.8076 × 10−6−0.205740.11462
360 h60Si2Mn-B7.5821 × 10−6−0.125570.088613
60Si2Mn-A5.3492 × 10−6−0.043820.062518
Table 4. Values of the equivalent circuit fitting data of 60Si2Mn-B, the rusty sample.
ElementValueError/%
Rsol1318.82
Cdl3.925 × 10−96.77
Rrust710.35.18
Qdl0.0011511.55
Rct1859.68
Ws3.862 × 10−44.84
Table 5. Values of EIS fitting data of experimental steel with rust.
Corrosion Time/hSteelRsol/(Ω·cm2)Rrust/(Ω·cm2)Rct/(Ω·cm2)
24 h60Si2Mn-B114.2449.1107.1
60Si2Mn-A117.5399.692.1
360 h60Si2Mn-B120.9826.7292.1
60Si2Mn-A131.1710.3185.1
Publisher’s Note: MDPI stays neutral with regard to jurisdictional claims in published maps and institutional affiliations.

