1. Introduction
Due to its simpler structure and lower manufacture/service cost, Macpherson suspension with the functions of vibration isolation and steering has been widely used in light mining trucks [
1,
2,
3,
4,
5,
6]. The steering arm is a key component in the steering mechanism integrated with Macpherson suspension, and its strength is very important for the security and reliability of the trucks. However, recently it has been frequently fractured in a kind of mining truck, which seriously threatened the driver’s security and caused the damage to property.
Generally, a complete design process for a steering arm or other similar parts is as follows [
7,
8,
9,
10,
11,
12]. First, a full vehicle model, also called a virtual prototype model, is established based on multi-body dynamical software such as Adams, RecurDyn, SIMPACK, and so on. Second, forces on the steering arm are obtained under different roads and manipulation conditions, according to the established model. Third, the forces, particularly those under extreme conditions, will be used to optimize the geometry or shape of the steering arm considering the motion interference by using a professional finite element analysis (FEA) software, such as ANSYS and ABAQUS.
This digitized method, which shortens the design cycle and reduces the design cost, has been widely used, compared with the traditional method based on experiments. Surely, the full vehicle model should be comprehensively verified by experiments. However, it is not easy to accurately determine all parts’ characteristics, particularly those of the tires and roads in surface mining, although the 3D geometric model of a mining truck can be established according to its engineering drawings. For example, when selected as a tire model in the Adams environment, PAC 2002 has up to 200 parameters that should be determined for a dynamic simulation [
13,
14,
15]. For a tire that has not been completely measured by experiments, it is hardly possible to obtain these parameters, which causes a large difficulty in the dynamic simulation. In addition, determining the dynamical parameters of the full vehicle model and verifying its simulation results may spend much time on experiments, which reduces the efficiency of a new replacement part to some extent. Due to the complex characteristics of key parts, road surfaces, and tires, there are many design methods for the strength design, fatigue test, and life prediction of the steering arm according to the theoretical forces or accelerations [
16,
17,
18,
19]. In general, these methods did not consider the features of the vehicle, arrangement of each structure, and the assembly which may cause kinematic interference, and then the obtained results are often limited. In fact, the complete design method is beneficial to a company in the long run, but a fast and effective design will be the engineers’ emphasis in the short term for the problem that only a few parts are broken in the vehicles. In this current stage, it is urgent to present a fast calculation method which can partly consider the characteristics of the road and tire for improving the steering arm.
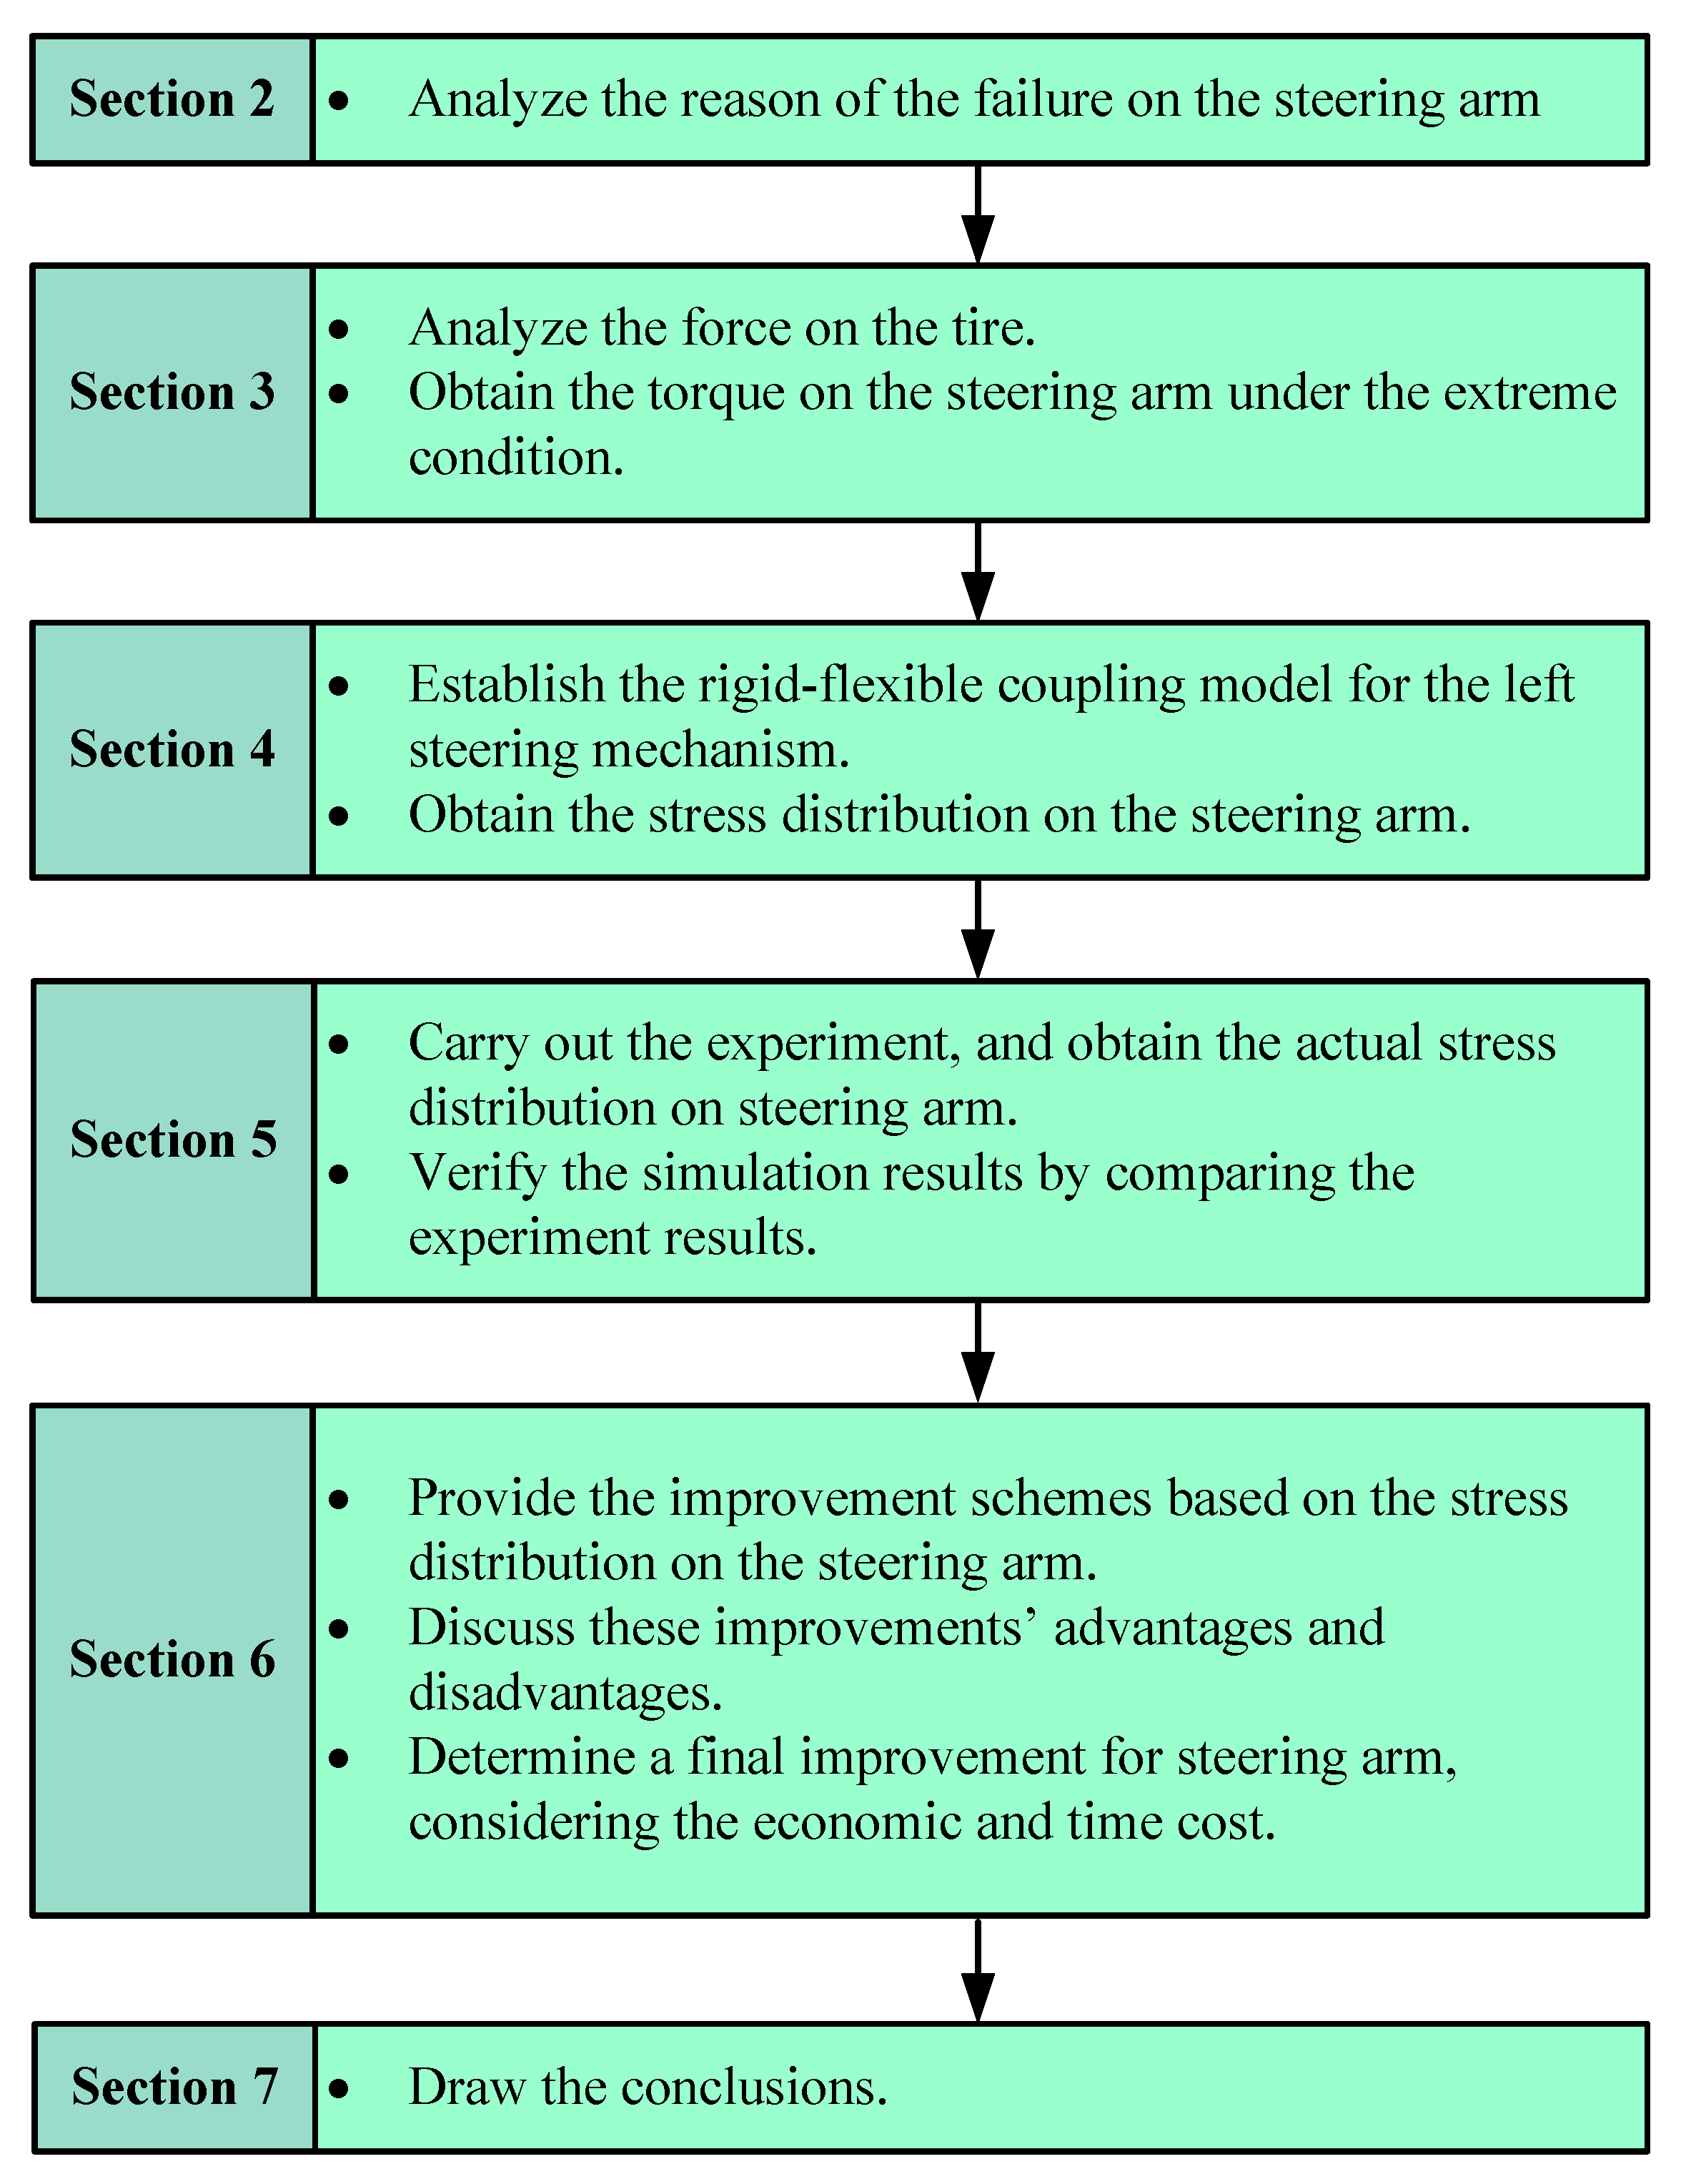
Therefore, a fast calculation method for improving the steering arm of mining trucks with Macpherson suspension is proposed in this paper. This method can avoid establishing a full vehicle model and only analyse the left steering mechanism, increasing the efficiency of improving the steering arm. In this method, after the force analysis on the tire, the torque on the steering arm is calculated by using the empirical values of the rolling resistance coefficient and friction coefficient allowed to be limited in the two ranges; the rigid–flexible coupling model for the left steering mechanism in ANSYS environment is established and solved to obtain the distribution stress on the steering arm under extreme conditions. Then, the stress test is carried out to verify the reliability of the simulation results based on the fast method. Finally, an improvement scheme with a low economic and time cost is presented, and its effectiveness is demonstrated by the users’ feedback after it was run for a period of time. Additionally, this paper’s framework is shown in
Figure 1.
2. Failure Analysis of the Steering Arm
2.1. Steering Arm
Figure 2 shows the installation and geometry of the steering arm in the Macpherson suspension system, which includes many parts, such as the A-type frame, hydro-pneumatic strut, tie rod, tire, and so on. The steering arm, whose role is to transmit steering torque, is a key part in the Macpherson suspension system integrated into the steering mechanism. The king-pin axis is just the axis of the hydro-pneumatic strut in the Macpherson suspension [
20,
21]. Steering torque is generated by the force from the steering cylinder around the king-pin axis. On the contrary, torque—generated by the forces from the road around the king-pin axis—will act on the steering arm when the truck drives on the road.
2.2. Failure Analysis
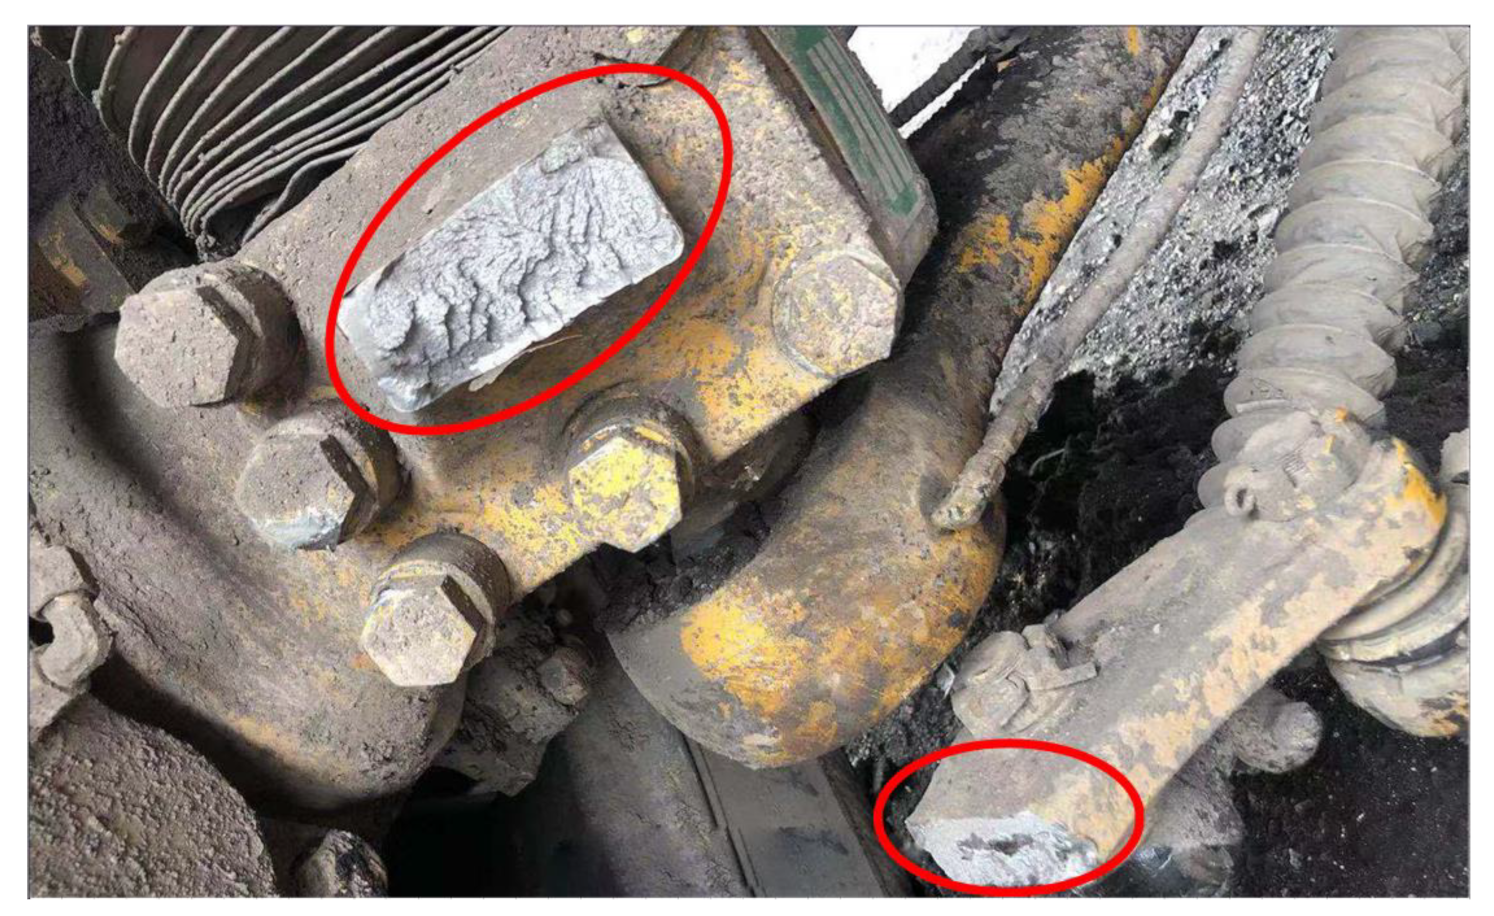
The fractured steering arm is shown in
Figure 3. In a kind of mining truck, its steering arm is broken frequently, particularly when it drives through a high obstacle according to the drivers’ feedback. It is observed that, unlike fatigue failure, the fracture area without an evident crack propagation happened abruptly. In addition, the fracture area has certain plastic deformation. On the one hand, according to the characteristics of the fracture, the cause of failure can be basically determined by the long experience of engineers. On the other hand, the designed load capacity is 60 t for the kind of truck, while the real load reaches 80 t due to the complex transportation requirement; the reason that the parts have broken is the lack strength to a large extent. In addition, the structure of the steering arm is not reasonable. It not only produces a bending movement, but also torsion at the root of the steering arm, which reduces the strength of this parts. At present, many trucks are gradually phased out of this structural form, and scheme 1, shown in
Section 6.1, is increasingly adopted. Therefore, the reason that the steering arm fractured is most likely its strength shortage.
3. Force Analysis and Torque Calculation
All the forces of the vehicle come from the road surface, not considering the aerodynamic resistance. When the steering arm is broken, due to kinematic restrictions, the steering arm will inevitably rotate along the king-pin axis. It is known that the steering arm mainly withstands the torque generated by the forces from the road around the king-pin axis, because the horizontal and vertical forces will be respectively occupied by the A-type frame and hydro-pneumatic strut according to the characteristics and the previous kinematic analysis of Macpherson suspension. Accordingly, the key is to determine the torque, particularly the maximum one on the steering arm from the road under the condition described by the drivers when it is broken.
3.1. Force Analysis on the Tire
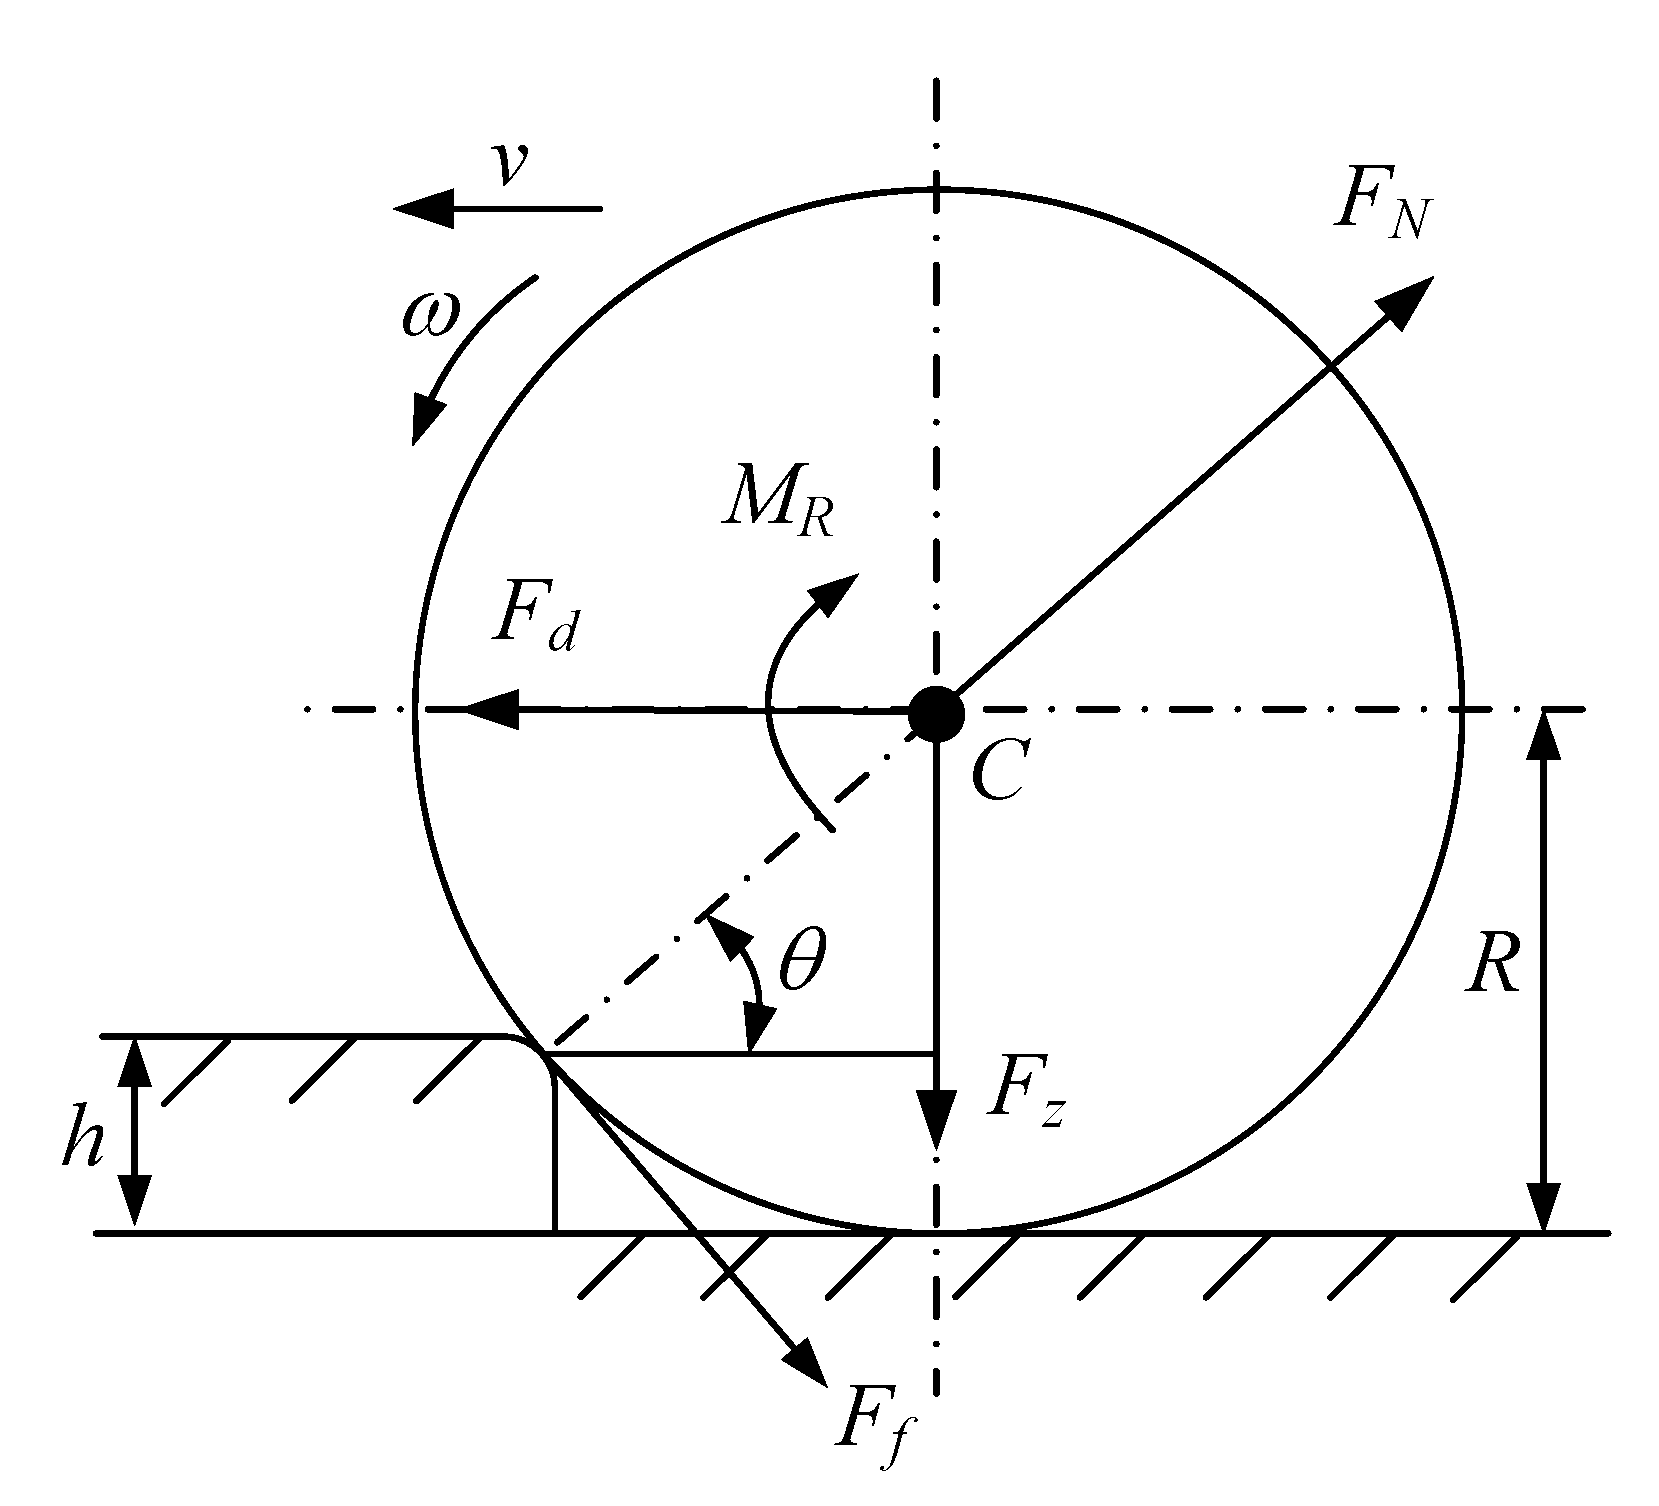
Figure 4 shows the force analysis on the tire installed in the driven wheel when a truck with rear-wheel drive travels through an obstacle. In this figure,
Fd,
Fz,
Ff, and
FN are the driving force, vertical force from the sprung mass, friction, and reaction force from the road, respectively,
MR represents the rolling resistance moment, and
h and
R respectively represent the height of the obstacle and the radius of the tire.
When a truck needs to pass through a higher obstacle, its speed is generally very low. It is assumed that the truck drives through the obstacle at a low constant speed, and the equilibrium equations can be expressed as
where
and
fr is the rolling resistance coefficient.
Based on the concept of the friction cycle [
13,
22], the maximum lateral force can be calculated as
where
μ is the tire–road friction coefficient.
It is noted that there is a residual torque acting on the steering arm, only when the opposite one caused by the lateral friction around the king-pin axis is less than the one generated by the
Fd and king-pin axis. Therefore, the residual torque can be written as
where
L1 and
L2 respectively represent the arm lengths of the longitudinal and lateral forces along the king-pin axis, and they both can be measured by the 3D model of the Macpherson suspension system integrated into the steering mechanism. In addition, the energy of the stress responses, as shown in the experiment results in this paper, mainly focuses on a very low frequency due to the truck with a low velocity when it drives through a high obstacle, so the tire fore modelling, notwithstanding similar to the static analysis (i.e., quasi-static analysis), is reasonable.
3.2. Torque on the Steering Arm
Table 1 shows the parameters of the truck for calculating the torque on the steering arm. Although the rolling resistance coefficient and friction coefficient can be determined based on the experiential values for the unsurfaced road recommended by the literature [
23,
24], they are two ranges as shown in
Table 1. The two ranges can moderately reflect the dynamic characteristics of the road and the tire.
h can be obtained by measuring the height of the obstacle where the steering arm is broken frequently.
According to Equations (1) to (5) and
Table 1, torque
M on the steering arm with different rolling resistance and friction coefficients can be obtained, as shown in
Figure 5. The torque value is mainly determined according to three parameters—the height of the obstacle, the coefficient of friction, and the coefficient of rolling resistance. The height of the obstacle can be obtained by measuring the height of the road surface at the frequently broken site, while the other two parameters are related to the state of the vehicle, the characteristics of the road surface and the characteristics of the tire. In order to avoid obtaining the complex characteristics of the road and tire, we can determine the maximum torque according to the range of its experience values, so as to ensure a certain strength redundancy. These coefficients are confined in the ranges given in
Table 1.
Similarly, the relationship between the torque on the steering arm and the height of the obstacle is shown in
Figure 6 where parameters
L1 and
L2 will vary with the height of the obstacle, rolling resistance coefficient
fr and friction coefficient
μ are, respectively, 0.15 and 0.4, and the others remain unchanged as shown in
Table 1. It can be seen that the higher the obstacle is, the greater the torque on the steering arm becomes. For safety’s sake, the maximum torque will be used to verify and improve the steering arm, and the maximum is 16.52 kN m under the extreme conditions where the steering arm is broken frequently.
4. FEA of the Left Steering Mechanism
4.1. Mechanism Description
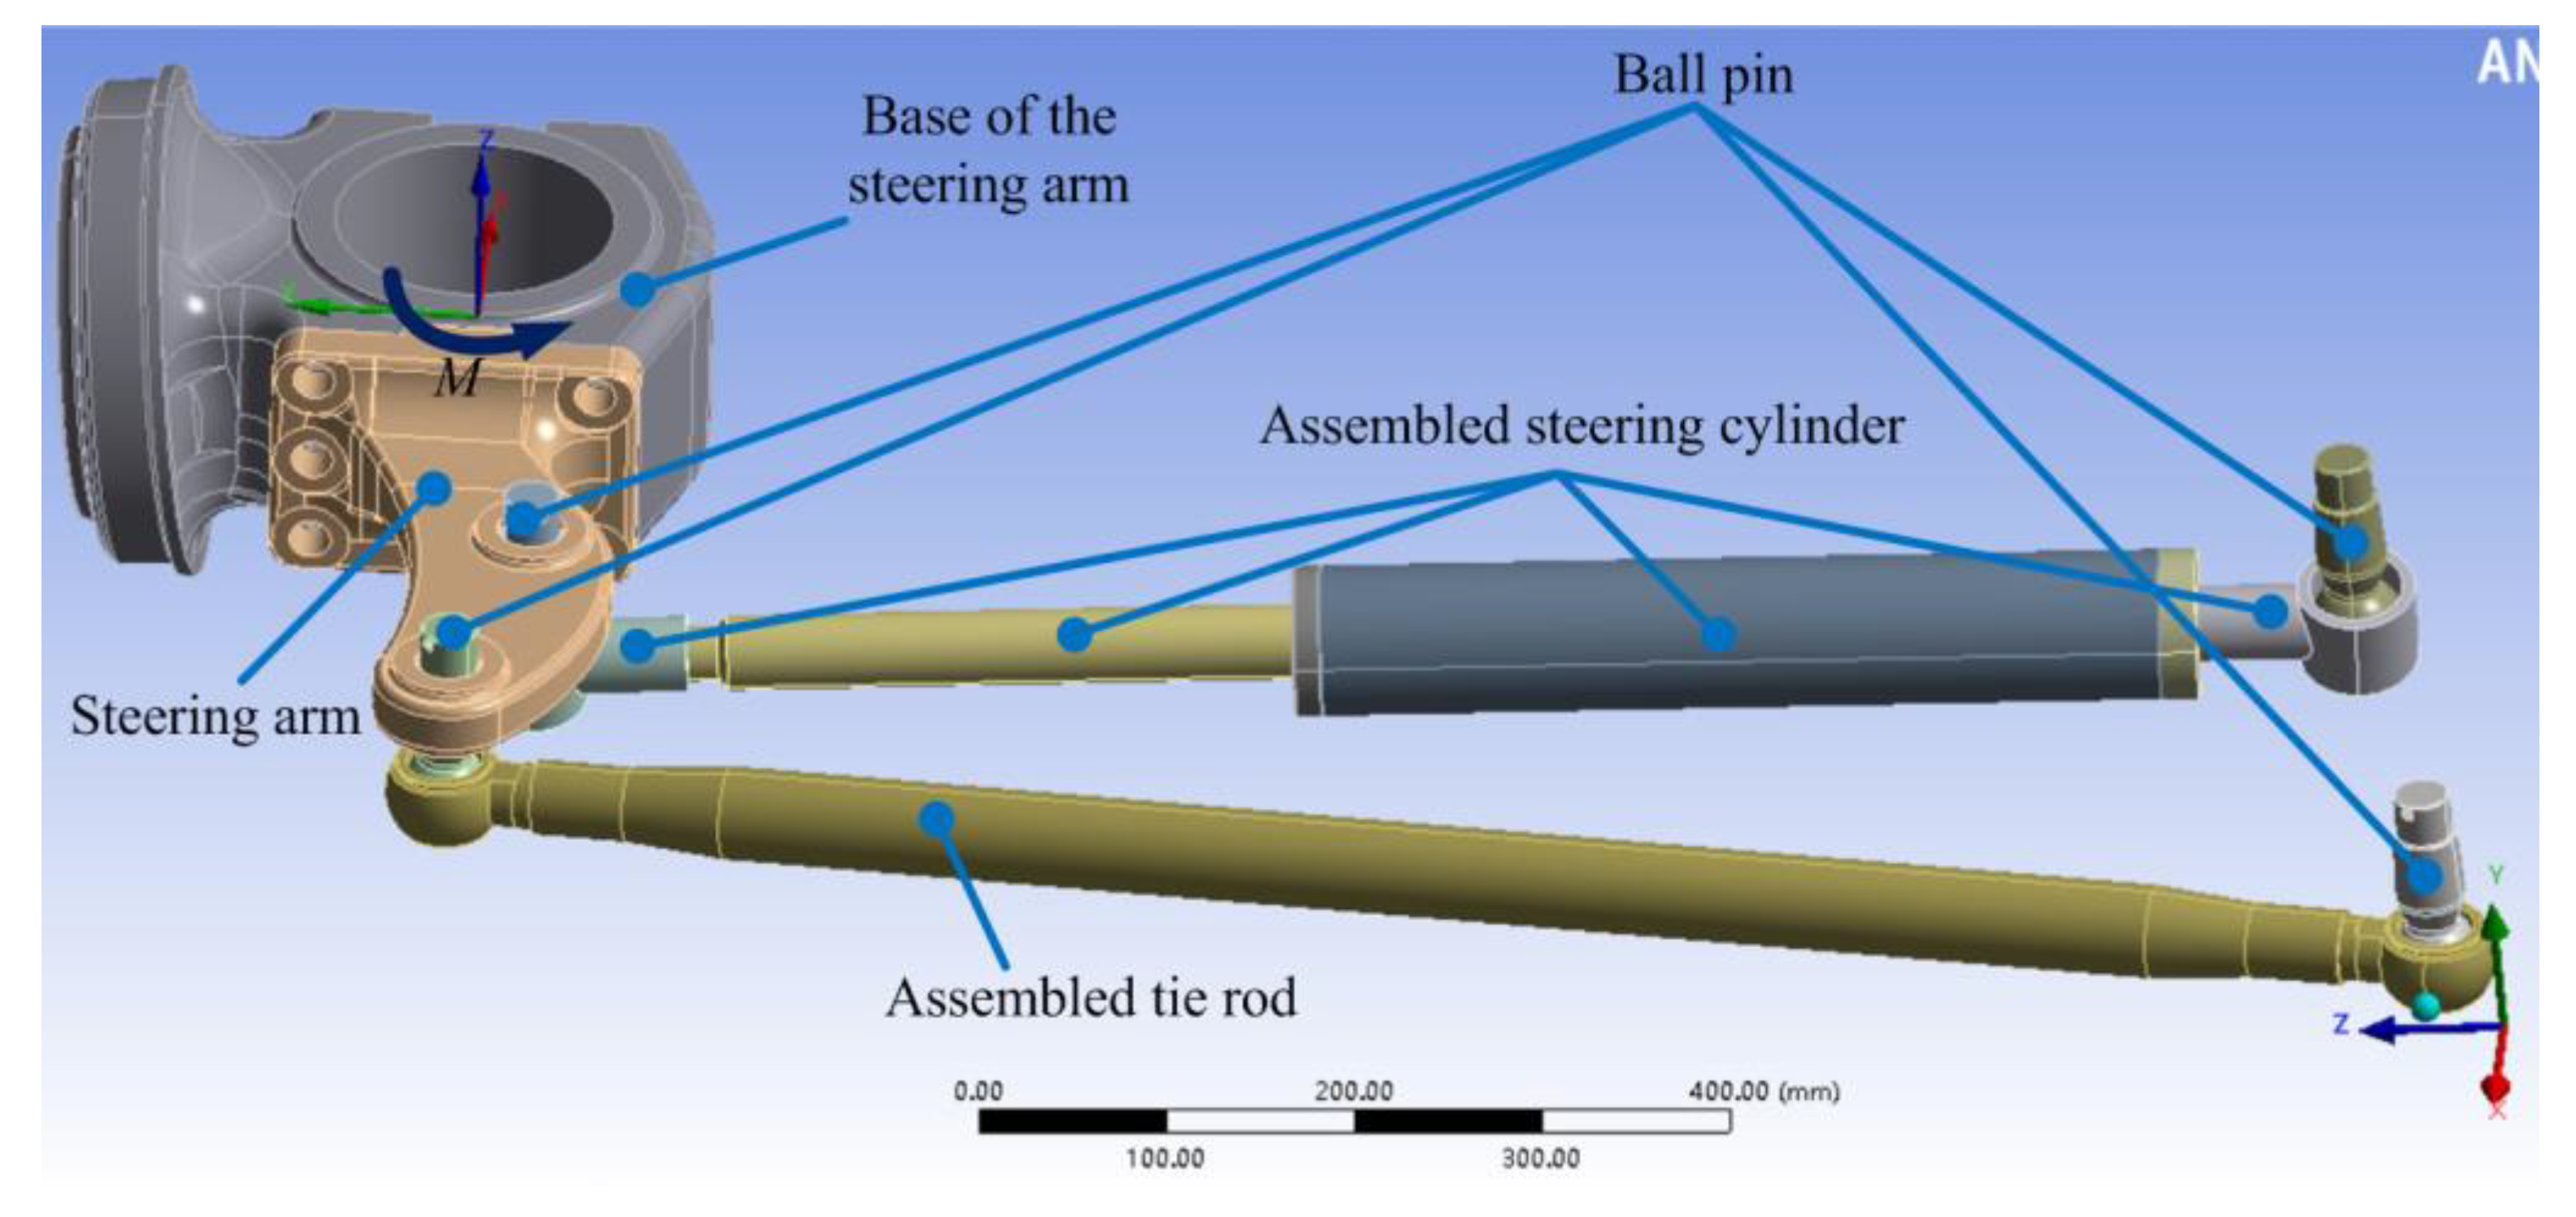
Figure 7 shows the left steering mechanism, which is simplified as the following main parts: the steering arm, base of the steering arm, assembled tie rod, assembled steering cylinder, and four ball pins. To carry out the strength analysis, a rigid–flexible coupling model is established by importing the 3D geometric model of the mechanism into the ANSYS environment. The stress distributions of these parts can be obtained by solving the model in ANSYS Workbench, after defining the material properties, connected relations between parts, element types, meshes, and loads.
The steering arm is the emphasis in this paper, and its material property is shown in
Table 2.
4.2. Rigid–Flexible Coupling Model
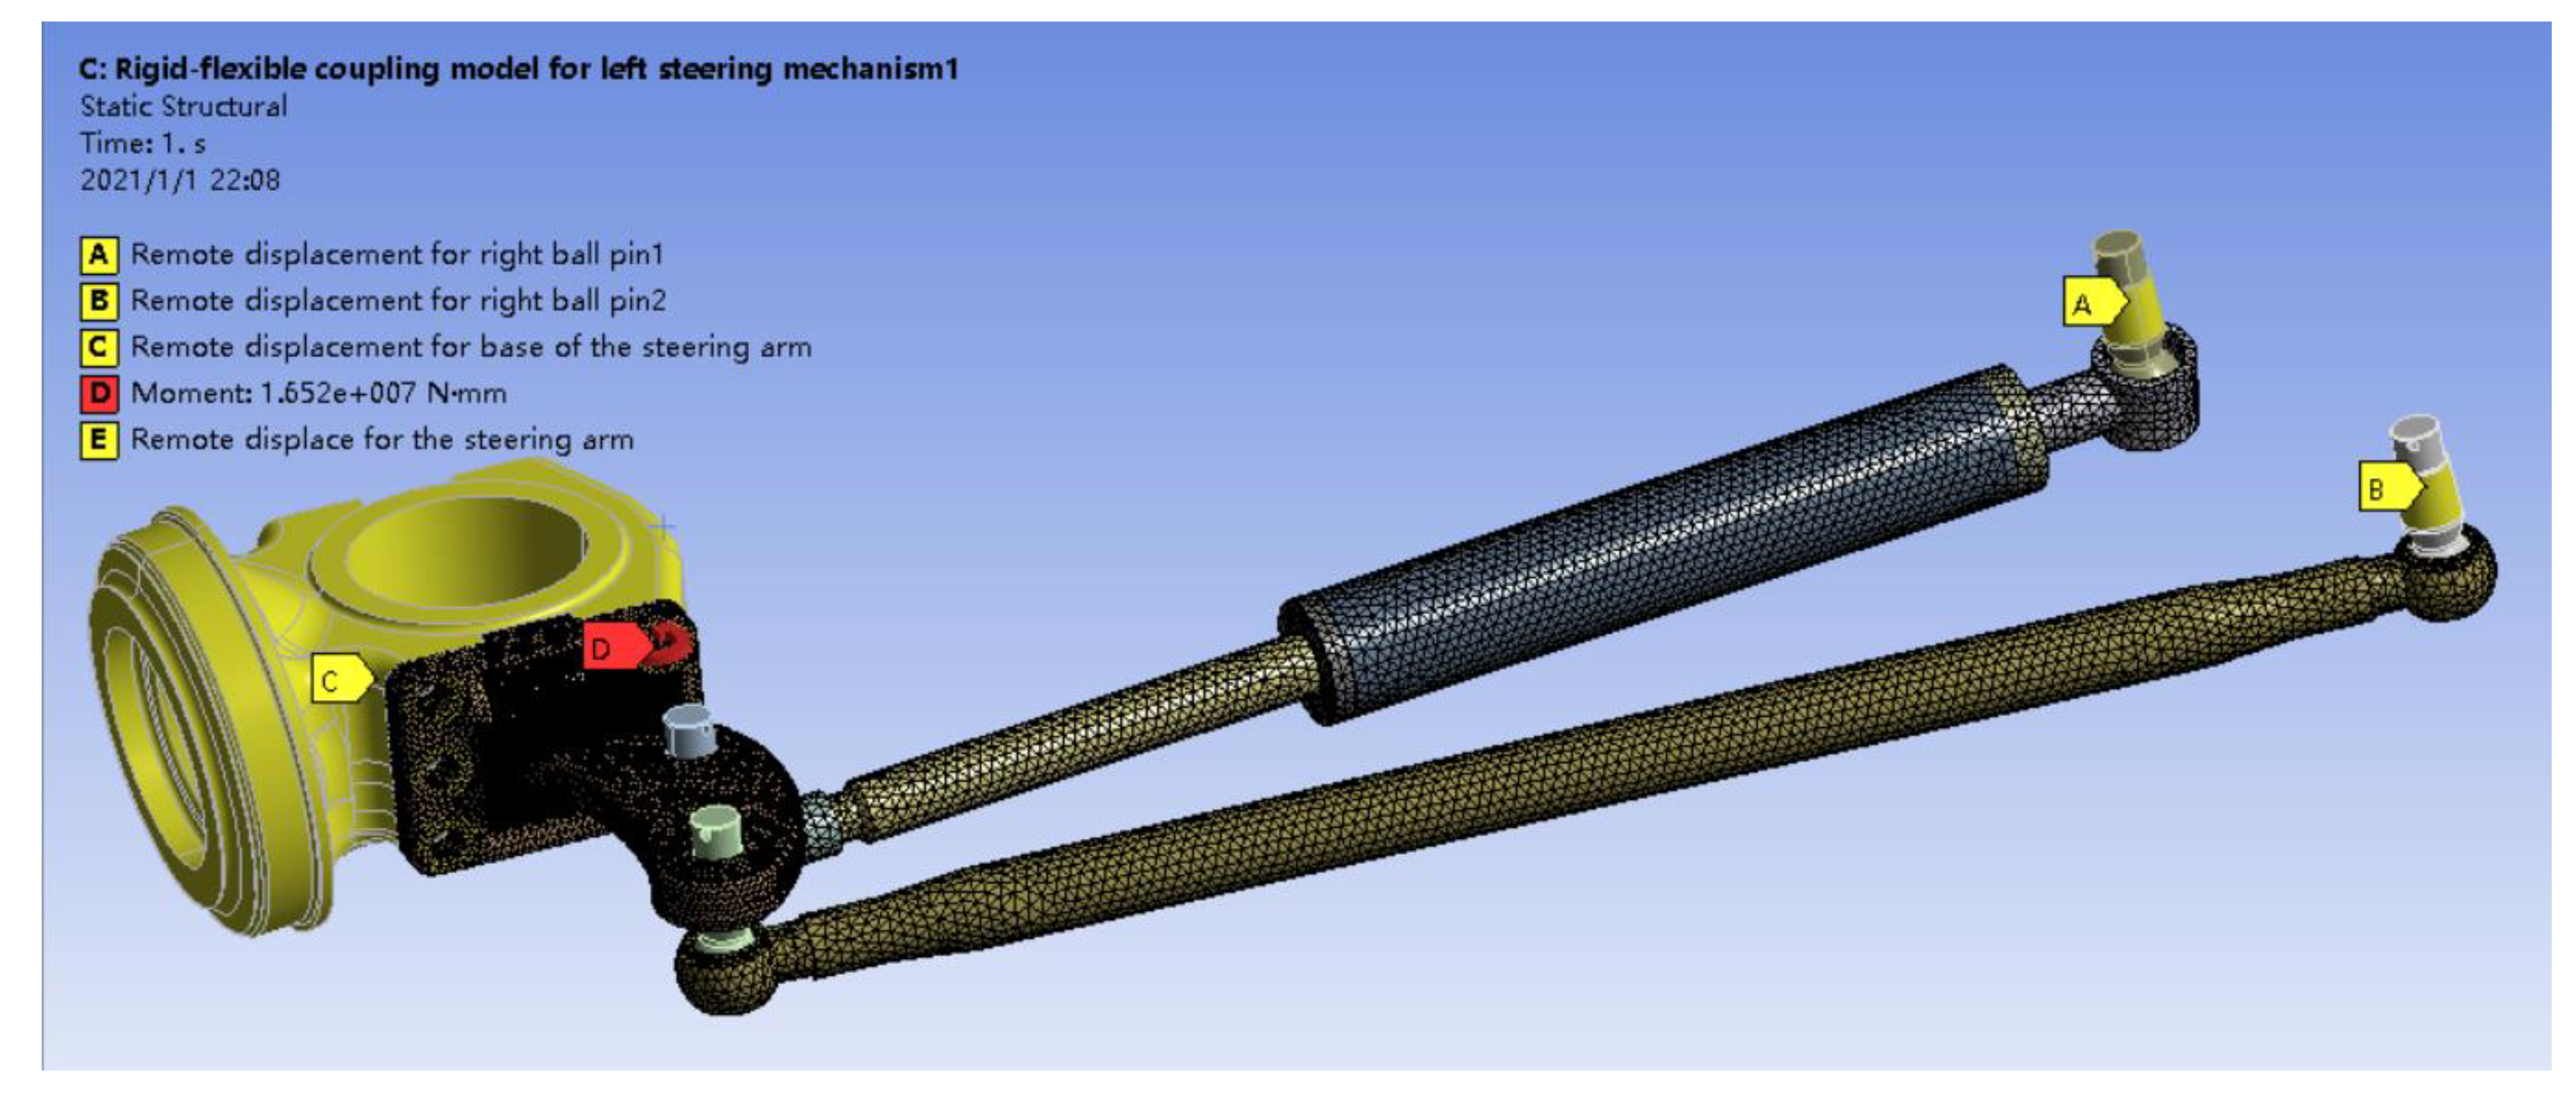
The rigid–flexible coupling model is shown in
Figure 8, and the modelling steps are mainly as follows.
(1) Define rigid and elastic bodies. Since the deformation of the four ball is small, and the base of the steering arm mainly is to define a king-pin coordinate whose Z axis is the king-pin axis, as shown in
Figure 7, the five parts are defined as rigid body, but the others as elastic body.
(2) Define connection relations. The connection relations between the two ball pins in the left side and the steering arm are defined as the bonded contact, and they respectively connect with the assembled steering cylinder and tie rod by spherical joint. Similarly, the other ball pins respectively connect with the assembled steering cylinder and tie rod by spherical joint.
(3) Perform the meshing. The tetrahedral and hexahedral meshes will be used for all the elastic bodies, and the high stress area in the steering arm will be further refined. Compared with the steering arm emphasized in this paper, the meshes of other parts is relatively coarser, as shown in
Figure 8.
(4) Determine the constraints and loads. The steering arm with one degree of freedom can rotate around the king-pin axis by defining a remote displacement, and the torque on it is 16.52 kN m which is obtained by the quasi-static analysis mentioned in
Section 3 under extreme conditions. The two ball pins in the right side are fixed.
4.3. Stress Distribution on the Steering Arm
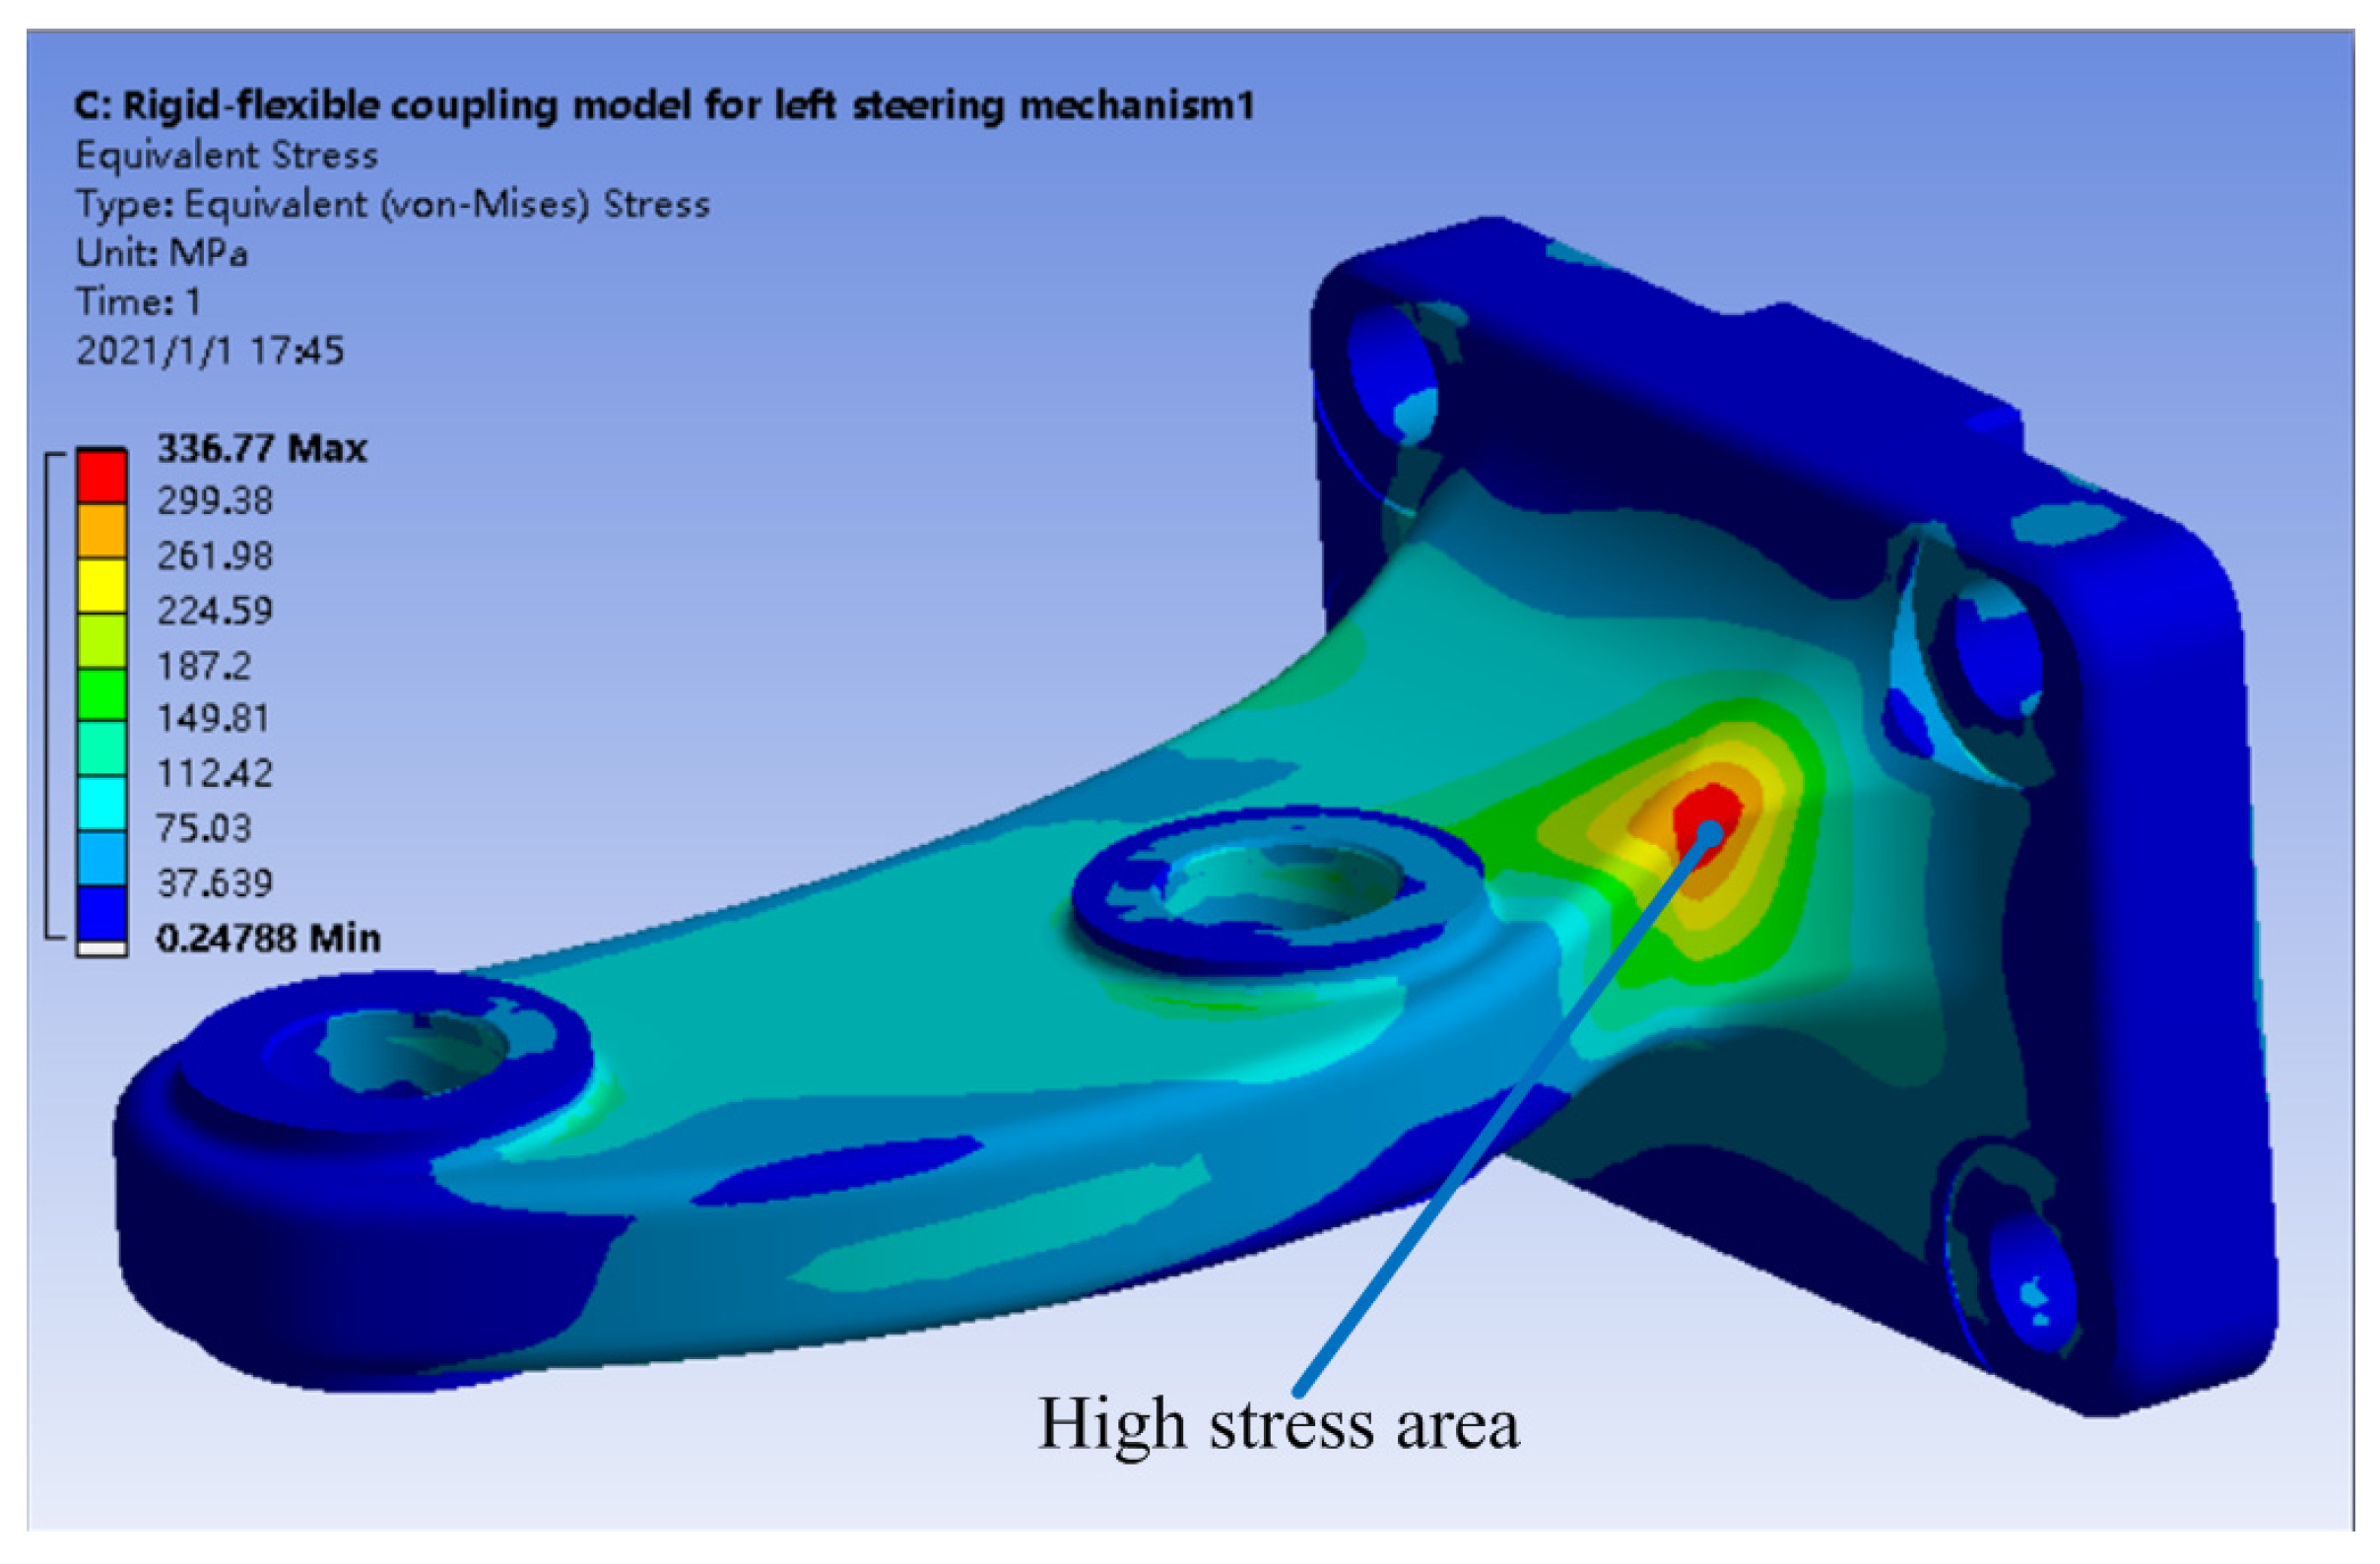
Solving the rigid–flexible coupling model can obtain the stress distribution on the steering arm, as shown in
Figure 9. It is seen that the high-stress area is consistent with that of the fractured steering arm, and the maximal Von Mises stress is 336.77 MPa, which has markedly excessed its yield strength from
Table 2. On the one hand, the fast calculation neglects the horizontal and vertical forces on the steering arm, and on the other hand, it did not completely consider the complex dynamic characteristics of the tire and road, which illustrates that the real stress may be more than 336.77 MPa. As a frequently moving part, therefore, the steering arm indeed has a great risk of failure, because the maximum stress has markedly exceeded its yield strength under the quasi-static analysis.
5. Stress Test and Its Discussions
5.1. Test Arrangement
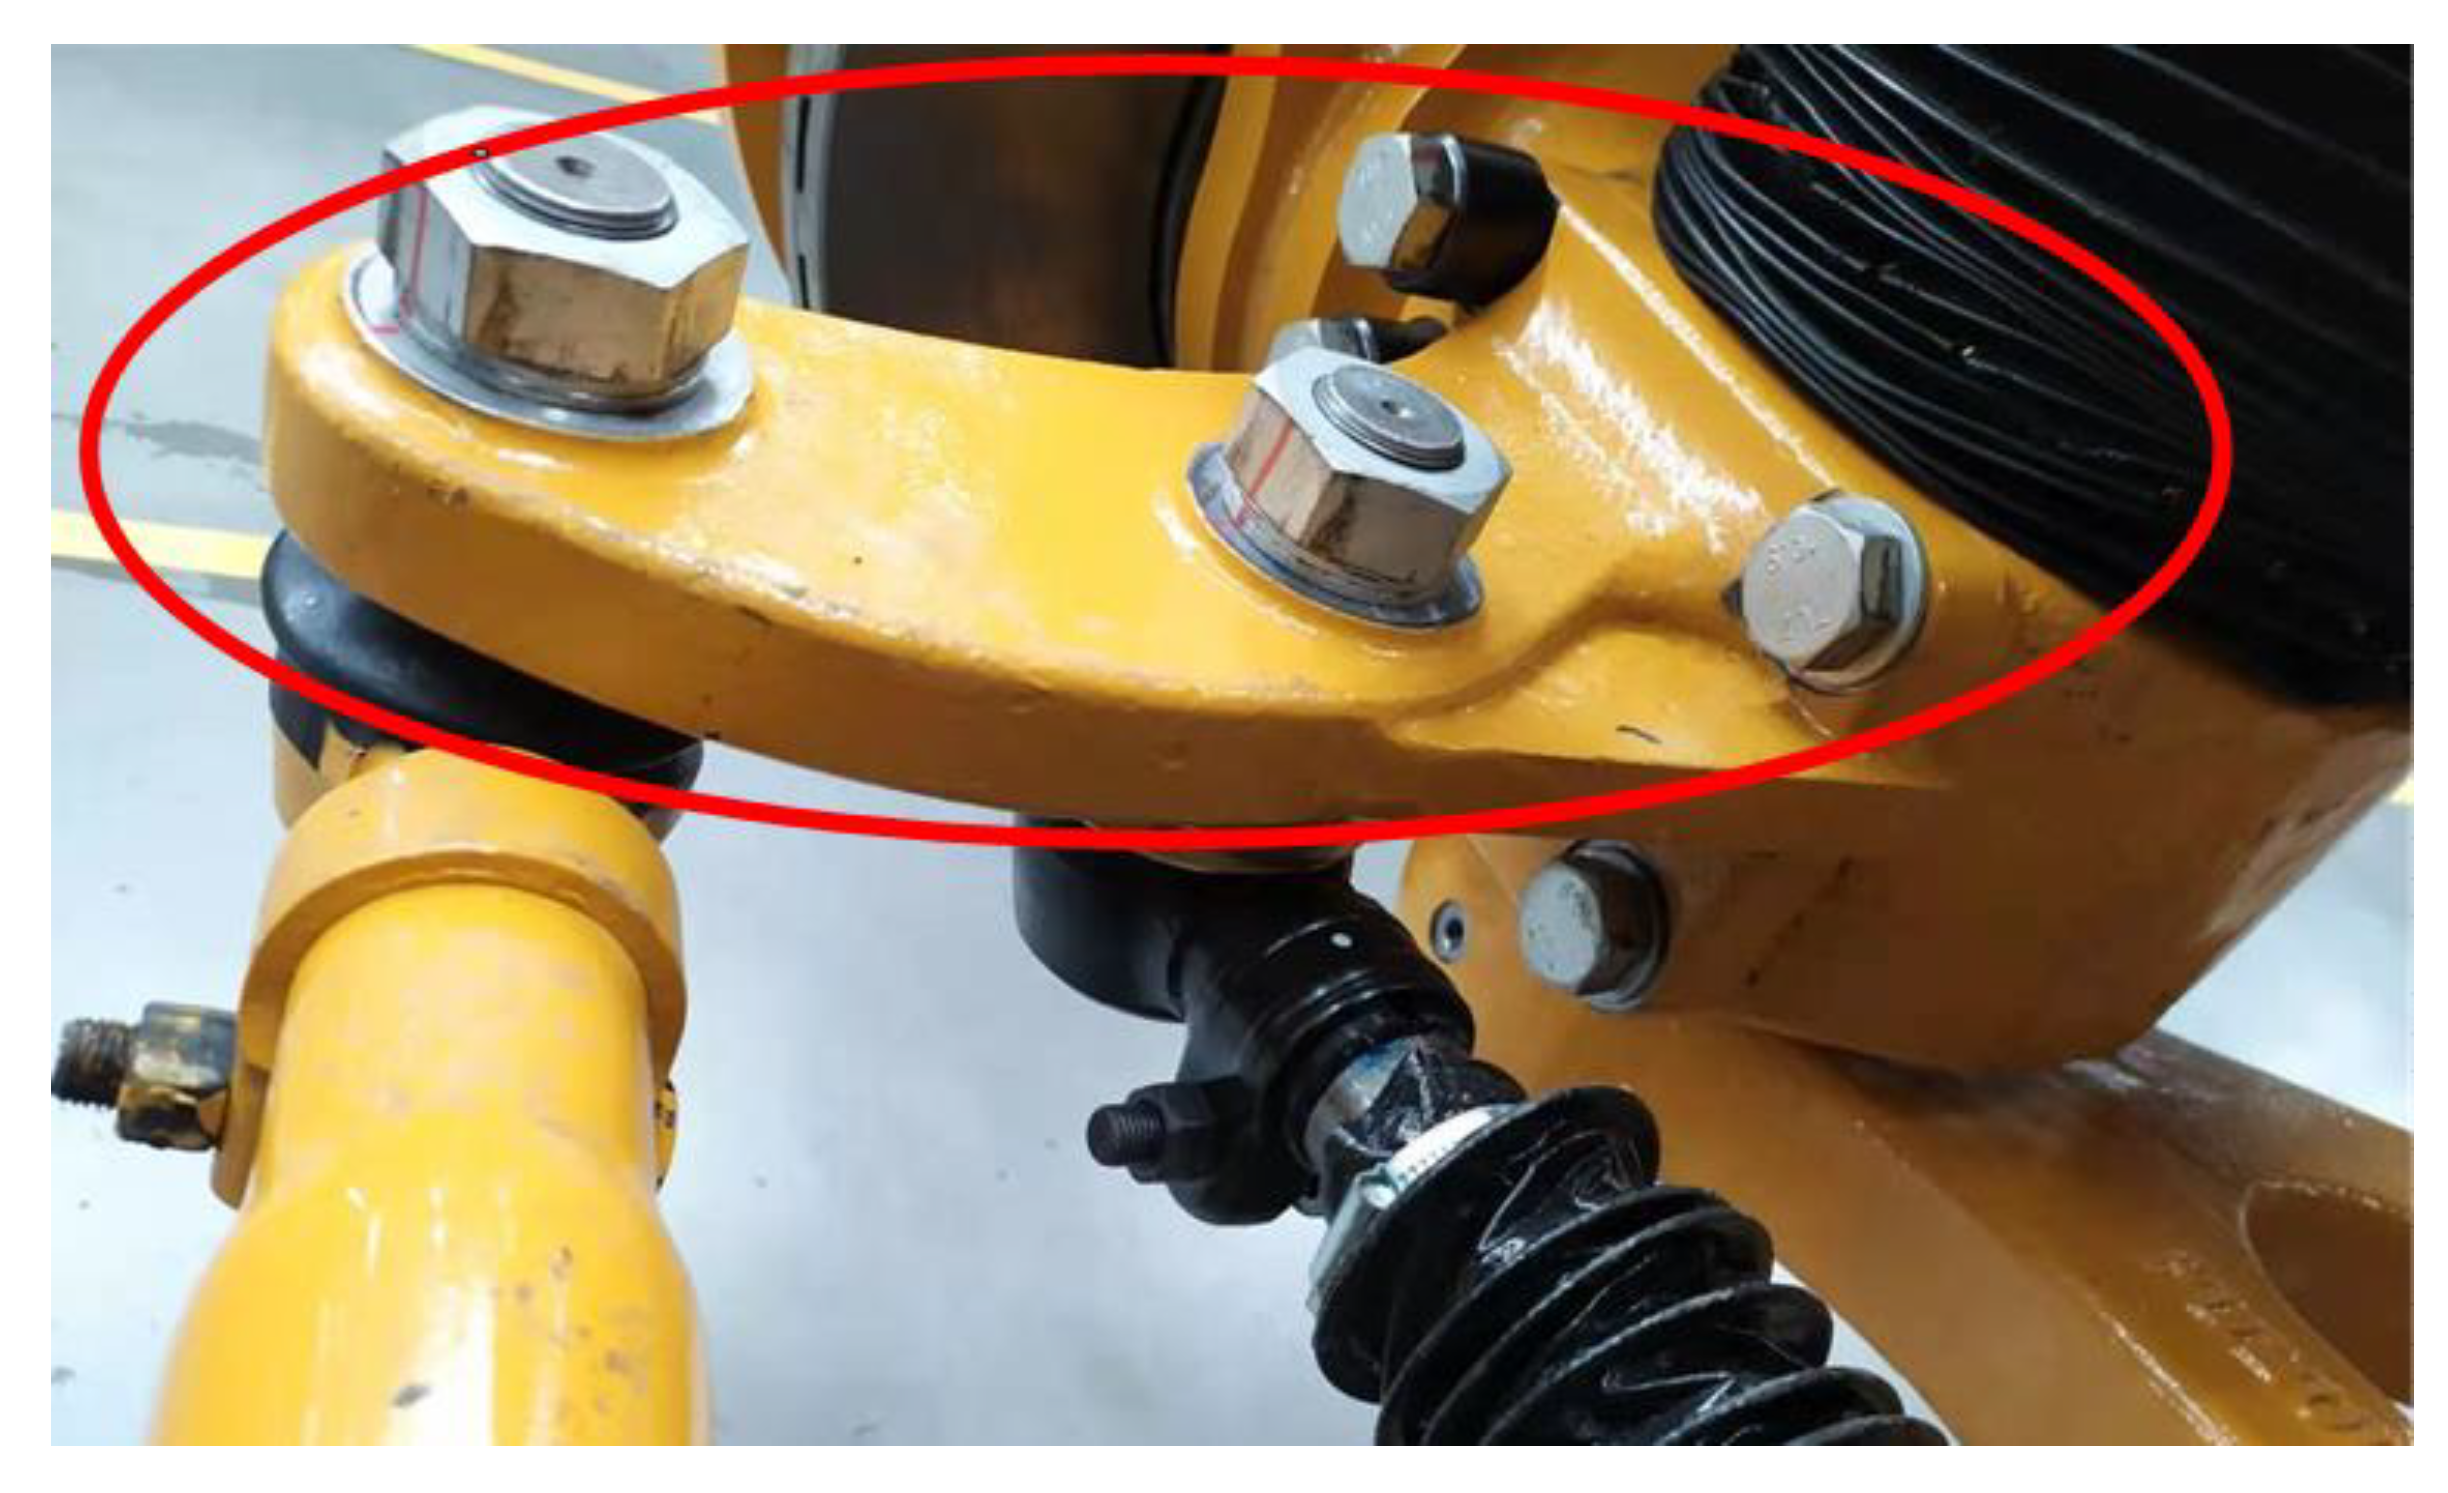
On the one hand, the stress test is performed to understand the forces on parts and realize a better design for mining trucks. On the other hand, the stress test can verify the modelling results from the fast calculation method for the steering arm. The stress points and the test road in the experiment are shown in
Figure 10 and
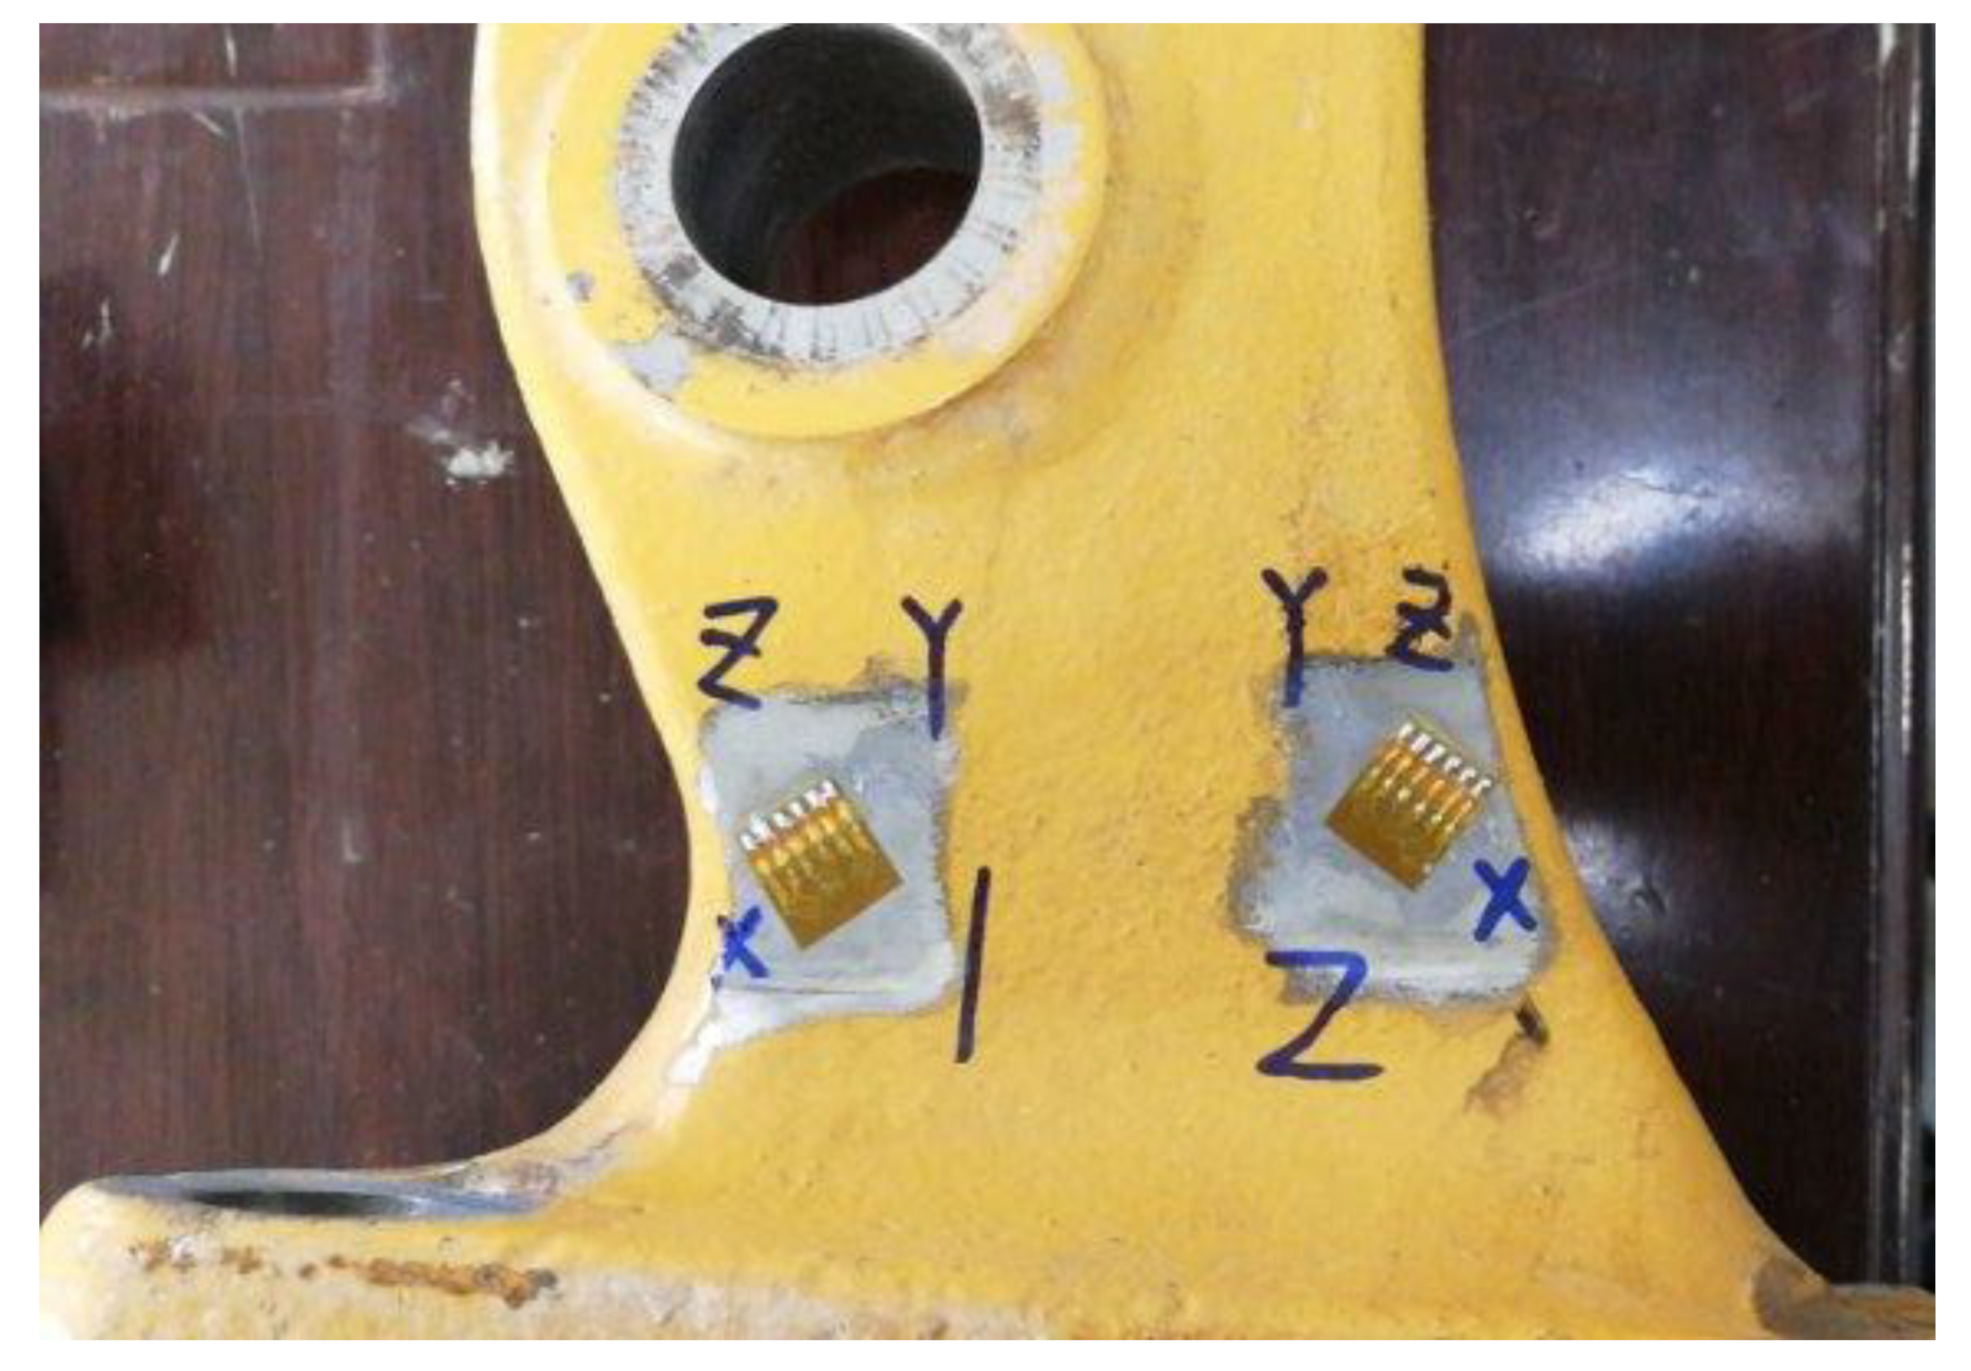
Figure 11, respectively. Different test points on parts, such as the steering arm, assembled steering cylinder, and assembled tie rod, are arranged. These points include three- and single-axis strain gauges, and there are, in total, 35 channels. In the test road, the height of the obstacle is arranged as 200 mm, and it is lower than the extreme condition, which can ensure driving safety. It is not easy to paste the strain rosette on the account of the curved surface in the high stress area, so the test points with a three-axis rectangular rosette on the steering arm are shown
Figure 12.
5.2. Strain Results from the Test
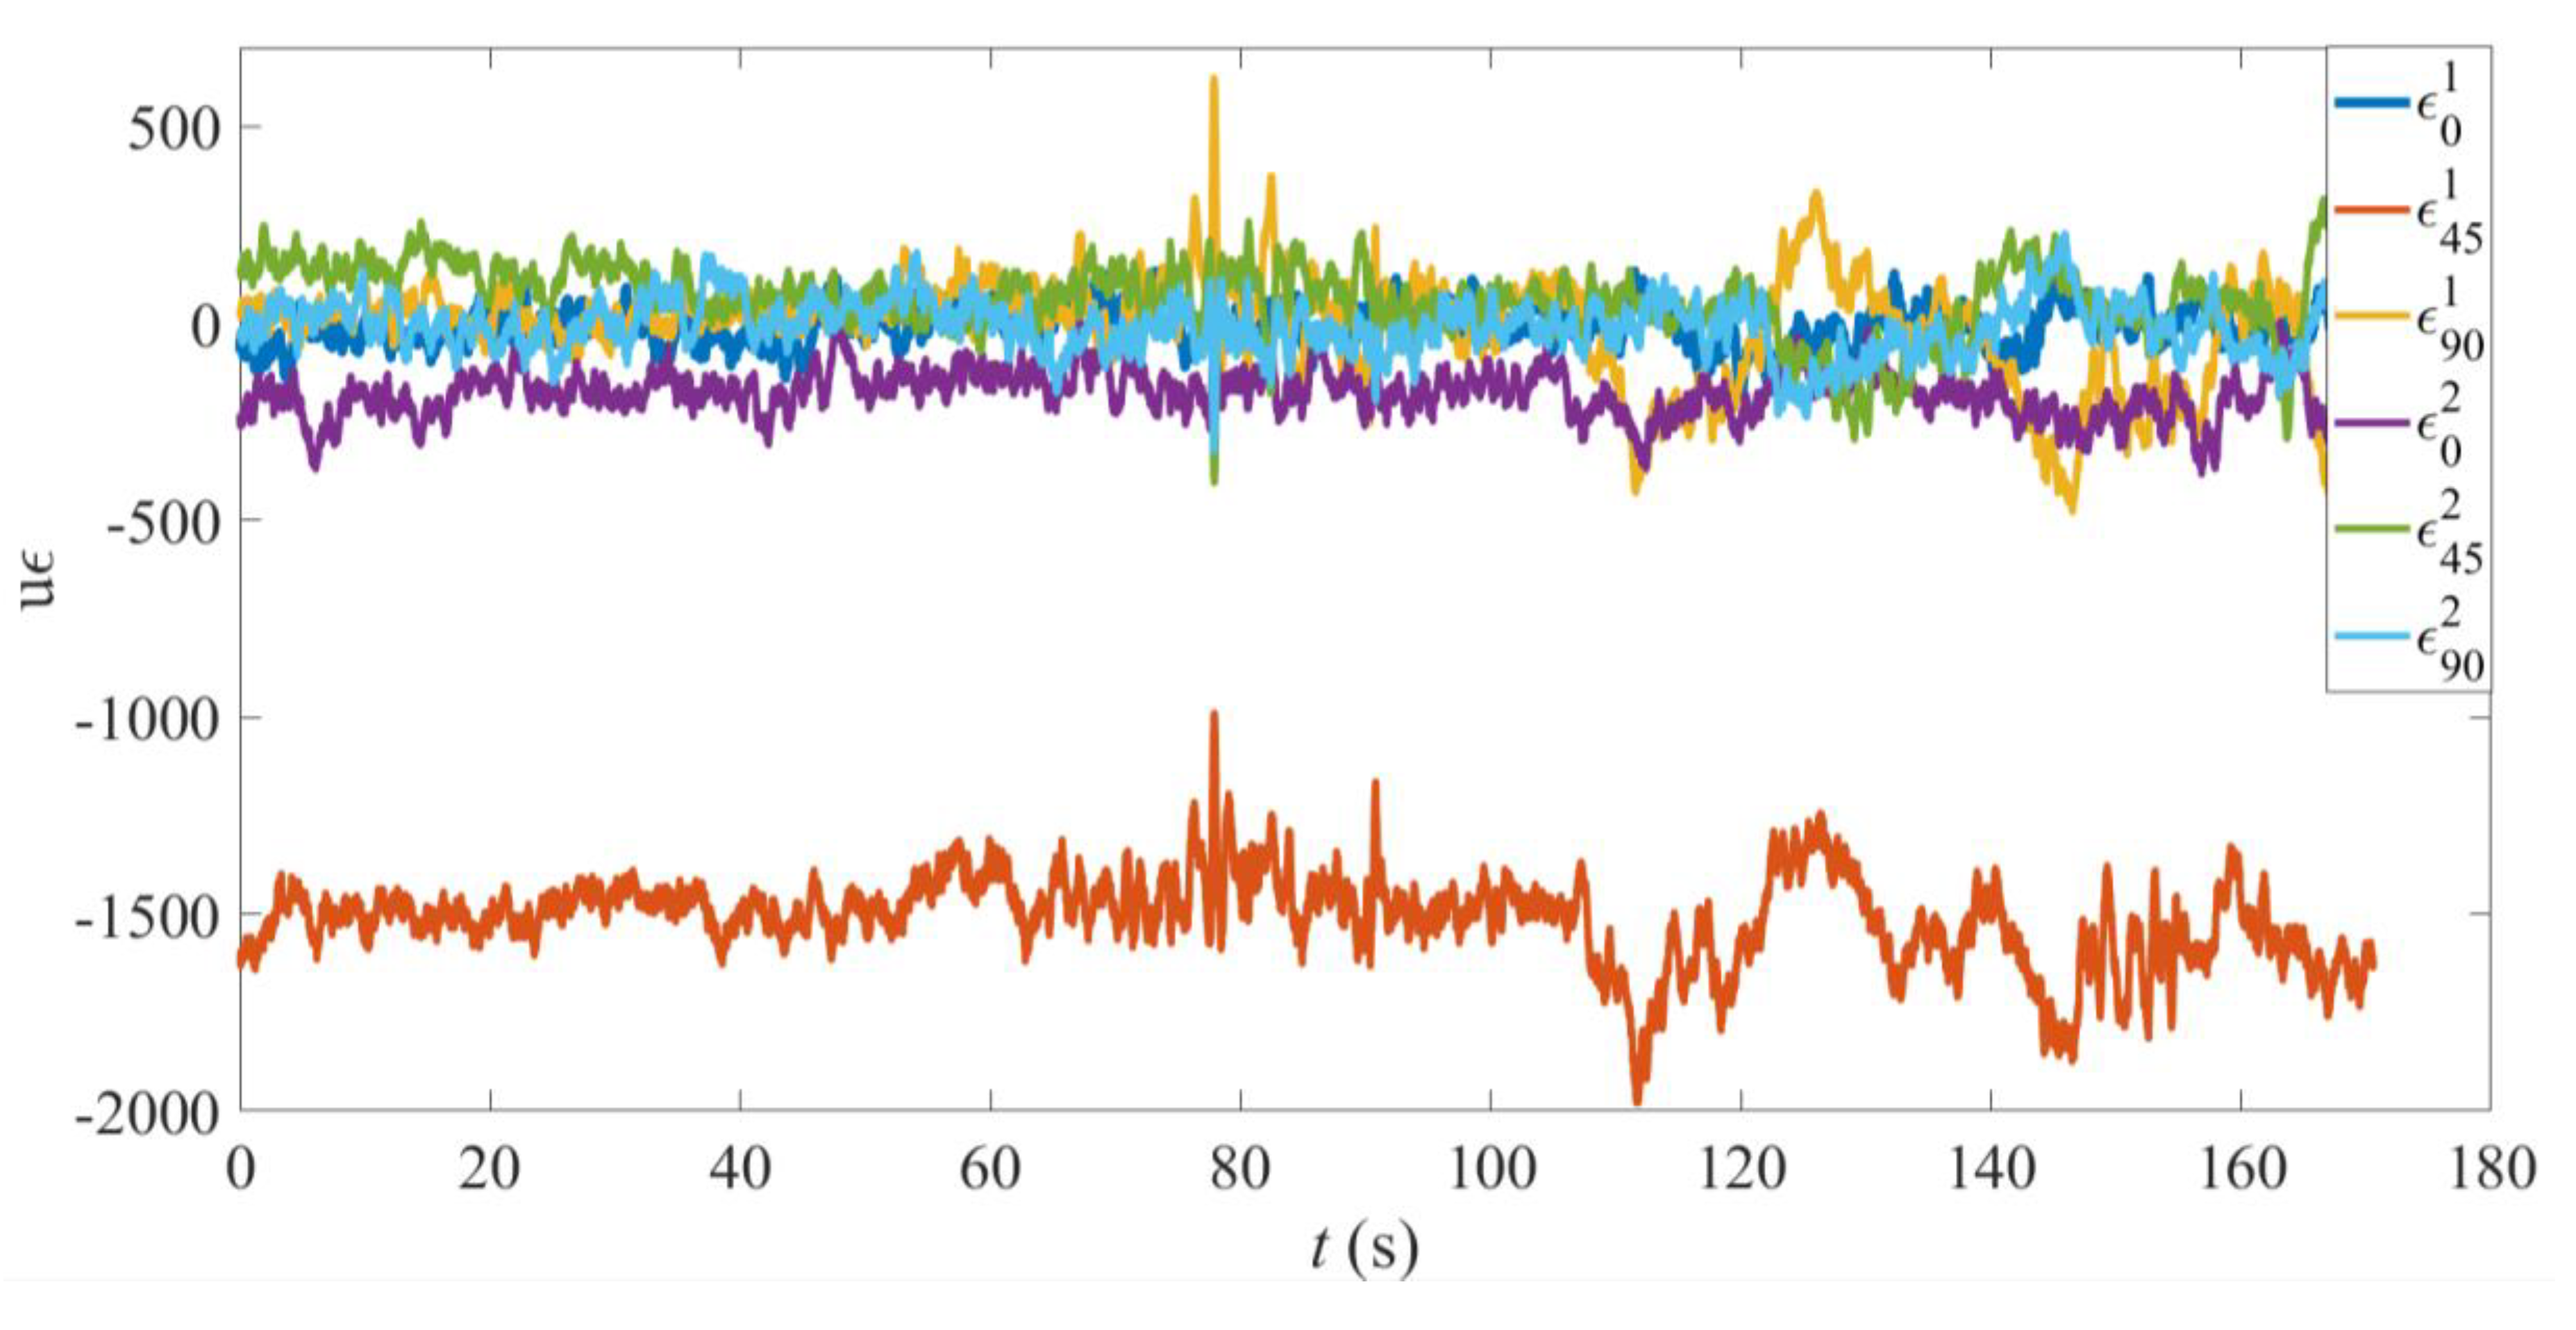
The strain responses on the steering arm are shown in
Figure 13 where the superscript and subscript respectively represent the serial number of the test points and the direction of the three-axis strain gages, for example,
.
5.3. Stress Results from the Test
According to the strain responses, the principal stress and its direction can be calculated by the following formulas [
25,
26]:
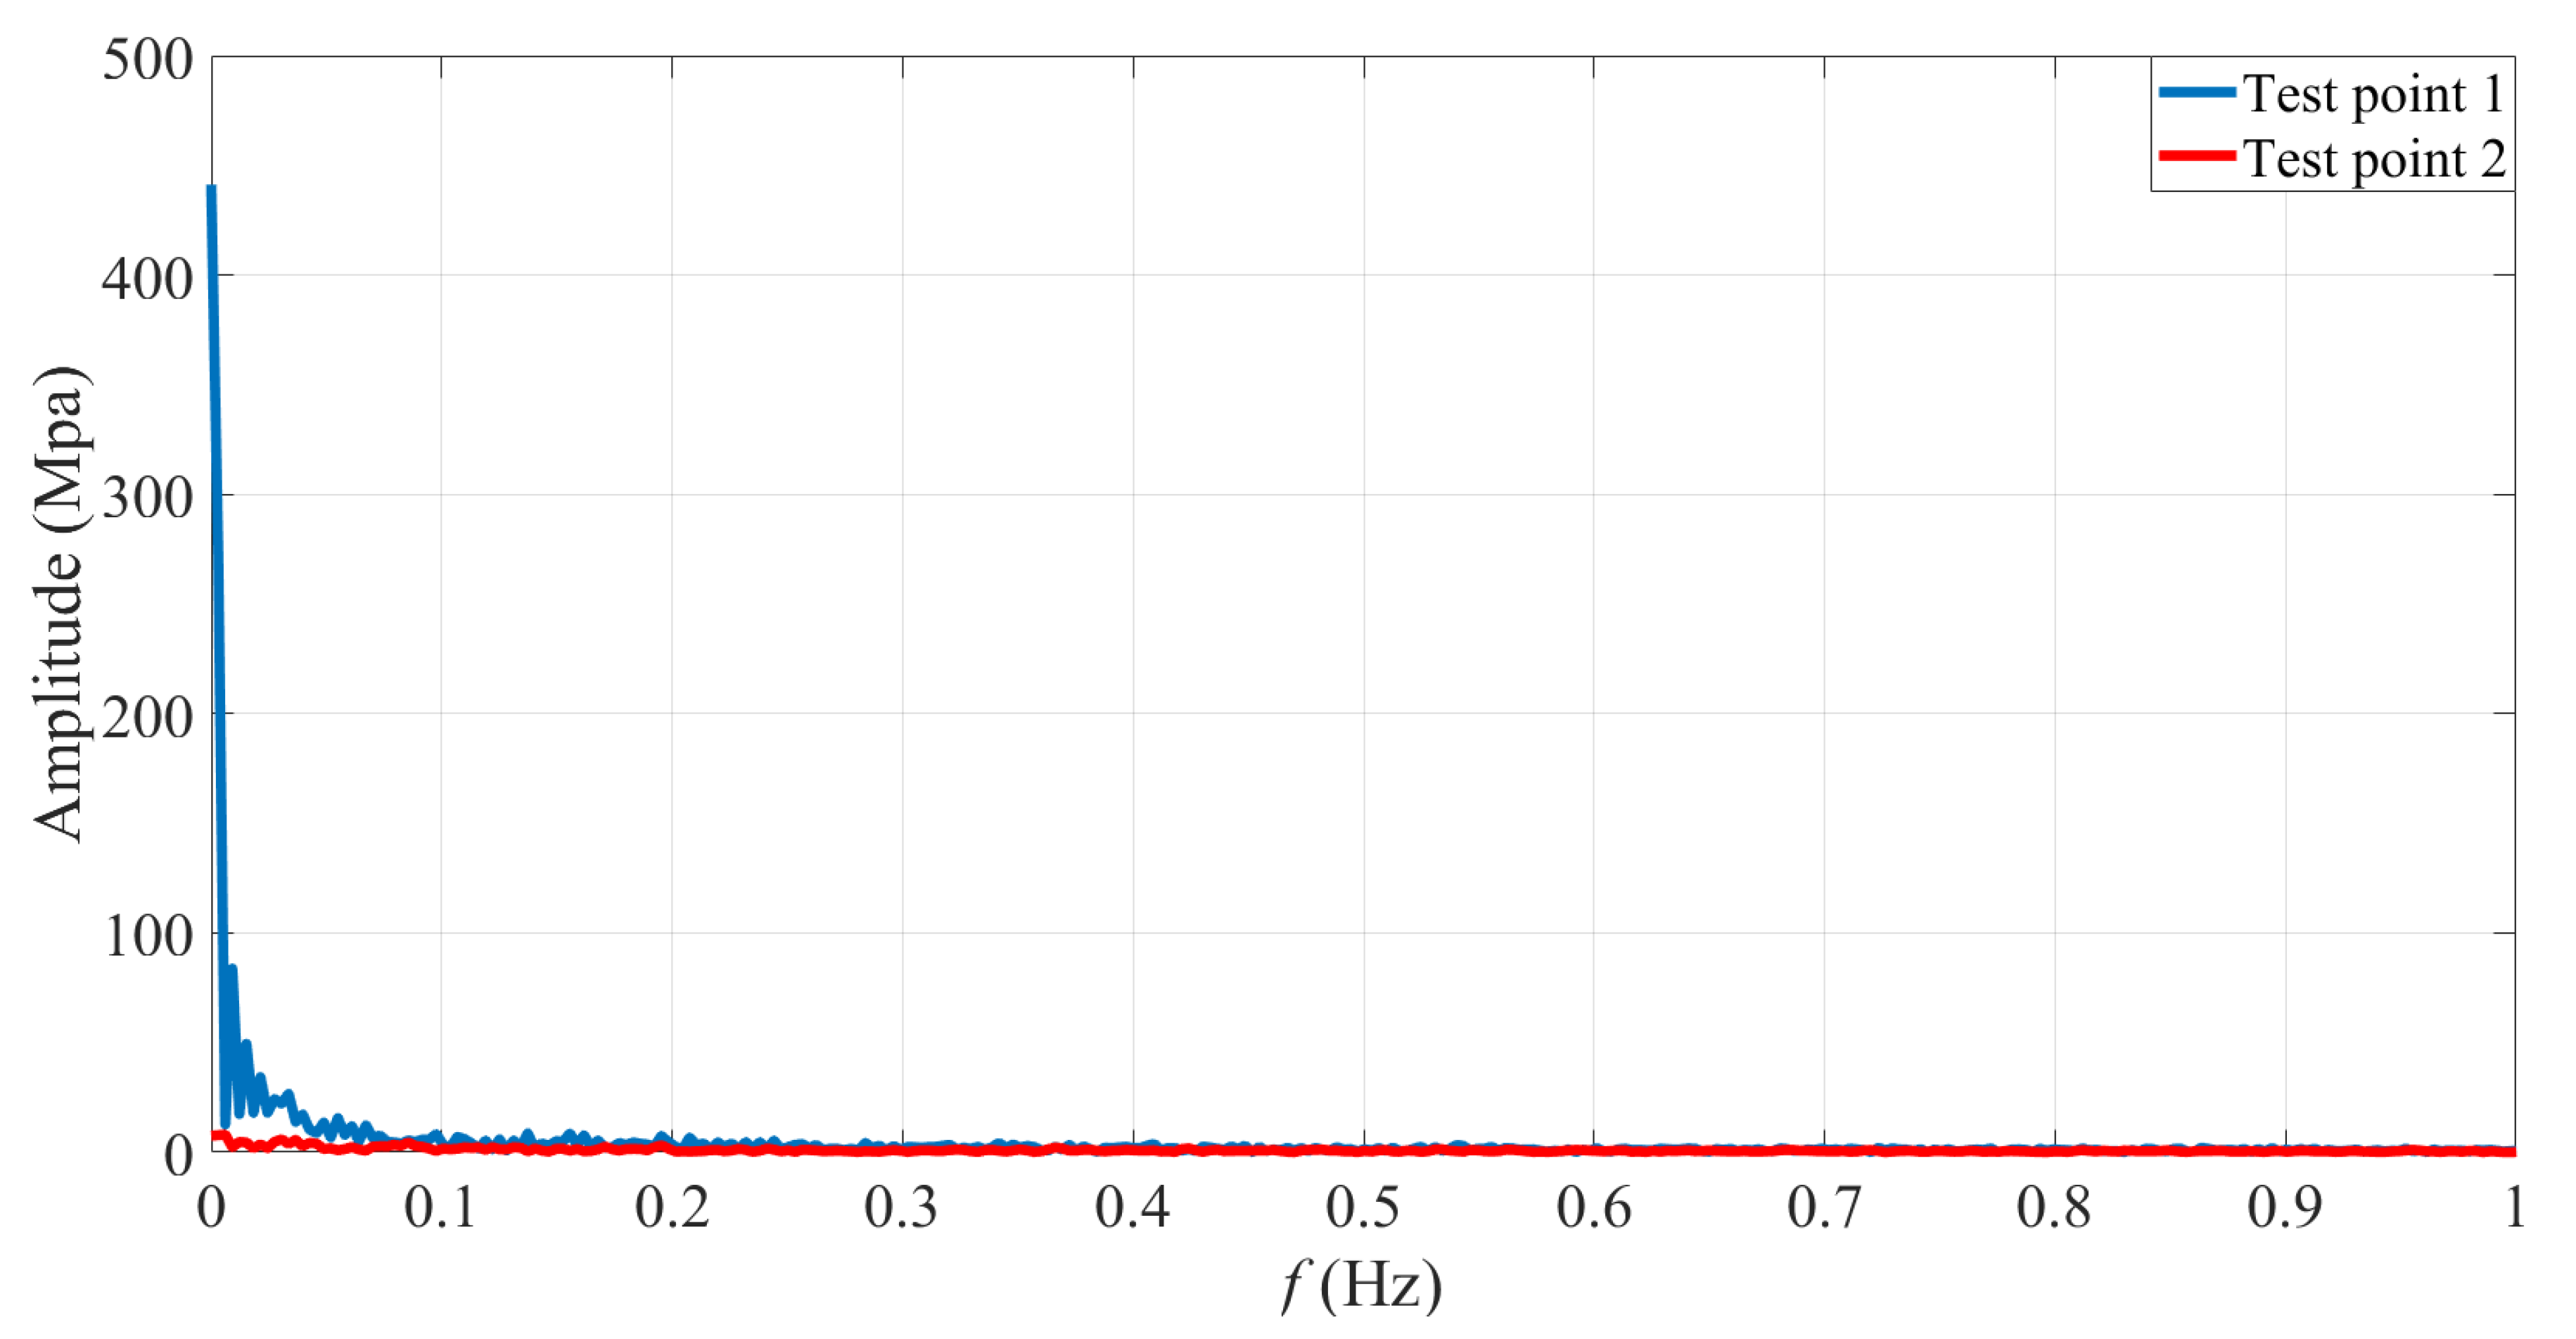
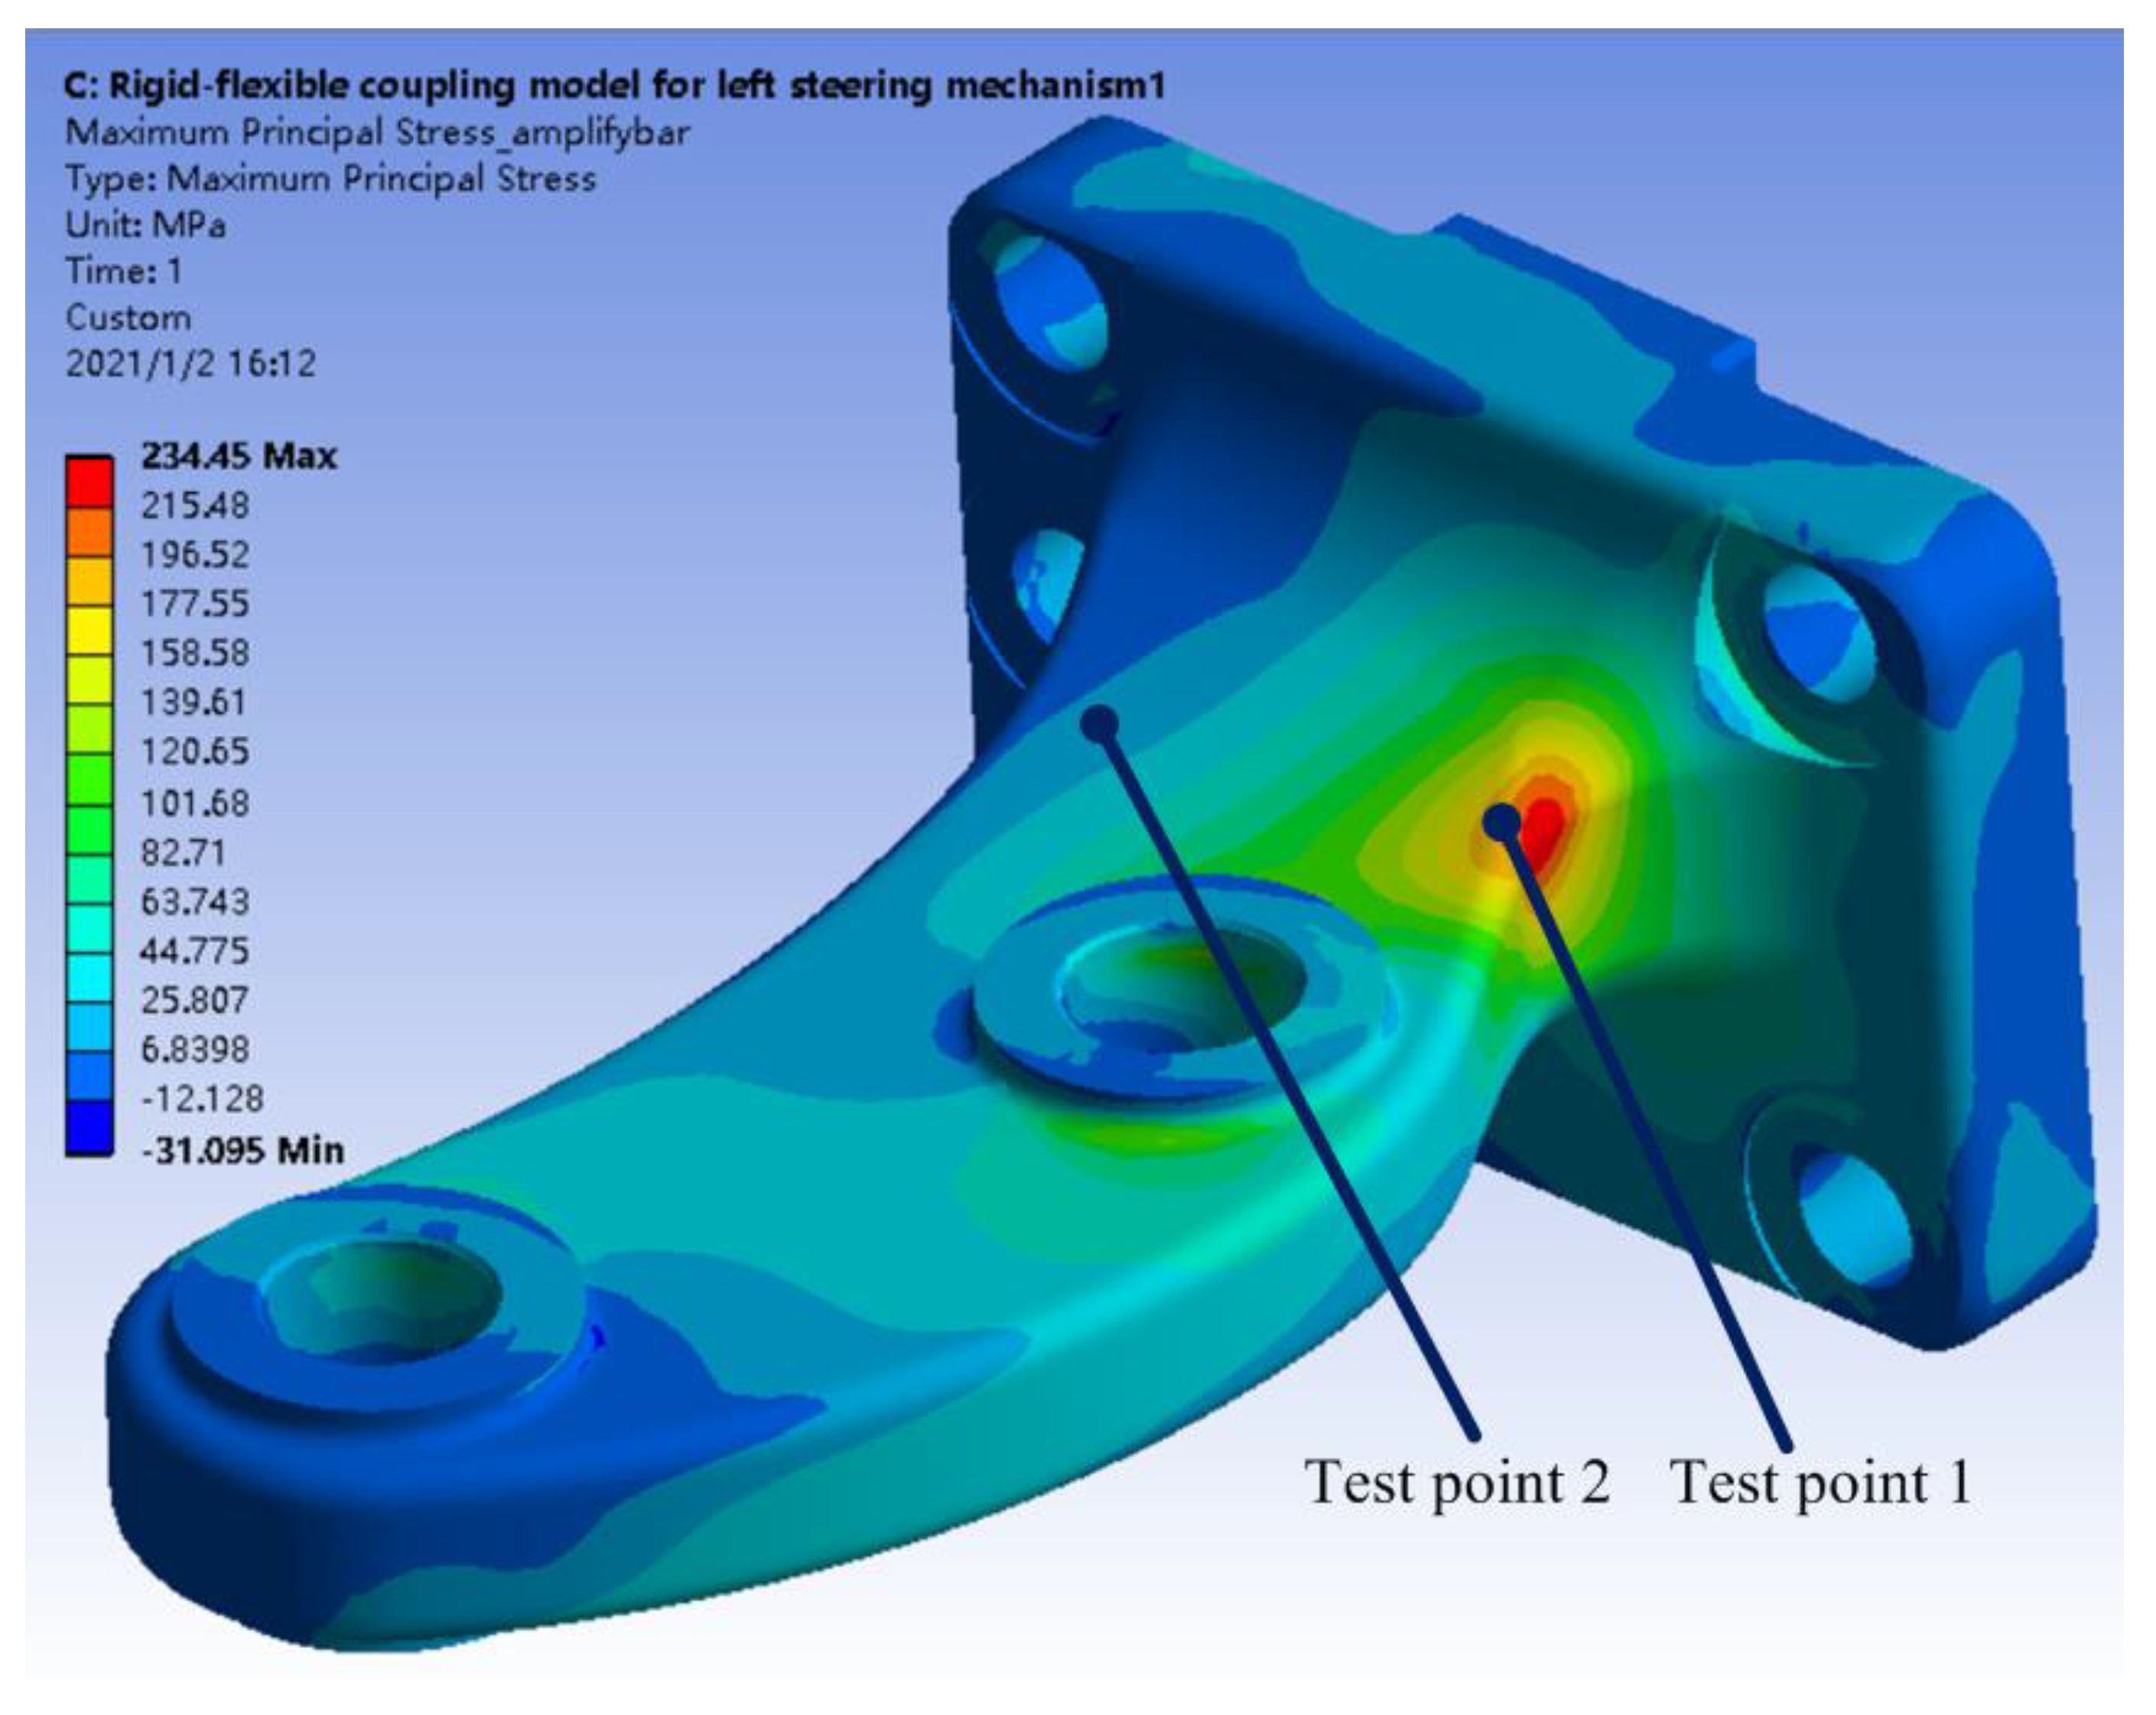
By (6), the maximum principal stress on test points 1 and 2 can be obtained, as shown in
Figure 14. According to the fast Fourier transform, the amplitudes of the maximum principal stress on test points 1 and 2 can be obtained, as shown in
Figure 15. It is noted that for clarity, the two curves are not completely shown in
Figure 15, due to the small amplitudes corresponding to the frequencies which are more than 1 Hz.
Figure 14 shows the stresses varying with time, so it is not convenient to compare them with the simulation. Accordingly, the statistics for these stresses can be obtained, as shown in
Table 3.
5.4. Stress Results from the Simulation
For comparison, the torque in the rigid–flexible coupling model is set to 11.345 kN·m—the value corresponding to the height 200 mm of the obstacle which is the same with the test road; after this model is solved, the stress distribution of the maximum principal stress is shown in
Figure 16. By postprocessing, it can be determined that the maximum principal stresses on test points 1 and 2 are about 12 and 190 MPa, respectively.
5.5. Discussions
It can be seen the stress distribution simulated by FEA are basically the same with the experiment on test points 1 and 2, by comparing the maximum principal stresses from the test (see the RMS shown in
Table 3) and the simulation (see
Section 5.4). Although there are some deviations, their relative errors are both not more than 15%, which satisfies the requirement in engineering. Since the speed of the truck is generally very small when passing a high obstacle, it can be regarded as a quasi-static dynamic model. In addition, it can be seen from the experiment in
Figure 15 that the energy of the stress responses mainly focuses on a very low frequency due to the truck with a low velocity when it drives a high obstacle, so the simulation results, notwithstanding similar to the static analysis, are feasible.
From the above discussions, it can be concluded that the simulation results by the fast calculation method proposed in this paper are feasible and reliable. The next section will use the simulation method to improve the steering arm.
6. Improvement of the Steering Arm
6.1. Improvement Analysis
The steering arm is generally made of castings or forgings, with the casting round corners, bosses, pits, cone holes, bolt holes, counter bores, and so on, and its shape is irregular, as shown
Figure 7. According to the stress distribution on the steering arm, its failure is from the combined effect by the bending and twisting. Based on the premise of no motion interference between the steering arm with other parts, three improvement schemes can be used to enhance its strength, as shown in
Figure 17 and
Figure 18. These schemes have respective advantages and disadvantages, and their descriptions and discussions are as follows.
(1) Improvement scheme 1. The scheme is to alleviate the torsional effect around the X axis by adjusting the position of the spherical joint of the ball pin on the steering arm, as shown in
Figure 17. No matter which role—withstanding the tire force or performing the steering—reducing the torsion is beneficial. However, the scheme will result in the modification of the ball pin and even the base of the steering arm.
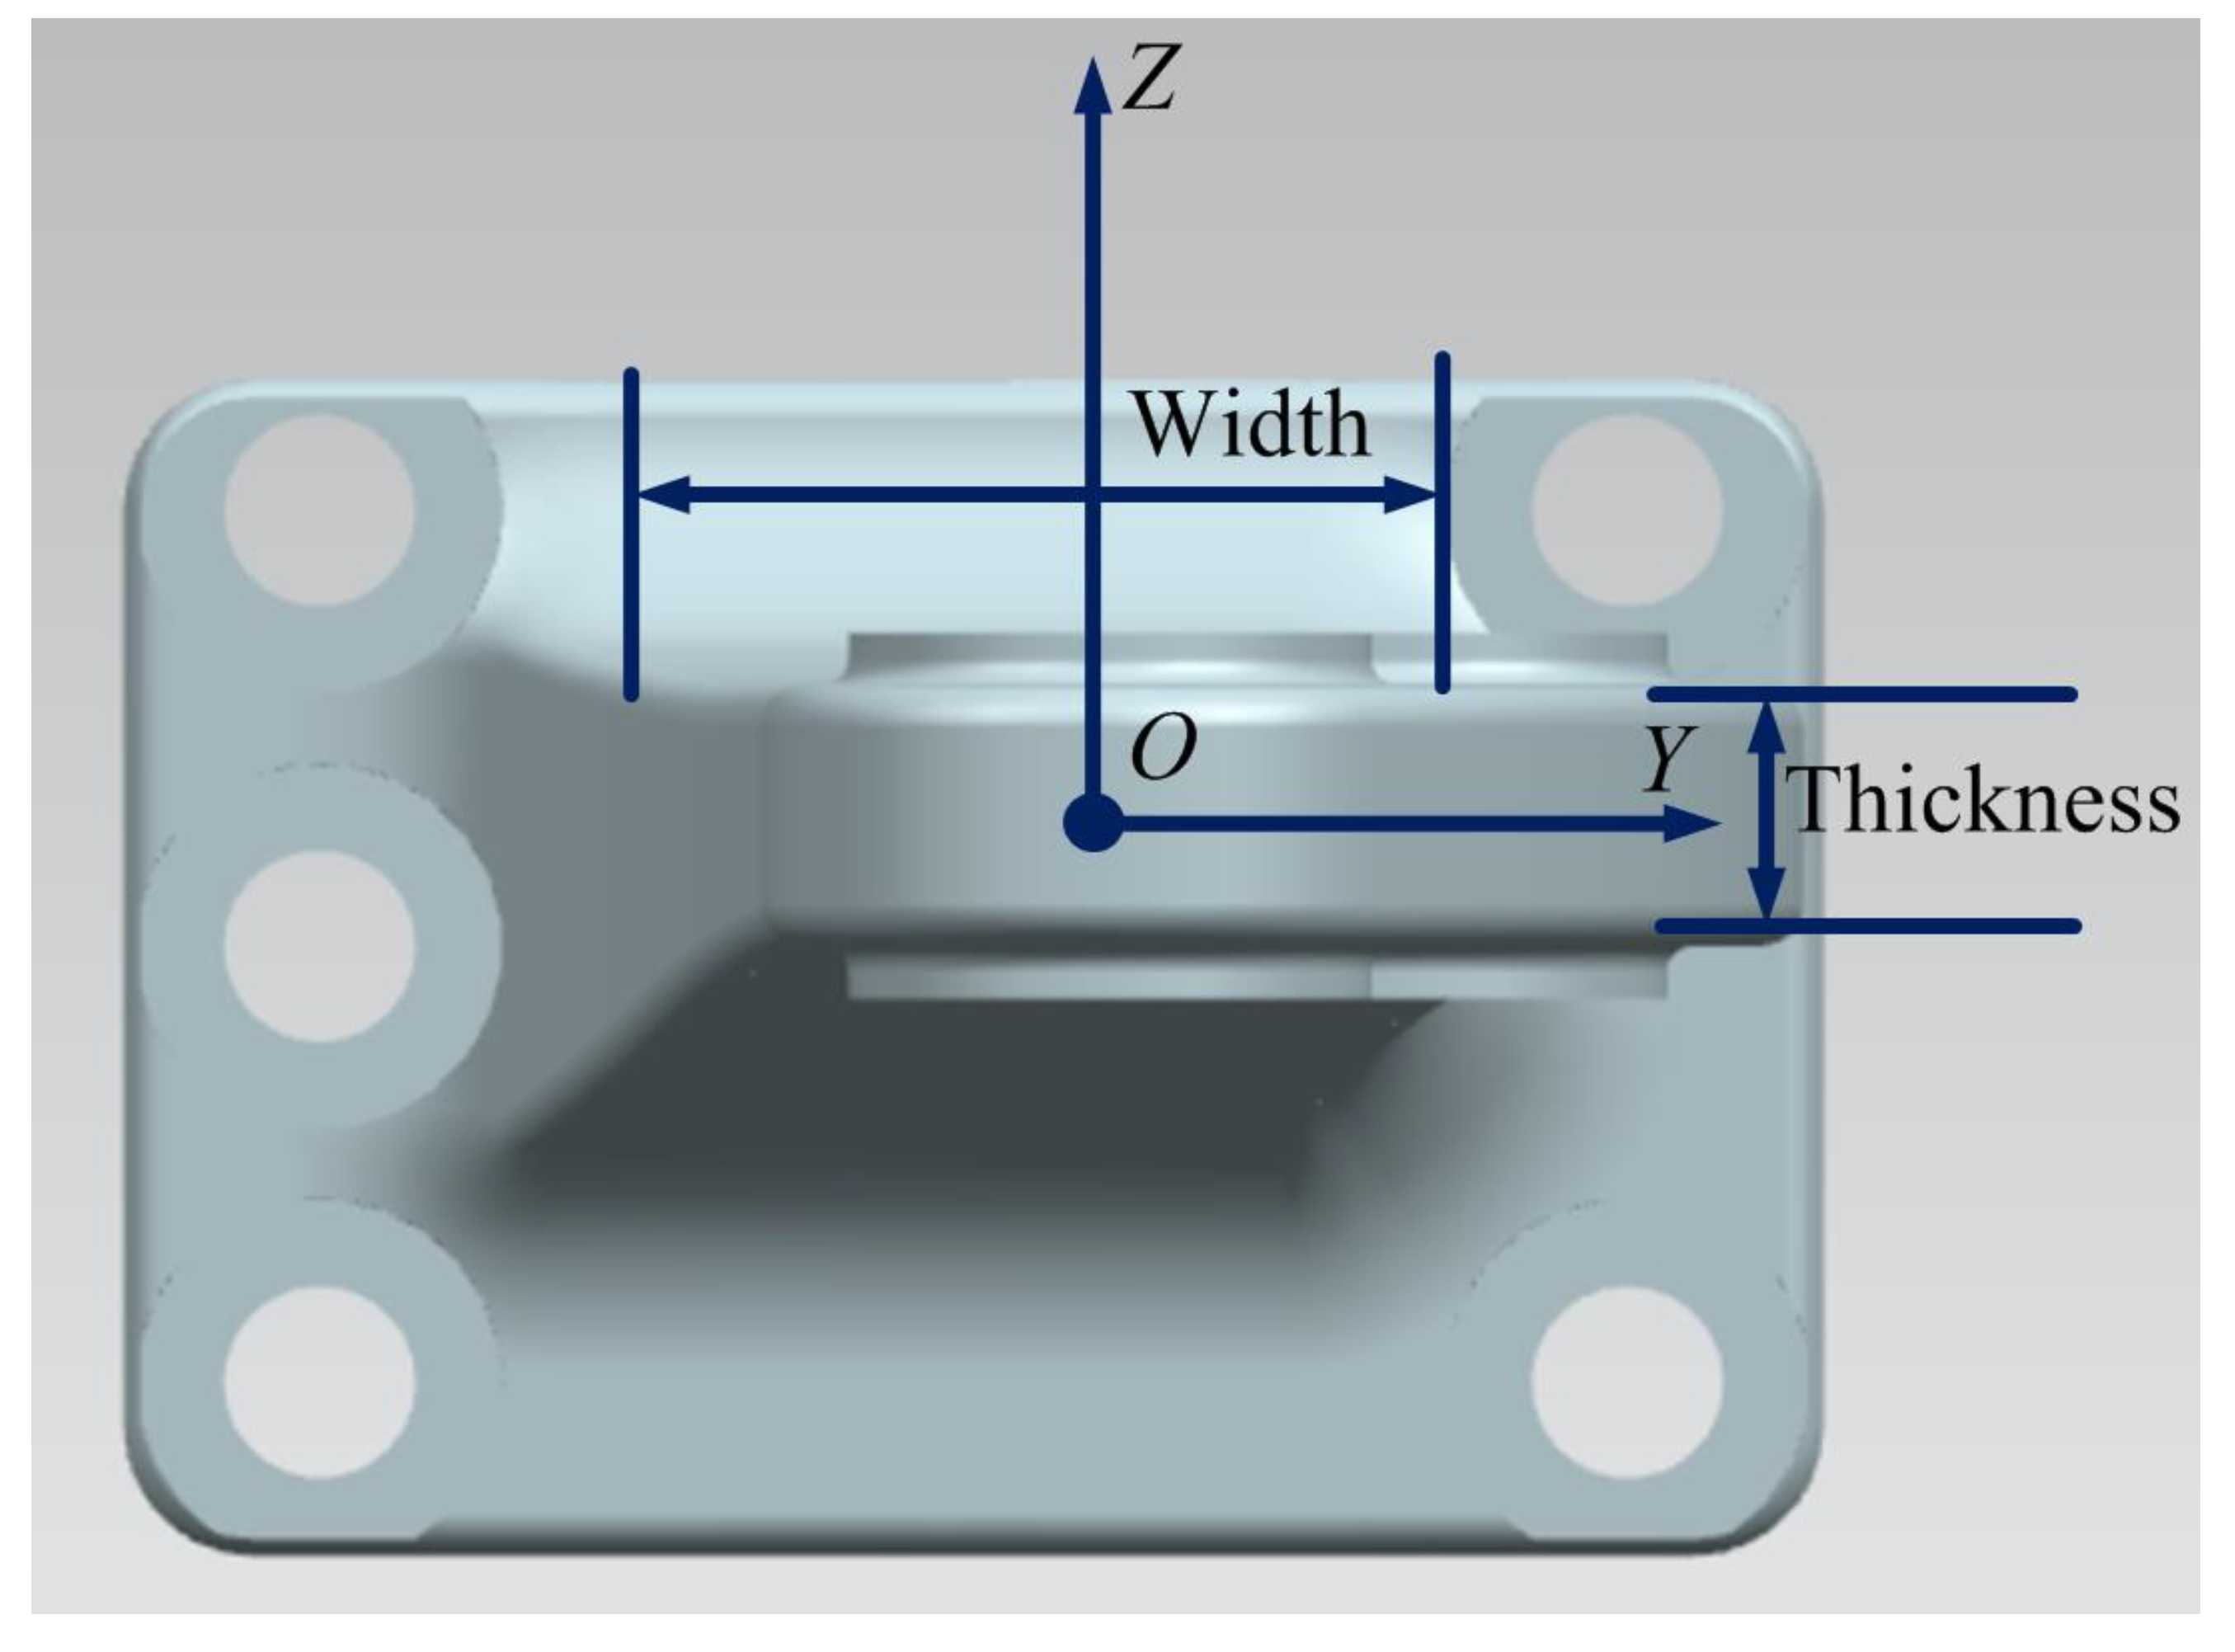
(2) Improvement scheme 2. The scheme increasing the thickness is to augment the moment of inertia of the cross-sectional area about the Z axis, as well as the polar moment of inertia about the X axis, as shown in
Figure 18. However, the enhanced strength based on the scheme is not as evident as augmenting the width (i.e., improvement scheme 3), according to the qualitative analysis from mechanics of materials [
27]. In addition, the scheme will similarly result in the modification of the ball pin, or even a change in position of the spherical joint, and the change may have an adverse effect on the kinematic characteristics.
(3) Improvement scheme 3. The scheme, whose purpose is the same as the improvement scheme 2, is to increase the width, as shown in
Figure 18. However, the kinematic analysis should be conducted to avoid motion interference between the improved steering arm and other parts.
Having a big modification in the steering system, schemes 1 and 2 may be not very applicable in this stage, for the steering arm needs to be replaced fast, but they can be adopted for the development of new vehicle in the near future. To sum up, improvement scheme 3 will be used to enhance the strength of the steering arm in this paper.
6.2. Improved Steering Arm
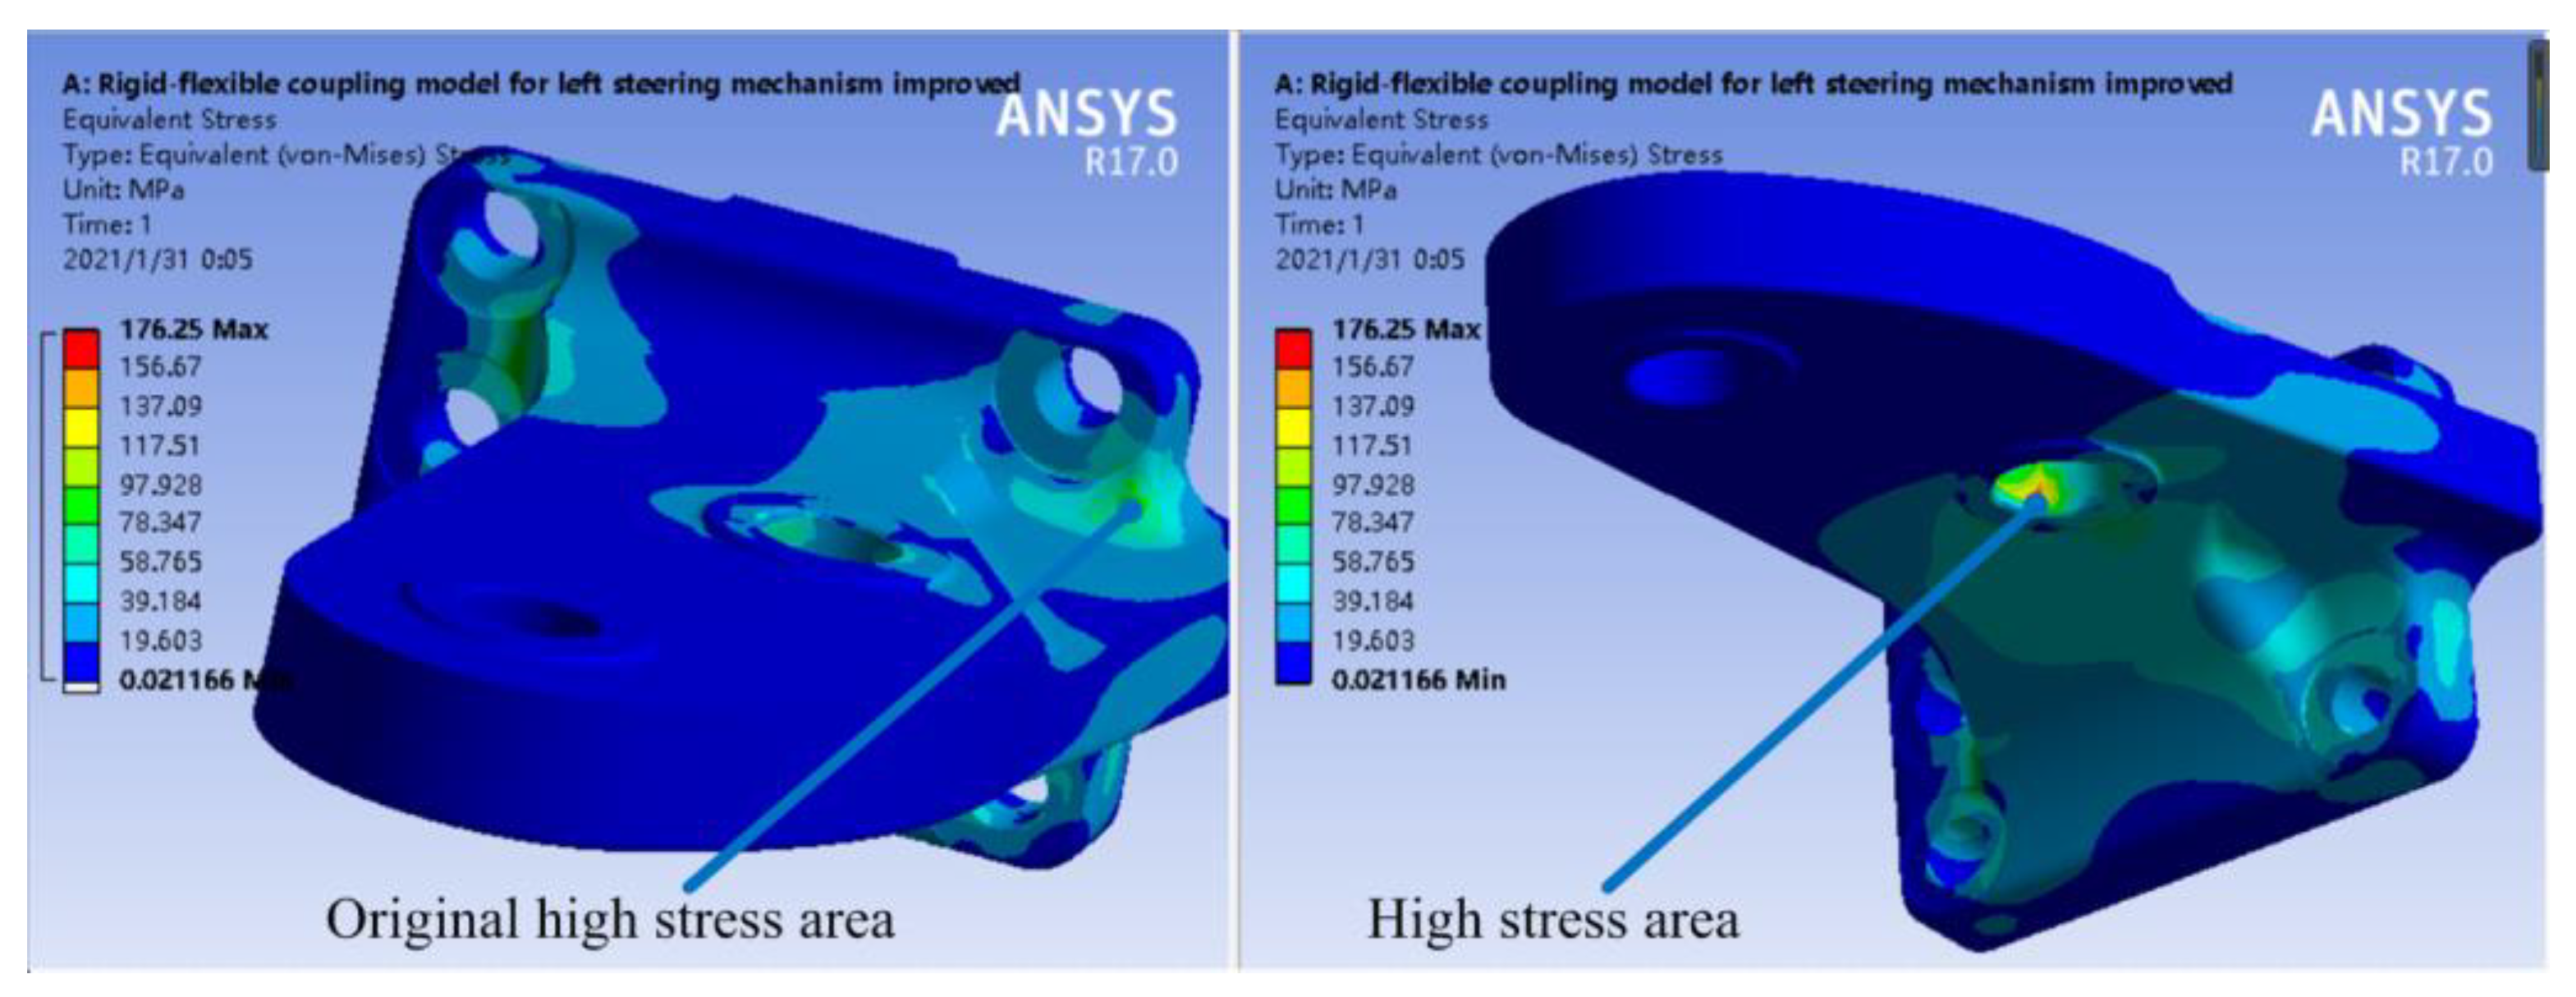
The steering arm has been repeatedly modified to maximize its strength and to avoid the stress concentration and motion interference, and the final improvement is shown in
Figure 19. After the steering arm in the rigid–flexible coupling model mentioned in
Section 4.2 is replaced by the improved one, the Von Mises stress distribution can be obtained by solving the model, as shown in
Figure 19. It can be seen that the maximum Von Mises stress 176.25 MPa is located in the contact area between the steering arm and the ball pin, and the maximum stress on its original high stress area has decreased to around 85 MPa. By comparing the maximum Von Mises stresses on the steering arm improved before and after, it can be seen that the strength of the improved steering arm has nearly doubled. Furthermore, the enhancement in rigidity apparently decreases the stress on the contact area between the steering arm and the ball pin away from fixed end, which satisfies the real condition. The results illustrate that the improved steering arm has a significant enhancement in strength under the extreme conditions (i.e., obstacle’s height 300 mm).
Then, the improved steering arm is manufactured and installed for the kind of mining truck, and the real product is shown in
Figure 20. According to the feedback from the users, there is no fracture of the improved steering arm after it was installed, which illustrates that the issue has been addressed. At present, the improved part has been used for more than half a year without any fault, demonstrating that the current scheme is effective, and the rapid improvement and optimization of the steering arm has been realized.
7. Conclusions
This paper proposes a fast calculation method for improving the steering arm, addressing the issue that it is frequently broken in a kind of mining truck with Macpherson suspension. In the method, stress distribution on the steering arm is obtained by analyzing the force on the tire, calculating the torque on the steering arm, and establishing and solving the rigid–flexible coupling model of the left steering mechanism. The obtained stress results are used to improve the steering arm. The improvement results by using the the fast calculation method illustrate that the strength of the improved steering arm has nearly doubled. The experiment results and the users’ feedback further demonstrate the feasibility and effectiveness of this method.
Most importantly, this method is based on the empirical values of the rolling resistance coefficient and friction coefficient in calculating the torque on the steering arm, and these coefficients are respectively in the two ranges which can partly consider the dynamic characteristics of the tire and road. This handling way can avoid establishing a full vehicle model and only study the left steering mechanism by a static analysis, increasing the efficiency of improving the steering arm.
In fact, the improvement based on the fast calculation method is temporary to rapidly solve the current problem, so that the damaged truck can be put into use as soon as possible. This approach depends largely on the level of engineering experience. It is worth noting that this analytical method agrees well with the experimental results; even the stress distribution is in good agreement. At present, the improved parts have been used for more than half a year without any fault, indicating that the current scheme is effective, and the rapid improvement and optimization of the steering arm has been realized. On the one hand, the experimental results show the correctness of the fast calculation results. On the other hand, the feedback also shows the effectiveness of the improved results, after the improved steering arm is installed into the mining dump truck and run for a period of time. It is sure that the method can provide a reference for the similar parts or mechanisms so as to realize their fast improvement and design.
Author Contributions
Conceptualization: J.W., Q.F., J.Z.; methodology: J.W., Q.F.; formal analysis: Q.F., B.S., J.Z.; supervision: B.S.; project administration: B.S., J.Z.; funding acquisition: B.S.; software: J.W.; validation: J.W.; writing: J.W., Q.F., B.S. All authors have read and agreed to the published version of the manuscript.
Funding
This research was supported in part by the National Key Research and Development Program of China (Grant No. 2019YFB2006404), and in part by the Guangxi science and Technology Major project (Grant Nos. GUIKE AA18242036 and AA18242037).
Institutional Review Board Statement
Not Applicable.
Informed Consent Statement
Not Applicable.
Data Availability Statement
Not Applicable.
Conflicts of Interest
The authors declare no conflict of interest.
References
- Liu, J.; Zhuang, D.J.; Yu, F.; Lou, L.M. Optimized design for a MacPherson strut suspension with side load springs. Int. J. Automot. Technol. 2008, 9, 29–35. [Google Scholar] [CrossRef]
- Fallah, M.S.; Bhat, R.; Xie, W. H robust control of semi-active Macpherson suspension system: New applied design. Veh. Syst. Dyn. 2010, 48, 339–360. [Google Scholar] [CrossRef]
- Reddy, K.V.; Kodati, M.; Chatra, K.; Bandyopadhyay, S. A comprehensive kinematic analysis of the double wishbone and MacPherson strut suspension systems. Mech. Mach. Theory 2016, 105, 441–470. [Google Scholar] [CrossRef]
- Choi, B.C.; Cho, S.; Kim, C.-W. Kriging Model Based Optimization of MacPherson Strut Suspension for Minimizing Side Load using Flexible Multi-Body Dynamics. Int. J. Precis. Eng. Manuf. 2018, 19, 873–879. [Google Scholar] [CrossRef]
- Niu, Z.; Jin, S.; Li, Z. Assembly Variation Analysis of Incompletely Positioned Macpherson Suspension Systems Considering Vehicle Load Change. J. Mech. Des. 2021, 143, 052001. [Google Scholar] [CrossRef]
- Dinh, H.T.; Tuan-Duong, T.; Van-Nhu, T. Saturated RISE Feedback Control for Uncertain Nonlinear MacPherson Active Suspension System to Improve Ride Comfort. J. Dyn. Syst. Meas. Control 2021, 143, 011004. [Google Scholar] [CrossRef]
- Grujicic, M.; Arakere, G.; Nallagatla, H.; Bell, W.C.; Haque, I. Computational investigation of blast survivability and off-road performance of an up-armoured high-mobility multi-purpose wheeled vehicle. Proc. Inst. Mech. Eng. Part D J. Automob. Eng. 2009, 223, 301–325. [Google Scholar] [CrossRef]
- Hameed, A.; Zubair, O.; Shams, T.A.; Mehmood, Z.; Javed, A.; Mehmood, Z. Failure analysis of a broken support strut of an aircraft landing gear. Eng. Fail. Anal. 2020, 117, 104847. [Google Scholar] [CrossRef]
- Jia, H.; Wu, K.; Wang, Y.; Sun, Y. Conveyor belt structure of belt dryer: Analysis and optimization. Eng. Fail. Anal. 2020, 115, 104686. [Google Scholar] [CrossRef]
- Rane, A.K.; Kumar, S.; Maheshwari, S. Literature Review on Analysis of Wheel Loader and Its Various Components. Mater. Today Proc. 2018, 5, 19049–19055. [Google Scholar] [CrossRef]
- Song, C.Y.; Lee, J. Strength design of a knuckle component using moving least-squares response-surface-based approximate optimization methods. Proc. Inst. Mech. Eng. Part D J. Automob. Eng. 2009, 223, 1019–1032. [Google Scholar] [CrossRef]
- Chen, Y.; Huang, H.; Weng, C. Failure analysis of a re-design knuckle using topology optimization. Mech. Sci. 2019, 10, 465–473. [Google Scholar] [CrossRef]
- Pacejka, H.B. Tire and Vehicle Dynamics, 3rd ed.; Butterworth-Heinemann: Oxford, UK, 2012; pp. 5–6. [Google Scholar]
- Adams/Tire User’s Manual; MSC Software Corporation: Santa Ana, CA, USA, 2013.
- Albinsson, A.; Bruzelius, F.; Jacobson, B.; Ran, S. Validation of vehicle-based tyre testing methods. Proc. Inst. Mech. Eng. Part D J. Automob. Eng. 2019, 233, 18–27. [Google Scholar] [CrossRef]
- Kim, K.J. Light-weight design and fatigue characteristics of automotive knuckle by using finite element analysis. J. Mec. Sci. Technol. 2021, 35, 2989–2995. [Google Scholar] [CrossRef]
- Kashyzadeh, K.R. Effects of Axial and Multiaxial Variable Amplitude Loading Conditions on the Fatigue Life Assessment of Automotive Steering Knuckle. J. Fail. Anal. Prev. 2020, 20, 455–463. [Google Scholar] [CrossRef]
- Pugazhenthi, R.; Anbuchezhiyan, G.; Muthuraman, R.K.; Vignesh, M.; Ponshanmugakumar, A. Optimization of fatigue life and fractography analysis of knuckle joint. Mater. Today Proc. 2021, 46, 4344–4348. [Google Scholar] [CrossRef]
- Liu, H.; Wang, J.; Fang, S.; Li, S. Strength Analysis and Fatigue Life Prediction on Steering Knuckle. In Proceedings of the 2016 2nd Workshop on Advanced Research and Technology in Industry Applications, Dalian, China, 14–15 May 2016; Volume 81, pp. 1392–1395. [Google Scholar]
- Chen, K.Y.; Beale, D.G. Base dynamic parameter estimation of a MacPherson suspension mechanism. Veh. Syst. Dyn. 2003, 39, 227–244. [Google Scholar] [CrossRef]
- Shojaeefard, M.H.; Khalkhali, A.; Yarmohammadisatri, S. An efficient sensitivity analysis method for modified geometry of Macpherson suspension based on Pearson correlation coefficient. Veh. Syst. Dyn. 2017, 55, 827–852. [Google Scholar] [CrossRef]
- Guo, J.; Li, K.; Luo, Y. Coordinated Control of Autonomous Four Wheel Drive Electric Vehicles for Platooning and Trajectory Tracking Using a Hierarchical Architecture. J. Dyn. Syst. Meas. Control 2015, 137, 101001. [Google Scholar] [CrossRef]
- Gillespie, T. Fundamentals of Vehicle Dynamics; Society of Automotive Engineers, Inc: Warrendale, PA, USA, 2000. [Google Scholar]
- Lin, Y.; Yu, F. Vehicle System Dynamics, 2nd ed.; China Machine Press: Beijing, China, 2017. [Google Scholar]
- Gu, Z.; Mi, C.; Wang, Y.; Jiang, J. A-type frame fatigue life estimation of a mining dump truck based on modal stress recovery method. Eng. Fail. Anal. 2012, 26, 89–99. [Google Scholar] [CrossRef]
- Freddi, A.; Olmi, G.; Cristofolini, L. Experimental Stress Analysis for Materials and Structures; Springer: Cham, Switherland, 2015. [Google Scholar]
- Anthony, B.; Kenneth, M.L. Mechanics of Materials; Springer: Cham, Switherland, 2020. [Google Scholar]
Figure 1.
Framework of the paper.
Figure 1.
Framework of the paper.
Figure 2.
Macpherson suspension system integrated the steering mechanism.
Figure 2.
Macpherson suspension system integrated the steering mechanism.
Figure 3.
Fractured steering arm.
Figure 3.
Fractured steering arm.
Figure 4.
Force analysis on the tire.
Figure 4.
Force analysis on the tire.
Figure 5.
Torque on the steering arm with different rolling resistance coefficients and friction coefficients.
Figure 5.
Torque on the steering arm with different rolling resistance coefficients and friction coefficients.
Figure 6.
Relationship between the torque on the steering arm and the height of the obstacle.
Figure 6.
Relationship between the torque on the steering arm and the height of the obstacle.
Figure 7.
Left steering mechanism.
Figure 7.
Left steering mechanism.
Figure 8.
Rigid–flexible coupling model of the left steering mechanism.
Figure 8.
Rigid–flexible coupling model of the left steering mechanism.
Figure 9.
Von Mises stress distribution on the steering arm.
Figure 9.
Von Mises stress distribution on the steering arm.
Figure 10.
Stress test of the front axle system.
Figure 10.
Stress test of the front axle system.
Figure 11.
Test road for the mining truck.
Figure 11.
Test road for the mining truck.
Figure 12.
Test points on the steering arm.
Figure 12.
Test points on the steering arm.
Figure 13.
Strain responses on the steering arm.
Figure 13.
Strain responses on the steering arm.
Figure 14.
Responses of the maximum principal stress on test points 1 and 2.
Figure 14.
Responses of the maximum principal stress on test points 1 and 2.
Figure 15.
Amplitude spectra of the maximum principal stress on test points 1 and 2.
Figure 15.
Amplitude spectra of the maximum principal stress on test points 1 and 2.
Figure 16.
Stress distribution of the maximum principal stress on the steering arm.
Figure 16.
Stress distribution of the maximum principal stress on the steering arm.
Figure 17.
Improvement scheme 1.
Figure 17.
Improvement scheme 1.
Figure 18.
Improvement schemes 2 and 3.
Figure 18.
Improvement schemes 2 and 3.
Figure 19.
Von Mises stress distribution on the improved steering arm.
Figure 19.
Von Mises stress distribution on the improved steering arm.
Figure 20.
Real product of the improved steering arm.
Figure 20.
Real product of the improved steering arm.
Table 1.
Parameters of the truck.
Table 1.
Parameters of the truck.
| Symbols | Value | Unit |
|---|
| R | 774 | mm |
| h | 300 | mm |
| Fz | 127.4 | kN |
| L1 | 329.68 | mm |
| L2 | 611.88 | mm |
| fr | 0.025~0.15 | — |
| μ | 0.4~0.65 | — |
Table 2.
Material property of the steering arm.
Table 2.
Material property of the steering arm.
| Material Designation | Material Density | Elastic Modulus | Poisson’s Ratio | Yield Strength | Ultimate Strength |
|---|
| ZG28NiMnA | 7800 kg/m3 | 190 GPa | 0.28 | 270 MPa | 500 MPa |
Table 3.
The statistics of the maximum principal stress on test points 1 and 2.
Table 3.
The statistics of the maximum principal stress on test points 1 and 2.
| | Maximum | Minimum | RMS | Mean | Variance |
|---|
| Point 1 (MPa) | 279.13 | 154.77 | 221.46 | 220.61 | 19.45 |
| Point 2 (MPa) | 44.48 | -41.31 | 13.74 | 3.77 | 13.21 |
| Publisher’s Note: MDPI stays neutral with regard to jurisdictional claims in published maps and institutional affiliations. |
© 2021 by the authors. Licensee MDPI, Basel, Switzerland. This article is an open access article distributed under the terms and conditions of the Creative Commons Attribution (CC BY) license (https://creativecommons.org/licenses/by/4.0/).


