
Failure of Rock Slope with Heterogeneous Locked Patches: Insights from Numerical Modelling


Abstract
:1. Introduction
2. Brief Description of RFPA and Numerical Model
3. Numerical Results
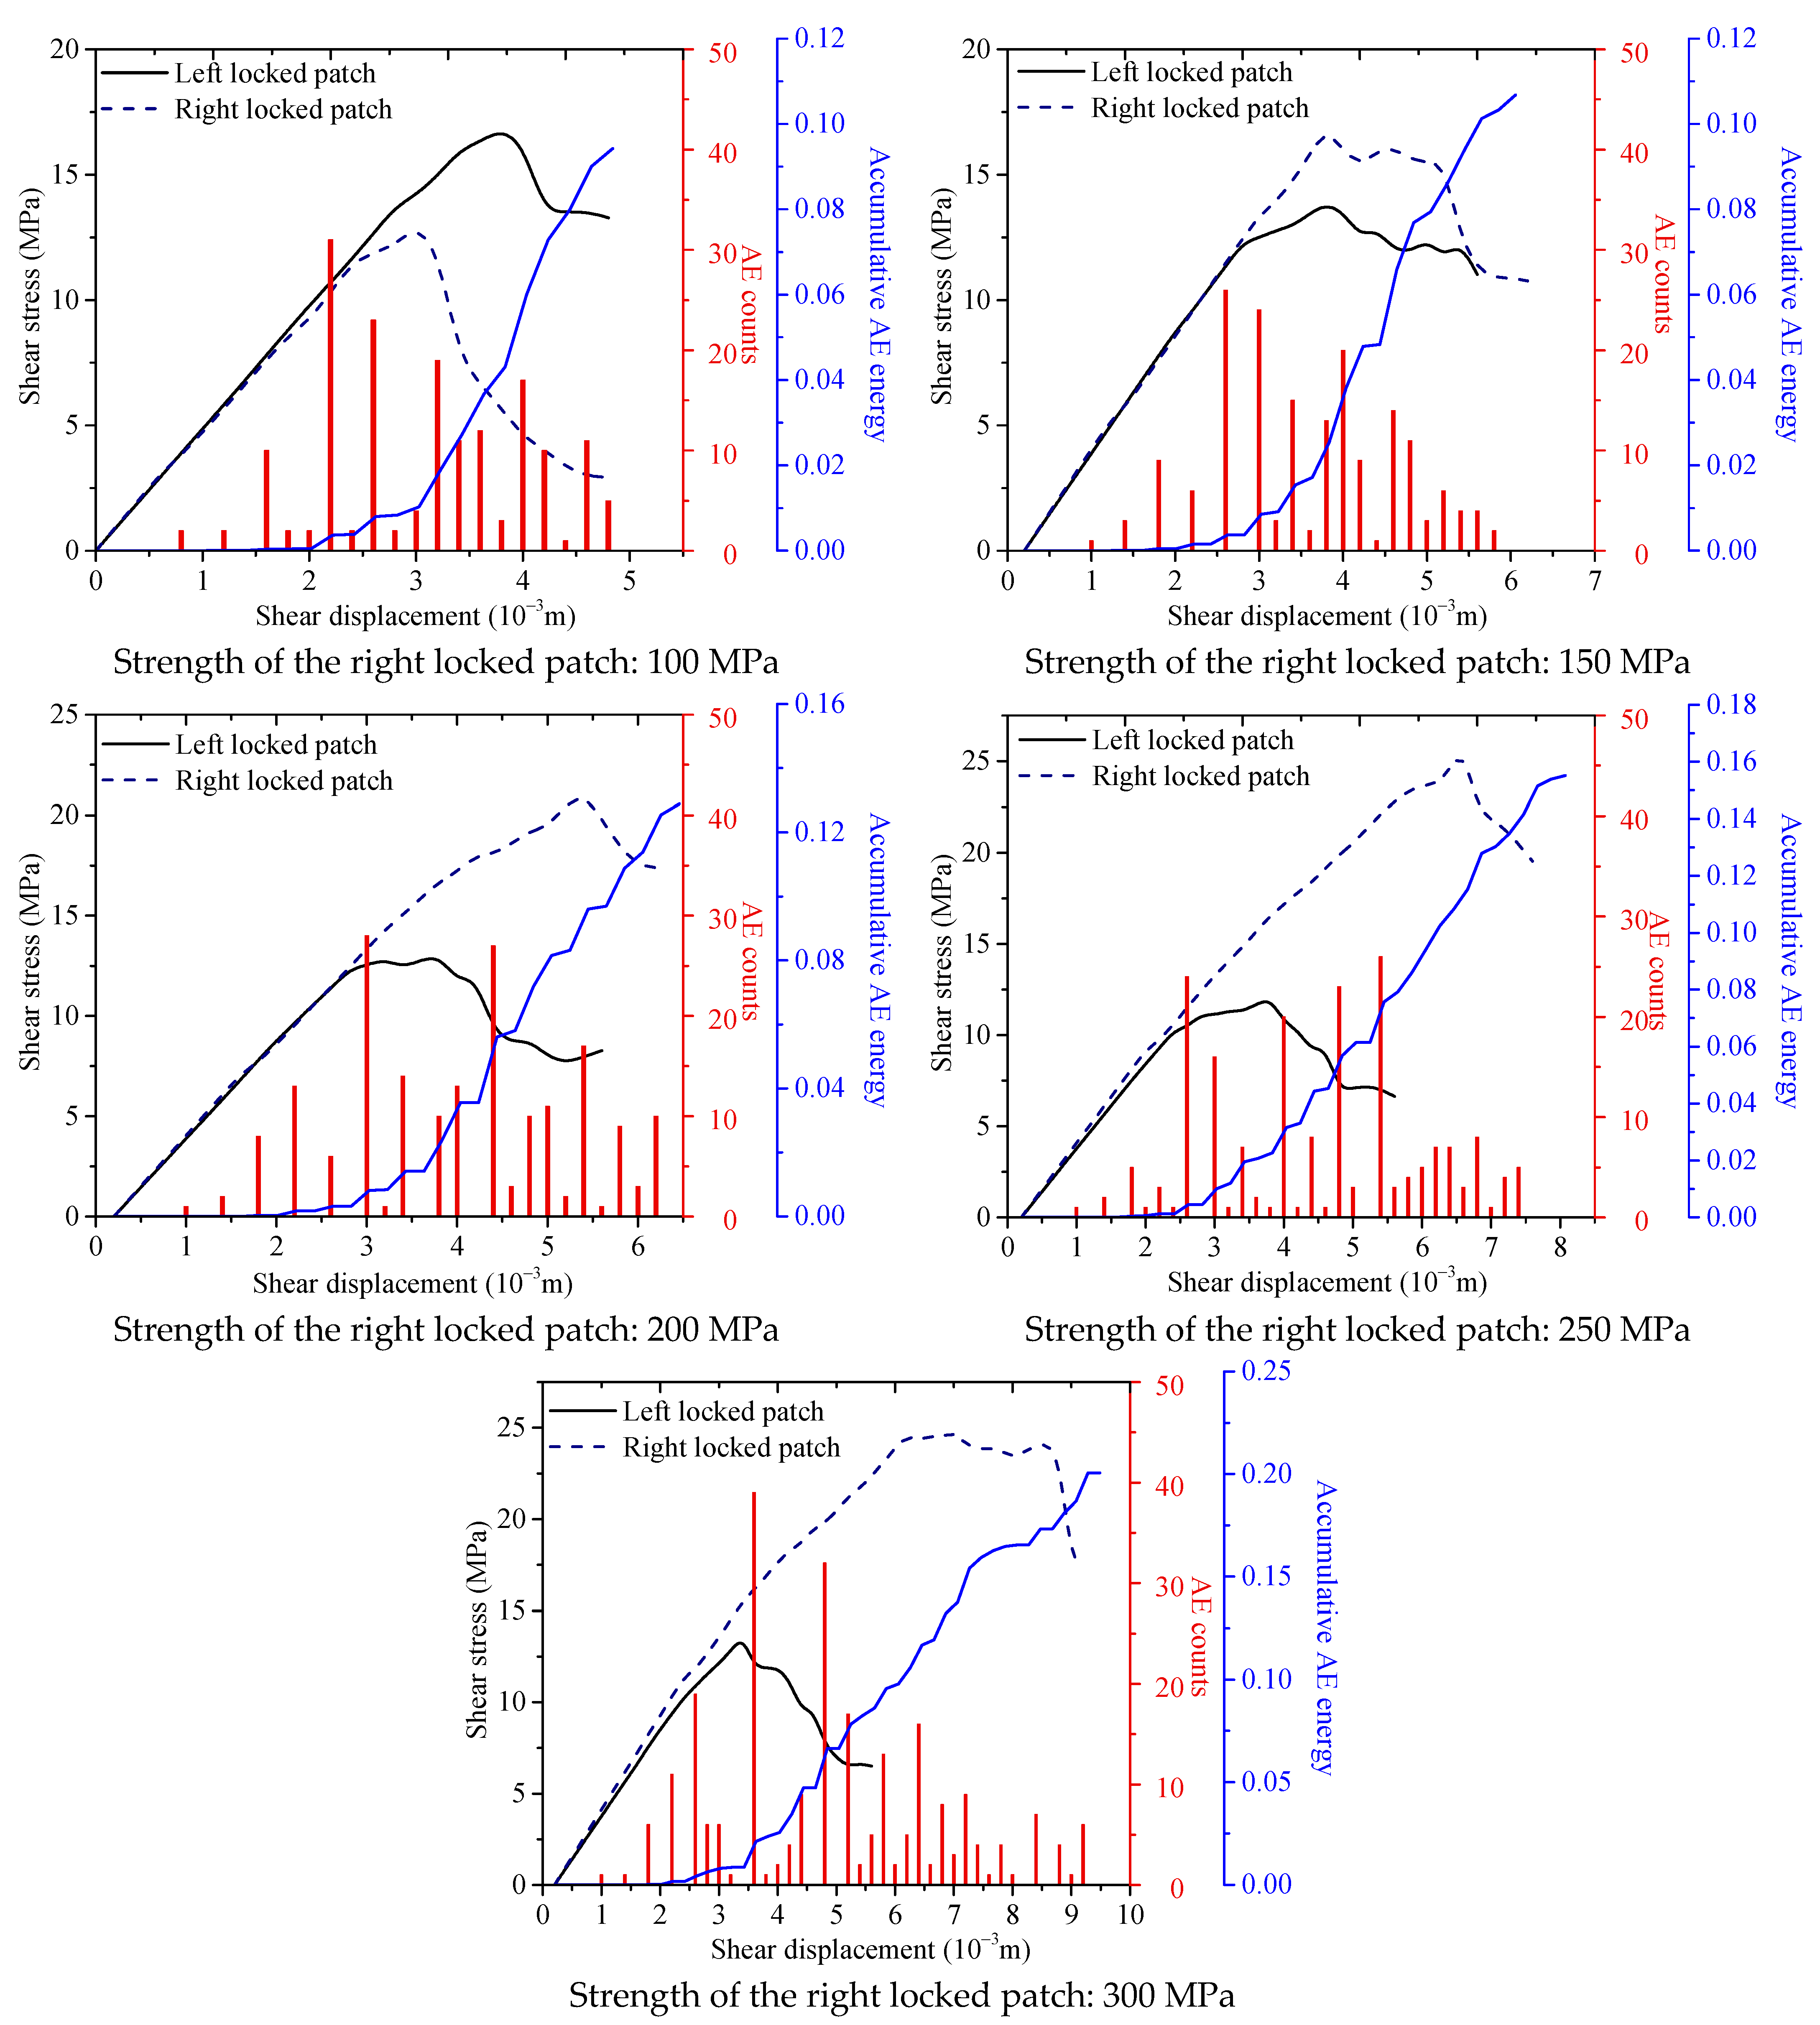
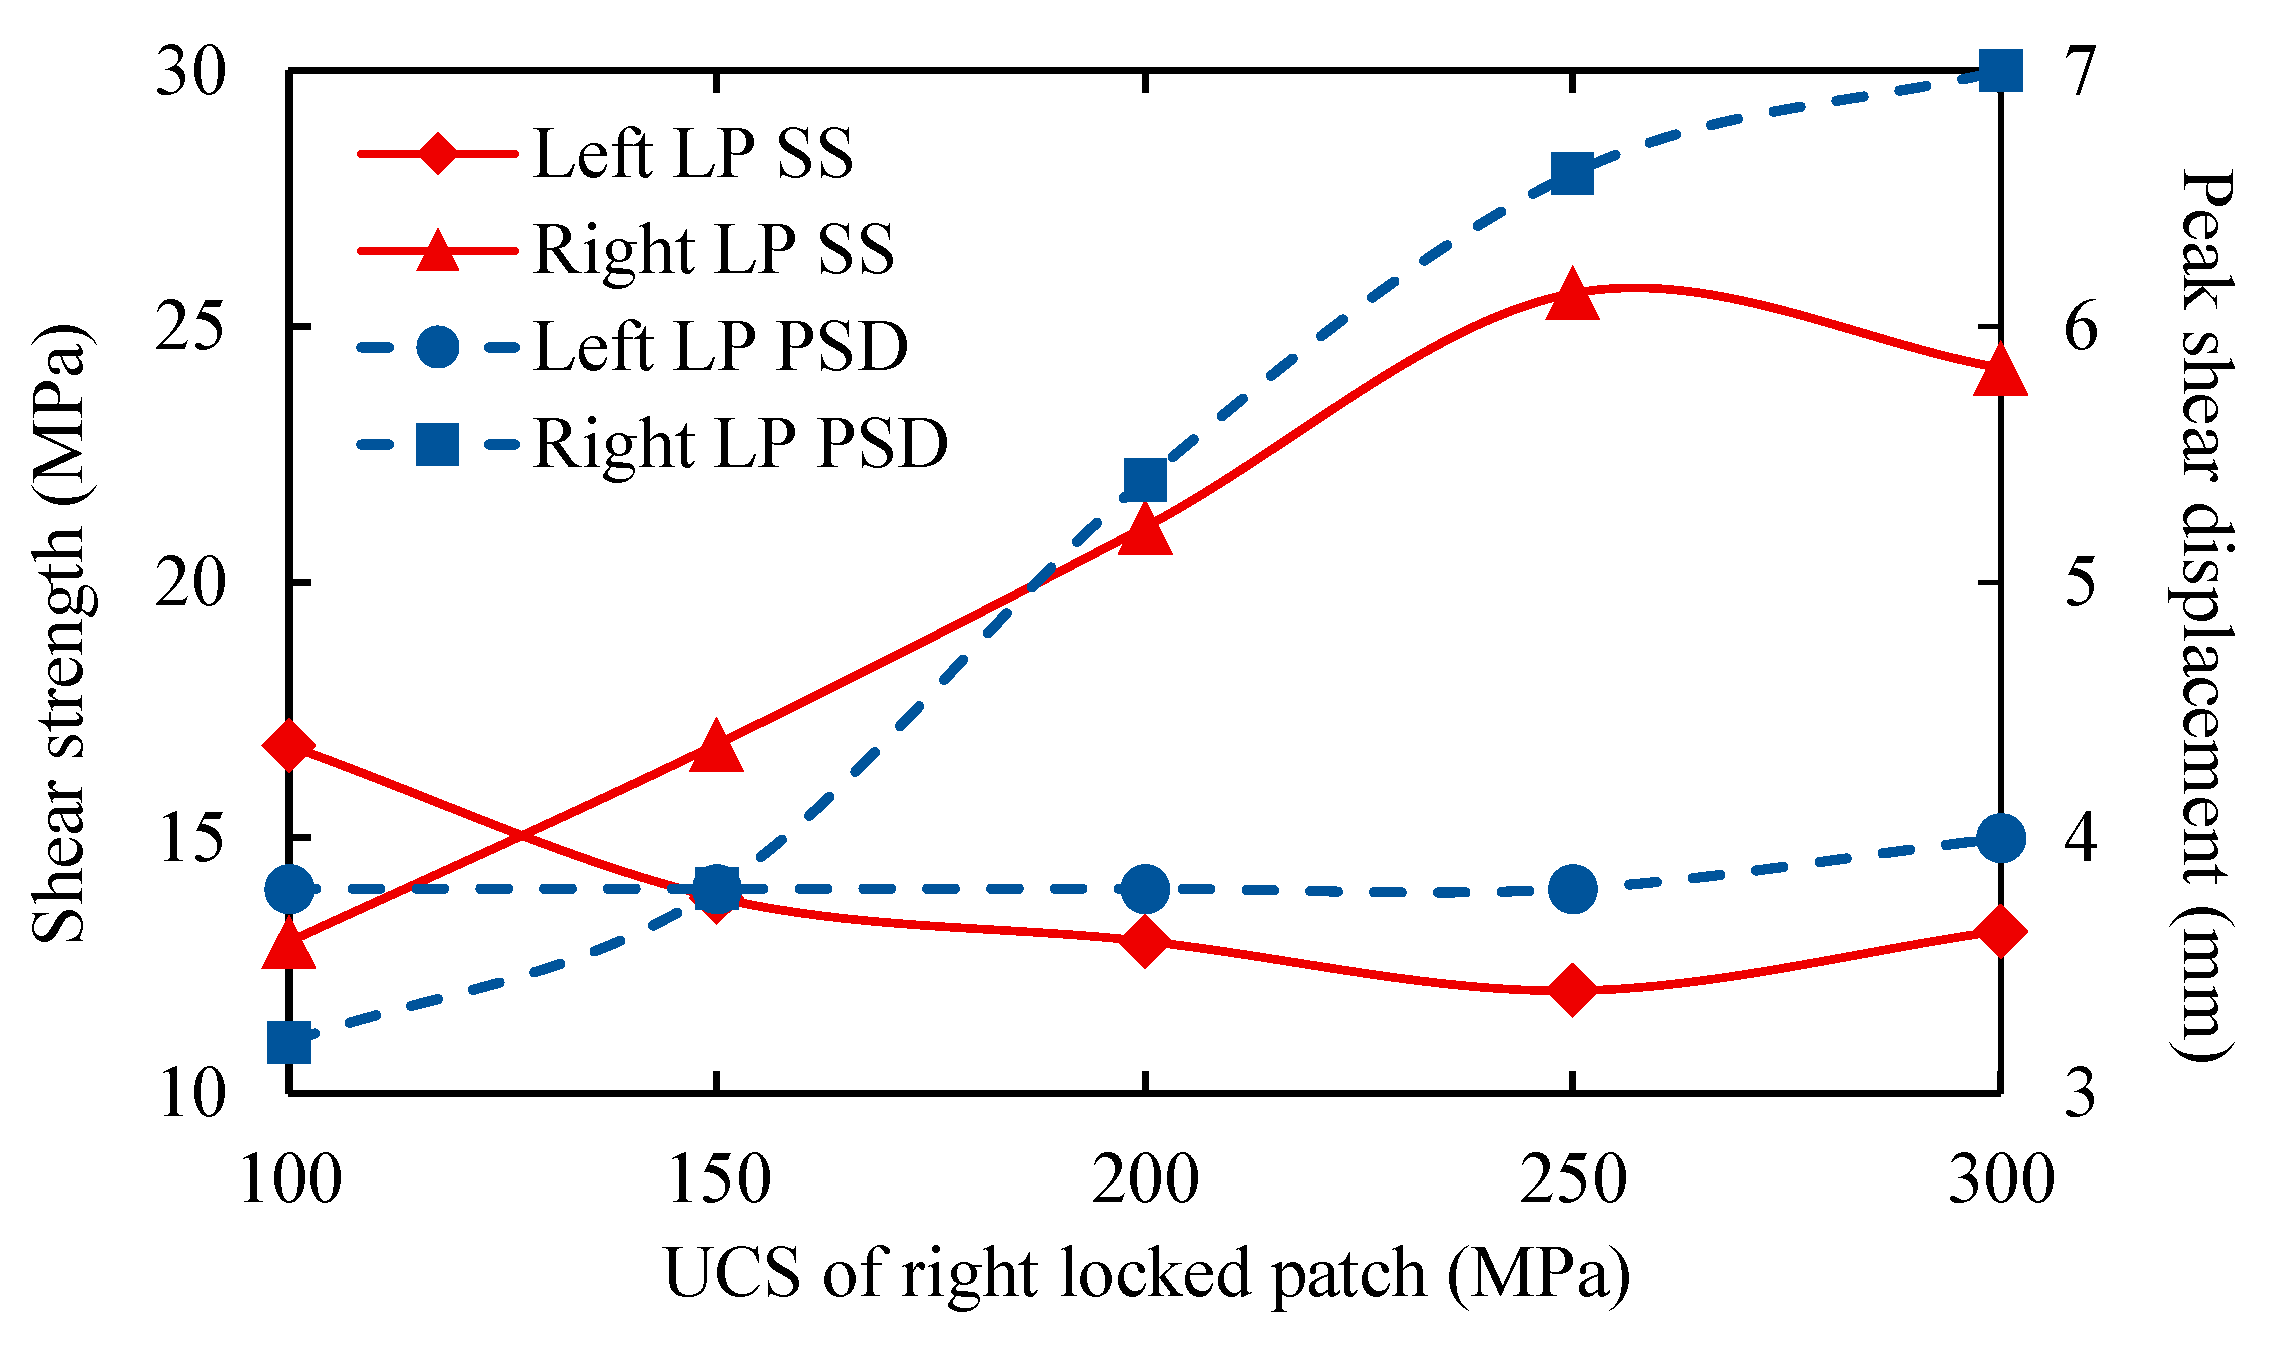
3.1. Strength Effect
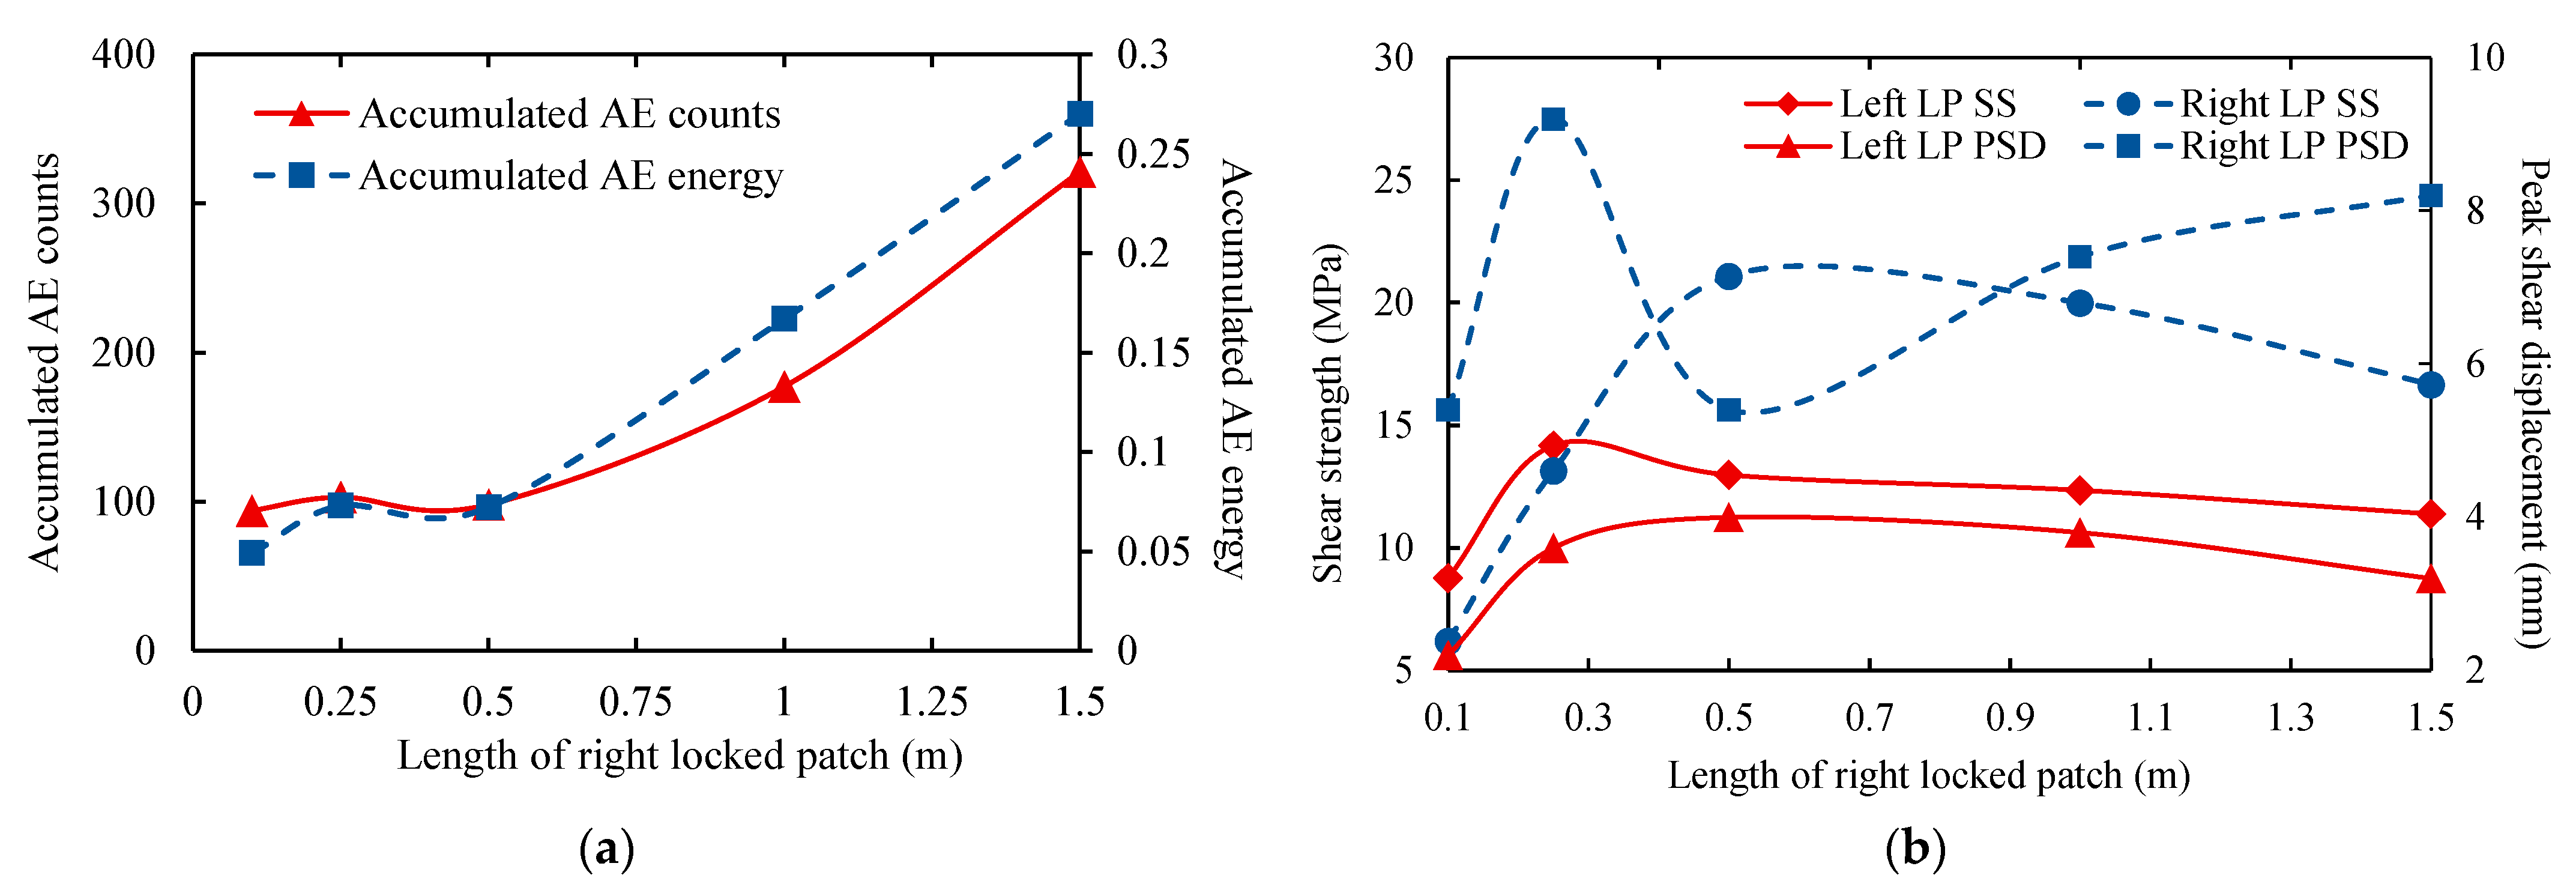
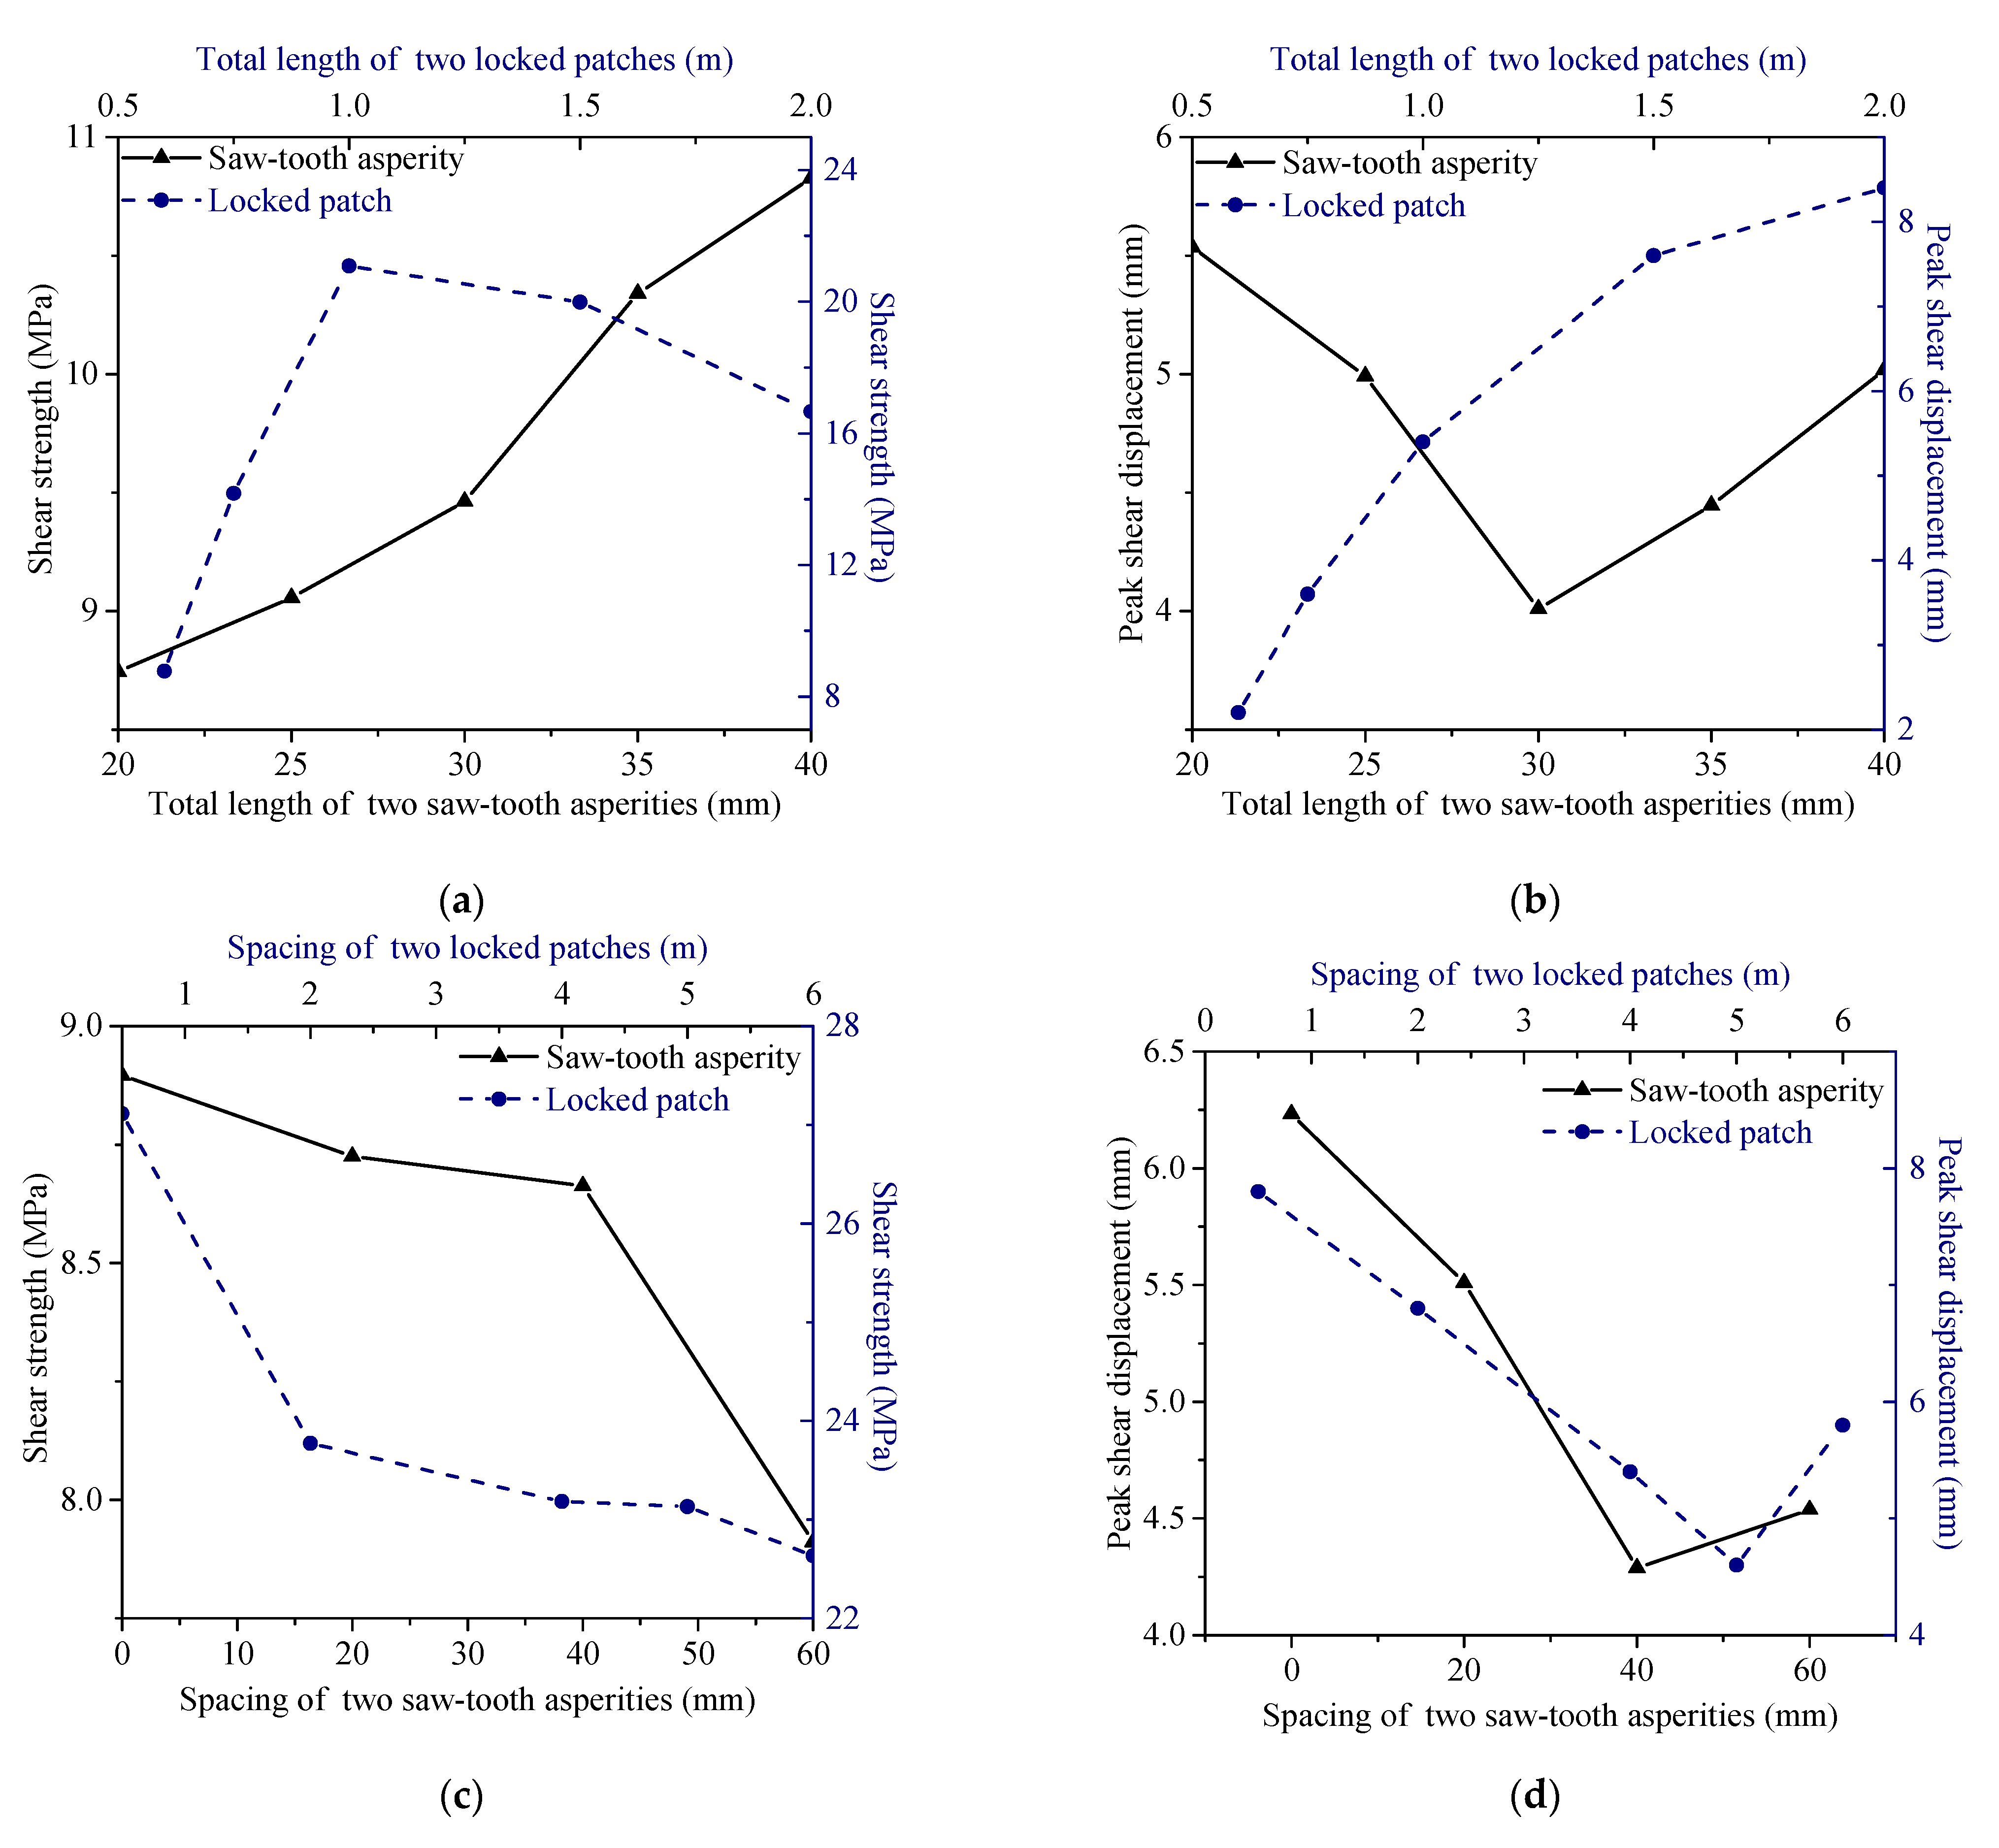
3.2. Length Effect
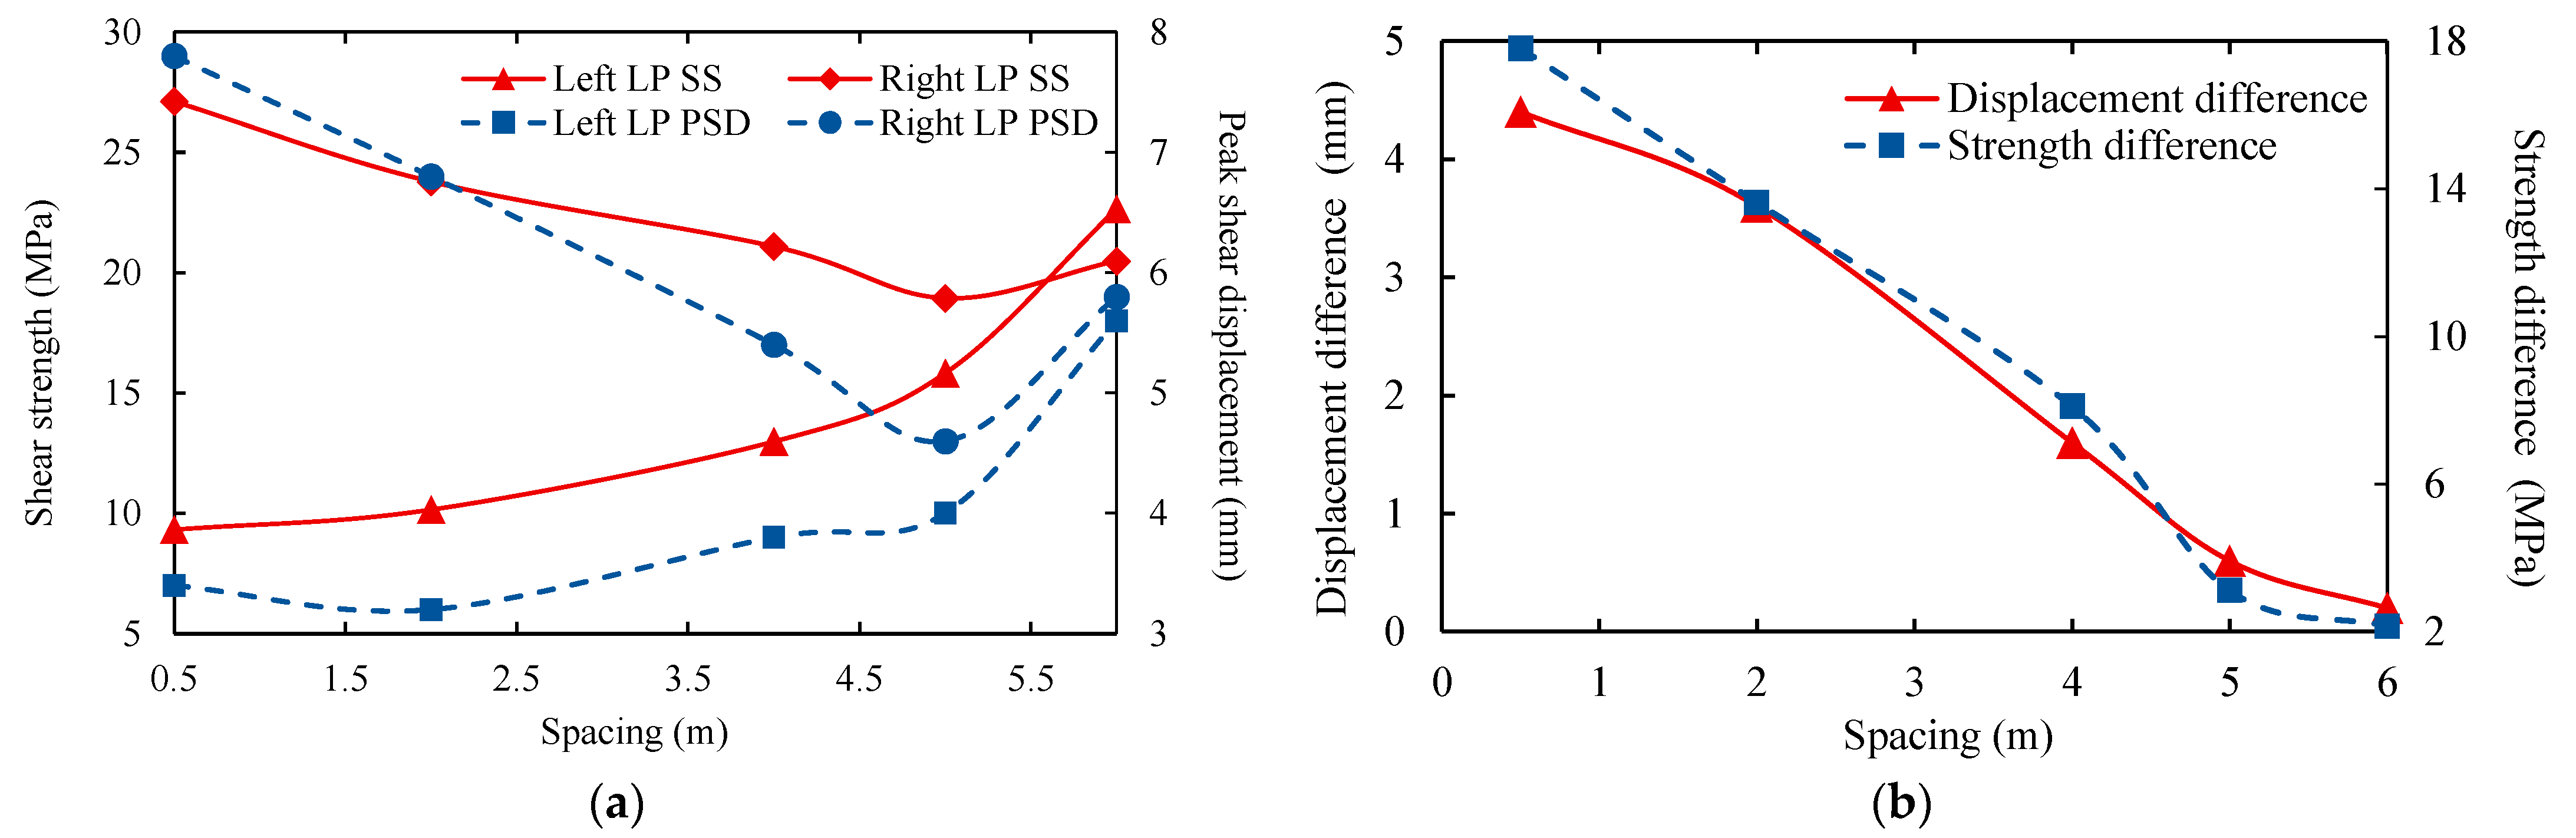
3.3. Spacing Effect
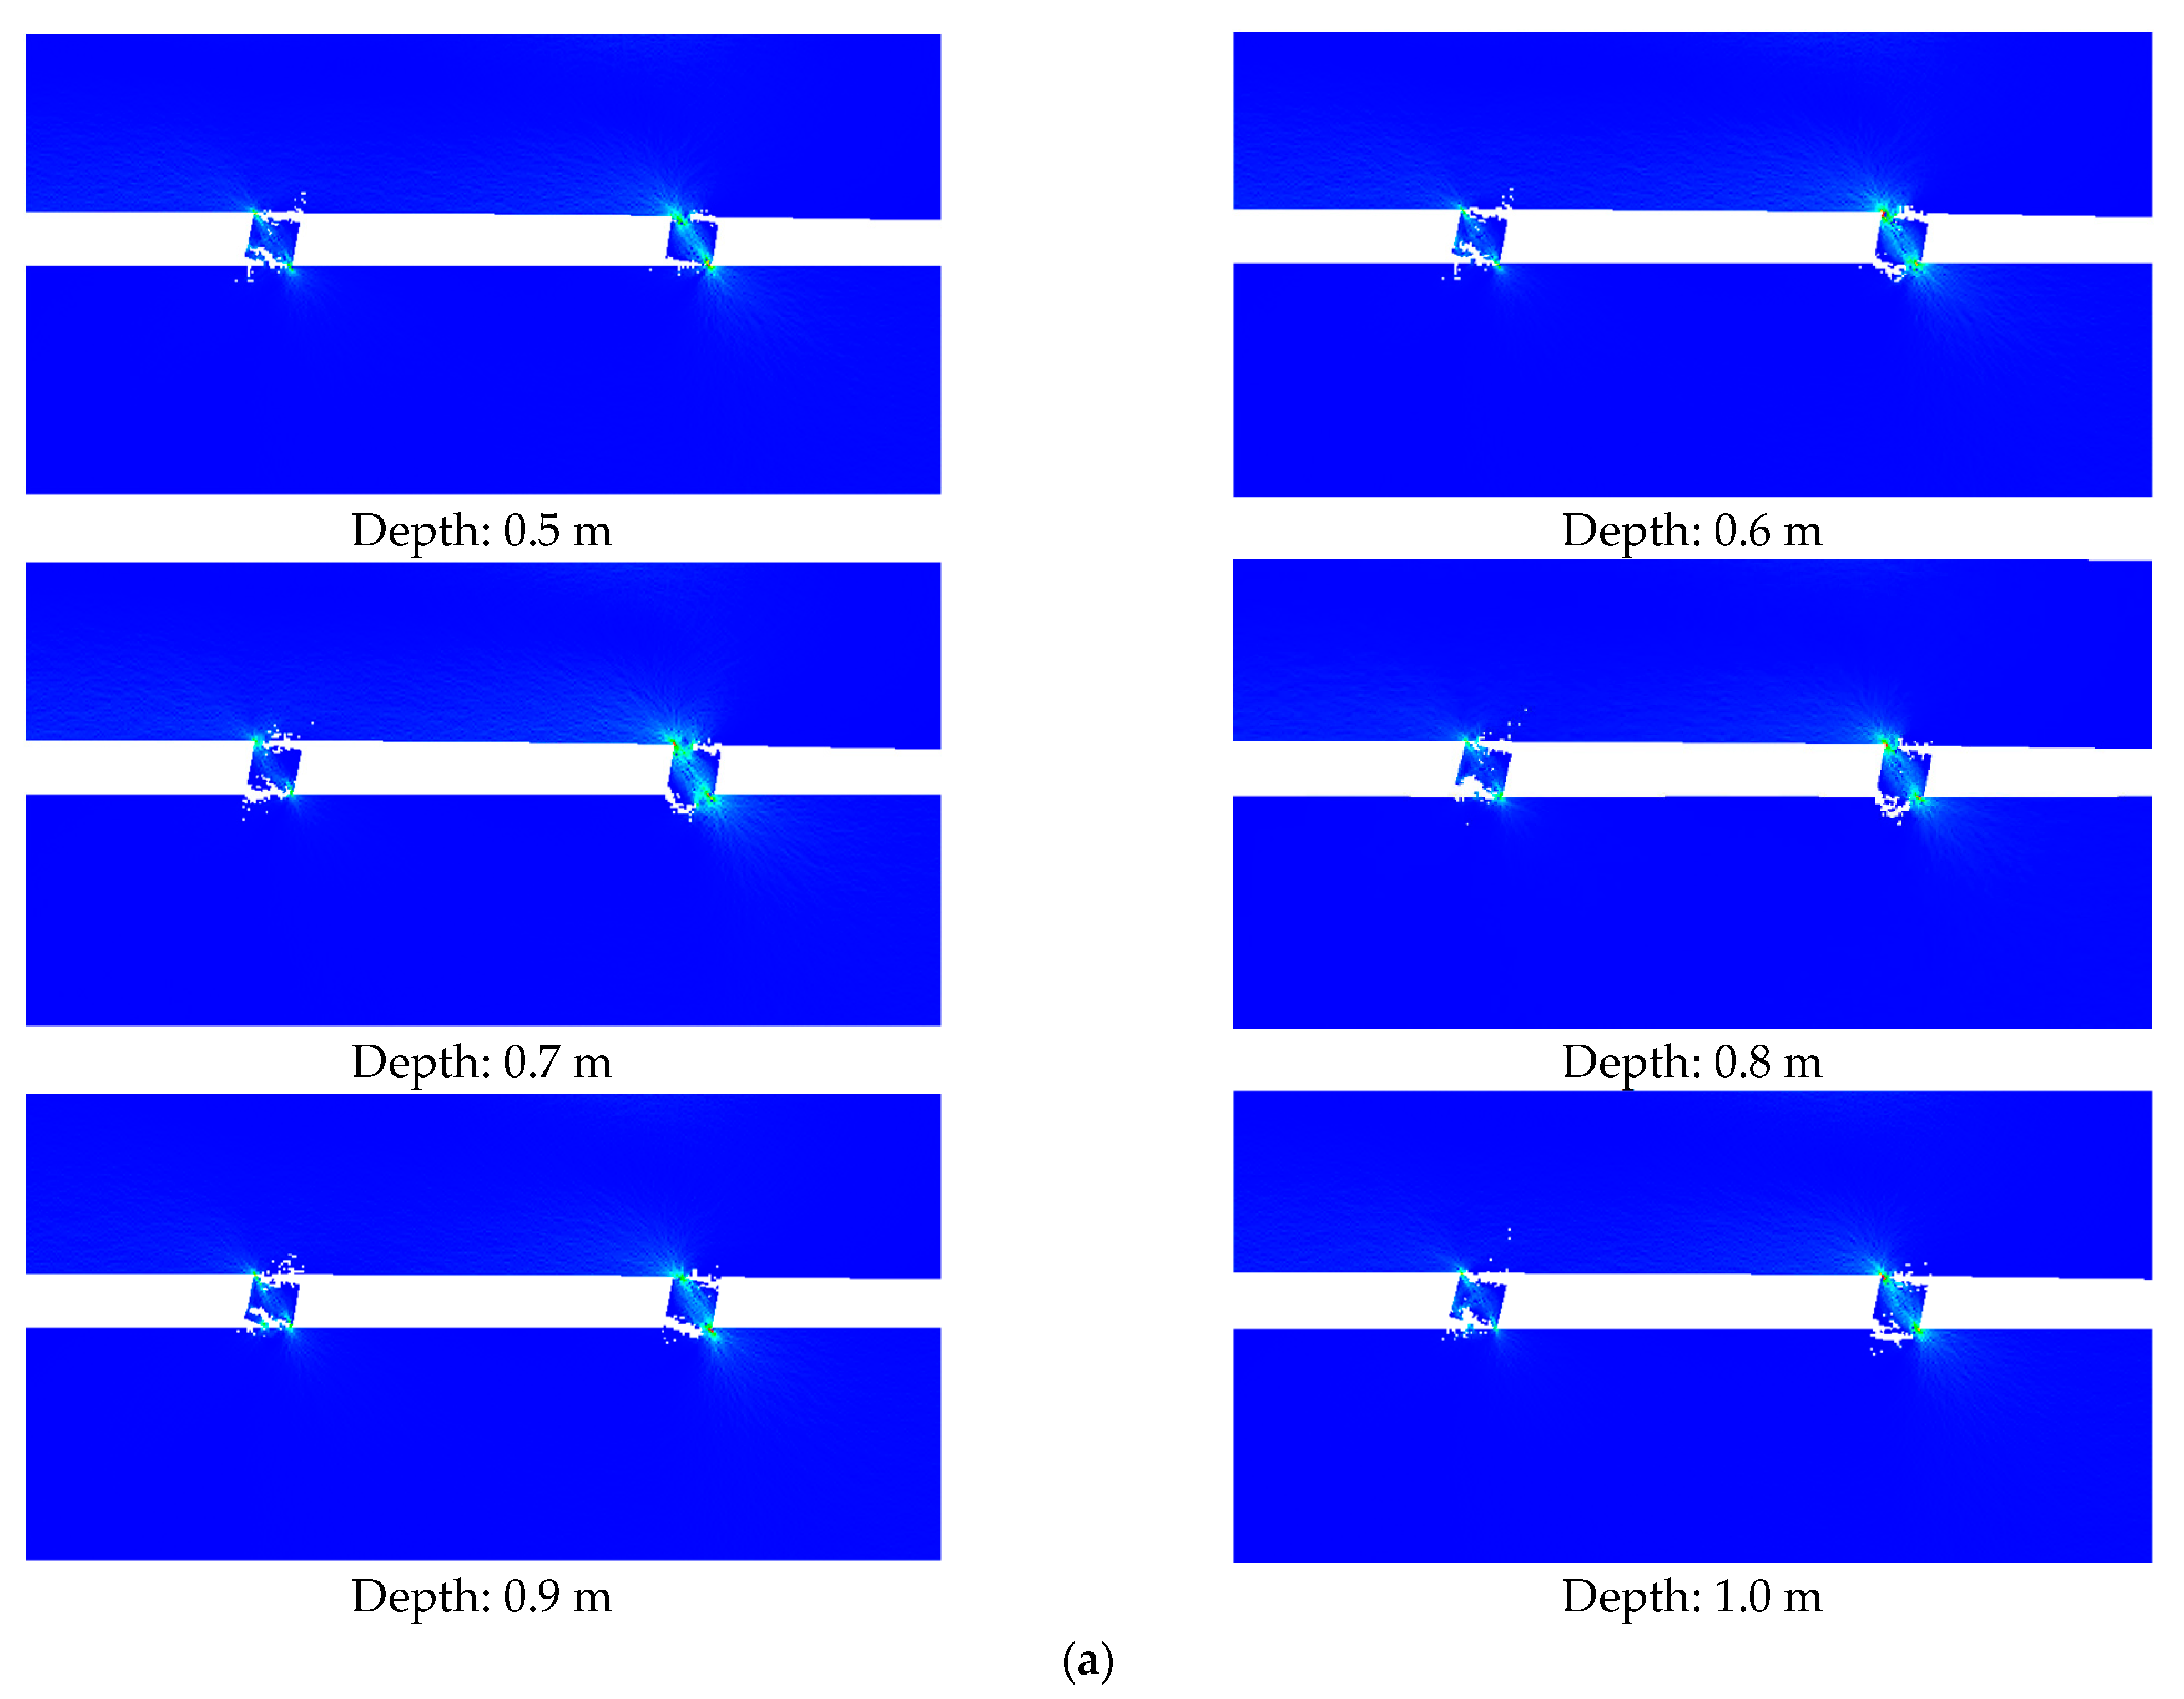
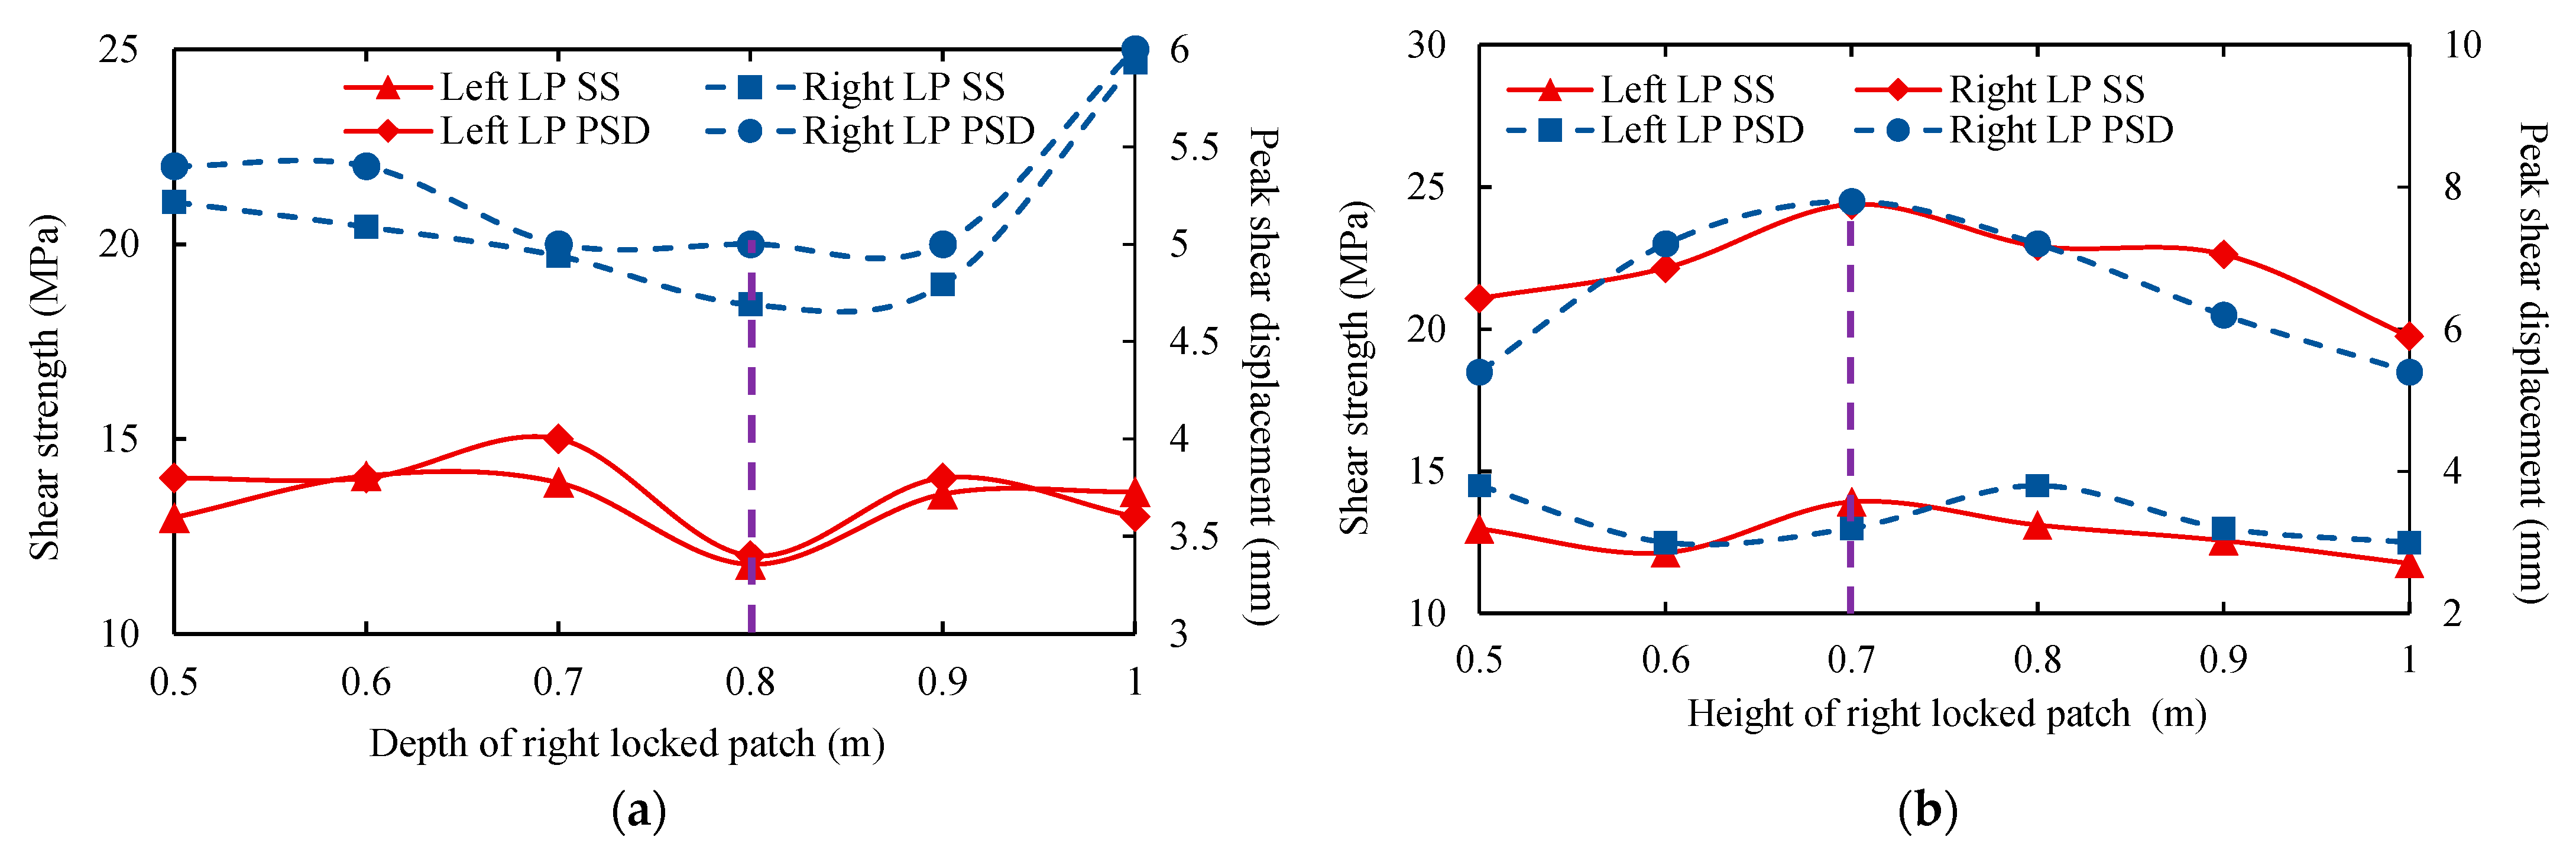
3.4. Depth Effect
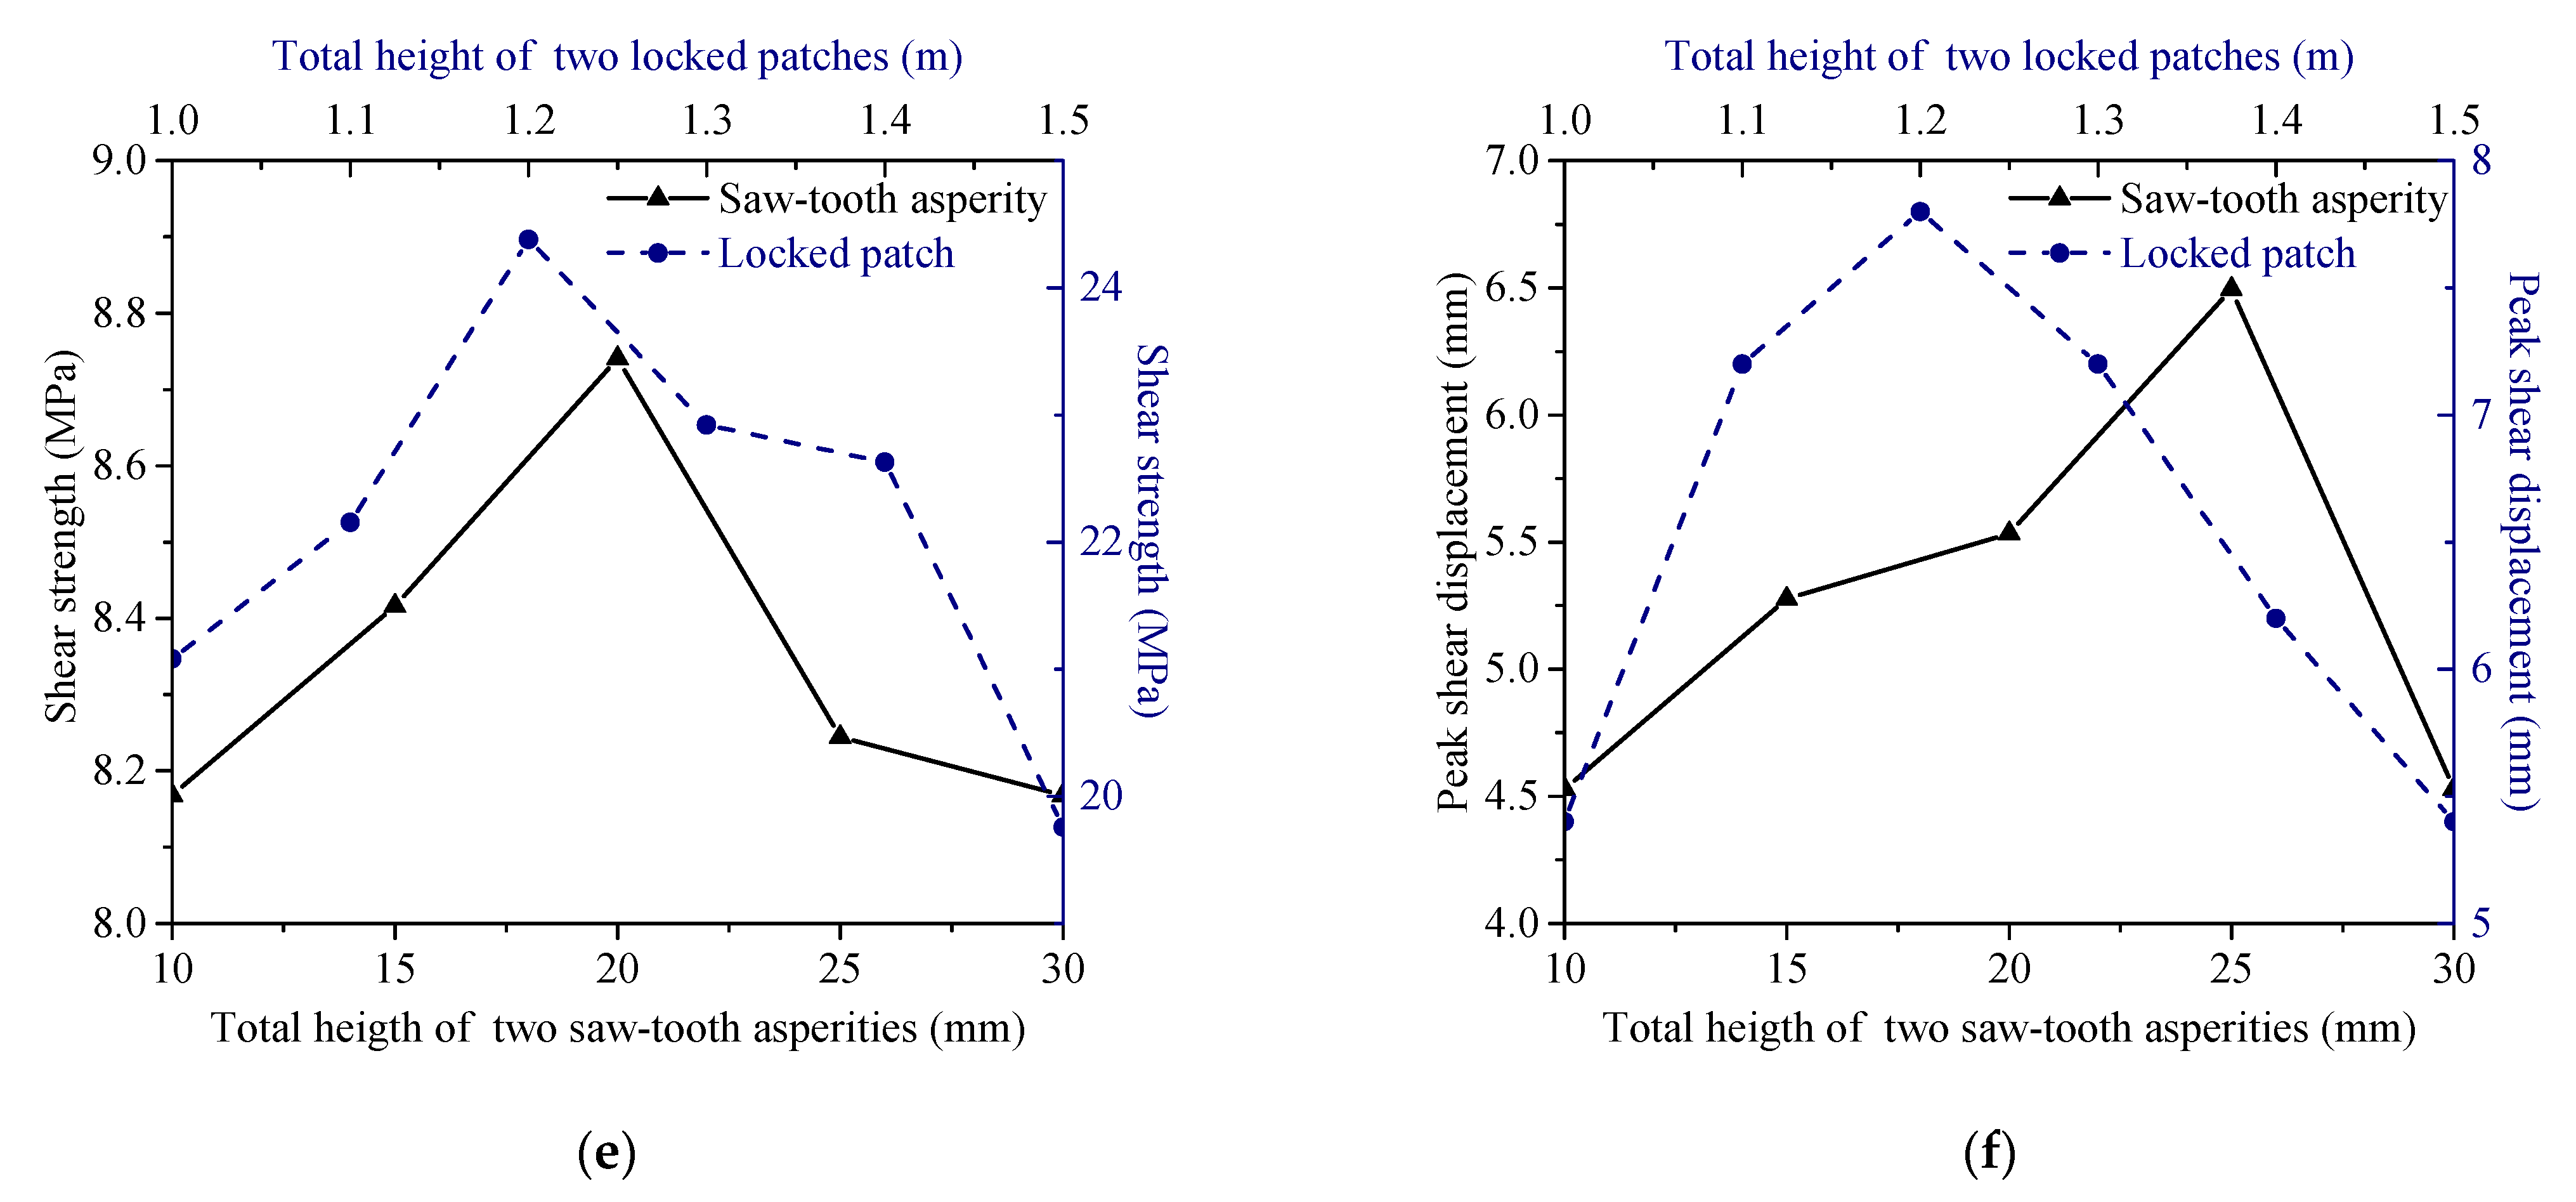
3.5. Height Effect
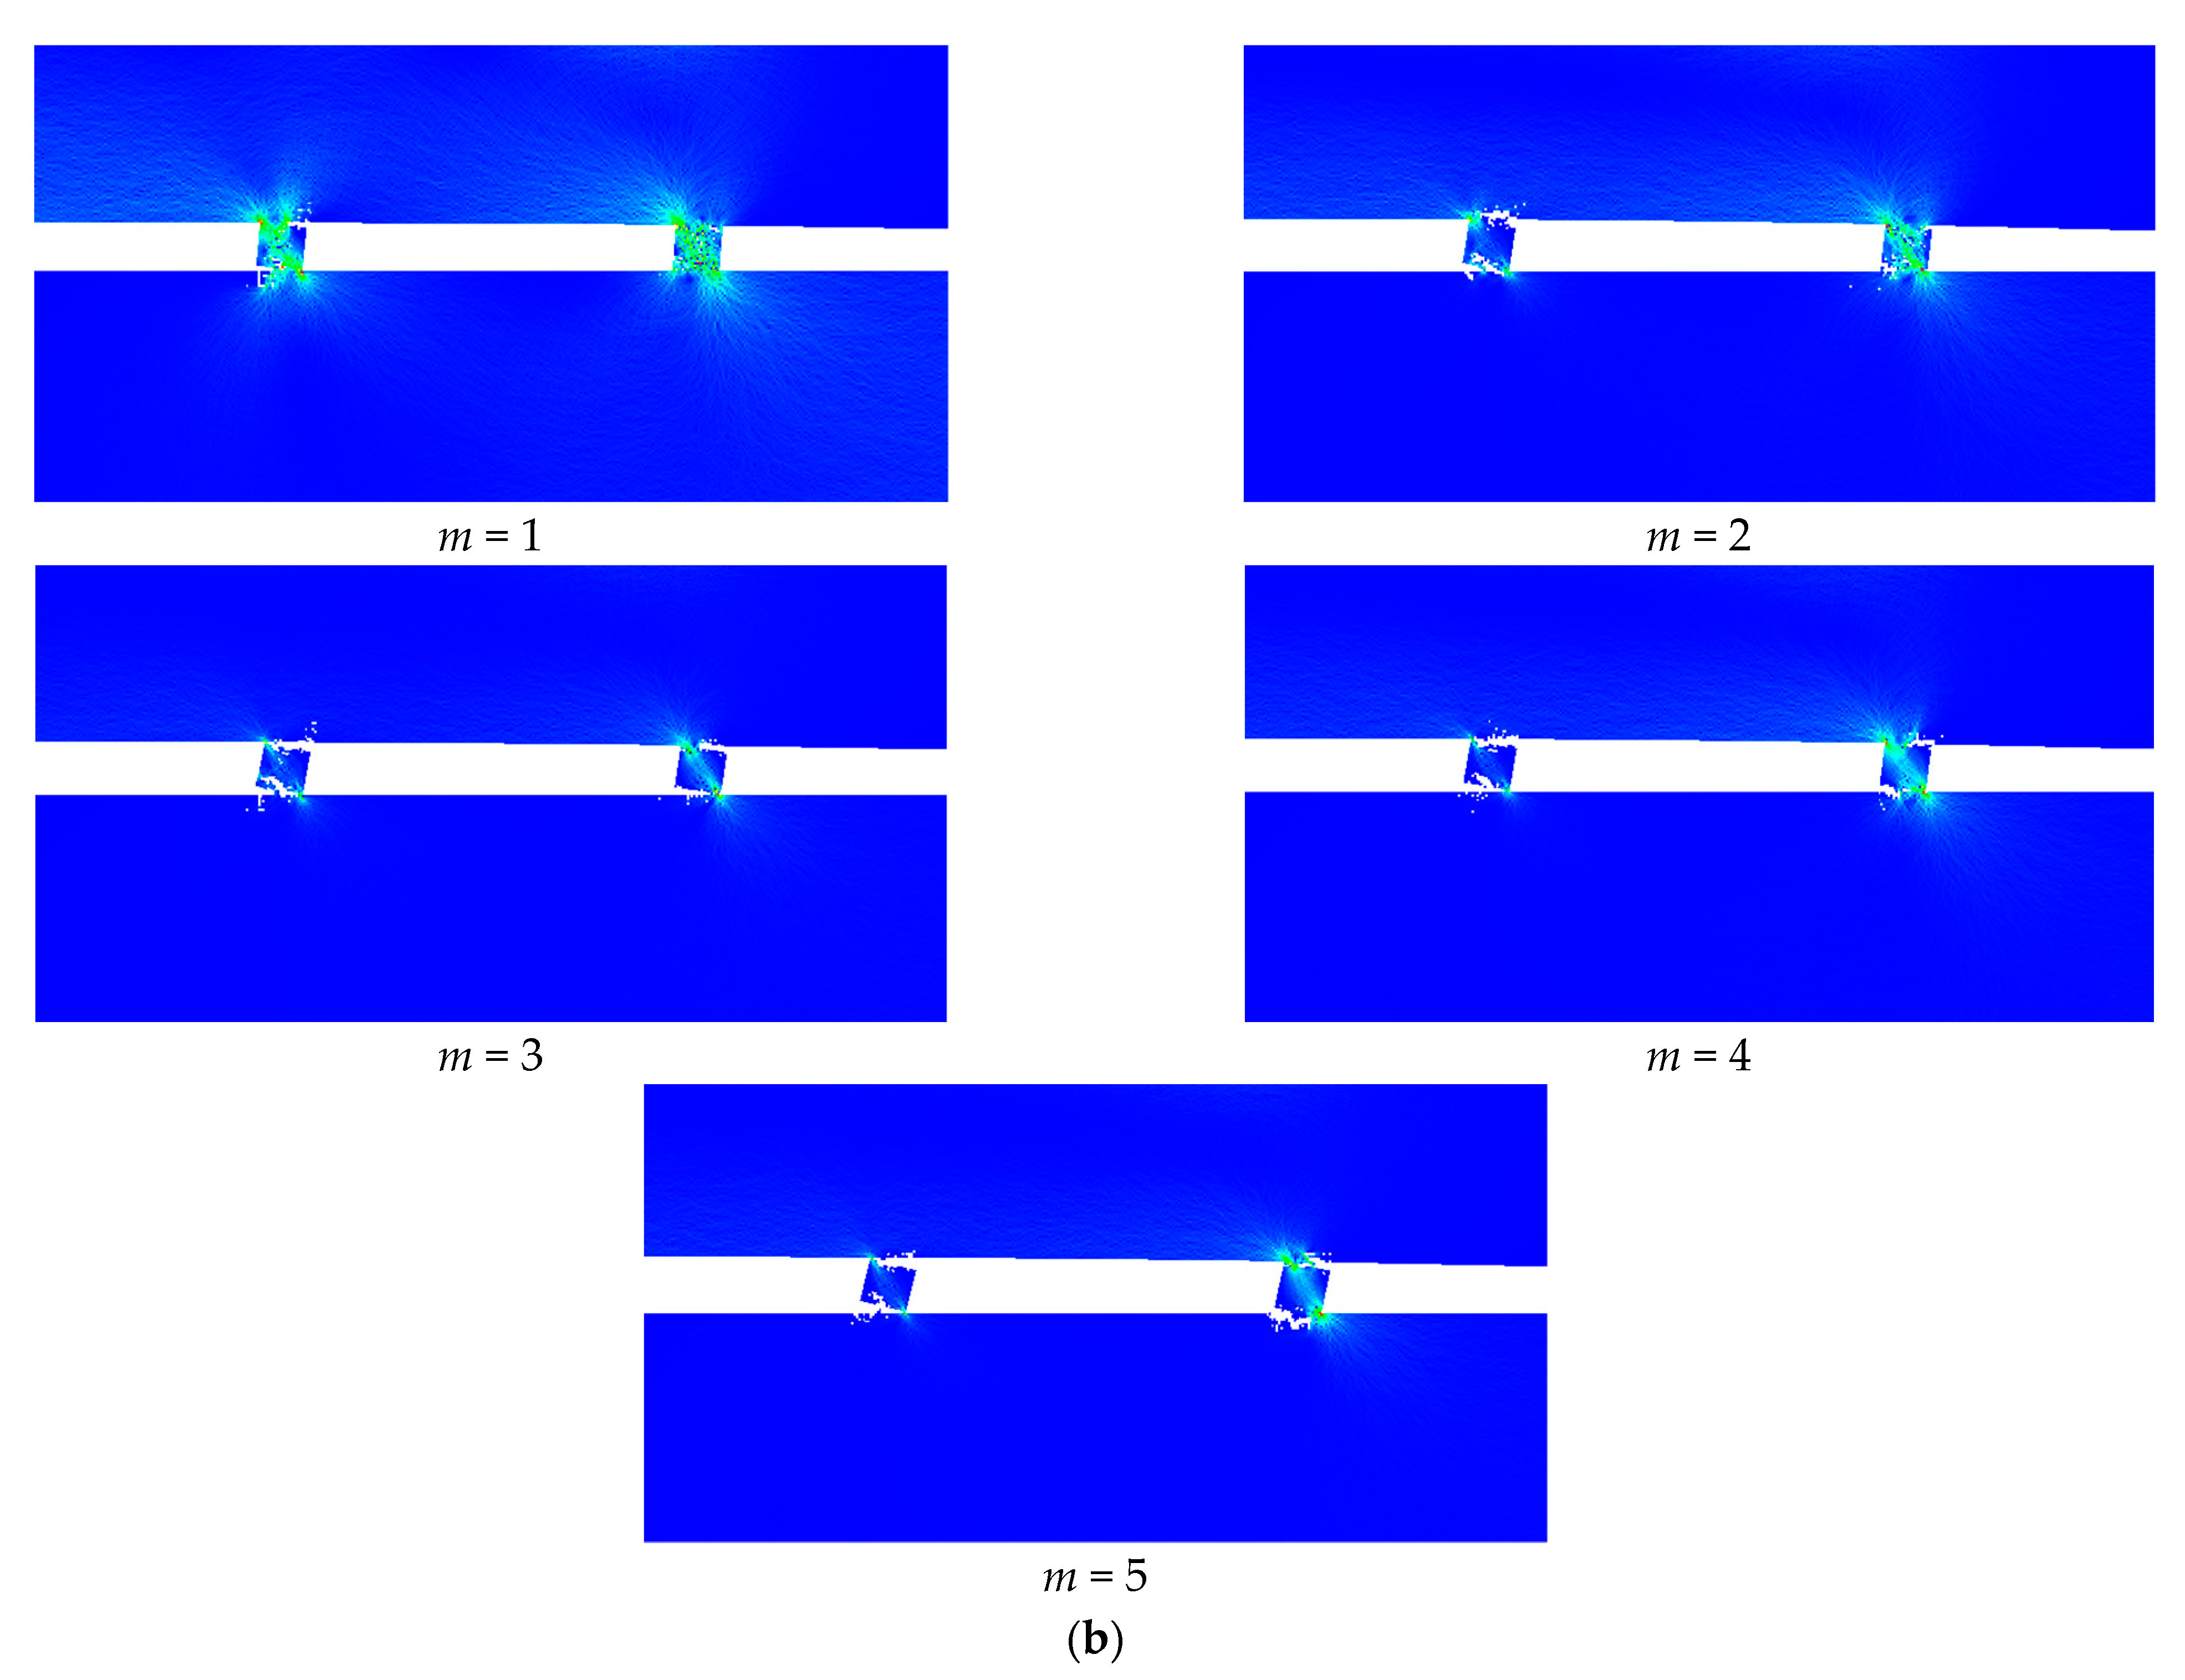
3.6. Homogeneity Effect
3.7. ANOVA Analysis
4. Comparisons with Experimental Observations
4.1. Comparison of Failure Pattern
4.2. Comparison of Mechanical Parameters
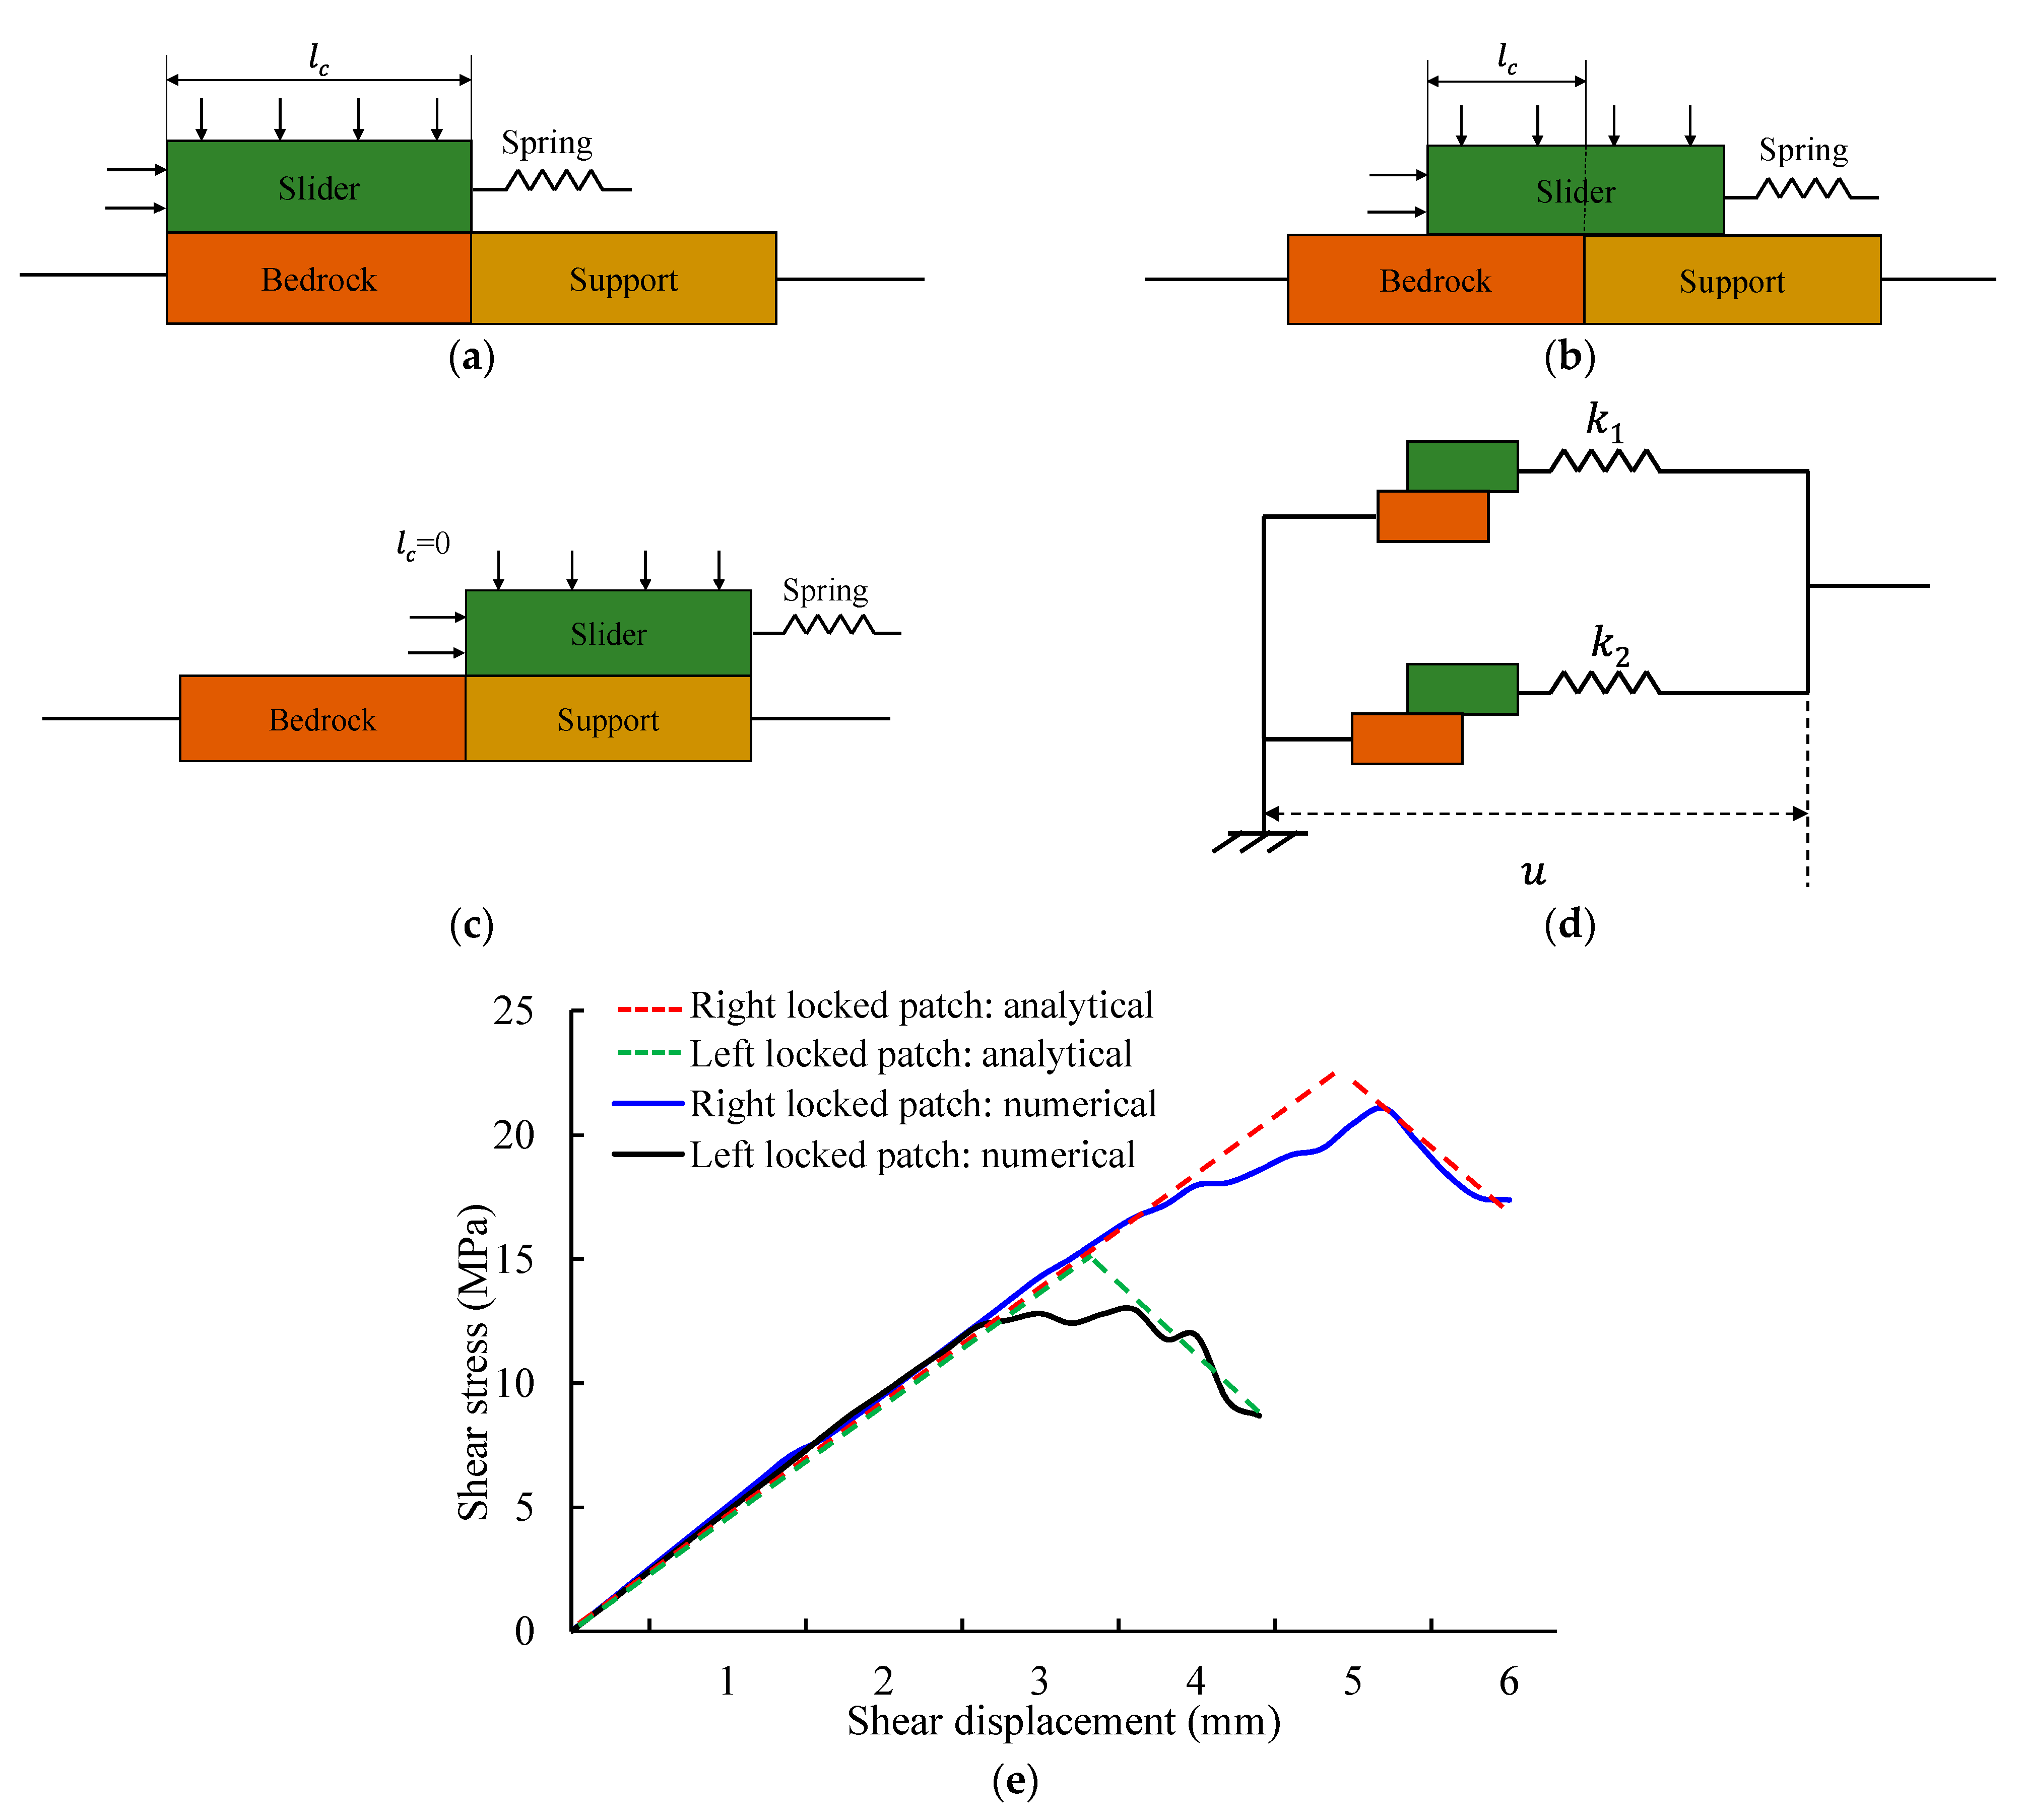
5. Mechanical Model of Locked Patch
6. Conclusions
Author Contributions
Funding
Institutional Review Board Statement
Informed Consent Statement
Data Availability Statement
Conflicts of Interest
References
- Yang, S.Q.; Yang, D.S.; Jing, H.W.; Li, Y.H.; Wang, S.Y. An experimental study of the fracture coalescence behaviour of brittle sandstone specimens containing three fissures. Rock Mech. Rock Eng. 2012, 45, 563–582. [Google Scholar] [CrossRef]
- Einstein, H.H.; Veneziano, D.; Baecher, G.B.; Oreilly, K.J. The effect of discontinuity persistence on rock slope stability. Int. J. Rock Mech. Min. Sci. 1983, 20, 227–236. [Google Scholar] [CrossRef]
- Lajtai, E.Z. Strength of discontinuous rocks in direct shear. Geotechnique 1969, 19, 218–233. [Google Scholar] [CrossRef]
- Li, Y.; Sun, S. Analytical prediction of the shear behaviour of rock joints with quantified waviness and unevenness through wavelet analysis. Rock Mech. Rock Eng. 2019, 52, 3645–3657. [Google Scholar] [CrossRef]
- Li, Y.; Tang, C.A.; Li, D.; Wu, C. A New Shear Strength Criterion of Three-Dimensional Rock Joints. Rock Mech. Rock Eng. 2020, 53, 1477–1483. [Google Scholar] [CrossRef]
- Terzaghi, K. Stability of steep slopes on hard unweathered rock. Geotechnique 1962, 12, 251–270. [Google Scholar] [CrossRef]
- Eberhardt, E.; Stead, D.; Coggan, J.S. Numerical analysis of initiation and progressive failure in natural rock slopes—the 1991 Randa rockslide. Int. J. Rock Mech. Min. Sci. 2004, 41, 69–87. [Google Scholar] [CrossRef]
- Elmoa, D.; Donati, D.; Stead, D. Challenges in the characterisation of intact rock bridges in rock slopes. Eng. Geol. 2018, 245, 81–96. [Google Scholar] [CrossRef]
- Tang, P.; Chen, G.Q.; Huang, R.Q.; Zhu, L. Brittle failure of rockslides linked to the rock bridge length effect. Landslides 2020, 17, 793–803. [Google Scholar] [CrossRef]
- Tuckey, Z.; Stead, D. Improvements to field and remote sensing methods for mapping discontinuity persistence and intact rock bridges in rock slopes. Eng. Geol. 2016, 208, 136–153. [Google Scholar] [CrossRef]
- Sarfarazi, V.; Haeri, H.; Shemirani, A.B. The effect of compression load and rock bridge geometry on the shear mechanism of weak plane. Geomech. Eng. 2017, 13, 431–446. [Google Scholar]
- Bonilla–Sierra, V.; Scholtès, L.; Donzé, F.V.; Elmouttie, M. DEM analysis of rock bridges and the contribution to rock slope stability in the case of translational sliding failures. Int. J. Rock Mech. Min. Sci. 2015, 80, 67–78. [Google Scholar] [CrossRef]
- Paronuzzi, P.; Bolla, A.; Rigo, E. 3D stress-strain analysis of a failed limestone wedge influenced by an intact rock bridge. Rock Mech. Rock Eng. 2016, 49, 3223–3242. [Google Scholar] [CrossRef]
- Shang, J.; Zhao, Z.; Hu, J.; Handley, K. 3D particle-based dem investigation into the shear behaviour of incipient rock joints with various geometries of rock bridges. Rock Mech. Rock Eng. 2018, 51, 3563–3584. [Google Scholar] [CrossRef]
- Huang, R.Q. Some catastrophic landslides since the twentieth century in the southwest of China. Landslides 2009, 6, 69–81. [Google Scholar]
- Huang, R.Q.; Chen, G.Q.; Guo, F.; Zhang, G.F.; Zhang, Y. Experimental study on the brittle failure of the locking section in a large-scale rock slide. Landslides 2016, 13, 583–588. [Google Scholar] [CrossRef]
- Pan, X.H.; Sun, H.Y.; Wu, Z.J.; Lü, Q. Study of the failure mechanism and progressive failure process of intact rock patches of rock slope with weak surfaces. Rock Mech. Rock Eng. 2016, 50, 951–966. [Google Scholar] [CrossRef]
- Chen, H.R.; Qin, S.Q.; Xue, L.; Yang, B.C.; Zhang, K. A physical model predicting instability of rock slopes with locked segments along a potential slip surface. Eng. Geol. 2018, 242, 34–43. [Google Scholar] [CrossRef] [Green Version]
- Liu, H.D.; Li, D.D.; Wang, Z.F.; Geng, Z.; Li, L.D. Physical modeling on failure mechanism of locked-segment landslides triggered by heavy precipitation. Landslides 2020, 17, 459–469. [Google Scholar] [CrossRef]
- Zhang, K.; Li, N.; Liu, W.L.; Xie, J.B. Experimental study of the mechanical, energy conversion and frictional heating characteristics of locking sections. Eng. Fract. Mech. 2020, 228, 106905. [Google Scholar] [CrossRef]
- Huang, R.Q.; Chen, G.Q.; Tang, P. Precursor information of locking segment landslides based on transient characteristics. Chin. J. Rock Mech. Eng. 2017, 36, 521–533. [Google Scholar]
- Xue, L.; Qin, S.; Pan, X.; Chen, H.; Yang, B.; Zhang, K. Mechanism and physical prediction model of instability of the locked-segment type slopes. Chin. J. Eng. Geol. 2018, 26, 179–192. [Google Scholar]
- Yang, B.C.; Qin, S.Q.; Xue, L.; Chen, H.R.; Wu, X.W.; Zhang, K. A physical self-similarity law describing the accelerated failure behavior of rocks. Chin. J. Geophys. 2017, 60, 1746–1760. [Google Scholar]
- Ma, K.; Tang, C.A.; Liang, Z.Z.; Zhuang, D.Y.; Zhang, Q.B. Stability analysis and reinforcement evaluation of high-steep rock slope by microseismic monitoring. Eng. Geol. 2017, 218, 22–38. [Google Scholar] [CrossRef]
- Tang, C.A.; Liu, H.; Lee, P.K.K.; Tsui, Y.; Tham, L.G. Numerical studies of the influence of microstructure on rock failure in uniaxial compression—Part I: Effect of heterogeneity. Int. J. Rock Mech. Min. Sci. 2000, 37, 555–569. [Google Scholar] [CrossRef]
- Tang, C.A.; Kaiser, P.K. Numerical simulation of cumulative damage and seismic energy release during brittle rock failure—Part I: Fundamentals. Int. J. Rock Mech. Min. Sci. 1998, 35, 113–121. [Google Scholar] [CrossRef]
- Li, G.; Tang, C.A. A statistical meso-damage mechanical method for modeling trans-scale progressive failure process of rock. Int. J. Rock Mech. Min. Sci. 2015, 74, 133–150. [Google Scholar] [CrossRef]
- Tang, C.A. Numerical simulation of progressive rock failure and associated seismicity. Int. J. Rock Mech. Min. Sci. 1997, 34, 249–261. [Google Scholar] [CrossRef]
- Chen, X.; Yu, J.; Tang, C.A.; Li, H.; Wang, S.Y. Experimental and numerical investigation of permeability evolution with damage of sandstone under triaxial compression. Rock Mech. Rock Eng. 2017, 50, 1529–1549. [Google Scholar] [CrossRef]
- Ma, T.H.; Tang, C.A.; Tang, S.B.; Kuang, L.; Yu, Q.; Kong, D.Q.; Zhu, X. Rockburst mechanism and prediction based on microseismic monitoring. Int. J. Rock Mech. Min. Sci. 2018, 110, 177–188. [Google Scholar] [CrossRef]
- Weibull, W. A statistical distribution function of wide applicability. J. Appl. Mech. Asme 1951, 18, 293–297. [Google Scholar] [CrossRef]
- Xu, T.; Ranjith, P.G.; Wasantha, P.L.P.; Zhao, J.; Tang, C.A.; Zhu, W.C. Influence of the geometry of partially-spanning joints on mechanical properties of rock in uniaxial compression. Eng. Geol. 2013, 167, 134–147. [Google Scholar] [CrossRef] [Green Version]
- Barton, N.; Choubey, V. The shear strength of rock joints in theory and practice. Rock Mech. 1977, 10, 1–54. [Google Scholar] [CrossRef]
- Yang, W.H.; Tarng, Y.S. Design optimization of cutting parameters for turning operations based on the Taguchi method. J. Mater. Process. Tech 1998, 84, 122–129. [Google Scholar] [CrossRef]
- Mo, L.F. Study of Stress Effect on Shear Strength of Double Saw-Tooth Structural Plane; Zhejiang University of Science and Technology: Hangzhou, China, 2018. [Google Scholar]


| Parameters | Rock Mass | Left Locked Patch | Right Locked Patch |
|---|---|---|---|
| Elastic modulus (GPa) | 50 | 40 | 40 |
| Poisson’s ratio | 0.25 | 0.25 | 0.25 |
| Ratio of compressive and tensile strength | 10 | 10 | 10 |
| Angle of internal friction (°) | 30 | 30 | 30 |
| Mean element uniaxial compressive strength * (MPa) | 300 | 200 | 100, 150, 200, 250, 300 |
| Length (m) | 10 | 0.5 | 0.1, 0.25, 0.5, 1.0, 1.5 |
| Spacing (m) | - | 0.5, 2, 4, 5, 6 | 0.5, 2, 4, 5, 6 |
| Depth (m) | 5 | 0.5 | 0.5, 0.6, 0.7, 0.8, 0.9, 1.0 |
| Height (m) | - | 0.5 | 0.5, 0.6, 0.7, 0.8, 0.9, 1.0 |
| Homogeneity index, m | 3 | 3 | 1, 2, 3, 4, 5 |
| Parameters | Sum of Squares | DOF | Mean Square | F Value | Weighting Contribution |
|---|---|---|---|---|---|
| Strength (MPa) | 68.64 | 4 | 17.16 | 1.63 | 17.17 |
| Length (m) | 184.91 | 4 | 46.23 | 4.38 | 46.26 |
| Spacing (m) | 72.03 | 4 | 18.01 | 1.71 | 18.02 |
| Depth (m) | 27.52 | 5 | 5.50 | 0.52 | 5.51 |
| Height (m) | 32.92 | 5 | 6.58 | 0.62 | 6.59 |
| Homogeneity, m | 32.27 | 4 | 8.07 | 0.61 | 6.46 |
| Parameters | Sum of Squares | DOF | Mean Square | F Value | Weighting Contribution |
|---|---|---|---|---|---|
| Strength (MPa) | 10.05 | 4 | 2.51 | 1.32 | 4.93 |
| Length (m) | 175.28 | 4 | 43.82 | 22.98 | 86.02 |
| Spacing (m) | 6.72 | 4 | 1.68 | 0.88 | 3.30 |
| Depth (m) | 1.99 | 5 | 0.40 | 0.26 | 0.97 |
| Height (m) | 8.64 | 5 | 1.73 | 1.13 | 4.24 |
| Homogeneity, m | 1.08 | 4 | 0.27 | 0.14 | 0.53 |
Publisher’s Note: MDPI stays neutral with regard to jurisdictional claims in published maps and institutional affiliations. |
© 2021 by the authors. Licensee MDPI, Basel, Switzerland. This article is an open access article distributed under the terms and conditions of the Creative Commons Attribution (CC BY) license (https://creativecommons.org/licenses/by/4.0/).
Share and Cite
Fu, B.; Li, Y.; Tang, C.; Lin, Z. Failure of Rock Slope with Heterogeneous Locked Patches: Insights from Numerical Modelling. Appl. Sci. 2021, 11, 8585. https://doi.org/10.3390/app11188585
Fu B, Li Y, Tang C, Lin Z. Failure of Rock Slope with Heterogeneous Locked Patches: Insights from Numerical Modelling. Applied Sciences. 2021; 11(18):8585. https://doi.org/10.3390/app11188585
Chicago/Turabian StyleFu, Bin, Yingchun Li, Chun’an Tang, and Zhibin Lin. 2021. "Failure of Rock Slope with Heterogeneous Locked Patches: Insights from Numerical Modelling" Applied Sciences 11, no. 18: 8585. https://doi.org/10.3390/app11188585
APA StyleFu, B., Li, Y., Tang, C., & Lin, Z. (2021). Failure of Rock Slope with Heterogeneous Locked Patches: Insights from Numerical Modelling. Applied Sciences, 11(18), 8585. https://doi.org/10.3390/app11188585