Article

2D Solid-State HETCOR 1H-13C NMR Experiments with Variable Cross Polarization Times as a Tool for a Better Understanding of the Chemistry of Cellulose-Based Pyrochars—A Tutorial

by
Heike Knicker
1,2,*,
Marta Velasco-Molina
1 and
Michael Knicker
3
1
Solid-State NMR Service Unit, Instituto de Recursos Naturales y Agrobiología de Sevilla (IRNAS-CSIC), Avda. Reina Mercedes 10, 41012 Seville, Spain
2
Department of Biogeochemistry, Plant and Microbial Ecology, IRNAS-CSIC, Avda. Reina Mercedes 10, 41012 Seville, Spain
3
Consult Michael Knicker (CMK), Max-Friedlaender Bogen 7, 80339 Munich, Germany
*
Author to whom correspondence should be addressed.
Appl. Sci. 2021, 11(18), 8569; https://doi.org/10.3390/app11188569
Submission received: 10 August 2021 / Revised: 30 August 2021 / Accepted: 3 September 2021 / Published: 15 September 2021
(This article belongs to the Special Issue Composts and Organic Wastes: Analytical Methods and Applications)

Abstract

:

Featured Application

Using cellulose and its pyrochar as model compounds, we explain the potential of the solid-state 2D HETCOR NMR technique for revealing the chemical nature of charred organic residues. Expanding its application to other biochars can unveil chemical features which remain undiscovered by other techniques but are essential for a better understanding of the relationship between feedstock chemistry, pyrolysis condition, and biochar properties.

Abstract

The chemistry and nature of biochars are still far from being well understood. In the present work, solid-state 2D HETCOR 1H-13C NMR spectroscopy is introduced for an improved characterization of the aromatic network in biochars. To that end, a pyrochar obtained from the pyrolysis of cellulose at 350 °C for 1 h was used as an example. Variation of the contact time during cross polarization from 50 µs, to 200 µs and 1000 µs gave information about the protonation degree of the different C groups and their interactions. We demonstrated that carbohydrates did not survive the used pyrolysis conditions. Therefore, O-alkyl C was assigned to ethers. Phenols were not identified to a higher extent suggesting that furan and benzofuran-type units determine the O-functionality of the aromatic domains. The latter are directly connected to alkyl chains. Those features are expected to affect chemical but also physical properties of the biochar. Based on our results, we developed a new concept describing the nature of the aromatic network in the studied cellulose-based pyrochars. The latter contrasts common views about the chemical nature of biochar, possibly because pyrolysis temperatures > 350 °C are required for achieving advanced condensation of the aromatic domains.

1. Introduction

Biochar derives from the pyrolysis of organic residue such as green waste, biowaste, sewage sludge, algal residues, or manure. Due to its high energy density, it is predestinated as a high-quality fuel, although during the last years, alternative uses have been proposed such as a raw material of activation carbon or supporter of catalyst and supercapacitor electrodes [1]. In agriculture, it is recommended as soil amendment, stable litter, or even as an additive for animal alimentation [2]. It was also tested as a possible peat substitute in gardening soil [3,4], as a soil additive for the remediation of contaminated soils such as mining sites or spills [5,6], and as an amendment during composting [7].
With respect to composting, biochar addition is expected to improve the humification process, enhancing microbial diversity and activity as well as reducing the production of greenhouse gas emissions by their sequestration [8]. Further, it is thought to immobilize toxic metals [5] and organic pollutants [9] associated with the feedstock of the compost. Complementarily, biochar addition increases the water holding capacity (WHC) which is mainly explained by its high porosity.
The increasing research related to biochar evidenced that depending on the chemistry of the feedstock and the production condition, the chemical composition and the physical properties of biochars vary strongly [10]. Thus, biochar application is not a “one-size fit-all paradigm” [11], but requires careful consideration of the product properties and how those contribute to the fulfillment of the application purpose. In spite of this, most reports about biochar characterization are still limited to basic descriptive data such as the content of pollutants, pH, WHC, nutrient content, and elemental composition. In particular, the latter is used to elucidate the carbonization degree by its atomic H/C and O/C ratios. The lower these ratios, the higher is the aromaticity which is commonly related to increasing porosity. This is paid with a lowering of the chemical reactivity and the decrease of acid functional groups such as carboxylic acids [12,13], and as a possible consequence a reduction of the adsorption capacity in particular for metals or nutrients.
However, often the sole description of basic parameters fails to explain why different feedstocks or pyrolysis conditions result in products with a large variation in porosity, adsorption, or biochemical recalcitrance. In some cases, they show unexpected behaviors during their application. The latter can be avoided if the scarce understanding of the chemical changes of biomass residues during pyrolysis and how these changes affect the chemical and physical properties of the final product is improved. Indeed, considerable literature reports on the analysis of volatile or soluble thermal degradation products of cellulose or lignin [14,15], being the two major biopolymers of woody biochar precursors. However, a more detailed description of the charred solid residues which goes beyond the identification of condensed aromatic structures is still rare [16].
One of the non-degradative techniques that allow a more detailed description of the chemical alteration of organic matter during pyrolysis represents solid-state 13C nuclear magnetic resonance (NMR) spectroscopy. With this technique, secondary reactions during sample preparation or extraction can be avoided. However, this powerful approach still has a major drawback, which is its low resolution, in particular if analyzing biochars.
Most solid-state 13C NMR spectra of biochars are defined by an intense but broad signal assigned to aromatic C and–in case–a smaller signal attributed to alkyl C. When analyzing the spectra in more detail, it may be possible to distinguish a small shoulder assignable to O-substituted aromatic C (O-aryl C) on the low field side of the peak of aromatic C resonance. This shoulder is commonly assigned to phenol C. Although the contribution of this phenol to the total aromaticity represents an important parameter not only for a better understanding of the chemical structure but also for elucidating the reactivity and adsorption capacity of a biochar, it is rarely considered, most probably because a highly condensed aromatic network is generally assumed [17].
On the other hand, modern solid-state NMR spectroscopy offers special pulse sequences which allow an improved assignment of signal intensity to C groups and thus a more detailed description of the nature of the aromatic network in biochars. One of those is the two dimensional (2D) 1H-13C heteronuclear correlation (HETCOR) NMR experiment in which 13C and 1H are correlated through their spin-spin interactions [18]. This allows the identification of the connection between specific proton and carbon groups. Originally, this technique was developed for characterizing organic compounds in solution, but eventually was also successfully applied to study solid polymers and coals [19], humic substances [20,21], kerogen [22], and biochars [23].
Although this technique has already proven its high potential for the analysis of complex and heterogeneous mixtures, the very long measurement times for obtaining meaningful spectra still limits its application to the study of the composting process, in biochar research or soil sciences and related fields. On the other hand, the information obtained from such experiments can provide the base for a better interpretation of data obtained with other routine techniques. However, many investigators in research areas not directly involved in analytical chemistry and NMR spectroscopy, may find the analysis of the complex 2D NMR spectra mysterious and at times daunting. Therefore, aside from reporting of research data, the intention of the present work is to give a short introduction how to interpret solid-state 2D 1H-13C HETCOR NMR spectra by applying this technique to a model char (thereafter called pyrochar) produced from commercially available cellulose pyrolyzed for 1 h at 350 °C. Cellulose was chosen since it represents a major player in the composition of the vegetal biomass used for biochar production. It accounts for 40% of the total biomass of wood [24] and 19–33% of grass and wheat straw residues [25].

2. Materials and Methods

2.1. Production of the Pyrochar

For the production of the pyrochars, 22 g of α–cellulose powder (Sigma: CAS: 9004-34-6, St. Louis, MO, USA) was filled into a closed custom-made stainless-steel reactor which at the top was equipped with a closable entrance and an exit tube of stainless steel to allow the release of syngas. Before heating in a muffle oven, the reactor with the feedstock was swept with N2 to remove air and to ensure pyrolysis conditions. During the thermal treatment of 1 h at a temperature of 350 °C, the exit tube was connected to an external trap containing an alkaline oil solution to sequester released volatiles. Thereafter, the reactor was allowed to cool down within the muffle oven over night. Then, the charred residue was collected, weighted and stored in the dark for further analysis.

2.2. Elemental Composition and pH

The feedstock and the pyrochar were analyzed for their total C and H contents in triplicate by dry combustion at 925 °C using an elemental analyzer (Carlo-Erba EA-1108-CHNS, Milan, Italy) and their pH was measured in an aqua dest. (1:20) suspension.

2.3. Solid-State 13C NMR Spectroscopy

The standard CPMAS spectra of the pure cellulose and its biochar were obtained with a Bruker (Rheinstetten, Germany) Avance III HD 400 MHz wide bore spectrometer, using a triple resonance broadband probe and zirconium rotors of 4 mm OD with KEL-F-caps and applying a magic-angle spinning (MAS) speed of the rotor at 14 kHz. For all CPMAS spectra, a ramped 1H-pulse amplitude was applied during the contact time, tc = 100 µs to circumvent spin modulation during Hartmann-Hahn condition. For the cellulose and biochar, 200 and 13,000 scans were accumulated, respectively, and the line broadening was between 0 and 50 Hz. The needed recycle delay was adjusted after determination of the 1H spin-lattice relaxation time, T1H, with an inversion recovery experiment. Proton decoupling during acquisition was obtained by using SPINAL-64 [26]. The 13C chemical shift scale was calibrated relative to tetramethylsilane (0 ppm) with glycine (COOH at 176.08 ppm). The 13C intensity distribution was determined by integrating the following chemical shift regions: alkyl C (0–45 ppm); methoxyl C (45–60 ppm); O-alkyl C (60–95 ppm); anomeric C in the pure cellulose (95–110 ppm); aryl C (95–140 ppm); O-aryl C (140–160 ppm); carboxyl C (160–185 ppm); aldehyde/ketone C (185–225 ppm).
The solid-state 2D 1H-13C HETCOR experiments with frequency-switched Lee-Goldburg (FSLG) irradiation during the evolution time were performed to correlate 13C and 1H chemical shifts [18]. In order to identify 13C with strong dipolar interaction with 1H, a short tc = 50 µs was applied. In addition, spectra with tc = 200 and 1000 µs were obtained for the detection of long-distance heterodipolar interactions. For the 2D spectra of the pure cellulose and the pyrochar, 128 single spectra with 16 and 700 scans, respectively, and an increment of the mixing time by 22.9 µs were acquired for the data points in the 1H indirect dimension and 1536 data points were used in the 13C dimension. Recycle delays were adjusted according to pre-determined T1H. Quadrature detection in ω1 was achieved using States-TPPI. Exponential line broadening between 0 and 50 Hz was applied to the 13C dimension prior to Fourier transformation. The samples were spun at the magic angle with 13 and 15 kHz.
T1H was approached with the inversion recovery pulse sequence using an array of up to 13 delay times between an initial 180 °C pulse and a final 90 °C pulse. Each spectrum of the set was phased and subjected to a manual baseline correction before their intensity was determined by integration of the respective chemical shift. Spinning side bands were not considered. The obtained intensities were used as raw data for interpolation using the software “simFIT” provided with the NMR software topspin 3.6.2.
For evaluating if a tc = 1000 µs is sufficient for a complete cross polarization of all aromatic C in the pyrochar, a variable contact time experiment was performed. Here, 23 single spectra were acquired with increasing the tc from 10 µs to 4000 µs. Afterwards, the intensity course of each chemical shift region was plotted as function of the contact time and fitted with a two component model using the program NMR-Relax version 1.010.002 (CMK, Munich, Germany) and based on equations provided by [27,28] (Table S1).

3. Results

3.1. Elemental Composition and pH of the Cellulose Pyrochar

The pyrolysis of cellulose at a temperature of 350 °C for 1 h resulted in a weight loss of 64% (Table 1) corresponding to a C-loss of 55% which is in line with observations that thermal degradation of cellulose starts around 300 °C [15]. However, pyrolysis seems to be less destructive since oxic charring led to a weight loss of 85% and 89% already after 4 min and 8 min heating at the same temperature [29,30]. The C content, H/Catm and O/Catm of pyrochars are often used as an indication of their condensation degree. The present pyrochar reveals a C concentration of 70% and the ratios decrease from 1.7 in the pure cellulose to 0.7 and from 0.9 to 0.3, respectively, indicating dehydration during pyrolysis. Whereas the O/Catm of the pyrochar is below the threshold adjusted by the European Biochar Certificate to be classified as biochar [31] the H/Catm is just at the threshold.
Commonly, an increase of the pH value with increasing charring temperature of wood is reported in the literature [13]. However, this behavior is not confirmed for the pyrolyzed cellulose, analyzed here. In contrary, the pH decreases from 7.2 for the fresh cellulose to 5.0 for its pyrochar (Table 1). A possible explanation of the contradicting result may be the fact that the used cellulose contained negligible amounts of ash and other impurities which could accumulate due to the combustion of organic matter. Therefore, the pH change is explainable solely by heat-induced chemical alterations, which may have been the removal of OH-groups of the cellulose by dehydrogenation and the formation of functional groups which increase the acidity of the pyrolysate. Bearing this in mind, one can suspect that high alkalinity in biochars derived from plant residues is related to the content of inorganic cations (Ca, Mg, etc.) in the feedstock rather than being a general property of such materials.

3.2. Characterization of Cellulose by 1D and 2D NMR Spectroscopy

3.2.1. Some Theoretical Background of the Cross-Polarization Experiment

Useful information about the chemical structure of a compound can already be obtained by one dimensional (1D) solid-state 13C NMR spectroscopy. However, due to the low sensitivity of this technique, several single measurements have to be performed (scans) and accumulated. By doing this, the intensity of the signals adds up while the noise is reduced. In order to avoid saturation effects and thus tampering quantification, the waiting time between two scans has to be 3 to 5 times of the spin-lattice relaxation time, T1. The latter is the time which is needed by the excited spin system for a complete return to the thermal equilibrium after the excitation pulse has terminated. Here, it has to be noted that due to the higher mobility of molecules in solutions than in the solid state, T1 for solids can be considerably long. This is in particular true for excited 13C since its low abundance (1.1 atm%) prevents homonuclear interactions which could support efficient T1. For example, for 13C in crystalline cellulose a T1 of 266 s was reported [32]. Such components can occur as part of undegraded plant residues in immature composts and fresh soil organic matter inputs. Therefore, to ensure quantifiable solid-state NMR spectra of such samples via direct excitation, pulse delays of 13 to 22 min must be applied. Considering further that for many soil organic matter or compost samples, approximately 10,000 single scans are needed to achieve a high quality spectrum, a measurement time of at least 92 to 153 days is required. Such unfeasible long measurements times can be avoided if one takes advantage of a “trick” which is called cross polarization (CP) [33]. Here, one takes advantage of the highly abundant 1H spins exhibiting strong homonuclear interactions and thus have comparably short T1 (T1H) of approximately 2 to 3 s which shortens the total measurement time of cellulose-containing compost or soil samples to 13 h to 24 h.
For CP, the 1H spin system has first to be excited, thus magnetized (Figure 1a). Then, during the so-called contact time, tc, this magnetization is transferred to the 13C spin system. After termination of tc, the polarized 13Cs are detected during the acquisition time and their signals can be analyzed in a spectrum. Subsequently, the spin systems can relax, but being the “engine” of the polarization transfer a full relaxation before the next scan is only necessary for the 1H spin system. Since the latter is considerably faster than for 13C, the total measurement time can be largely reduced.
Applying this technique, we must consider some aspects of the CP dynamics if we intend to obtain quantitative spectra. One is that the efficiency of CP depends upon the strength of the dipole-dipole interactions or coupling between 1H and 13C (through space). If a 1H couples strongly with a 13C, for example, which is the case for directly bound 1H in carbohydrates, the CP is efficient and complete within a short cross polarization time. The respective time needed is described by the cross-polarization rate, TCH (Figure 1b). Thus, a short tc = 50 µs is sufficient for maximal polarization. With increasing distance between those two nuclei, the efficiency decreases, thus longer tc s are required to reach maximal 13C intensity. This behavior would not be a problem, if there weren’t already relaxation of the 1H spins occurring already during the cross polarization. This process is described by the spin-lattice relaxation time in the rotating frame, T1ρH. It decreases the magnitude of magnetization that can be transferred from the 1H to the 13C spins. Comparable to T1H, T1ρH depends, among others, on molecular motions, thus on size and crystallinity of the molecules under study and can be considerably shortened by paramagnetic components such as Fe3+ or stable organic radicals. However, under the premise that TCH << T1ρH is valid, the signal can be detected, although some intensity loss due to T1ρH has to be encountered. Since in heterogeneous mixtures, different C groups follow different cross polarization dynamics, the challenge is to find a tc at which the intensity loss for each signal is comparable. As a consequence, the intensity distribution in such spectra still represents the relative contribution of each C to the total C content of the sample. For soils, composts, and several coals it was shown that the use of tc = 1 ms allows the acquisition of quantitative spectra [34,35]. However, analyzing in particular high temperature charcoals, polycondensed aromatic structures with core Cs that are poorly cross polarized may be present, although the latter may not be detected with tc = 1 ms. An easy way to test this possibility is a more detailed analysis of the CP dynamics. Commonly this is done by acquiring a set of spectra with increasing tc (variable contact time measurement), then plotting the course of the intensity for each signal as function of tc. Fitting this curve with a two-component model allows the calculation of TCH and T1ρH for a fast and slow pool. For all carbons of the cellulose char of the present study TCH << T1ρH is valid and no indications for a higher contribution of inefficiently cross polarized C was obtained (Table S1, Figure S1).

3.2.2. Solid-State 1D CPMAS 13C NMR Spectrum of α–Cellulose

The spectrum in Figure 2a was obtained from commercially available α-cellulose using the CP technique. It shows seven clearly distinguishable resonance lines and a small shoulder at 96 ppm. The latter can be assigned to terminal C1. The most pronounced signals at 74.7 ppm and 72.4 ppm are caused by C2, C3, and C5 in cellulose. Intensity derived from C6 contributes to the signal at 65 ppm and 62 ppm. The resonance line at 104 ppm corresponds to the anomeric C1 carbon in a glycosidic bond [36]. The equivalent resonance in hemicellulose would appear at 103 ppm. The signal at 89 ppm is assigned to C4 in crystalline units, whereas C4 in amorphous structures results in a signal at 83 ppm. The crystallinity of cellulose is due to its abundant hydroxyl groups which are involved in intra and intermolecular H-bonds. The ratio between those two signals can be used as a measure for the relative crystallinity of cellulose [37,38]. A higher ratio indicates a higher crystallinity. For the cellulose analyzed here, the ratio was obtained after integration of the signals in the chemical shift regions 95 to 85 ppm and 85 to 80 ppm. A value of 1 was calculated indicating that approximately half of the cellulose units occur in crystalline structures.

3.2.3. D Solid-State 1H-13C HETCOR NMR Spectra of α-Cellulose and Its T1H

Although 2D NMR spectroscopy has many different applications, all pulse sequences are based on the introduction of a preparation time during which the magnetization of a spin system is adjusted into a state appropriate to whatever properties needs to be detected. Then, the spins are allowed to evolve with the given conditions and after their additional manipulation during a mixing period the modulated magnetization is detected. Assembling several 1D spectra with incrementing evolution time (t1) creates a data set which is two-dimensional in time. Fourier transformation of both dimensions leads to a 2D contour plot correlating the interactions detected in the indirect dimension F1 with the signals detected in the direct dimension F2. The HETCOR NMR spectrum detects the 13C signals which are modulated by 1H chemical shift information. For its application in solid-state, the preparation and mixing times are followed by the 1H-13C polarization-transfer step during which the encoded 1H chemical-shift modulation is transferred coherently to 13C. Then, the respective 13C intensities are recorded.
For the spectrum in Figure 2b, 128 single spectra were acquired with tc = 50 µs an increment of t1 by 22.9 µs. They were Fourier-transformed both the indirect 1H (F1) (relative to t1) and the direct 13C (F2) dimension.
Since short tc limit CP to strongly interacting 1H and 13C spins, the 2D spectrum shows only cross peaks from 13C in close vicinity or directly bound to 1H. Correspondingly, in the spectrum in Figure 2b, cross peaks are only identified in the 1H chemical shift (δH) range assigned to 1H directly bound to 13C in the chemical shift (δC) of alcohols at δC/δH 104 ppm/4.4 ppm (C1), δC/δH 89 ppm/3.4 ppm, δC/δH 83 ppm/3.4 ppm (C4), δC/δH 74.7, 72.4 ppm/3.6 ppm (C2, C3, C5), δC/δH 65, 62.4 ppm/3.7 ppm (C6). Increasing tc to 200 µs allows dipole-dipole interactions between 13C and more distant 1H. For cellulose this is the case for 1H in its hydroxyl groups (Figure 2c), giving rise to δH at 6.2 ppm. As a consequence, more cross peaks can be identified for the 13C resonance at 72.4 ppm assigned to C2, C3 and C5. The fact that such cross peaks are missing for C4 and C1, which are not directly connected to hydroxyl groups supports this interpretation. Increasing tc to 1000 µs resulted in a broadening of the resonance lines mainly in the 1H dimension (Figure 2d) due to increasing interactions between 13C and distant 1H which cannot be clearly resolved.
For the cellulose used in this study, T1H-values between 1.6 s and 1.9 s were determined (Figure 2a), which is in line with a rather crystalline structure with low intramolecular motion. The fact that fairly uniform values were obtained points toward efficient 1H spin diffusion among the different domains and thus to close vicinity of crystalline and amorphous domains.

3.3. Solid-State NMR Spectroscopic Characterization of Cellulose Pyrochar Pyrolzed at 350 °C

3.3.1. General Information Obtained by 1D Solid-State CPMAS 13C NMR Spectroscopy

As already expected from the decreasing H/Catm with higher temperature (Table 1), a considerable shift of the chemical composition towards higher aromaticity (160 to 110 ppm) at the expense of O-alkyl C (110 to 45 ppm) is evidenced from the solid-state CPMAS NMR spectrum of the cellulose (Figure 3a), pyrolyzed at 350 °C for 1 h.
The spectrum is coherent with previous spectra obtained from other pyrolyzed cellulose [39] and lignocellulose residues [23]. Further intensity occurs between 215 and 200 ppm and is assigned to aldehyde/ketone C and in the carboxyl C region at 174 ppm. Note that such signals were not expressed in the spectrum obtained from cellulose charred at 350 °C under oxic conditions [29] (Figure 3b), confirming that during pyrolysis and oxic combustion different processes occur. Comparably, the considerable intensity in the chemical shift region assigned to O-alkyl C (90–45 ppm) and alkyl C (45–0 ppm) in the spectrum of the pyrolyzed cellulose is missing in that obtained from the cellulose charred in the presence of oxygen.
The resonances in the aromatic C region (160 to 95 ppm) of 1D NMR spectra of bio- or pyrochars are often interpreted to be caused by carbons located in a polycondensed aromatic network [40,41]. Note that if such aromatic systems are too large, magnetization transfer to their core carbons may be inefficient and the latter may not be detected by the CP technique. However, analyzing the CP dynamics of the present char suggested full CP of all Cs at tc = 1000 µs (Figure S1; Table S1). Thus, we can assume that almost all if not all aromatic C occurs in small ring systems.
Note that the chemical shift of the main signal at 127 ppm could also be explained with protonated phenyl C units [36,42]. The smaller shoulder, peaking at 153 ppm is in the chemical shift region assigned to O-aryl C (160 to 140 ppm). For lignocellulose feedstocks such as wood and its biochars, this region is often assigned to phenols in lignin residues (Figure 4, structure 1) or to surface aromatic C substituted by a hydroxyl groups or involved in ether bonds (Figure 4, structure 2). In all cases, their protonated adjunct Cs resonance around 110–120 ppm. Of course, for the cellulose studied here, the first explanation isn’t appropriate since lignin was not present in the feedstock, but the second could still be valid. Alternatively, C close to oxygen in furan-like intermediates may equally contribute to signals between 140 and 160 ppm (Figure 4, structure 3–11). The neighboring protonated C would give a signal around 100 to 114 ppm. Such compounds were also evidenced during thermal degradation of wood [23]. These furans may be part of hydroxymethylfurfural (HMF) (Figure 4, structure 6), which were suggested to be formed during hydrothermal carbonization of glucose [43], but also as a degradation product of cellulose during pyrolysis [44]. Falco et al. [43] proposed that HMF condensates to polyfuran chains which finally form a condensed aromatic network (Figure 4, structure 7, 8, 12).

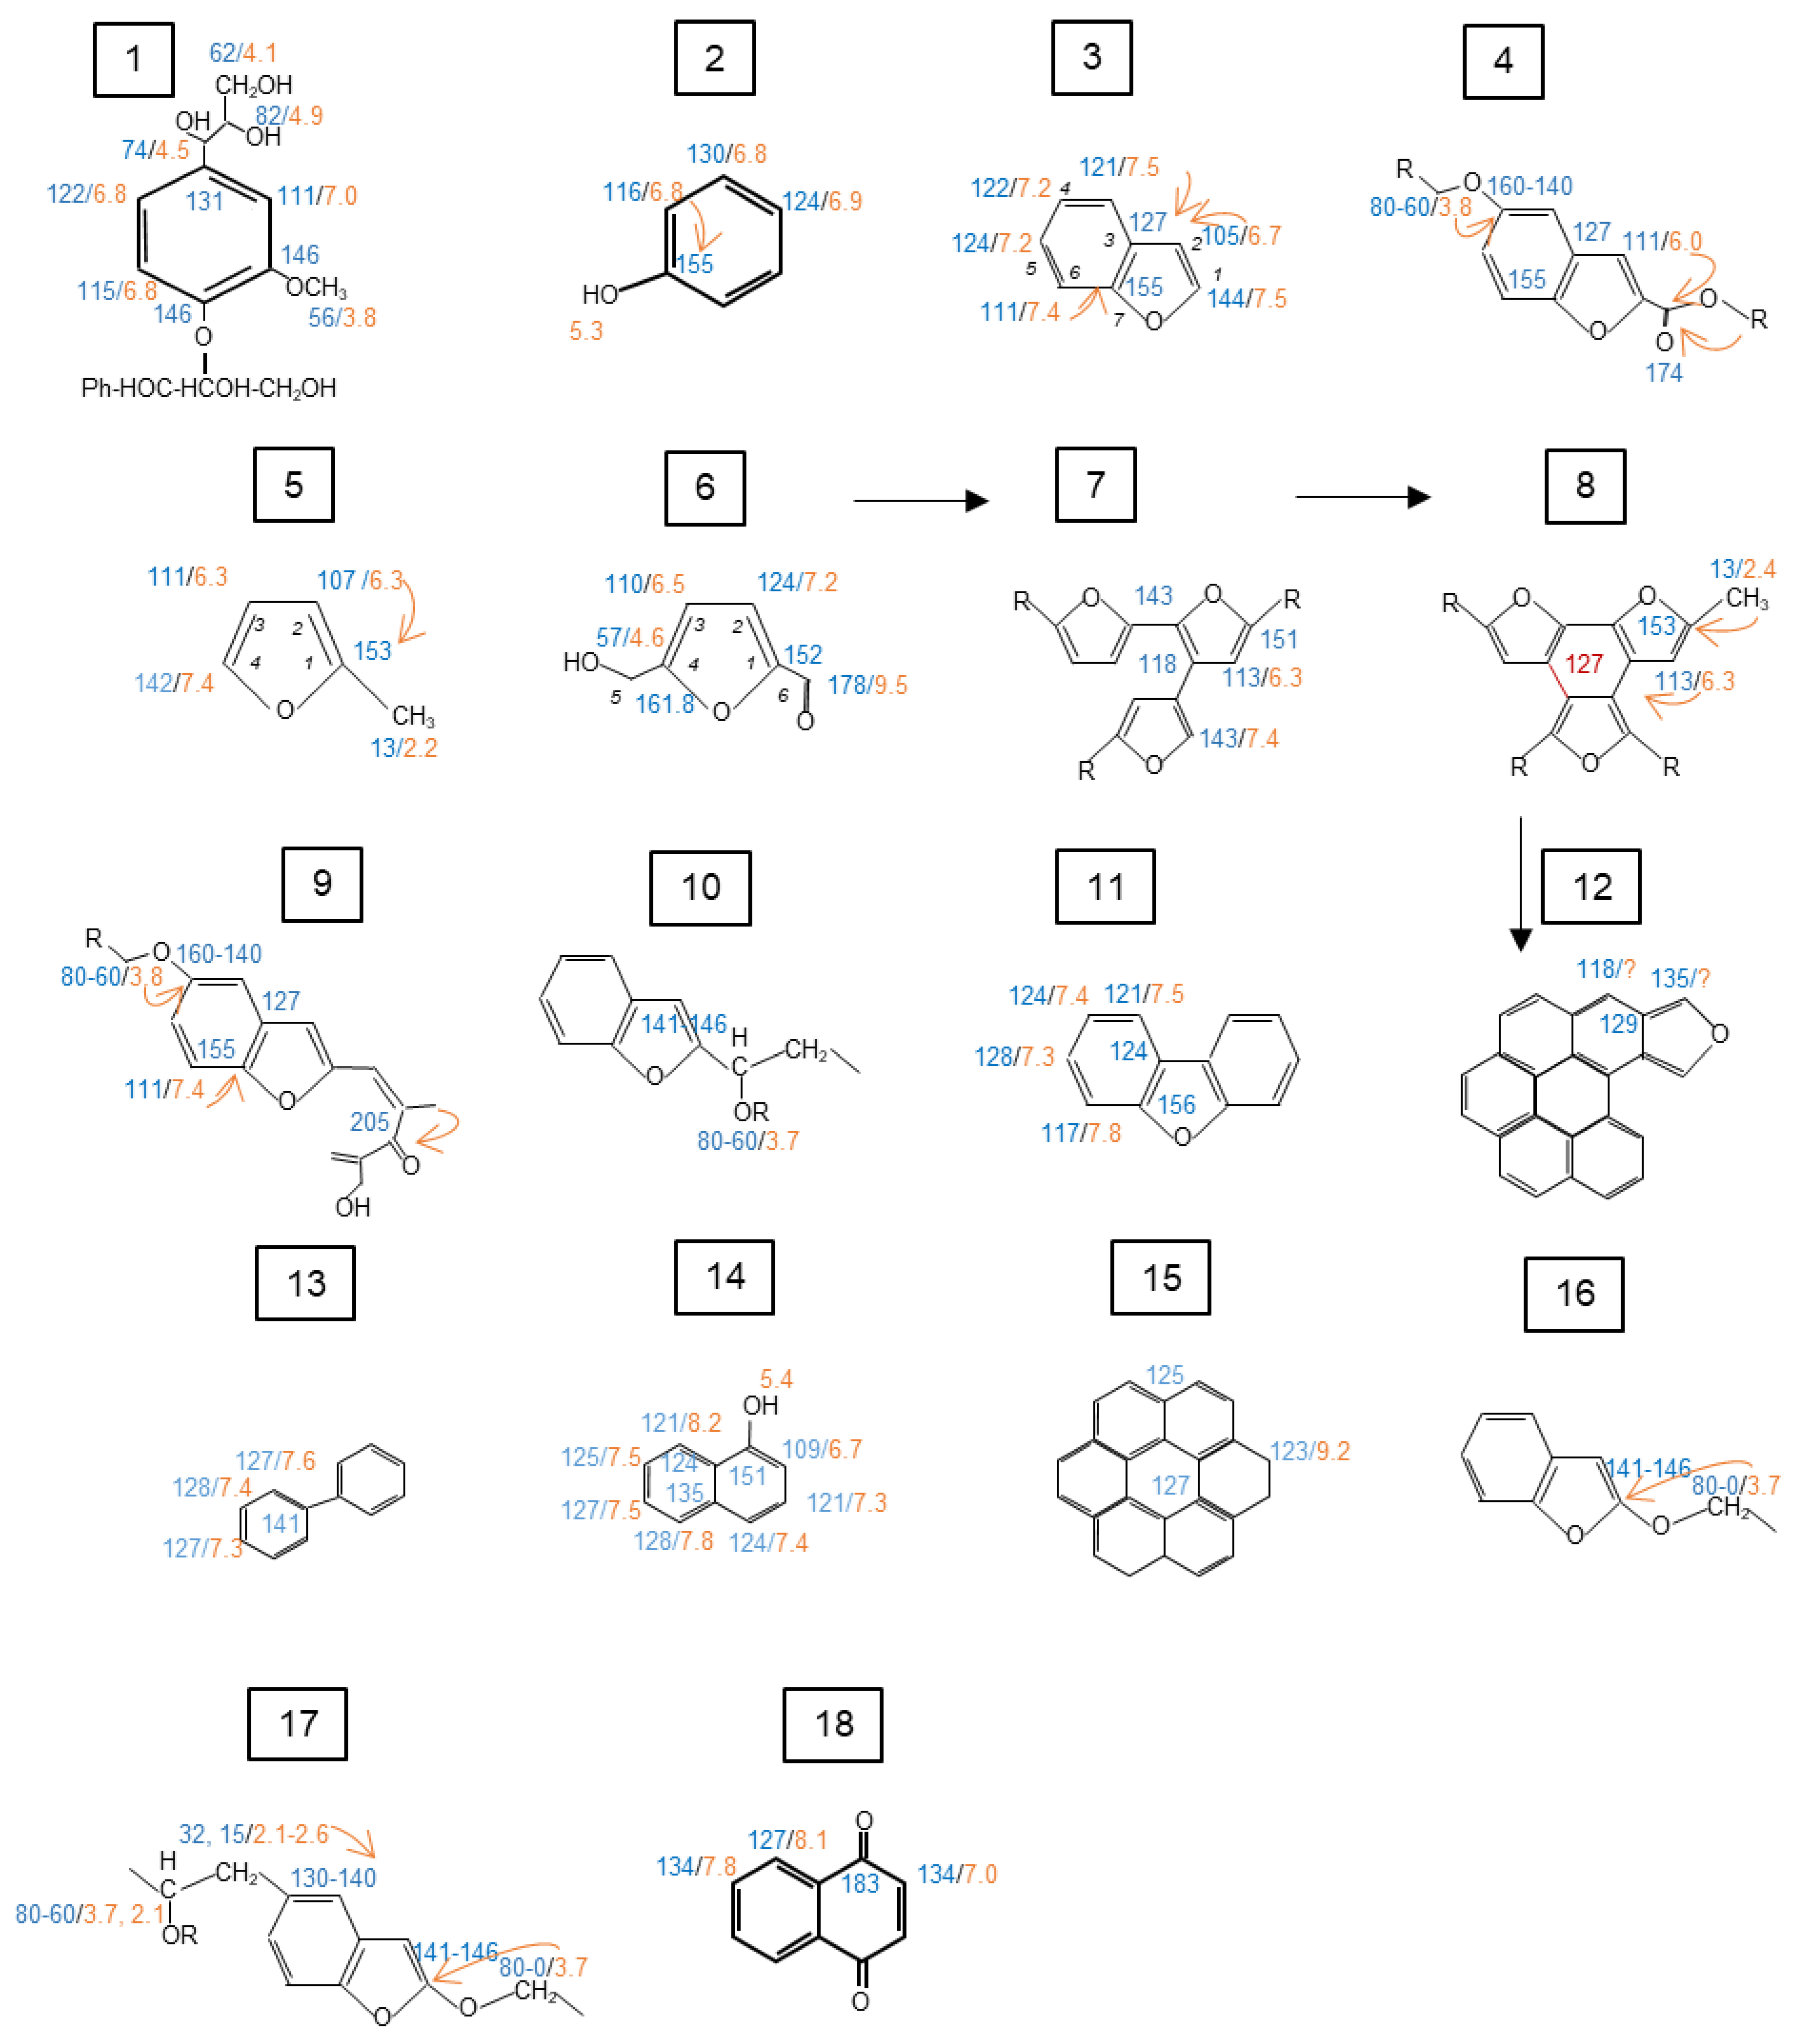
3.3.2. Solid-State 2D 1H-13C HETCOR NMR Spectra of the Cellulose Derived Pyrochar

Alcohols, Furans, Alkene C and Protonated Aromatic C in Cellulose Biochar Produced at 350 °C: In order to obtain more insights into the nature of the aromatic network of the pyrochar produced at 350 °C, the respective solid-state 2D 1H-13C HETCOR NMR spectra are analyzed in more detail (Figure 5). Note that the spectrum obtained with tc = 50 µs (Figure 5a) shows only cross peaks if the 13C is in close proximity 1H. In the most cases this is the case if the two nuclei are directly bound.
Cross peaks are visible in the chemical shift region of O-alkyl C/H (δC/δH 77 to 64 ppm/3 to 5 ppm). The 13C signals around 75 ppm were previously interpreted as deriving from residual or “final” carbohydrates. The latter were suggested to be intermediates, formed during heating up to 325 °C and converting into aromatic structures at higher temperatures [39]. However, the HETCOR spectrum in Figure 5a reveals no signal assignable to anomeric C (δC/δH 95 to 110 ppm/3.5 to 4.5 ppm) of this intermediate or of any other carbohydrate. This suggests that if such intermediates were formed in our experiment they did not survive heating up to 350 °C. The missing of intensity in this region indicates further that in contrast to common interpretation, the signal in the chemical shift region of O-alkyl C in spectra of biochars may derive from alcohols or ether rather than from residual labile carbohydrate residues. Thus, we may conclude that already at 350 °C almost all carbohydrate units have been transformed either into aromatic moieties and alkyl residues or were degraded and released as volatile compounds. Typical chemical shifts for aliphatic alcohols would occur around δC/δH 90 to 50 ppm/3.5 to 5.5 ppm.
Interpretation of 13C NMR spectra of soil organic matter, compost, or biochar often neglects that in addition to aromatic C, the region between 160 and 110 ppm covers resonances of olefin C in alkenes. In the present sample, they may have been formed during heat-induced partial degradation of cellulose units. Their 1Hs resonates between 6.5 and 4.5 ppm and can explain the cross peaks in the respective area in the 2D spectrum in Figure 5a.
Indications for pyrochar constituents other than phenyl units are revealed by the 13C signal appearing between 120 and 110 ppm at δC/δH 111 pm/6.3 ppm which is most likely caused by protonated C3 in furans (Figure 4, structures 4–6) [23]. For benzofurans, C6 can contribute to δC/δH 111 ppm /7.4 ppm (Figure 4, C6 in structure 3).
In the following, we will have a closer look for indications that may support the aromatization during cellulose pyrolysis via the HMF pathway suggested for glucose [43]. HMF (Figure 4, structure 6) gives 13C signals at 178 ppm (C6), 152 ppm (C1), 124 ppm (C2), 110 ppm (C3), 162 ppm (C4), 57 ppm (C5) (https://www.chemicalbook.com/SpectrumEN_67-47-0_13CNMR.htm, accessed on 10 January 2021). The respective 1H chemical shifts are: 9.5 ppm (H6), 7.2 ppm (H2), 6.5 ppm (H3), 4.6 ppm (H5) (https://www.chemicalbook.com/SpectrumEN_67-47-0_1HNMR.htm, accessed on 10 January 2021). However, in the spectrum in Figure 5a, signals assignable to C5 at δC/δH 57 ppm/4.6 ppm, or to aldehyde C around δC/δH 178 ppm/9.5 ppm cannot be identified, suggesting that if present, the contribution of HMF units is below the detection limits.
A further important information deducible from this spectrum is based on the occurrence of the strong signal in the 13C region from 130 to 120 ppm correlating with 1H resonating between 7 and 8 ppm, which evidences that a considerable part of the aromatic network must be protonated. This would be the case for 1H in benzofuran, dibenzofuran, diphenyl or naphthol (Figure 4, structure 3, 11, 13, 14). Thus, the aromatic signal in the respective 1D solid-state 13C NMR spectrum cannot be solely explained by polycondensed aromatic hydrocarbons (PAHs) (Figure 4, structure 15). The outer protonated C of the latter may contribute to the cross peak at δC/δH 130 to 110/8.8 to 9.5 ppm [49].
As determined by [49], pyrene results in 13C NMR signals at 125 ppm, 127 ppm and 131 ppm, its 1H chemical shifts are between 7.6 to 8.2 ppm. 13C and 1H resonances of coronene (Figure 4, structure 15) were reported to occur at 123 ppm, 127 ppm, 125 ppm and 9.2 ppm, respectively [46].
Phenols and the structure of the aromatic network: Increasing tc to 200 µs allows CP between 1H and 13C which are in vicinity but are not directly bonded to each other. Thus, unprotonated Cs receive magnetization from 1H of adjunct C (indicated as arrows in Figure 4). As a consequence, the chemical shift resonance of the unprotonated 13C will correlate with the 1H chemical shift of the neighboring protonated C. As it is indicated by the circles in the spectrum in Figure 5b, this leads to intensity in the 13C chemical shift region between 160 to 130 ppm, typically assigned to C-substituted aryl C (140 to 130 ppm) and O-aryl C (160 to 140 ppm) receiving the magnetization from the 1H of the adjunct aromatic C (δH around 7.5) or alkyl C (δH around 4 to 2 ppm). Indications for the presence of quaternary C connected to alkyl at the rim of PAHs may be given with the 13C intensities between 140 and 130 ppm cross peaking to the 1H chemical shift region around 8.0–8.5 ppm.
Phenol Cs resonate between δC 160 to 140 ppm. Their magnetization derives either from the 1H of the adjunct aromatic C but also from the hydroxyl H. The δH of the latter is reported to be at 5.3 ppm (Figure 4, structure 15). However, here only a very small peak was identified. Substitution with methoxyl-groups (-OCH3) would be indicated by a correlation with the 1H chemical shift around 3.7 ppm but was not evidenced, which is in contrast to former reports suggesting that the aromatic units were connected to the alkyl chains via aromatic ether [50].
Aside from phenol C, the new signals at δC/δH 156, 154, 144 ppm /7.4 ppm which correlate with signals at δC/δH 125–122 ppm, 117 ppm-111 ppm/7.4 ppm can derive from benzofuran or dibenzofuran units (Figure 4, structure 3, 9, 11) as they were suggested to be formed during the pyrolysis of cellulose by Baldock and Smernik [51].
Falco et al. [45] proposed that during hydrothermal carbonization, HMF units fuse which leads to a loss of the two side groups (Figure 4, structure 7). Substitution of their C2 or C3 shifts their signal to 117 ppm which can be polarized by a neighboring C (δC/δH 110–113 ppm/6.3 ppm). A cross peak can be identified at δC/δH 117 ppm/6.3 ppm, but no clear cross signal appears at δC/δH 117 ppm/6.3 ppm. Further condensation of the polyfuran chain shifts the signal further to 127 ppm [43] (Figure 4, structure 8), attributed to a nonprotonated aromatic C. The latter would receive polarization from H2 or H3 in furan (around 6.3 ppm), but our spectrum allows no unbiased support of such an interpretation.
In order to estimate the contribution of intensity of furan structures to the chemical shift region commonly assigned to phenol C, the ratio of the intensities assigned to aromatic C adjunct to O-substituted aromatic C in the chemical shift regions 115 to 100 ppm (I(115–95)) and the total O-substituted aromatic C 160 to 140 ppm (I(160–140)) was calculated. For uncondensed furans and benzofurans, this value is 1 (Figure 4, structure 3, 5). Crosslinking of furan units decreases the value to 0.5 (Figure 4, structure 7, 8). For dibenzofurans a value < 0.5 is expected. For uncondensed phenols this ratio increases to 2, whereas condensation can reduce it to 1 (Figure 4, structure 15). For the present sample a value of 0.5 was obtained which corresponds to furan structures with at least one crosslinked C2 furan or benzofuran. This supports the observation, obtained from the HETCOR NMR spectra, that phenol plays a negligible role within the aromatic network of the studied pyrochar. For a further evaluation of the importance of furan units within the aromatic network in the cellulose char, the ratio O-aryl C-to-total aryl C (I(160–140)/I(160–95)) may be used. Bearing in mind that phenol C plays a minor role, it was estimated that approximately 30% of the aromatic C are attributable to Cα in furan units.
The role of alkyl C for the chemical structure of the cellulose char: According to the 1D NMR spectrum in Figure 3, the O-alkyl and alkyl C (100 to 0 ppm) corresponds to 44% of the total organic C. This divides into 31% for methylene C (45 to 0 ppm) and 13% for O-alkyl C (Table S2). However, for a better evaluation of the role of alkyl C for the properties of the pyrochar, it is important to reveal if this alkyl C represents an integral part of the organic network or occurs as physically and chemically separated residues of only partially degraded cellulose units. A first indication for the former is revealed from the fairly small variation of T1Hs determined for the different chemical shift ranges. They vary between 270 and 330 ms (Table S2) evidencing efficient 1H spin diffusion among the 1H bound to carbonyl, carboxyl, aryl and alkyl C which is only the case if alkyl C is chemically connected the aromatic units. The high uniformity of T1H suggests that the thermally altered cellulose residues maintained their polymeric or oligomeric feature, rather than being the product of depolymerized units that randomly re-condensed to structures with random molecular size distribution. Note that our pyrolysis reactor allowed the escape of volatile compounds released during pyrolysis, which prevented their condensation within the reactor during its cooling after the pyrolysis. However, compared to the unheated cellulose, the T1Hs of the cellulose char are considerably shorter which is in agreement with a loss of molecular rigidity during heating most likely due to loss of stabilizing H-bonds and shortening of the polymer length.
A closer look at the respective HETCOR NMR cross plots unveils further interesting information. In line with their efficient polarization by their adjunct protons, alkyl C was already identified in the HETCOR spectrum obtained with tc = 50 µs (Figure 5a). Increasing tc to 200 µs correlates the alkyl 1H chemical shift region between 2.0 ppm and 5.0 ppm with the aromatic 13C chemical shift region between 150 and 100 ppm demonstrating that a considerable proportion of alkyl H has strong interaction with aromatic units. This confirms the conclusion obtained from the relaxation data that rather than being physically separated, a considerable portion of the alkyl C forms an integrated part of the aromatized char structure. In line with it, the HETCOR spectrum obtained with tc = 1000 µs (Figure 5c) correlates the aromatic δH region (6.5 to 7.5 ppm) to the alkyl C region (60 to 14 ppm). Note that there are no indications for interactions between outer aryl H in PAHs (>7.5 ppm) and alkyl C, allowing the assumption that only a low amount of higher molecular weight PAHs are connected via alkyl bridging. The cross peaks at δC/δH 137/2.6 ppm or δC/δH 133 ppm/2.1 ppm in Figure 5b, demonstrate that unprotonated aryl C is connected to methyl C (δC: 32 and 15 ppm). Bearing in mind that with the information of Figure 5c, this aryl C cannot be associated to high molecular weight PAHs, since no clear cross signals are seen at δC/δH 45 to 0 ppm/ > 7.5 ppm. However, since the aryl H signal at 2.1 ppm shows a further correlation with the 13C signal at 69 ppm, the bridging methyl C must be in close vicinity to O-alkyl C, possibly because they are connected via ether bond (Figure 4, structure 17).
As mentioned above, we have no evidence that the signals in the O-alkyl C region derive from remaining cellulose derivatives as they are described by Wooten et al. [39]. Thus, an interpretation as ethers is more appropriate. The signal at δC/δH 146 to 142 ppm/3.7 ppm in the spectrum obtained with tc = 200 µs (Figure 5b) points to cross linking of these O-alkyl C to furan C (Figure 3, structure 10). The presence of methoxyl groups bound to phenyl units giving rise to cross peaks around δC/δH 56 ppm, 160–140 ppm/7.5, 3.8 ppm were not identified.
Further information obtained from the 2D 1H-13C HETCOR NMR spectrum obtained with tc = 1000 µs (ketones and carboxylic C): The long-range coupling between 13C and 1H during a CT = 1000 µs, leads to a highly complex 2D 1H-13C HETCOR NMR cross plot (Figure 5c) and an attempt to identify structural features has to be done with caution to avoid overinterpretation. The broad signals obtained in the 13C chemical shift region attributed to aromatic C (160 to 100 ppm) covers the total 1H chemical shift region except that assigned to aldehyde H or outer rim H in PAHs. On the other hand, cross peaks between 200 and 210 ppm and between 190 to 160 ppm in the 13C dimension are identified and can be attributed to ketones and carboxyl C. The fact that those signals need a tc = 1000 µs to appear in a spectrum indicates that most of them have no adjunct protonated C. Thus, the respective protons providing polarization have to be at least an equivalent of three bonds apart from the carbon. The signal at δC/δH 187 ppm/6.65 ppm may indicate carbonic acid anhydride bridging to aromatic/furan units or quinones (Figure 4, structure 18). At δC/δH 174 ppm/6.2 ppm appears a cross signal, suggesting a carboxyl C connected either to a vinyl or furan unit. The cross peaks at δC/δH 174 ppm/3.8 ppm and δC/δH 174 ppm/2.2 ppm suggest the presence of methyl esters (Figure 4, structure 4).
The ketone signals at δC/δH 205 ppm/3.6 ppm and δC/δH 205 ppm/1.9 ppm propose their interactions with O-alkyl H and methyl H (Figure 4, structure 9). The signal at 211 ppm/1.9 ppm is explained with long range interactions between ketone and CH2 units. No cross peak can be revealed between ketones and aromatic or furan C. Signals assignable to quinones weren’t either detected (δC: 200 to 190 ppm). Thus, the 13C signal between 200 and 215 ppm may be best explained with ketones which are an integrated part of the bridging alkyl. The 13C signal at 164 ppm correlates with δH 6.18 and 5.3 ppm which would also allow an assignment to carboxyl groups interaction with vinyl or furan units rather than to phenyl C.

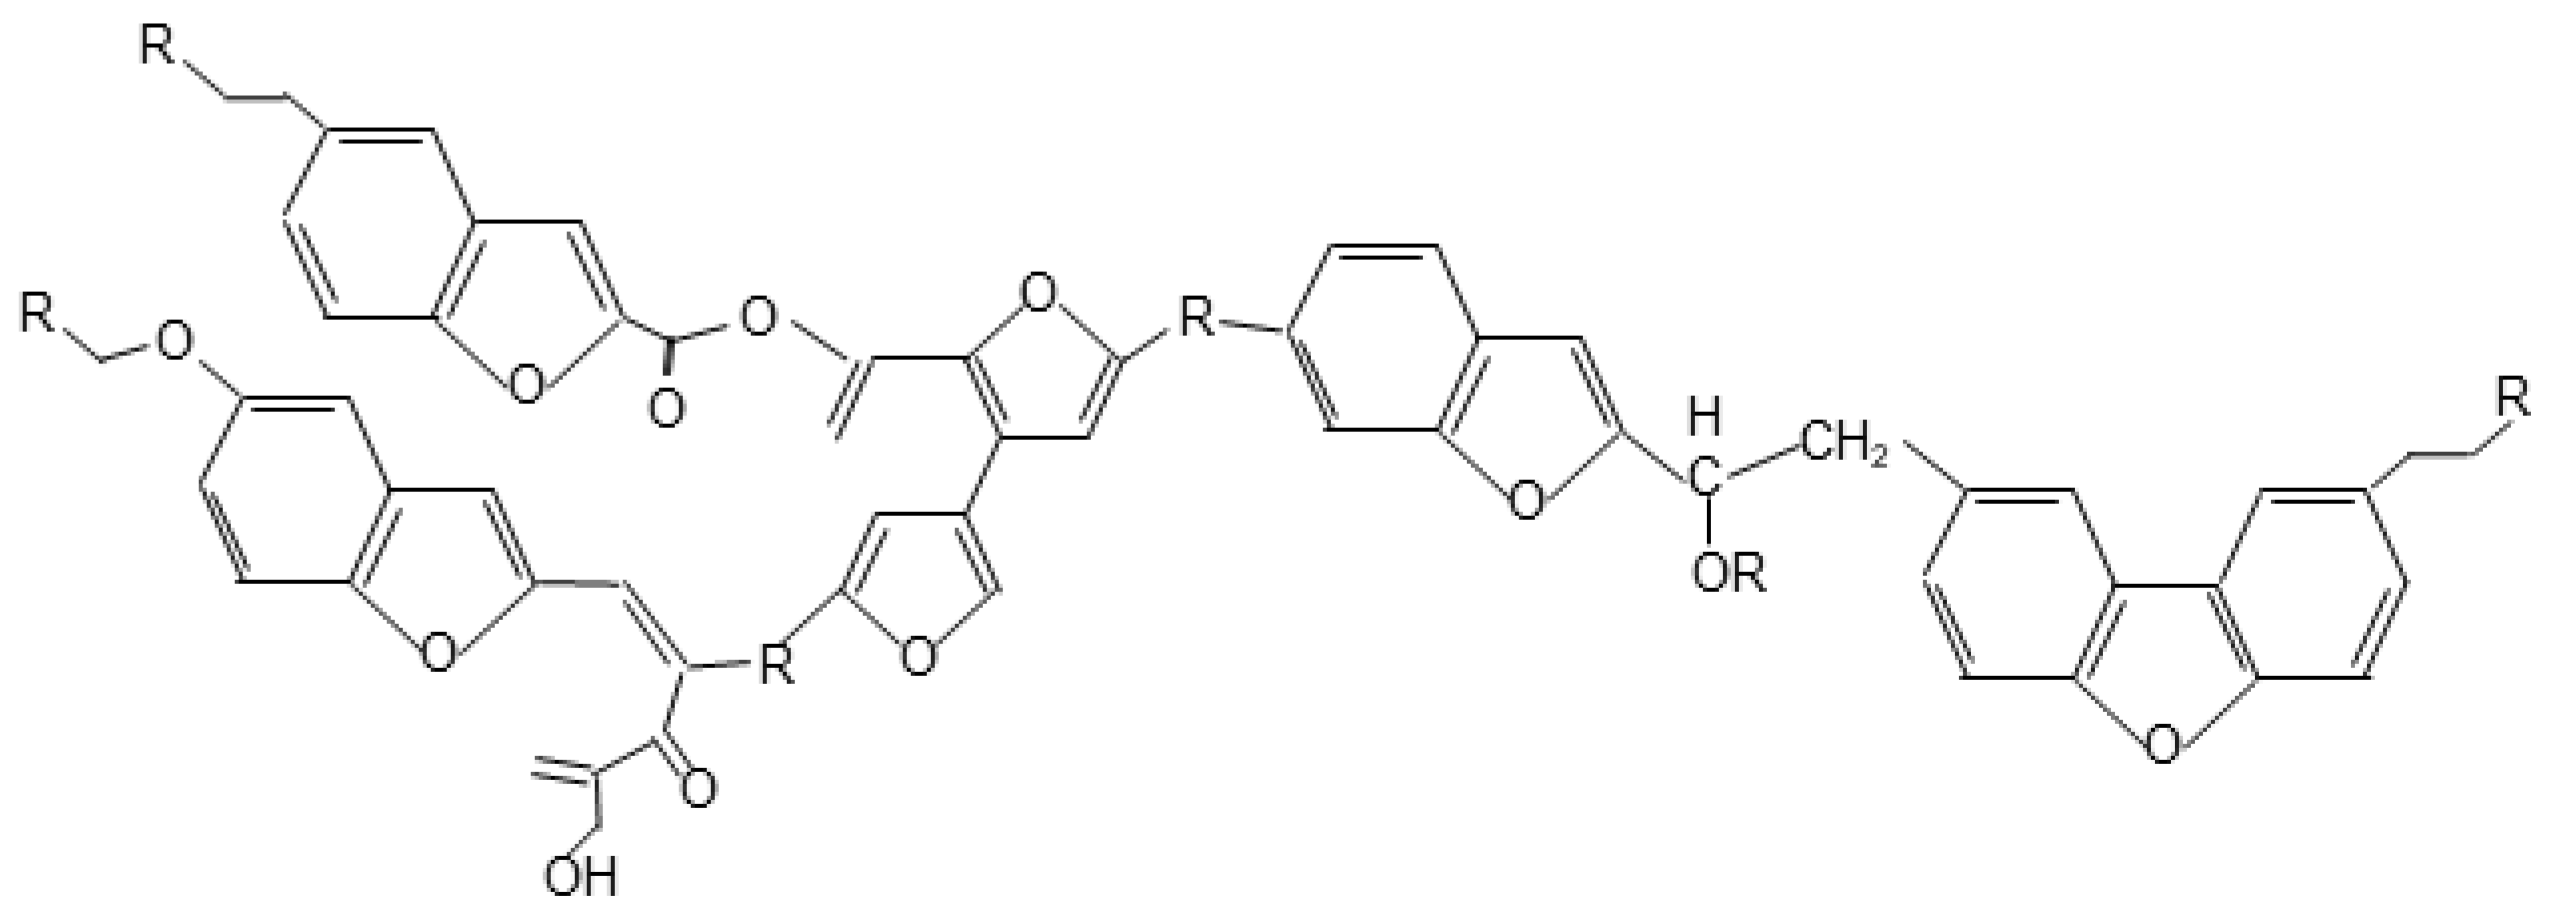
4. Implications of the Findings for a Better Understanding of the Nature of Biochar

The present analysis of the cellulose char produced at a 350 °C by 2D NMR spectroscopic techniques taught us that the common assignment of the aromatic C signal in the 1D 13C NMR spectrum to PAH structures of which some of outer rim carbons are substituted by hydroxyl groups represents an oversimplified interpretation. The application of this technique unveiled new information about the nature of the aromatic network in pyrochar that is rarely accessible by other techniques but highly valuable for a better predication of the efficiency of biochar application to compost and soils. One major observation is that almost all–if not all-O-aryl Cs occur in furan and benzofuran-type structures contributing to a network with few domains of high molecular weight PAHs. Figure 6 shows a model of the cellulose derived char network including the main constituents that were identified in the present work.
Indeed, furan and benzofuran-type structures seem to play a more important role for defining the overall structure and properties of the residual char than commonly assumed. In the present sample, their Cα comprises 30% of the total aromatic C, since phenols were identified as negligible entity. Rather than carboxyl groups, they explain the oxygen content of the sample. This finding will certainly have some practical implications and may improve our understanding of the behavior of low-temperature biochar in soils or as filtering system, since the nature of the oxygen functions within the aromatic network affects not only sorption of cations or organic molecules, wettability of the sample, but also the accessibility of aromatic domains for microbial degradation. Bearing in mind the high cellulose content of woody biomass, it can be concluded that these furan/benzofuran-type domains are indeed more relevant in defining the physical and chemical properties of a wood-derived biochar than generally considered.
Further important information obtained from the present analysis is related to the nature of the alkyl residues. This fraction has been interpreted as extractable not yet condensed low molecular weight degradation products or residual carbohydrates [39]. They are supposed to be highly accessible to further thermal degradation and after the application of the biochar to soils and compost to microbial decomposition [40]. The results obtained in the present study show a different picture. There is strong evidence that rather than being separate entities, a considerable part of the alkyl and O-alkyl groups are directly connected to the aromatic domains. This is in line with observations by [52] suggesting that above 300 °C, a three-dimensional network was formed from oligosaccharides, aliphatic hydrocarbons and aromatics which are connected via ether linkages, although remaining saccharides must have been already transformed at the temperature used in our study. Carboxyl and carbonyl functional groups seem to be mainly incorporated into these alkyl chains. However, the question if the alkyl C and carbonyl C entities act preferentially as bridging units between the different aromatic domains or occur as side chains cannot be unbiasedly answered with the data obtained here. On the other hand, considering that those units contribute with 52% to the total organic C of the pyrochar, it is expected that they are not only determining the molecular structure and rigidity of its aromatic network but are also having an impact on its physical and chemical properties. Depending whether they occur as side chains or bridging unit, their influence on porosity, thus gas diffusion, accessibility of nutrients, water, or microorganisms will be different. Comparably, their contribution to interactions with the compost or soil components will vary.
Although the present study, analyzing a pyrochar obtained at a certain temperature demonstrated already the potential of solid-state 2D HETCOR 13C NMR spectroscopy for a better description of molecular properties of biochars, it did not yet provide an answer to the question how this furan/benzofuran-type based network is formed and how it will develop with increasing pyrolysis temperature. This is certainly of high interest in particular for chemists and from an engineering point of view. For agronomy or composting application, however, this question seems to be of less importance, at least at a first glance. On the other hand, obtaining a better and more detailed understanding at the molecular level of how pyrolysis conditions, feedstock composition or aging of a biochar alter the chemical structure and properties of the pyrolytic product, can put us a step further in designing bio- or pyrochars which more efficiently serve their intended use.

Supplementary Materials

The following are available online at https://www.mdpi.com/article/10.3390/app11188569/s1, Figure S1: Relative 13C intensity of the different chemical shift regions a functions of the contact time. The intensity is calibrated to the maximal signal intensity detected during the experiment. Note, no indications for a larger fraction of aromatic C with long CP times are indicated., Table S1: Cross polarization dynamics with cross polarization rate (TCH) and spin-lattice relaxation time in the rotating frame (T1ρH) of a pyrochar derived from cellulose and charred at 350 °C for 1 h. The data were obtained by fitting with a two component model with NMR-Relax provided by CMK (Munich, Germany) and based on Equation (1) [1,2], Table S2: Intensity distribution in the 1D solid-state 13C CPMAS NMR spectrum of a cellulose derived pyrochar produced after pyrolysis at 350 °C for 1 h and the respective 1H spin-lattice relaxation times (T1H).

Author Contributions

Conceptualization, H.K.; methodology, H.K. and M.V.-M.; validation, H.K., M.K. and M.V.-M.; formal analysis, H.K. and M.K.; investigation, and data curation H.K., M.V.-M. and M.K.; writing—original draft preparation, H.K.; writing—review and editing, H.K. and M.V.-M.; visualization, H.K.; supervision, project administration and funding acquisition, H.K.; software, M.K. All authors have read and agreed to the published version of the manuscript.

Funding

This research was funded by The Spanish Ministry of Economy, Industry and Competitiveness (MINEICO) and AEI/FEDER [project CGL2015-64811-P].

Institutional Review Board Statement

Not applicable.

Informed Consent Statement

Not applicable.

Data Availability Statement

The data presented in this study are available on request from the corresponding author.

Acknowledgments

We thank José María García de Castro Barragán for providing the photo of the reactor used for the graphical abstract.

Conflicts of Interest

The authors declare no conflict of interest. The funders had no role in the design of the study; in the collection, analyses, or interpretation of data; in the writing of the manuscript, or in the decision to publish the results.

References

  1. You, K.; Zhou, Z.; Gao, C.; Yang, Q. One-Step Preparation of Biochar Electrodes and Their Applications in Sediment Microbial Electrochemical Systems. Catalysts 2021, 11, 508. [Google Scholar] [CrossRef]
  2. Schmidt, H.P.; Hagemann, N.; Draper, K.; Kammann, C. The use of biochar in animal feeding. PeerJ 2019, 7, e7373. [Google Scholar] [CrossRef] [Green Version]
  3. Mendez, A.; Terradillos, M.; Gasco, G. Physicochemical and agronomic properties of biochar from sewage sludge pyrolysed at different temperatures. J. Anal. Appl. Pyrolysis 2013, 102, 124–130. [Google Scholar] [CrossRef]
  4. Nocentini, M.; Panettieri, M.; García de Castro Barragán, J.M.; Mastrolonardo, G.; Knicker, H. Recycling pyrolyzed organic waste from plant nurseries, rice production and shrimp industry as peat substitute in potting substrates. J. Environ. Manag. 2021, 277, 111436. [Google Scholar] [CrossRef]
  5. Campos, P.; De la Rosa, J.M. Assessing the Effects of Biochar on the Immobilization of Trace Elements and Plant Development in a Naturally Contaminated Soil. Sustainability 2020, 12, 6025. [Google Scholar] [CrossRef]
  6. Campos, P.; Miller, A.Z.; Prats, S.A.; Knicker, H.; Hagemann, N.; De la Rosa, J.M. Biochar amendment increases bacterial diversity and vegetation cover in trace element-polluted soils: A long-term field experiment. Soil Biol. Biochem. 2020, 150, 108014. [Google Scholar] [CrossRef]
  7. Medina, J.; Monreal, C.M.; Antilén, M.; Calabi-Floody, M.; Velasco-Molina, M.; Meier, S.; Borie, F.; Cornejo, P.; Knicker, H. Influence of inorganic additives on wheat straw composting: Characterization and structural composition of organic matter derived from the process. J. Environ. Manag. 2020, 260, 110137. [Google Scholar] [CrossRef]
  8. Antonangelo, J.A.; Sun, X.; Zhang, H. The roles of co-composted biochar (COMBI) in improving soil quality, crop productivity, and toxic metal amelioration. J. Environ. Manag. 2021, 277, 111443. [Google Scholar] [CrossRef]
  9. Zhang, X.; Wang, H.; He, L.; Lu, K.; Sarmah, A.; Li, J.; Bolan, N.S.; Pei, J.; Huang, H. Using biochar for remediation of soils contaminated with heavy metals and organic pollutants. Environ. Sci. Pollut. Res. 2013, 20, 8472–8483. [Google Scholar] [CrossRef]
  10. Wiedemeier, D.B.; Abiven, S.; Hockaday, W.C.; Keiluweit, M.; Kleber, M.; Masiello, C.A.; McBeath, A.V.; Nico, P.S.; Pyle, L.A.; Schneider, M.P.W.; et al. Aromaticity and degree of aromatic condensation of char. Org. Geochem. 2015, 78, 135–143. [Google Scholar] [CrossRef] [Green Version]
  11. Novak, J.M.; Busscher, W.J. Selection and Use of Designer Biochars to Improve Characteristics of Southeastern USA Coastal Plain Degraded Soils. In Advanced Biofuels and Bioproducts; Lee, J.W., Ed.; Springer: New York, NY, USA, 2013; pp. 69–96. ISBN 978-1-4614-3348-4. [Google Scholar]
  12. Zhao, S.-X.; Ta, N.; Wang, X.-D. Effect of Temperature on the Structural and Physicochemical Properties of Biochar with Apple Tree Branches as Feedstock Material. Energies 2017, 10, 1293. [Google Scholar] [CrossRef] [Green Version]
  13. Campos, P.; Miller, A.Z.; Knicker, H.; Costa-Pereira, M.F.; Merino, A.; De la Rosa, J.M. Chemical, physical and morphological properties of biochars produced from agricultural residues: Implications for their use as soil amendment. Waste Manag. 2020, 105, 256–267. [Google Scholar] [CrossRef] [PubMed]
  14. Wang, Q.; Song, H.; Pan, S.; Dong, N.; Wang, X.; Sun, S. Initial pyrolysis mechanism and product formation of cellulose: An Experimental and Density functional theory(DFT) study. Sci. Rep. 2020, 10, 3626. [Google Scholar] [CrossRef] [PubMed]
  15. Yang, H.; Yan, R.; Chen, H.; Lee, D.H.; Zheng, C. Characteristics of hemicellulose, cellulose and lignin pyrolysis. Fuel 2007, 86, 1781–1788. [Google Scholar] [CrossRef]
  16. Lédé, J. Cellulose pyrolysis kinetics: An historical review on the existence and role of intermediate active cellulose. J. Anal. Appl. Pyrolysis 2012, 94, 17–32. [Google Scholar] [CrossRef]
  17. Lehmann, J. A handful of carbon. Nature 2007, 447, 143–144. [Google Scholar] [CrossRef] [PubMed]
  18. van Rossum, B.J.; Förster, H.; de Groot, H.J.M. High-Field and High-Speed CP-MAS13C NMR Heteronuclear Dipolar-Correlation Spectroscopy of Solids with Frequency-Switched Lee–Goldburg Homonuclear Decoupling. J. Magn. Reson. 1997, 124, 516–519. [Google Scholar] [CrossRef]
  19. Bronnimann, C.E.; Ridenour, C.F.; Kinney, D.R.; Maciel, G.E. 2D 1H-133C heteronuclear correlation spectra of representative organic solids. J. Magn. Reson. 1992, 97, 522–534. [Google Scholar] [CrossRef]
  20. Lattao, C.; Birdwell, J.; Wang, J.J.; Cook, R.L. Studying organic matter molecular assemblage within a whole organic soil by nuclear magnetic resonance. J. Environ. Qual. 2008, 37, 1501–1509. [Google Scholar] [CrossRef]
  21. Mao, J.D.; Xing, B.; Schmidt-Rohr, K. New structural information on a humic acid from two-dimensional 1H-13C correlation solid-state nuclear magnetic resonance. Environ. Sci. Technol. 2001, 35, 1928–1934. [Google Scholar] [CrossRef]
  22. Chu, W.; Cao, X.; Schmidt-Rohr, K.; Birdwell, J.E.; Mao, J. Investigation into the Effect of Heteroatom Content on Kerogen Structure Using Advanced 13 C Solid-State Nuclear Magnetic Resonance Spectroscopy. Energy Fuels 2019, 33, 645–653. [Google Scholar] [CrossRef]
  23. Le Brech, Y.; Delmotte, L.; Raya, J.; Brosse, N.; Gadiou, R.; Dufour, A. High resolution solid state 2D NMR analysis of biomass and biochar. Anal. Chem. 2015, 87, 843–847. [Google Scholar] [CrossRef] [PubMed]
  24. Fengel, D.; Wegener, G. Wood: Chemistry, Ultrastructure, Reaction; De Gruyter: Berlin, Germany, 1984. [Google Scholar]
  25. Haider, K. Problems related to the humification processes in soils of temperate climate. In Soil Biochemistry; Bollag, J.-M., Stotzky, G., Eds.; Marcel Dekker: New York, NY, USA, 1991; Volume 7, pp. 55–94. [Google Scholar]
  26. Sun, H.; Hockaday, W.C.; Masiello, C.A.; Zygourakis, K. Multiple Controls on the Chemical and Physical Structure of Biochars. Ind. Eng. Chem. Res. 2012, 51, 3587–3597. [Google Scholar] [CrossRef]
  27. Mehring, M. High Resolution NMR in Solids, 2nd ed.; Springer: Berlin, Germany, 1983. [Google Scholar]
  28. Abelmann, K.; Totsche, K.U.; Knicker, H.; Kögel-Knabner, I. CP dynamics of heterogeneous organic material: Characterization of molecular domains in coals. Solid State Nucl. Magn. Reson. 2004, 25, 252–266. [Google Scholar] [CrossRef] [PubMed]
  29. Knicker, H.; Hilscher, A.; González-Vila, F.J.; Almendros, G. A new conceptual model for the structural properties of char produced during vegetation fires. Org. Geochem. 2008, 39, 935–939. [Google Scholar] [CrossRef] [Green Version]
  30. Knicker, H. “Black nitrogen”—An important fraction in determining the recalcitrance of charcoal. Org. Geochem. 2010, 41, 947–950. [Google Scholar] [CrossRef]
  31. Schmidt, H.P.; Bucheli, T.; Kammann, C.; Glaser, B.; Abiven, S.; Leifeld, J. EBC European Biochar Certificate Guidelines for a Sustainable Production of Biochar. European Biochar Certificate. 2021. Available online: https://www.european-biochar.org/en/ct/2-EBC-guidelines-documents-for-the-certification (accessed on 6 August 2021).
  32. Teeäär, R.; Lippmaa, E. Solid state 13C NMR of cellulose. A relaxation study. Polym. Bull. 1984, 12, 315–318. [Google Scholar] [CrossRef]
  33. Pines, A.; Gibby, G.G.; Waugh, J.S. Proton-enhanced NMR of dilute spins in solids. J. Chem. Phys. 1973, 59, 569–590. [Google Scholar] [CrossRef]
  34. Knicker, H. Solid state CPMAS 13C and 15N NMR spectroscopy in organic geochemistry and how spin dynamics can either aggravate or improve spectra interpretation. Org. Geochem. 2011, 42, 867–890. [Google Scholar] [CrossRef]
  35. Wilson, M.A. NMR Techniques and Applications in Geochemistry and Soil Chemistry; Pergamon Press: Oxford, UK, 1987. [Google Scholar]
  36. Kalinowski, H.-O.; Berger, S.; Braun, S. 13C NMR Spektroskopie; Thieme: Stuttgart, Germany, 1984. [Google Scholar]
  37. Earl, W.L.; VanderHart, D.L. Observations by high-resolution carbon-13 nuclear magnetic resonance of cellulose I related to morphology and crystal structure. Macromolecules 1981, 14, 570–574. [Google Scholar] [CrossRef]
  38. Atalla, R.H.; VanderHart, D.L. The role of solid state 13C NMR spectroscopy in studies of the nature of native celluloses. Solid State Nucl. Magn. Reson. 1999, 15, 1–19. [Google Scholar] [CrossRef]
  39. Wooten, J.B.; Seeman, J.I.; Hajaligol, M.R. Observation and Characterization of Cellulose Pyrolysis Intermediates by 13C CPMAS NMR. A New Mechanistic Model. Energy Fuels 2004, 18, 1–15. [Google Scholar] [CrossRef]
  40. McBeath, A.V.; Smernik, R.J.; Krull, E.S.; Lehmann, J. The influence of feedstock and production temperature on biochar carbon chemistry: A solid-state 13C NMR study. Biomass Bioenergy 2014, 60, 121–129. [Google Scholar] [CrossRef]
  41. Bourke, J.; Manley-Harris, M.; Fushimi, C.; Dowaki, K.; Nunoura, T.; Antal, M.J. Do All Carbonized Charcoals Have the Same Chemical Structure? 2. A Model of the Chemical Structure of Carbonized Charcoal. Ind. Eng. Chem. Res. 2007, 46, 5954–5967. [Google Scholar] [CrossRef]
  42. Ben, H.; Hao, N.; Liu, Q.; Ragauskas, A.J. Solid-State NMR Investigation of Bio-chars Produced from Biomass Components and Whole Biomasses. BioEnergy Res. 2017, 10, 1036–1044. [Google Scholar] [CrossRef]
  43. Falco, C.; Perez Caballero, F.; Babonneau, F.; Gervais, C.; Laurent, G.; Titirici, M.-M.; Baccile, N. Hydrothermal Carbon from Biomass: Structural Differences between Hydrothermal and Pyrolyzed Carbons via 13C Solid State NMR. Langmuir 2011, 27, 14460–14471. [Google Scholar] [CrossRef] [Green Version]
  44. Mettler, M.S.; Vlachos, D.G.; Dauenhauer, P.J. Top ten fundamental challenges of biomass pyrolysis for biofuels. Energy Environ. Sci. 2012, 5, 7797–7809. [Google Scholar] [CrossRef]
  45. Falco, C.; Baccile, N.; Titirici, M.-M. Morphological and structural differences between glucose, cellulose and lignocellulosic biomass derived hydrothermal carbons. Green Chem. 2011, 13, 3273. [Google Scholar] [CrossRef] [Green Version]
  46. Schulman, J.M.; Disch, R.L. Aromatic Character of [n]Helicenes and [n]Phenacenes. J. Phys. Chem. A 1999, 103, 6669–6672. [Google Scholar] [CrossRef]
  47. Pu, Y.; Hallac, B.; Ragauskas, A.J. Plant Biomass Characterization: Application of Solution- and Solid-State NMR Spectroscopy. In Aqueous Pretreatment of Plant Biomass for Biological and Chemical Conversion to Fuels and Chemicals; John Wiley & Sons, Ltd.: Chichester, UK, 2013; pp. 369–390. ISBN 9780470975831. [Google Scholar]
  48. Reich, H. Hans Reich’s Collection. NMR Spectroscopy. Available online: https://organicchemistrydata.org/hansreich/resources/nmr/?page=nmr-content%2F (accessed on 20 January 2021).
  49. Thonhauser, T.; Ceresoli, D.; Marzari, N. NMR shifts for polycyclic aromatic hydrocarbons from first-principles. Int. J. Quantum Chem. 2009, 109, 3336–3342. [Google Scholar] [CrossRef] [Green Version]
  50. Sekiguchi, Y.; Frye, J.S.; Shafizadeh, F. Structure and formation of cellulosic chars. J. Appl. Polym. Sci. 1983, 28, 3513–3525. [Google Scholar] [CrossRef]
  51. Baldock, J.A.; Smernik, R.J. Chemical composition and bioavailability of thermally altered Pinus resinosa (Red pine) wood. Org. Geochem. 2002, 33, 1093–1109. [Google Scholar] [CrossRef]
  52. Xin, S.; Yang, H.; Chen, Y.; Yang, M.; Chen, L.; Wang, X.; Chen, H. Chemical structure evolution of char during the pyrolysis of cellulose. J. Anal. Appl. Pyrolysis 2015, 116, 263–271. [Google Scholar] [CrossRef]
Figure 1. Scheme of the cross polarization process (a) and the 13C intensity of O-alkyl C as a function of contact time measured for a soil sample (Cambisol, Ah horizon from the Sierra de Aznalcóllar, Southern Spain) with and without demineralization with hydrofluoric acid (HF) (10% v/v) (b) modified from [34].
Applsci 11 08569 g001
Figure 2. Solid-state 1D 13C NMR spectrum of α–cellulose, its intensity distribution, the T1H determined for the respective signal and the chemical structure of cellulose (a), the respective 2D 1H-13C HETCOR NMR spectra obtained with a contact time, tc = 50 µs (b), tc = 200 µs (c) and tc = 1000 µs (d).
Applsci 11 08569 g002
Figure 3. Solid-state 1D NMR spectra of charred cellulose produced after pyrolysis of 350 °C (a) and incomplete combustion in the presence of oxygen for 4 and 8 min (b) [29]. The asterisks indicate spinning side bands, which result from the modulation of the magnetic field at the spinning frequency and contain intensity of the parent signal (in this case the aryl C).
Applsci 11 08569 g003
Figure 4. Chemical structures (1–18) that are potentially present in the pyrochar produced from cellulose pyrolyzed at 350 °C for 1 h. Their 13C chemical shifts are given in blue and their 1H chemical shifts are indicated in orange. Potential cross polarization of unprotonated carbons by neighboring protons of adjunct carbons are indicated by orange arrows. The chemical shift assignments were obtained from literature values [23,36,45,46,47,48] and https://www.chemicalbook.com (accessed on 20 January 2021).
Applsci 11 08569 g004
Figure 5. Solid-state 2D 1H-13C HETCOR NMR spectra from cellulose charred at 350 °C for 1 h obtained with tc = 50 µs (a), 200 µs (b) and 1000 µs (c). Lines indicate the chemical shifts of selected the cross peaks. 13C and 1H chemical shifts of cross peaks are given in blue and orange, respectively.
Applsci 11 08569 g005
Figure 6. Conceptual model describing the aromatic network in the cellulose residue pyrolyzed at 350 °C for 1 h according to compounds identified with the solid-state 2D 1H-13C HETCOR NMR technique.
Applsci 11 08569 g006
Table 1. Elemental composition, atomic H/C (H/Catm) and O/C (O/Catm), pH of cellulose (Ce25) and its pyrochar (Ce350) produced by pyrolysis at 350 °C for 1 h.
Weight-Loss
(%)
C
(g/kg)
H
(g/kg)
O 1
(g/kg)
H/CatmO/CatmpH
Ce250419.1±1.359.5±0.5521.41.70.97.2
Ce35064701.1±3.442.8±1.0256.10.70.35.0
1 calculated by difference.
Publisher’s Note: MDPI stays neutral with regard to jurisdictional claims in published maps and institutional affiliations.

