Abstract
Multifold effects of the COVID-19 global health crisis and economic lockdowns are reflected in the insurance industry, and are predicted to expand to the post-COVID-19 era. It is expected that, within a short period of time, the current worldwide situation, in regards to the coronavirus pandemic, will be reflected in new trends, regarding customer behavior, organizational management, and culture, as well as reveal improved business management models, legacy infrastructure, and service systems in insurance organizations. Here, a focus on end-user preferences, data, and their behavior modeling in digital platforms are major practical drivers within the modern insurance concept, but there is a paucity of researches within the theoretical synthesis of consumer decision-making (CDM) models, information system theories, and behavioral economics concerning modern insurance-specific value chains and digitalized decision-making processes. Therefore, the following research aims to expand upon the existing scientific knowledge of end-user behavioral patterns and process frameworks in the Baltic insurance market, by including and examining a factor group of technological enablers and a digital environment. Research results in digitalization, personalization, and customization levels within the Baltic non-life insurance market are homogenous with a leading position of Estonia and overall evaluations ranging between Satisfied and Rather Good. There are also three major factor groups and process stages identified, which influence insurance purchase decision-making in digital insurance platforms in the Baltic market.
1. Introduction
Countries across the world underwent an unprecedented global health crisis and subsequent lockdowns in 2020–2021 due to the coronavirus disease (COVID-19) pandemic, moreover, social and economic outcomes are still hard to predict at a full scope. It is argued that insurance organizations should focus on the development of hybrid service-based and customer-driven business models, sustainable and innovative digital products, and consolidations, with InsurTech and technology companies, for better digitization of distribution channels [1,2]. The ongoing global pandemic has revealed a lack of flexibility, emotional connection, and data harmonization with the day-to-day needs of end-users, as well as personalized, situation-based, and easily customizable insurance services, as a part of practical improvements toward the modern insurance [3,4]. It is important to note intensive and dynamic changes in the market structure, which are mostly determined by a high competition among traditional peers and new virtual incumbents, non-traditional insurance service providers, such as “Big Tech”, and product manufacturers [5,6].
From a theoretical point of view, the research refers to predecessor studies in the field of non-life insurance consumer decision-making, such as Hsee and Kunreuther (2000) [7], Kunreuther and Pauly (2006; 2015) [8,9], and a cross-border study report by the European Commission (2017) [10]. The present research also follows key findings and limitations of scientific studies on behavioral patterns in the Baltic insurance market, such as research by Kiyak and Pranckevičiūtė (2014) [11], and longitudinal studies conducted by Ulbinaitė et al. (2010, 2011, 2013) [12,13,14,15]. Additionally, novel studies of comparison websites [2], multi-sided platforms [1] in the insurance industry and the Service-Dominant Architecture (SDA) [16], as well as insurance literacy [16,17], were considered. However, a recent increase in practical demands for hyper-personalized support services and digitally customized insurance outcomes of on-demand and usage-based insurance reveal a research gap. There is a need for a multi-tier factor evaluation of the digital insurance environment and multi-agent-based model simulations oriented toward decision making in digital insurance platforms. Therefore, this research aims to extend the existing scientific knowledge on insurance end-user behavioral patterns and frameworks by including and examining factors of customization, personalization, and technological enablers. To investigate this situation, the following research questions have been raised:
- How do digital environments and technological factors influence the decision-making process in insurance distribution platforms?
- What are the predominant factors of insurance decision-making processes in digital insurance platforms?
From a methodological point of view, the research follows a triangulation logic, combining an online survey with Fuzzy and Likert logic, simplified art-based method outcomes for information presentation, and an embedded, descriptive case study with statistical data analysis methods, which summarize key findings of the online survey. The structure of this research paper is composed of five main sections. The first section introduces the theoretical background of the topic. The second section provides a detailed description of the research and survey methodology and applied methods. Results of the online survey are presented and analyzed in the third section. The fourth section presents a discussion on research limitations and possible future research directions. The fifth section concludes the main findings from theoretical and practical analyses.
2. The Theoretical Background of Digital Non-Life Insurance Concepts and Insurance Customer Decision-Making Processes
Although the importance of non-life insurance products for the financial wellbeing of individuals and society has been recognized for a long time, a practical spread is still considered vague, i.e., the lack of insurance literacy, financial decision-making skills, and a number of underinsured persons are observed [17]. On a theoretical level, it is argued that modern insurance-related decisions and customer behavior cannot be sufficiently explained by applying traditional neoclassical economic and financial theories and ignoring cognitive and emotional factors.
In general, fundamental studies on consumer decision-making in insurance services, insurers, and market behavior, were carried out by Hsee and Kunreuther in 2000 [7] and Kunreuther and Pauly in 2006 [8]. However, the phenomenon of insurance purchases under these studies has been analyzed from a holistic standpoint, resulting in a focus on high-level benchmark models of insurance demand and supply, legal regulation, and government insurance market principles. The interdisciplinary nature of the behavior of consumers in the insurance market was analyzed, mostly regarding monetary financial risks and positive theory perspectives, with limited attention to the influence of behavioral finance and economics theories, as well as heuristic and bias phenomena. This research gap was only partially covered in the last decade via a comprehensive analysis from the European Commission (2014) [10] study, and Kunreuther and Pauly in 2015 [9]. Here, assumptions on behavioral finance and economy and cognitive psychology domains have contributed to the foundation of the modern insurance concept by introducing the influence of individual risk perceptions, heuristic reflections in framing effects, and intuitive and deliberative thinking along general concepts of probability and risk, distribution channels, and social-demographic differences in Europe [9,10,17]. Nevertheless, afterwards, an increase in scientific attention to the phenomenon of insurance digitization and digitalization has been noticed, as the majority of research was mostly oriented to countries from Western and Central European regions, while analyses of the Baltic region (Lithuania, Latvia, and Estonia) resulted in low volumes, and were mostly limited to a one country-level (Lithuania or Latvia). A significant part of the existing scientific studies on digital insurance have been completed at a high-generality level, scattered to different parts of the insurance-specific value chain or technological solutions, without sufficiently considering the influence of modern mass customization and personalization concepts and marketing theories. A similar situation can be identified when analyzing consumer decision-making in insurance services, which, in the case of the Baltic region, are geographically limited, practically outdated, and, as in the case of Lithuania, the majority of studies were completed from 2008 to 2014, without considering customization, personalization, or digitalization factors. Therefore, the multidimensional and cross-border studies of digital insurance decision-making, insurance literacy, and platform business models in the Baltic region are required both theoretically and practically.
To conclude, the modern insurance combines derivatives from several concepts and theories:
- Risk management, regarding the relationships between insurance service counterparties, the obligation of exchanging customer risks, risk handling methods, and the overall management of the asymmetric dominance effect legally and ethically [12,18];
- Customer behavior, regarding personal mental considerations and physical actions, behavioral and cognitive decision-making biases, purchase decision function, and interaction between the social system and the social reality [18,19];
- CDM and HCDM, regarding behavior and purchase decision-making of insurance customers. It can be defined as a continuous sequence of mental considerations and physical actions, which are divided into the two following main groups and two stages: a perception group of a need for insurance and a perception group of affordability; a personal evaluation stage of needs and affordability factors and objective evaluation stage of insurance content [12,13,18,19]. On the other hand, organizations, including the non-life insurance market, still focus on favorable customer experience management with limited attention and analysis on the multifaceted concept of customer experience and journey management [19]. This situation illustrates a need for conceptualization of insurance customer experience drivers and outcomes in the traditional model of three process stages and comprehensive evaluation categories. These categories combine customer experience drivers and customer integration via value co-creation efforts within different processes of insurance decision-making [20]. This type of holistic customer experience evaluation approach indicates that the customer value and experience are context-dependent, systematic, and interactive within all stages of the process [19,21];
- Information system theories and models of technology acceptance and self-service technologies (SSTs), in the form of constructs and determinant groups of behavioral intentions, usage behavior, and digital insurance platforms. The following constructs and determinants of behavioral intentions and usage behavior can be identified as slightly modified, but reflecting both traditional (face-to-face) and digital insurance distribution channels, such as performance expectancy, effort expectancy, social influence/boundaries, facilitating conditions (organizational and technical infrastructure) and attitude factors (cognitive processes and emotional reactions) [22,23].
Modern insurance specific value chain and co-creation activities depend on features of the core offering-purchase stage, but are also shaped by numerous internal and external factors: customer sourcing processes and an organization role within customer operations, high-level factors of sociodemographic and socioeconomic characteristics, insurance literacy, platform design and information layout, and social media and reality [12,13,17,19,24,25]. Figure 1 summarizes key elements and processes of insurance decision-making.
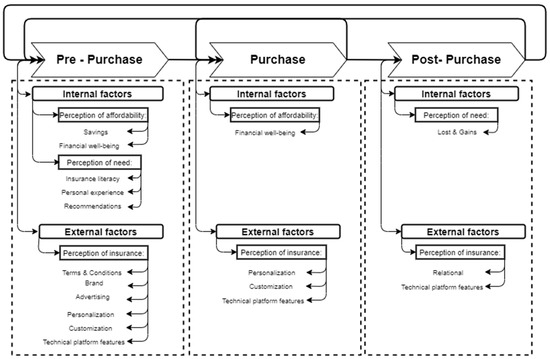
Figure 1.
Features and background of the insurance decision-making process. Source: composed by the authors, by following [5,12,13,17].
Figure 1 illustrates the main process stages and influential driving factors, which affect the insurance decision-making and customer transition through the stages. In general, all influential driving factors can be divided into two groups. The first group is formed by internal factors, which are related to personal evaluation of an insurance need, financial affordability, and past and ongoing experience with insurance service providers. The second group compounds external factors, which define an objective and holistic evaluation of insurance decision-making from legal, marketing, and technical points of view. The financial and marketing-oriented factors have key role in the pre-purchase stage, where the final decision to purchase is made. It should also be outlined that technological factors and the digital environment have a significant influence on the modern insurance value chain and customer experience management. Contrary to the legal, informational, relational, or social-demographic driver factors, they are recognized equally important to the entire value co-creation process in all three stages of the insurance decision-making process. An intensive development of the internet technology, mobile devices, and digital platform business model have become critical enablers to balance the quality of service delivery, insurance personalization, and customization, with different customer expectations and experience levels:
- Operational activities and product-levels via the mediation of a customer’s journey, by personalized easy-access communication tools and information exchange. It also allows ensuring operational capabilities for value co-creation processes and a spectrum of product customization options;
- Customer experience management activities and individual-levels via a well-designed purchase process in graphical interface solutions, situations involving flow interruptions or overwhelming information. It also promotes a continuous positive social interaction and an emotional brand connection after the purchase stage [26].
This theoretical setup reflects the modern non-life insurance meaning, which stands for a continuous (but not a simultaneous) sequence of the insurance-related processes and multiple internal and external influencing factors within the decision-making. The complex and non-linear non-life insurance market nature requires a decentralized, digitalized, and individual-centric approach to organizational management, product configuration, and customer experience management [12,13,17]. Otherwise, digital technologies, technological advancements, and global social networks increased the recognition of non-life insurance products and services, and have been rapidly embedded into daily operations and a value co-creation chain of insurance. These trends indicate the shift of traditional insurance concept boundaries and the non-life insurance market from a traditional, provider-centric management approach and service blueprint model, where a homogenous focus on the operational efficiency and cost-service level dichotomy is dominant [26,27]. The emerging prominence of the customer-centric philosophy and holistic design framework and availability of individual-level real-time data factors reflect in newly developed, innovative, and personalized touchpoints, on customer values and experience management [26,27]. Practically, it reflects on advanced online self-service platforms, which work in combination with techniques of personalization and customization and create a new cognitive framework. It embraces an intrinsic security need for customers and leads to a simpler creation, usage, and exchange of insurance knowledge and information [5,26,28].
It is also agreed that the last two decades of the globalization process, intensive digitization, and digitalization, and rapid socioeconomic changes, have brought about a remarkable, two-fold impact on the financial service market, organizations, and customers, including the insurance industry [29]. Therefore, it is recognized that existing integrated and sophisticated quantitative analysis techniques, financial and economic theories, and consumer decision-making (CDM) models are not fully sufficient to be applied in the modern, digitalized financial service, oriented to the platform business model [30]. The analysis and modeling of the optimal financial decision-making process should be supported by the application of behavioral reasoning theory (BRT), forecasting, and multi-criteria decision approach and methods with qualitative data, behavioral, and cognitive factor evaluations [29,31]. New theoretic models and conceptual frameworks should reflect both technical specifications and capabilities of digital platforms as well as recent behavioral patterns of fully digital end-users, which is no longer a linear progression through process stages, but more an iterative decision-making process [30]. The traditional CDM and hybrid decision-making models (HDCM) have been widely applied in practice since 1960s, but there is a paucity of research within the theoretical synthesis of CDM and HDCM models, concerning a modern insurance-specific value chain and digitalized decision-making process. A brief overview of the main CDM models and their influence points on digitalized insurance decision-making processes is presented in Table 1.

Table 1.
The influence of the main CDM models on digitalized insurance decision-making processes. Source: created by the authors, following [30,32,33,34,35,36].
For a long period of time, main CDM models defined in Table 1, together with the expected utility theory have been accepted as a dominant paradigm by economic and marketing researchers, and used practically by organizations to determine and model customer responses to products or services, purchase offerings, and motivational appeals [33,36]. On the other hand, modeling of the financial attitude and decision-making process in digital platforms has specific circumstances to consider. The stage of the initial problem, problem recognition, or need arousal, together with a non-standard combination of high psychological and monetary risks, internal and external biases associated with certain consequences of financial decision-making, have a strong influence in this field [30,34]. These particular characteristics of financial decision-making require reframing processes and variables of existing CDM and HCDM models. It is also essential to identify and apply the fundamentals of customer behavior models to the comprehensive examination of the insurance service customer’s engagement and characteristics. The following essential points of traditional consumer decision-making models can remarkably contribute to a conceptual framework of the digital insurance decision-making process. Fundamental outcomes of Nicosia’s (1966) [37] model, as a separation of the buying process to the multiple stages, iterative and constant connection between the organization and the customer (in the form of a feedback area and repurchase cycle) can be identified in the insurance. Relevant factors, considering various endogenous and exogenous variables, marketing stimuli components, process options of partiality, and postponement of decision-making, were presented in the EKB (1968) [38] and J. A. Howard and J. N. Sheth (1969) [39] models. These elements support the content and the context of the modern insurance and decision-making process, but are also limited to apply fully, due to the logic of the linear process and the unmeasured relationships between variables [36,46]. Later revisions and elaborations of these limitations in the choice set model of S. Um and J. L. Crompton (1990) [40] and the hybrid choice model of J. Walker and M. Ben-Akiva (2002) [43] introduce relevant factors of possible disturbances, irrational behavior, and an unreliable memory of customers, as well as the initial stage of the awareness set [32,33,36]. Furthermore, simplified models by P. Kotler (1997) [43], P. Kotler and K. L. Keller (2006, 2012) [44,45], and J. E. McCarthy, W. E. Perreault, and P. G. Quester (1997) [42] reflect early complex models of buyer behavior, and in this way, support the holistic approach to the decision-making process. Overall, these models outline the pre-purchase and post-purchase stages and customer-orientated activities of identification differentiation and transformation of target groups, which are also important parts of the modern insurance concept.
3. Materials and Methods
The present research is a continuation and a supplementary portion of the authors’ multi-step research (2020, 2021) within a practical status, regarding insurance digitalization, customization and personalization level, and digital insurance platforms in the Baltic non-life insurance market. The research also contributes to the research field, providing empirical validation of a conceptual framework of the digital insurance customer decision-making process. Therefore, data collection and analyses were carried out by using a convergent parallel research design and the following triangulation of scientific methods:
- A descriptive thematic analysis and synthesis of scientific findings within digital non-life insurance and decision-making models.
- Modeling a conceptual process flow and framework of digital insurance purchase-decision making. A simplified logic of the Robinson’s [47,48,49] conceptual modeling framework in combination with a logical data flow diagram was applied.
- The online survey of 157 insurance-related specialists from three Baltic countries, using a structured questionnaire of 24 questions, a full-blown Likert evaluation scale, and visualized prototypes of online customization frameworks. Visual outcomes were illustrated by using the design and prototyping software Axure RP Pro (version 8).
- Descriptive statistics, multiple factors, and correlation analyses of online survey results. The exploratory factor analysis (EFA), confirmatory factors analyses (CFA), and Pearson correlation analysis were applied by using the statistical analysis software IBM SPSS Statistics 26 (Armonk, NY, USA: IBM Corp.).
It is argued that a convergent parallel research design and triangulation of scientific methods allow simultaneous collection, analysis, and interpretation of quantitative data and qualitative evaluations in a single research study. Moreover, complementary data can be used and transformed to a more holistic understanding of the research phenomenon [50,51]. The details of the questionnaire are presented in Table 2.
Table 2.
Presentation of the questionnaire structure, content, and methodological foundation. Source: composed by the authors.
The questionnaire was formulated by using a combined full-blown Likert scale and a Fuzzy set of 9 points with numerical and linguistic values due to several methodological reasons:
- The research object of the conceptual framework regarding the customer decision-making processes in digital insurance platforms follows the multi-criteria decision making (MCDM) approach. It concerns the design of the criteria evaluation scale and validity of results, using the traditional ranking scale [52,53]. It is also recommended to reduce possible risks of uncertainty, subjective interpretation, and bias within responses, by applying specific wording techniques, reversed forms, as well as an improved scale for evaluations [52];
- The research aims to evaluate the influence of the digital environment and technological factors as well as identify the predominant factors, as it is not aligned to the classical set theory, binary terms, and bivalent conditions. It requires a comparison concerning a certain criterion (a degree of influence to purchase), gradual membership, and a combined linguistic and visual analog scale for easier interpretation and understanding of questions [54];
- Provision of responses grounded with a well-balanced and gradual assessment for further interpretation within methods of descriptive statistics, and comparative and correlation analysis [54].
The selection of the fundamental scale of nine points (from 1 to 9) follows the multi-criteria decision making (MCDM) approach and the logic of the analytic hierarchy process (AHP). It determines a comparison of criteria and their weight importance within the suggested conceptual framework [55]. It is also argued that a combined full-blown Likert and fundamental AHP 1 to 9 scale is relevant under the cross of the threshold at n = 10 criteria [56].
The online survey was conducted through multiple forms, distribution channels, and periods. The detailed summary of the surveying process is as follows:
- The introductory section and the questionnaire were translated to English and three local languages of the Baltic countries, Lithuanian, Latvian, and Estonian respectively. Translation was handled in collaboration with native speakers of local languages and a qualified English linguist;
- The main survey distribution channel involved a direct contact with insurance service distributors and institutions via publicly available and/or personal contact emails. Supplementary channels and forms involved messaging and posting on Facebook and via the authors’ personal professional network;
- The online survey process was held between 16 February and 22 May 2021.
The research sample was formulated by following a logic of probability sampling and a simple sample type. The probability sampling selection was related to the specific research and target population, a methodological set of selection criteria to participate in the survey, and the overall possibility of reducing the sample bias and gathering higher, unbiased data quality. Authors accept key limitations and risks of using simple random sampling—a high level of the standard error of estimate [57]. The target population was defined by using two critical selection criteria: (a) working positions and experiences in the non-life insurance field, and (b) the workplace as an insurance service provider, physically located and operating in the Baltic region (Lithuania, Latvia, or Estonia).
4. Results
A combination of statistical techniques, involving descriptive statistics and factor analyses, are recommended within the applied research to simplify an interpretation of quantitative variables and, overall, to ensure a comprehensive examination of the empirical dataset [58]. This type of multi-level qualitative and quantitative analysis allows researchers to examine the validity of theoretical constructs and the consistency of research instruments, sampling adequacy, and underlining structures and relationships among latent variables (factors) [58,59]. The selected forms of the descriptive statistics involved a manual calculation of a simple and grouped frequency distribution and measures of central tendency. The factor analysis was conducted with the SPPS statistical software (version 26) by completing exploratory factor analysis (EFA), confirmatory factor analysis (CFA), and Pearson’s correlation analysis. The logical sequence of statistical analysis procedures is presented in Figure 2.
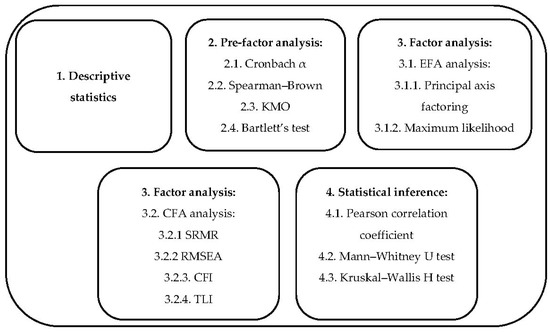
Figure 2.
Logical sequence and content of statistical analysis. Source: created by the authors.
4.1. Descriptive Statistics
Application of the descriptive statistics provides a valuable summary of the dataset characteristics and research sample in a manageable and organized format [60]. It also contributes to the research conclusions and validation of the conceptual framework by revealing the influence of sociodemographic factors. The main characteristics of the research sample are presented in Table 3.
Table 3.
Characteristics of the research sample. Source: composed by the authors.
In total, 157 insurance-related specialists from three Baltic countries agreed to participate in the online survey; the majority (64% of all respondents) belong to the 26–45 year-old age group, are female (78%), and from Lithuania (60%). One important reliability feature of the research sample is the variety of respondent age groups. Accordingly, a representation of five different age groups was identified, while the majority was composed of three age groups within the age range of 18–55. Nevertheless, the analysis of results shows that sociodemographic factors do not have any significant influence on digitalization, personalization, and customization evaluation or factor groups of the insurance decision-making process in digital platforms.
4.2. Factor and Correlation Analysis
4.2.1. Pre-Factor Analysis
The pre-factor analysis of four indicators was conducted using the SPPS statistical software (version 26). It was oriented to investigate an internal consistency of questionnaire items, a level of questionnaire reliability, sampling adequacy, and usefulness of factor analysis. Results of the pre-factor analysis are presented in Table 4.
Table 4.
Results of indexes in the pre-factor analysis.
As per Table 4, the Cronbach α indicator has a value of 0.875, which shows that the internal consistency of questionnaire items is relatively high and acceptable. Test reliability and acceptance to perform data reduction using EFA and CFA techniques were confirmed by the Spearman–Brown and Kaiser–Meyer–Olkin coefficients. The value of KMO was 0.839, exceeding the suggested cut-off value of 0.6. Moreover, it indicates a meritorious selection of variables. These results indicate that the sampling was adequate and supports the application of factor analysis [61]. Finally, the Bartlett’s test of sphericity (a test of at least one significant correlation between two of the items studied) was significant: χ2 (153) = 1140.42, p < 0.05. Here, the p-value is smaller than the significance level (α = 0.05); therefore, it confirms that the dataset is suitable to continue investigation within procedures of EFA and CFA.
4.2.2. EFA, CFA, and Pearson’s Correlation Analysis
EFA and CFA are generally accepted and widely used as a combination of statistical techniques, allowing researchers to reach high effectiveness in both statistical data content analysis and testing of construct and criteria [58]. Firstly, EFA was applied to determine a structure of latent dimensions among the observed variables reflected in the items of an instrument. Construct validity was determined by using the principal component analysis (PCA) extraction method and varimax rotation. In addition to the indicators of EFA, which were presented in the pre-factor analysis, as per Table 2, it is important to “ground” the size of the sample. Authors followed the position offered by Guadagnoli and Velicer (1988), who claim that 150 participants could be interpreted as adequate if factor loads of several items exceed 0.80 [58,62].
The CFA principal procedure was used for a better interpretation of factor structures, to test the validity of the structure obtained after EFA. Here, three groups of model fit indices were used to examine the goodness-of-fit of the model with a given dataset: videlicet the absolute fit indices (coefficients of standardized root mean square residual, SRMR), parsimonious indices (a coefficient of root means square error of approximation, RMSEA), and comparative indices (coefficients of comparative fit index, CFI; non-normed fit index, also known as the Tucker–Lewis index, TLI-NNFI) [58]. Results of these indices are provided in Table 5.
Table 5.
Results of CFA. Source: composed by the authors, using IBM SPSS Statistics 26 (Armonk, NY: IBM Corp.).
It is important to note that the chi-square/df ratio was 1.66, indicating that the model fitted the data well. Overall, the results of fit indices in Table 5 are under the recommended cut-off points for a good model-data fit. The value of SRMR was less than 0.08, the value of RMSEA did not exceed the acceptable limit of 0.08, and values of CFI and TLI-NNFI indices were above the recommended value of 0.90. Finally, the following five groups of related factors were identified after completing EFA and CFA:
- The first-factor group (F1) consists of six internal factors, which together represent a factor group of personal evaluation and considerations. These six factors represent the evaluation of the influence level within insurance purchases in digital insurance platforms: perception of a need of insurance, financial well-being, potential financial savings, consideration of loss and gains probability, recommendations, and insurance literacy.
- The second-factor group (F2) was formed of four external factors of technological features and the marketing domain, which influence the insurance purchase process in digital insurance platforms: advertising, the brand of insurance service provider, key technical platform features, and graphical user interface features.
- The third-factor group (F3) has two factors inside, representing a status regarding evaluation of the digitalization level and level of preparation of insurance service providers to apply digital solutions.
- The fourth-factor group (F4) composes four combined factors of insurance knowledge and operational features level, which influence the insurance purchase process in digital insurance platforms: insurance literacy, product terms, and conditions acceptability, customization of insurance products, personalization of insurance processes, and services.
- The fifth-factor group (F5) has two factors, representing an “as-is” evaluation status of the service personalization level and product customization level in existing digital insurance platforms.
Results of the statistical factor analysis show the existence of five-factor groups, but only three of them are directly related to the digital behavior and purchase decision-making process of Baltic insurance customers: the first-factor group, the second-factor group, and the fourth-factor group. Additionally, calculation of the total rank-sum was conducted to identify the most influential factor groups; the first-factor group with 6648 points. The second-factor and the fourth-factor groups have rank-sums of 4482 and 4352 points, respectively. The Pearson correlations between the five-factor groups were calculated in a parallel way. Details of the Pearson’s correlation calculation are provided in Table 6.
Table 6.
The calculation of Pearson’s correlation. Source: composed by authors by using using IBM SPSS Statistics 26 (Armonk, NY: IBM Corp.).
It should be outlined that three factors groups are identified as having a strong positive Pearson correlation: the first-factor group, the second-factor group, and the fourth-factor group. This result has a two-fold outcome. First, it supports the previous finding of these three factor groups being predominant factors within insurance purchase–decision-making processes at Baltics online insurance platforms. Second, it grounds the theoretical assumption about the digital environment and technological factor influences to end-users and extends the foundation of the theoretical insurance decision-making framework, with new components in the pre-purchase and purchase stages.
Finally, the aim was to analyze the views of insurance-related specialists regarding their sociodemographic characteristics, i.e. age, country, and gender. As the normal distribution assumptions were not met, Mann–Whitney U and Kruskal–Wallis tests were applied to identify whether there were any statistically significant differences between different groups of respondents in the three most influential factor groups. Results of the Kruskal–Wallis test are presented in Table 7.
Table 7.
Results of Kruskal–Wallis H test. Source: composed by the authors by using IBM SPSS Statistics 26 (Armonk, NY: IBM Corp.).
The Kruskal–Wallis identified that the difference between the mean values of the second-factor group for age groups was statistically significant (p-value = 0.004 is less than the significance level 0.05). It was identified that the highest mean rank of 103.53 was in the age group 46–55, compared to the lowest mean rank of 59.22 in the age group 18–25. Moreover, it was noticed that the value of a mean rank increases constantly within age groups. Several conclusions can be formulated in regards to the above-defined observations:
- External factors of technological platform features and marketing domains do not have any significant influence on the digital insurance decision-making process for the customers in the age group 18–25, because members of this very age group are considered tech-savvy-type customers without any strong brand recognition in insurance.
- External factors of technological platform features and marketing domains have a significant influence on the digital insurance decision-making process for customers in the age group of 46–55. Members of this age group tend to have a higher need for a technologically friendly platform, are already experienced with a specific brand of insurance service providers, and possess an overall emotional connection to the brand.
The Mann–Whitney U test was applied to test for gender differences in evaluations of factors groups. Results, presented in Table 8, do not show any statistically significant differences in the evaluation of factor groups according to gender.
Table 8.
Results of Mann–Whitney U test. Source: composed by the authors by using IBM SPSS Statistics 26 (Armonk, NY: IBM Corp.).
5. Discussion and Limitations
First, the above-presented factor and correlation analysis validate theoretical assumptions of internal and external main driving factors and the framework of the digital insurance decision-making process, and disclose the actual Baltic insurer’s perception towards this process reflection in digital distribution platforms. The main finding of a strong, positive Pearson correlation among three factor groups both support and extend the findings of Milner and Rosenstreich (2013) [30] and Rocha and Botelho (2018) [63] studies. The personal insurance experience factor has the highest rank (7.4) among all influential factors, supporting the findings by the structural model of attitude towards insurance (ATI) by Rocha and Botelho (2018) [63], where factors of perception of risk in relation to the good/asset and personal concern with finances are indicated as having the highest positive influence towards consumers’ willingness to pay for insurance. Additionally, the high rank (7.2) and influence of the insurance service provider brand factor confirm marketing domain-oriented findings of Milner and Rosenstreich (2013) [30], where marketing mixes are recognized as an outlying component of the final financial decision-making frameworks, and the structural ATI model of Rocha and Botelho (2018) [63], where the factor of trust in the industry is also outlined among three of the most influential factors. From the perspective of the Baltic insurance market research, the empirical investigation and results of marketing-oriented factors extend the finding by Kiyak and Pranckevičiūtė (2014) [11], where no significant statistical relationship has been identified between the insurance purchase intention and the discount factor. Moreover, this contradiction of evaluation results in insurance research on marketing-oriented factors will reveal a possible scope of the marketing domain inclusion in further studies on digital insurance decision-making. Second, the findings on the insurance literacy factor have a two-fold meaning and scientific contribution. The lower average evaluation rank (6.9) on the insurance literacy factor partially supports the findings by Weedige and Ouyang [18], Weedige et al. [64], and Allodi et al. [17], where insurance literacy was identified as a potential mitigation action and an influential factor to reduce the problem of underinsurance and low-level insurance knowledge. Otherwise, recognition of the insurance literacy factor in non-standard combination, with the factors product terms and conditions acceptability, customization, and personalization foster an additional scientific discussion and contribute, as a standpoint, to further conceptual modeling and empirical analysis.
The research also has methodological and empirical limitations. First, in methodological terms, the validity and reliability of CFA outcomes within the selected sample of 157 respondents are questionable. It contradicts the Hoelter’s critical N (C.N.) recommendation, where the acceptable size of the sample (N) should be above 200 to accept a model at the 0.05 level [65,66]. Nevertheless, authors follow the methodological position by Guadagnoli and Velicer (1988) [62], claiming that a sample’s size, as a function of the number of variables, is not an important factor to determine the sample pattern as being a stable and approximate population pattern. It is outlined that a research sample size between 100 and 200 observations is valid, and under this sample, “a correlation coefficient becomes an adequate estimator of the population correlation coefficient” [62]. Additionally, the value of the KMO of 0.839 confirms the adequacy of sampling. Additionally, the scope of the research instrument and assessment scale, by including more than 10 items, is considered to bring some negative effects on the reliability of measurement results and affect the perception of respondents [67]. Otherwise, it is confirmed that if the index of the Cronbach’s alpha is equal to 0.7 or above, the research instrument of 10 or more items is treated as sufficient [61]. Previous research in this field also confirmed that 9-point scale scores correlated better than the 5-point scale, and, overall, an increase in the reliability level was noticed due to the transition to a higher number scale [67]. The main empirical limitation of the research can be interpreted as a future research discourse within this topic. Application of the traditional fuzzy analytic hierarchy process (FAHP), the modified version of extended fuzzy analytic hierarchy process (E-FAHP), or a combination of different multi-criteria decision-making (MCDM) techniques can reduce the vagueness inherent in a stand-alone linguistic assessment and an uncertain comparison of opinions [68]. Accordingly, future scientific discussions and empirical investigations should be focused on using this set of methodological techniques in continuous scientific investigations. A more extensive and overall continuous validation of the authors’ suggested influential driving factors within a higher sample of external customers in the Baltic insurance market is required. Additionally, a simultaneous theoretical analysis within the presented topic, by adding the foundation of organization buyer behavior (OBB) and/or technology acceptance models (TAM), should be completed by the authors.
6. Conclusions
The theoretical analysis of scientific literature and recent practical trends have revealed that the global insurance market and insurers are in a multidimensional transition period, including an intensive digital acceleration (mostly due to COVID-19), dynamic changes in the market structure, and a spread of the new hybrid operational business model. The digital environment, big data analytics, and technological and cognitive-emotional factors have become major drivers of the modern insurance concept. Otherwise, it has also been recognized that insurance customer behavior and decision-making processes in digital platforms reflect on the fundamental outcomes of the traditional CDM and hybrid choice models. Parallelly, the following features of the complex and simplified customer behavioral models, expected utility theory and behavioral reasoning theory, could be identified: interactive multi-step logic, the complexity of perceived risks, personal bias, and contextual variables in decision-making, influence of the marketing domain, and feedback-repurchase loop. The conceptual modeling confirmed that, within digital platforms, the behavior and purchase decision making of insurance customers is a continuous, but not a simultaneous, sequence of three-stage processes. Additionally, the statistical factor analysis confirmed that the combination of three internal and external factor groups influence the insurance purchase–decision-making in Baltics digital insurance platforms. Here, a strong, positive Pearson correlation was identified among six internal factors of personal evaluation and considerations, four external factors of technological features and marketing domains, and four combined factors of insurance knowledge, levels of product customization, and service personalization. Otherwise, the analysis of sociodemographic factors, such as age group, gender, and country, showed that there are no statistically significant relationships among these types of factors and evaluations of digitalization, personalization, and customization levels within the Baltic non-life insurance market and digital insurance platforms.
Author Contributions
Conceptualization, G.B.; methodology, G.B. and A.G.R.; software, G.B. and A.G.R.; validation, G.B. and A.G.R.; formal analysis, G.B.; investigation, G.B.; resources, G.B.; data curation, G.B.; writing—original draft preparation, G.B.; writing—review and editing, G.B. and A.G.R.; visualization, G.B.; supervision, A.G.R. Both authors have read and agreed to the published version of the manuscript.
Funding
This research received no external funding.
Institutional Review Board Statement
Not applicable.
Informed Consent Statement
Informed consent was obtained from all subjects involved in the study.
Data Availability Statement
The data used in this research work are available from the corresponding authors upon request.
Acknowledgments
Technical software IBM SPSS Statistics 26 (Armonk, NY: IBM Corp.) support was provided by a colleague Rūta Juozaitienė.
Conflicts of Interest
The authors declare no conflict of interest.
References
- Pousttchi, K.; Gleiss, A. Surrounded by middlemen—How multi-sided platforms change the insurance industry. Electron. Mark. 2019, 29, 609–629. [Google Scholar] [CrossRef]
- Porrini, D. The effects of innovation on market competition: The case of the insurance comparison websites. Mark. Manag. Innov. 2018, 3, 324–332. [Google Scholar] [CrossRef]
- Wiesböck, F.; Matt, C.; Hess, T.; Li, L.; Richter, A. How management in the German insurance industry can handle digital transformation. Manag. Rep. 2017, 1, 1–26. [Google Scholar]
- Warg, M.; Zolnowski, A.; Frosch, M.; Weiß, P. From product organization to platform organization—Observations of organizational development in the insurance industry. In Proceedings of the Conference of the 10 Years Naples Forum on Service, Ischia, Italy, 4–7 June 2019; pp. 2–16. [Google Scholar]
- Łyskawa, K.; Kędra, A.; Klapkiv, L.; Klapkiv, J. Digitalization in insurance companies. In Proceedings of the Conference Contemporary Issues in Business, Management and Economics Engineering, Vilnius, Lithuania, 9–10 May 2019; pp. 842–852. [Google Scholar]
- Zarina, I.; Voronova, I.; Pettere, G. Internal model for insurers: Possibilities and issues. In Proceedings of the Conference Contemporary Issues in Business, Management and Economics Engineering, Vilnius, Lithuania, 9–10 May 2019; pp. 255–265. [Google Scholar]
- Hsee, C.K.; Kunreuther, H.C. The affection effect in insurance decisions. J. Risk Uncertain. 2000, 20, 141–159. [Google Scholar] [CrossRef]
- Kunreuther, H.; Pauly, M.V. Insurance decision-making and market behavior. Found. Trends Microecon. 2006, 1, 63–127. [Google Scholar] [CrossRef]
- Kunreuther, H.; Pauly, M. Behavioral economics and insurance: Principles and solutions. In Research Handbook on the Economics of Insurance Law; Schwarcz, D., Siegelman, P., Eds.; Edward Elgar Publishing Ltd.: Cheltenham, UK, 2015. [Google Scholar]
- Suter, J.; Duke, C.; Harms, A.; Joshi, A.; Rzepecka, J.; Lechardoy, L.; Hausemer, P.; Wilhelm, C.; Dekeulenaer, F.; Lucica, E. Study on consumers’ decision making in insurance services: A behavioural economics perspective. In Final Report Prepared by London Economics, Ipsos and VVA Europe; Publications Office of the European Union: Luxembourg, 2017. [Google Scholar]
- Kiyak, D.; Pranckevičiūtė, L. Causal survey of purchase of non-life insurance products for Lithuanian consumers. Reg. Form. Dev. Stud. 2014, 3, 112–122. [Google Scholar] [CrossRef][Green Version]
- Ulbinaitė, A.; Kučinskienė, M.; Moullec, Y.L. Conceptualising and simulating insurance consumer behaviour: An agent-based-model approach. Int. J. Modeling Optim. 2011, 1, 250–257. [Google Scholar] [CrossRef]
- Ulbinaitė, A.; Moullec, Y.L. Towards an ABM-based framework for investigating consumer behaviour in the insurance industry. Ekonomika 2010, 89, 250–257. [Google Scholar] [CrossRef]
- Ulbinaitė, A.; Kučinskienė, M. Insurance service purchase decision-making rationale: Expert-based evidence from Lithuania. Ekonomika 2013, 92, 137–155. [Google Scholar] [CrossRef]
- Ulbinaitė, A.; Moullec, Y.L. Determinants of insurance purchase decision making in Lithuania. Eng. Econ. 2013, 24, 144–159. [Google Scholar] [CrossRef]
- Zolnowski, A.; Warg, M. Let’s get digital: Digitizing the insurance business with service platforms. Cut. Bus. Technol. J. 2017, 30, 3–8. [Google Scholar]
- Allodi, E.; Cervellati, E.M.; Stella, G.P. A new proposal to define insurance literacy: Paving the path ahead. Risk Gov. Control Financ. Mark. Inst. 2020, 10, 22–32. [Google Scholar]
- Weedige, S.S.; Ouyang, H. Consumers’ insurance literacy: Literature review, conceptual definition, and approach for a measurement instrument. Eur. J. Bus. Manag. 2019, 11, 49–65. [Google Scholar]
- Åkesson, M.; Edvardsson, B.; Tronvoll, B. Customer experience from a self-service system perspective. J. Serv. Manag. 2014, 25, 677–698. [Google Scholar] [CrossRef]
- Rosebaum, M.S.; Otalora, M.L.; Ramírez, G.C. How to create a realistic customer journey map. Bus. Horiz. 2017, 60, 143–150. [Google Scholar] [CrossRef]
- Ulaga, W.; Eggert, A. Value-based differentiation in business relationships: Gaining and sustaining key supplier status. J. Mark. 2006, 70, 119–136. [Google Scholar] [CrossRef]
- Taherdoost, H. A review of technology acceptance and adoption models and theories. Procedia Manuf. 2018, 22, 960–967. [Google Scholar] [CrossRef]
- Monami, A.M. The unified theory of acceptance and use of technology: A new approach in technology acceptance. Int. J. Sociotechnol. Knowl. Dev. 2020, 12, 79–98. [Google Scholar]
- Klauss, P.; Edvardsson, B.; Maklan, S. Developing a typology of customer experience management practice—From preservers to vanguards. In Proceedings of the 12th International Research Conference in Service Management, La Londe les Maures, France, 29 May–1 June 2012. [Google Scholar]
- Baek, J.; Lee, J.A. Conceptual framework on reconceptualizing customer share of wallet (SOW): As a perspective of dynamic process in the hospitality consumption context. Sustainability 2021, 13, 1423. [Google Scholar] [CrossRef]
- Tueanrat, Y.; Papagiannidis, S.; Alamanos, E. Going on a journey: A review of the customer journey literature. J. Bus. Res. 2021, 125, 336–353. [Google Scholar] [CrossRef]
- Ponsignon, F.; Smart, A.P.; Phillips, L. A customer journey perspective on service delivery system design: Insights from healthcare. Int. J. Qual. Reliab. Manag. 2018, 35, 1–16. [Google Scholar] [CrossRef]
- Germanakos, P.; Tsianos, N.; Lekkas, Z.; Mourlas, C.; Belk, M.; Samaras, G. intelligent authoring tools for enhancing mass customization of e-services—The smarTag framework. In Proceedings of the 11th International Conference on Enterprise Information Systems—Human-Computer Interaction, Milano, Italy, 6–10 May 2009; pp. 91–96. [Google Scholar]
- Zopounidis, C.; Doumpos, M. Multi-criteria decision aid in financial decision making: Methodologies and literature review. J. Multi-Criteria Decis. Anal. 2002, 11, 167–186. [Google Scholar] [CrossRef]
- Milner, T.; Rosenstreich, D. A review of consumer decision-making models and development of a new model for financial services. J. Financ. Serv. Mark. 2013, 18, 106–120. [Google Scholar] [CrossRef]
- Sahu, A.K.; Padhy, P.; Dhir, A. Envisioning the future of behavioral decision-making: A systematic literature review of behavioral reasoning theory. Australas. Mark. J. 2020, 28, 145–159. [Google Scholar] [CrossRef]
- Vij, A.; Walker, J.L. Hybrid choice models: The identification problem. In Handbook of Choice Modelling; Hess, S., Daly, A., Eds.; Edward Elgar Pub: Cheltenham, UK; Northamptom, MA, USA, 2014; pp. 519–564. [Google Scholar]
- Goodhope, O.O. Major classic consumer buying behaviour models: Implications for marketing decision-making. J. Econ. Sustain. Dev. 2013, 4, 164–173. [Google Scholar]
- Gómez-Díaz, J.A. Reviewing a consumer decision making model in online purchasing: An ex-post-fact study with a Colombian sample. Av. En Psicol. Latinoam. 2016, 34, 273–292. [Google Scholar] [CrossRef]
- Ragothaman, N.; Shanmugam, V. Impact of market drivers on consumers purchase decision with reference to steel products in tamilnadu. Int. J. Appl. Bus. Econ. Res. 2017, 15, 35–40. [Google Scholar]
- Holland, J. Navigating Uncertainty: Tourists’ Perceptions of Risk in Ocean Cruising. Ph.D. Thesis, University of Brighton, Brighton, UK, 2019. [Google Scholar]
- Nicosia, F.M. Consumer Decision Processes: Marketing and Advertising Implications; Prentice-Hall: Englewood Cliffs, NJ, USA, 1966. [Google Scholar]
- Engel, J.F.; Kollat, D.T.; Blackwell, R. Consumer Behavior; Holt Rinehart and Winston: New York, NY, USA, 1968. [Google Scholar]
- Howard, J.A.; Sheth, J.N. The Theory of Buyer Behavior; John, Wiley and Sons: Hoboken, NJ, USA, 1969. [Google Scholar]
- Um, S.; Crompton, J.L. Attitude determinants in tourism destination choice. Ann. Tour. Res. 1990, 17, 432–448. [Google Scholar] [CrossRef]
- Kotler, P. Marketing Management: Analysis, Planning, Implementation, and Control, 9th ed.; Prentice Hall: Upper Saddle River, NJ, USA, 1997. [Google Scholar]
- McCarthy, J.E.; Perreault, W.D.; Quester, P.G. Basic Marketing: A Managerial Approach, 1st Australasian ed.; Irwin: Sydney, Australia, 1993. [Google Scholar]
- Walker, J.; Ben-Akiva, M. Generalized random utility model. Math. Soc. Sci. 2002, 43, 303–343. [Google Scholar] [CrossRef]
- Kotler, P.; Keller, K.L. Marketing Management, 12th ed.; Prentice Hall: Upper Saddle River, NJ, USA, 2006. [Google Scholar]
- Kotler, P.; Keller, K.L. Marketing Management, 14th ed.; Prentice Hall: Upper Saddle River, NJ, USA, 2012. [Google Scholar]
- Muzondo, N. Modelling consumer behaviour conceptually through the seven Ps of marketing: A revised theoretical generic consumer stimulus-response mode. Univ. Zimb. Bus. Rev. 2016, 4, 89–107. [Google Scholar]
- Robinson, S. Conceptual modelling for simulation part II: A framework for conceptual modelling. J. Oper. Res. Soc. 2008, 59, 291–304. [Google Scholar] [CrossRef]
- Robinson, S. Conceptual modelling for simulation part I: Definition and requirements. J. Oper. Res. Soc. 2008, 59, 278–290. [Google Scholar] [CrossRef]
- Robinson, S. A tutorial on conceptual modeling for simulation. In Proceedings of the 2015 Winter Simulation Conference, Huntington Beach, CA, USA, 6–9 December 2015; pp. 1820–1834. [Google Scholar]
- Edmonds, W.A.; Kennedy, T.D. Convergent-parallel approach. In An Applied Guide to Research Designs: Quantitative, Qualitative, and Mixed Methods, 2nd ed.; Edmonds, W.A., Kennedy, T.D., Eds.; SAGE Publications, Inc.: Los Angeles, CA, USA, 2017; pp. 181–188. [Google Scholar]
- Razali, F.M.; Aziz, N.A.A.; Rasli, M.R.; Zulkefly, N.F.; Salim, S.A. Using convergent parallel design mixed method to assess the usage of multi-touch hand gestures towards fine motor skills among pre-school children. Int. J. Acad. Res. Bus. Soc. Sci. 2019, 9, 153–166. [Google Scholar]
- Suárez-Álvarez, J.; Pedrosa, I.; Lozano, L.; García-Cueto, E.; Cuesta, M.; Muñiz, J. Using reversed items in Likert scales: A questionable practice. Psicothema 2018, 30, 149–158. [Google Scholar] [PubMed]
- Musani, S.; Jemain, A. A fuzzy MCDM approach for evaluating school performance based on linguistic information. AIP Conf. Proc. 2013, 1571, 1006–1012. [Google Scholar]
- Quirós, P.; Alonso, J.M.; Pancho, D.P. Descriptive and comparative analysis of human perceptions expressed through Fuzzy rating scale-based questionnaires. Int. J. Comput. Intell. Syst. 2016, 9, 450–467. [Google Scholar] [CrossRef]
- Peculis, R.; Rogers, D.; Campbell, P. Task model of software intensive acquisitions: Integrated tactical avionics system for a maritime helicopter case study. In Proceedings of the Twelfth Australian Aeronautical Conference, Melbourne, Australia, 17–19 October 2007; pp. 510–522. [Google Scholar]
- Goepel, K. Comparison of judgment scales of the analytical hierarchy process—A new approach. Int. J. Inf. Technol. Dec. Making 2019, 18, 445–463. [Google Scholar] [CrossRef]
- Taherdoost, H. Sampling methods in research methodology: How to choose a sampling technique for research. Int. J. Acad. Res. Manag. 2016, 5, 18–27. [Google Scholar] [CrossRef]
- Koyuncu, I.; Kılıç, A.F. The use of exploratory and confirmatory factor analyses: A document analysis. Eğitim Bilim 2019, 44, 361–388. [Google Scholar] [CrossRef]
- Dhillon, H.K.; Zain, M.; Zain, A.Z.; Quek, K.F.; Singh, H.; Kaur, G.; Nordin, R. Exploratory and confirmatory factor analyses for testing validity and reliability of the Malay language Questionnaire for Urinary Incontinence Diagnosis (QUID). Open J. Prev. Med. 2014, 4, 844–851. [Google Scholar] [CrossRef]
- Mathur, B.; Kaushik, M. Data analysis of students marks with descriptive statistics. Int. J. Recent Innov. Trends Comput. Commun. 2014, 2, 1188–1191. [Google Scholar]
- Chan, L.L.; Idris, N. Validity and reliability of the instrument using exploratory factor analysis and Cronbach’s alpha. Int. J. Acad. Res. Bus. Soc. Sci. 2017, 7, 400–410. [Google Scholar]
- Guadagnoli, E.; Velicer, W. Relation of sample size to the stability of component patterns. Psychol. Bull. 1988, 103, 265–275. [Google Scholar] [CrossRef] [PubMed]
- Rocha, A.Q.; Botelho, D. Attitudes towards insurance for personal assets: Antecedents and consequents. Eur. J. Bus. Soc. Sci. 2018, 6, 62–80. [Google Scholar]
- Weedige, S.S.; Ouyang, H.; Gao, Y.; Liu, Y. Decision making in personal insurance: Impact of insurance literacy. Sustainability 2019, 11, 6795. [Google Scholar] [CrossRef]
- Shadfar, S.; Malekmohammadi, I. Application of Structural Equation Modeling (SEM) in restructuring state intervention strategies toward paddy production development. Int. J. Acad. Res. Bus. Soc. Sci. 2013, 3, 576–618. [Google Scholar] [CrossRef]
- Bollen, K.; Liang, J. Some properties of Hoelter’s CN. Sociol. Methods Res. 1988, 16, 492–503. [Google Scholar] [CrossRef]
- Tarka, P. Likert scale and change in range of response categories vs. the factors extraction in EFA model. Acta Univ. Lodz. Folia Oeconomica 2015, 1, 27–35. [Google Scholar] [CrossRef][Green Version]
- Reig-Mullor, J.; Pla-Santamaria, D.; Garcia-Bernabeu, A. Extended fuzzy analytic hierarchy process (E-FAHP): A general approach. Mathematics 2020, 8, 2014. [Google Scholar] [CrossRef]


Publisher’s Note: MDPI stays neutral with regard to jurisdictional claims in published maps and institutional affiliations. |
© 2021 by the authors. Licensee MDPI, Basel, Switzerland. This article is an open access article distributed under the terms and conditions of the Creative Commons Attribution (CC BY) license (https://creativecommons.org/licenses/by/4.0/).