Article

Probabilistic Moment Capacity Models of Reinforced Concrete Slab Members for Underground Box Culverts

1
School of Civil and Environmental Engineering, Yonsei University, Seoul 03722, Korea
2
Department of Civil and Environmental Engineering, University of Illinois at Urbana-Champaign, Urbana, IL 61801, USA
3
KEPCO Research Institute, Daejeon 34056, Korea
*
Author to whom correspondence should be addressed.
Appl. Sci. 2021, 11(18), 8520; https://doi.org/10.3390/app11188520
Submission received: 22 August 2021 / Revised: 9 September 2021 / Accepted: 10 September 2021 / Published: 14 September 2021

Abstract

:
This study was performed to evaluate the probabilistic characteristics of the flexural strength of reinforced concrete (RC) flexural members adopted for underground box culverts. These probabilistic models were developed to be adopted for the development of limit state load combination formats for underground RC box culverts. The probabilistic models of uncertainties inherent in the basic design variables were developed to evaluate flexural strength using field material test data as well as field survey data collected from various domestic construction sites of underground box culverts in Korea. The basic design variables include concrete strength, steel rebar strength, and section dimensions, such as slab thickness and rebar locations. Some design variables are assumed to have inherent construction error characteristics, which may be different from those inherent in the RC members for buildings and bridges. The bias models on flexural strength were evaluated based on the experimental results of four-point flexural tests on one-way RC slabs, which were fabricated following the general practice adopted in the local underground box culvert construction process. Based on the probabilistic models of basic design variables, as well as the bias models of flexural strength, Monte Carlo simulations were performed to examine the probabilistic characteristics of both ultimate flexural strength and yield moment strength of RC slab members. Some sensitivity analyses were performed to confirm the soundness of various probability models and the assumptions adopted in the development procedure. The proposed procedure may be applied to develop probabilistic resistance models for structural members, in which the construction error characteristics are assumed to be different from other practices.

1. Introduction

The utilization of underground space has become quite important in urban areas due to the increasing demand for city infrastructure. Underground transportation systems and utility spaces can alleviate the increasing demand on infrastructure and would provide more open and green spaces for urban dwellers. Underground RC box culverts are widely adopted for utility tunnels for electricity power lines, water pipes, and communications lines.
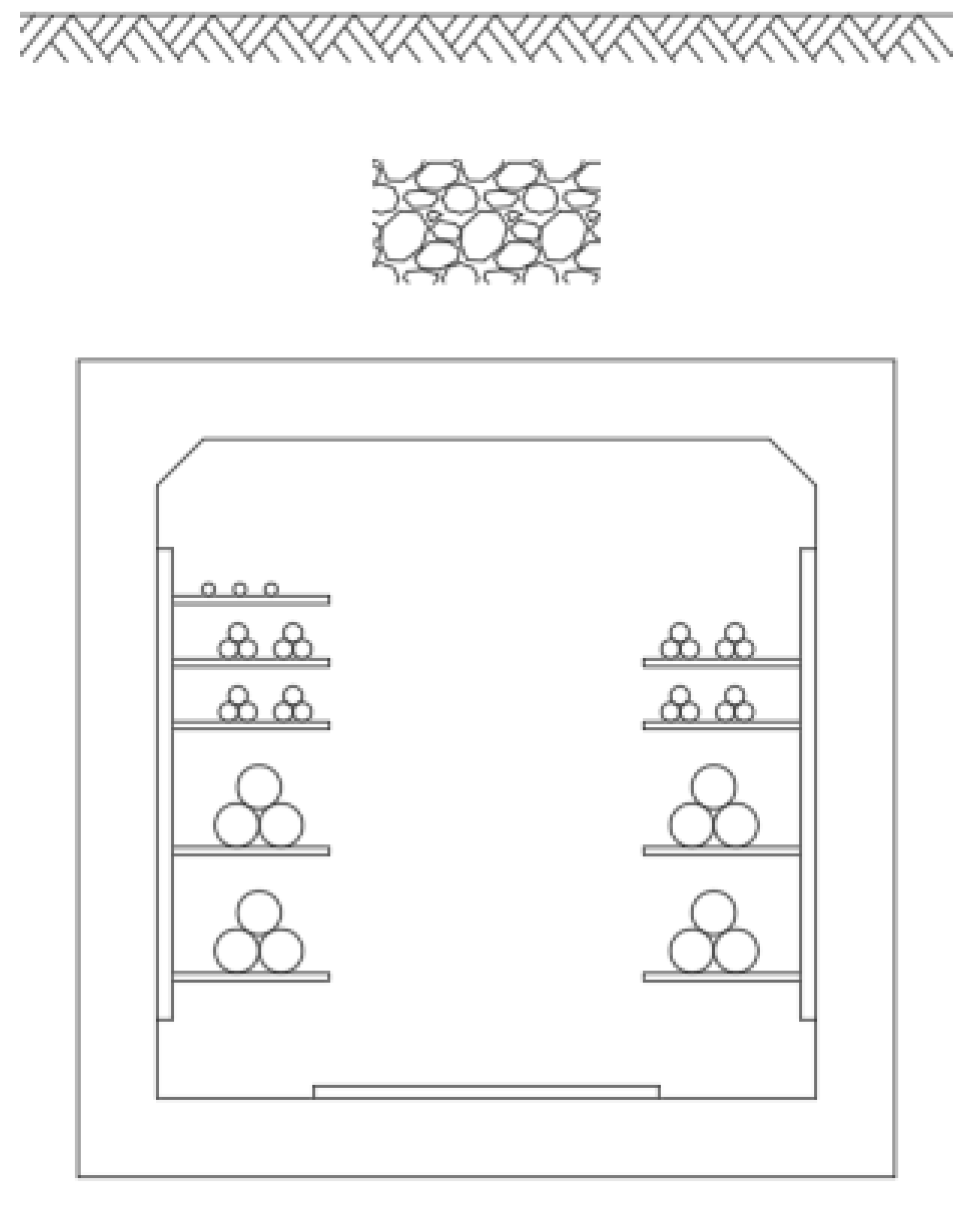
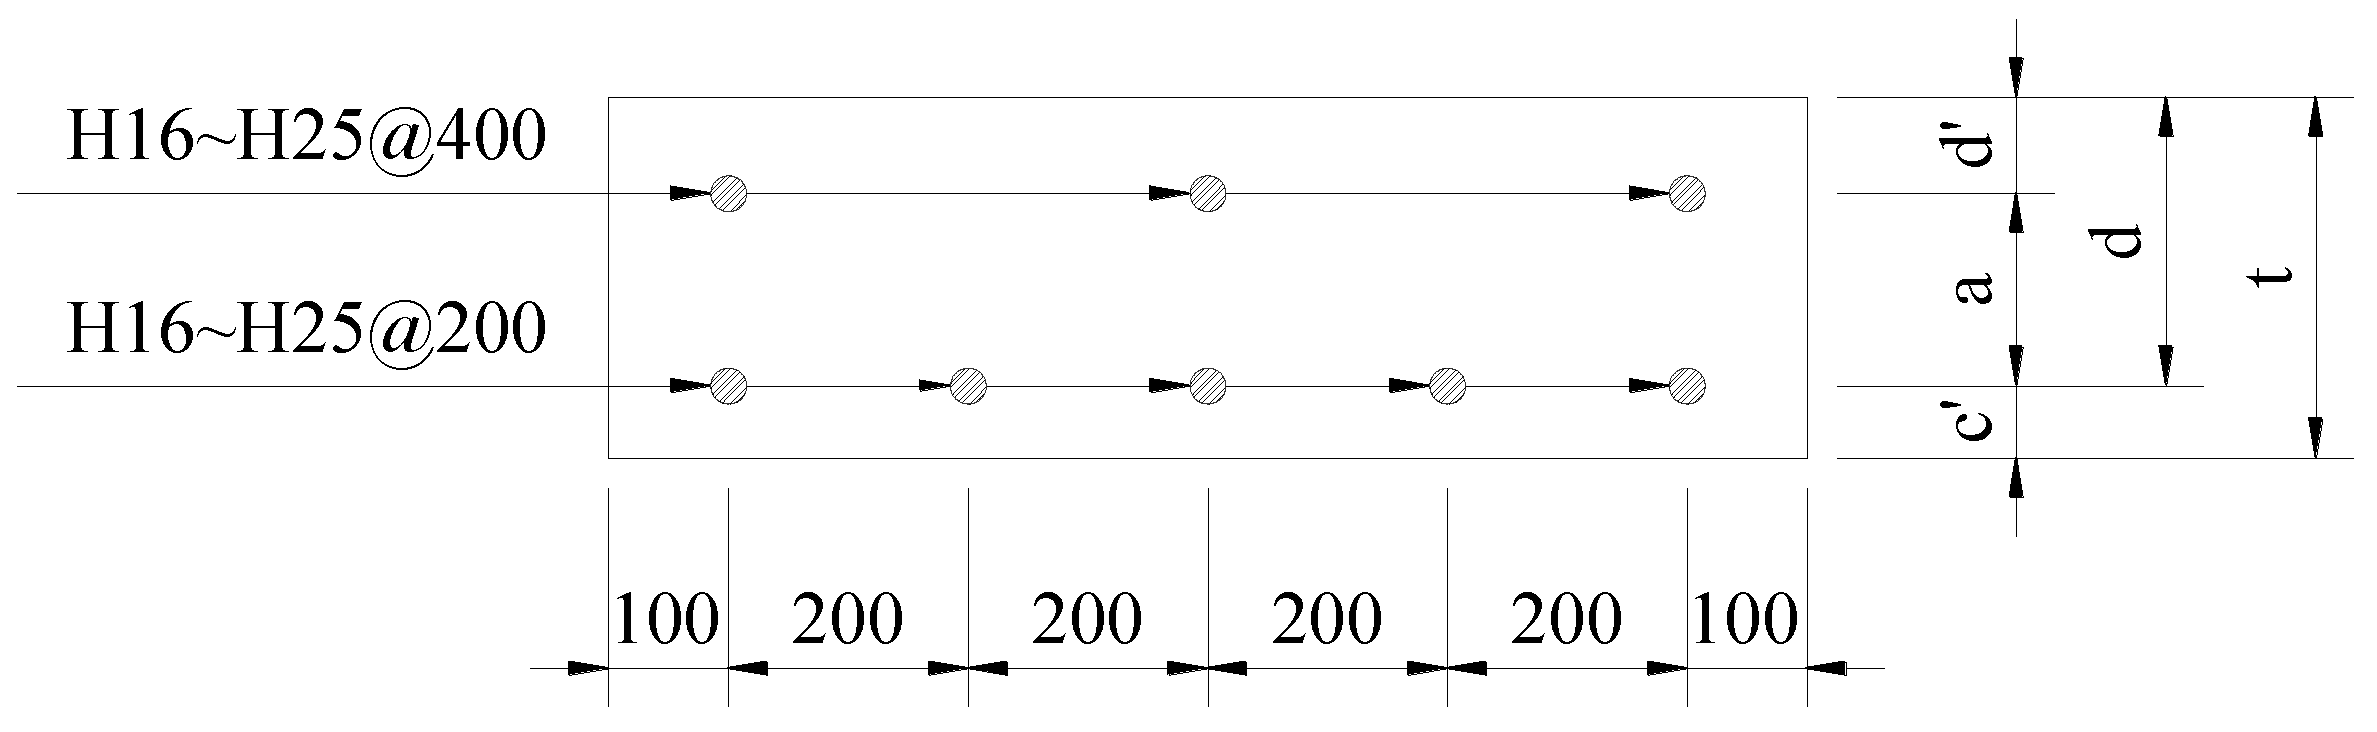
The underground box culverts constructed for the local electric company in this study have a very typical cross-section, as shown in 
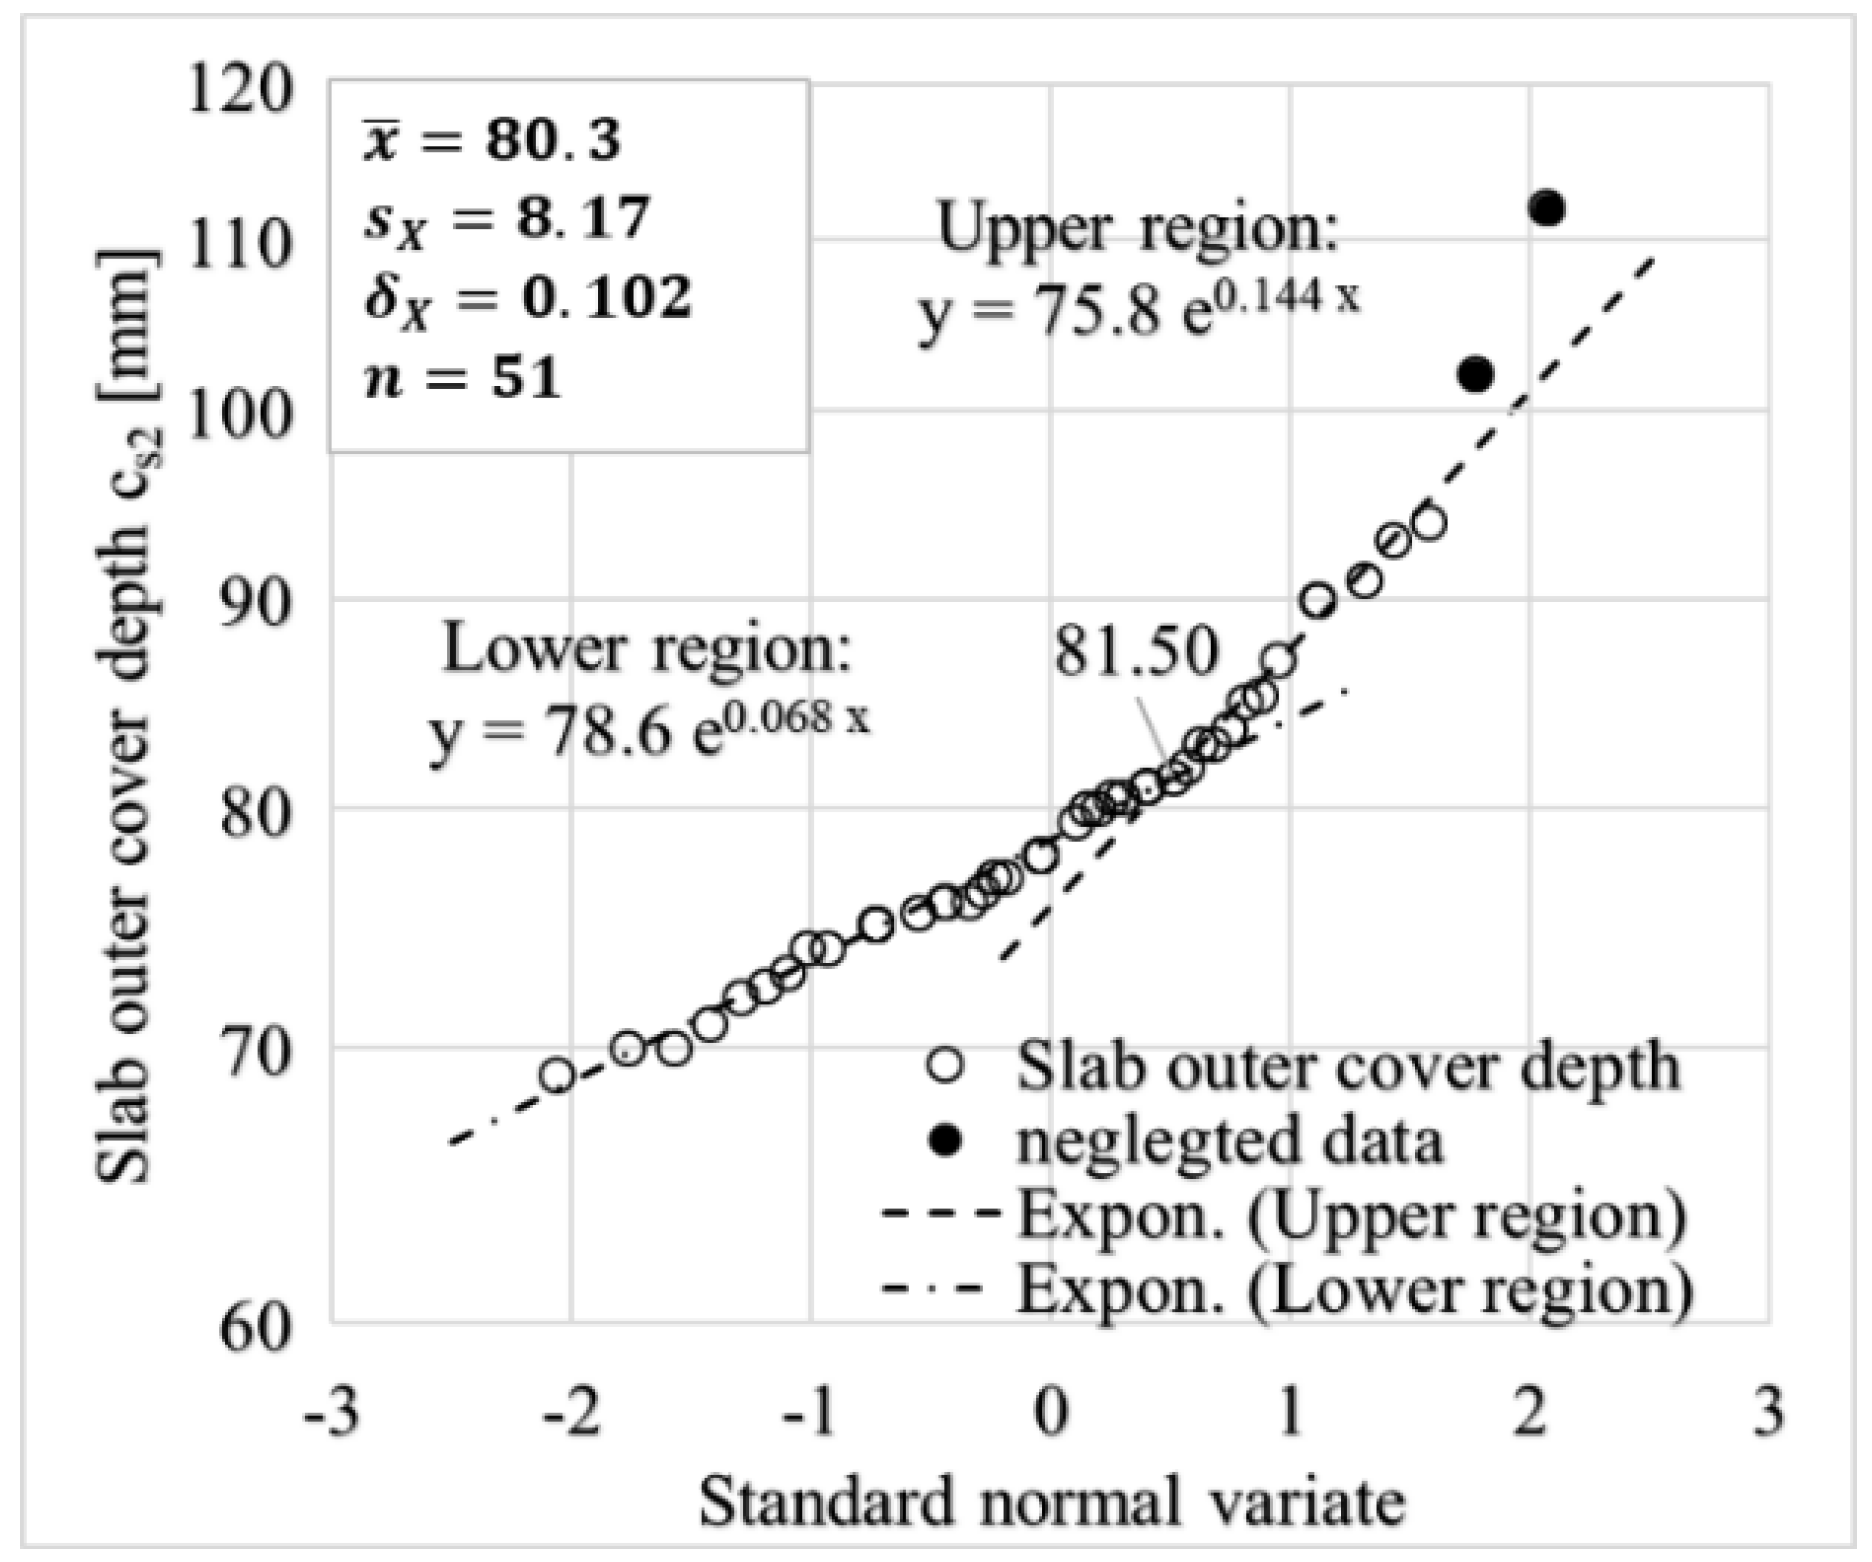
Figure 1. The spans (internal distances between two walls) range from 2.0 m to 2.6 m generally, and the rises (internal distances between the top and bottom slabs) range from 2.0 m to 2.2 m. The earth fills over the top slabs are generally required to be greater than 1.2 m to prevent freezing damage. Most underground box culverts are constructed along existing urban highways. Haunches are constructed at the top two corners because the corner end moments of the bottom slab are not large due to the strengthened foundation under the bottom slab. The cover depth (the distance from the center of the rebar to the outside surface) of the outside main rebar is fixed at 80 mm, and it is 60 mm for the inside main rebar.
Various probabilistic resistance models have been proposed and adopted to perform reliability-based code calibrations [1,2,3,4,5,6,7,8,9], mainly for buildings and bridges. Ellingwood et al. [1] proposed a probabilistic model of the flexural resistance of RC members in order to develop the load combinations and load factors for limit state design, in which the basic data were collected mainly from RC buildings and prestressed concrete beams. Nowak [2] developed a probabilistic resistance model of general bridge structural members based on the statistical models of the basic design variables proposed by Ellingwood et al. [1]. Nowak, Park, and Ojala [3] performed a reliability-based calibration of design codes for buried structures. However, the resistance model in this study [3] is adapted from previous works on bridge structures [10,11]. Nowak et al. [4,5] and Rakoczy and Nowak [6] proposed resistance models of building RC components, revised with new material test data. Galasso et al. [7] investigated the uncertainty of the flexural strength of an RC beam, in which the probabilistic model of rebar strength was only modified based on data collected from local (Italian) industries. All other models have been adapted from previous studies [1,4,12]. Similarly, Foster et al. [8] studied the statistical characteristics of material properties as well as uncertainties in strength of RC members based on local data and local laboratory tests (Australia). Wisniewski et al. [9] proposed the probabilistic models for mechanical properties of materials including concrete, reinforcing steel, and prestressing steel to account for a recent improvement in production. Most studies [4,5,6,7] adopted probabilistic models of geometric dimensions, as well as the experimental strength bias values in relation to flexural strength, from Ellingwood’s [1] models, in which geometric dimension errors were measured based on building members and the flexural strength biasness model was developed based on the experimental results obtained from RC beams and prestressed beams.
Most underground utility culverts are constructed through a process involving open-excavation, concrete formwork, rebar assembly, concrete cast-in-place, field curing, earth refill, and pavement. Therefore, quality control for underground RC culverts has not been able to maintain constancy throughout the construction process in relation to the load-carrying capacity of RC culvert members. The variability of the member strength of RC culverts should be considered in the design process in order to achieve consistent structural safety as well as to ensure the construction of cost-efficient structures. RC box culverts, which consist of slab- and wall-type members, may have different characteristics compared with the members of buildings or bridges. In addition, the target reliability levels for underground power supply culverts may be different from the safety levels inherent in building design and bridge design.
In this study, probabilistic resistance models that address the variability inherent in the flexural strength of the slab members of underground RC box-type culverts are proposed based on real field data collected and measured at local construction sites of underground RC box culverts in South Korea. In addition, 48 RC slab specimens are tested to verify uncertainties in the nominal flexural capacity.

2. Flexural Moment Strength of RC Members

2.1. Ultimate Moment Strength

The ultimate moment strength is calculated based on strain compatibility and the equilibrium of internal forces. An elastic, perfectly plastic model is used for steel rebar and an equivalent rectangular stress block is used for concrete in compression [13,14]. The nominal ultimate moment strength can be estimated using Equation (1), considering only the lower rebar [14]:
M n = f y A s ( d β 1 c 2 )
where f y is the yield strength of steel rebar, A s is the area of lower reinforcement, d is the effective depth of the section, β 1 is a factor relating the depth of the equivalent rectangular stress block to the depth of the neutral axis, and c is the depth of the neutral axis [14].
For doubly reinforced concrete members, the calculation of moment strength may depend on the induced strain of the upper reinforcement. When the upper reinforcement is in the compression zone, the moment strength can be evaluated using Equation (2), where f c k is the compressive strength of concrete, b is the width of RC member, A s is the area of upper reinforcement, f s is the stress in the upper rebar, and d is the distance from the extreme compression fiber to the centroid of the upper rebar [14].
M n = 0.85 f c k b β 1 c ( d β 1 c 2 ) + A s ( f s 0.85 f c k ) ( d d )
Furthermore, the moment strength is calculated by Equation (3) when the upper rebar is in the tension zone [14].
M n = 0.85 f c k b β 1 c ( d β 1 c 2 ) + A s ( f s 0.85 f c k ) ( d d )
When the strain in the steel rebar is greater than its yield strain, the stress in the steel rebar is equal to the yield stress.

2.2. Yield Moment Strength

The reinforcing steel in the tension side will yield before the concrete reaches its ultimate strain on the compression side since the RC slabs are designed to be under-reinforced. To evaluate the yield moment strength, the strain of the tensile rebar is assumed to be equal to the yield strain, and the section equilibrium between tension and compression must be established [14,15,16] (Figure 2). The concrete stress is estimated with Equation (4) (Figure 3).
f c y = 0.85 f c k ( 2 ε c y ε 0 ( ε c y ε 0 ) 2 )
The upper rebar stress is not considered because it is observed that the upper rebar is located near the neutral axis when the bottom rebar yields in the RC slab section and the contribution is negligible. The stress of the lower rebar is set to its yield stress.
A simple iteration procedure to calculate the yield moments of the RC slabs is proposed in Figure 4. Based on iterations with various slab designs, ε c y is assumed to be 3 7 ε y at the beginning of the calculation to accelerate the iterations. The depth of the neutral axis c is adjusted by calibrating ε c y until section equilibrium is established. Then, the yield moment M y can be estimated using Equation (5).
M y = f y A s ( d 0.35 c )
The proposed iteration process is based on the algorithm of Laupa et al. [15]; however, steps 2 and 5 in Figure 4. have been proposed here to improve the iteration procedure. Those functions are selected from various computational examples of slab-type members. De Cossio et al. [16] proposed a simplified computational method to improve the iteration method of Laupa et al. [15], compromising the accuracy of the estimated yield moment. The computational results from the proposed iteration shown in Figure 4. will be compared with the experimental results as well as the computational results obtained by previous methods [15,16] in Section 4.

3. Probabilistic Model of Basic Design Variables

3.1. Probabilistic Model of Concrete Compressive Strength

The probabilistic model of concrete compressive strength was developed using compressive test results of 407 field-collected and field-cured concrete cylinders. The design’s compressive strength of concrete is 27 MPa, which is the strength recommended by the local power company.
The cumulative distribution function (CDF) of concrete compressive strength (28-days) is plotted on a normal probability paper in Figure 5. The compressive strengths are quite widely scattered, because the design strength is relatively low and the field curing environments vary greatly depending on the ambient weather and site conditions. Since the lower tail of the concrete strength distribution is the critical part affecting the flexural strength of the slab member, a linear regression line is fitted to sample points below x ¯ 1 · s X , as shown in Figure 5, where x ¯ is the sample mean and s X is the sample standard deviation. Finally, a normal probability density function (PDF) model with a mean of 30.4 MPa (bias factor 30.4/27 = 1.13) and coefficient of variation (cov) of 0.222 (standard deviation, SD, 6.75 MPa) is proposed for concrete compressive strength with the design strength of 27 MPa.
For similar concrete models (design strength 27.6 MPa = 4000 psi), Ellingwood et al. [1] recommended a normal distribution with a mean of 23.4 MPa and cov of 0.18; Nowak et al. [4,5] suggested a normal distribution model with a bias factor of 1.24 and a cov of 0.15.

3.2. Probabilistic Model of Yield Strength of Steel Rebar

The tensile strength tests were performed at a national laboratory using 318 test samples of SD400-grade steel rebar ( f y = 400 MPa) with diameters ranging from 10 mm to 32 mm, produced by nine different local reinforcing steel manufacturers. Table 1 provides a summary of the yield strengths. Except for the 10 mm rebars, the statistical mean values were quite similar for the various diameters, which was the general trend in other studies [4,5]. D10 and D13 rebars are not used for structural reinforcements in the local underground RC culverts.
A linear regression line is proposed with most of the data set, excluding 5% of the upper tail (n = 16) since the lower region data are more important in the structural safety evaluation, as described in Figure 6. A normal distribution model with a mean of 468.7 MPa (bias factor 1.17) and a cov of 0.043 (SD 20.34 MPa) is proposed for the yield strengths of steel rebar.
For steel reinforcing bars of 420 MPa (60 ksi), Ellingwood et al. [1] proposed a beta distribution function model (bias factor 1.125, cov 0.10), Nowak et al. [4] recommended a normal distribution function model (bias factor 1.145, cov 0.05), and Nowak et al. [5] also suggested a normal distribution function model (bias factor 1.13, cov 0.03). Galasso et al. [7] proposed a log-normal PDF with a bias factor of 1.22 and a cov of 0.054 for steel rebars of 450 MPa grade (Italy).

3.3. Probabilistic Models of Dimensions of Cross Sections

The sectional dimensions (thickness and cover depths) of slab members of RC box culverts were measured from various construction sites, whereby a core was drilled through the depth of the slab. As shown in Figure 7, the bias factor of slab thickness ( λ t ) was found to be 1.004 with a cov of 0.032, based on the fitting of a normal probability distribution function.
The vertical locations of the upper and the lower reinforcements were measured using a rebar detector. The design value for cover depths is 60 mm for the inner cover depth ( c s 1 distance from the bottom side of the slab to the centroid of the lower rebar) and 80 mm for the outer cover depth ( c s 2 distance from the top side of the slab to the centroid of the upper rebar). These are the recommended cover depths for all local underground RC culverts for the electricity supply.
The probabilistic flexural strength models herein were developed for positive moment capacity (cover depths of tensile and compressive rebars—60 mm and 80 mm) and negative moment capacity (cover depths of tensile and compressive rebars—80 mm and 60 mm). The effective depth decreases when the cover depth of the tensile rebar increases. Hence, these probabilistic models are evaluated considering the upper part of the distribution. Furthermore, probabilistic models of the cover depth of the compressive rebar are determined with the lower part of the distributions, because the moment capacity decreases as the cover depth of compressive rebar decreases.
As illustrated in Figure 8, a normal PDF with a mean of 71.5 mm and an SD of 4.66 mm (cov 0.065) is proposed for the cover depth of a tensile rebar (positive moment). A normal PDF with a mean of 67.2 mm and SD of 4.35 mm (cov 0.065) is proposed for the cover depth of a compressive rebar (negative moment).
The outer cover depth (nominal depth—80 mm) is modeled with a log-normal distribution. A log-normal PDF with a median of 75.8 mm and a ζ (logarithmic standard deviation or zeta) of 0.144 is proposed for the cover depth of a tensile rebar (negative moment), as illustrated in Figure 9. For the cover depth of a compressive rebar (positive moment), a log-normal PDF with a median of 78.6 mm and a ζ of 0.068 is proposed.
Ellingwood et al. [1] proposed a unified normal distribution model for construction errors in members of all dimensions, which have been adopted in other studies [4,5,6,7].

4. Uncertainty Evaluation of Flexural Strength of a Reinforced Concrete Slab

4.1. Overview of One-Way RC Slab Test

The flexural strength can be different from the design strength due to variations in material properties and the dimensions of the member, as well as errors inherent in the design formulations and assumptions (Nowak and Collins [18]). To evaluate the uncertainty in flexural strength, four-point flexural tests were conducted with 48 one-way RC slab specimens with a width of 1000 mm and length of 3000 mm. The thickness of the slab specimens varied from 250 mm to 400 mm. The design compressive strength of concrete is fixed to 27 MPa. SD400-grade steel rebars ( f y = 400 MPa), with various diameters ranging from 16 mm to 25 mm, were used for longitudinal reinforcements, as shown in Figure 10.
For shear reinforcement, stirrups of 13 mm in diameter were placed with 200 mm spacing at the center, and 16 mm diameter stirrups were placed with 120 mm spacing at both ends, as shown in Figure 11. The sectional information of the slab specimens is summarized in Table 2. The cover depth of bottom rebars varied from 30 mm to the design value of 60 mm in order to investigate the effect on ultimate flexural strength. Slabs were simply supported at 250 mm from both ends and tested under two concentrated loads, placed symmetrically at 700 mm apart, as illustrated in Figure 11.

4.2. Experimental Results of One-Way RC Slab Tests

Figure 12 shows some photographs of the loading experiments. Figure 12a provides a view of the test setup and the broken lines on the side surface indicate the locations of both the lower rebars and upper rebars, which were detected using a rebar detector before the test setup. Figure 12b shows the cracks on the side surface, in which the 2-point loading positions were located at “35” (350 mm in both the left and right directions from the center). It was found that the tensile cracks started from the bottom and grew upward over the upper rebar and the upper rebar experienced the tensile stress before the ultimate moment capacity was reached. The major cracks around the center approached the crush region of the top surface concrete. Figure 12c shows the typical crush patterns on the top surface concrete of another specimen. The depth of the concrete crush region was measured to be about 30 mm to 40 mm, depending on the slab depth. The nominal cover depth of the upper rebar is 80 mm in the local underground culverts.
The experimental ultimate load P u and the yield load P y were obtained from the load–displacement curves of the slab specimens and confirmed from the load–strain curves of the bottom rebar, upper rebar, and top surface concrete. Figure 13 presents some load–displacement curves of the RC slab members. The ultimate load P u caused the crushing of the concrete at the top surface of the slab. The yield load P y caused the yielding of the bottom reinforcements. The load–displacement curves presented in Figure 13 show two different behaviors: one for specimens with a small bottom rebar area and another for specimens with a large bottom rebar area. The slabs with small tensile bottom rebar areas (Figure 13a,b) withstood loads until large deflections occurred; however, the slabs with large amounts of bottom tensile rebar (Figure 13c,d) reached the ultimate moment capacities earlier because the top concrete was crushed earlier.
The experimental moment strengths were compared to the analytical moment strengths. The analytical moment strengths were calculated with 28-day concrete strength, as well as the measured sectional dimensions (thickness and cover depths). The yield strength of the rebar was adopted from the mean values of the rebar tensile tests, summarized in Table 1.
The yield moment strengths are calculated as described in Section 2.2 and compared with the experimental results as well as the computational results estimated by the other methods suggested in the previous studies [15,16]. As shown in Figure 14, De Cossio’s procedure [16] shows relatively noticeable errors in some cases while both Laupa’s procedure and the proposed procedure provide better estimations to the experimental results ( M y e x p ) . The proposed iteration procedure is found to be simpler and converge faster than the procedure of Laupa et al. [15]. The computational results of   M y e x p / M y c o m p estimated for 48 specimens by those 3 methods are summarized in Table 3. It is found that the proposed procedure reduces the estimation errors.
The bias factors of the yield moment strength ( λ y = M y e x p / M y c o m p ) are well-plotted on a normal probability paper, as shown in Figure 15. The biasness of the yield moment strength ( λ y ) is modeled with a normal PDF with a mean of 0.99 and SD of 0.046, which are close to the sample mean and sample cov, shown at the top-left of Figure 15.
The bias factors of ultimate moment strength ( λ u = M u e x p / M u c o m p ) are also plotted on a normal probability paper, as shown in Figure 16. The probabilistic slope in the upper region for λ u > 1.16 , which is the sample mean value marked with a vertical line in Figure 16, is larger than that in the lower region for λ u 1.16 .
In Figure 17, the bias factors of ultimate flexural capacity, grouped in the lower region of λ u 1.16 (in which 1.16 is the sample mean λ ¯ u ) , are marked with circles, numbering 29 in total, and the bias factors of yield moment capacity ( λ y ) obtained from the same specimens are also marked with circles. It was found that the λ y values for the specimens in the lower group of λ u (marked with “o”) were scattered in either the lower group (17 out of 29) of λ y values ( 0.98: 0.98 is the sample mean, λ ¯ y ) or the upper group (12 out of 29) of λ y values ( > 0.98). It can be concluded that λ u and λ y do not have any relation and are not affected by the particular design variables, such as f y . The yield strength of the rebar is the major design variable in terms of both the ultimate moment capacity and the yield moment capacity.
The major contribution to the probability of flexural failure in the slab will result from the probabilistic characteristics of the lower region. Therefore, the lower tail distribution in Figure 16 has been adopted for the bias model of ultimate flexural strength. A normal PDF model is proposed with a mean of 1.15 and a cov of 0.043 (SD 0.049).
Ellingwood et al. [1] assumed λ u to follow a normal distribution, having a mean of 1.01 and a cov of 0.046 for the flexural strength of structural members, based on the tests of simply supported reinforced and prestressed concrete beams. Nowak et al. [4] modified the model presented in Ellingwood et al. [1] as a normal PDF with a mean of 1.02 and a cov of 0.06, which was also adopted in Nowak et al. [5] and Galasso et al. [7]. As the upper rebars in RC slabs with medium depths of 300 mm to 500 mm are found to contribute significantly to the flexural moment capacity, the experimental capacities are found to be much higher than the nominal capacities calculated without the contributions of the upper rebars, and λ u in this study has a higher mean value than the model of λ u presented in Ellingwood et al. [1].

5. Probabilistic Flexural Strength Model of RC Slab Members

The probabilistic characteristics of the flexural strength of RC members are examined through Monte Carlo simulations based on probabilistic models of design variables ( f c k , f y ,   λ t , c s 1 , c s 2 ) and probabilistic models of experimental strength biasness ( λ y and λ u ). The Monte Carlo method is a numerical process of repeatedly calculating a mathematical operator including random variables with prescribed probability distributions to obtain the solution to complex probabilistic problems [19]. Probabilistic models of variables are summarized in Table 4.
The thicknesses of the simulation slab models range from 300 mm to 500 mm. The section areas of the reinforcements in the tension side vary from 993 mm2 to 2578 mm2 (ρ: 0.0022–0.0095), which are widely used design values in local underground RC box culverts, and the area of the reinforcements in the compression side is taken generally as half of the bottom rebar area. The positive moment capacity at the middle of the top slab and the negative moment capacity at the end of the top slab in the box section are investigated in this study. The middle section and the end section have different nominal cover depths (60 mm and 80 mm), which result in different effective depths.
Different simulation sizes are assigned to the different slab models based on the inventory survey, presented in Table 5. The basic simulation size is 100 K. The slab with a thickness of 300 mm and bottom rebar area of 1324.0 mm2 has a weight factor of 20 in Table 5. Therefore, 2000 K simulations are generated for the positive moment capacity. For the slab with a thickness of 500 mm and bottom rebar area of 1324.0 mm2, 100 K ultimate moments are simulated. In total, 8300 K simulation results are used to investigate the ultimate flexural strength model for the positive moment in the RC box slab. The same procedure is repeated for the negative moment model.
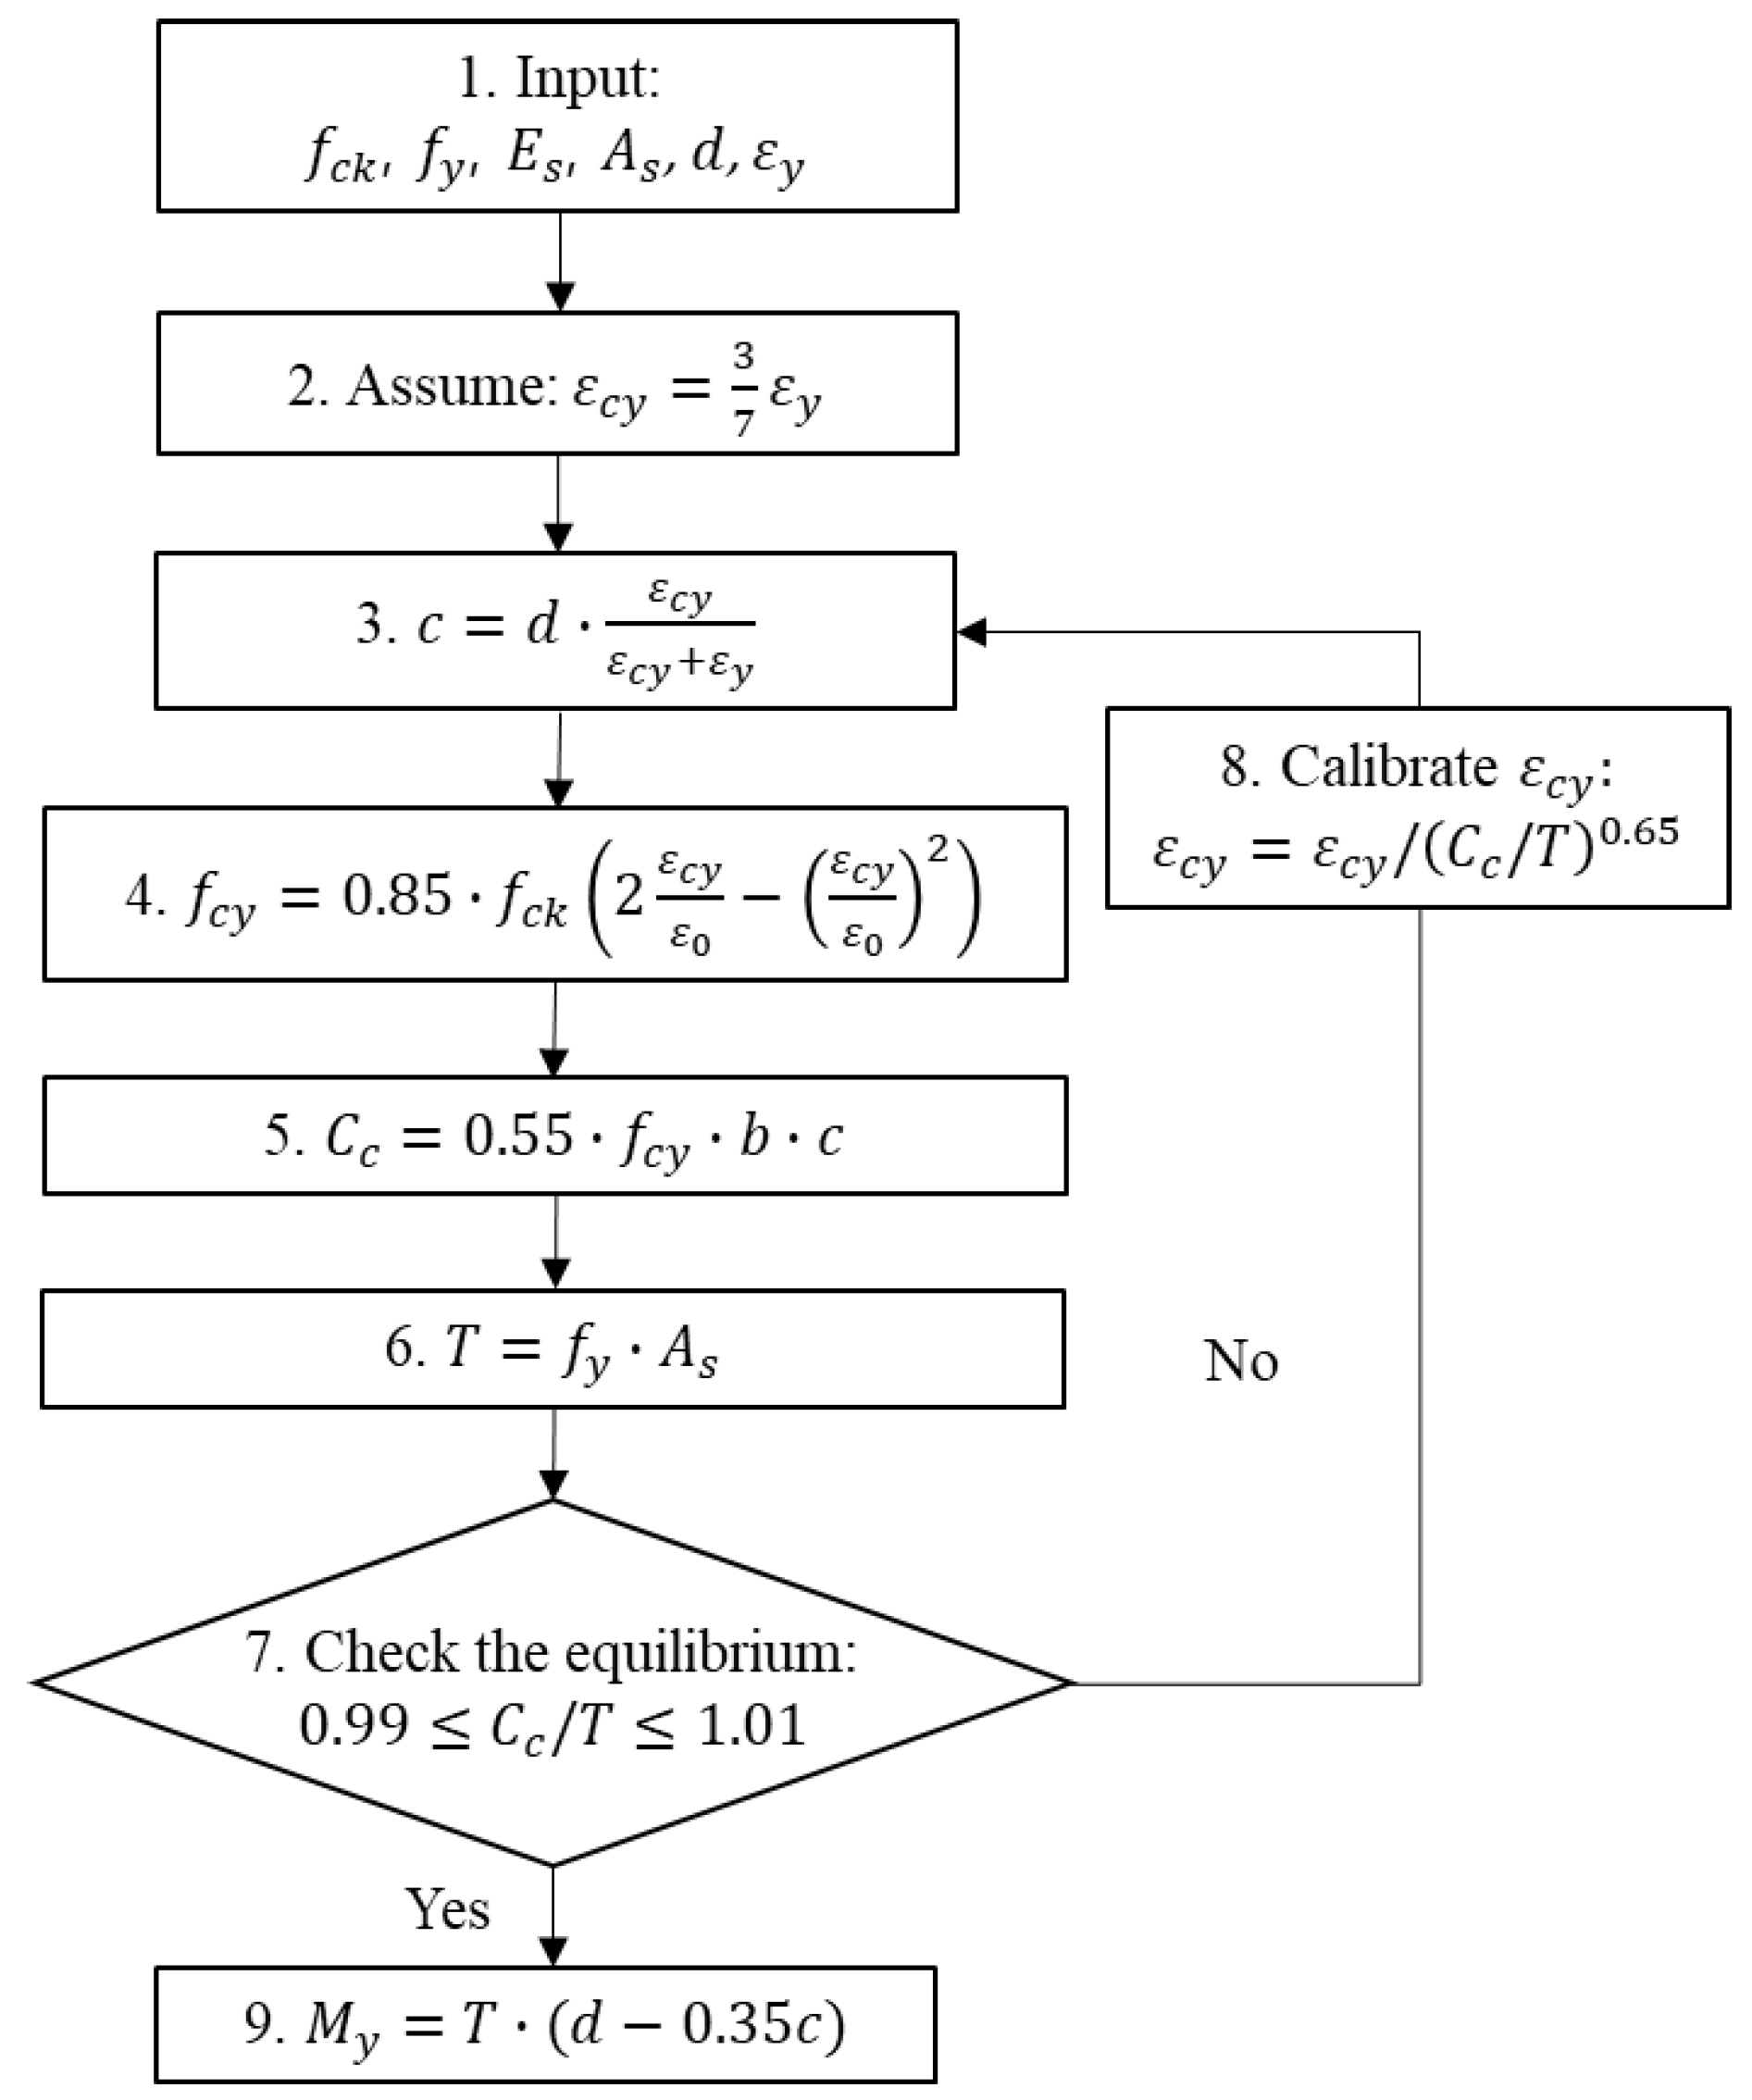
The evaluation process for the probabilistic model of flexural strength for RC members is illustrated in Figure 18. The ultimate moment strength is calculated considering both upper rebars and lower rebars that are effective in their load-carrying capacity. The yield moment strength is estimated considering only the lower rebar because the effect of the upper rebar is negligible until the yield moment is developed. The moment strengths (ultimate M u and yield M y ) are normalized with the nominal moment strength ( M n ), calculated with the nominal design values of all the design variables, in which only the rebars on the tension side are considered (Equation (1)), as in most design practices.
The simulation results for the ultimate moment strength are plotted on normal probability papers in Figure 19. Even though the ultimate moments show a good fit to the normal PDF, as shown in Figure 19, adaptive local PDFs are proposed for selected regions with various probable failure points of M u , as summarized in Table 6. The adaptive PDF is selected to fit the simulation results in the selected lower region, below (mean + α ), in which α is the failure point location factor. The value of (mean + α ) is assumed to be close to the value of M u at the probable failure point in the calculation of the reliability index through the advanced first-order second-moment (AFOSM) method.
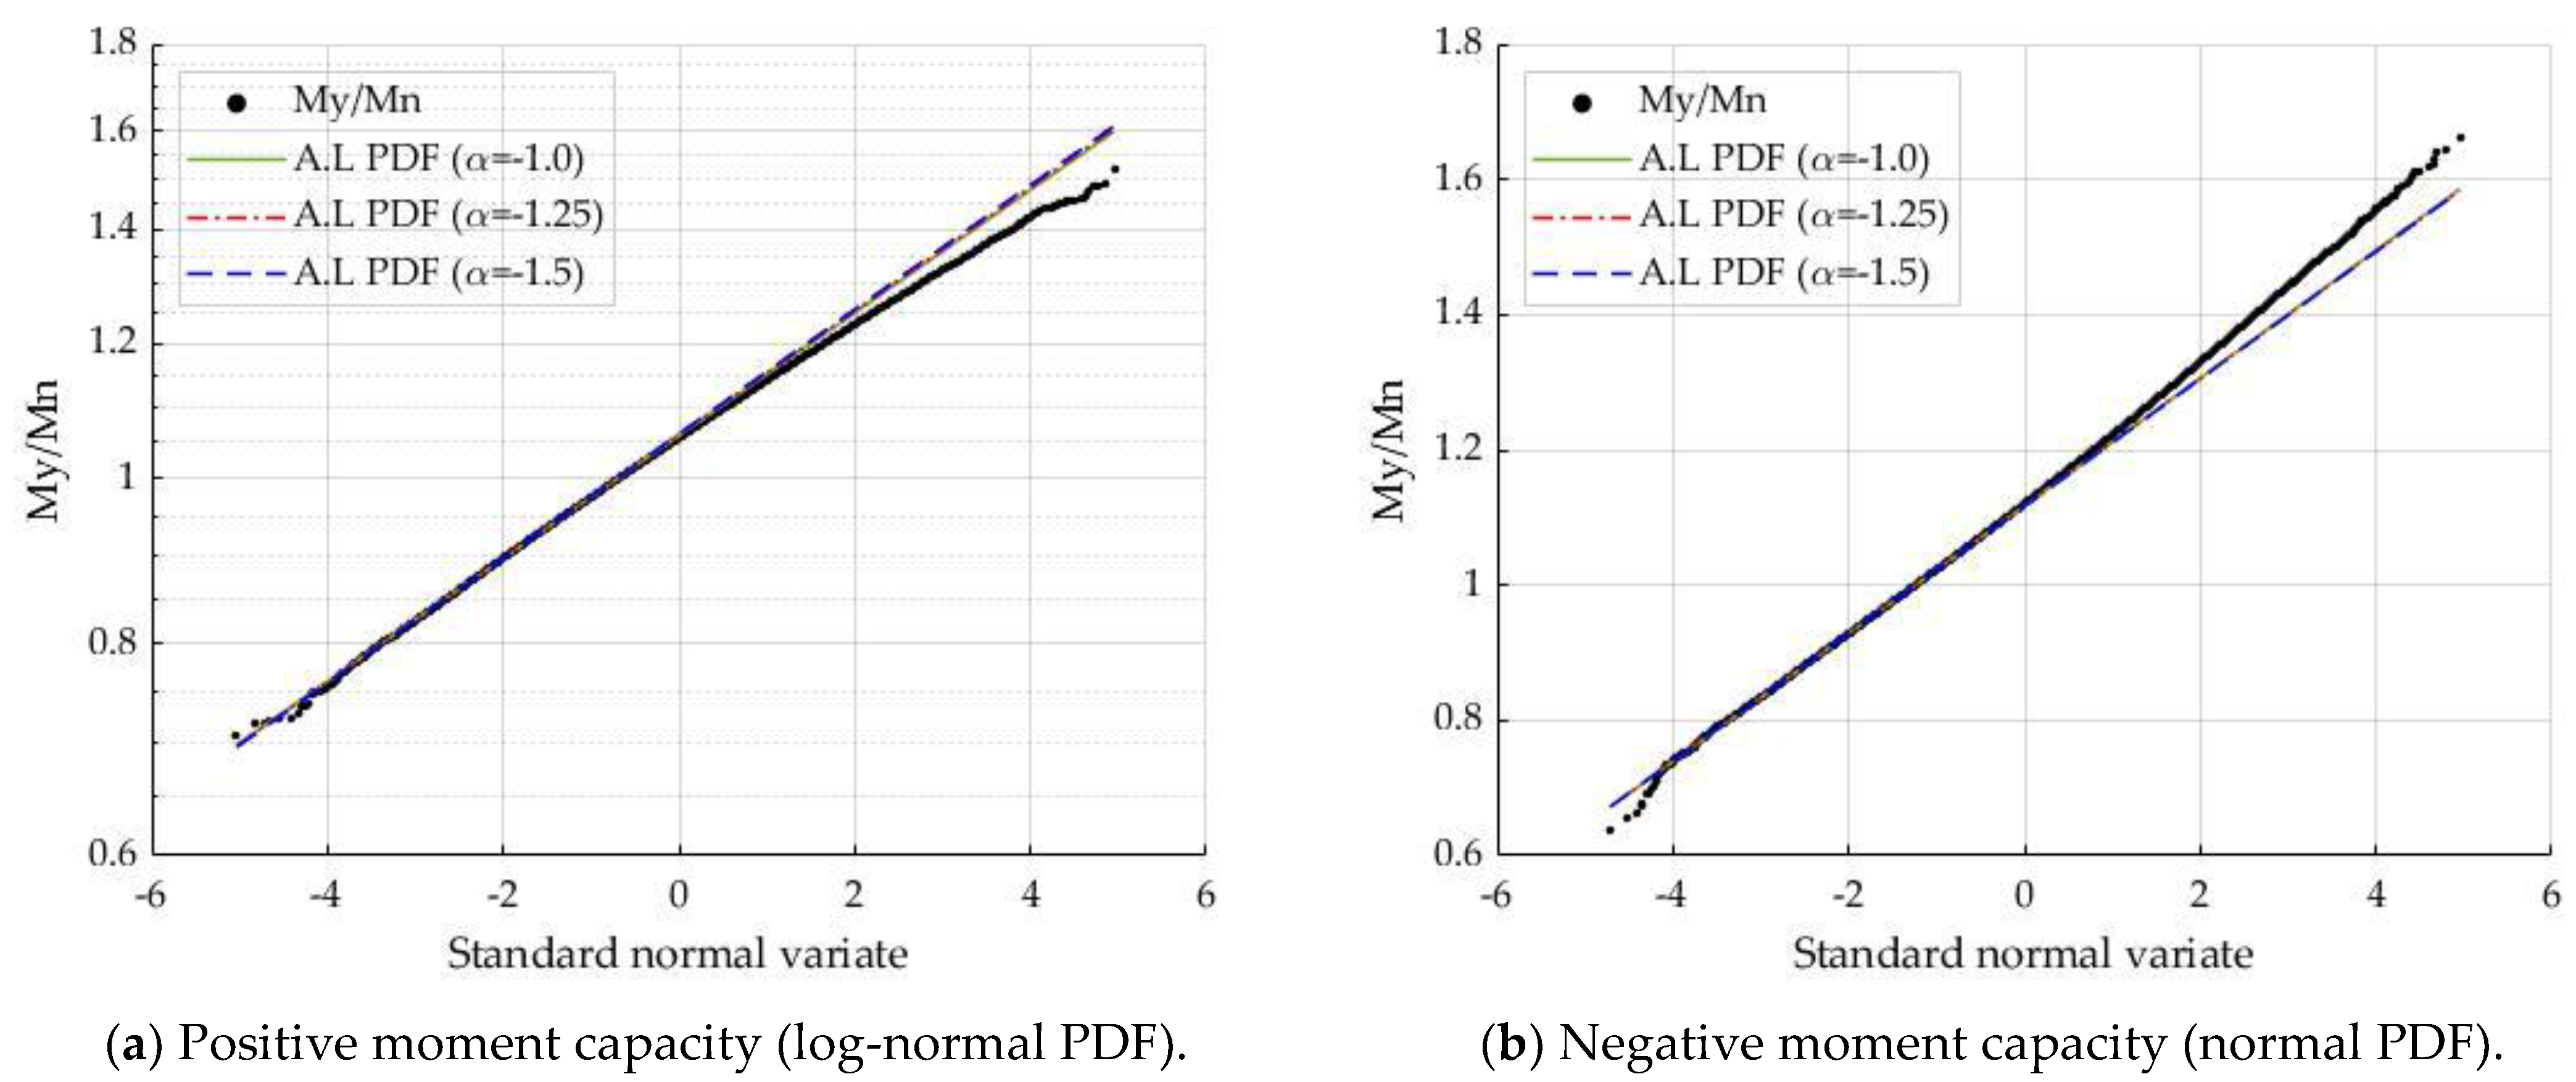
As described in Figure 20, the positive yield moment fits better with the 1, whereas the normal PDF is more appropriate for the negative yield moment. For the yield moment models, the failure point location factor α is selected between −1.0 and −1.5, as summarized in Table 6, because the expected reliability levels inherent in the yield moment limits could be lower than those for the ultimate moment limits. This is shown in Figure 21 and Figure 22. For the log-normal PDF, λ ¯ R is the median and ζ R is the logarithmic standard deviation. The probability models with either α = 1.25 or α = 1.5 show almost the same statistical parameters for both the positive moment and the negative moment.
The limit state function selected for the reliability evaluation is related to the major load combinations adopted in the design of local underground RC culverts, presented in Equation (6):
M D L v H v H h < 0
where M = flexural resistance, D = dead load effect (bias factor 0.94, cov 0.04, normal PDF), L v = traffic live load effect (bias factor 2.24, cov 0.10, Gumbel’s Type-I PDF), H v = vertical earth load effect (bias factor 1.18, cov 0.17, normal PDF), and H h = horizontal earth load effect (bias factor 1.00, cov 0.28, normal PDF) for an example case with an earth fill depth of 4 m, in which the bias factor is the ratio of the probability model mean to the nominal design value.
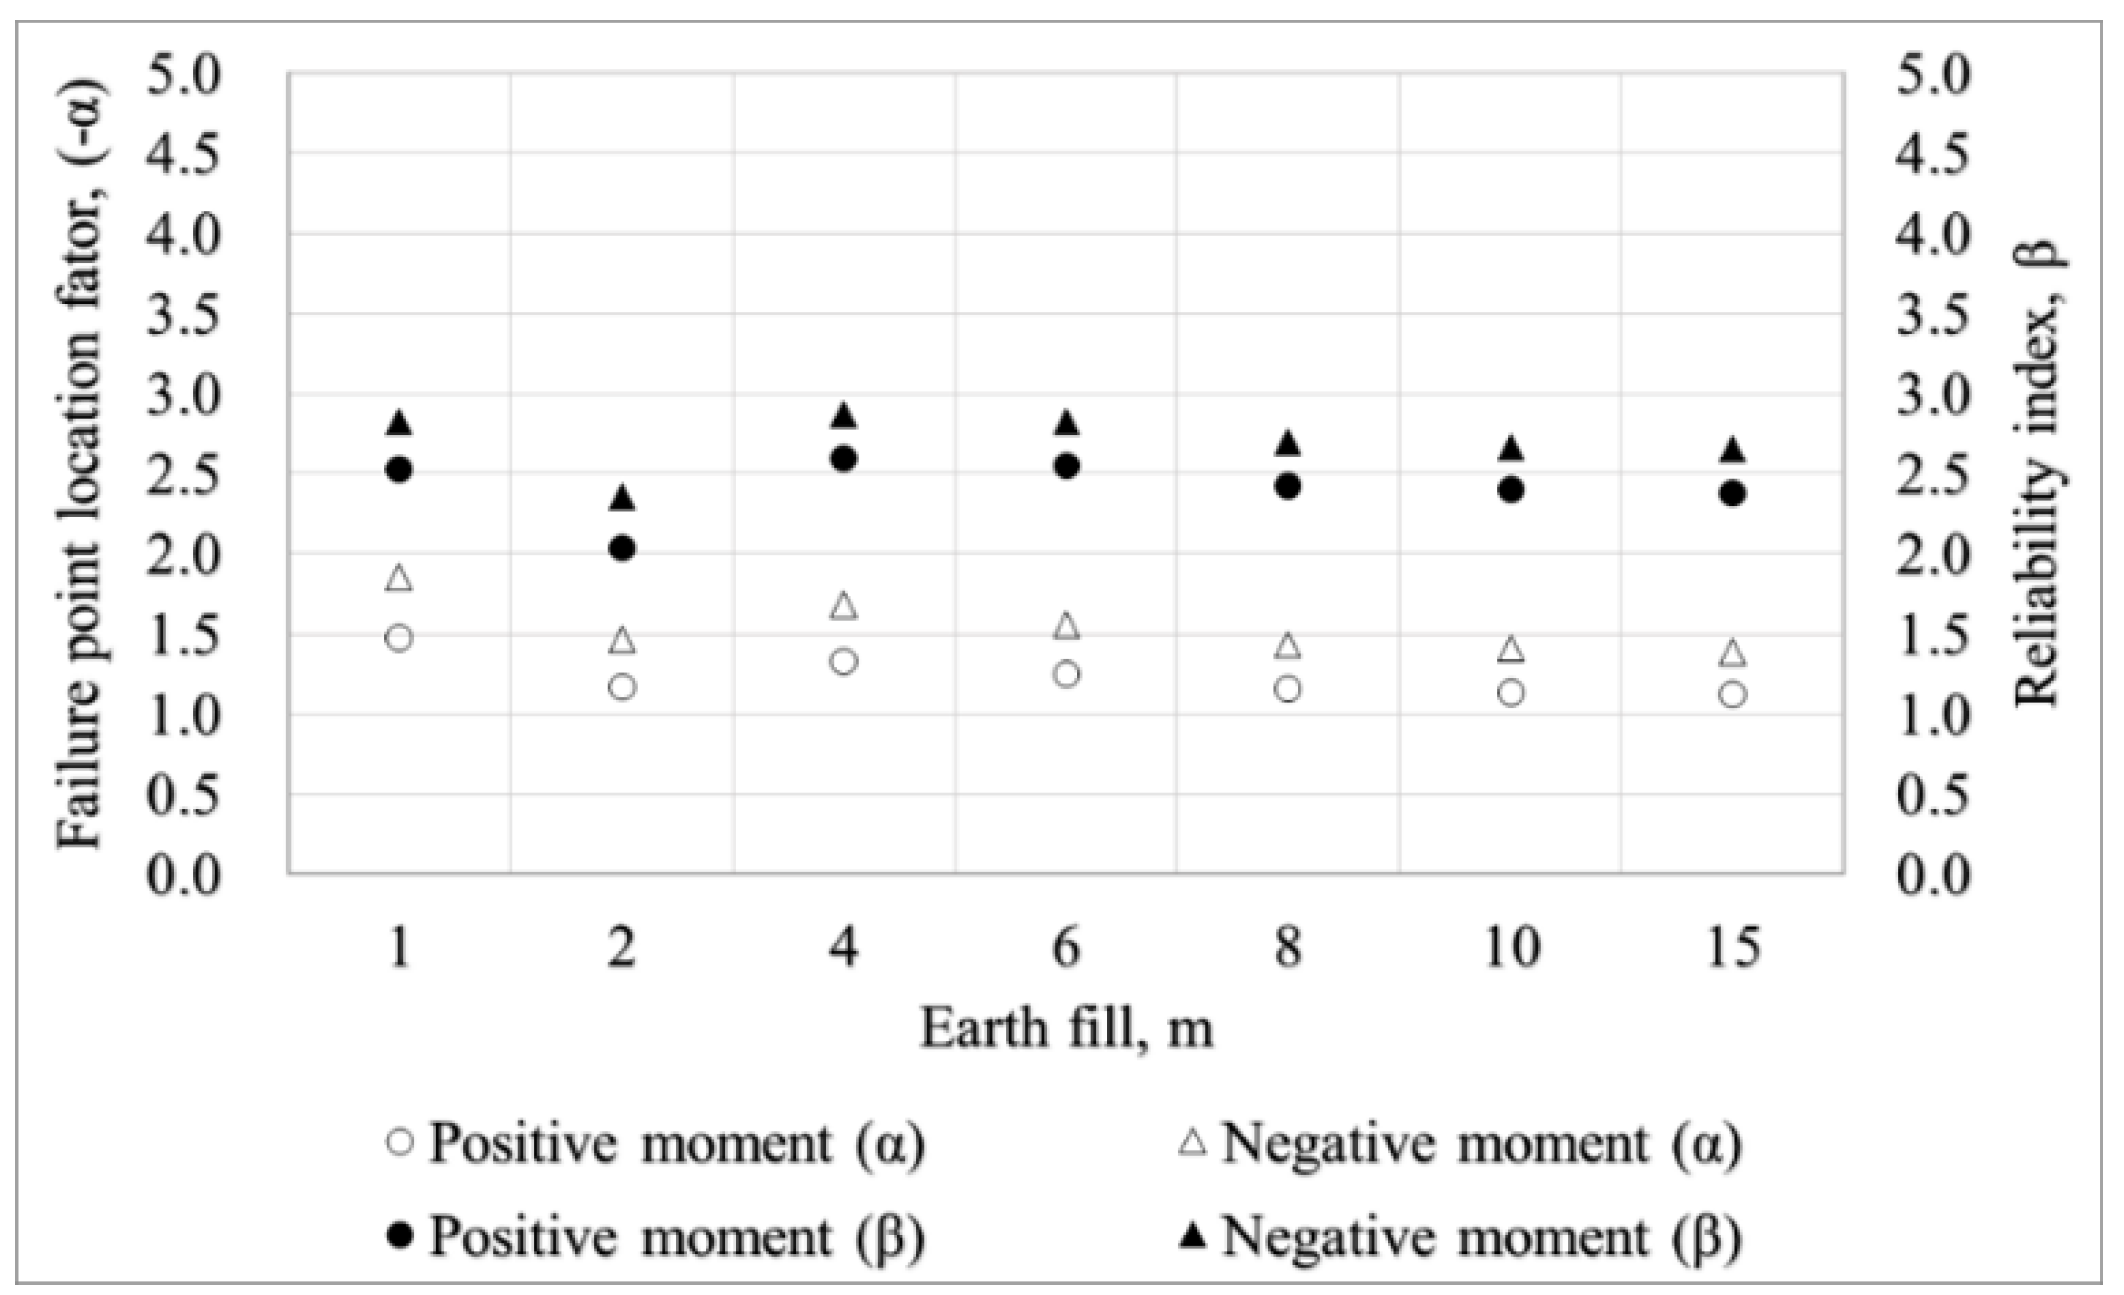
Figure 21 summarizes the failure point location factors resulting from the reliability evaluations for various earth fill depths with the probability model ( α = 2.5 ) of M u , as shown in Table 6. Most location factors were found to be about −2.5 for the positive ultimate moment and ranged from −2.5 to −3.0 for the negative ultimate moment. However, the probabilistic model was not very sensitive to the location factor of α , as presented in Table 6.
Figure 22 presents the failure point location factors resulting from the reliability evaluations with the probability model ( α = 1.25 ) of the positive M y , as shown in Table 6, which ranged from −1.0 to −1.5. Similarly, most failure location factors were found to be around −1.5 for the negative yield moment.
It was concluded that probabilistic ultimate strength models for flexural members may be proposed with a normal PDF having a mean of 1.38 and a cov of 0.08 for the positive moment region and a normal PDF having a mean of 1.45 and a cov of 0.09 for the negative moment region. For the probabilistic yield strength models, a log-normal PDF with a median of 1.06 and a logarithmic standard deviation of 0.085 for the positive yield moment region and a normal PDF with a mean of 1.12 and a cov of 0.085 for the negative moment region may be representative. The probabilistic models need to be modified slightly, depending on the target reliability level, even though the PDF models were found not to be very sensitive to the reliability levels.
To compare the resistance models obtained in this study with the flexural resistance models proposed in previous studies, the statistical parameters of basic random variables and flexural resistance of structural members proposed in the previous studies are summarized in Table 7 and Table 8, respectively. The original references are provided in the “Ref.” column in Table 7 and others are based on their own data. The statistical parameters in Table 8 were obtained through Monte Carlo simulations with the probabilistic models given in Table 7.
The resistance model investigated in this study showed a higher mean value and a lower cov compared with the previous studies [1,4,5], except for that of Galasso et al. [6]. In Galasso et al. [6], the material partial factors were included in the nominal resistance to be divided and the higher bias factor was evaluated. The main reason for this result is that the mean value of the experimental strength biasness was higher than that of other studies [1,4,5,6], as mentioned in Section 4.2. The mean biasness of f y based on the Korean industrial data was slightly higher than those in other studies, except for that of Galasso et al. [6]. However, the cov values of the basic design variables were slightly smaller than others, because the probabilistic models of the basic design variables adopted in this study were based on the critical regions—either the lower tail region or the upper tail region. Therefore, the cov of the resistance model results in a smaller cov.
To verify the simulation procedure proposed in this study, the simulation procedure was performed with the basic random variable models recommended in Ellingwood et al. [1]: f c k bias factor 0.85, cov 0.18; f y bias factor 1.13, cov 0.10; effective depth of bottom rebar—mean error −3.30 mm, SD 8.89 mm; experimental strength biasness—bias factor 1.01, cov 0.046; the cover depth of the upper rebar was assumed to be deterministic at 80 mm. All basic random variables were assumed to follow normal distribution functions. As summarized in Table 9, the mean value was found to be same, but the cov at 0.11 was smaller than 0.15 because the effective depth error models were fixed with a mean of −3.30 mm and standard deviation of 8.89 mm, regardless of the structural member depths.

6. Conclusions

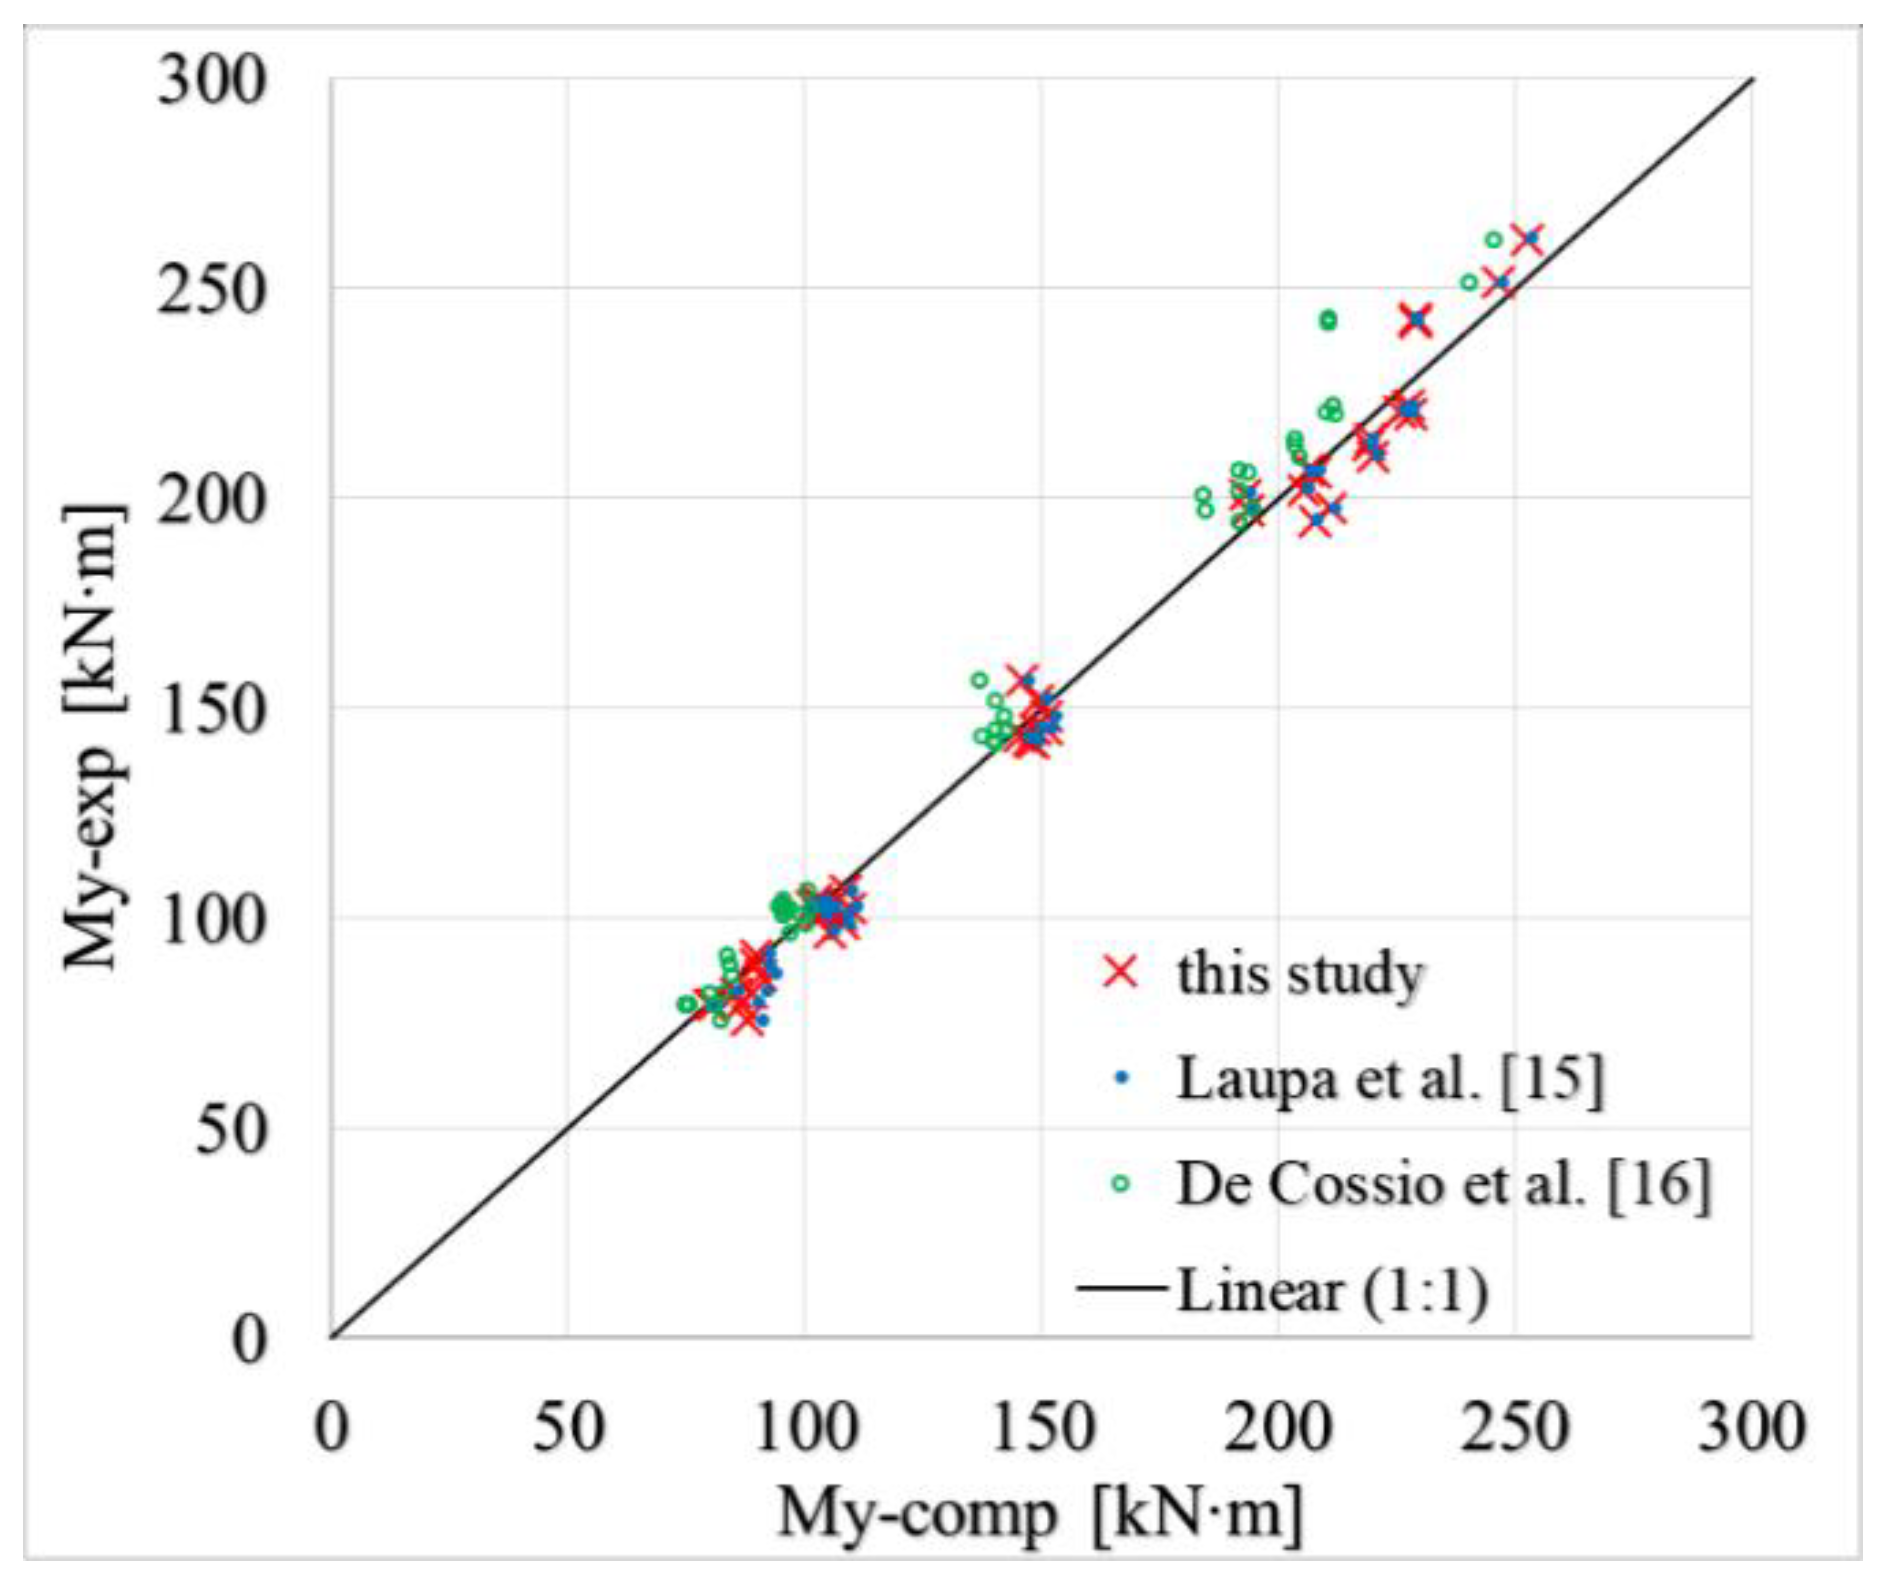
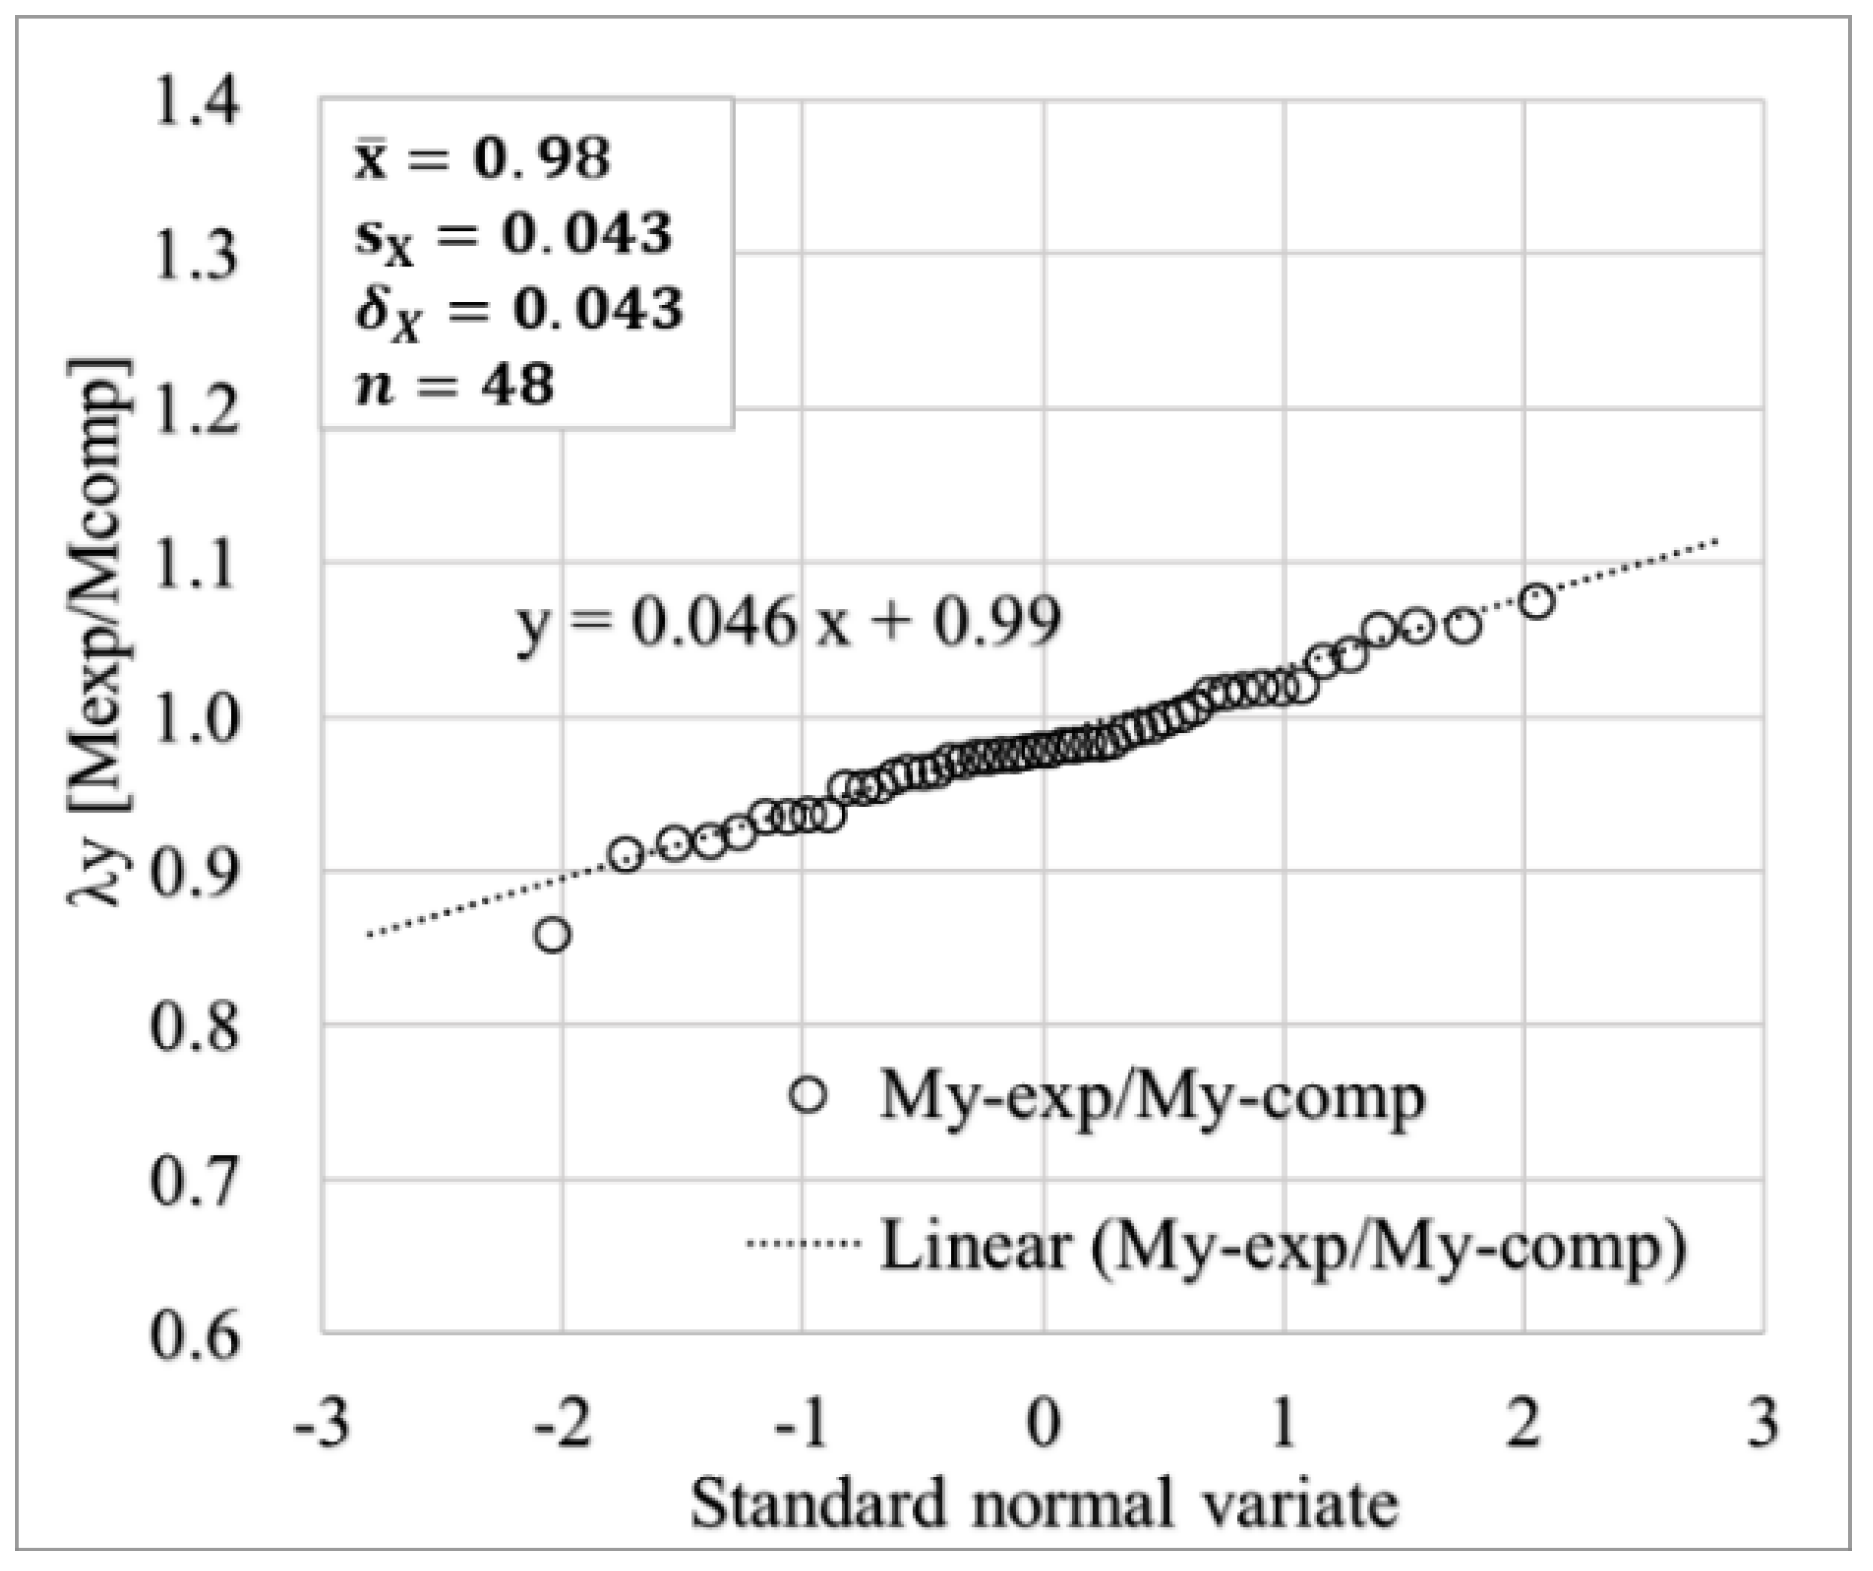
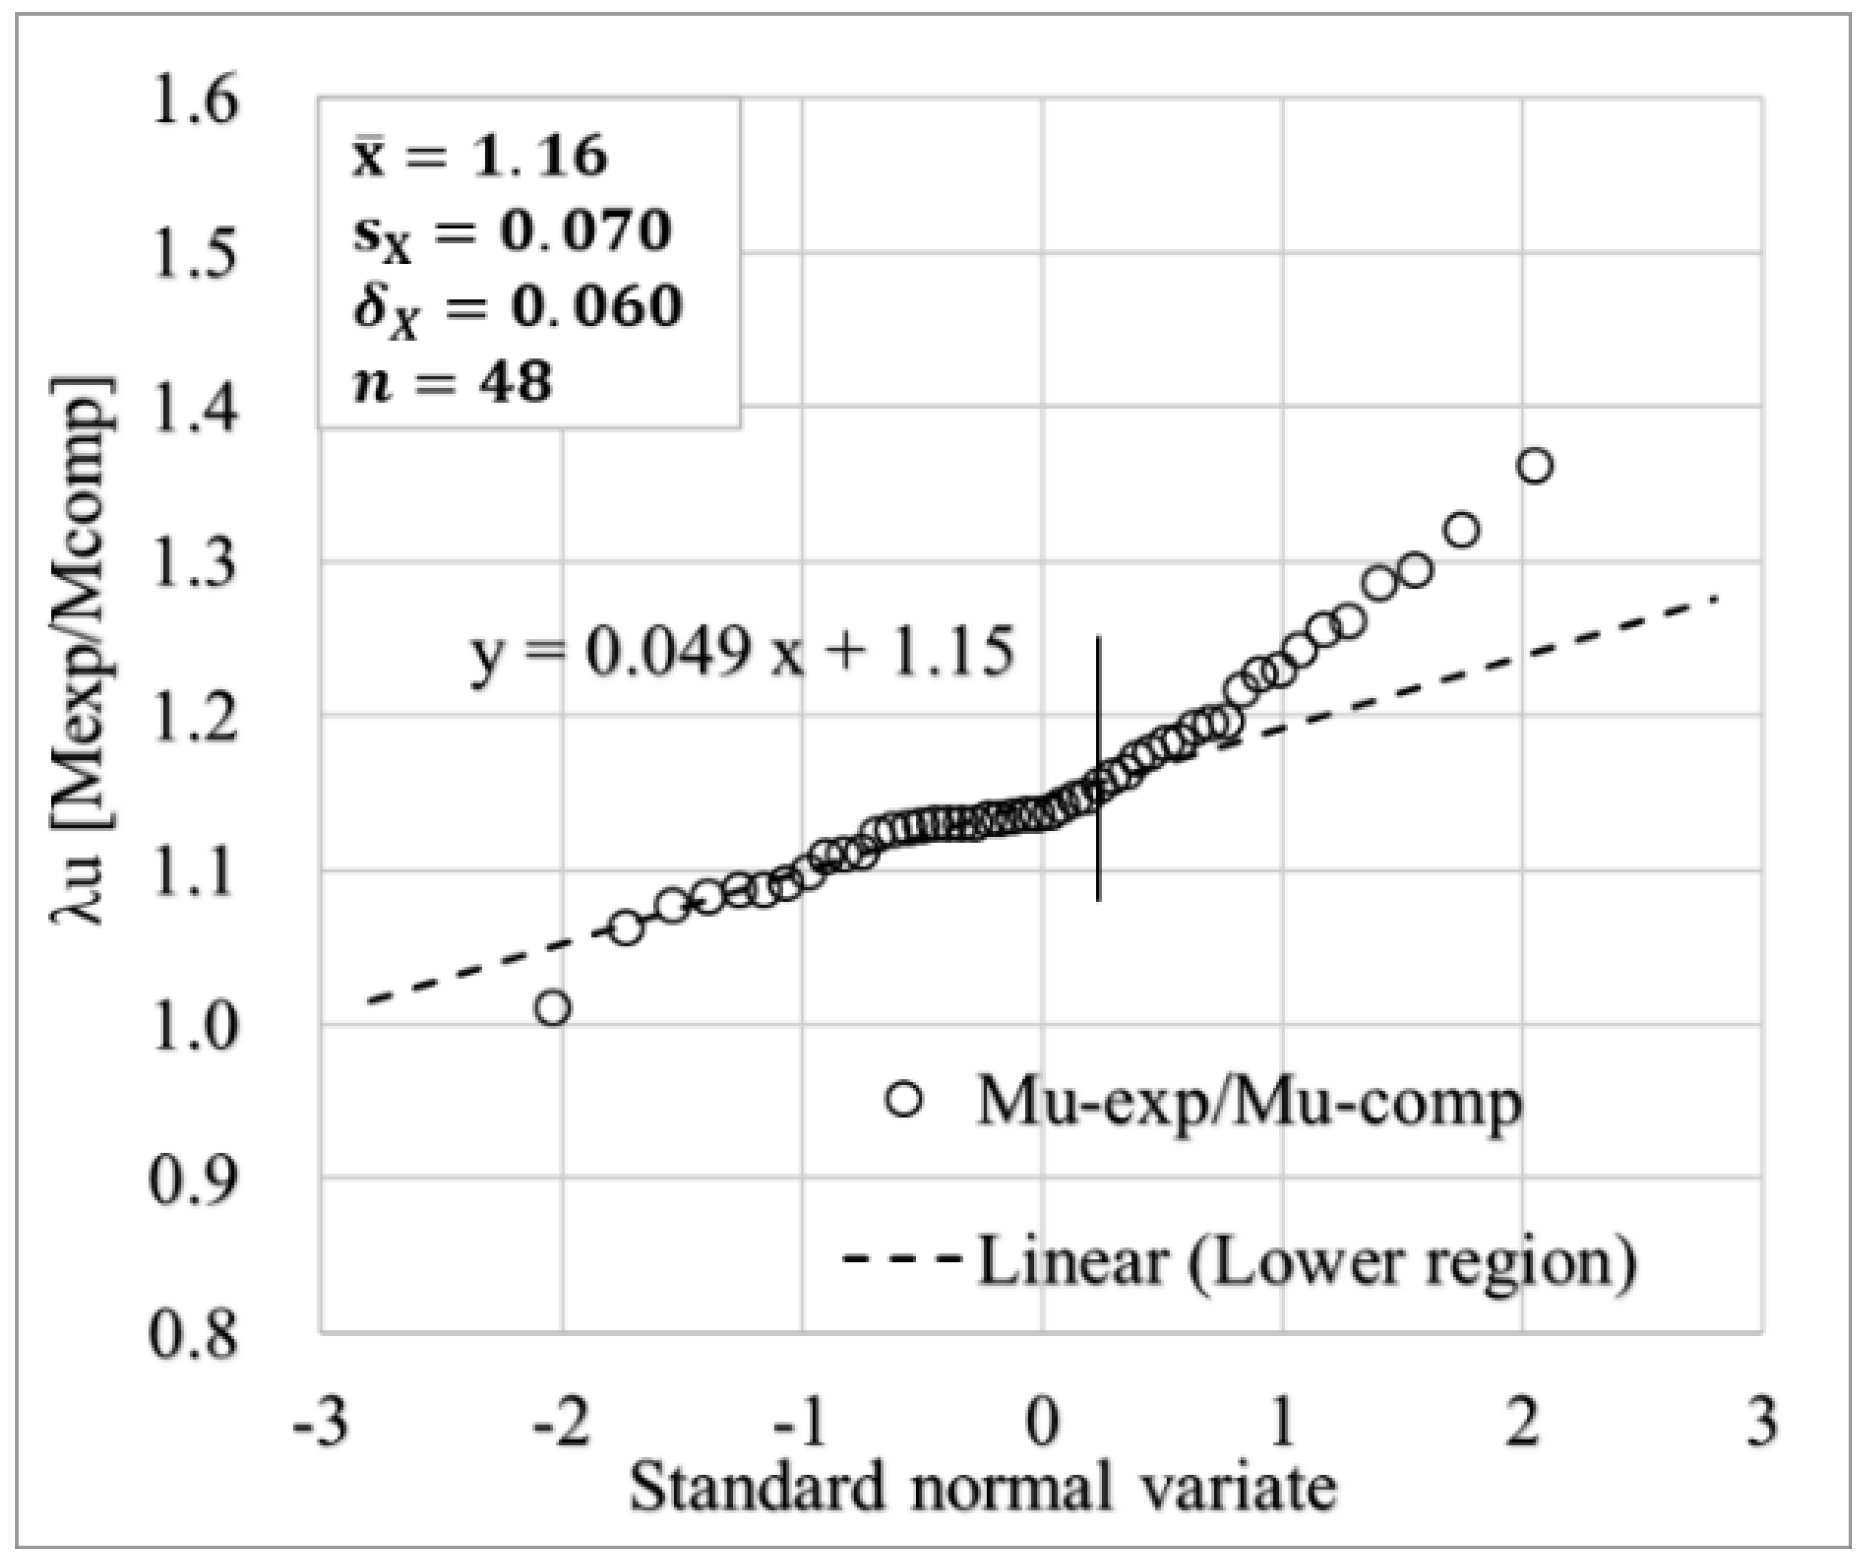
To develop probabilistic models of flexural strengths for slab members adopted in underground RC box culverts in Korea, probabilistic models of basic design variables (concrete compressive strength, yield strength of the rebar, thickness, and cover depth) were established based on material testing data of concrete and reinforcements, and field measurement data on the sectional properties, which were collected from the construction sites for underground RC box culverts in Korea. The biasness models for flexural strength (ultimate and yield strength) were evaluated as the ratio of experimental moment strength to analytical moment strength, calculated with the material strength test results and the measured sectional properties of one-way RC slab specimens.
The probabilistic characteristics of the flexural strength of RC slab members were examined through a Monte Carlo simulation with the probabilistic models of basic design variables and the biasness models of the moment strengths. Most moment strengths exhibited a better fit with normal PDFs, whereas log-normal PDFs were more suitable for positive yield moments. The positive ultimate flexural strength model was observed to follow a normal PDF with a mean of 1.38 and cov of 0.08, and the negative ultimate flexural strength model to follow a normal PDF with a mean of 1.45 with cov of 0.09 with respect to the nominal moment strength. The yield moment strengths were modeled using a log-normal PDF with a median of 1.06 and a logarithmic standard deviation of 0.085 for positive moment section, and a normal PDF with a mean of 1.12 and cov of 0.085 for negative moment section.
The proposed procedure may be applied to develop probabilistic resistance models for structural members, in which the construction error characteristics are expected to be different from other practices.

Author Contributions

Conceptualization and methodology, S.-H.K., S.-K.W., and I.C.; experiment, formal analysis, and investigation, T.B. and D.-Y.K.; writing—original draft preparation, T.B., S.-K.W., and I.C.; writing—review and editing, S.-H.K.; project administration, S.-K.W. and I.C. All authors have read and agreed to the published version of the manuscript.

Funding

This research work was supported by the Korea Electric Power Research Institute (Grant R18SA02) as well as the Korea Institute of Energy Technology Evaluation and Planning (KETEP) and the Ministry of Trade, Industry and Energy (MOTIE) of the Republic of Korea. (No. 20194030202460).

Institutional Review Board Statement

Not applicable.

Informed Consent Statement

Not applicable.

Data Availability Statement

Not applicable.

Conflicts of Interest

The authors declare no conflict of interest.

References

  1. Ellingwood, B.; Galambos, T.V.; MacGregor, J.G.; Cornell, C.A. Development of a Probability Based Load Criterion for American National Standard A58: Building Code Requirements for Minimum Design Loads in Buildings and Other Structures; US Government Printing Office: Washington, DC, USA, 1980.
  2. Nowak, A.S. Calibration of LRFD Bridge Design Code; TRB: Washington, DC, USA, 1999; ISBN 030-906-613-7. [Google Scholar]
  3. Nowak, A.S.; Park, C.-H.; Ojala, P. Calibration of Design Code for Buried Structures. Can. J. Civ. Eng. 2001, 28, 574–582. [Google Scholar] [CrossRef]
  4. Nowak, A.S.; Szerszen, M.M. Calibration of Design Code for Buildings (ACI 318): Part 1—Statistical Models for Resistance. ACI Struct. J. 2003, 100, 377–382. [Google Scholar]
  5. Nowak, A.S.; Rakoczy, A.M.; Szeliga, E.K. Revised Statistical Resistance Models for R/C Structural Components; ACI Symposium Publication; ACI: Farmington Hills, MI, USA, 2012; Volume 284, pp. 1–16. [Google Scholar]
  6. Rakoczy, A.M.; Nowak, A.S. Resistance model of lightweight concrete members. ACI Mater. J. 2013, 110, 99–107. [Google Scholar]
  7. Galasso, C.; Maddaloni, G.; Cosenza, E. Uncertainly Analysis of Flexural Overstrength for Capacity Design of RC Beams. J. Struct. Eng. 2014, 140, 04014037. [Google Scholar] [CrossRef]
  8. Foster, S.J.; Stewart, M.G.; Loo, M.; Ahammed, M.; Sirivivatnanon, V. Calibration of Australian Standard AS3600 Concrete Structures: Part I statistical analysis of material properties and model error. Aust. J. Struct. Eng. 2016, 17, 242–253. [Google Scholar] [CrossRef]
  9. Wiśniewski, D.F.; Cruz, P.J.S.; Henriques, A.A.R.; Simões, R.A.D. Probabilistic Models for Mechanical Properties of Concrete, Reinforcing Steel and PreStressing Steel. Struct. Infrastruct. Eng. 2012, 8, 111–123. [Google Scholar] [CrossRef]
  10. Nowak, A.S.; Grouni, H.N. Calibration of the Ontario Highway Bridge Design Code 1991 edition. Can. J. Civ. Eng. 1994, 21, 25–35. [Google Scholar] [CrossRef]
  11. Nowak, A.S.; Yamani, A.S.; Tabs, S.W. Probabilistic Models for Resistance of Concrete Bridge Girders. ACI Struct. J. 1994, 91, 269–276. [Google Scholar]
  12. Galambos, T.V.; Ellingwood, B.; MacGregor, J.G. Probability Based Load Criteria: Assessment of Current Design Practice. J. Struct. Div. 1982, 108, 959–977. [Google Scholar] [CrossRef]
  13. American Concrete Institute (ACI) Committee 318. Building Code Requirements for Structural Concrete (ACI 318-14) and Commentary; American Concrete Institute, ACI: Farmington Hilss, MI, USA, 2014. [Google Scholar]
  14. Wight, J.K.; MacGregor, J.G. Reinforced Concrete: Mechanics and Design, 6th ed.; Pearson Education, Inc.: Upper Saddle River, NJ, USA, 2012; ISBN 978-013-217-652-1. [Google Scholar]
  15. Laupa, A.; Siess, C.P.; Newmark, N.M. The Flexural and Shear Strength of Reinforced Concrete Box Culverts; University of Illinois Engineering Experiment Station, College of Engineering: Urbana, IL, USA, 1954. [Google Scholar]
  16. De Cossio, R.D.; Siess, C.P. Development of Design Criteria for Reinforced Concrete Box Culverts. Part I: Strength and Behavior of Reinforced Concrete Beams and Frames; University of Illinois Engineering Experiment Station, College of Engineering: Urbana, IL, USA, 1958. [Google Scholar]
  17. Hognestad, E. Inelastic Behavior in Tests of Eccentrically Loaded Short Reinforced Concrete Columns. ACI J. 1952, 49, 117–139. [Google Scholar]
  18. Nowak, A.S.; Collins, K.R. Reliability of Structures, 2nd ed.; CRC Press: Boca Raton, FL, USA, 2012; ISBN 978-036-7866-273. [Google Scholar]
  19. Ang, A.H.S.; Tang, W.H. Probability Concepts in Engineering: Emphasis on Applications to Civil and Environmental Engineering, 2nd ed.; John Wiley & Sons, Inc.: New York, NY, USA, 1984; ISBN 978-0-471-72064-5. [Google Scholar]
  20. Mirza, S.A.; MacGregor, J.G.; Hatzinikolas, M. Statistical Descriptions of Strength of Concrete. J. Struct. Div. 1979, 105, 1021–1037. [Google Scholar] [CrossRef]
  21. Mirza, S.A.; MacGregor, J.G. Variability of Mechanical Properties of Reinforcing Bars. J. Struct. Div. 1979, 105, 921–937. [Google Scholar] [CrossRef]
  22. Mirza, S.A.; MacGregor, J.G. Variations in Dimensions of Reinforced Concrete Members. J. Struct. Div. 1979, 105, 751–766. [Google Scholar] [CrossRef]
  23. Gardiner, R.A.; Hatcher, D.S. Material and Dimensional Properties of an Eleven-Story Reinforced Concrete Building; Washington University: St. Louis, MO, USA, 1978. [Google Scholar]
  24. Mirza, S.A.; Kikuchi, D.K.; MacGregor, J.G. Flexural Strength Reduction Factor for Bonded Prestressed Concrete Beams. ACI J. 1980, 77, 237–246. [Google Scholar]
Figure 1. Underground RC culverts for power supply.
Applsci 11 08520 g001
Figure 2. Strain and stress diagram of reinforced rectangular section at the yield point.
Applsci 11 08520 g002
Figure 3. Stress–strain relationship for concrete in compression (Hognestad [17]).
Applsci 11 08520 g003
Figure 4. Flowchart for the determination of the yield moment strength of a reinforced concrete rectangular section.
Applsci 11 08520 g004
Figure 5. CDF for concrete compressive strength (normal PDF).
Applsci 11 08520 g005
Figure 6. CDF for yield strength of steel rebar (normal PDF).
Applsci 11 08520 g006
Figure 7. CDF for thickness of slab member (normal PDF).
Applsci 11 08520 g007
Figure 8. CDF for inner cover depth of slab member (normal PDF).
Applsci 11 08520 g008
Figure 9. CDF for outer cover depth of slab member (log-normal PDF).
Applsci 11 08520 g009
Figure 10. Section reinforcement of RC slab specimens (unit: mm).
Applsci 11 08520 g010
Figure 11. Test setup of four-point flexural test of RC slab (unit: mm).
Applsci 11 08520 g011
Figure 12. Test setup and failure pattern of slab: (a) test setup, (b) crack pattern of slab (side view), (c) crush pattern of slab.
Applsci 11 08520 g012
Figure 13. Load–displacement curves of representative specimens: (a) SE-H16-250T, (b) SA-H16-300T, (c) SA-H19-300T, (d) SH-H19-400T.
Applsci 11 08520 g013aApplsci 11 08520 g013b
Figure 14. Estimation of yield moments.
Applsci 11 08520 g014
Figure 15. CDFs for experimental biasness ( λ y ) of yield moment strength (normal PDF).
Applsci 11 08520 g015
Figure 16. CDFs for experimental biasness ( λ u ) of ultimate moment strength (normal PDF).
Applsci 11 08520 g016
Figure 17. CDFs for experimental strength biasness ( λ y or λ u ).
Applsci 11 08520 g017
Figure 18. Flowchart for the evaluation of the probabilistic model of flexural strength of RC members.
Applsci 11 08520 g018
Figure 19. Probabilistic model of the ultimate moment strength of an RC slab.
Applsci 11 08520 g019
Figure 20. Probabilistic model of the yield moment strength of an RC slab.
Applsci 11 08520 g020
Figure 21. Failure point location factors and reliability indices for ultimate moment capacity.
Applsci 11 08520 g021
Figure 22. Failure point location factors and reliability indices for yield moment capacity.
Applsci 11 08520 g022
Table 1. Statistical yield strength data of SD400 rebars (unit: MPa).
DiameterD10D13D16D19D22D25D29D32Total
Mean, x ¯ 502.7474.3471.1467.3463.7466.3463.5464.3468.4
cov, δ X 0.0110.0450.0320.0430.0450.0290.0490.0350.042
n654545448363333318
Table 2. Dimensions of one-way RC slabs.
Specimen Titlen (Specimens)d’ (mm)a (mm)c’ (mm)t (mm)
SA-H16-300T78016060300
SA-H19-300T58016060300
SA-H22-300T28016060300
SA-H25-300T28016060300
SB-H16-300T36018060300
SC-H16-300T38017545300
SC-H19-300T38017545300
SD-H16-270T38013060270
SE-H16-250T36013060250
SF-H16-240T38012535240
SH-H19-400T58026060400
SI-H19-400T38028040400
SJ-H19-400T68029030400
Table 3. Estimation of yield moment strengths.
Statistical ParameterThis StudyLaupa et al. [15]De Cossio et al. [16]
Mean (n = 48)0.9820.9691.052
SD0.0430.0470.044
cov0.0430.0490.042
min0.8600.8300.923
max1.0751.0631.153
max–min0.2140.2330.229
Table 4. Probabilistic models of variables.
VariablesMean/MedianCov/ZetaPDF
λ u ( M u )1.150.043Normal
λ y ( M y )0.990.046Normal
f c k (27 MPa)30.4 MPa0.222Normal
f y (400 MPa)468.7 MPa0.043Normal
λ t (slab thickness biasness)1.0040.032Normal
Positive moment c s 1 (cover depth of bottom rebar/tensile rebar)71.5 mm0.065Normal
c s 2 (cover depth of upper rebar/compressive rebar)78.6 mm0.068LN
Negative moment c s 2 (cover depth of upper rebar/tensile rebar)75.8 mm0.144LN
c s 1 (cover depth of bottom rebar/compressive rebar)67.2 mm0.065Normal
Table 5. Simulation size for slab model.
Thickness, t (mm) Bottom   Rebar   Area ,   A s   ( Mm 2 )
993.01324.01909.82578.1
300122041
35041681
4004441
5001111
Table 6. Probabilistic models of flexural moment strength with adaptive PDF.
(a) Ultimate moment strength model of an RC slab (normal PDF).
Probable Failure PointPositive MomentNegative Moment
λ ¯ R V R λ ¯ R V R
Entire1.390.0831.440.093
α = 2.0 1.390.0801.440.089
α = 2.5 1.380.0791.450.090
α = 3.0 1.380.0781.450.091
(b) Yield moment strength model of an RC slab.
Probable Failure PointPositive Moment (Long-Normal PDF)Negative Moment (Normal PDF)
λ ¯ R ζ R λ ¯ R V R
Entire1.050.0791.120.089
α = 1.0 1.060.0831.120.085
α = 1.25 1.060.0841.120.084
α = 1.5 1.060.0841.120.084
Table 7. Probabilistic models of basic random variables in previous studies.
StudyBasic Random VariablesBias FactorCovPDFRef.
Ellingwood et al. [1] f c k (20.7, 27.6, 34.5 MPa)0.92, 0.85, 0.810.18, 0.18, 0.15Normal[20]
f y (420 MPa)1.130.10Beta[21]
Effective depth, bottom rebar−3.30 mm *SD = 8.89 mmNormal[22,23]
Effective depth, upper rebar−10.16 mm *SD = 12.70 mmNormal[22,23]
Experimental strength biasness1.010.046Normal[24]
Nowak et al. [4] f c k (20.7~41.3 MPa)1.35~1.120.10Normal-
f y (420 MPa)1.150.05Normal-
Area of rebar, A s 1.000.02Normal-
Effective depth of slab, cast-in-place0.920.12Normal[1]
Experimental strength biasness1.020.06Normal[1]
Nowak et al. [5] f c k (20.7~44.8 MPa)1.31~1.140.17–0.12Normal-
f y (420 MPa)1.130.03Normal-
Area of rebar, A s 1.000.02Normal-
Effective depth of slab, cast-in-place0.920.12Normal[1]
Experimental strength biasness1.020.06Normal[1]
Galasso et al. [7] f c k (25 MPa)1.350.18Normal[1,4,12]
f y (450 MPa)1.220.05LN-
Area of rebar, A s 1.000.01Normal[1,4,12]
Effective depth of beam0.990.04Normal[1,4,12]
Width of beam1.100.04Normal[1,4,12]
Experimental strength biasness1.020.06Normal[1,4,12]
Present study
(Positive moment strength)
f c k (27 MPa)1.130.222Normal-
f y (400 MPa)1.170.043Normal-
λ t (slab thickness biasness)1.0040.032Normal-
c s 1 (cover depth of bottom rebar)1.190.065Normal-
c s 2 (cover depth of upper rebar)0.98 **0.068 ***LN-
Experimental strength biasness1.150.043Normal-
*—mean error; **—median; ***—zeta.
Table 8. Statistical parameters of flexural resistances in previous studies.
StudyStructural TypeBias FactorCov
Ellingwood et al. [1]One-way RC slab; 127 mm-thick1.210.15
Nowak et al. [4]RC slab cast-in-place1.080.15
Nowak et al. [5]One-way RC slab; 102~203 mm-thick1.060.15
Galasso et al. [7]RC beam; 500–850 mm-thick1.65 ****-
Present studyOne-way RC slab; 300~500 mm-thick1.380.08
****—median; material partial safety factors are included.
Table 9. Statistical parameters of flexural resistance, based on Ellingwood models.
Structural TypeMeanCov
Ellingwood et al. [1]Continuous one-way RC slab in flexure; 127 mm-thick1.210.15
Present study with Ellingwood et al.’s [1] dataOne-way RC slab in flexure; 300~500 mm-thick1.210.11
Publisher’s Note: MDPI stays neutral with regard to jurisdictional claims in published maps and institutional affiliations.

