1. Introduction
Population growth and urbanisation are amplifying the impacts of natural disasters and incidents. This poses a significant challenge for emergency teams, whose resources must be deployed in the least possible time to minimise casualties and losses [
1,
2]; however, these emergency systems are unlikely to be able to meet incident requirements if they are not well designed and robust for largescale events [
3]. Good planning and prediction of future needs, including new fire station locations, are essential to ensure universal coverage by the service, protection of people and property, and an equitable distribution of the workload among its servers [
4,
5].
Fire service management in Spain depends on the regional governments. The Madrid Region is the autonomous region with the highest population density in Spain, with 84,453 per km
2 [
6]. Although the number of fire stations (FS) in the Madrid Region increased from 14 in 1990 to 19 in 2014, in the same period the population grew from 1,952,428 (excluding the city of Madrid) to 3,364,377 in 2018 [
7]—an increase of 72%—while the number of FS rose by only 15%, with an annual average of 17,991 incidents. With these population conditions and facilities, the Madrid Region’s emergency system is more fragile than all other regions in Spain in terms of potential scenarios involving a high number of simultaneous incidents or largescale disasters that could collapse the system [
1].
Within this framework, the Madrid Regional Government has decided to increase the number of fire stations to resolve the fragility of the emergency system, prevent its collapse, and maintain its reliability [
8] (oral communication). These specific characteristics of the Madrid Region make it the most suitable region in Spain for developing this study.
This study introduces the concept of the collapse index to ensure the reliability of the system and prevent it from reaching the limit of its capacity. This is a spatial measure, which in one year and for each pixel, integrates the maximum simultaneous time dedicated by two or more resources (vehicles) to one or more incidents of any type, as well as the maximum number of vehicles that have been deployed at the same time. A more detailed explanation of this index can be found in the Material and Methods section. The threshold in this index beyond which the system may collapse is determined from the number of resources in a geographic area, their location, the number of incidents, and the time the resources take to act. In this paper, we describe both “incidents” and “disasters” as “incidents”, since this distinction is irrelevant in developing the methodology (Law 17/2015 of 9 July from the Spanish National Civil Protection system defines a disaster as a risk situation that collapses the society for a period and an incident as a local event that may produce high losses but never causes society to cease functioning).
According to the analysis of the data from the Madrid Region, the emergency fire system is highly likely to collapse. This would occur when all vehicles are deployed to several incidents at the same time and new calls are received.
This study addresses two key issues that previous studies in the literature do not tackle in depth: the problem of the reliability of fire services in areas with a sharp increase in incidents where the system may collapse and the issue of the homogeneous workload distribution of FS resources when the optimum location of new FS is calculated.
The aim of this paper is to obtain the optimum locations of between one and five new FS according to the demands of the Madrid Region civil defence system in order to minimise the annual workload of the resources of a particular FS and avoid the collapse of the emergency fire system. The heuristic optimisation method of simulated annealing is applied.
The main contributions of this paper include the following:
We formulate a new measure of the reliability of the fire service system, the collapse index, to reduce the overlap of the actions of the resources in the incidents. This is a territorial measure at the pixel level calculated from the historical fire service data for the Madrid Region. A specific maximum value of this index is determined and considered as a restriction in the optimisation process;
We propose a new fire station (FS) optimum location model by applying the simulated annealing method in combination with geographic information system algorithms. This model balances the workload between FS when new FS are optimally located. The use of a cost function that minimises the standard deviation of the FS resource workload is a novelty as compared to other studies in the literature on FS locations;
The optimisation process calculates the effects on the workload of an old FS due to the replacement of one of its resources in an incident by a resource from a new FS and updates the collapse index for the study area. All types of incidents and resources are considered in the model. The results show that the maximum collapse index in a pixel decreases from its initial value of 10,485 min to 2500 min when five new FS are built.
A specific computer application was developed for this study, which includes historical data in the Madrid Region fire service, namely all types of incidents in all vehicle types, as well as the calculation of the collapse maps for each configuration of the FS locations and the optimisation process. Maps of the collapse index can, thus, be obtained to determine its distribution in Madrid and identify the areas with the highest risk of collapse for use in the decision-making process. The decision makers also have information on the effects of adding one to five fire stations on the reliability of the system and where these new FS should be placed.
This paper is organised as follows.
Section 2 presents the related studies in the literature.
Section 3 introduces the study area, while the new optimisation model is described in
Section 4.
Section 5 contains the results obtained by applying the proposed methodology in the Madrid Region, which are then discussed in
Section 6. Finally, the conclusions drawn from our study are explained in
Section 7.
2. Related Work
This section describes the different studies that established the basis of the allocation–location problem in emergency management, as well as the metaheuristic of the studies most closely related with this study. Mathematical programming is still the most widely used methodology for analysing emergencies. Galindo and Batta [
9] indicated that approximately 11% of the publications on emergency research use a combination of techniques, including the statistical risk approach, simulation through the Monte Carlo method for the validation of objectives, and mathematical programming for optimisation models. Multicriteria decision-making methods such as the analytical hierarchical process (AHP) and heuristic methods such as genetic algorithms and simulated annealing are also common [
10].
2.1. Linear Programming and Multicriteria Methods in Optimum Fire Station Location
The earliest linear programming (LP) papers on emergency response were the fire station location planning studies by Valinsky [
11] and Hogg [
12], which took a strictly economic approach to the optimum location for a fixed number of FS in New York and Bristol, respectively. The economic variable may be based on property values (Valinsky [
11]) or losses from fires and the costs of the services (Hogg [
12]). Both these studies served as a reference for later research combined with new models. Two of the main focuses to date were first presented by Toregas et al. [
13] and Church and ReVelle [
14] in the 1970s. Toregas et al. [
13] established the concept of the location set covering problem (LSCP) and applied LP to the optimum location of the minimum FS at fixed potential facility points, measuring performance in terms of the response time. Plane and Hendrick [
15] integrated this new approach with the results from the studies by Valinsky [
11] and Hogg [
12] to formulate a goal-programming model that minimised annual costs, response times, and the number of FS. Unlike the LSCP model, which aims for full coverage of the population, Church and ReVelle [
14] introduced the maximal coverage location problem (MCLP) on a network to maximise the population covered by each FS for a fixed distance, S, over a range of facilities. The first developments of the MCLP model integrated not only the maximum population covered but also the maximum property value in the relocation of the existing facilities (Schilling et al. [
16]). These first studies still failed to address the problem of a fire station being unable to meet all of the demands or the fact that the FS may use their resources to help other FS. Hogan and ReVelle [
17] and Daskin [
18] addressed this problem by incorporating into the MCLP model the location of a second FS in a specific area, which could be used if the first facility assigned is unavailable to provide a service.
The development of geographic information systems (GIS) has allowed researchers to obtain more accurate FS location models by taking a territorial approach; thus, distances, fire station sites, and demand locations can be calculated more precisely than in previous studies. New research based on MCLP and GIS incorporated response times into the MCLP model through a threshold of the percentage of incidents that were responded to within a fixed time, also including a risk modelling approach to estimate demand-weighted areas (Murray and Tong 2009 [
19] and Chevalier et al. [
20]). Murray and Tong [
19] applied the model in the state of Massachusetts, although without considering the interactions between the FS in cities or the FS configuration. Chevalier et al. [
20] studied a location–allocation problem in Belgium, considering the staffing of fire stations and two types of risks—recurrent risks and sporadic risks—based only on their frequency. Other simplifications were assumed in their model: one crew is always available in each station, while in the allocation problem, the model does not consider sporadic risks which could affect the location results. Finally, in this same line of research, in 2017 Van den Berg et al. [
21] presented a more complex location–allocation model, which assumed multiple vehicle types with a type-dependent response time target. The model maximises the sum of the coverage provided by the different vehicle types but does not consider backup coverage if the demand point is not covered by the assigned FS.
Multicriteria decision-making methods allow FS locations to be ranked according to a small number of criteria weighted by the stakeholders. Unlike in linear programming or heuristic optimisation methods, no optimum solution is sought. Studies such as those by Habibi et al. [
22] and Erden et al. [
23] applied GIS at the plot scale with the analytical hierarchical process method to identify a finite number of possible location points and rank them under classical criteria such as population, risk, and distance between FS.
2.2. Previous Related Metaheuristic Studies
One of the first studies to address the problem of locating new facilities applying a metaheuristic model was Liu et al. in 1994 [
24]. In this study, the total weighted distances between new and existing facilities were minimised so that total travel cost per unit time was minimal. In this case, the applied optimisation algorithm was simulated annealing.
Some previous studies in the literature addressed the FS location problem with heuristic methods following the LSCP model, while others applied the MCLP formulation [
25].
In the first case, heuristic methods minimised the number of facilities so that the whole population was served within a standard distance and with standard FS equipment [
26]), or minimised the longest distance from a FS to any incident site given a possible maximum number of FS [
27]. In the first case, the heuristic concentration method was applied, while a genetic algorithm was applied in the second case. Zhang and Jiang [
28] and Indriasari et al. [
29] followed the MCLP approach by combining genetic algorithms with GIS, which allowed MCLP to be formulated as a maximal service area problem (MSAP), whereby the decision variable was the size of the area rather than the population [
29]. Several simplifications were proposed in these heuristic approaches to ensure the responses to all incidents—each demand was assigned to one and only one crew [
26], and one fire engine was always available when a call was received [
27] following the MCLP approach [
30]. Başar et al. addressed the multiperiod location planning problem of emergency medical service stations by applying another metaheuristic method—tabu search. The objective was to maximise the total population serviced by two different stations within two different response time limits over a multiperiod planning horizon [
30].
A mixed LCP-MCLP model was presented by Bolouri et al. to address the ordered capacitated multiobjective location–allocation problem for fire stations [
31]. In this model, the distance between the demand and the station and the arrival time from the station were minimised, while the station’s coverage was maximised. The authors applied and compared genetic algorithm and simulated annealing models. The results showed that for small problems, the genetic algorithm was more efficient than simulated annealing, although the reverse was true for large problems.
Other studies by Nasab et al. and Buil et al. were related to the study described in this paper. Nasab et al. developed a general facility location approach in which the objective was to minimise the total distance travelled by the products or resources by applying a model based on simulated annealing [
32].
Buil et al. presented a study applying both linear programming and simulated annealing to determine the optimal allocation of resources to incidents in real time in a roadside assistance problem that minimised operating costs while maintaining the level of service above a certain threshold. These authors introduced a constraint similar to the one presented in this paper [
33].
Finally, Alfilian et al. addressed the problem of forecasting relocation in a carsharing framework with the objective of balancing the distribution of cars at the end of the day, which was similar to the objective of balancing the workload of FS [
34].
These previous studies showed that optimal location of FS works have not been formulated yet to minimise the annual workload of the FS to avoid the collapse of the emergency fire system.
3. Study Area
The Madrid Region is located in central Spain and has an area of 8021.80 km2. The region is organised into 179 municipalities with a total of 6,661,949 inhabitants, 3,223,334 of whom live in the city of Madrid. The per capita GDP is 34,916 euros, the second highest in Spain. The main land use is forest, covering over 50% of the area.
Regarding the legislation on the emergency system, Law 17/2015 of 9 July from the National Civil Defence System established the responsibilities of the various national, regional, and local bodies in the area of civil defence. In the Madrid Region, Decree 9/1985 of 14 February describes the Madrid Region’s Territorial Civil Defence Plan, which regulates the coordination of services and resources in the Madrid Region for the purposes of civil defence and depends on the Fire Division in the Madrid Region’s Directorate-General of Civil Defence.
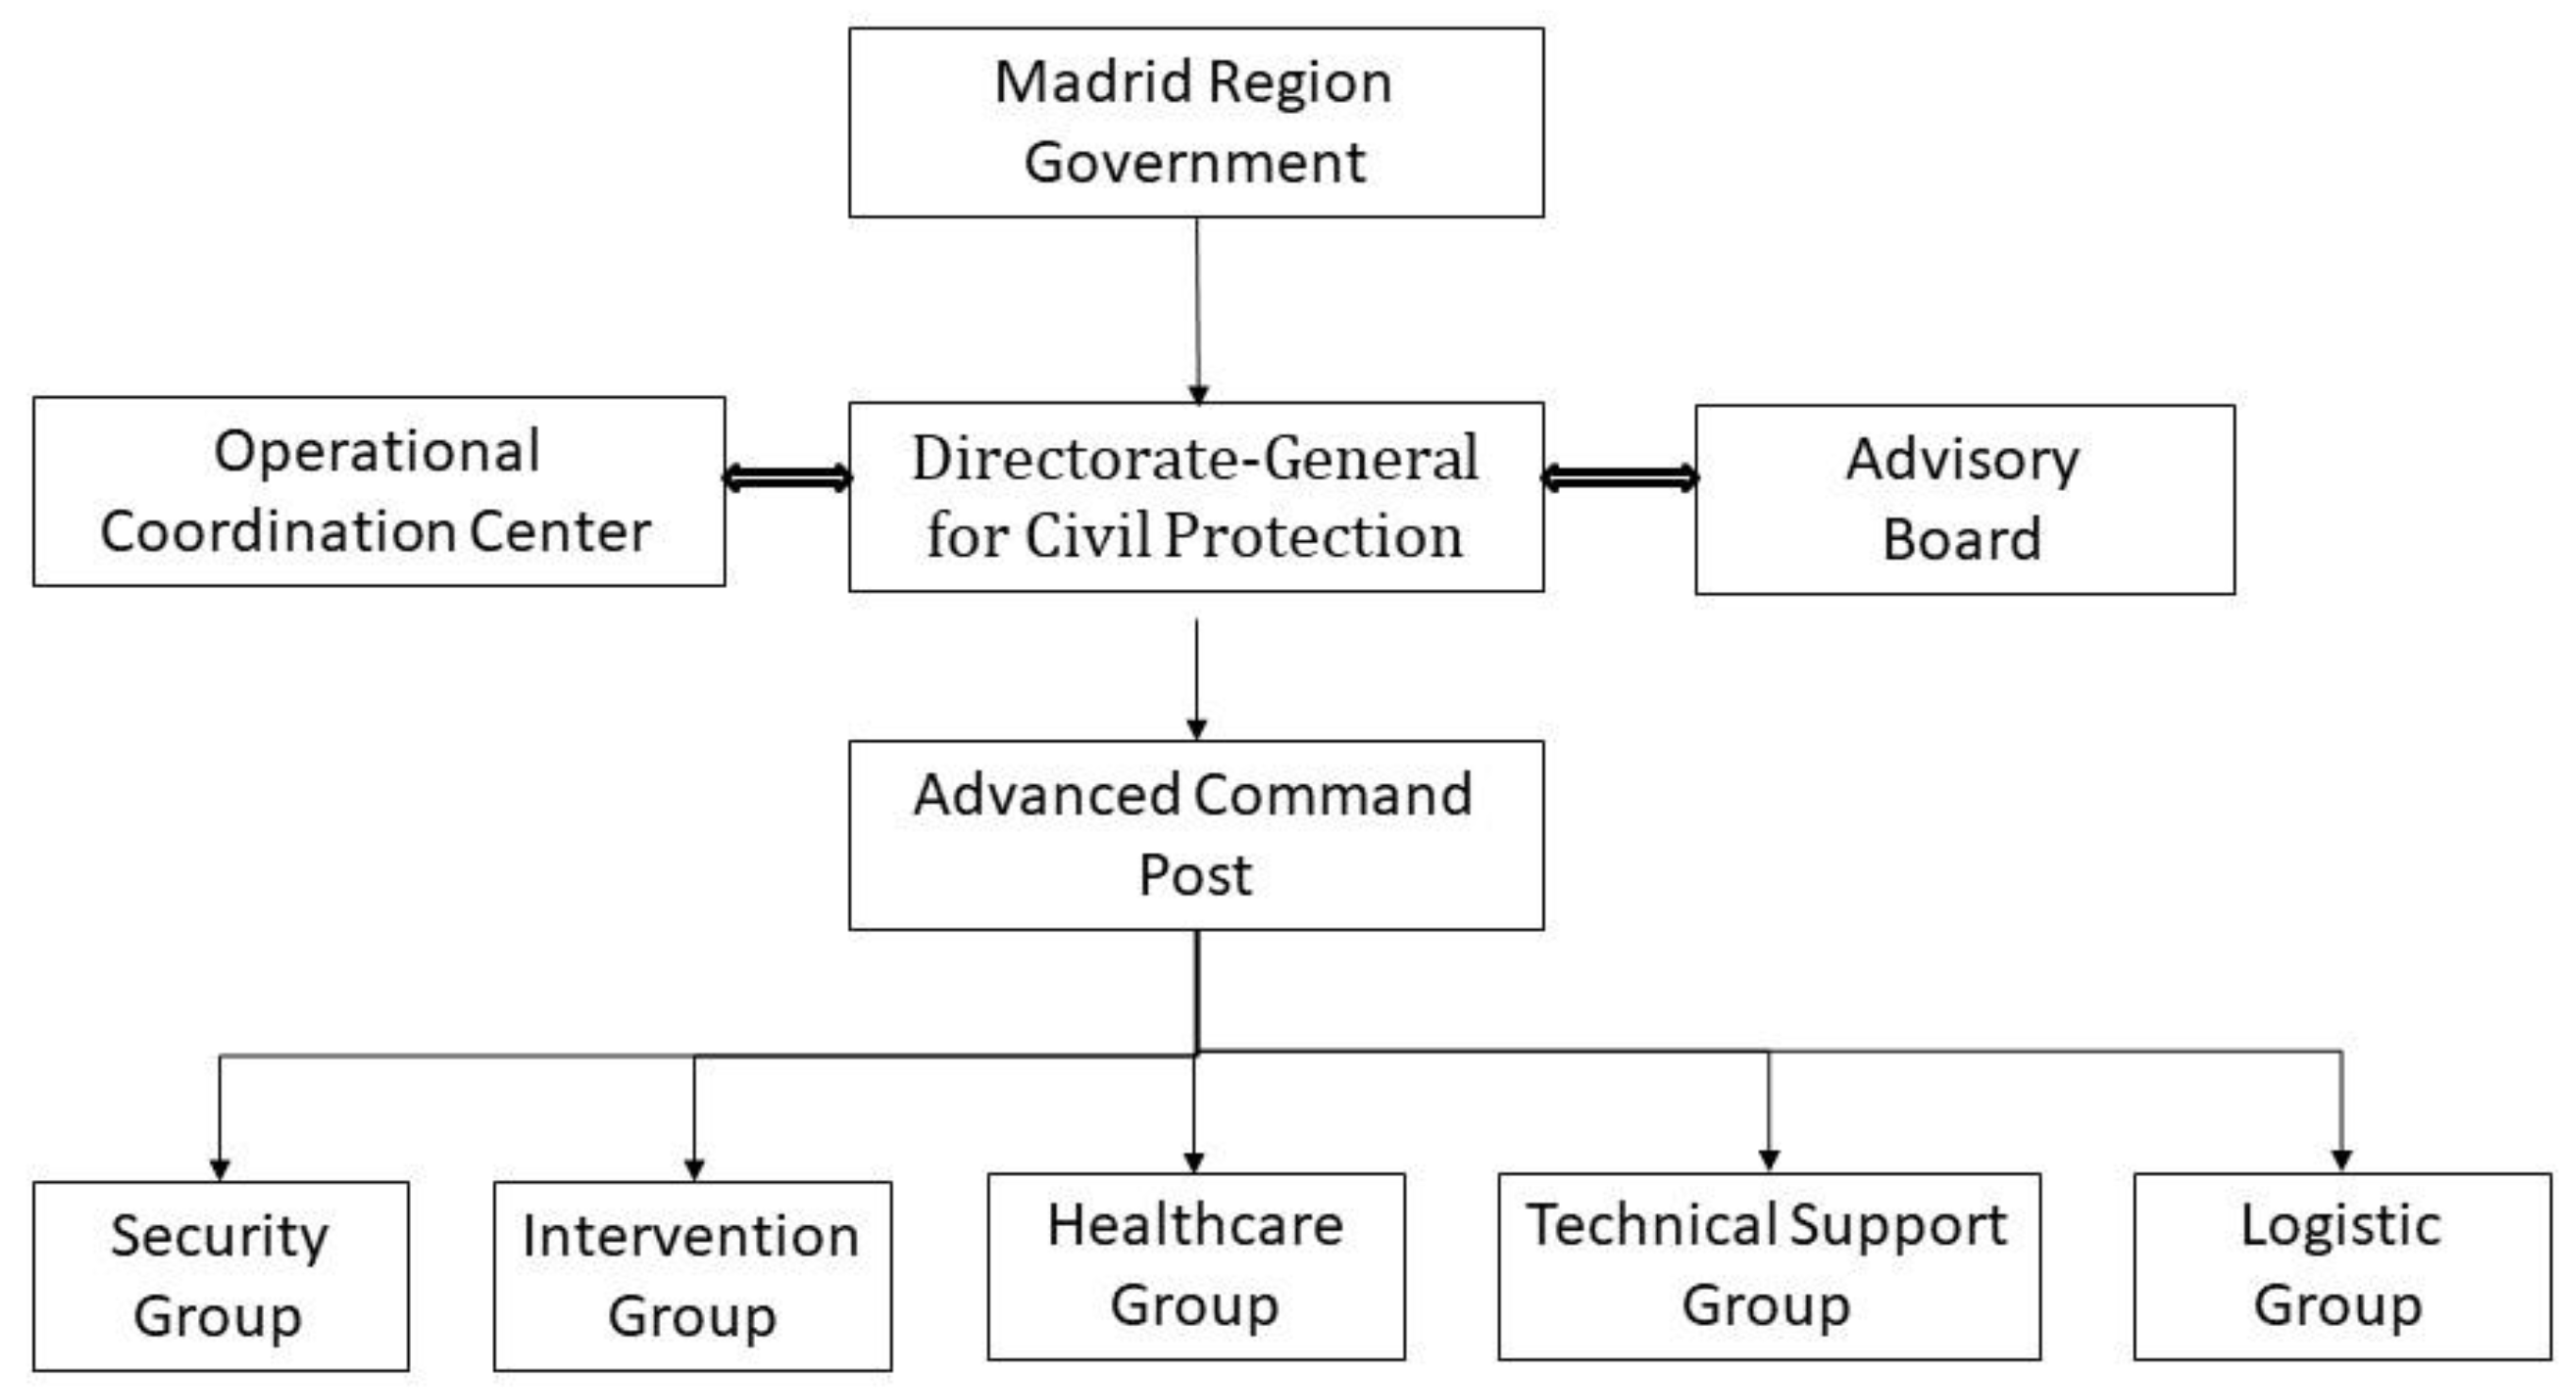
Figure 1 shows the organisation established for decision-making in the emergency system.
The aim of the Madrid Region’s Territorial Civil Defence Plan is to respond to situations of serious risk, catastrophes, or public alarms that may occur in its territory; to establish the general organisational framework for the coordination of all services and resources available in the Madrid Region, including those of public and private entities and from other public administrations, according to their prior assignment based on their availability and the needs of the Territorial Plan; to allow the integration of territorial plans with a smaller scope and to guarantee the link with plans with a broader scope; and to ensure in all cases the first response to any emergency situation that may arise.
The General Director for Civil Defence determines which part of the organisational structure is activated in each incident, as well as the general strategy of the operations, as supported by the advisory board.
The Operations Coordination Centre (CECOP, Centro de Coordinación Operativa), the body that is common to all emergency systems [
35], is the main centre tasked with coordinating plans from different levels and for actions in the execution and management of processes and resources. It has the necessary links and communication systems to disseminate the information to other management centres, from which the plan director can direct and coordinate the operations. The CECOP receives alarms from all information systems and databases necessary to assess the risk status of the incidents on an ongoing basis, and these aid the plan director in decision-making and planning of the actions.
The advanced command roles are an extension of the CECOP and constitute the working body of the coordinator on the ground. The team that assists and advises the coordinator in the field is designated according to the circumstances and is constituted by representatives of the action groups and all bodies or entities whose actions are key to achieving the objectives. Under the framework of the Territorial Plan for emergencies, the ordinary operating services, or action groups—including fire extinction and rescue units, emergency medical services, the Red Cross, national security units and forces, and local police and assistance and volunteer organisations—are all coordinated under a single management system. If the firefighting service is involved in an incident, the closest available auto-pumping urban vehicle will intervene, and if necessary specific vehicles will be used according to the type of intervention.
The region has 19 fire stations that respond to any incident in the region, excluding the municipality of Madrid. They serve 3,364,377 inhabitants and cover 93 different types of incidents [
36], grouped into traffic accidents, indoor and outdoor technical assistance, explosions, fires, floods, rescues, and other incidents and disasters.
Each fire station is characterised by the types of vehicles and resources it has, which are classified into the following operational groups according to the Madrid Region Fire Department [
1]:
Group 1, G1: This includes auto-pumping urban or rural vehicles, which are the basic intervention vehicles that respond to the most common types of firefighting incidents;
Group 2, G2: This comprises several specific vehicles used for different types of intervention, including automated ladder, rescue, supply pump, N.B.C., lighting, support van, water rescue, electric generator, breathing support, and advanced command post vehicles;
Group 3, G3: These are auto-pumping forestry vehicles used specifically for interventions in forest fires or fires on agricultural land;
Group 4, G4: Vehicles used for transporting materials or personnel;
Group 5, G5: Helicopters used for coordination, search, rescue, surveillance, and extinguishing forest fires.
The types of fire stations in the Madrid Region are shown in
Table 1:
The stations may or may not have vehicles in groups 3, 4, and 5.
4. Materials and Methods
To determine the reliability of the system, we first describe the methodology used to calculate the collapse index (CI) at the territorial scale, applying territorial and tabular information to obtain a CI map for the current fire stations. Then, the optimisation model used to locate one to five new fire stations in the Madrid Region is described, where again the methodology used to obtain CI maps is applied to see how these maps change with the new FS.
4.1. Obtaining the Collapse Index at the Territorial Scale
The aim of this phase is to obtain a map of collapse indices in the study area. The period selected for the calculation of these indices is one year, due to the seasonality of certain incidents such as forest fires, gales, and others. The results obtained in this phase are a raster map of collapse indices and an average and maximum global value of the index for the entire territory for a specific year. The cell size of this map is 2 × 2 km to ensure that there is a communication route in each pixel of the territory in the Madrid Region and that the arrival time can be calculated from any FS to the pixel where the incident or incidents have occurred. For a specific kind of incident, the same type or types of vehicles will always arrive from one or more FS. Once they reach the pixel of the incident, the displacement from the road to the incident is considered the same for all vehicles regardless of the FS they come from, so this last displacement time does not affect the collapse index, as it is the same for all FS.
The expression of the collapse index in pixel
i is:
where
ni is the maximum number of resources (vehicles) that have worked simultaneously on one or more incidents in one year in pixel
i and
ti is the maximum duration of simultaneous interventions on one or more incidents in one year in pixel
i.
The map of the collapse indices is based on the emergencies database of the Madrid Region Fire Department for the year 2014, in which there were 25,221 incidents.
This database provides the following information for each intervention: incident code, incident type, date, notification time, time of activation of each vehicle, departure time of each vehicle, arrival time of each vehicle at the incident, time of return from the incident for each vehicle, actual arrival time of each vehicle at the station, time of availability of the vehicle for another incident, duration of the intervention, stations, resources or vehicles dispatched, address of the incident, georeferencing of the incident, number of pixels in the 2 × 2 km raster map, cost of the service, and number and type(s) of vehicles activated.
Incidents coinciding in time are identified to calculate the overlap time in a pixel. The intersection of the time intervals from the time of activation of each vehicle to the time of its availability for another incident is calculated for these incidents. The value assigned is the highest value of all the coincidences in one pixel over one year.
For example, if in pixel i on the 20 March 2014 it has been identified that 4 resources have worked simultaneously in that pixel, and after analysing the whole data set for that year 4 is the maximum number of resources that have worked simultaneously in pixel i, then ni = 4. Additionally, if on 7 July it has been identified in the same pixel i that 2 vehicles coincided in time in that pixel, the first activated at 18:00, becoming available for another incident at 19:00, and the second activated at 18:10, becoming available again at 18:50, the duration of the simultaneous interventions is 40 min. If this is the maximum duration of the simultaneous interventions in 2014 in pixel i, then ti = 40, meaning the collapse index in pixel i would be RCIi = 4 × 40 = 160 min.
Determination of the Collapse Index Threshold
One of the restrictions in the optimisation process is that the collapse index in every pixel in the territory must be less than a specific threshold.
In the Madrid Region, there is a very high probability that with the current resources the organisation will crash if 20 vehicles intervene simultaneously for 500 min in different incidents, which is equivalent to a collapse index of 10,000 (oral communication from the chief inspector of the firefighting service in the Madrid Region). Such incidents trigger the activation of aerial resources, prolong the shifts of the staff on duty, and activate their substitutes. Additionally, depending on the conditions of the incident(s), the emergency military unit or the firefighting services in adjacent regions may also be activated (oral communication from the chief inspector of the firefighting service in the Madrid Region). These characteristics are the basis used to calculate this threshold value in any area.
More than 25% of the pixels had a collapse index above 10,000 in 2014 (see
Table 2).
4.2. Simulated Annealing Approach for the Optimal Location of the New Fire Station
Simulated annealing (SA) is a metaheuristic optimisation algorithm that dynamically and iteratively obtains the optimal solution for combinatorial problems with large solution spaces. The SA algorithm is based on the physical annealing process of solids, whereby one material is under high temperature then gradually cooled until a crystalline state is formed, with minimal energy and a large crystal size. The SA algorithm can find the global solution quickly and guarantees convergence when enough iterations are run, ensuring that the solution has the highest probability of being the best [
37]. One of the main characteristics of SA is the possibility of probabilistically accepting worse alternatives; this characteristic means SA is able to reach the globally best solution [
38].
Thanks to the flexibility of the formulation of the heuristic method, the interaction between crews from different FS—which has been insufficiently addressed in previous studies—can be considered.
This method has advantages compared to other heuristic methods such as its ability to solve continuous problems [
39,
40], establishing a strong stochastic neighbourhood search technique compared to the genetic algorithm approach [
32,
41]
In addition to these characteristics, simulated annealing can be integrated in geographic information systems [
42] and is more suitable for combinatorial optimisation problems than other types of optimisation techniques using GIS, such as Greenfield analysis. This method does not take into account roads, cities, and peculiarities of geographical areas and cannot address combinatorial optimisation problems [
43].
4.2.1. Formulation of the Cost Function and the Restrictions
To resolve the problems of overlapping in the Madrid Region, the optimum locations are obtained for one to five new stations, while maintaining the locations of the previous ones. All new FS are of type A (see
Table 1). This type of FS has two G1 type vehicles, so we consider that the resources (vehicles) from the new fire stations can work in a maximum of two incidents at the same time.
The optimum locations of the new stations correspond to the most equitable possible distribution of the workload of the resources between the stations, given a limit collapse index at the pixel scale. The new fire stations modify the workload of the vehicles in the existing ones and the incidents they attend. Their resources replace the resources in the old stations in all interventions that are nearest their location, which will no longer be handled by FS in more distant locations.
To recalculate the new collapse indices with the new stations, each vehicle’s time of activation, departure time, and time of direct work on the intervention (i.e., time of return from the incident minus arrival time) are assumed to remain unchanged, unlike the arrival time at the incident, time of return from the incident for each vehicle (since the arrival time changes), actual arrival time of each vehicle at the station, and time of availability of the vehicle for another incident change. The road network map is used to obtain the arrival times and the trajectory from each departure point to the arrival point is the minimum displacement time via the communications routes. The optimisation algorithm is programmed in Visual Basic 6.0, which includes geographic information system algorithms for mapping, map generation, and calculation of arrival times.
In this combinatorial optimisation problem, each alternative is configured by the set of locations of the old and new FS. We apply the simulated annealing algorithms [
37] to identify the optimum locations. This heuristic method determines the set of locations with the greatest probability of being the best, where the probability that the set of locations
vj is the best is the following (in
Appendix A the decision variables and subindices are explained):
where
E(
vj) is the cost or objective function of alternative
vj and
T is a parameter.
The analytical expression of the cost function
E(
vj) is:
and is minimised. This cost function expresses the standard deviation of the vehicles’ workload by the fire station over a year.
Here,
n is the total number of stations in the Madrid Region and
CTij is the workload of the vehicles of the
j-th station in one year for the alternative of locations
i:
where
Sij is the number of interventions of the vehicles of station
j for
i-esimo alternative
vj,
dkij is the duration of the
t-th intervention by any vehicle of station
j for alternative
vj, and
is the average annual workload of
n stations for alternative
j.
Here, is the collapse index in the Madrid Region for pixel i and alternative Vi,j, and CCI is the reference collapse index, which is 10,000 min in this study.
The number of FS in every municipality is less than 1:
Here, FSmn is the number of FS in municipality mn.
Here,
ta,nfs,p is the arrival time from the new fire station
nfs to pixel
p and
ta,ofs,p is the arrival time from the old fire station
ofs to pixel
p;
is the total number of new FS considered in the optimisation process.
Here, TotNRsce is the total number of groups of resources in the new fire stations.
4.2.2. Iterative Optimisation Process
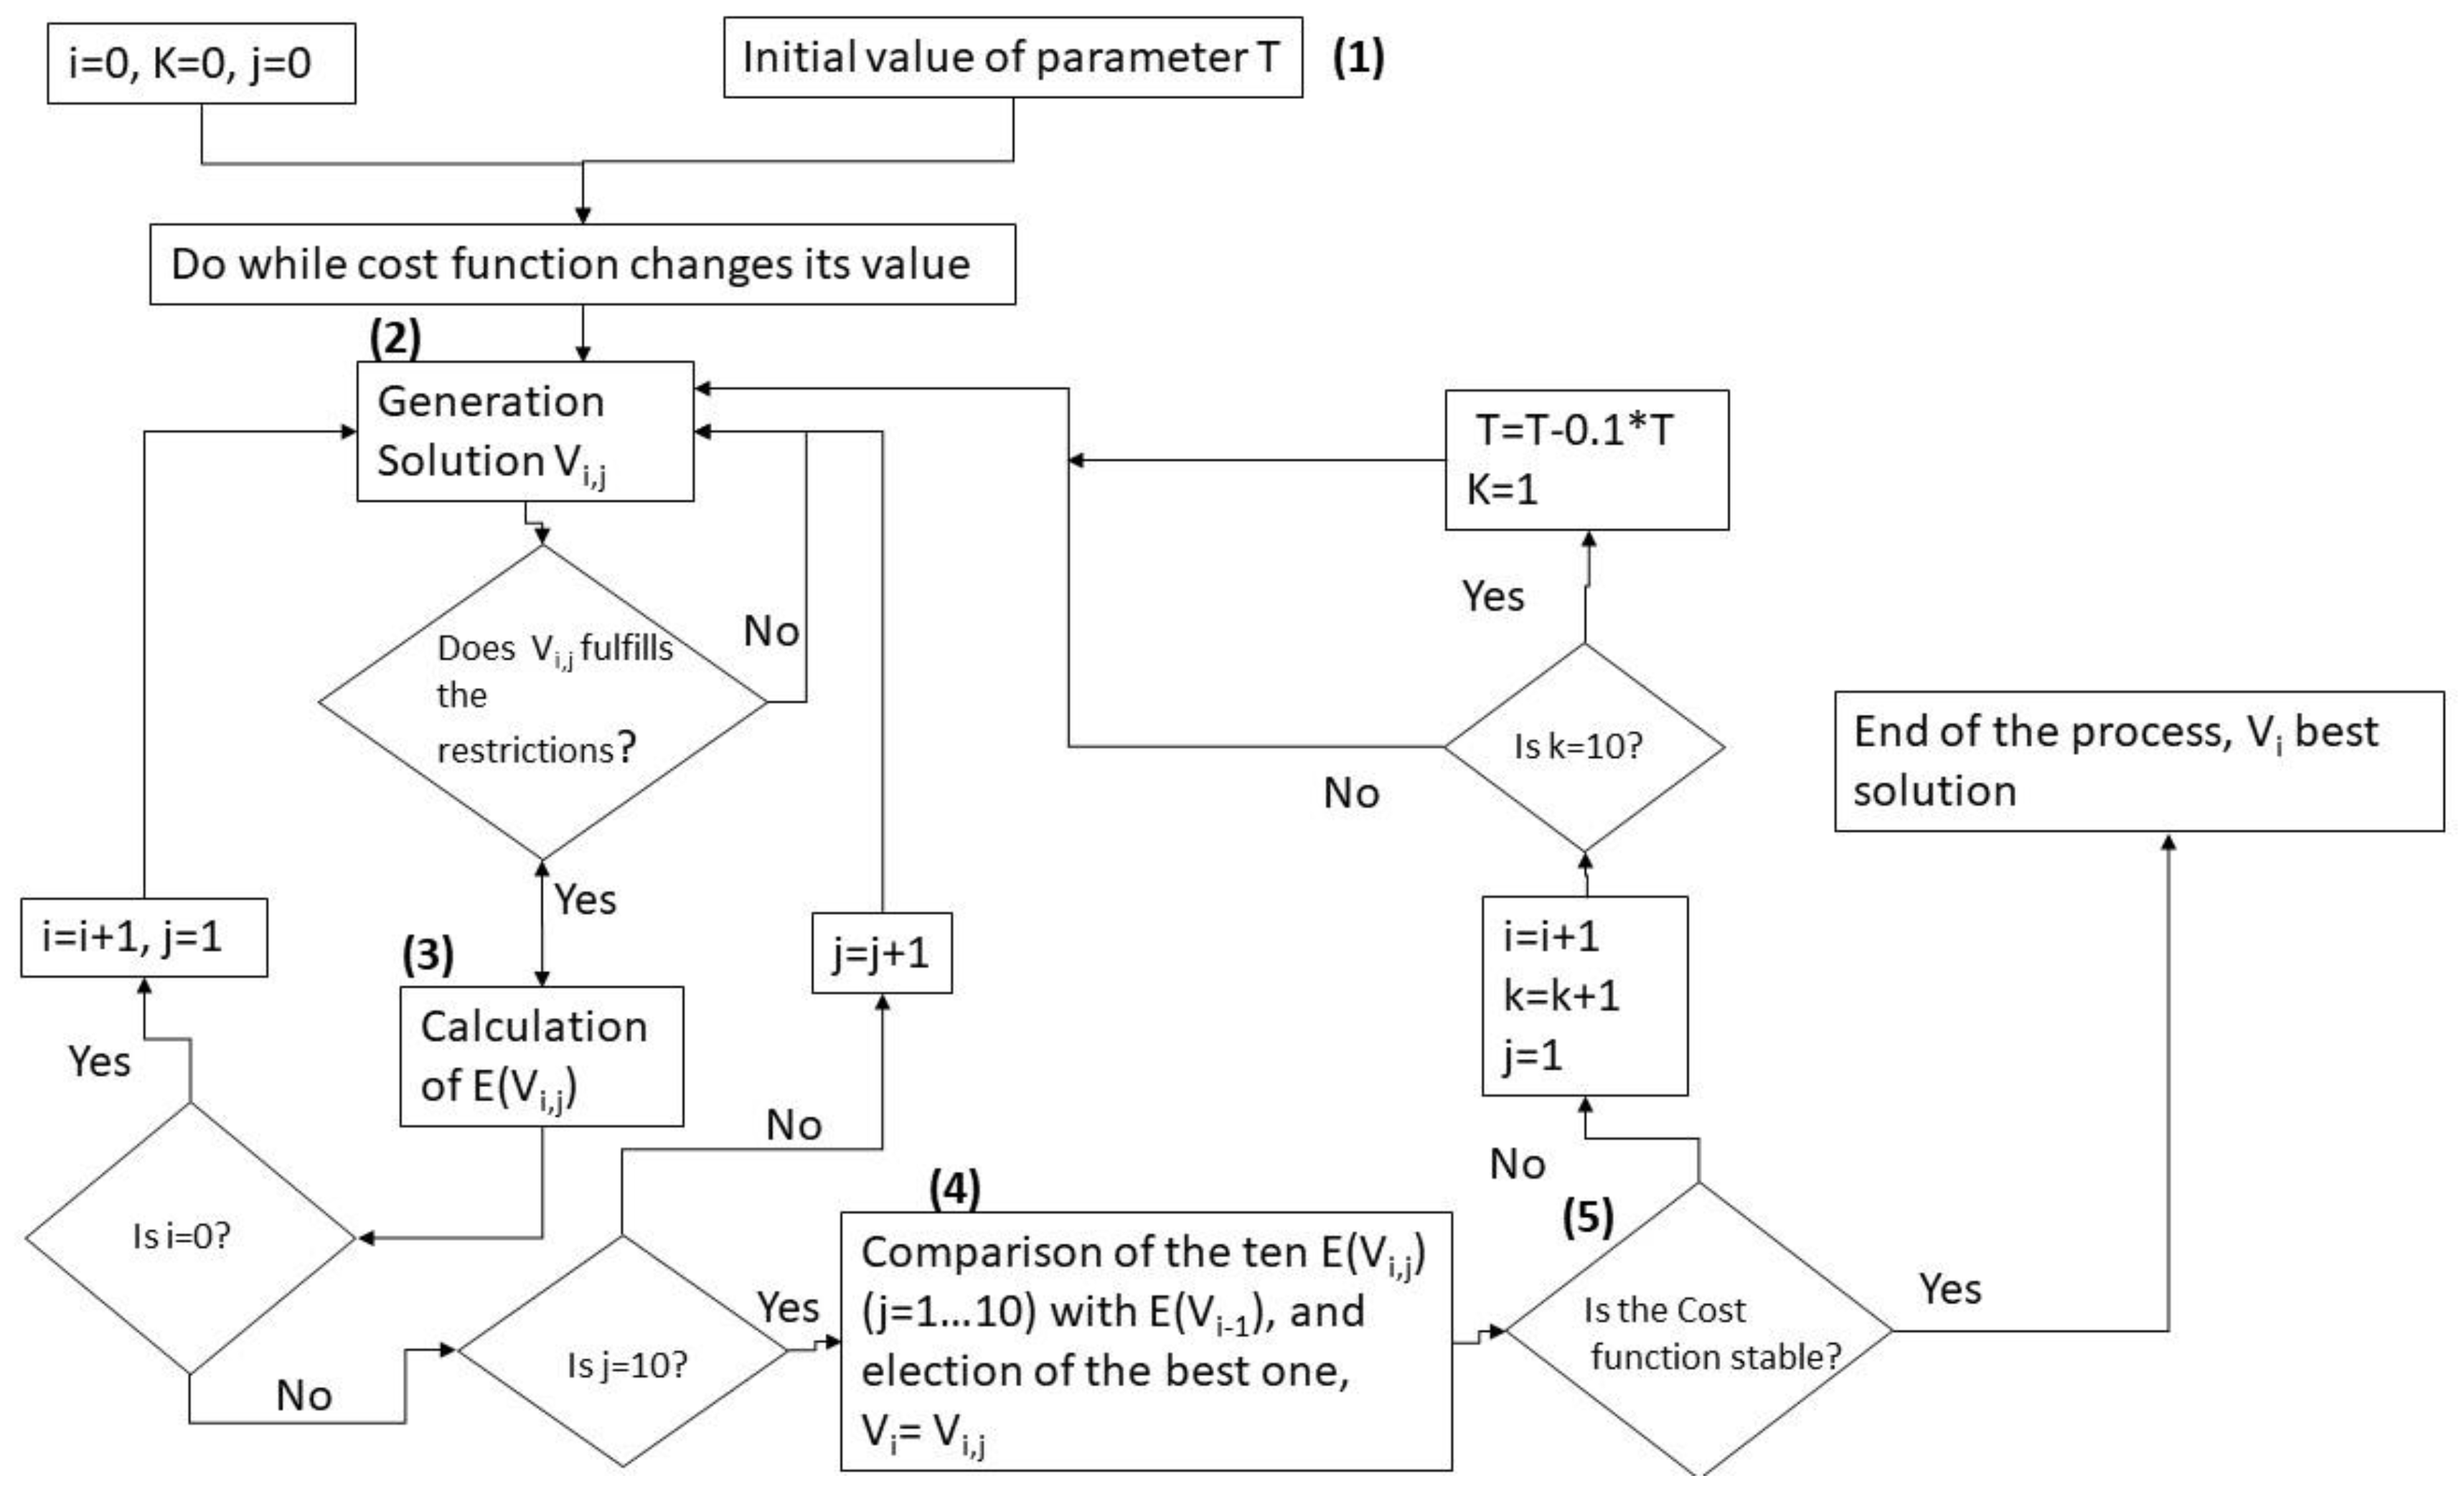
The iterative optimisation process is shown in
Figure 2.
The process begins by establishing the initial value of the parameter
T of the simulated annealing method (step 1 in
Figure 2). This is the highest value of the cost function for a number of previously calculated alternatives and is modified by 10% every ten interactions [
44].
The process then continues with the generation of alternative
V0 in the first iteration (step 2 in
Figure 2). The locations of the new
TotNFS FS are randomly selected among all the municipalities except the ones with old stations. The set of the locations of the new FS is
NS0, so
V0 = {
OS ⋃
NS0}; this solution must fulfil the restrictions described in
Section 4.2.1.
For the generation of the rest of alternatives
Vi (step 2 in
Figure 2), ten intermediate neighbouring alternatives,
Vi,j, are obtained, while only one location (municipality) changes with respect to
Vi−1, considering that old fire stations will not be replaced. This location is chosen randomly from among the closest municipalities of alternative
Vi−1, except the municipalities of the old fire stations. This new municipality will substitute the closest new one in
Vi−1.
The cost function is calculated for each alternative (step 3 in
Figure 2). First, it is determined in which incidents the resources of the new FS are going to intervene. If the arrival time of the new vehicle to an incident is less than the arrival time of any vehicle assigned to the incident, this vehicle will replace the old one.
Next, the variables of the cost function and, CTij are updated, a new collapse index map is obtained, and the restrictions are checked.
In the next step (step 4 in
Figure 2), the cost functions of alternatives
Vi,,j and
Vi−1 are compared according to the simulated annealing method.
If E(Vi,j) E(Vi−1), alternative Vi,j is better than Vi−1; this alternative is not discarded, and the information is saved.
If this is not the case, and E(Vi,j) > E(Vi−1), a random number q with q ∊ [0; 1] is generated; if > q, then this new alternative is not discarded and data are saved, while in the other case it is discarded.
The new alternative Vi is the one with the lowest cost function value among these Vi,j and with a cost function value less than E(Vi−1), otherwise the alternative that fulfils the probability condition is the next alternative Vi.
The process ends when the cost function becomes stable (step 5 in
Figure 2).
5. Results
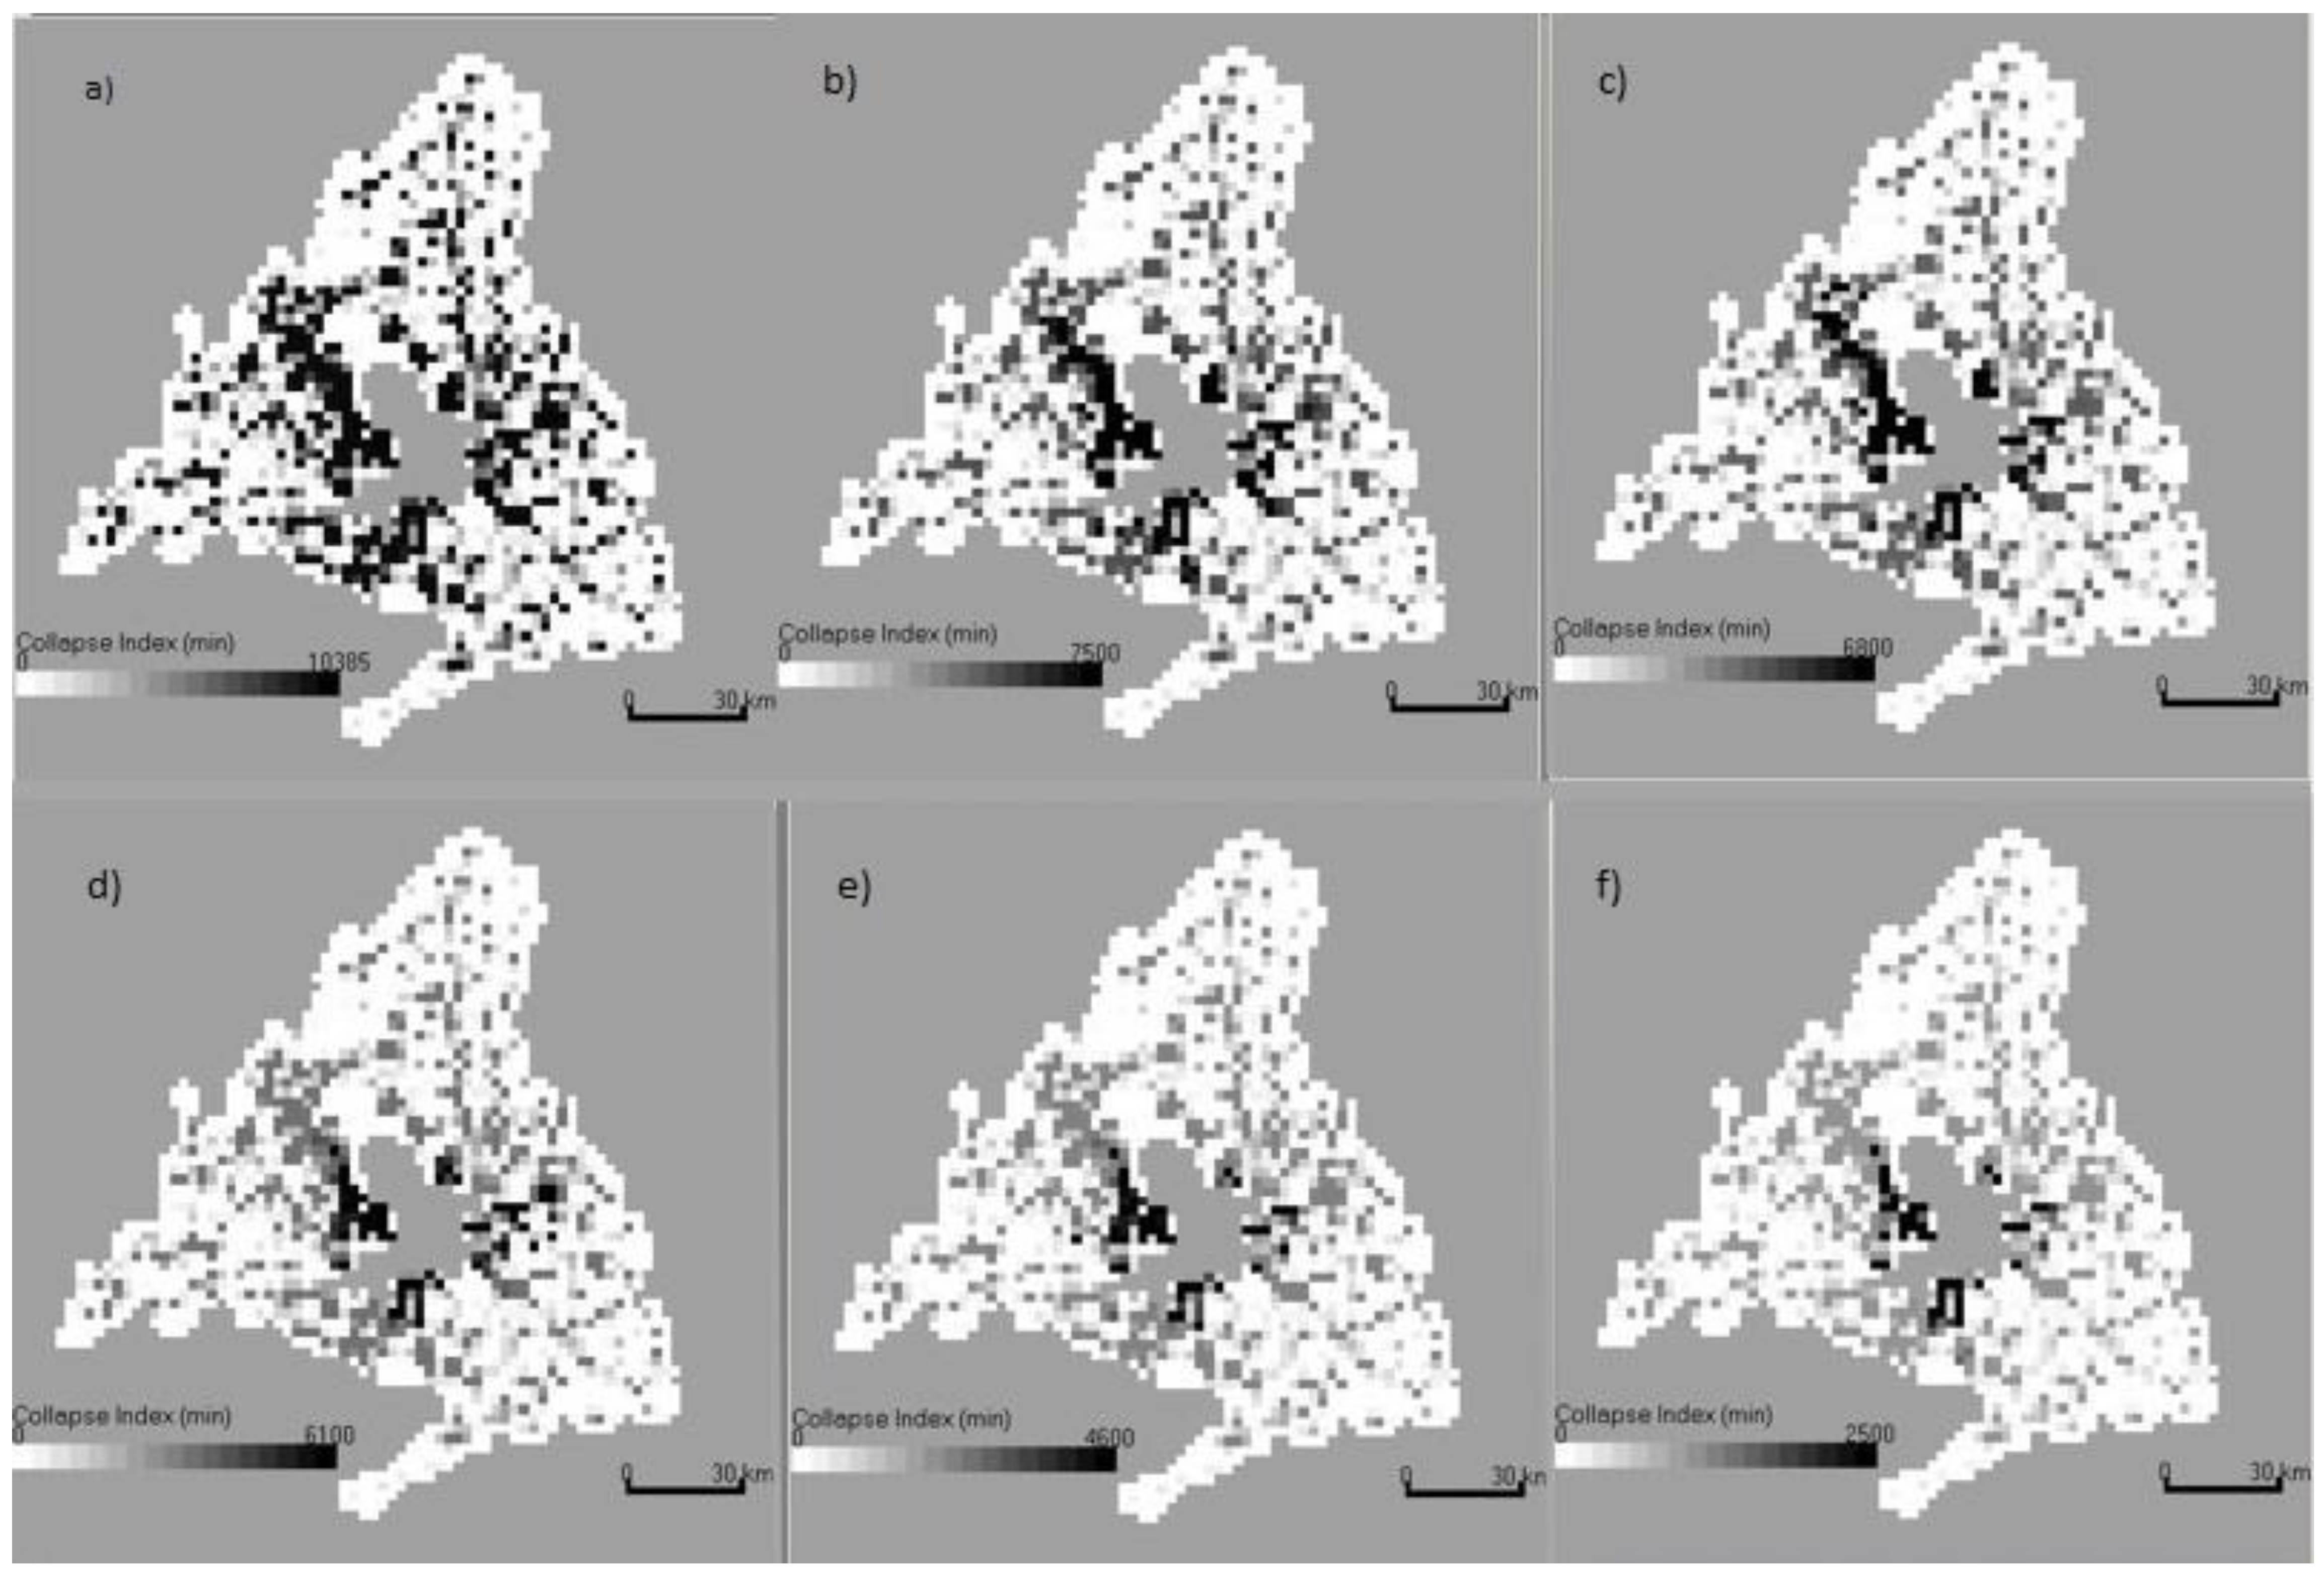
Figure 3a shows the collapse risk situation in 2014, whereby the centre-west of the Madrid Region and the belt around the city of Madrid present high CI values, higher than the threshold established by the Madrid Region Fire Department. This information is completed with the total time dedicated to all the incidents attended by the teams from each station, including both the displacement and the action itself, for the year 2014 (see
Table 3, in the column headed “only old fire stations”).
Table 3 also shows the results of the optimisation processes on the workloads of each FS for the incidents in 2014 in terms of the workloads for the old and new (in bold) FS. Their locations are shown in
Figure 4, along with the locations of the existing stations.
The fire stations with the highest workload are Navacerrada and Alcalá. The result of all the optimisation processes is that one station should be in the municipality of La Acebeda in the north of the Madrid Region. This is a mountainous area where travel time is lengthy and which was previously served by only one FS.
Table 4 shows that the maximum collapse index of a cell in 2014 was 10,484 min, exceeding the established limit of 10,000 min in this study. With the construction of the station in La Acebeda, this collapse index meets the requirements of the Madrid Region Fire Department and is reduced to 7500 min. The new fire station allows the Navacerrada FS and Lozoyuela FS (both in the north of the Madrid Region) to cover other incidents in areas in the west and east of the Madrid Region, reducing the response time and workload for the fire stations in these areas. This process produces a chain reaction and improves the situation for all of the stations.
In the second optimisation process, the two new fire stations are located in La Acebeda and El Boalo, as can be seen in
Figure 4. This new station is to the west of Madrid, thereby improving the collapse index in an area which initially had the highest value in the region (see
Figure 3a and
Table 4). Once again, a chain effect occurs when the new stations substitute the stations located further from the incidents, which can now attend incidents they were previously unable to cover, thereby improving response times. The new maximum collapse index for a pixel decreases and becomes more uniform throughout the region, as seen in
Figure 3c and
Table 4.
In the third optimisation process, a station is incorporated in the municipality of Valverde de Alcalá, as seen in
Figure 4. Its area of intervention is in the south of the region, substituting the more distant stations in the east and west of Madrid in the response to incidents. The reduction in the maximum collapse index of a cell (6100 min) is similar to that of the second optimisation process, as it is in an area where the effect of the previous new fire stations was lower. Its role is similar to the fire station in El Boalo, as it provides support in cells where the new fire stations were previously unable to reach.
Finally, the number of resources is very high in the two last optimisation processes and is reinforced with new fire stations in the north, east, and southwest of Madrid. The maximum values of the collapse index in a cell obtained with the two optimisation processes are 4600 and 2500 min.
Similarly,
Table 4 shows the values of the average collapse index per cell, which goes from 2641.35 min per pixel to half that figure when five new stations are built.
The results for the homogeneous distribution of the workload, represented by the value function (variance in the workload for each fire station) of the optimisation processes, show that this workload becomes more homogeneous between fire stations due to the redistribution of incidents among the new fire stations (
Table 4). The standard deviation decreases from 25,047.8 when only the old FS are considered to 11,675.3 when two new FS are built and to 8093.9 min when five new fire stations are built.
The simulated annealing algorithm took 40 s.
6. Discussion
The proposed model was built to address two issues facing decision-makers in emergency planning: maintaining overlaps below the threshold values recommended by fire department technicians and minimising and balancing feasible workloads between fire stations by adding new FS. The model incorporates GIS algorithms that reduce the visualisation time of the results and make the model more practical compared to other studies, such as the one proposed by Idriasari et al. [
29], where heuristics were run outside a GIS and the outputs were sent back to the GIS for visualisation and area calculation.
The CI map based on past incidents is a useful tool that enables decision-makers to easily identify the areas with the highest CI and the greatest likelihood of causing problems in the future. These risky areas are in the belt around Madrid (see
Figure 3), which contains most of the population and economic activity in the region. Here, the decrease in the CI in the optimisation process was more evident. This approach is in line with the current trend in emergency plans, which focus on resilience prior to a disaster rather than on the response once it has occurred [
45,
46]. Buil et al. also introduced a system reliability index, although in this case the threshold can be violated, leading to an additional cost in the objective function, which is minimised. They avoided fixing a specific value for each territory depending on its characteristics. Assigning a threshold to the CI was quite challenging, since this value depends on the number of FS and vehicles, number of incidents per year, and the population of the regions, so it was established by analysing the frequency of the CI calculated for each incident and by consulting experts from the firefighting service [
33]. The results of the optimisation process showed that the optimal locations of one to five FS increased the efficiency of the system. The maximum collapse index in one pixel of the territory decreased 28% when one FS was added, and by 35%, 42%, 56%, and 76% when 2, 3 4, and 5 FS were added, respectively. The average overlap in terms of the CI was also lower by 13% when one FS is added, and by 21.4%, 32.4%, 41%, and 50.1% when 2, 3 4, and 5 FS were added, respectively. Adding new FS means that the risk of collapse is reduced due to the increased availability of resources to deal with other incidents, thereby enhancing the efficiency of the system. Previous studies have also addressed the problem of overlapping, although their approaches focused on only one disaster, in general a natural hazard, involving a number of agencies instead of considering incidents in parallel, or they offered a solution to the overlap problem at a specific time and not as a global strategy to increase the resilience of the system [
3,
29,
47,
48,
49].
In terms of balancing the fire stations’ feasible workloads, the cost function value for the optimum method decreased by 32% compared to the initial conditions when one FS was added, and by 53.4%, 63.2%, 66%, and 68% when 2, 3, 4, and 5 FS were located, respectively. It is worth noting that the value of the cost function for the best solution stabilised with the addition of three FS, so it would not be necessary to build more than two new FS, since the new maximum value of the collapse index, 6800 min, and then average of 2074 min, were significantly below the established threshold. This would also avoid the possibility that too many additions to the existing services may produce overall system inefficiencies [
21,
25].
One of the main contributions of this study is that the optimisation model considers the interactions between the resources of the new and old FS in the location process. This implies that by simply adding one FS, the workload of the set of FS decreases by 32%. This approach was not considered in previous studies on the optimal locations of new FS, such as in [
19,
21], nor has it been implemented in the heuristic approaches [
26,
27,
28,
29], which focus on locating the new FS according to the LSCP [
26,
27] or MCLP [
28,
29] approaches. In future studies, it would be interesting to integrate resource interactions to test whether fewer FS are necessary in these approaches.
From a methodological point of view, the balanced distribution of the workload is a factor that has been previously considered in optimisation studies. A similar approach can be found in [
50,
51], who compared the results of ant colony optimisation with the tabu search heuristic method to minimise the differences between ambulance workloads in the states of Austria. The performances in time for the tabu search and simulated annealing were similar and better than the ant colony method for the same size of application area.
The formulation of the SA should guarantee the algorithm’s convergence, which implies a slow reduction of parameter T. Establishing its reduction ratio can be a problem if the computation time is too high. Although there are studies in the literature that propose a fairly high reduction ratio (66%), such as the paper by Abuajwa et al. [
40], we chose a ratio that is more frequently used (10%) to ensure this convergence [
52], with a low computing time of 60 s for the five optimisations.
Limitations of the Study
This study has some limitations that can be addressed in future research. First, we located only new G1-type FS in this work. G2-type FS, which contain more vehicle types, were not considered. The implication was that lower collapse index values could be obtained since more than two old resources could be replaced by the resources in each new FS.
In calculating the collapse index, the time spent directly working on intervening in an incident remains unchanged when a new resource from a closer FS replaces an old one. As the arrival time of the new resource is less than the arrival time of the old one, the direct work time does not always remain unchanged, depending on the type of incident (i.e., wildfires). Again, lower collapse index values could be obtained if more accurate data were available.
The advantage of these limitations is that the CI calculated in the model has a security range.
Finally, the level of traffic was not considered when calculating the time taken by the new resources from the new FS to arrive at the incidents. Traffic levels may change the arrival time at specific times of day. Incorporating software that includes street and road-level traffic analysis could improve this calculation.
7. Conclusions
This paper presents a novel contribution to the issue of locating new fire stations, solves the problem of the collapse of the emergency resources in a highly populated region, and reduces the overlap of actions between the resources in the incidents. This new territorial measurement of the reliability of fire departments ensures that the new FS are located in places that meet two conditions, namely that the fire service system will not collapse and the variation of the workload between FS will be minimal.
Five optimisation processes were developed to locate up to five FS. The results indicated that by adding only two FS, the cost function decreased by 53% and the maximum collapse index in a pixel was reduced by 35%, confirming the applicability of the model.
The use of GIS algorithms in the model facilitates the visualisation of the results, which could be useful in the decision-making process in firefighting services.
One of the contributions of this model is that it is closer to reality than previous approaches, as it considers (1) all types of incidents, (2) two resources per new FS, and (3) that the resources from the new FS replace the resources of the old FS in the closer incidents. Future studies could analyse the combination of new FS and increases in the numbers of resources in the old FS, as well as modifications of the results when the interactions between resources are considered in MCLP and LSCP models.


 ,
, 