1. Introduction
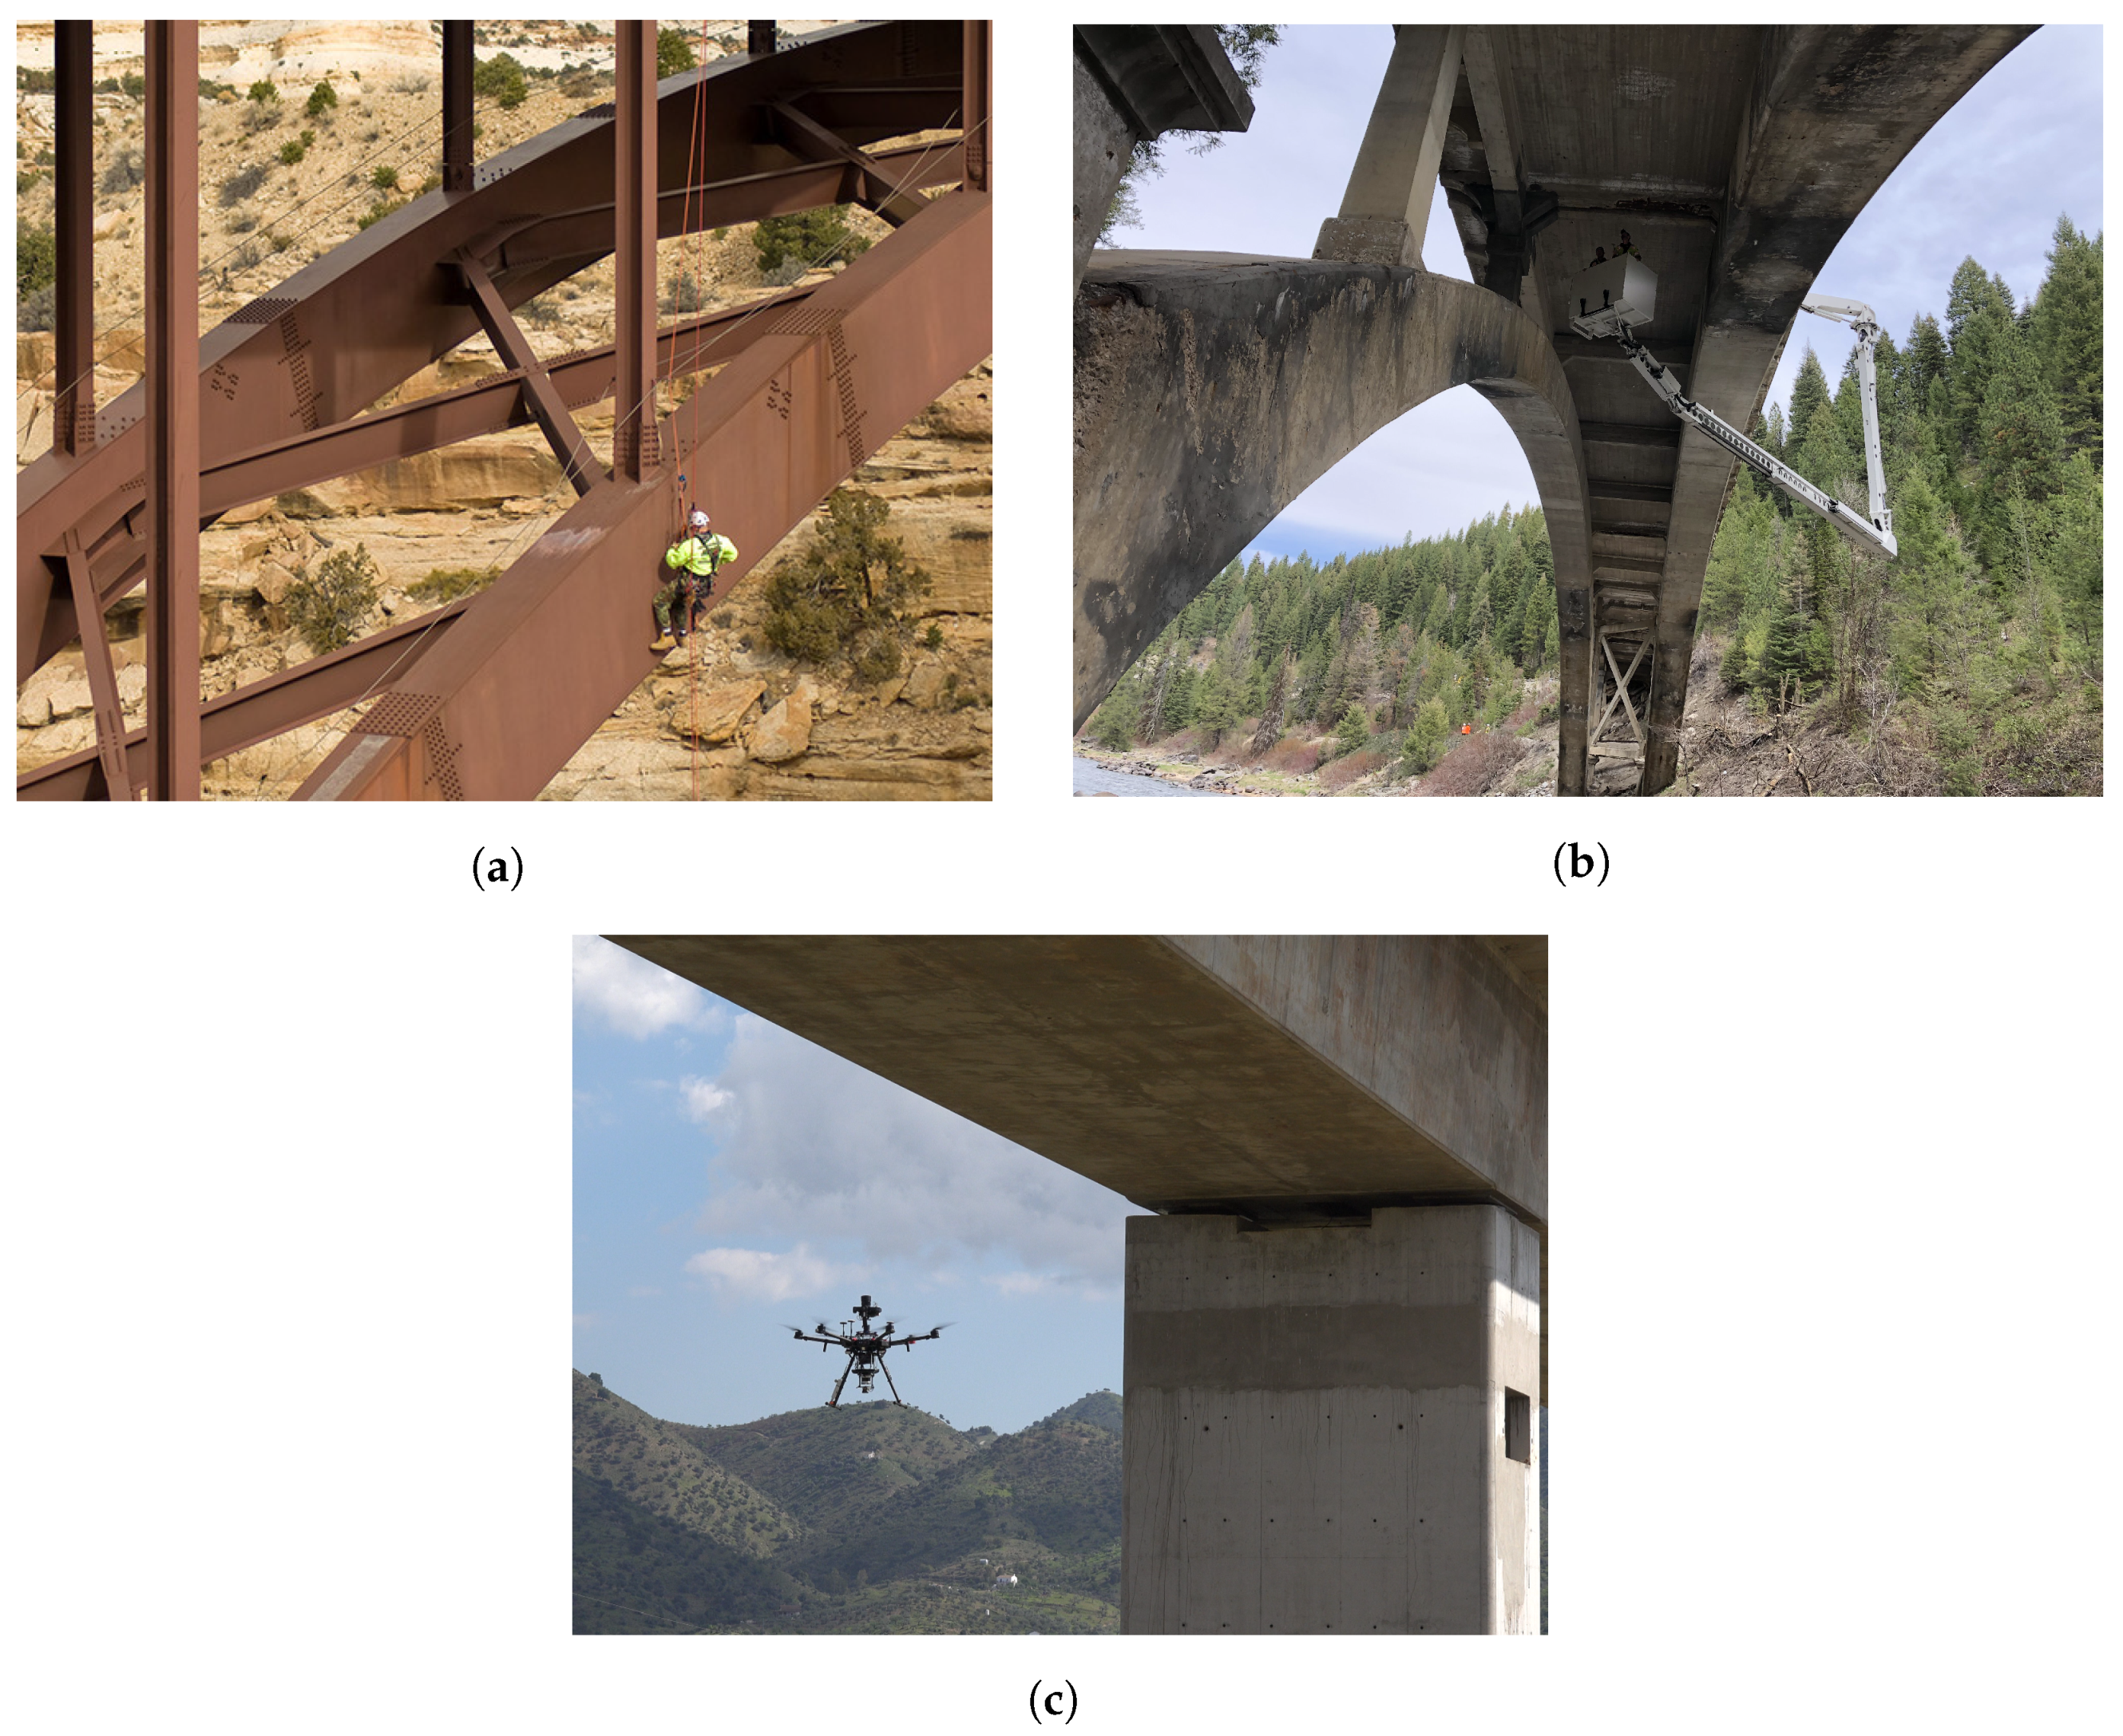
The inspection of viaducts and bridges is a very time-consuming and resource-intensive activity. It requires heavy involvement from highly qualified and specifically trained personnel. Additionally, these inspections pose health and safety risks that are mainly derived from working at height and the difficulty of the operation. Current inspection methodologies involve the use of climbing operators, who, by means of ropes, hang from the structure and perform the measurements required by the inspectors to evaluate its current state (see
Figure 1a). These works present many potential accident risks due to the difficulty and technical level required to access certain complicated areas at heights, the possible physical fatigue of the workers, human errors in the safety of the operation, or even problems with the use of specific measuring tools.
An alternative method is the use of heavy machinery, like cherry pickers, truck-mounted lifts, and cranes (see
Figure 1b). This machinery requires new specialized personnel to operate it and perform inspections and does not eliminate the problem of having to expose people to work at heights. The surfaces to be inspected are usually located at a high altitude, and under it, several types of obstacles could be found, such as traffic of vehicles or trains, water flows, or rough terrain. This means that the use of machinery has to be done from the top surface of the structure, interrupting its service and increasing the operational costs of the inspection.
Currently, the highly qualified staff required for inspections is normally composed of civil engineers working for engineering firms specialized in structures. Every little deformation, crack, or defect can be the cause of a potentially bigger critical problem, so they must be identified as soon as possible. An example that requires high accuracy is the measurement of cracks width with an error smaller than 0.1 mm. Moreover, crack depth can only be measured using contact sensors. However, visual inspection is the most extended way of assessing the preliminary status of the viaduct before deciding if specialized equipment is needed. This means that, in order to find the smallest defects, the inspector must be very close to them. Furthermore, human subjectivity or the lack of experience could lead to an undervaluation of the severity of a defect.
This whole process presents many inefficiencies that can be minimized using aerial robotic technologies combined with computer vision algorithms (e.g., artificial intelligence) and other computerized technologies supporting the post-processing of the acquired data. This article proposes an aerial robotic solution for gathering all the needed data to analyze the status of a viaduct. Our proposed solution drastically improves the safety of the inspections, as it does not involve the work at height of any human being or the use of heavy machinery. It reduces inspection times and costs by reducing the number of specialized people required to perform the inspection and avoiding the need to interrupt the use of the structure. On the other hand, it improves the quality of the data obtained, since it is the inspectors themselves who indicate the points to be inspected by the aerial robotic platforms, which can always be quickly sent back to obtain more information if necessary. In addition, the system is flexible to use the different sensors needed: either cameras or sensors that require physical contact with the structure.
1.1. Aerial Robots for Inspection
The use of autonomous unmanned aerial vehicles (UAVs) to capture images and their subsequent use in infrastructure analysis is currently on the rise. After an exhaustive search of the projects developed in the research world, relevant applications have been found that make use of autonomous UAVs for image capture in the inspection of railway tracks [
3], where autonomous flights are carried out to follow the tracks, capturing images for subsequent analysis. Other applications, like mining inspection obtained 3D maps [
4], make it possible to evaluate the earthworks carried out; wind turbines inspection for evaluation of deformations or damage [
5]; inspection of civil infrastructures capturing images and their subsequent analysis through the use of neural networks to identify possible cracks or landslides [
6]. Finally, in [
7], bridge inspection is studied in a similar way as proposed in this article, where images are captured autonomously using a UAV platform and then analyzed using photogrammetry software. The main limitation raised is that they use Global Navigation Satellite System (GNSS) positioning to automate flights, while in the system proposed in this article, the aircraft that captures images does not navigate with GNSS but with onboard sensors such as LIDAR. The physical characteristics of the viaducts cause the GNSS signal to be partially or totally degraded when flying near or under them. These degradation problems with global positioning signals are discussed in [
8], where the most critical ones affecting this article are signal masking and multipath. Therefore, the degradation of this signal leads to localization problems in the UAV in which it can drift its flight or even make sudden changes in its positioning, seriously compromising the safety and integrity of the operation. In addition, GNSS poses problems of repeatability of inspection operations, since the number and position of available satellites varies over time.
There are currently some commercial systems for infrastructure inspection such as the one offered by Skydio [
9], which makes use of several onboard cameras to navigate and perform the inspection autonomously. Unlike Skydio’s system, our system is able to reference the inspection to a global coordinate system that can be used from the construction of the viaduct until the end of its life. This feature makes our methodology better suited to the current workflow of inspectors, who already use total stations to check the displacements of structures against global references defined during construction. Additionally, thanks to the global coordinate system, the solution offers the possibility for more than one aircraft to navigate and perform an inspection while maintaining the same references. By using a generic gimbal, our system is much more flexible than Skydio’s system in the choice and configuration of the required camera sensor, as it is not limited to the built-in camera. In addition, our system uses an aerial robot that performs inspection by making physical contact with the structure. This provides information that cannot be acquired by pictures exclusively, such as precise measurements of crack depth and width, material hardness, concrete humidity, etc.
In relation to this inspection by contact with an aerial robot, there are different lines of research with a number of projects that focus on maintaining stability during physical contact [
10,
11]. In [
12] the predecessor aerial manipulator of the one used in this work is presented, which was patented [
13] and awarded with the EU Radar Innovation Award 2017 [
14]. In [
15], an aerial vehicle that operates overhead using a rigid arm, and that is even capable of keeping in contact with the surface [
16], is presented. In [
17] an aerial vehicle that operates at the bottom as well as at the front, is presented. Aerial manipulators capable of operating in either direction are presented in [
18]. Stable contact operations have been achieved using a pusher trirotor in [
19] or, a quadrotor in [
20,
21]. In [
22] a long rigid tool exerting force against a surface is applied.
1.2. Aerial Robots Localization
Different sensors can be used to achieve effective positioning of aerial robots. Total stations can be used to localize an UAV in motion with respect to a reference system, as in [
23]. This presents several problems, such as the high cost of this tool, as well as the dependence on flying continuously in line of sight with it or having an uninterrupted wireless communication system with the aerial robot. In addition, total stations only provide position information, not orientation.
On the other hand, the localization problem can also be solved through monocular or stereo visual cameras, as in [
24,
25]. The problem with visual cameras is that they are totally dependent on external light conditions. This is especially problematic when navigating near infrastructure because of the shadows and light changes it can cause. Other localization systems use a LIDAR as the main sensor [
26]. These sensors do not depend on external light conditions, as they use lasers to measure distances. While their application in autonomous driving is on the rise, their use in aerial robots is still limited because they require more available payload and a more powerful onboard computer than cameras. In [
27], a comparison of several algorithms applied to aerial robots is made.
1.3. Article Introduction
This article proposes a novel solution for the detailed inspection of viaducts using aerial robotics. This solution is an alternative to current inspection methodologies, improving safety, costs, time, and data quality. Given the amount of details involved in this solution, this article first provides a general overview and then focuses on the technical and experimental aspects of the visual inspection.
The rest of the article is organized as follows.
Section 2 describes the proposed viaduct inspection system and the two aircraft involved.
Section 3 presents a localization solution that provides one of the aircraft with autonomous capabilities to perform a visual inspection of a viaduct.
Section 4 outlines the localization and inspection experiments and presents the results used to assess the performance of the proposed solution. Finally, the conclusions and future work are summarized in
Section 5.
2. System Description
The proposed viaduct inspection system offers a comprehensive solution to check and to evaluate the condition of these infrastructures through its integrated tools. A workflow has been created that meets the needs to speed up, reduce the cost, and increase the safety of these inspections. All the tasks are carried out with aerial robotic platforms whose characteristics are chosen according to the task to be performed. These tasks can be general and/or detailed photographs or make physical contact with the structure to take measurements with sensors as required.
The workflow is shown in
Figure 2 and is as follows. Given a viaduct of interest on which an inspection should be performed, the proposed workflow begins with the creation of a mission. During this phase, it is required to acquire a 3D map of the structure in which the inspector can select the areas and points of interest. This 3D map is not only useful for the creation and subsequent visualization of the mission, but it is also required for the global localization of the aircraft. It is obtained with the help of a robotic total station that establishes an arbitrary coordinate system and performs scans to obtain the 3D points around it. It is important to capture these data from different points of view to obtain a complete point cloud of the viaduct. To facilitate the subsequent use of this map, the reference system should be aligned with the
ENU axes (
x = East,
y = North,
z = Top). If possible, it is desirable to obtain an approximate GNSS coordinate of the origin of the point cloud to locate it globally. Otherwise, this can be done manually. The use of the total station is then limited to one time only. Once the map has been created, it can be reused in all subsequent inspections, provided that the viaduct has not suffered significant changes.
With the points and areas of interest selected on the 3D map created, this information is sent to the aerial platform, which translates it to its local coordinate system and creates the route of waypoints and actions necessary to carry out the inspection autonomously capturing overlapping pictures. This mission is then a first general visual inspection of the structure to locate any possible defect. This check is performed by taking general pictures of the structure with high resolution in an automated way using the visual inspection platform described in
Section 2.1.
After the first general pictures are taken, they are analyzed to check the condition of the viaduct, paying special attention to those areas where a defect is suspected. This analysis can be performed manually by an inspector or automatically by applying an automatic image defect detection algorithm, like [
28,
29]. After the analysis, a decision should be made to determine if more detailed information on the defects found or suspect areas are required. If so, more detailed visual or contact information may be obtained using the visual or contact inspection platforms, respectively. In case more visual information is required, the mission previously created by the inspector can be reused but using another camera configuration that better collects the required information. For example, a different lens can be used for the camera with a longer focal length to obtain better details of the specific area. However, if the previous mission does not meet the requirements of the new visual inspection, the inspector can create a new one with the 3D map and select the previously found defects.
When the missions are finished and the visual information obtained is sufficient, our proposed solution also considers the use of a specific platform for contact inspections. This platform is described in
Section 2.2 and has a robotic arm with an end effector on which a sensor can be installed. In case of finding defects in the visual inspection that require a deep analysis with specific sensors that require physical contact with the structure, this platform is sent to those defects and captures data. When the contact inspection data is analyzed, a decision is made as to whether further visual or contact information is required or whether the inspection is terminated.
In short, the proposed workflow is an iterative process in which one can always return to a suspect area to obtain more detailed information. All the inspections are carried out by aerial robots specifically designed for each purpose. The viaduct inspection system comprises two platforms that work sequentially as described previously. The following sections describe these UAVs, showing their configuration and capabilities.
2.1. Visual Inspection
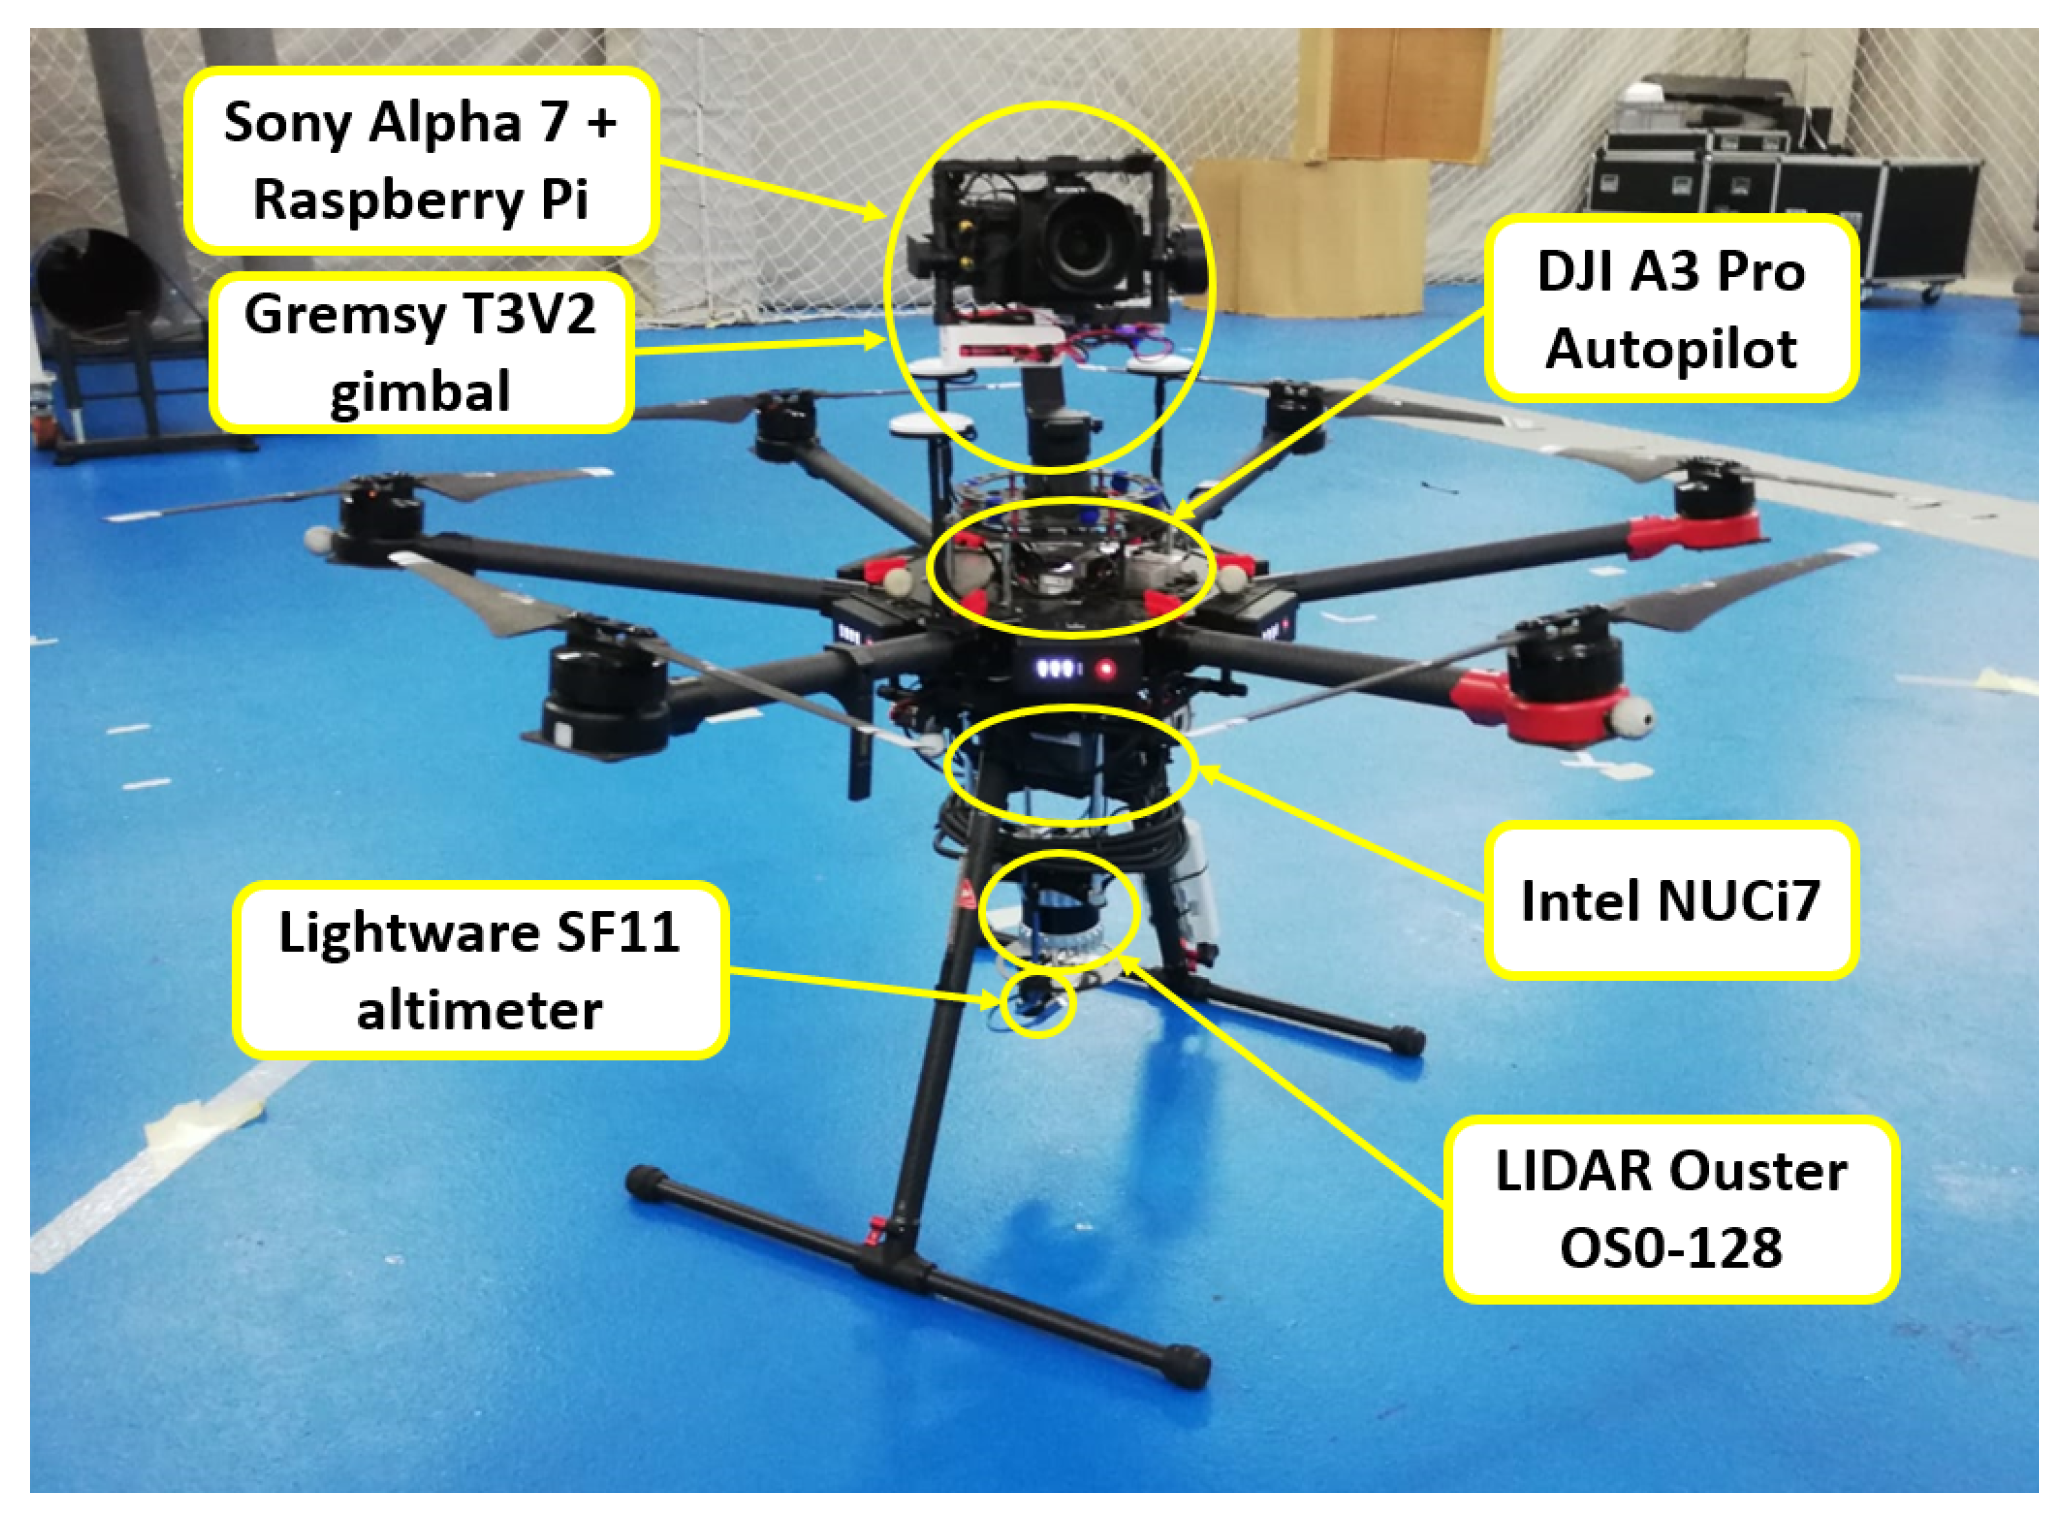
The visual inspection UAV (see
Figure 3) is known as AERO-CAM. This aircraft is specialized in taking very high quality images of a structure. This UAV is equipped with a stabilized camera which takes the images of desired areas.
The AERO-CAM platform is built from a DJI Matrice 600 Pro on which the necessary components to operate have been installed. Since the DJI is a commercial platform, the system is easily replicable. The standard configuration of the UAV has been preserved, with both the autopilot and the rotors and blades being those recommended by DJI. The autopilot includes a GPS/GNSS receiver, a 9-axis IMU, a magnetometer, and a barometric altimeter. In addition, it carries a Lightware Laser Altimeter for precision landing. Regarding the camera system, the UAV is equipped with a Gremsy T3V2 gimbal [
30] mounted in the slot available above the platform and carrying a Sony Alpha 7 camera [
31]. This mounting location allows the gimbal-camera set to have a better available field of view and can even take pictures pointing completely upwards, as opposed to mounting it on the bottom of the UAV like most commercial camera drone systems. This is especially useful when performing inspections under a viaduct as the UAV will be able to take pictures of the bottom part of the deck. Depending on the space available for the flight and the amount of detail to be obtained in each image, the camera can be equipped with different lenses. This camera is managed by a Raspberry Pi Model 3B+ that implements a software developed using using Sony’s Camera Remote SDK [
32].
To provide the platform with autonomous capabilities, the UAV mounts an Ouster OS0-128 LIDAR sensor [
33] under the avionics with a custom anti-vibration structure. All previously mentioned sensors are connected together with the autopilot to the onboard computer, which is an Intel NUCi7. Finally, an Ubiquiti Rocket M5 is used for ground communications and to connect the Rapsberry Pi and Intel NUC via Wi-Fi.
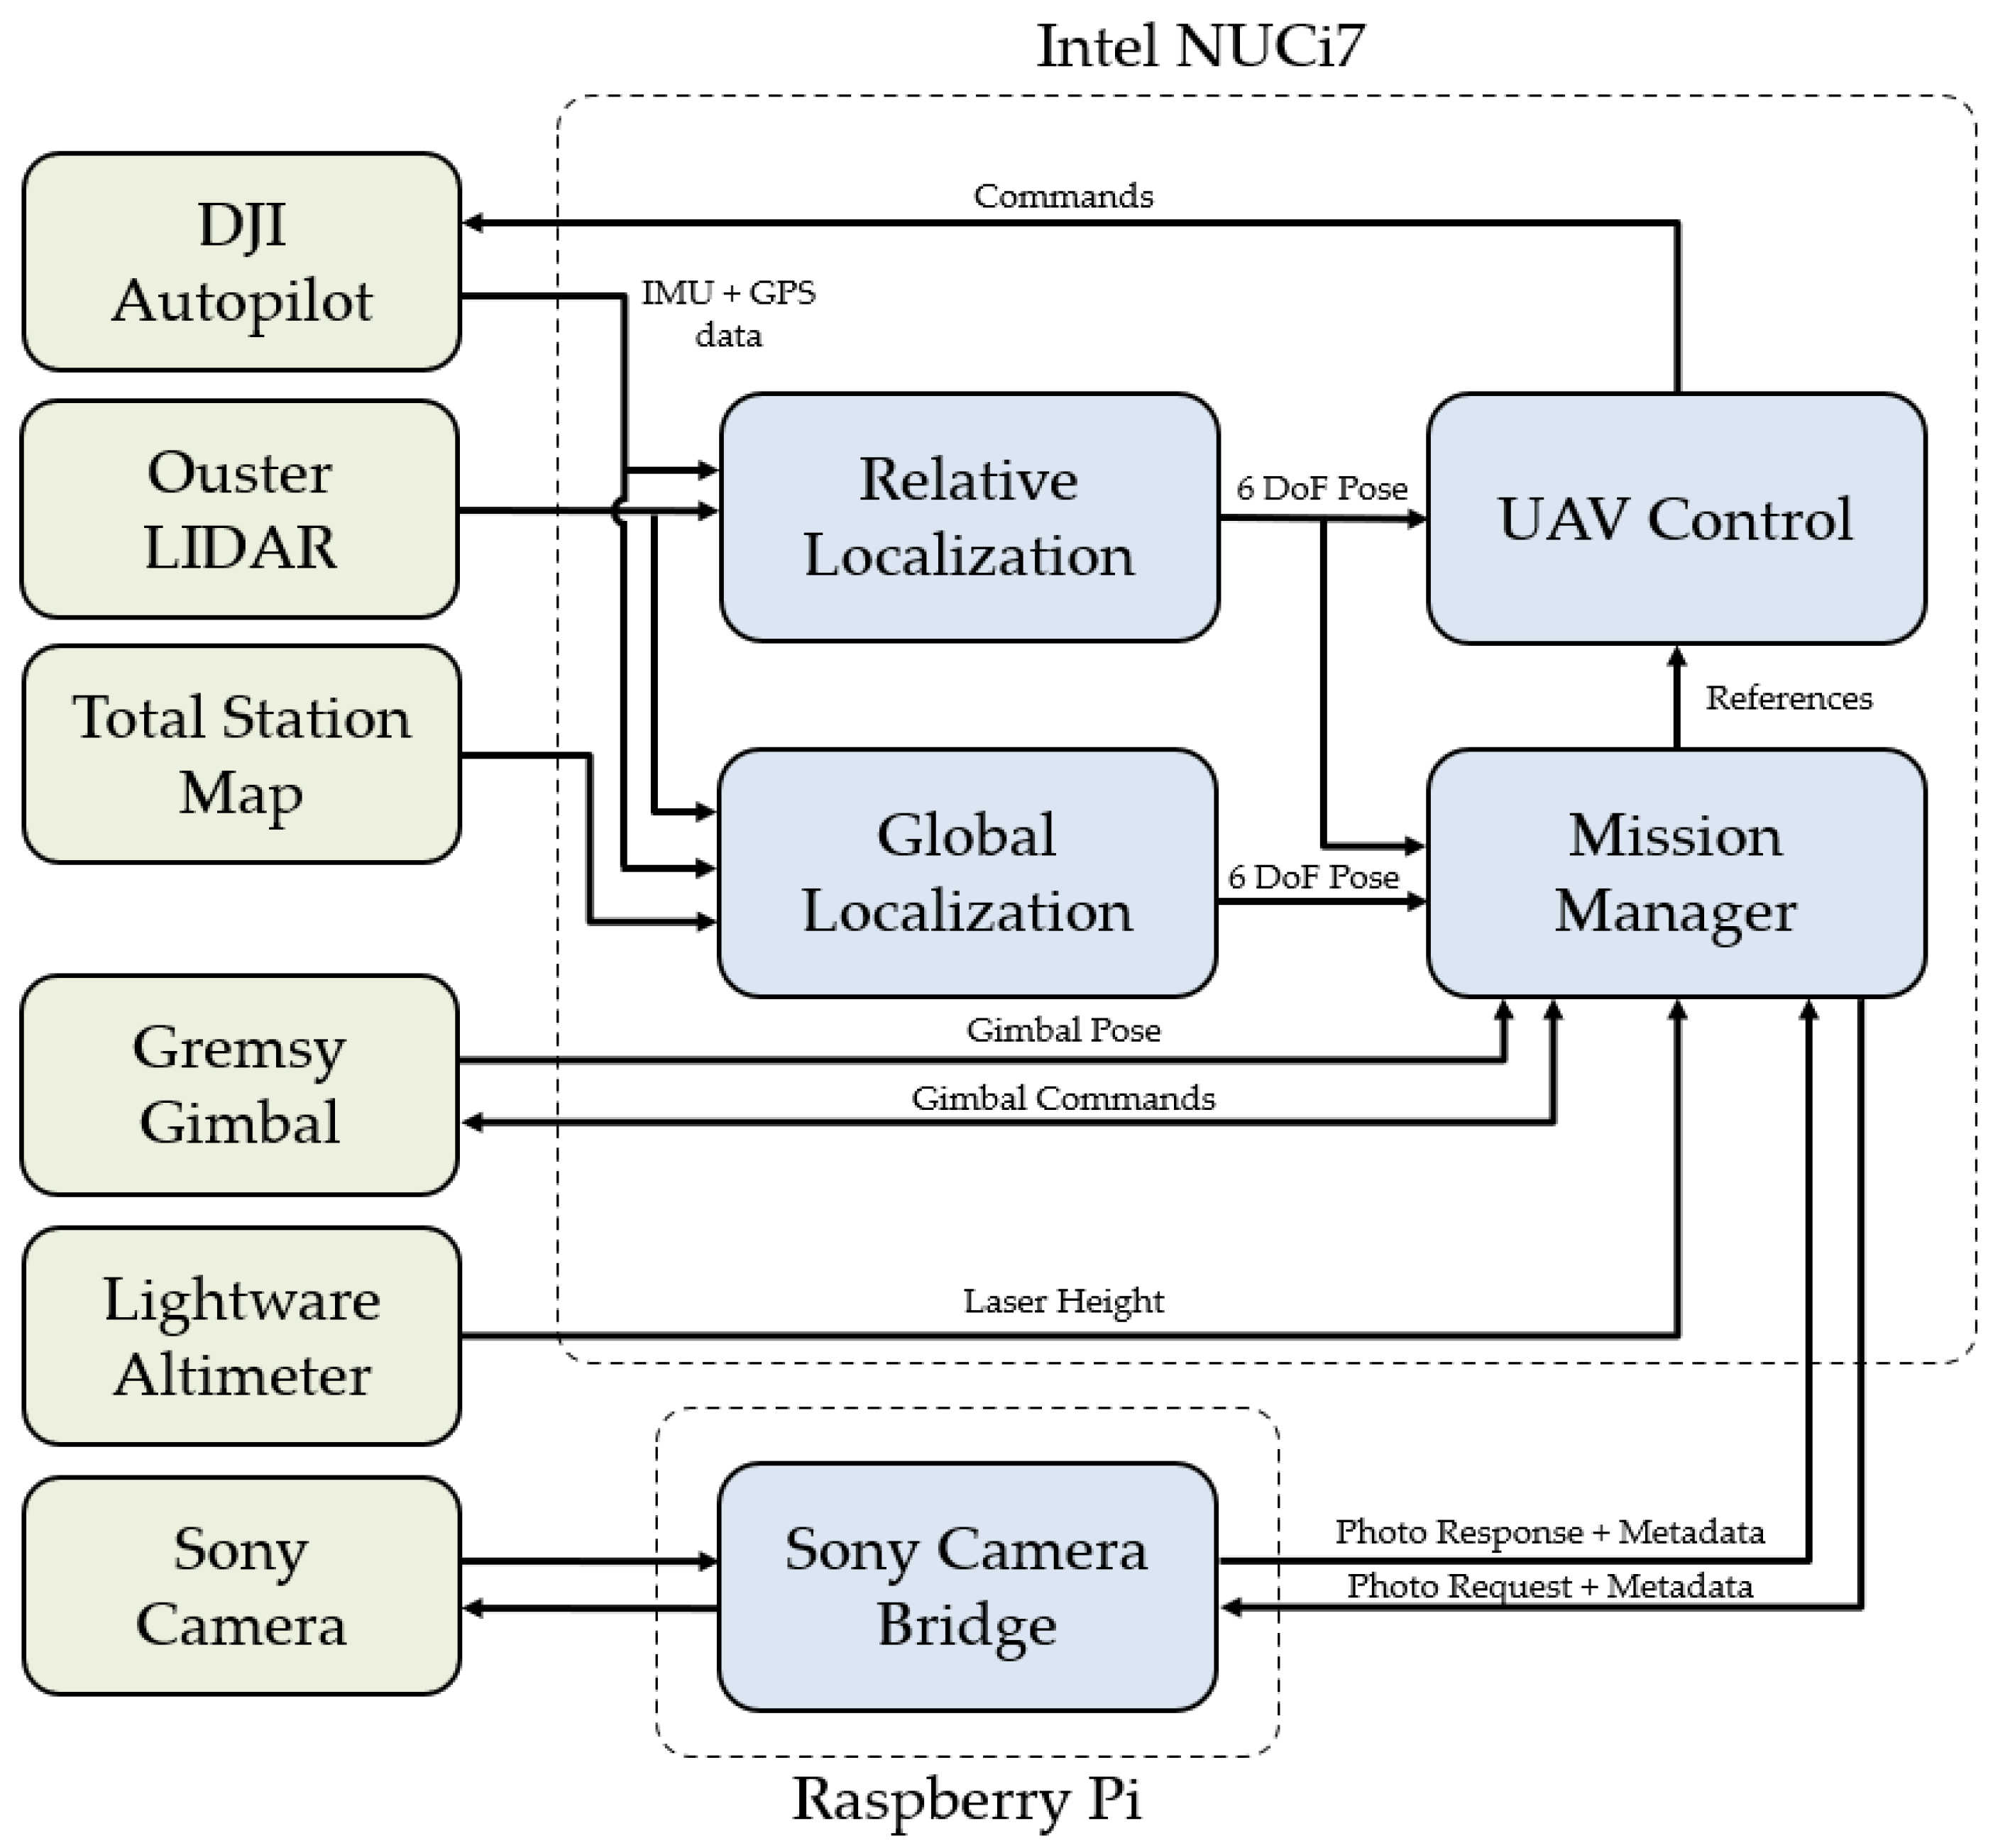
Both onboard computers run Ubuntu 18.04 and ROS Melodic and have their clocks synchronized for greater accuracy in capturing images with metadata. The software of the platform is programmed as nodes that communicate with each other.
Figure 4 shows the scheme of processes that operate in the system.
With all this equipment, the AERO-CAM is able to perform completely autonomous visual inspections even in GNSS-denied environments. It is capable of taking off and landing on its own, as well as carrying out the mission created from the 3D map of the viaduct. These missions are composed of many waypoints that have an image associated with them. Each time the UAV reaches a waypoint, it moves the gimbal and captures the corresponding image autonomously.
2.2. Contact Inspection
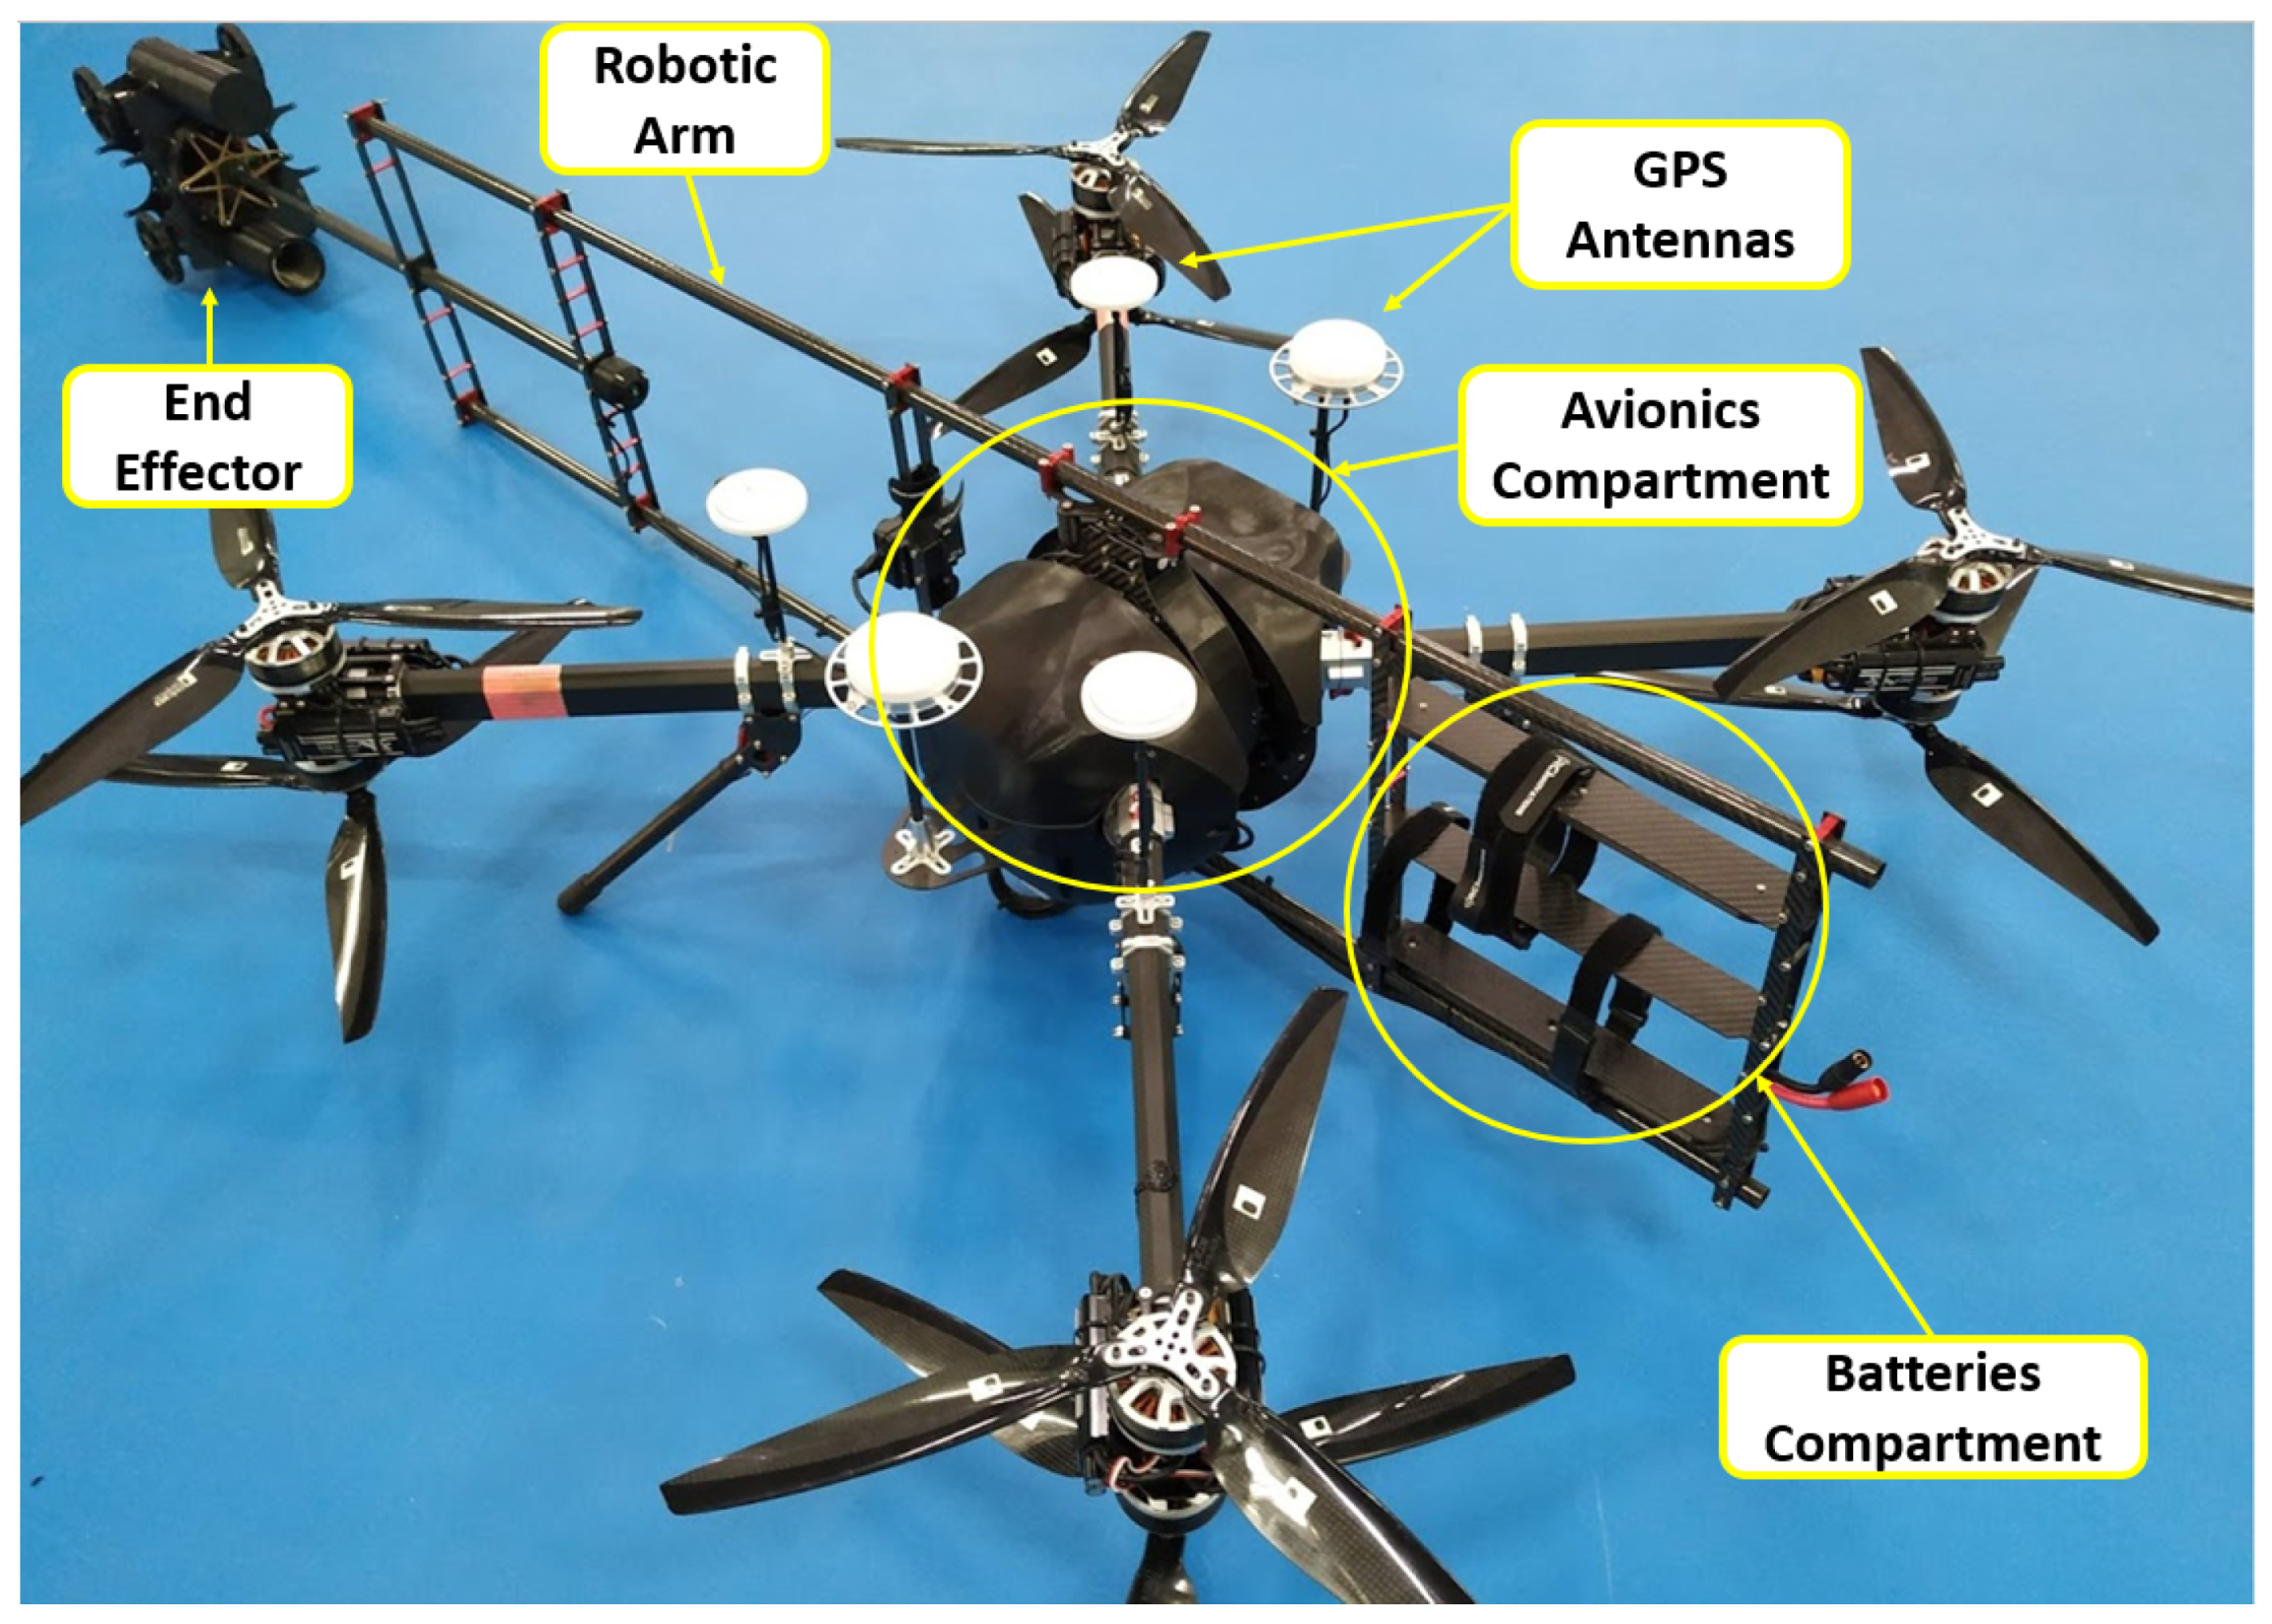
The aerial contact inspection robot is named AeroX [
12] (see
Figure 5). It is a specialized aircraft capable of contacting static surfaces. This UAV is composed of two different platforms: the aerial platform and the Robotic Mobile Contact Platform (RMCP), which will be in charge of the Ultrasonic Testing (UT) inspection for measuring the cracks’ depth. The RMCP is attached at the end of the contact device of the aerial platform.
AeroX is a novel aerial robotic manipulator that performs physical contact inspection with unprecedented capabilities. It is composed of a robotic vehicle, a six degree-of-freedom (DoF) robotic arm, and a robotic end-effector equipped with wheels and inspection sensors. AeroX has a semi-autonomous operation, which provides interesting advantages in contact inspection. In the free-flight mode, the pilot guides the robot until performing contact with its end-effector on the surface to be inspected. During contact, AeroX is in its fully-autonomous GNSS-free contact-flight mode, in which the robot keeps its relative position with respect to the surface contact point using only its internal sensors. During autonomous flight, the inspector—with uninterrupted contact—can move the end-effector on the surface to accurately select the points to be inspected with sensors that require to be in contact with or very close to the surface.
The AeroX controller is able to efficiently compensate perturbations thanks to its design, which transmits the surface contact forces and perturbations to the robot center of mass and allows small movements of the aerial part of the robot in every DoF to absorb other perturbations such as wind. AeroX adopts a 4 coaxial rotor configuration and a simple and efficient design which provides high stability, maneuverability, and robustness to rotor failure. It can perform contact inspection on surfaces at any orientation, including vertical, inclined, horizontal top or horizontal bottom, and its operation can be easily integrated into current maintenance operations in many industries.
Although AeroX is part of the proposed solution for viaduct inspection, the technical and experimental development of this article focuses on the AERO-CAM localization algorithms. For more information about AeroX, please refer to [
12].
3. Localization Solution
The proposed solution for the visual inspection of the viaduct requires the creation of a previous 3D map using a total station. This map will be a point cloud that identifies the reference coordinate origin for the entire inspection system. To create this map, operators should ensure that the ENU coordinate system is followed. This map can be reused in future inspections of the viaduct.
The UAV system has its own localization and navigation algorithm that provides the transform {
} whose origin is the take-off point {
L}. Since this location may vary, the complete system requires a second localization system that establishes the 3D transformation, {
}, between the initial UAV pose and the global reference system, {
G}, expressed in
ENU coordinates at the origin of the map created by the total station. These transforms can be visualized in
Figure 6.
Therefore, the AERO-CAM platform has two parallel localization processes to perform the automatic inspection of the viaducts. The following subsections explain the details of both processes.
3.1. Global Localization System
The function of the global localization system is to find the transform, {
}, which establishes the connection between the global reference system of the viaduct 3D map and the UAV localization system as expressed in Equation (
1). Finding this transform is crucial, as it will allow the aerial robot to safely navigate to those areas of interest selected by the inspector without maintaining the same take-off position between flights. This process eliminates total station dependency after the initial 3D map has been created/acquired. In addition, since the viaduct can be found in an inaccessible area, the take-off position may not be replicated between flights. This can occur even on inspections on different days where changing terrain or weather conditions make it impossible to replicate the take-off position accurately.
This global localization system is designed to calculate the transform at the start of each mission, just before the aerial robot takes off. Therefore, the transform, {
}, is fixed and will only vary during the flight if another transform with better accuracy has been obtained. During flight, this system continues to calculate the transform between the UAV’s current position and the base map, {
}, as expressed in Equation (
2), so that if the accuracy of the transform improves, it gets updated. This last case can be also visualized in
Figure 6. This in-flight update is only applied with the confirmation of the inspector on the ground, who personally checks whether the mean square error calculated by the global positioning algorithm is better.
The global localization can be executed on a ground computer asynchronously, since this calculation need not be instantaneous. In this case, the onboard computer sends the data to the ground computer, which performs the calculations and sends the results back to the aerial robot. This update has no direct impact on the relative localization of the UAV, as this is not affected by the change of {}. This update has no direct impact on the ongoing flight of the UAV, as its relative localization and control are not affected. However, the mission waypoints, which are referenced to {G}, are updated in the onboard computer. Therefore, the UAV changes its target points to more accurate ones.
To find the correspondence between the 3D map generated by the total station and the data from the onboard sensors, we apply an algorithm that makes use of the geometric characteristics of the point clouds. Firstly, the point clouds are preprocessed to filter out the sparse data noise by applying a filter that removes outliers if the number of neighbors in a given radius (e.g., 0.1 m) is smaller than a given number, typically 15. Secondly, the algorithm performs a distributed downsampling by applying a voxel grid filter and tries to remove the ground points. The process of eliminating the ground points is carried out by creating a parametrizable grid of squares that is filled with the z-value of the lowest point within each square. For each square, all points with z-values between the minimum and a given threshold (1.5 m) are removed. Then, the algorithm calculates the FPFH (Fast Point Feature Histogram) descriptors [
34] of the remaining distributed points. These features encode the geometric properties of the k-nearest neighbors of a given point using the average curvature of the multidimensional histogram around that point. Among its advantages, these features are invariant in position and a certain level of noise. After this feature extraction process, the Random Sample Consensus (RANSAC) algorithm is applied to find a first approximation between both inputs. The result is then corrected according to the problem-specific assumptions outlined below and refined via the Iterative Closest Point (ICP) algorithm. These correction and refinement steps are applied twice to further adjust the result. They are only refined twice as doing it more has not shown a substantial improvement of the result but an increase of computational load and computational time. Depending on whether the initial guess is reliable and if, at the instant of processing, the UAV is close to the structure, the RANSAC stage can be exchanged for the ICP algorithm directly to obtain better results. To identify these refinement stages, they are named ICP1, ICP2, and ICP3, with ICP1 being the one that can be exchanged for RANSAC, as explained before.
Figure 7 shows a block diagram of the main steps of the algorithm.
To improve this process, some assumptions are made that simplify the problem and work in all possible scenarios:
The total station 3D map is filtered manually so that it only contains information about the viaduct. This prevents unwanted objects from appearing.
The total station map’s origin and the UAV’s take-off point are aligned with the horizon, so they both have 0 degrees in pitch and roll.
The absolute yaw orientation of the UAV is known thanks to an onboard magnetometer. Therefore, the approximate rotation matrix between the LIDAR and the total station map is known beforehand.
The GNSS position of the total station map’s origin is known approximately. If the drone has GNSS coverage at the take-off point, an initial guess for its position can also be obtained.
The introduction of the above assumptions mainly corrects the orientation before starting the alignment process, thus reducing the problem to almost pure translation. In addition, even minimal GNSS coverage at the take-off point provides an initial guess that makes the problem converge more accurately and faster. In case no GNSS coverage is available, the approximate coordinate of the take-off point with respect to the total station 3D map can be entered manually.
In addition to the above assumptions, in case of significant changes between reality and the reference map obtained with the total station due to catastrophes or severe structural failures, the discordant areas of the reference map should be removed. Alternatively, a map of the new state of the structure can be created with the same reference origin as the previous one.
3.2. Relative Localization System
The purpose of the relative localization system is to find the transform {}, which describes the motion of the aerial robot from its take-off point. This take-off point will be located near the viaduct, on a flat surface parallel to the horizon so that the UAV can take off safely. This localization is performed using only current readings from the onboard sensors and does not require any prior data. It is desirable that this localization is as accurate as possible and minimizes drift over time, as much as possible, to avoid a significant divergence between the UAV’s perceived and actual poses.
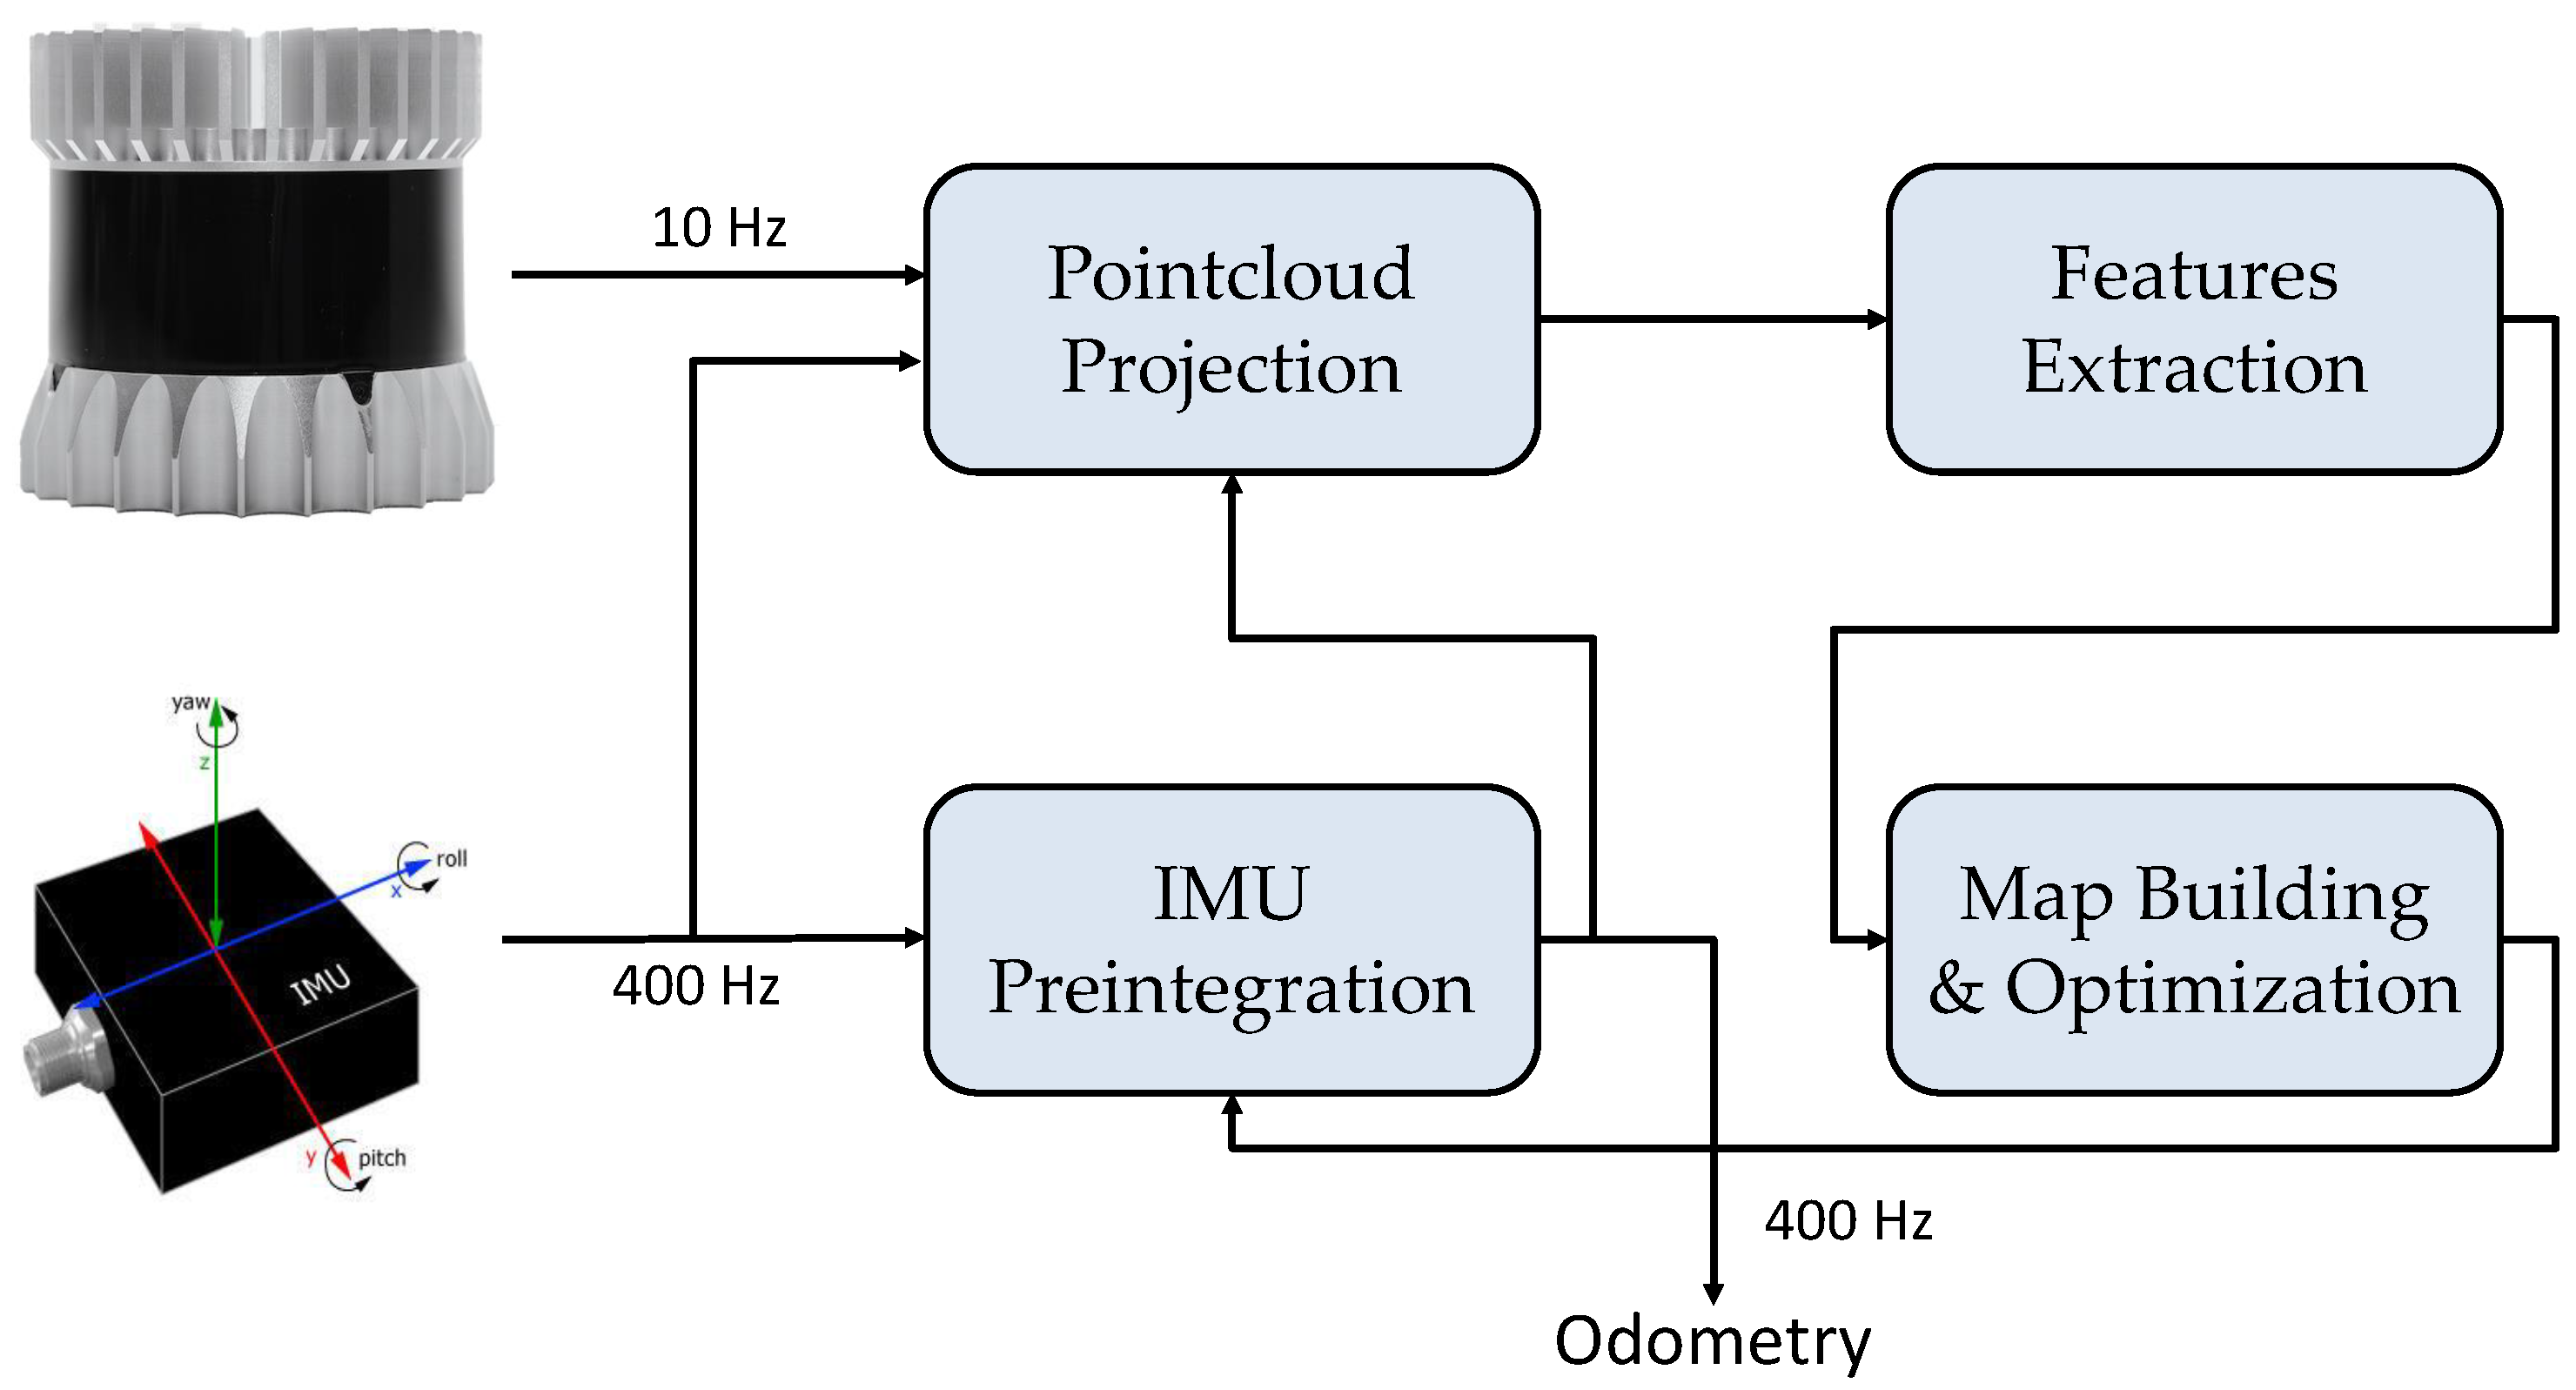
The relative localization system makes use of the LIDAR and a 9-axis IMU to calculate the UAV’s pose at each instant. The algorithm operates at high frequency in real time, updating the pose at the same frequency as the IMU, which in the case of AERO-CAM is 400 Hz. The LIDAR is set to an operating frequency of 10 Hz. This algorithm is executed entirely onboard the aerial robot in the equipped Intel NUC. Despite running in real time, this algorithm has the highest processing load among the programs executed. It is of vital importance to the system, as it provides localization feedback to the UAV control algorithm, so that it can ensure a stable flight while navigating autonomously to the desired target points. The localization algorithm is based on LIO-SAM [
35] and its general architecture is adapted to AERO-CAM as shown in
Figure 8.
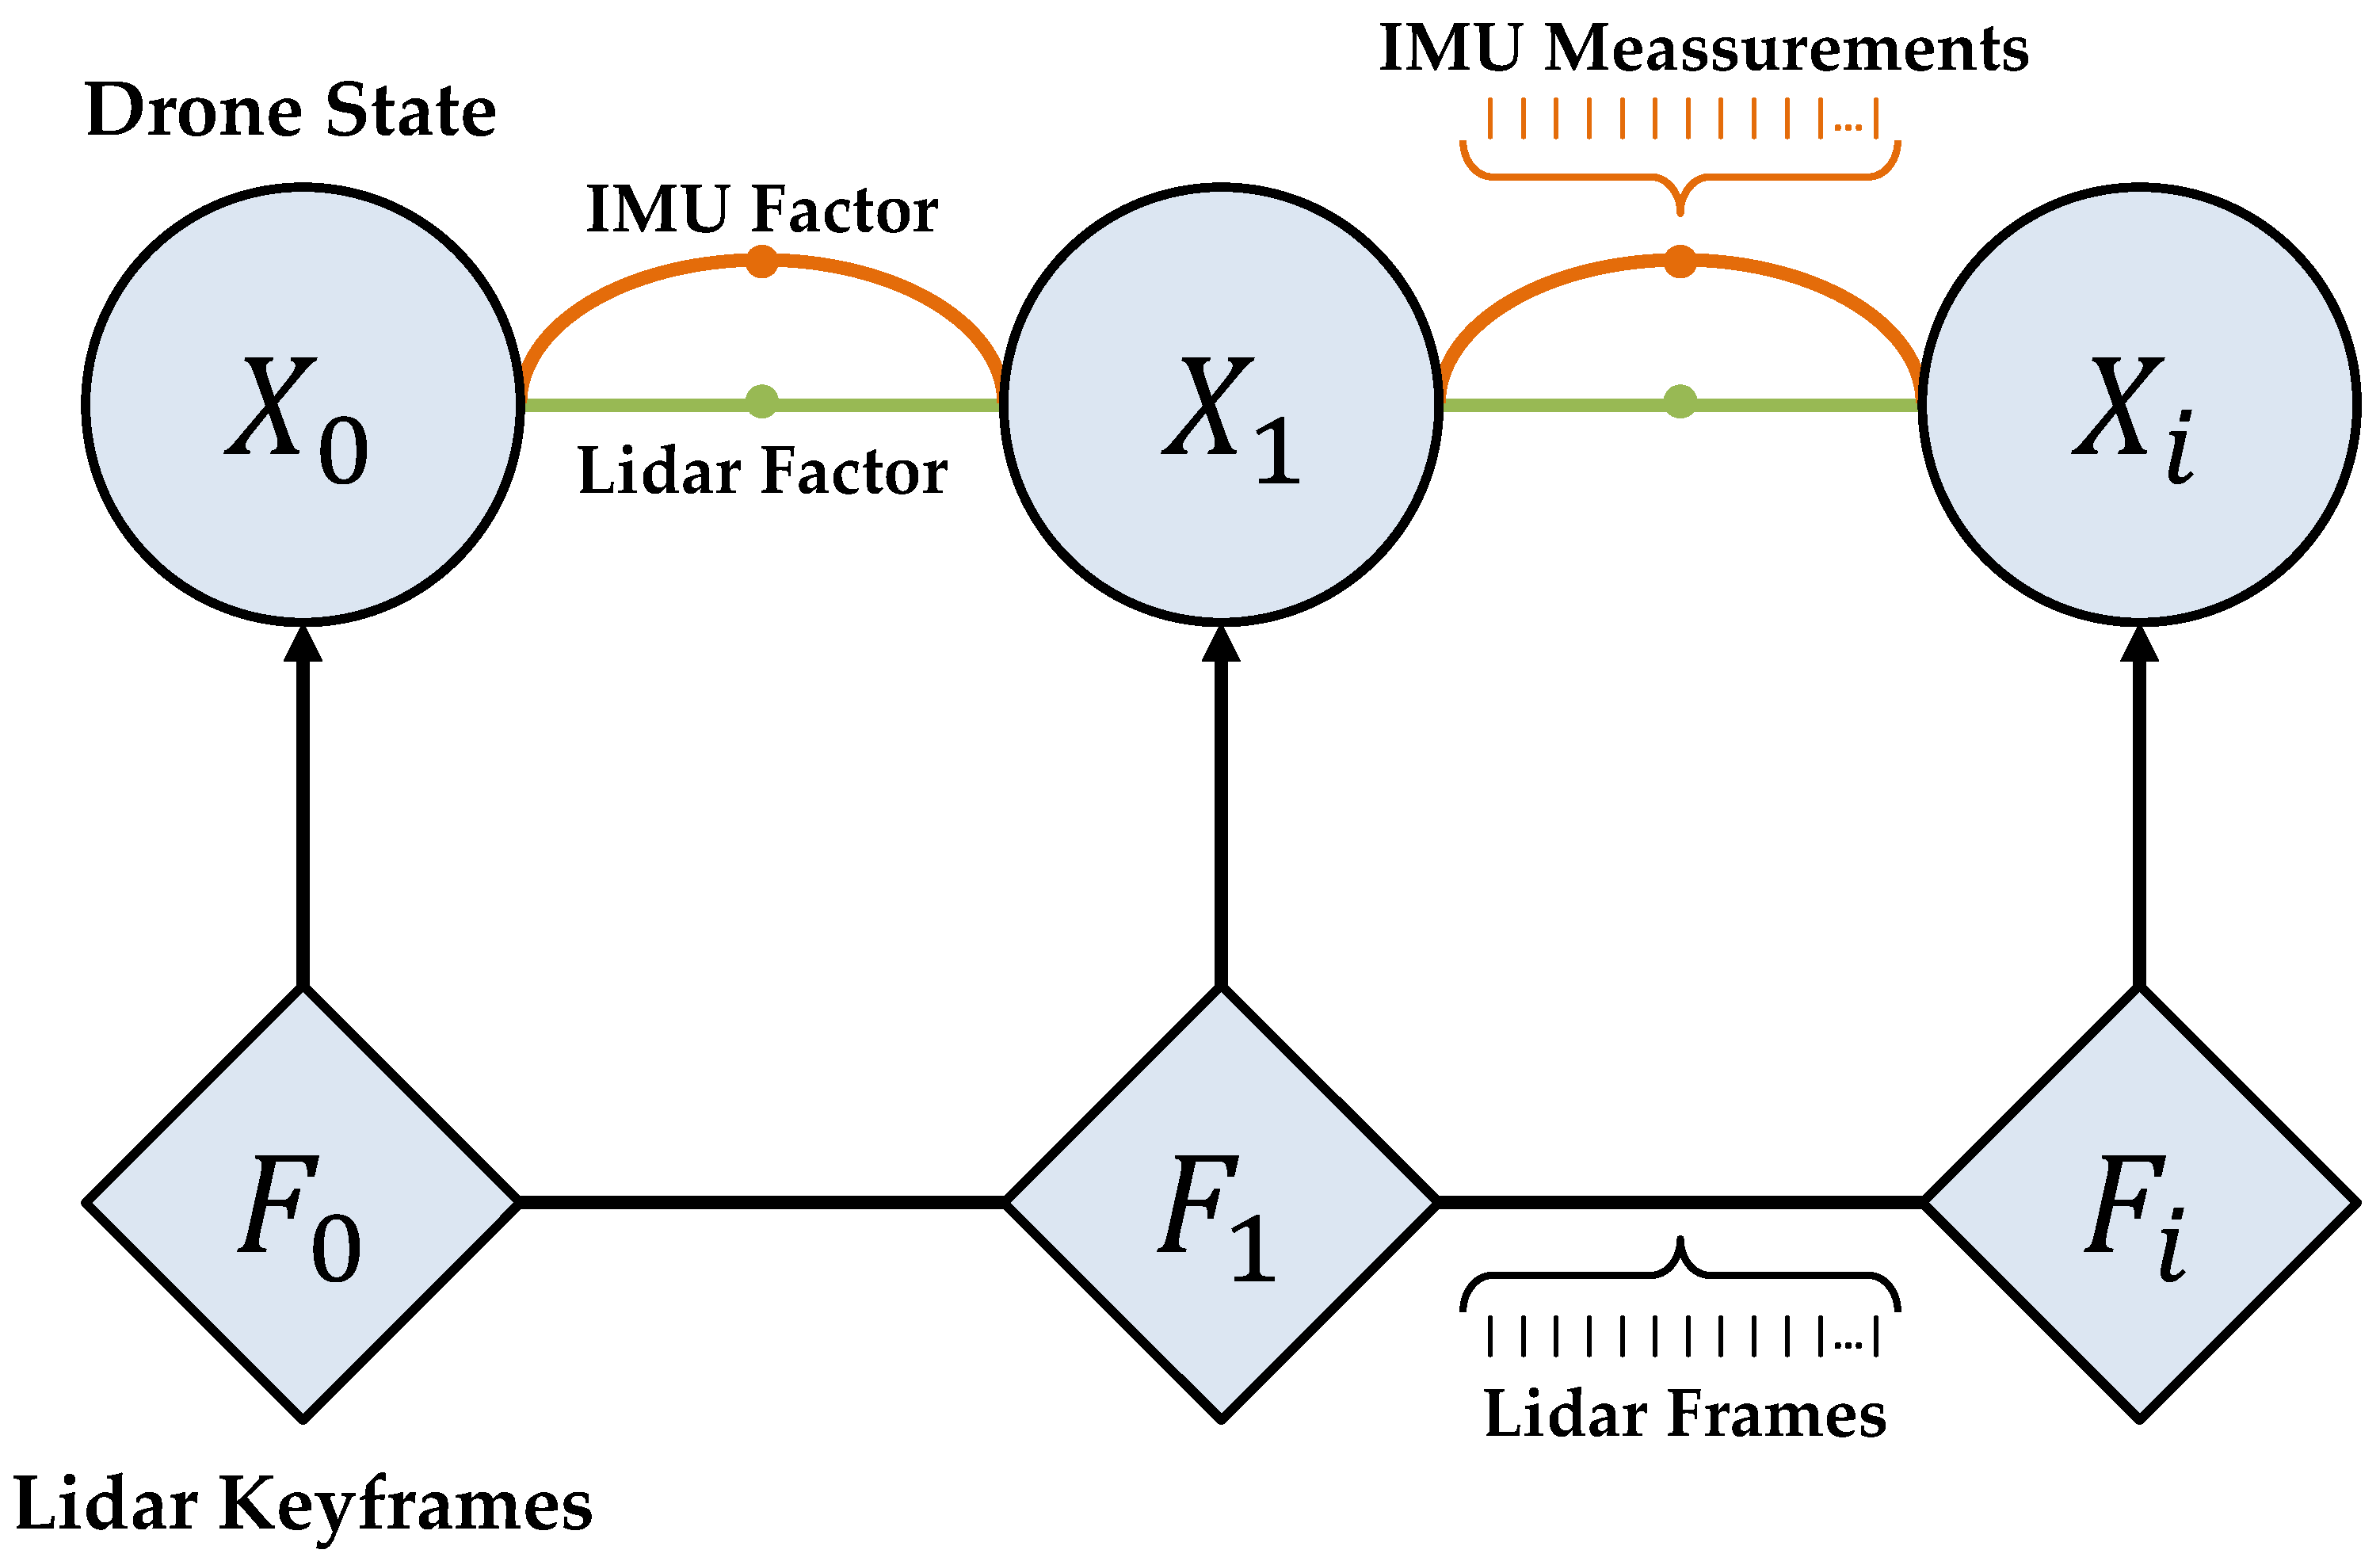
This architecture establishes a tightly coupled fusion between the LIDAR and the IMU, building a factor graph in which the measurements made by the sensors are integrated to build and optimize the map, as shown in
Figure 9. The factor graph is optimized using smoothing and mapping a Bayes tree with iSAM2 [
36]. The IMU pre-integration is based on [
37]. Since the double integration of IMU measurements leads to large drift, the architecture proposes its short-term integration instead, correcting its bias thanks to the localization at lower frequency in the built map using the information of the LIDAR point cloud. In order to process everything in real time, the algorithm discards LIDAR readings if they are not sufficiently displaced (typically 1 m and 0.2 radians) with respect to the previous reading (known as LIDAR keyframes). In this way, a lot of redundant information that would otherwise increase the computational load is discarded. Between LIDAR keyframes, the IMU readings are integrated, converging in a node of the graph that would be the state of the location at that given instant. Unlike the original algorithm, the adaptation for AERO-CAM does not introduce GPS/GNSS factors since the signal quality is totally impaired during the inspection flight due to the structure itself. Another difference with the original algorithm is that the loop closure option is disabled to avoid possible jumps in the odometry. The main reason is that this odometry is used to close the control loop so as to avoid as many peaks and spikes as possible, as it is safety critical to smooth the flight near the viaduct during the inspection. However, this particularization of the algorithm can lead to larger drifts in the calculated odometry. To overcome this problem, inspection flights are assumed to have a controlled duration with a planned route close to the viaduct, thus providing a rich point cloud which will help to minimize drift.
As already mentioned, the result of all this processing is the relative localization of the aerial robot with a high frequency (400 Hz) that serves the control algorithm to proceed with the AERO-CAM. This publication does not intend to go into the details of the original LIO-SAM implementation. For more details, please refer to [
35].
4. Experimental Results
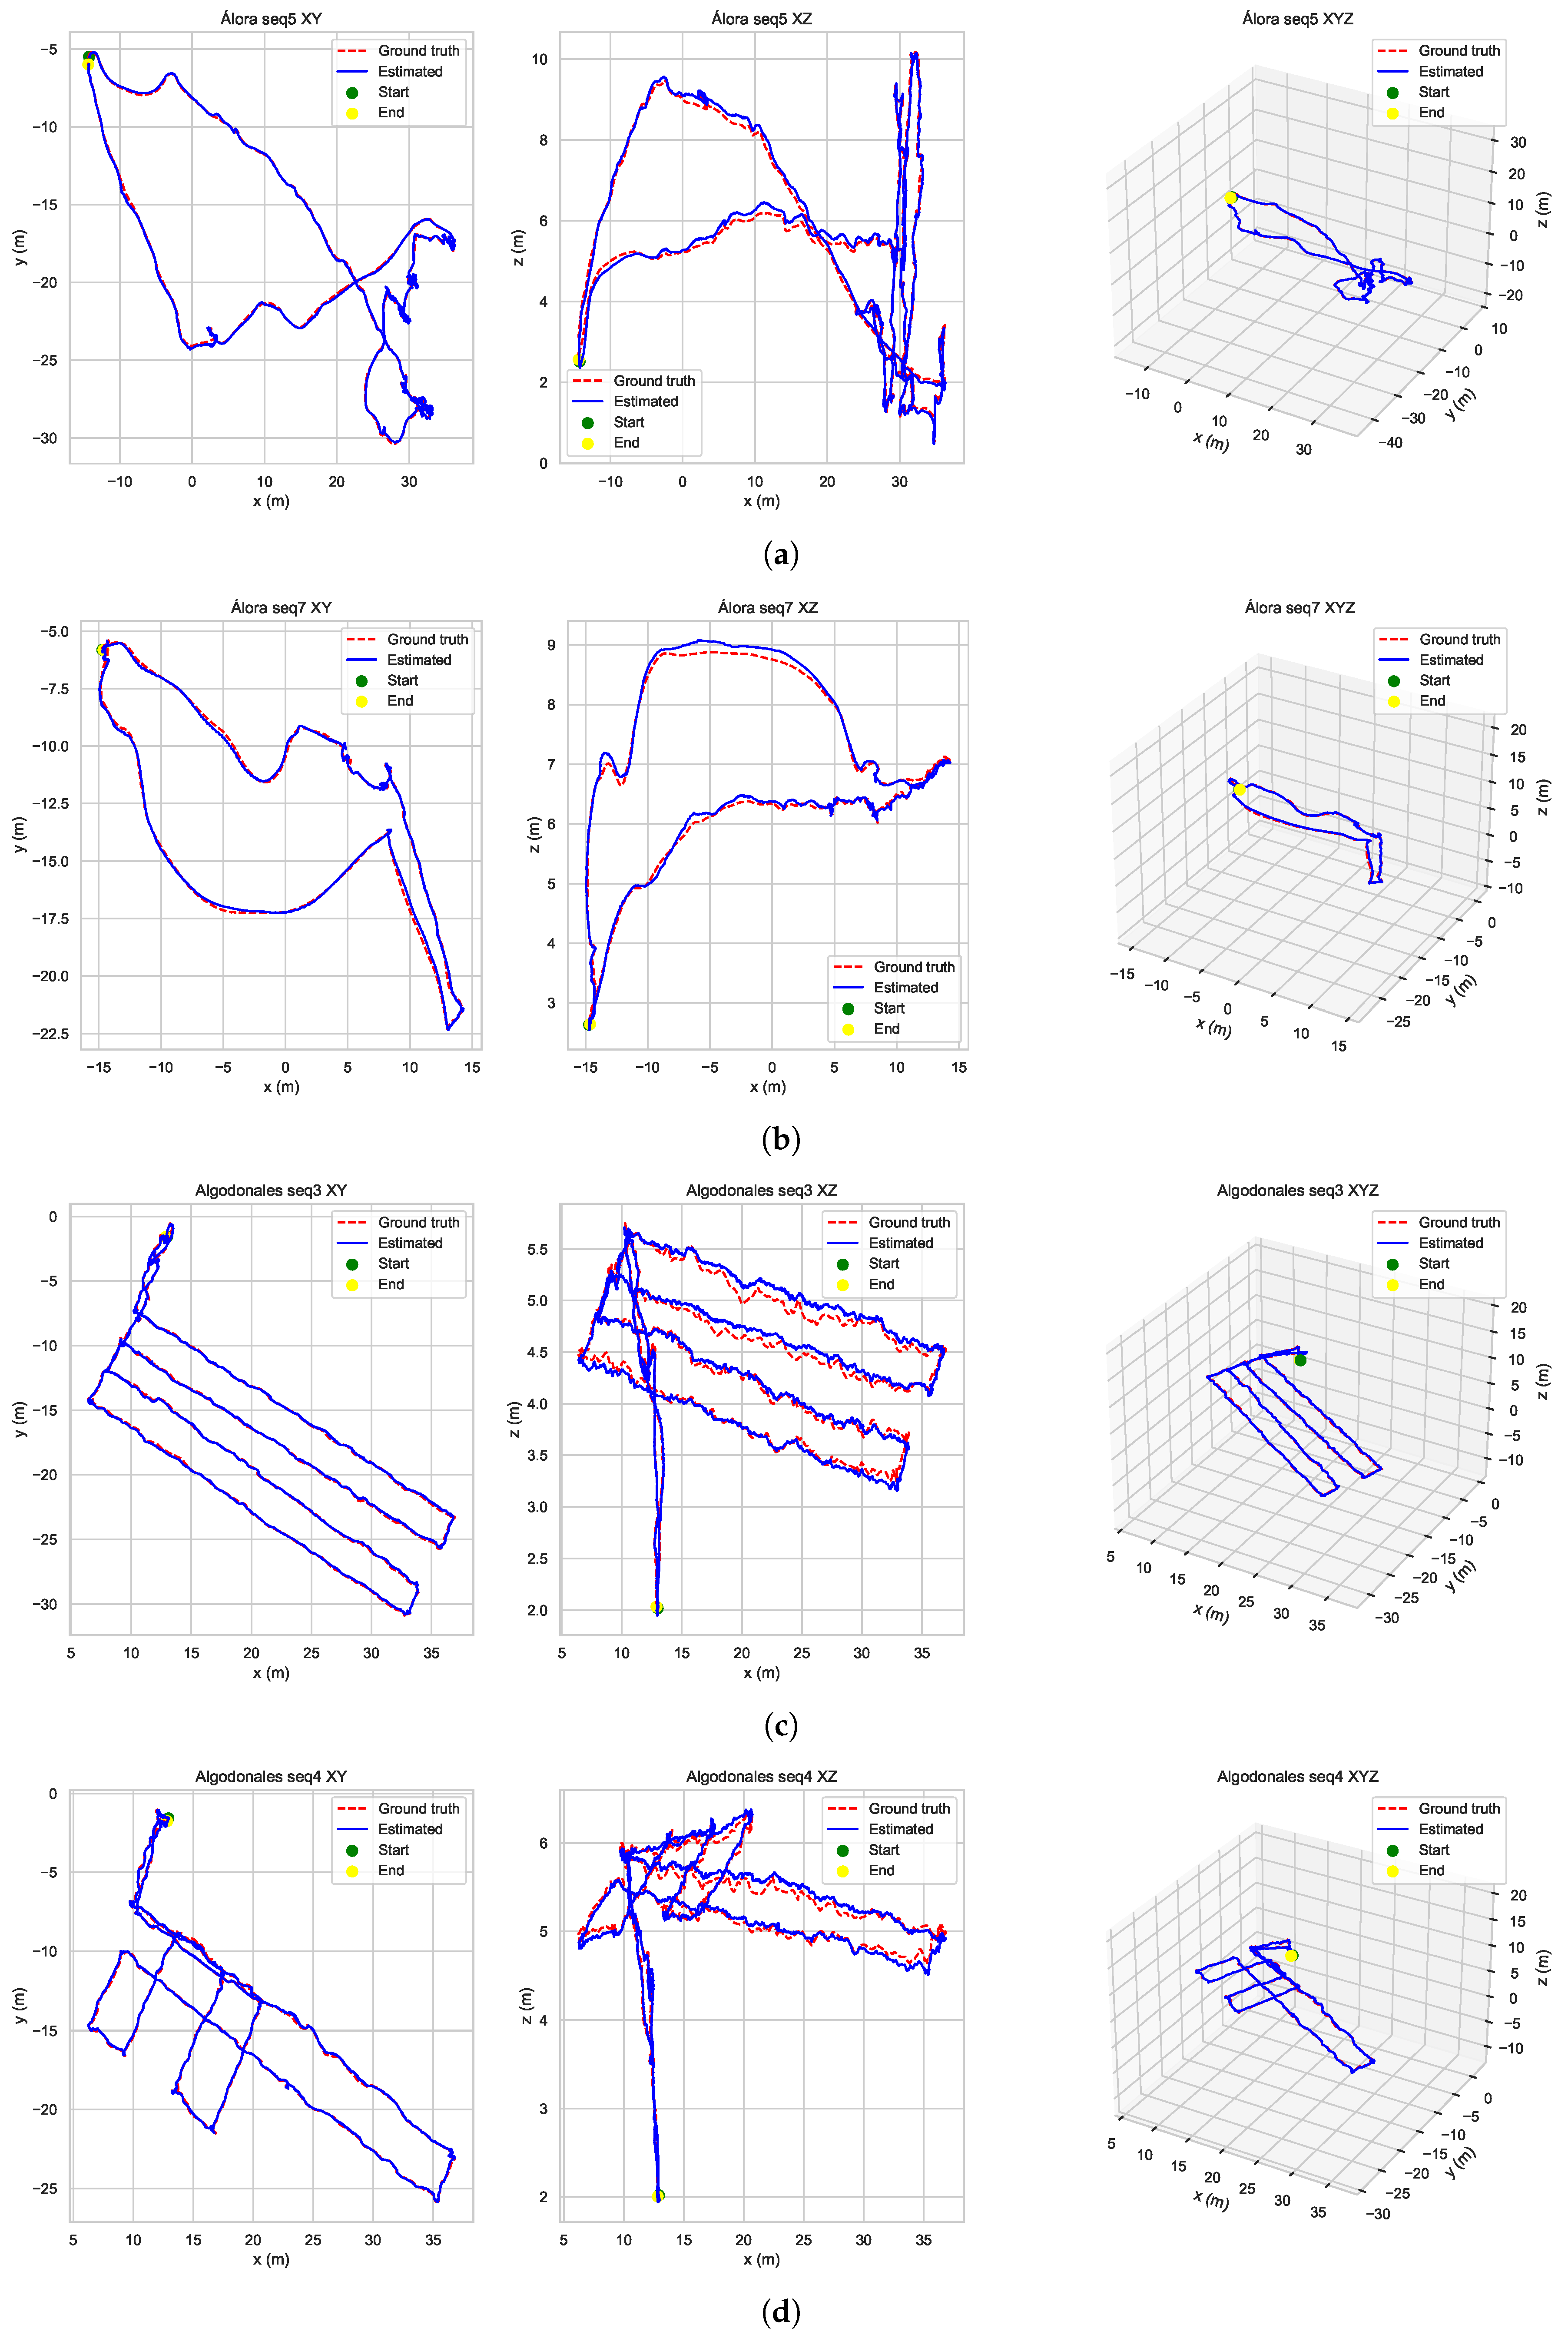
The experimentation phase of this article was carried out with the AERO-CAM platform, performing the various experiments described next. Real flights around and under two viaducts were performed to evaluate the localization solution. On the one hand, there is the railway viaduct Arroyo del Espinazo in Álora, Málaga (Spain). This viaduct was inaugurated in 2006 and is currently in use. It has a length of 1.2 km with a maximum pillar height of 93 m and a width of 14 m. The pillars are equidistantly distributed and have a hollow square cross-section. On the other hand, there is the road viaduct Puente de las Navas in Algodonales, Cádiz (Spain). This viaduct was built in the 1980s and is still active with the A-384 road passing over it; therefore, it withstands daily traffic. It is approximately 350 m long and consists of cylindrical pillars supporting in pairs three longitudinal beams on which the deck rests. Both viaducts are in a good state of conservation, presenting small aesthetic defects in the concrete during the inspections without danger. The utility of the experimental inspections is focused on predictive maintenance, being able to return in the future to carry out the same inspection and compare the evolution. The flights in Álora were pilot assisted in order to perform realistic routes while those in Algodonales were fully autonomous. A preliminary map of the viaducts was created using a Leica Nova MS50 total station.
The trajectory followed in these experiments consists of a take-off close to the viaduct and a flight inspection of different areas that may include changes in altitude.
Figure 10 shows some of these trajectories. In order to obtain the ground truth of the trajectory followed by the platform, a prism was installed on it and, using the Leica total station, the position with respect to the origin of the viaduct map was tracked. Note that the total station only provides position data, as it cannot estimate orientation. This position data is provided at 20 Hz.
4.1. Global Localization
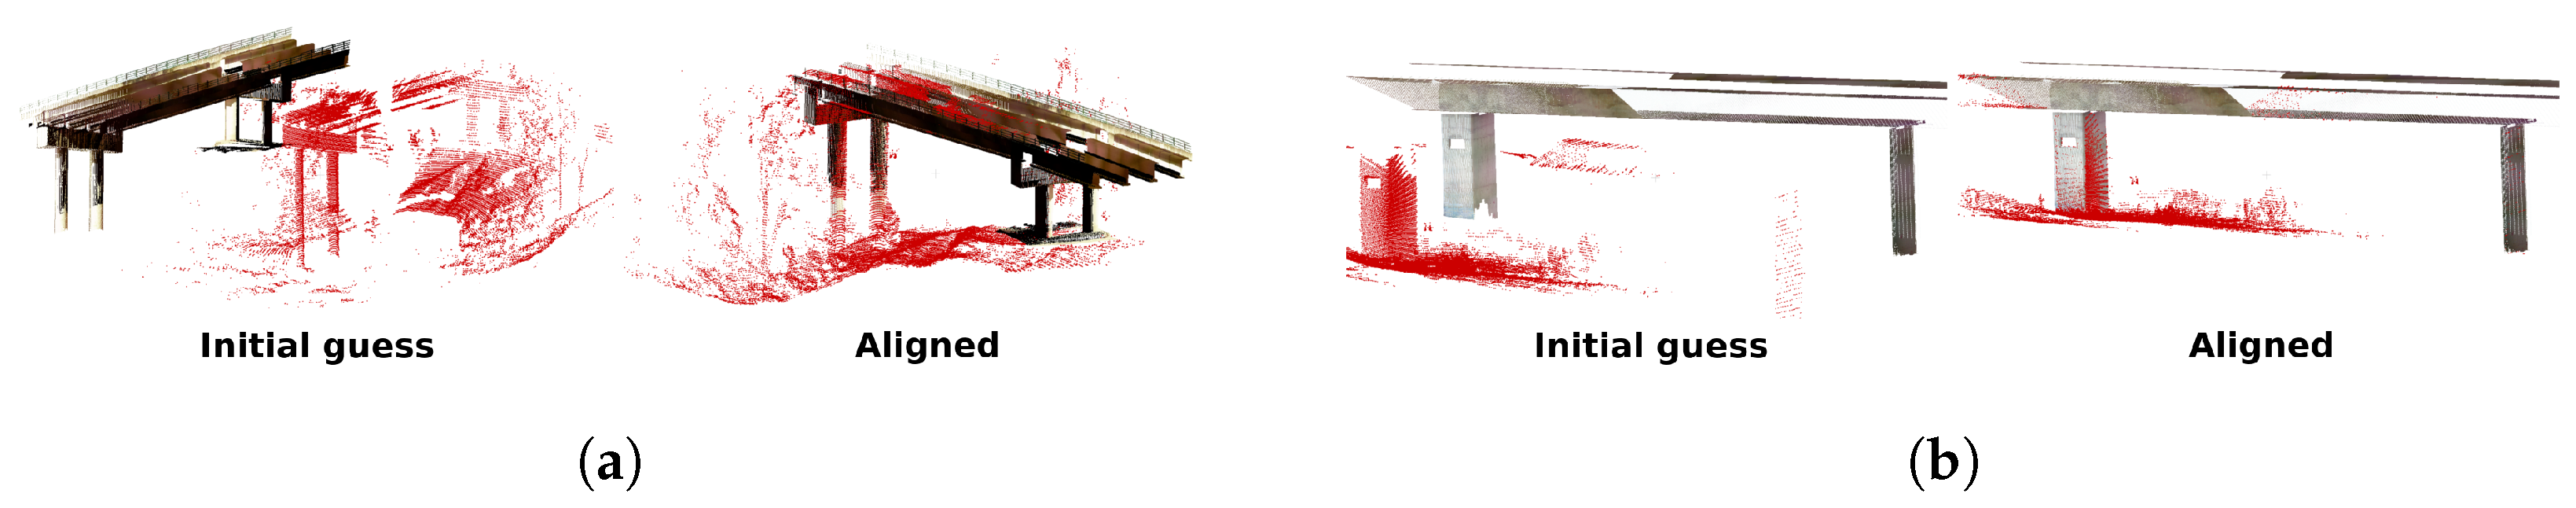
The experiments to test the global localization algorithm consisted of extracting LIDAR readings from the aerial platform for different time instants and inputting them for computation. These instants include moments before take-off and during flight and landing. To illustrate this process,
Figure 11 shows two alignment examples at take-off.
On the one hand, the initial alignment of the total station 3D map and the LIDAR data readouts are shown, taking into account the assumptions introduced in
Section 3.1. On the other hand, both point clouds aligned with the algorithm results are shown.
During the experimentation, the execution of the global localization algorithms was carried out on a laptop with a 4-core Intel Core i7-8564U CPU and 8 GB of RAM. The execution and convergence time of the algorithm varied between 12 and 25 s for each resulting transform. This duration is not a problem since the first iteration is performed before take-off. The rest of them can be performed during the flight and update the transform at convenience, as explained in
Section 3.1.
The performance evaluation of the global localization algorithm is carried out by studying the mean error between matches after each ICP step. All tested cases converge to a valid solution.
Table 1 and
Table 2 show the metrics obtained for Algodonales and Álora, respectively. As explained in
Section 3, the ICP1 step is not always executed, so it is denoted in the tables as “*” when there is no data. The so called “Proportional Correspondence” metrics (Prop. Corr.) shows the number of correspondences in that ICP stage divided by the size of the LIDAR point cloud at that instant in time. The MSE metrics represents the mean square error of the correspondences after applying the transform obtained at that stage.
Additionally, during these instants, the position given by the total station—which has the same reference system as the 3D map—was obtained. This position serves as a ground truth to check the output of the global localization algorithm, since the output of this algorithm should correspond with the reading of the total station. Again, since the total station does not provide orientation, only the transitional part is considered.
Table 3 and
Table 4 show the obtained results.
The results are considered valid since the algorithm is able to converge correctly in the proposed realistic cases. The advantage of the global localization system is that, if run before take-off, the operator can visually validate the obtained result and proceed with the inspection if there is no problem.
Table 3 and
Table 4 show how the final 3D error is between 0.2 and 0.64 m for the tested cases, the z-axis (vertical) being the most affected. The results are considered good since the uncertainty of the point clouds and of the algorithm itself must be taken into account. While the total station error is in the order of millimeters (always proportional to the distance), the LIDAR points have an error of ±1.5–5 cm (both errors according to the manufacturers), which may influence the result.
4.2. Relative Localization
In the experiments to test the relative localization, the position data estimated by the algorithm were compared with the ground truth from the total station. It should be taken into account that the latter can only provide positions without orientation, so only the translation part is compared. The comparison between the two sets was made with a time association of the positions and a scale-free alignment was performed with the Umeyama algorithm [
38]. The EVO framework [
39] was used to facilitate this task. The metrics used are the APE (
Absolute Position Error), to evaluate the global consistency, and the RPE (
Relative Position Error), to evaluate the local one. For the RPE, an increment of 0.5 m was selected for the calculations. For both metrics, data such as maximum peak, mean, standard deviation, and RMSE (
Root Mean Square Error) were obtained.
Table 5 and
Table 6 show the results.
4.3. Inspection Result
The results obtained after performing a mission show the tracking of the planned trajectory by taking images of the viaduct. Each image obtained saves metadata containing the exact pose and instant in which they were taken with respect to the 3D map of the viaduct. In this way, it is always possible to review the inspection performed and to know the exact location to which each image belongs, with respect to the 3D map.
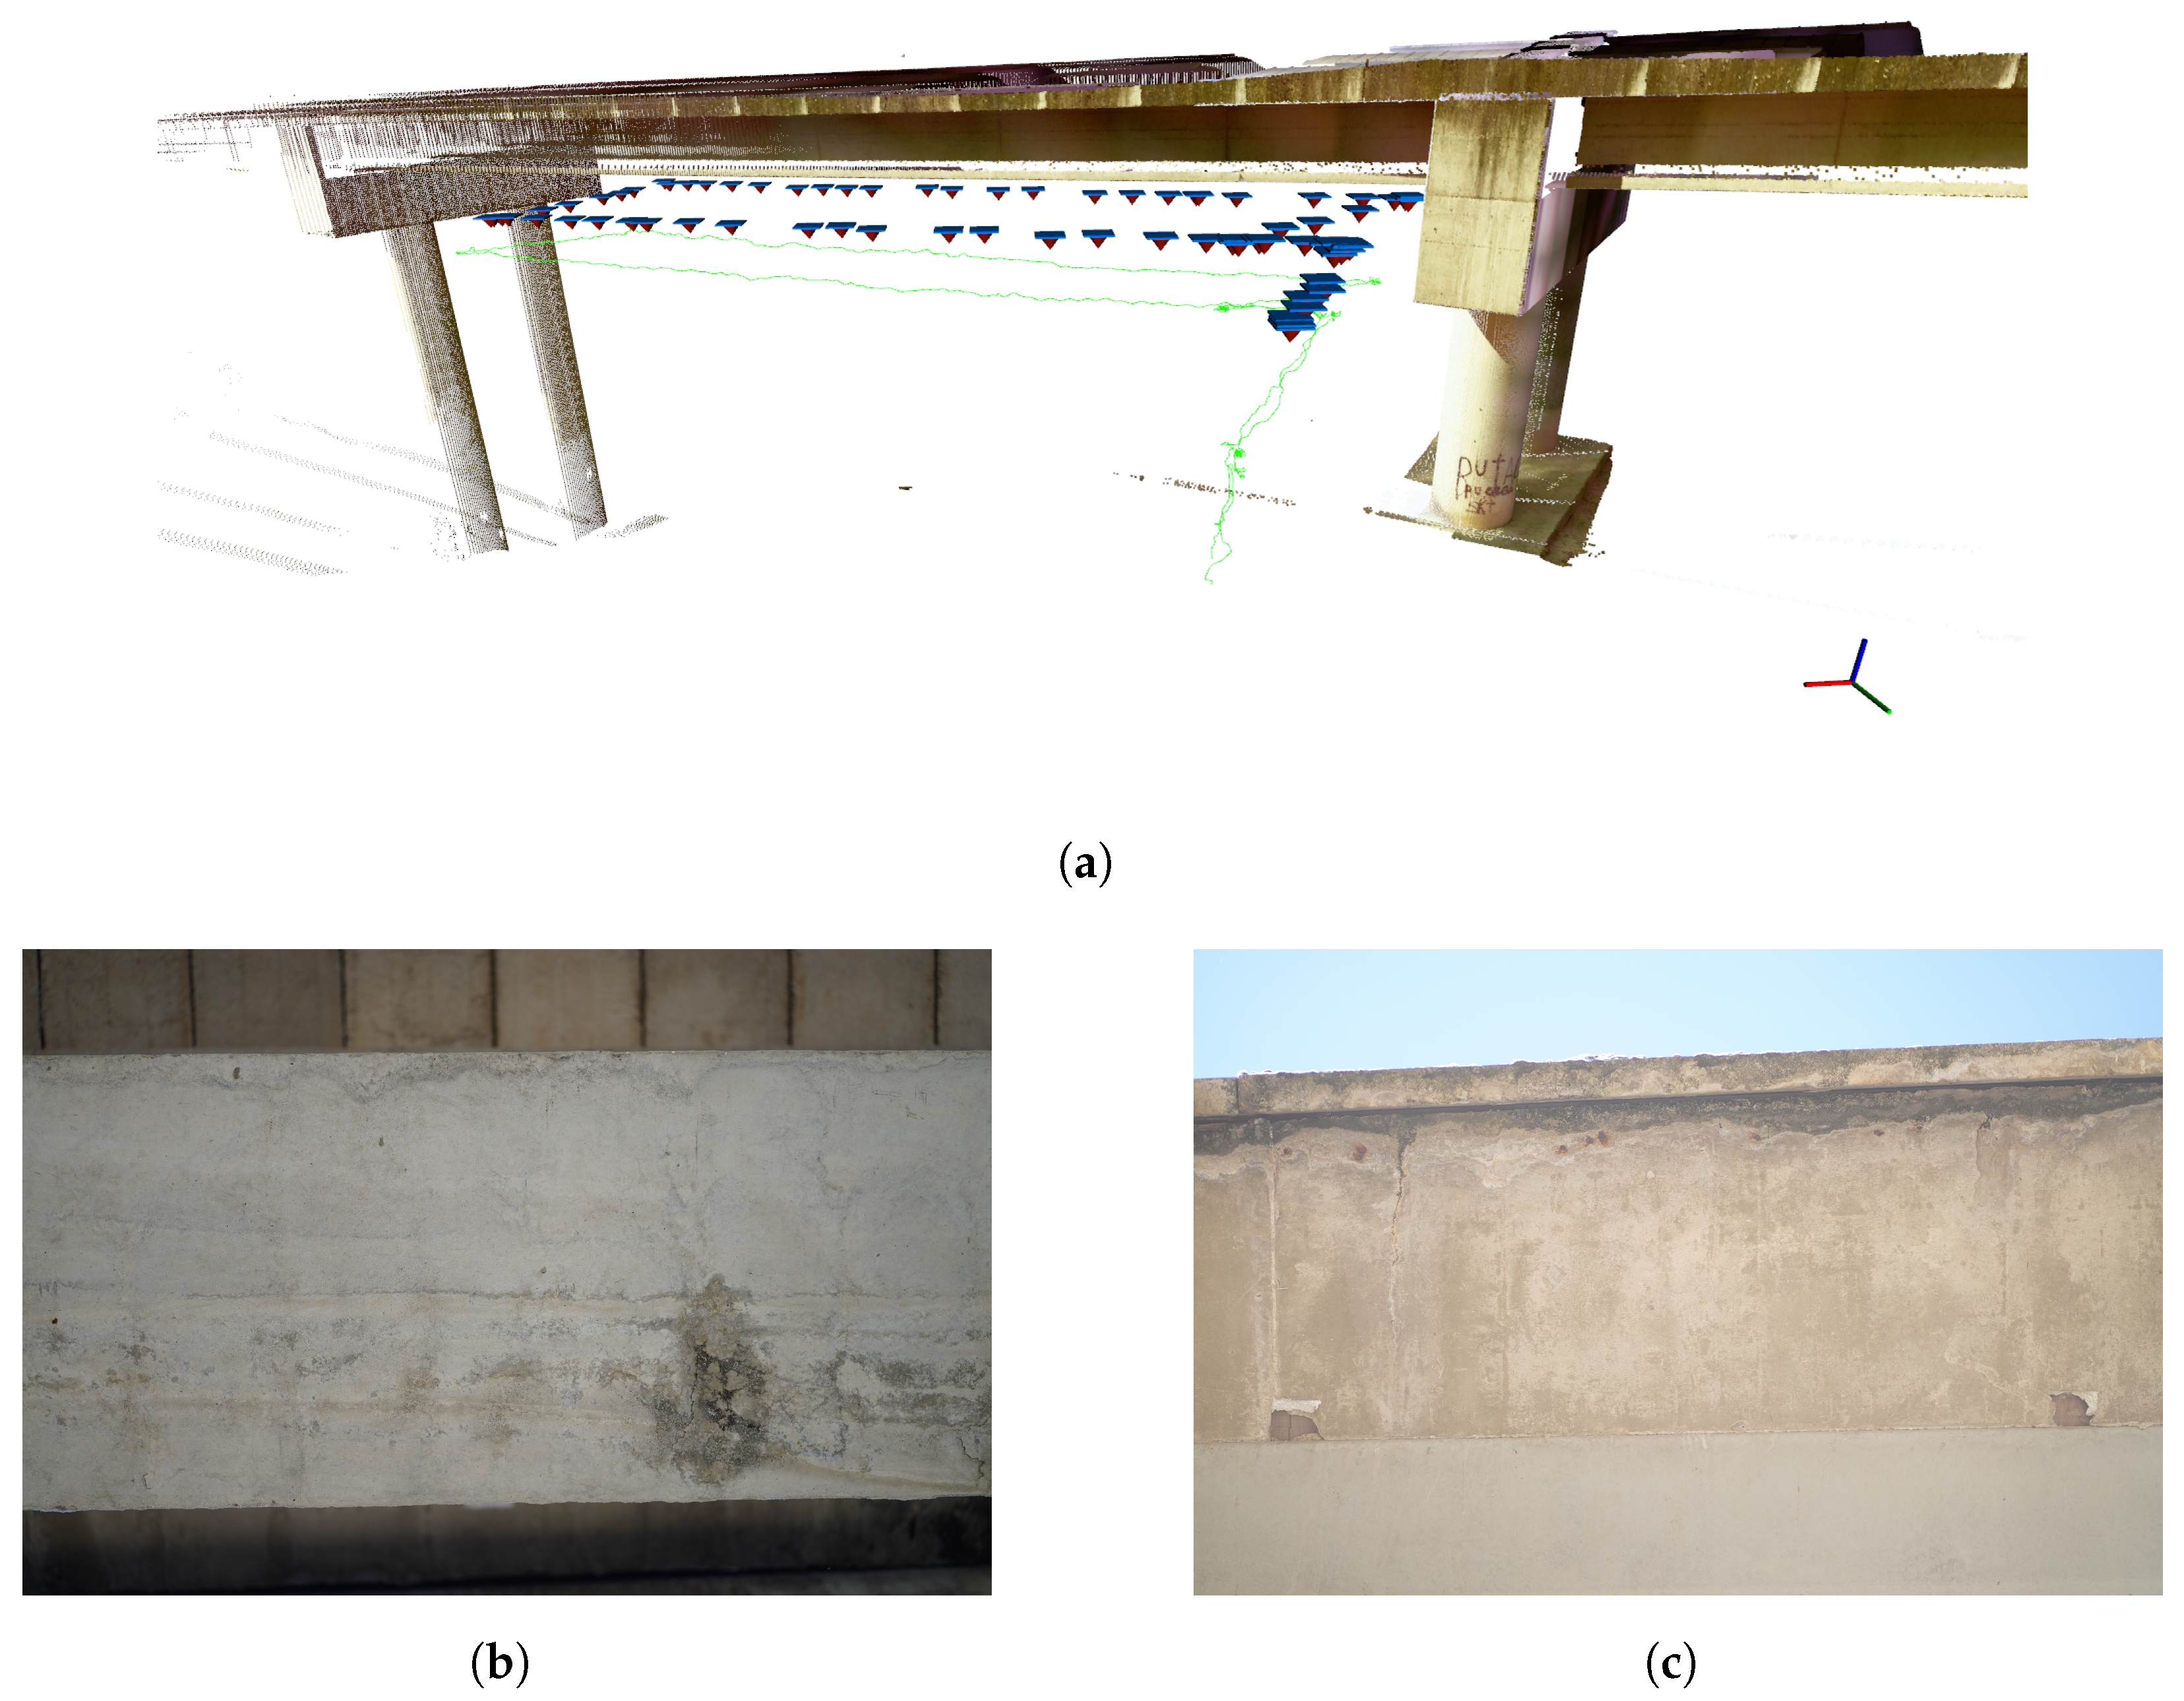
Figure 12 illustrates one of the experiments performed. Specifically, it refers to Algodonales sequence 2, where a flight was performed under the viaduct deck, along the external part of the viaduct. Each vertical arrow indicates the pose of the camera for each acquired image. The green line represents the trajectory of the AERO-CAM.
The pictures shown in
Figure 12b,c show an example of the visual information obtained with the AERO-CAM. Both pictures show different parts of the lower part of the viaduct deck, which is a difficult area to access.
Figure 12b focuses on one of the cross beams, while picture
Figure 12c shows the outer side of the deck. As explained above, the quality and level of detail of these pictures depend on the choice and configuration of the camera as well as the distance to the structure configured in the mission. In this case, an 85 mm lens has been used with a distance to the structure of about 2 m. This results in pictures with a resolution of 9504 × 6336 pixels in which the detail density per pixel is very high.
The distribution of the pictures along the structure is also crucial for a possible later analysis by performing a reconstruction of the structure through photogrammetry. All pictures have enough overlap between them to make this possible. The overlap is not only beneficial for possible photogrammetry but also allows the same point to be analyzed from different pictures, adding more redundancy and information to the system.
5. Conclusions
This work demonstrates that it is possible to perform an inspection of a viaduct with aerial robots as an alternative to current methodologies, saving time and cost and improving the safety and quality of data obtained. The design and development of the AERO-CAM and AeroX inspection platforms was quite successful, since together they cover the sensor needs of a viaduct: either looking for possible defects or analyzing existing ones.
In addition, the provision of autonomous capabilities to the platforms, especially to the AERO-CAM, greatly facilitates the work and provides more flexibility than conventional methods. These capabilities also reduce the number of specialized people needed to operate these platforms, thus improving their safety and speed of use.
Thanks to the choice of a LIDAR-type sensor for the autonomous capabilities of the AERO-CAM, the platform is fully versatile to operate in variable lighting situations, either due to weather conditions or to possible shadows and lighting changes that may be caused by the viaducts themselves. In addition, the system does not rely on a total station for the flight of the robotic platforms. Likewise, the camera installed in its gimbal can be configured to adapt to the different level of detail required or even be replaced by another one without having to redesign the platform.
As future developments, although the localization presented in this article provides good and sufficient results in terms of accuracy and calculation speed, the AERO-CAM does not consider taking off autonomously from areas where its LIDAR cannot see the structure, as the global localization would fail. This means that, until the system is able to locate itself, the pilot has to fly the UAV to the viaduct. Therefore, other strategies can be developed to complement the localization system to overcome these edge cases.
On the other hand, another line of work is the inclusion of a detect and avoid system to provide the AERO-CAM with more advanced intelligent capabilities when executing missions. Currently, the system relies on the fact that the mission designed by the inspector is free of obstacles and the waypoints keep a safe distance from the viaduct, but it could make use of the LIDAR readings to detect potential hazards on the route and re-plan it in real time.
Author Contributions
Conceptualization, R.C., M.Á.T., F.J.P.-G., A.V. and A.O.; Investigation, R.C., J.P., M.Á.T. and F.J.P.-G.; Methodology, R.C.; Software, R.C. and J.P.; Validation, R.C. and J.P.; Project administration, M.Á.T., F.J.P.-G., A.V. and A.O.; writing—original draft preparation, R.C.; writing—review and editing, R.C., J.P., M.Á.T., F.J.P.-G., A.V. and A.O. All authors have read and agreed to the published version of the manuscript.
Funding
This work was funded by the RESIST (H2020-2019-769066) and PILOTING (H2020-2020-871542) projects funded by the European Commission.
Institutional Review Board Statement
Not applicable.
Informed Consent Statement
Not applicable.
Data Availability Statement
The data presented in this study are available on request from the corresponding author. The data are not publicly available yet due to ongoing private work.
Acknowledgments
Authors would like to thank David Tejero for his support in the development of the global localization algorithm, Jorge Mariscal for his review of this article and the interesting discussions, and the GRVC from the University of Seville for collaborating with their total station. In addition, the authors would like to thank Ferrovial for allowing and providing access to infrastructure for the experimentation phase.
Conflicts of Interest
The authors declare no conflict of interest.
Abbreviations
The following abbreviations are used in this manuscript:
| APE | Absolute Pose Error |
| DoF | Degree of Freedom |
| ENU | East North Up |
| FPFH | Fast Point Feature Histogram |
| GNSS | Global Navigation Satellite System |
| GPS | Global Positioning System |
| ICP | Iterative Closest Point |
| IMU | Inertial Measurement Unit |
| LIDAR | Light Detection and Ranging |
| MDPI | Multidisciplinary Digital Publishing Institute |
| MSE | Mean Squared Error |
| RANSAC | Random Sample Consensus |
| RMCP | Robotic Mobile Contact Platform |
| RMSE | Root Mean Square Error |
| RPE | Relative Pose Error |
| UAV | Unmanned Aerial Vehicle |
| UT | Ultrasonic Testing |
References
- Ayres Associates, Inc. Bridge Inspection with Rope Access. Available online: https://www.ayresassociates.com/project/eagle-canyon-bridge-inspection (accessed on 26 August 2021).
- Forsgren Associates, Inc. Viaduct Inspection with a Crane. Available online: https://www.forsgren.com/bridge-management-services-inspections (accessed on 14 July 2021).
- Saini, A.; Singh, D. DroneRTEF: Development of a novel adaptive framework for railroad track extraction in drone images. Pattern Anal. Appl. 2021, 1–20. [Google Scholar] [CrossRef]
- Erenoglu, O. UAV for 3D Morphological Mapping Applications: A Case Study of Koru Mining Site, Canakkale, NW Turkey. Teh. Vjesn. 2021, 28, 1044–1050. [Google Scholar] [CrossRef]
- Khadka, A.; Afshar, A.; Zadeh, M. Strain monitoring of wind turbines using a semi-autonomous drone. Wind. Eng. 2021, 1–12. [Google Scholar] [CrossRef]
- Chen, K.; Reichard, G.; Xu, X.; Akanmu, A. Automated crack segmentation in close-range building façade inspection images using deep learning techniques. J. Build. Eng. 2021, 43, 102913. [Google Scholar] [CrossRef]
- Popescu, C.; Mirzazade, A.; Ohlsson, U.; Sas, G. Bridge Inspections Using Unmanned Aerial Vehicles—A Case Study in Sweden; Luleå Tekniska Universitet: Luleå, Sweden, 2021. [Google Scholar]
- MacGougan, G.; Lachapelle, G.; Nayak, R.; Wang, A. Overview of GNSS signal degradation phenomena. In Proceedings of the International Symposium Kinematic Systems and Geodesy, Geomatics and Navigation, Banff, AB, Canada, 5–8 June 2001. [Google Scholar]
- Skydio Inc. Available online: https://www.skydio.com/inspection (accessed on 29 July 2021).
- Jimenez-Cano, A.E.; Braga, J.; Heredia, G.; Ollero, A. Aerial manipulator for structure inspection by contact from the underside. IEEE Int. Conf. Intell. Robot. Syst. 2015, 2015, 1879–1884. [Google Scholar] [CrossRef]
- Suarez, A.; Heredia, G.; Ollero, A. Lightweight compliant arm with compliant finger for aerial manipulation and inspection. IEEE Int. Conf. Intell. Robot. Syst. 2016, 2016, 4449–4454. [Google Scholar] [CrossRef] [Green Version]
- Trujillo, M.; Martínez-De Dios, J.; Martín, C.; Viguria, A.; Ollero, A. Novel aerial manipulator for accurate and robust industrial NDT contact inspection: A new tool for the oil and gas inspection industry. Sensors 2019, 19, 1305. [Google Scholar] [CrossRef] [PubMed] [Green Version]
- Trujillo, M.A.; Viguria, A.; Marquez, J.C.; Petrus, A.L.; Jimenez, A.; Garcia, J.J.; Ollero, A. Aeronave con Dispositivo de Contacto. EU Patent ES2614994A1, 2 March 2018. [Google Scholar]
- EU Innovation Radar Prize. Available online: https://www.innoradar.eu/innoradarprize (accessed on 28 July 2021).
- Kocer, B.B.; Tjahjowidodo, T.; Pratama, M.; Seet, G.G.L. Inspection-while-flying: An autonomous contact-based nondestructive test using UAV-tools. Autom. Constr. 2019, 106, 102895. [Google Scholar] [CrossRef]
- Sanchez-Cuevas, P.J.; Ramon-Soria, P.; Arrue, B.; Ollero, A.; Heredia, G. Robotic system for inspection by contact of bridge beams using UAVs. Sensors 2019, 19, 305. [Google Scholar] [CrossRef] [Green Version]
- Kamel, M.; Alexis, K.; Siegwart, R. Design and modeling of dexterous aerial manipulator. IEEE Int. Conf. Intell. Robot. Syst. 2016, 2016, 4870–4876. [Google Scholar] [CrossRef]
- Park, S.; Her, J.; Kim, J.; Lee, D. Design, modeling and control of omni-directional aerial robot. IEEE Int. Conf. Intell. Robot. Syst. 2016, 2016, 1570–1575. [Google Scholar] [CrossRef]
- Papachristos, C.; Alexis, K.; Tzes, A. Efficient force exertion for aerial robotic manipulation: Exploiting the thrust-vectoring authority of a tri-tiltrotor UAV. In Proceedings of the IEEE International Conference on Robotics and Automation, Hong Kong, China, 31 May–7 June 2014; pp. 4500–4505. [Google Scholar] [CrossRef]
- Darivianakis, G.; Alexis, K.; Burri, M.; Siegwart, R. Hybrid predictive control for aerial robotic physical interaction towards inspection operations. In Proceedings of the IEEE International Conference on Robotics and Automation, Hong Kong, China, 31 May–7 June 2014; pp. 53–58. [Google Scholar] [CrossRef] [Green Version]
- González-deSantos, L.M.; Martínez-Sánchez, J.; González-Jorge, H.; Navarro-Medina, F.; Arias, P. UAV payload with collision mitigation for contact inspection. Autom. Constr. 2020, 115, 103200. [Google Scholar] [CrossRef]
- Gioioso, G.; Ryll, M.; Prattichizzo, D.; Bulthoff, H.H.; Franchi, A. Turning a near-hovering controlled quadrotor into a 3D force effector. In Proceedings of the IEEE International Conference on Robotics and Automation, Hong Kong, China, 31 May–7 June 2014; pp. 6278–6284. [Google Scholar] [CrossRef] [Green Version]
- Delgado, J.P.; Soria, P.R.; Arrue, B.C.; Ollero, A. Bridge Mapping for Inspection Using an UAV Assisted by a Total Station. Adv. Intell. Syst. Comput. 2017, 694, 309–319. [Google Scholar] [CrossRef] [Green Version]
- Qin, T.; Li, P.; Shen, S. VINS-Mono: A Robust and Versatile Monocular Visual-Inertial State Estimator. IEEE Trans. Robot. 2018, 34, 1004–1020. [Google Scholar] [CrossRef] [Green Version]
- Campos, C.; Elvira, R.; Rodríguez, J.J.; Montiel, J.M.; Tardós, J.D. ORB-SLAM3: An Accurate Open-Source Library for Visual, Visual—Inertial, and Multimap SLAM. IEEE Trans. Robot. 2021. [Google Scholar] [CrossRef]
- Zhang, J.; Singh, S. LOAM: Lidar Odometry and Mapping in Real-time. In Proceedings of the Robotics: Science and Systems, Berkeley, CA, USA, 12–16 July 2014. [Google Scholar]
- Milijas, R.; Markovic, L.; Ivanovic, A.; Petric, F.; Bogdan, S. A Comparison of LiDAR-based SLAM Systems for Control of Unmanned Aerial Vehicles. In Proceedings of the 2021 International Conference on Unmanned Aircraft Systems (ICUAS), Athens, Greece, 15–18 June 2021; pp. 1148–1154. [Google Scholar] [CrossRef]
- Mundt, M.; Majumder, S.; Murali, S.; Panetsos, P.; Ramesh, V. Meta-learning Convolutional Neural Architectures for Multi-target Concrete Defect Classification with the COncrete DEfect BRidge IMage Dataset. Proc. IEEE Comput. Soc. Conf. Comput. Vis. Pattern Recognit. 2019, 2019, 11188–11197. [Google Scholar]
- Chow, J.K.; Su, Z.; Wu, J.; Tan, P.S.; Mao, X.; Wang, Y.H. Anomaly detection of defects on concrete structures with the convolutional autoencoder. Adv. Eng. Inform. 2020, 45, 101105. [Google Scholar] [CrossRef]
- Gremsy T3-Gremsy. Available online: https://gremsy.com/products/gremsy-t3v3 (accessed on 15 June 2021).
- Sony Alpha 7. Available online: https://www.sony.es/electronics/camaras-lentes-intercambiables/ilce-7-body-kit (accessed on 16 July 2021).
- Sony-Camera Remote SDK. Available online: https://support.d-imaging.sony.co.jp/app/sdk/en/index.html (accessed on 15 June 2021).
- Ouster OS0-128. Available online: https://ouster.com/products/os0-lidar-sensor/ (accessed on 15 June 2021).
- Rusu, R.B.; Blodow, N.; Beetz, M. Fast Point Feature Histograms (FPFH) for 3D Registration; Institute of Electrical and Electronics Engineers (IEEE): Piscataway, NJ, USA, 2009; pp. 3212–3217. [Google Scholar] [CrossRef]
- Shan, T.; Englot, B.; Meyers, D.; Wang, W.; Ratti, C.; Rus, D. LIO-SAM: Tightly-coupled lidar inertial odometry via smoothing and mapping. In Proceedings of the IEEE International Conference on Intelligent Robots and Systems, Las Vegas, NA, USA, 25–29 October 2020; pp. 5135–5142. [Google Scholar] [CrossRef]
- Kaess, M.; Johannsson, H.; Roberts, R.; Ila, V.; Leonard, J.J.; Dellaert, F. ISAM2: Incremental smoothing and mapping using the Bayes tree. Int. J. Robot. Res. 2012, 31, 216–235. [Google Scholar] [CrossRef]
- Forster, C.; Carlone, L.; Dellaert, F.; Scaramuzza, D. On-Manifold Preintegration for Real-Time Visual-Inertial Odometry. IEEE Trans. Robot. 2015, 33, 1–21. [Google Scholar] [CrossRef] [Green Version]
- Umeyama, S. Least-Squares Estimation of Transformation Parameters between Two Point Patterns. IEEE Trans. Pattern Anal. Mach. Intell. 1991, 13, 376–380. [Google Scholar] [CrossRef] [Green Version]
- Grupp, M. Evo: Python Package for the Evaluation of Odometry and SLAM. 2017. Available online: https://github.com/MichaelGrupp/evo (accessed on 14 July 2021).
Figure 1.
Examples of current inspection methodologies. (
a) Current method for the viaduct inspection with rope access, from Ayres Associates, Inc. [
1]. (
b) Current method for the viaduct inspection using specialized machinery, from Forsgren Associates, Inc. [
2]. (
c) Proposed new methodology using the flight platform AERO-CAM in Álora, Málaga (Spain) performing an inspection under a viaduct deck.
Figure 2.
General viaduct inspection workflow.
Figure 2.
General viaduct inspection workflow.
Figure 3.
AERO-CAM robot for visual inspection UAV.
Figure 3.
AERO-CAM robot for visual inspection UAV.
Figure 4.
AERO-CAM general software architecture.
Figure 4.
AERO-CAM general software architecture.
Figure 5.
AeroX robot for contact inspection.
Figure 5.
AeroX robot for contact inspection.
Figure 6.
Full transformation system.
Figure 6.
Full transformation system.
Figure 7.
Global localization algorithm.
Figure 7.
Global localization algorithm.
Figure 8.
LIO-SAM adapted architecture.
Figure 8.
LIO-SAM adapted architecture.
Figure 9.
LIO-SAM adapted factor graph.
Figure 9.
LIO-SAM adapted factor graph.
Figure 10.
Examples of trajectories followed from take-off to landing. The maneuvers were performed under a deck of the Algodonales and Álora viaducts. The graphs on the left illustrate X-Y, center X-Z and right X-Y-Z. (a) Alora sequence 5, (b) Alora sequence 7, (c) Algodonales sequence 3, (d) Algodonales sequence 4.
Figure 11.
Global localization examples at take-off. Red points are the LIDAR reading. (a) Algodonales, (b) Álora.
Figure 11.
Global localization examples at take-off. Red points are the LIDAR reading. (a) Algodonales, (b) Álora.
Figure 12.
Algodonales sequence 2 inspection result. (a) shows the 3D model with the followed route (green) and the location of the acquired pictures (blue planes). (b,c) show two examples of the acquired pictures.
Figure 12.
Algodonales sequence 2 inspection result. (a) shows the 3D model with the followed route (green) and the location of the acquired pictures (blue planes). (b,c) show two examples of the acquired pictures.
Table 1.
Algodonales global localization metrics.
Table 1.
Algodonales global localization metrics.
| Seq | ICP1 | ICP2 | ICP3 |
|---|
| Prop. Corr. | MSE | Prop. Corr. | MSE | Prop. Corr. | MSE |
|---|
| take-off_0 | * | * | 0.38 | 0.1551 | 0.34 | 0.0252 |
| middle_0 | * | * | 0.45 | 0.3004 | 0.33 | 0.0354 |
| ending_0 | * | * | 0.58 | 0.2141 | 0.56 | 0.0230 |
Table 2.
Álora global localization metrics.
Table 2.
Álora global localization metrics.
| Seq | ICP1 | ICP2 | ICP3 |
|---|
| Prop. Corr. | MSE | Prop. Corr. | MSE | Prop. Corr. | MSE |
|---|
| take-off_0 | 0.98 | 0.0615 | 0.98 | 0.0328 | 0.96 | 0.0051 |
| take-off_1 | 0.97 | 0.0060 | 0.97 | 0.0060 | 0.97 | 0.0044 |
| beginning_0 | * | * | 0.83 | 0.0370 | 0.86 | 0.0082 |
| middle_0 | * | * | 0.73 | 0.0312 | 0.73 | 0.0087 |
| ending_0 | * | * | 0.65 | 0.0283 | 0.65 | 0.0107 |
Table 3.
Comparative table between the ground truth obtained by the total station and the output of the global location algorithm for the Algodonales viaduct.
Table 3.
Comparative table between the ground truth obtained by the total station and the output of the global location algorithm for the Algodonales viaduct.
| Seq | Ground Truth [m] | Algorithm Estimation [m] | Distance [m] |
|---|
| x | y | z | x | y | z | Δx | Δy | Δz | Total |
|---|
| take-off_0 | −9.30 | −27.64 | 0.51 | −9.20 | −27.59 | 0.34 | −0.10 | −0.05 | 0.17 | 0.20 |
| middle_0 | −0.29 | −27.75 | 2.29 | −0.38 | −27.63 | 2.12 | 0.09 | −0.12 | 0.17 | 0.23 |
| ending_0 | 14.73 | −31.02 | 2.39 | 14.70 | −31.18 | 2.27 | 0.03 | 0.16 | 0.12 | 0.20 |
Table 4.
Comparative table between the ground truth obtained by the total station and the output of the global location algorithm for the Álora viaduct.
Table 4.
Comparative table between the ground truth obtained by the total station and the output of the global location algorithm for the Álora viaduct.
| Seq | Ground Truth [m] | Algorithm Estimation [m] | Distance [m] |
|---|
| x | y | z | x | y | z | Δx | Δy | Δz | Total |
|---|
| take-off_0 | −13.99 | −5.20 | 2.92 | −14.10 | −5.35 | 2.37 | 0.11 | 0.15 | 0.55 | 0.58 |
| take-off_1 | −10.24 | −7.39 | 4.97 | −10.59 | −7.37 | 4.43 | 0.35 | −0.02 | 0.54 | 0.64 |
| beginning_0 | −5.19 | −7.75 | 5.13 | −5.46 | −7.87 | 4.72 | 0.27 | 0.12 | 0.41 | 0.51 |
| middle_0 | 4.62 | −9.74 | 5.59 | 4.60 | −9.78 | 5.10 | 0.02 | 0.04 | 0.49 | 0.49 |
| ending_0 | 23.45 | −20.41 | 5.24 | 23.37 | −20.35 | 4.76 | 0.08 | −0.06 | 0.48 | 0.49 |
Table 5.
Algodonales dataset description and localization errors.
Table 5.
Algodonales dataset description and localization errors.
| Seq | Description | APE [m] | RPE [m] ( m) |
|---|
| Dist [m] | Time [s] | Max | Mean | Std | RMSE | Max | Mean | Std | RMSE |
|---|
| seq0 | 175.65 | 376.7 | 0.49 | 0.11 | 0.07 | 0.13 | 1.1 | 0.25 | 0.2 | 0.32 |
| seq1 | 227.92 | 397.85 | 0.45 | 0.13 | 0.06 | 0.14 | 0.94 | 0.4 | 0.2 | 0.45 |
| seq2 | 182.02 | 419.7 | 0.36 | 0.12 | 0.05 | 0.13 | 1.0 | 0.54 | 0.27 | 0.61 |
| seq3 | 276.3 | 526.14 | 1.04 | 0.36 | 0.16 | 0.4 | 1.62 | 0.56 | 0.25 | 0.61 |
| seq4 | 251.91 | 515.85 | 0.52 | 0.12 | 0.06 | 0.14 | 0.99 | 0.54 | 0.23 | 0.59 |
Table 6.
Álora dataset description and localization errors.
Table 6.
Álora dataset description and localization errors.
| Seq | Description | APE [m] | RPE [m] ( m) |
|---|
| Dist [m] | Time [s] | Max | Mean | Std | RMSE | Max | Mean | Std | RMSE |
|---|
| seq0 | 93.18 | 260.52 | 0.44 | 0.12 | 0.08 | 0.14 | 0.49 | 0.16 | 0.1 | 0.19 |
| seq1 | 204.47 | 486.57 | 0.85 | 0.14 | 0.09 | 0.17 | 1.35 | 0.16 | 0.08 | 0.18 |
| seq2 | 119.83 | 334.97 | 0.38 | 0.12 | 0.06 | 0.13 | 0.35 | 0.13 | 0.06 | 0.14 |
| seq4 | 280.93 | 547.72 | 0.66 | 0.17 | 0.08 | 0.18 | 10.36 | 0.18 | 0.31 | 0.36 |
| seq5 | 324.76 | 644.37 | 0.73 | 0.16 | 0.09 | 0.18 | 0.48 | 0.17 | 0.11 | 0.2 |
| seq6 | 108.96 | 211.71 | 0.79 | 0.13 | 0.12 | 0.18 | 0.57 | 0.23 | 0.12 | 0.26 |
| seq7 | 113.4 | 160.51 | 0.75 | 0.18 | 0.13 | 0.22 | 0.69 | 0.25 | 0.11 | 0.27 |
| Publisher’s Note: MDPI stays neutral with regard to jurisdictional claims in published maps and institutional affiliations. |
© 2021 by the authors. Licensee MDPI, Basel, Switzerland. This article is an open access article distributed under the terms and conditions of the Creative Commons Attribution (CC BY) license (https://creativecommons.org/licenses/by/4.0/).


 ,
, 


