
Multi-Objective Optimization Model of Industrial Lubricants Based on Integer Nonlinear Programming


Abstract
:Featured Application
Abstract
1. Introduction
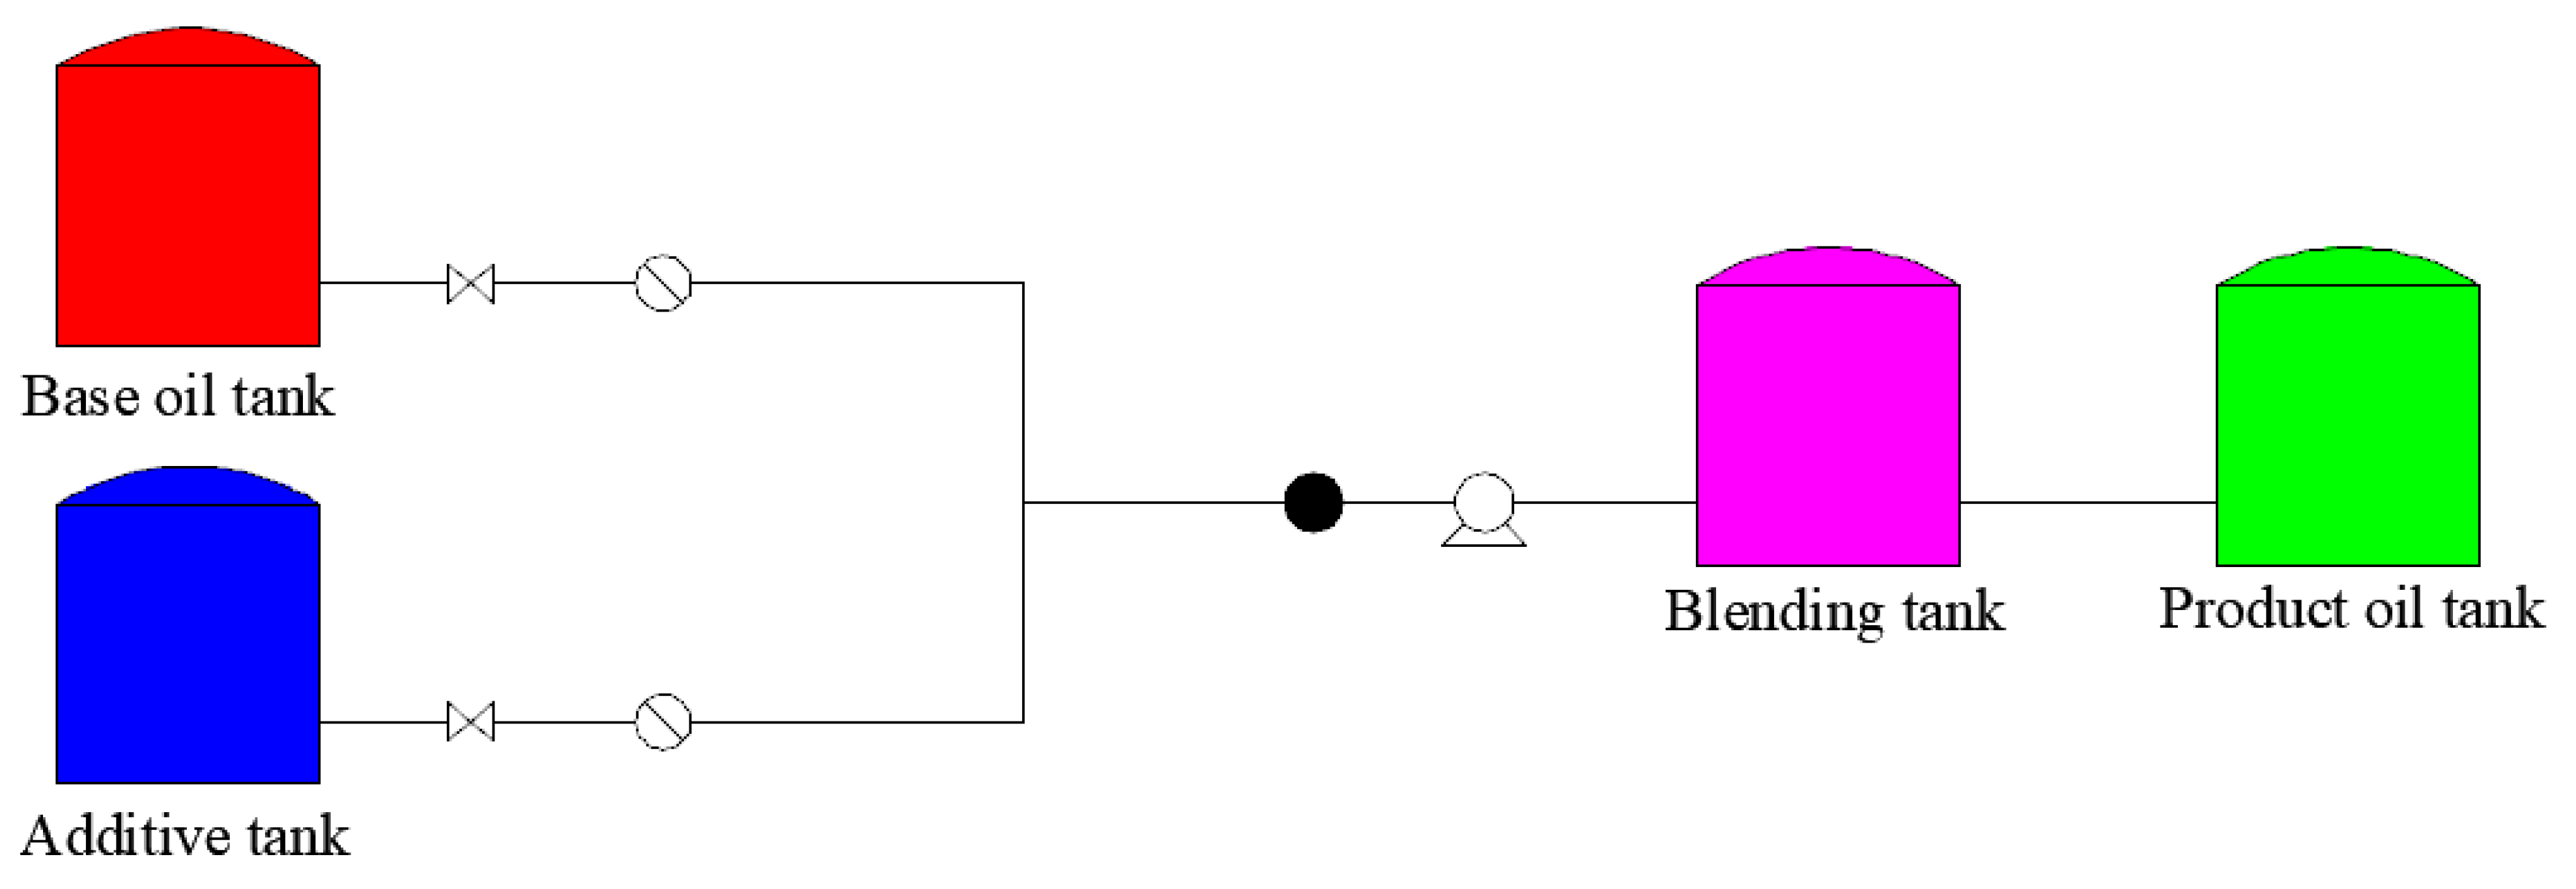
2. Data Processing and Blending Scheme
2.1. Data Processing
2.2. Blending Scheme
3. Establishment and Solution of the Model
3.1. Determination of Objective Function
3.2. Determination of Constraint Conditions
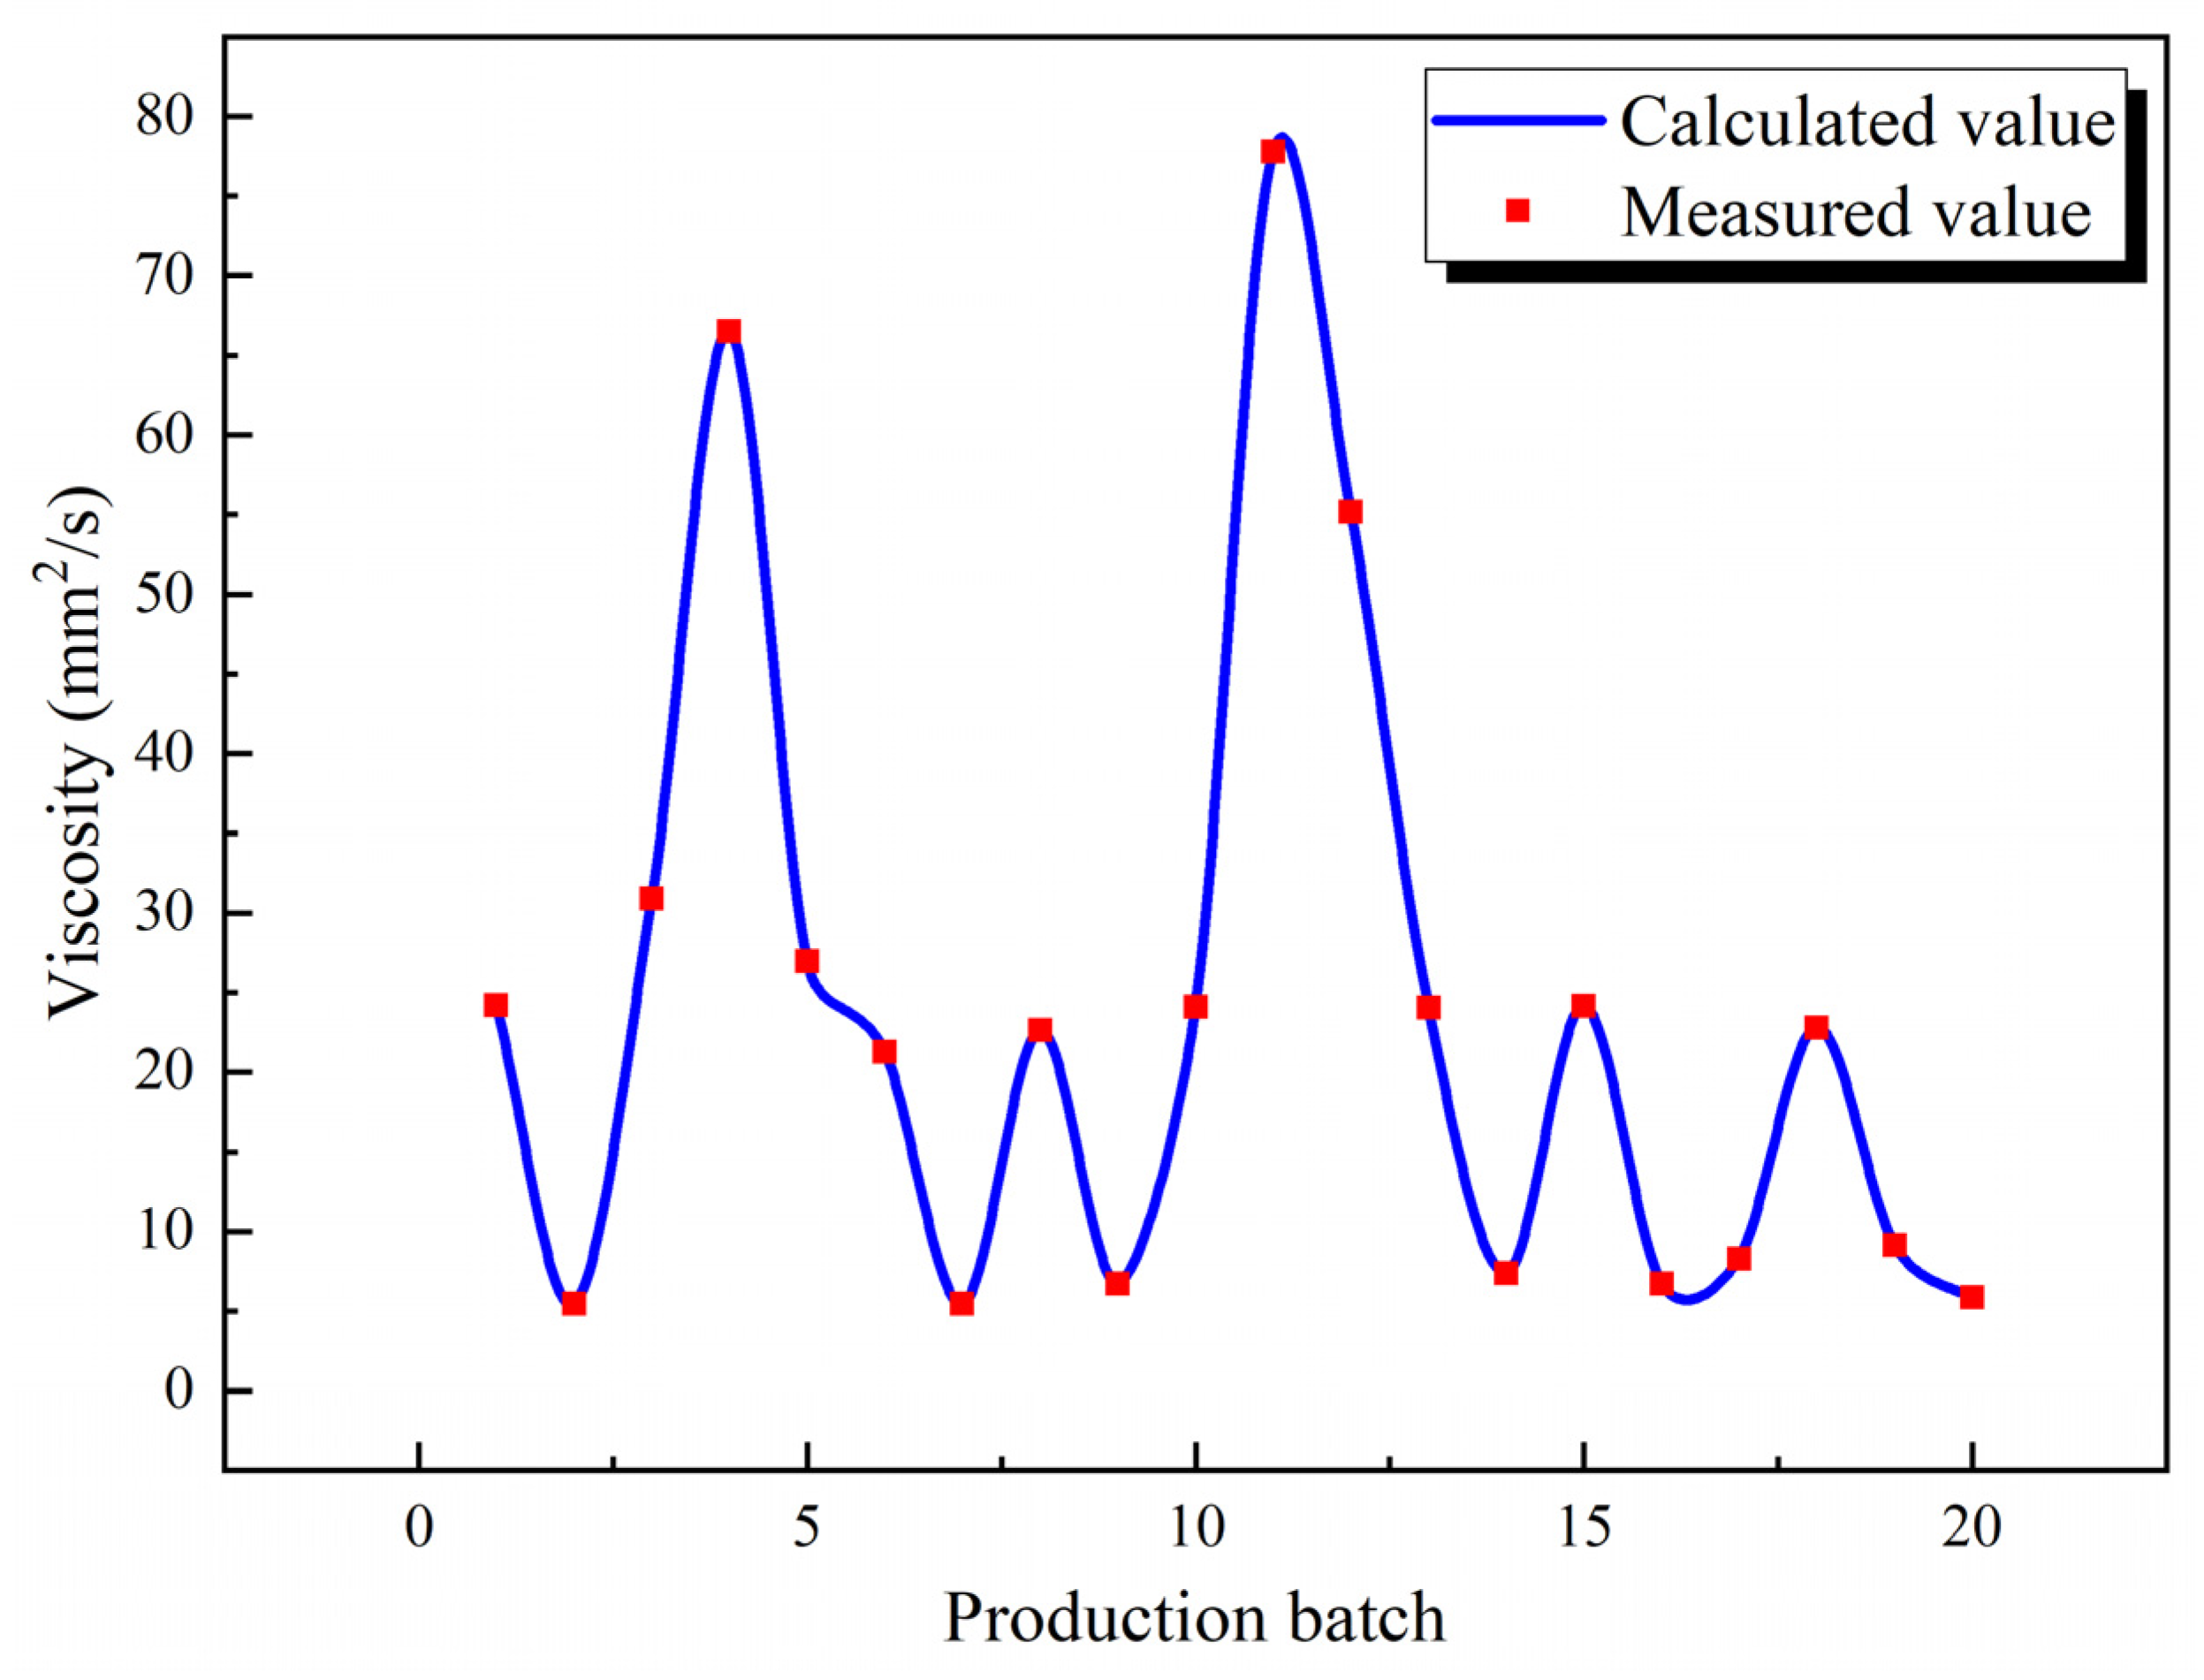
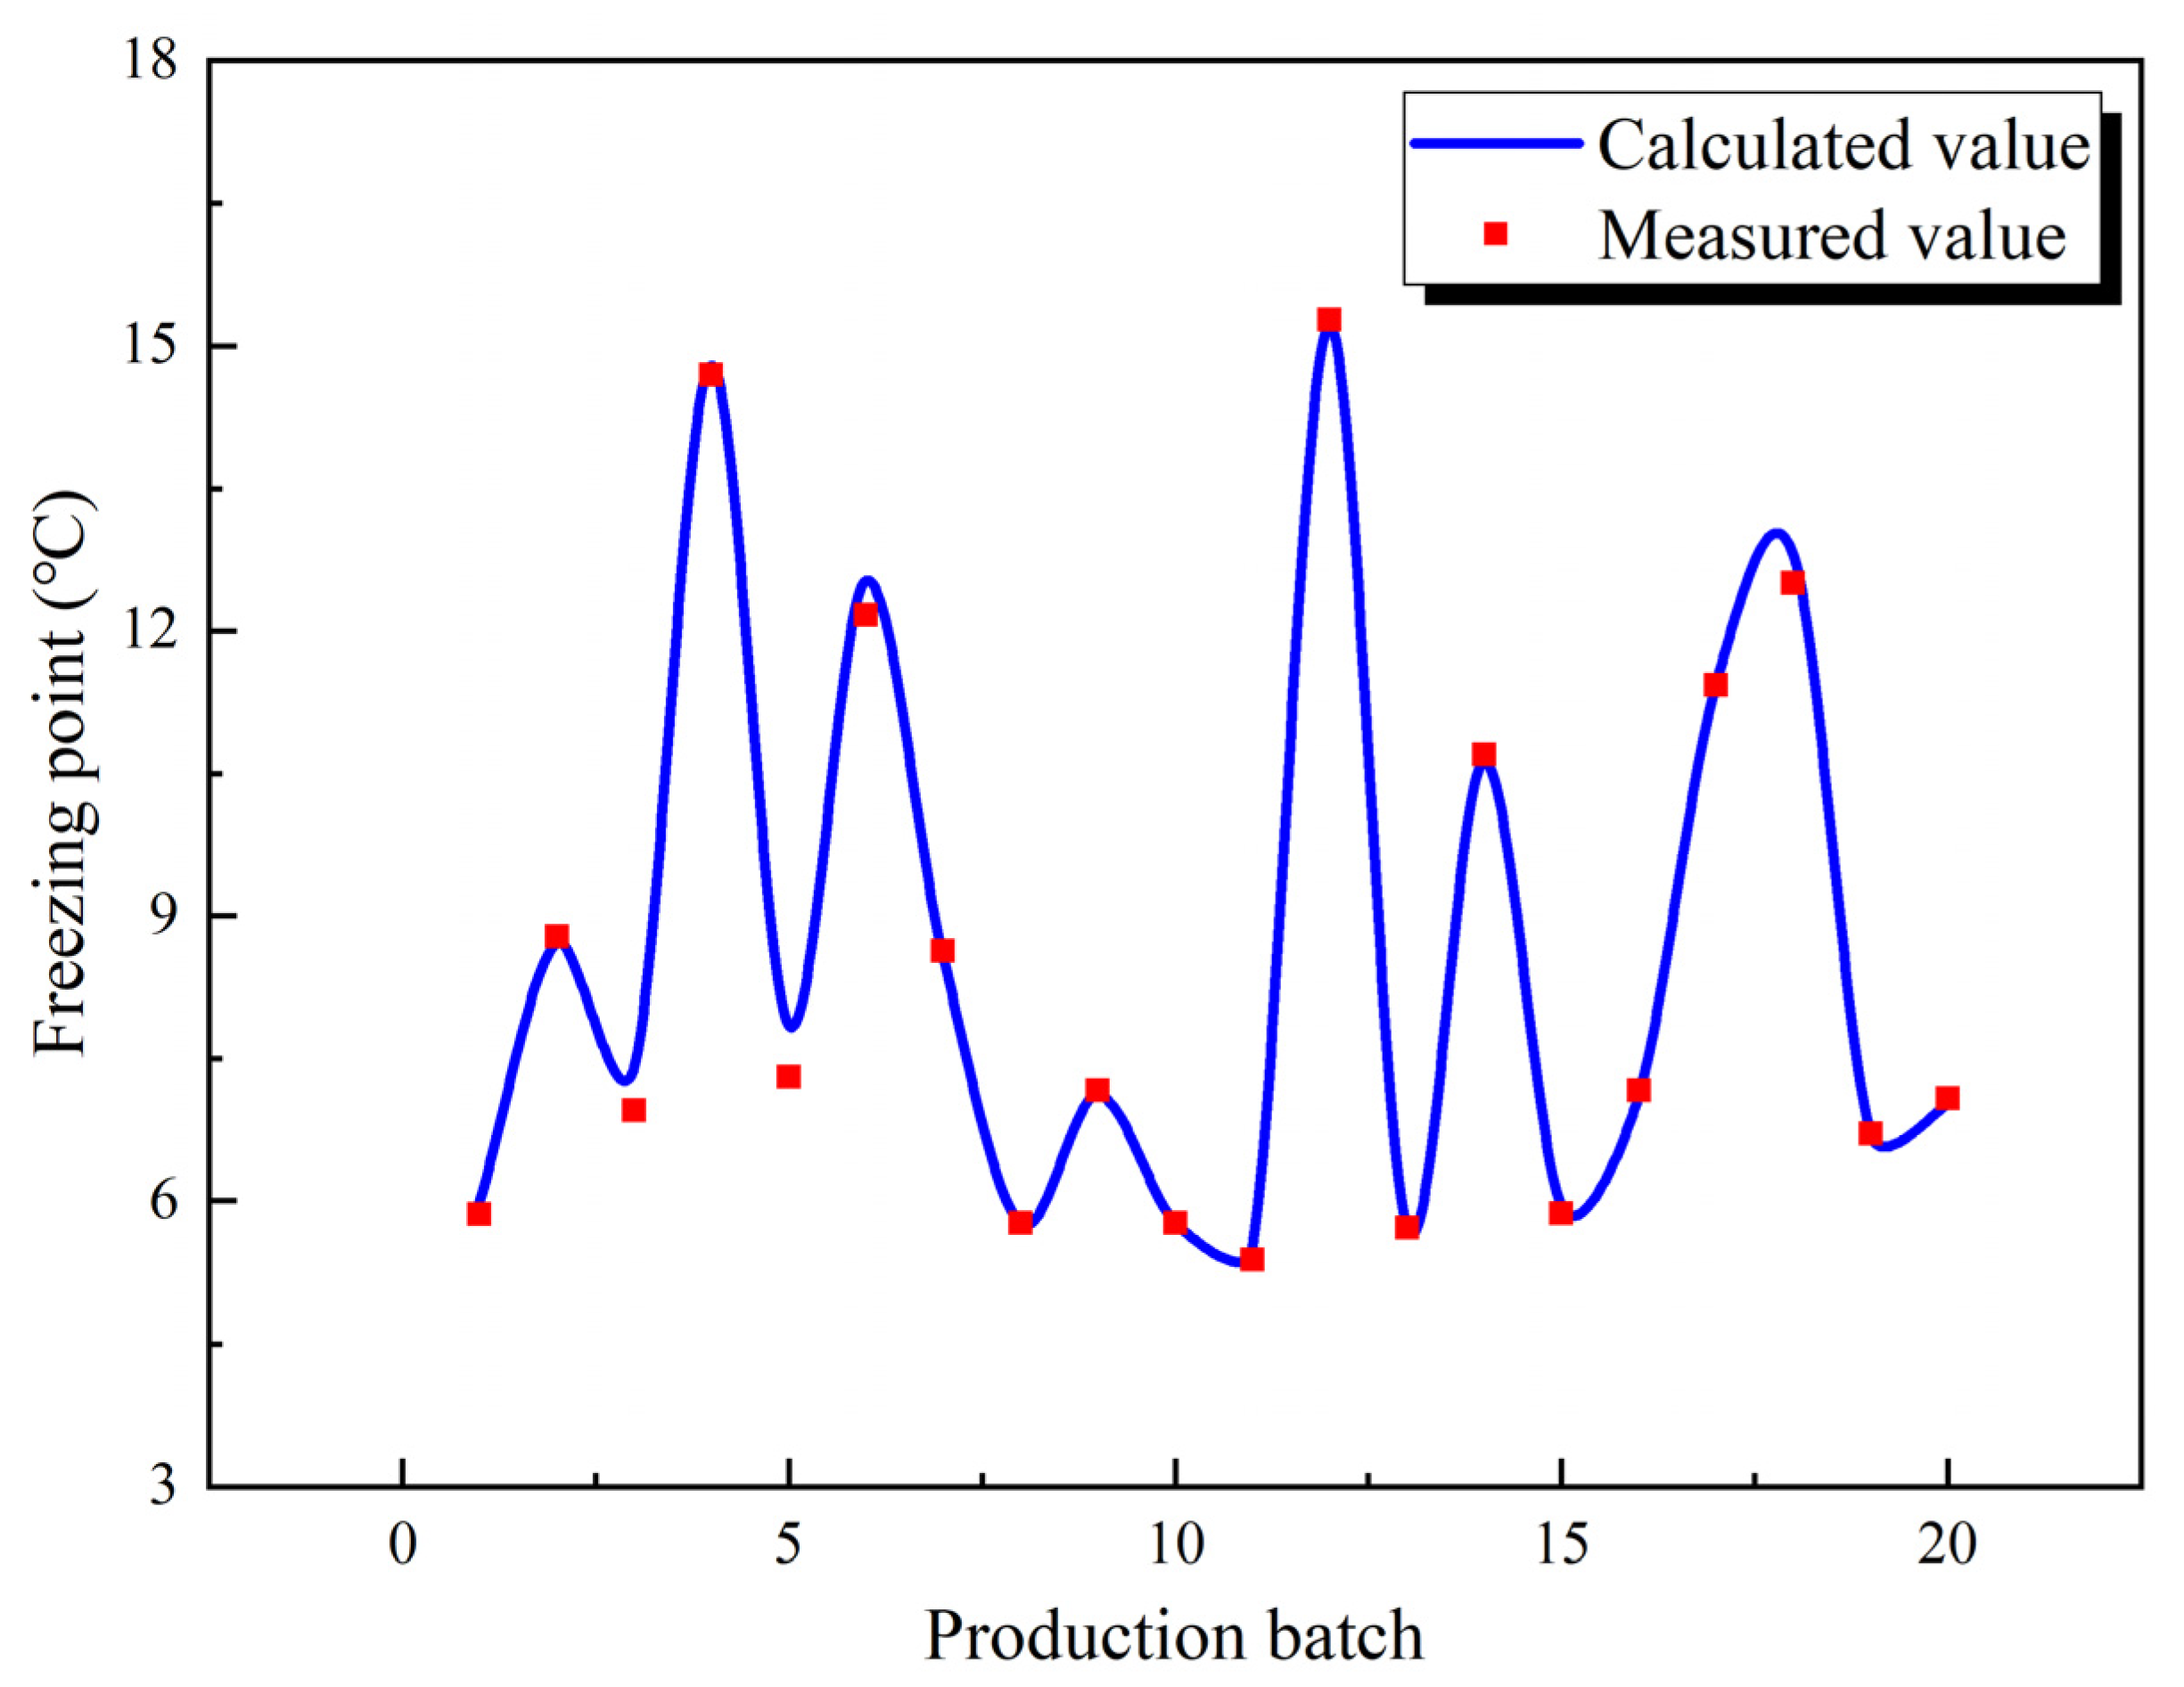
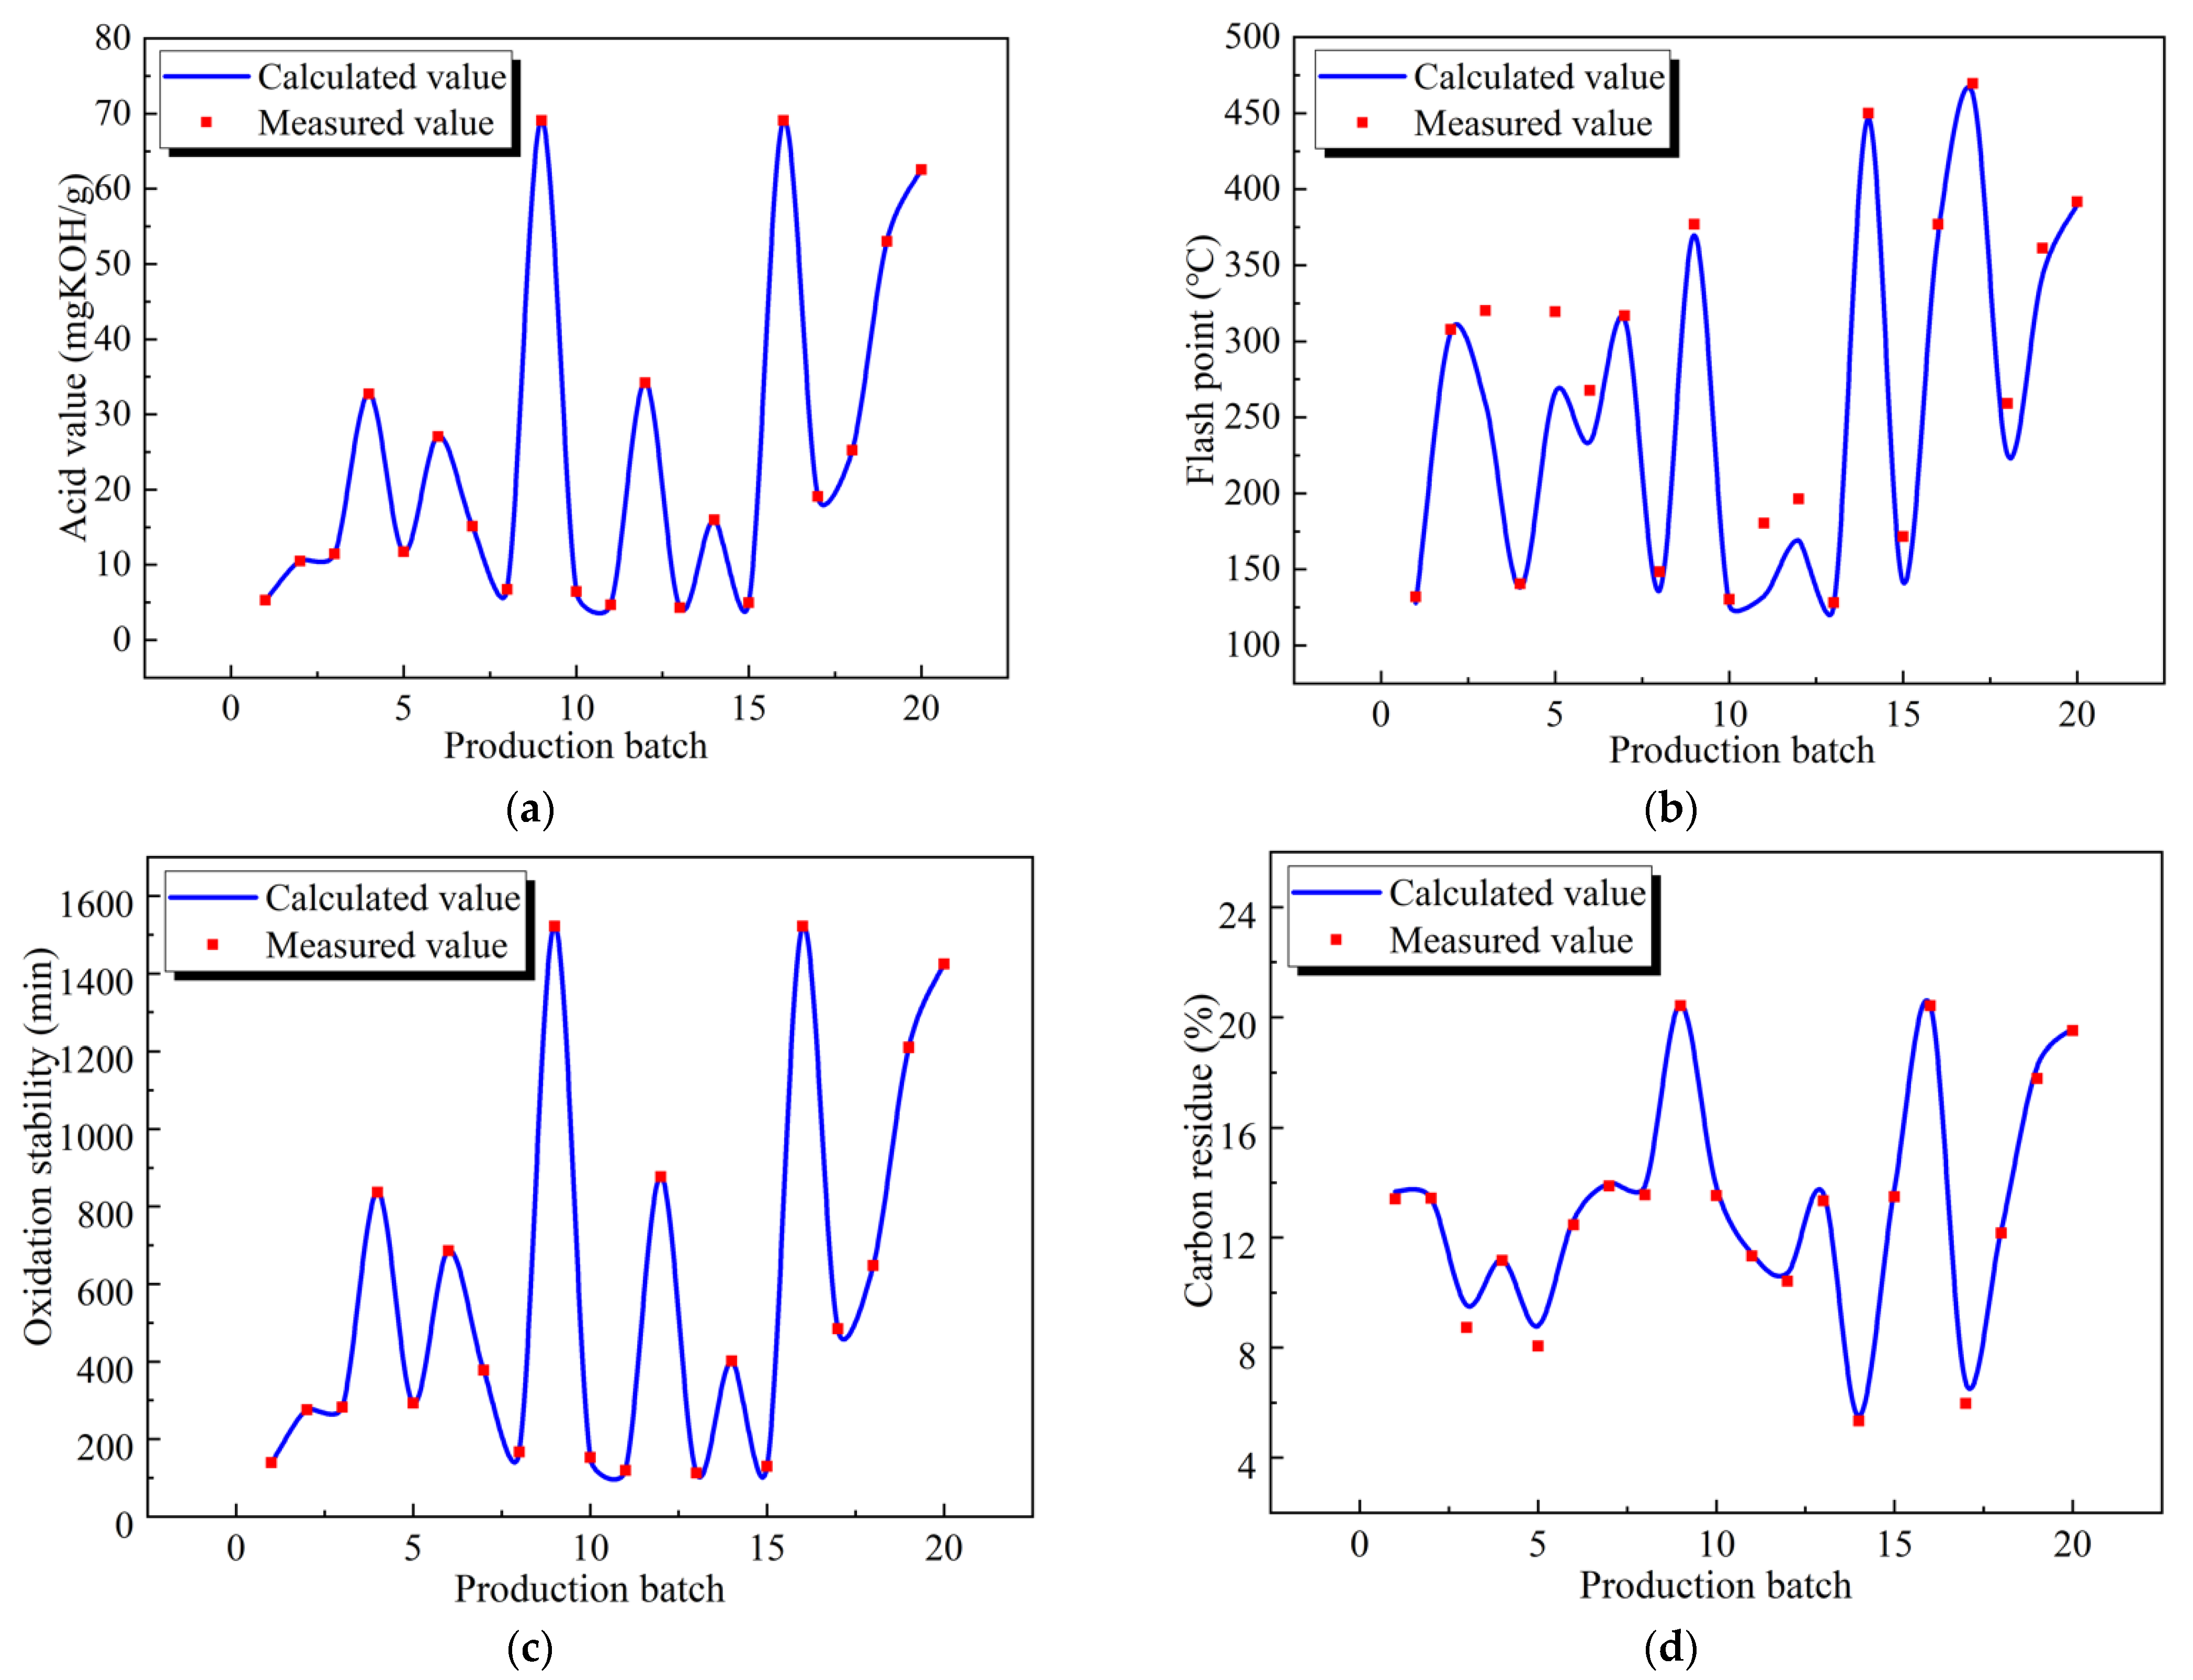
3.3. Solution and Analysis of Nonlinear Programming Model
4. Conclusions
- (a)
- The blending schemes of six performance indexes are proposed, which are simple in form and convenient in calculation. The calculated values are in good agreement with the measured values, and can well-predict the related indexes of blended oil.
- (b)
- A multi-objective optimization model of industrial lubricating oil based on integer nonlinear programming is established, which can be easily solved with good results.
- (c)
- The established multi-objective optimization model of industrial lubricating oil, combined with a certain amount of experimental data and production strategies, can be more accurately used to optimize the blending scheme of industrial lubricating oil.
Author Contributions
Funding
Institutional Review Board Statement
Informed Consent Statement
Data Availability Statement
Acknowledgments
Conflicts of Interest
References
- Wang, J.B.; Hu, W.J.; Li, J.S. Lubrication and anti-rust properties of jeffamine-triazole derivative as water-based lubricant additive. Coatings 2021, 11, 679. [Google Scholar] [CrossRef]
- Kim, S.H.; Lee, S.W.; Han, S.; Kim, S.M. Numerical investigation of thermal characteristics of spray cooling with minimum quantity lubrication in milling process. Appl. Math. Modell. 2018, 65, 137–147. [Google Scholar] [CrossRef]
- Luo, J.B.; Liu, S. The investigation of contact ratio in mixed lubrication. Tribol. Int. 2005, 39, 409–416. [Google Scholar] [CrossRef]
- Carolin, N.; Riikka, H.; Katriina, S. Selected fuel properties of alcohol and rapeseed oil blends. Energies 2020, 13, 3821. [Google Scholar]
- Yu, T.; Yin, P.; Zhang, W.; Song, Y.L.; Zhang, X. A compounding-model comprising back propagation neural network and genetic algorithm for performance prediction of bio-based lubricant blending with functional additives. Ind. Lubr. Tribol. 2021, 73, 246–252. [Google Scholar] [CrossRef]
- Murshed, S.M.; Estellé, P. A state of the art review on viscosity of nanofluids. Renew. Sustain. Energy Rev. 2017, 76, 1134–1152. [Google Scholar] [CrossRef]
- Sundaram, C.M.; Rajesh, A.V.; Sivaganesan, V. Influence of NiO nano-flakes dispersion on the viscosity of lubricating oil. Bull. Chem. Soc. Ethiop. 2020, 34, 203–214. [Google Scholar] [CrossRef]
- Sun, H.; Liu, Y.S.; Tan, J.W. Research on testing method of oil characteristic based on quartz tuning fork sensor. Appl. Sci. 2021, 11, 5642. [Google Scholar] [CrossRef]
- Cui, W.J.; Pakkanen, T.A. Icephobic performance of one-step silicone-oil-infused slippery coatings: Effects of surface energy, oil and nanoparticle contents. J. Colloid Interface Sci. 2020, 558, 251–258. [Google Scholar] [CrossRef]
- Chen, S.; Wu, T.T.; Zhao, C. Synthesis of branched biolubricant base oil from oleic acid. ChemSusChem 2020, 13, 5516–5522. [Google Scholar] [CrossRef]
- Pathmasiri, T.K.K.S.; Perera, G.I.P. Potential of using polyethylene as ciscosity enhancer of palm oil to use as a lubricating oil. Adv. Mech. Eng. 2020, 12, 1–13. [Google Scholar] [CrossRef]
- Fan, M.J.; Ai, J.; Hu, C.H.; Du, X.; Zhou, F.; Liu, W.M. Naphthoate based lubricating oil with high oxidation stability and lubricity. Tribol. Int. 2019, 138, 204–210. [Google Scholar] [CrossRef]
- Lv, S.S.; Zhang, J.Q.; Ni, H.J.; Wang, X.X.; Zhu, Y.; Chen, L. Study on the coupling relationship of low temperature fluidity and oxidation stability of biodiesel. Appl. Sci. 2020, 10, 1757. [Google Scholar] [CrossRef] [Green Version]
- Li, X.G.; Cui, C.T.; Sun, J.S. Enhanced product quality in lubricant type vacuum distillation unit by implementing dividing wall column. Chem. Eng. Process. 2018, 123, 1–11. [Google Scholar] [CrossRef]
- Panhwar, T.; Mahesar, S.A.; Kandhro, A.A.; Laghari, A.; Tufail Hussain Sherazi, S.; Atabani, A.E. Synthesis of biodiesel via pre-blending of feedstocks: An optimization by the polynomial curve fitting method. Biofuels 2021, 12, 679–688. [Google Scholar] [CrossRef]
- Chuzlov, V.A.; Nazarova, G.Y.; Dolganov, I.M.; Dolganova, I.O.; Seitenova, G.Z. Calculation of the optimal blending component ratio by using mathematical modeling method. J. Pet. Sci. Technol. 2019, 37, 1170–1175. [Google Scholar] [CrossRef]
- Murty, K.G. Nonlinear programming theory and algorithms. Technometrics 2007, 49, 105. [Google Scholar] [CrossRef]
- Liao, H.T.; Zhao, Q.Y.; Fang, D.N. The continuation and stability analysis methods for quasi-periodic solutions of nonlinear systems. Nonlinear Dyn. 2020, 100, 1469–1496. [Google Scholar] [CrossRef]
- Michel, R.; Boris, Z. Property blending relationships for binary mixtures of mineral oil and elektrionised vegetable oil: Viscosity, solvent power, and seal compatibility index. Lubr. Sci. 2011, 23, 263–278. [Google Scholar]
- Li, G.Q.; Meng, Q.H. Oil Storage and Transportation Design of Refinery; China Petrochemical Press: Beijing, China, 2018; pp. 148–151. [Google Scholar]
- Serra, T.; Hooker, J.N. Compact representation of near-optimal integer programming solutions. Math. Program. 2019, 182, 1–34. [Google Scholar] [CrossRef]
- Giri, P.K.; Maiti, M.K.; Maiti, M. Profit maximization solid transportation problem under budget constraint using fuzzy measures. Iran. J. Fuzzy Syst. 2016, 13, 35–63. [Google Scholar]

| Type of Base Oil | A | B | C | D | E | F | G | H | I | J |
|---|---|---|---|---|---|---|---|---|---|---|
| Performance Index | ||||||||||
| Viscosity (mm2/s) | 90.42 | 5.62 | 26.41 | 4.22 | 6.84 | 28.18 | 72.84 | 31.58 | 5.35 | 25.83 |
| Freezing point (°C) | 30.00 | 50.00 | 70.00 | 100.00 | 150.00 | 220.00 | 320.00 | 460.00 | 60.00 | 76.00 |
| Acid value (mgKOH/g) | 3.52 | 5.06 | 7.48 | 11.00 | 16.50 | 24.20 | 35.20 | 50.60 | 65.90 | 87.80 |
| Flash point (°C) | 100.00 | 150.00 | 220.00 | 320.00 | 460.00 | 680.00 | 130.00 | 250.00 | 400.00 | 190.00 |
| Oxidation stability (min) | 90.00 | 135.00 | 198.00 | 288.00 | 414.00 | 612.00 | 900.00 | 1350.00 | 1500.00 | 1650.00 |
| Carbon residue (%) | 90.42 | 5.62 | 26.41 | 4.22 | 6.84 | 28.18 | 72.84 | 31.58 | 5.35 | 25.83 |
| Cost (CNY/ton) | 3800 | 2750 | 4630 | 2210 | 3220 | 1500 | 4300 | 3800 | 5200 | 3000 |
| Type of Base Oil | A | B | C | D | E | F | G | H | I | J |
|---|---|---|---|---|---|---|---|---|---|---|
| Production Batch | ||||||||||
| 1 | 70,849.02 | 64,717.58 | 2016.89 | 3000.00 | ||||||
| 2 | 2431.16 | 14,798.85 | ||||||||
| 3 | 53,042.87 | 32,898.43 | 3017.84 | 4000.00 | ||||||
| 4 | 2016.89 | 20,492.89 | ||||||||
| 5 | 59,332.56 | 49,087.32 | 2309.93 | 3020.00 | ||||||
| 6 | 24,685.94 | 2318.85 | 35,198.66 | 3000.00 | ||||||
| 7 | 3015.85 | 18,908.83 | 2000.00 | |||||||
| 8 | 63,356.26 | 58,102.85 | 1789.99 | 5000.00 | ||||||
| 9 | 29,048.39 | 4903.96 | ||||||||
| 10 | 77,905.24 | 7,1053.95 | 2218.85 | 4000.00 | ||||||
| 11 | 53,252.23 | 1890.00 | 2482.97 | |||||||
| 12 | 7470.00 | 64,363.52 | 4125.73 | |||||||
| 13 | 73,968.84 | 67,546.03 | 2104.85 | |||||||
| 14 | 3110.85 | 52,531.42 | ||||||||
| 15 | 68,946.43 | 63,056.18 | 1963.86 | 4000.00 | 300.00 | |||||
| 16 | 49,153.19 | 8314.93 | ||||||||
| 17 | 43,314.34 | 3523.84 | 3000.00 | |||||||
| 18 | 21,715.90 | 2027.37 | 31,177.86 | |||||||
| 19 | 10,000.00 | 3017.75 | 49,073.83 | |||||||
| 20 | 3024.34 | 49,381.45 |
| Performance Index | Viscosity (mm2/s) | Freezing Point (°C) | Acid Value (mgKOH/g) | Flash Point (°C) | Oxidation Stability (min) | Carbon Residue (%) |
|---|---|---|---|---|---|---|
| Production Batch | ||||||
| 1 | 24.17 | 5.86 | 5.29 | 132.01 | 139.15 | 1340.46 |
| 2 | 5.46 | 8.79 | 10.50 | 307.87 | 275.30 | 1342.83 |
| 3 | 30.91 | 6.96 | 11.47 | 260.14 | 282.28 | 872.81 |
| 4 | 66.51 | 14.69 | 32.72 | 140.44 | 837.10 | 1116.59 |
| 5 | 26.94 | 7.31 | 11.73 | 269.45 | 292.84 | 805.99 |
| 6 | 21.23 | 12.17 | 27.06 | 243.76 | 685.66 | 1245.81 |
| 7 | 5.42 | 8.63 | 15.15 | 316.87 | 377.97 | 1388.47 |
| 8 | 22.60 | 5.77 | 6.71 | 141.48 | 166.87 | 1356.14 |
| 9 | 6.72 | 7.17 | 69.06 | 376.97 | 1521.67 | 2040.78 |
| 10 | 24.10 | 5.76 | 6.45 | 130.18 | 152.36 | 1353.06 |
| 11 | 77.77 | 5.38 | 4.66 | 138.34 | 118.99 | 1133.80 |
| 12 | 55.16 | 15.27 | 34.20 | 176.28 | 876.65 | 1041.82 |
| 13 | 24.04 | 5.72 | 4.30 | 128.23 | 112.75 | 1334.36 |
| 14 | 7.37 | 10.70 | 16.00 | 449.97 | 401.92 | 533.41 |
| 15 | 24.14 | 5.87 | 4.98 | 148.60 | 129.89 | 1348.90 |
| 16 | 6.72 | 7.17 | 69.07 | 376.93 | 1521.70 | 2040.86 |
| 17 | 8.29 | 11.43 | 19.10 | 469.42 | 484.34 | 596.59 |
| 18 | 22.80 | 12.51 | 25.23 | 239.14 | 647.38 | 1217.09 |
| 19 | 9.12 | 6.71 | 53.01 | 361.14 | 1209.64 | 1778.78 |
| 20 | 5.87 | 7.08 | 62.53 | 391.87 | 1424.86 | 1950.89 |
| Index | Viscosity (mm2/s) | Freezing Point (°C) | Acid Value (mgKOH/g) | Flash Point (°C) | Oxidation Stability (min) | Carbon Residue (%) |
|---|---|---|---|---|---|---|
| Required value | 30.60 | 12.55 | 39.70 | 303.18 | 961.80 | 14.58 |
| Type of Base Oil | A | B | C | D | E | F | G | H | I | J |
|---|---|---|---|---|---|---|---|---|---|---|
| Scheme | ||||||||||
| 1 | 10,400 | 0 | 600 | 0 | 7100 | 13,200 | 12,400 | 21,500 | 5400 | 9400 |
| 2 | 200 | 0 | 0 | 6300 | 7700 | 18,500 | 28,300 | 200 | 0 | 18,800 |
| 3 | 9900 | 200 | 900 | 0 | 8800 | 12,800 | 12,200 | 20,900 | 3000 | 11,300 |
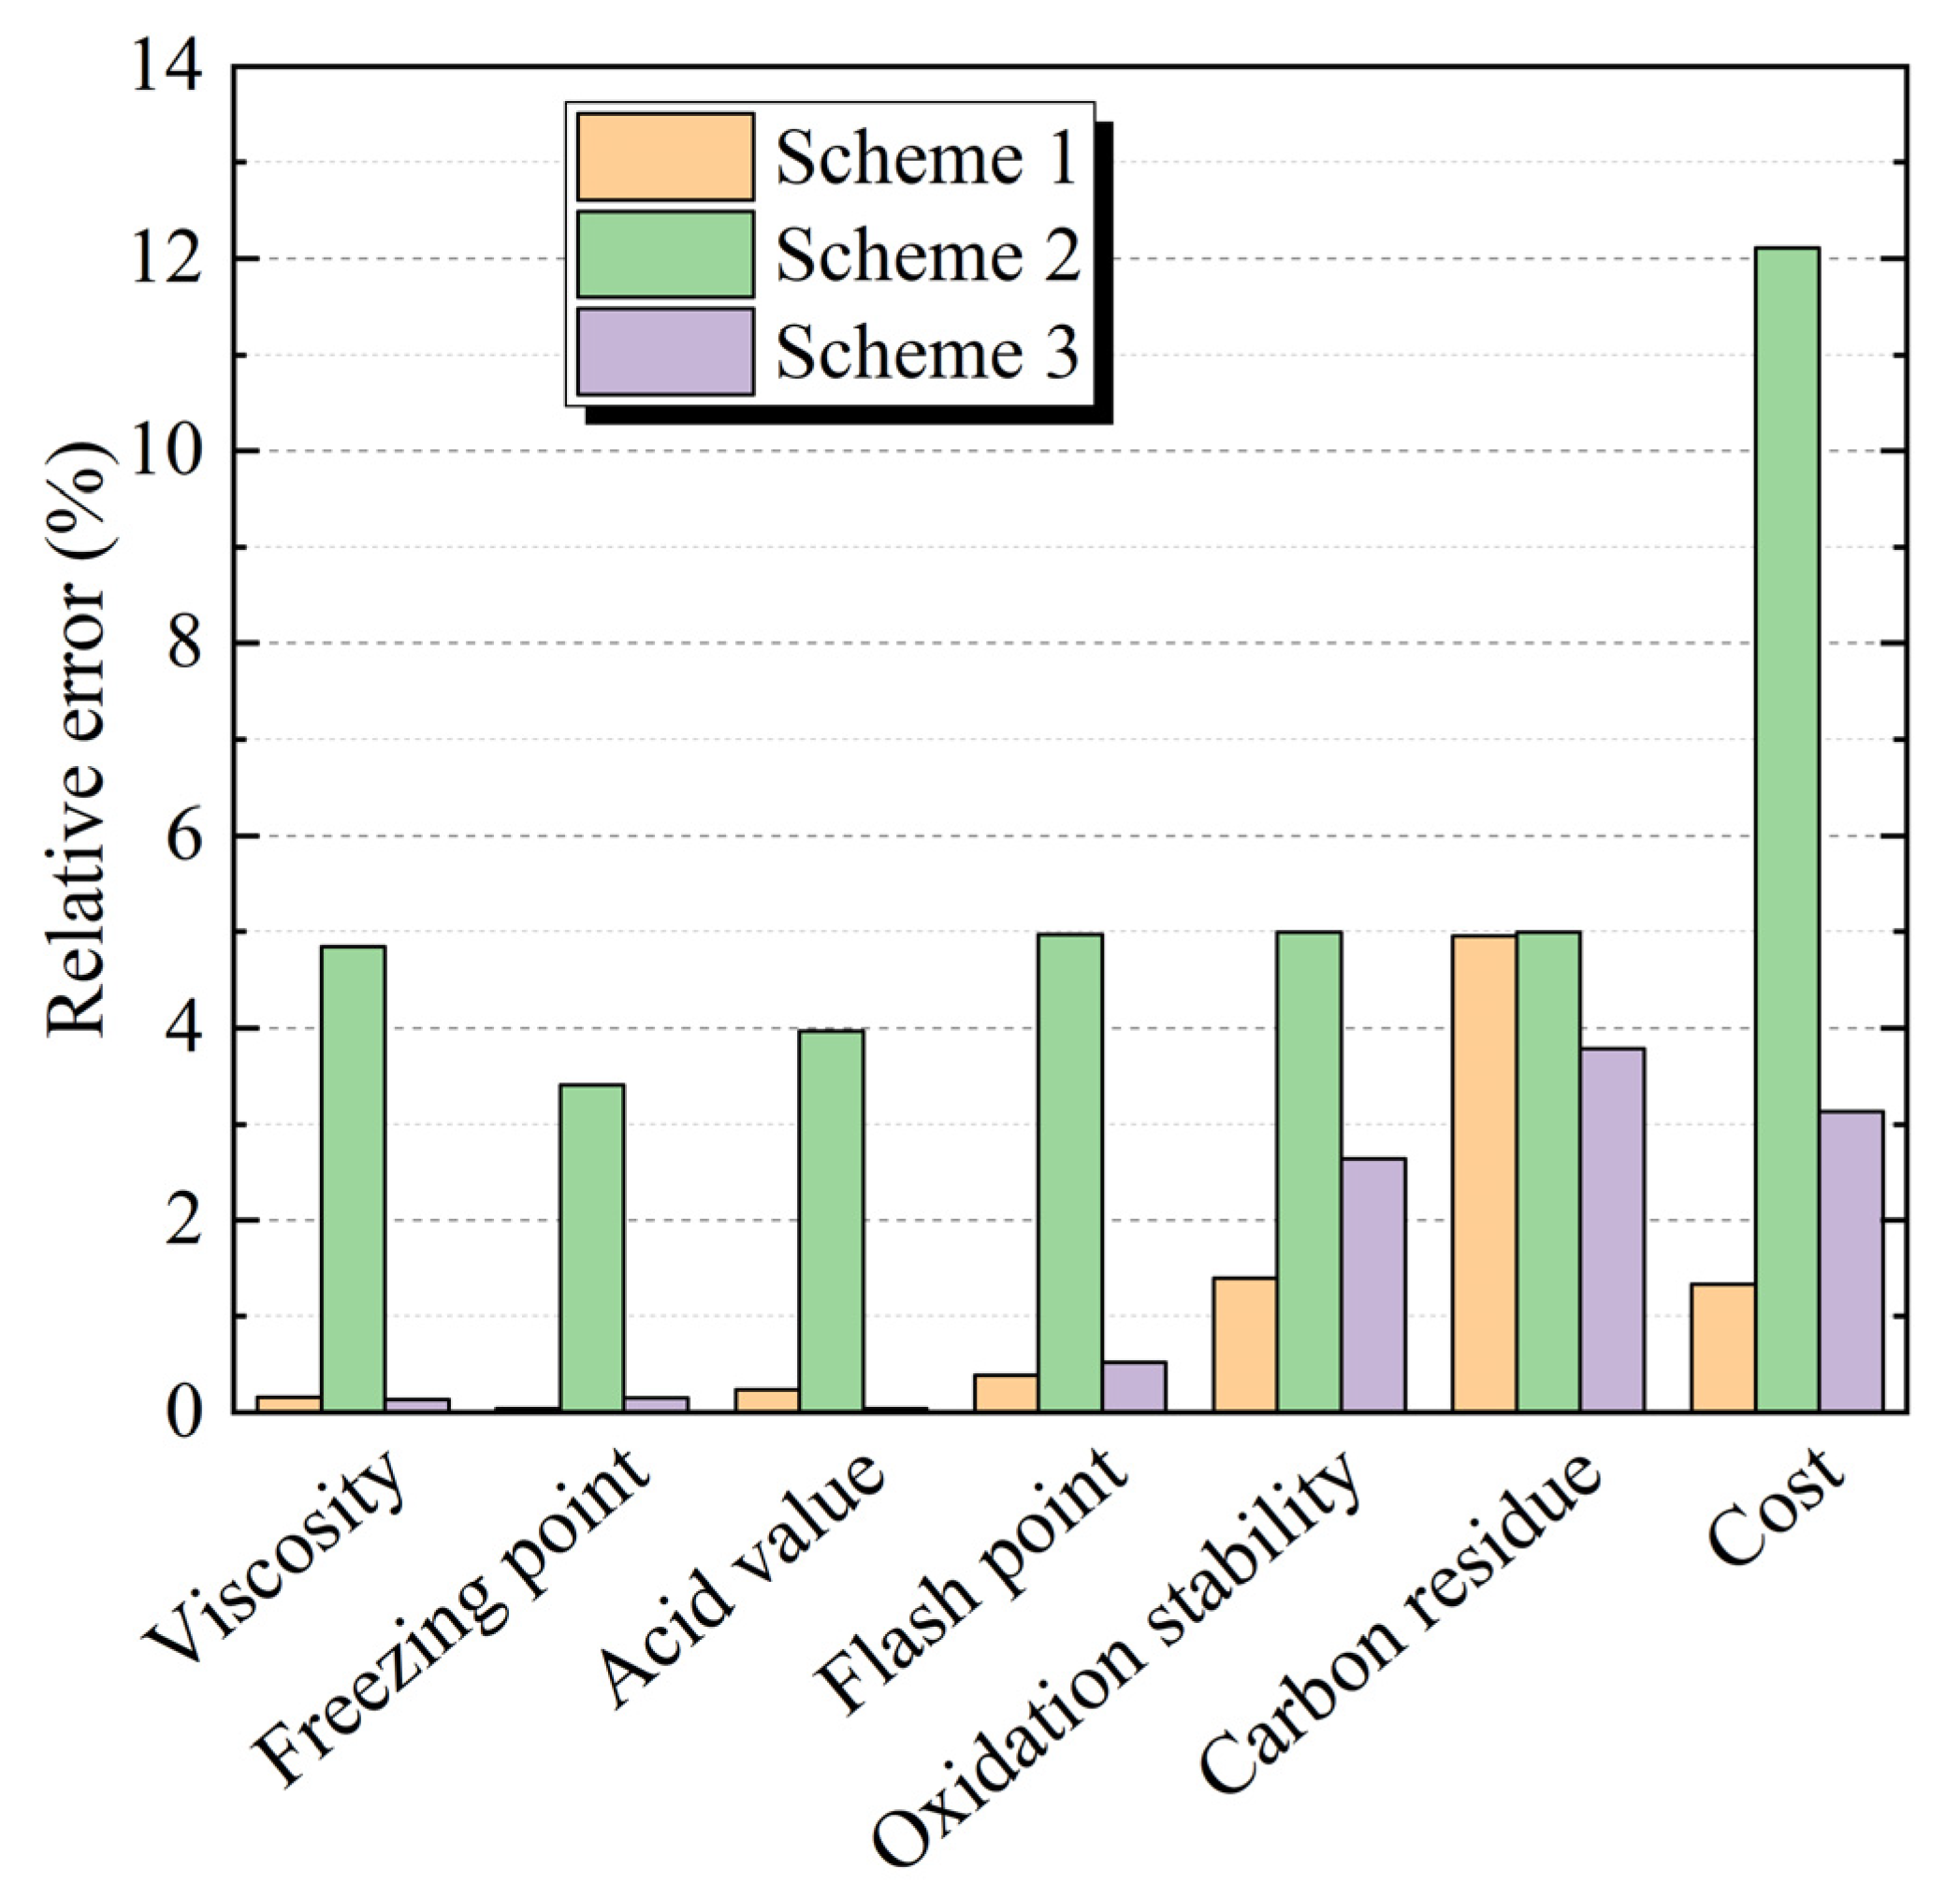
| Scheme | Index | Viscosity (mm2/s) | Freezing Point (°C) | Acid Value (mgKOH/g) | Flash Point (°C) | Oxidation Stability (min) | Carbon Residue (%) | Cost (CNY/Ton) |
|---|---|---|---|---|---|---|---|---|
| Required value | 30.60 | 12.55 | 39.70 | 303.18 | 961.80 | 14.58 | 3500.00 | |
| 1 | Calculated value | 30.55 | 12.56 | 39.79 | 304.34 | 948.35 | 15.30 | 3453.25 |
| 2 | Calculated value | 29.12 | 12.12 | 41.27 | 318.24 | 913.78 | 15.31 | 3075.96 |
| 3 | Calculated value | 30.64 | 12.53 | 39.68 | 301.60 | 936.41 | 15.13 | 3390.66 |
Publisher’s Note: MDPI stays neutral with regard to jurisdictional claims in published maps and institutional affiliations. |
© 2021 by the authors. Licensee MDPI, Basel, Switzerland. This article is an open access article distributed under the terms and conditions of the Creative Commons Attribution (CC BY) license (https://creativecommons.org/licenses/by/4.0/).
Share and Cite
Yuan, M.; Li, Y.; Xu, W.; Cui, W. Multi-Objective Optimization Model of Industrial Lubricants Based on Integer Nonlinear Programming. Appl. Sci. 2021, 11, 8375. https://doi.org/10.3390/app11188375
Yuan M, Li Y, Xu W, Cui W. Multi-Objective Optimization Model of Industrial Lubricants Based on Integer Nonlinear Programming. Applied Sciences. 2021; 11(18):8375. https://doi.org/10.3390/app11188375
Chicago/Turabian StyleYuan, Min, Yu Li, Wenqiang Xu, and Wei Cui. 2021. "Multi-Objective Optimization Model of Industrial Lubricants Based on Integer Nonlinear Programming" Applied Sciences 11, no. 18: 8375. https://doi.org/10.3390/app11188375
APA StyleYuan, M., Li, Y., Xu, W., & Cui, W. (2021). Multi-Objective Optimization Model of Industrial Lubricants Based on Integer Nonlinear Programming. Applied Sciences, 11(18), 8375. https://doi.org/10.3390/app11188375