Article

Experiment-Based Fatigue Behaviors and Damage Detection Study of Headed Shear Studs in Steel–Concrete Composite Beams

1
Department of Bridge Engineering, Tongji University, Shanghai 200092, China
2
College of Civil Science and Engineering, Yangzhou University, Yangzhou 225127, China
*
Author to whom correspondence should be addressed.
Appl. Sci. 2021, 11(18), 8297; https://doi.org/10.3390/app11188297
Submission received: 3 August 2021 / Revised: 28 August 2021 / Accepted: 3 September 2021 / Published: 7 September 2021

Abstract

:
Many in-service bridges with steel–concrete composite beams are currently aging and experiencing performance deterioration. Under long-term cyclic loads from traffic on bridges, headed shear studs in steel–concrete composite beams are vulnerable to fatigue damage. The comprehensive understanding of fatigue behaviors and the feasible detection of fatigue damage of headed shear studs is, thus, crucial for the accurate numerical simulation of the fatigue crack propagation process. The paper, thus, experimentally investigates the fatigue behaviors of headed shear studs through push-out tests of three specimens. The fatigue failure modes and cyclic strain evolution of specimens are analyzed. The fatigue lives of headed shear studs are compared with the SN curves of the AASHTO, Eurocode 4 and BS5400 codes. The fatigue crack details of shear studs in push-out tests are then detected using the ultrasonic non-destructive testing. The results show that the root fracture is the main fatigue failure mode of shear studs under fatigue loading. The fatigue life estimations based on the three current codes (i.e., AASHTO, Eurocode 4 and BS5400) can be safely guaranteed only with different safety redundancies. The strain at the shear stud with fatigue damage shows a consistent increasing trend followed by decreasing behavior after reaching the peak value with the loading cycles. Moreover, the feasibility of the ultrasonic non-destructive testing with the combination of a strain measurement for fatigue crack details detection of headed shear studs in composite beams is proved.

1. Introduction

Steel–concrete composite beams have been widely constructed in many bridges in recent decades [1]. Shear connectors are used to provide a mechanism for longitudinal shear transfer across the steel and concrete interface. Among different kinds of shear connectors, the most frequently used type is headed shear studs because of the installation efficiency and economic considerations [2]. So far, a growing number of composite bridges are gradually entering the aging period. Subjected to long-term cyclic loads from traffic on bridges, headed shear studs in steel–concrete composite beams are vulnerable to fatigue failures. However, the present understanding of fatigue behaviors and damage detection of headed shear studs is still incomprehensive. The fatigue damage of the headed shear studs is, thus, becoming ever more prominent, and an in-depth study on the problem appears more and more crucial.
Since the first engineering application of shear connectors, the fatigue problem has always been a vital factor in the design, given the connection geometry and welding imperfections [3]. The study on fatigue characteristics of headed shear studs originated in the 1960s. Generally, there are two experimental methods to study the fatigue performance of headed shear studs, i.e., the push-out test and the beam test. With advantages of low cost, convenient loading and short testing period, push-out tests are widely adopted in the experimental studies of the fatigue characteristics of headed shear studs. At first, the research emphasis was the fatigue life evaluation. Slutter and Fisher [4] carried out 44 fatigue tests on shear studs under constant amplitude stress cycles and gave a stud fatigue–life evaluation equation. They also observed two failure modes in headed shear studs, one in the root of the studs (Figure 1a) and the other in the root of the weld collar (Figure 1b). Hallam [5] also conducted push-out tests on the shear studs specimens and observed the third failure mode, which was started from the root of weld collar and propagated to the flange of beam (Figure 1c). Based on a number of push-out tests, Oehlers and Coughlan [6] studied the fatigue-induced stud stiffness degradation. They found that there was a linear relationship between the stud stiffness degradation and the fatigue life. Seracino et al. [7] studied the bi-directional cyclic fatigue behavior of headed shear studs. Their tests confirmed that for a given range of load, the fatigue life of connectors subjected to bi-directional cyclic loading was normally longer than those subjected to unidirectional loads only. Hanswille and Porsch [8,9] reported a series of experimental works with push-out specimens to determine the fatigue life and a possible reduction in the static strength of the headed shear studs subjected to unidirectional cyclic loading. Moreover, Ovuoba and Prinz [10] and Maeda and Matsuyi [11] performed similar studies. However, all the above research focused on the fatigue behaviors of a single shear stud with a diameter ranging from 13 mm to 22 mm. With the continuous development of engineering construction, the conventional headed studs cannot meet the increasing strength requirements. Thus, some researchers then performed push-out tests on large shear studs (with a stud diameter over 22 mm) [12,13] and grouped shear studs [14,15,16,17] to investigate the corresponding fatigue lives. The results showed that the fatigue lives of the large shear studs and the grouped studs tended to be lower. However, all the above-mentioned research only investigated the fatigue behaviors of headed shear studs in normal concrete.
Recently, several new types of concrete materials with unique properties, such as lightweight concrete (LWC), ultra-high performance concrete (UHPC) and engineered cementitious composites (ECC), have been used to improve the mechanical performance of steel–concrete composite beams. Thus, increasing experimental research has been conducted to study the fatigue behaviors of headed shear studs embedded in the LWC [20,21,22], the UHPC [23,24,25] and the ECC [26,27]. The research results indicated that the fatigue strength of studs in the LWC and ECC was lower than that of studs in normal concrete. However, the studs in the UHPC improved the fatigue performance compared to normal concrete. Compared with push-out tests, large-scale beam tests are more accurate to capture the actual fatigue behaviors of headed shear studs [28]. Hence, some studies investigated the fatigue performance of headed shear studs through the testing of beam specimens [3,19,29]. Comparing the beam test results with a larger dataset for headed shear studs in the above studies, the potential of studs in the beam tests in terms of the relative fatigue performance is apparent.
With the deepening of research, some studies then adopted numerical methods to better analyze the behaviors of headed shear studs in steel–concrete composite beams. For example, Lam and El-Lobody [30] proposed an effective numerical model to simulate the load–slip behavior and the shear capacity of shear studs in the push-out tests. Okada et al. [14] studied the failure mode and shear strength of grouped shear studs based on a push-out test of shear studs and numerically simulated the test results using the finite element analysis. Their numerical models provided a better understanding of the different failure modes observed during experimental testing and, hence, the shear capacity of headed shear studs. Mia and Bhowmick [31] then presented a finite element-based approach using a push-out specimen to the fatigue life estimation of headed shear studs. Both the crack initiation and crack propagation life were estimated. However, it is noteworthy to point out that all the finite element analyses in the above studies were conducted aiming at the parametric comparison, not the simulation of the fatigue push-out test process. The precise simulation of the fatigue push-out test process (i.e., fatigue crack propagation process) by the finite element analysis is too complicated [16]. To the authors’ knowledge, there is only one published research concerning the numerical simulation of the fatigue crack propagation process of shear studs in push-out test. In our previous research work [32], a numerical method was presented to calculate the stress intensity factor using the crack box technique and M integral method, and it applied to study the fatigue behavior of headed shear studs. It was found that the crack propagation in the stud shank was a composite state of the opening mode crack and the sliding mode crack. However, the numerical method in the preliminary study did not reach the step to be valid for simulating the fatigue crack propagation process of shear studs. It lacks detailed fatigue crack data of shear studs in the push-out tests to support the progress of the numerical method.
To develop an accurate numerical simulation of fatigue crack propagation, it is indispensable to dynamically inspect the fatigue crack of headed shear studs in push-out tests. However, there are too few studies on fatigue damage inspection of headed shear studs. Ovuoba and Prinz [33] chiseled away the concrete surrounding shear studs and carried out a stud crack inspection on two in situ bridges, using magnetic particle inspection and dye penetrant testing. However, their methods had to remove the concrete covered in shear studs; therefore, it was not feasible to dynamically detect stud cracks in push-out tests. Liu and Roeck [34] proposed a fatigue damage detection method using a numerical simulation on the basis of the local modal curvature and the wavelet transform modulus maxima. Their study only focused on the global fatigue failure of shear studs, not the fatigue crack details. Through an experimental and theoretical analysis, Ma et al. [35] demonstrated that the cumulative plastic damage can be estimated semi-quantitatively via the variations of the self-magnetic leakage field curve, which is beneficial for the fatigue damage assessment for steel. Nobile and Saponaro [36] detected fatigue damage of notched metal specimens by monitoring the electrical resistance change in real-time. Moreover, several methods of destructive and non-destructive testing were adopted to analyze concrete properties [37]. However, the inspection methods mentioned above are all not suitable for the detection of the fatigue crack propagation process of shear studs in push-out tests or real bridges. There is no effective non-destructive detection method to monitor the fatigue crack details of shear studs, which limits the development of a numerical simulation of the fatigue crack propagation process.
In this case, a series of cyclic push-out tests are conducted to study the detailed fatigue behaviors and the feasible fatigue damage detection of headed shear studs in steel–concrete composite beams. The fatigue failure modes and cyclic strain evolution of specimens are analyzed with test results. The fatigue lives are estimated by different current design codes and compared with actual values. The fatigue crack details of headed shear studs in push-out tests are detected by the ultrasonic non-destructive testing. The study provides insights to assist in developing an accurate numerical simulation of fatigue crack propagation of headed shear studs in steel–concrete composite beams.

2. Experimental Study

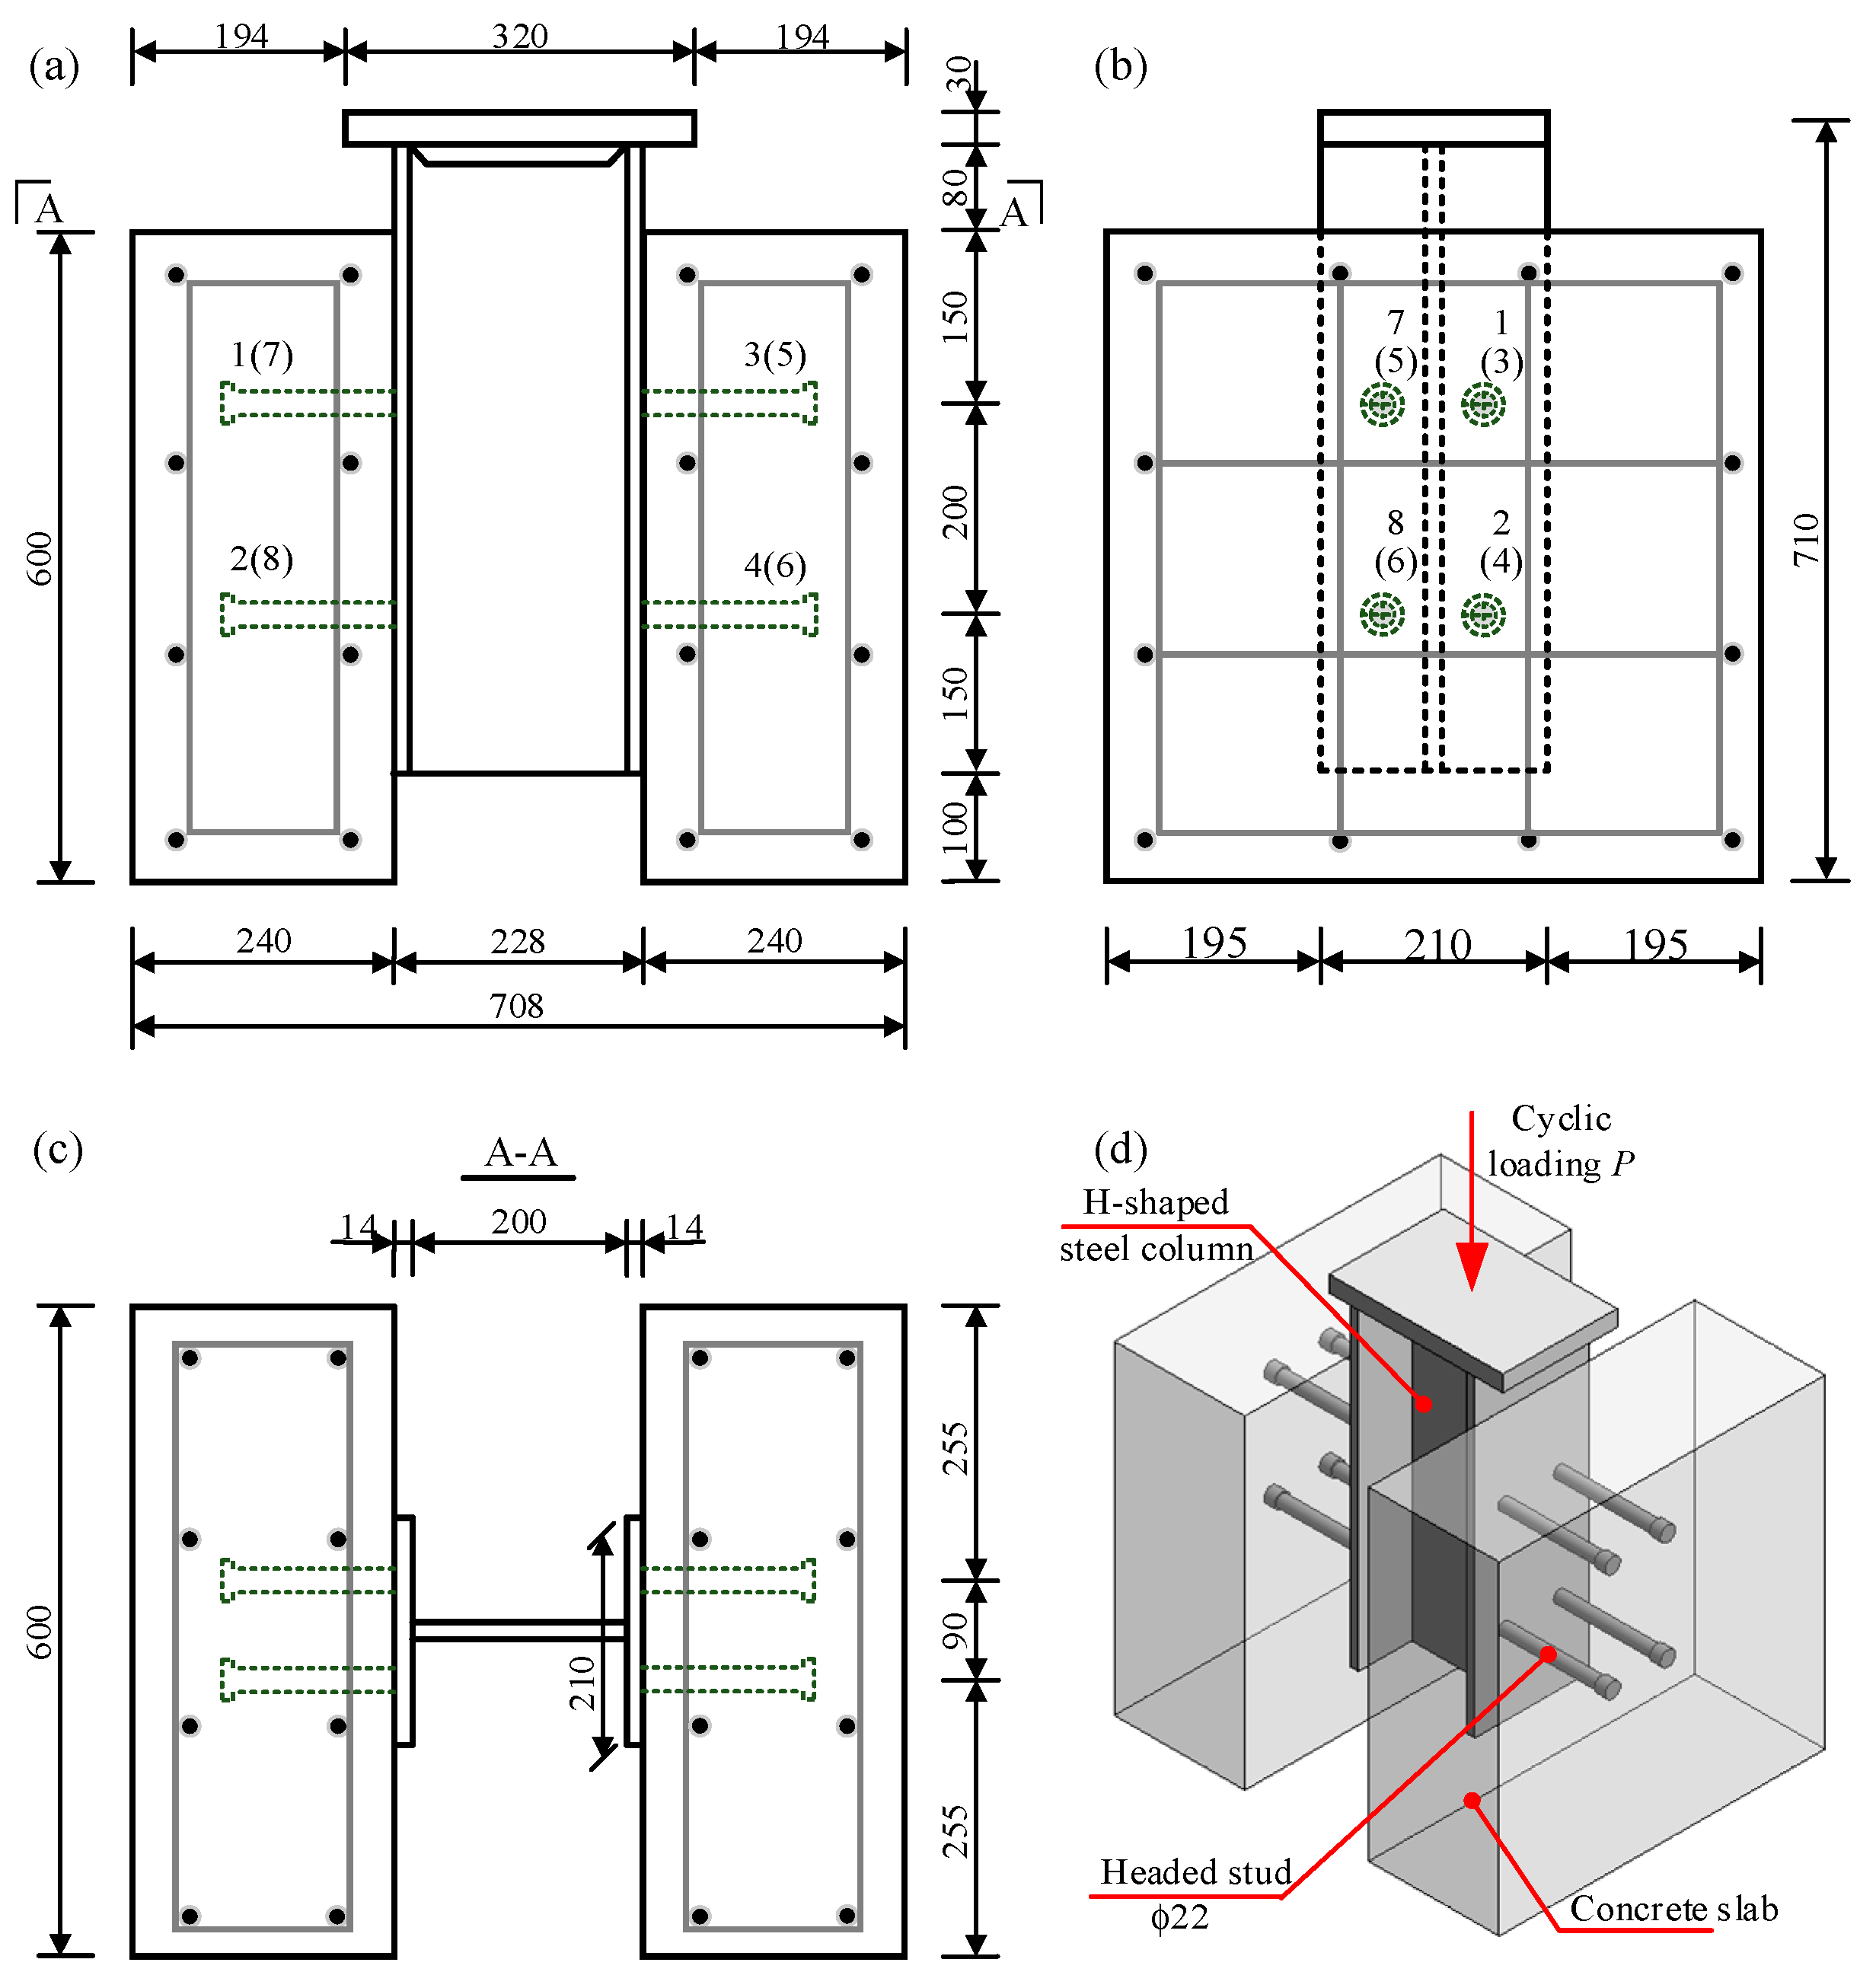
2.1. Test Specimens Details

According to the relevant provisions of Eurocode 4 [38] and the actual layout of railway composite beams, three push-out specimens numbered as S-1, S-2 and S-3, were fabricated. The geometric details of push-out specimens are shown in Figure 2, including an H-shaped steel column, eight headed shear studs and two normal concrete slabs. The height of the H-shaped steel column was 580 mm, and the width was 228 mm. The thickness of the flange and web plates of the H-shaped steel column was 14 mm. The upper side of web plate was chamfered to ensure that the load could be transferred to the two flange plates smoothly. In each specimen, there were two rows of studs in the concrete slabs on both sides, and each row had two studs. The headed shear studs were welded on the steel flange plates, which were named as No. 1 to No. 8 in order (Figure 2a). The stud size was designed according to the actual size in composite beams, with the height of 180 mm and the diameter of 22 mm. The vertical and transverse stud spacing in specimens was 200 mm and 90 mm, separately. The size of each concrete slab was 600 mm × 600 mm × 240 mm to ensure that the shear studs could be wrapped in it (Figure 2). The chosen geometry for concrete slabs was based on the actual sizes of railway composite beams. According to the actual reinforcement situation of composite beams, the HRB335 hot-rolled ribbed bars with a diameter of 20 mm were also arranged in the concrete slabs. To prevent friction of the steel–concrete interface, each steel flange plate was greased before the concrete casting. A thick steel plate (30 mm in thickness) was set on the top of the H-shaped steel column to evenly distribute the vertical load (Figure 2d).

2.2. Material Properties

The concrete slabs of push-out specimens were composed of C35 concrete. The characteristic value of concrete compressive strength of cube specimens (150 mm × 150 mm × 150 mm) after curing for 28 days under standard conditions (temperature 20 ± 2 °C, relative humidity no less than 95%) was 35 MPa [39]. The elastic modulus of the concrete material was 3.15 × 10⁴ MPa. The H-shaped steel column and the load distribution plate were fabricated with Q345q steel [40] consistent with the actual structure. The headed shear studs were composed of Grade 4.6 steel, and the reinforcement structural reinforcement bars were HRB335 [39]. The material properties of different types of steel are summarized in Table 1.

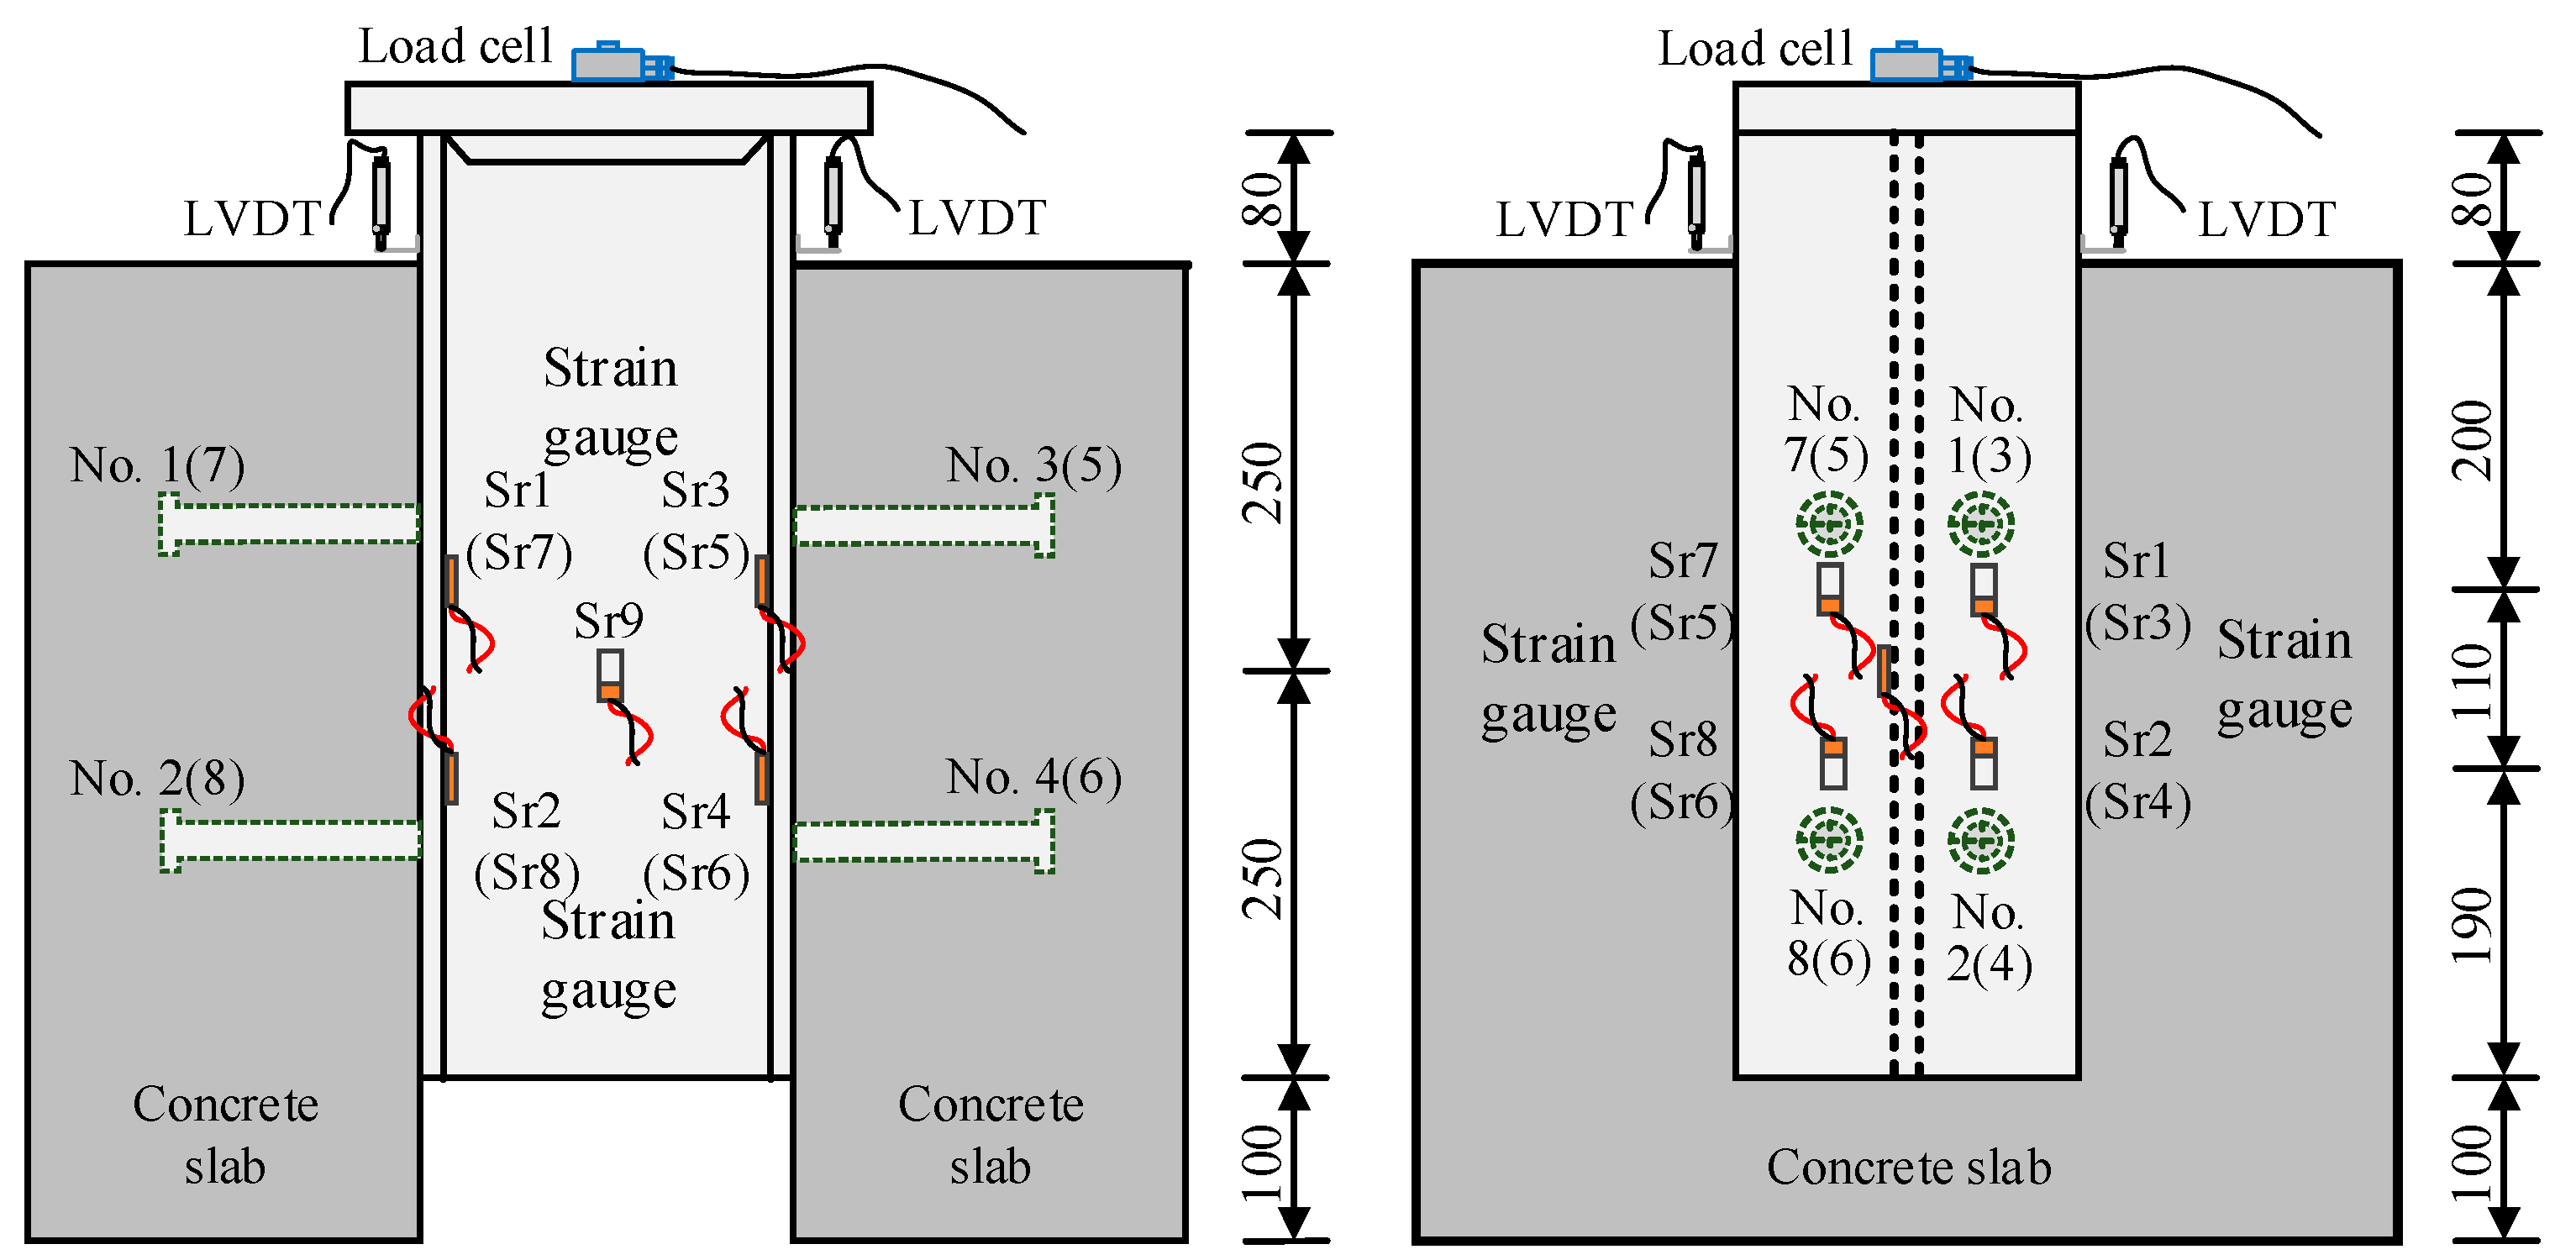
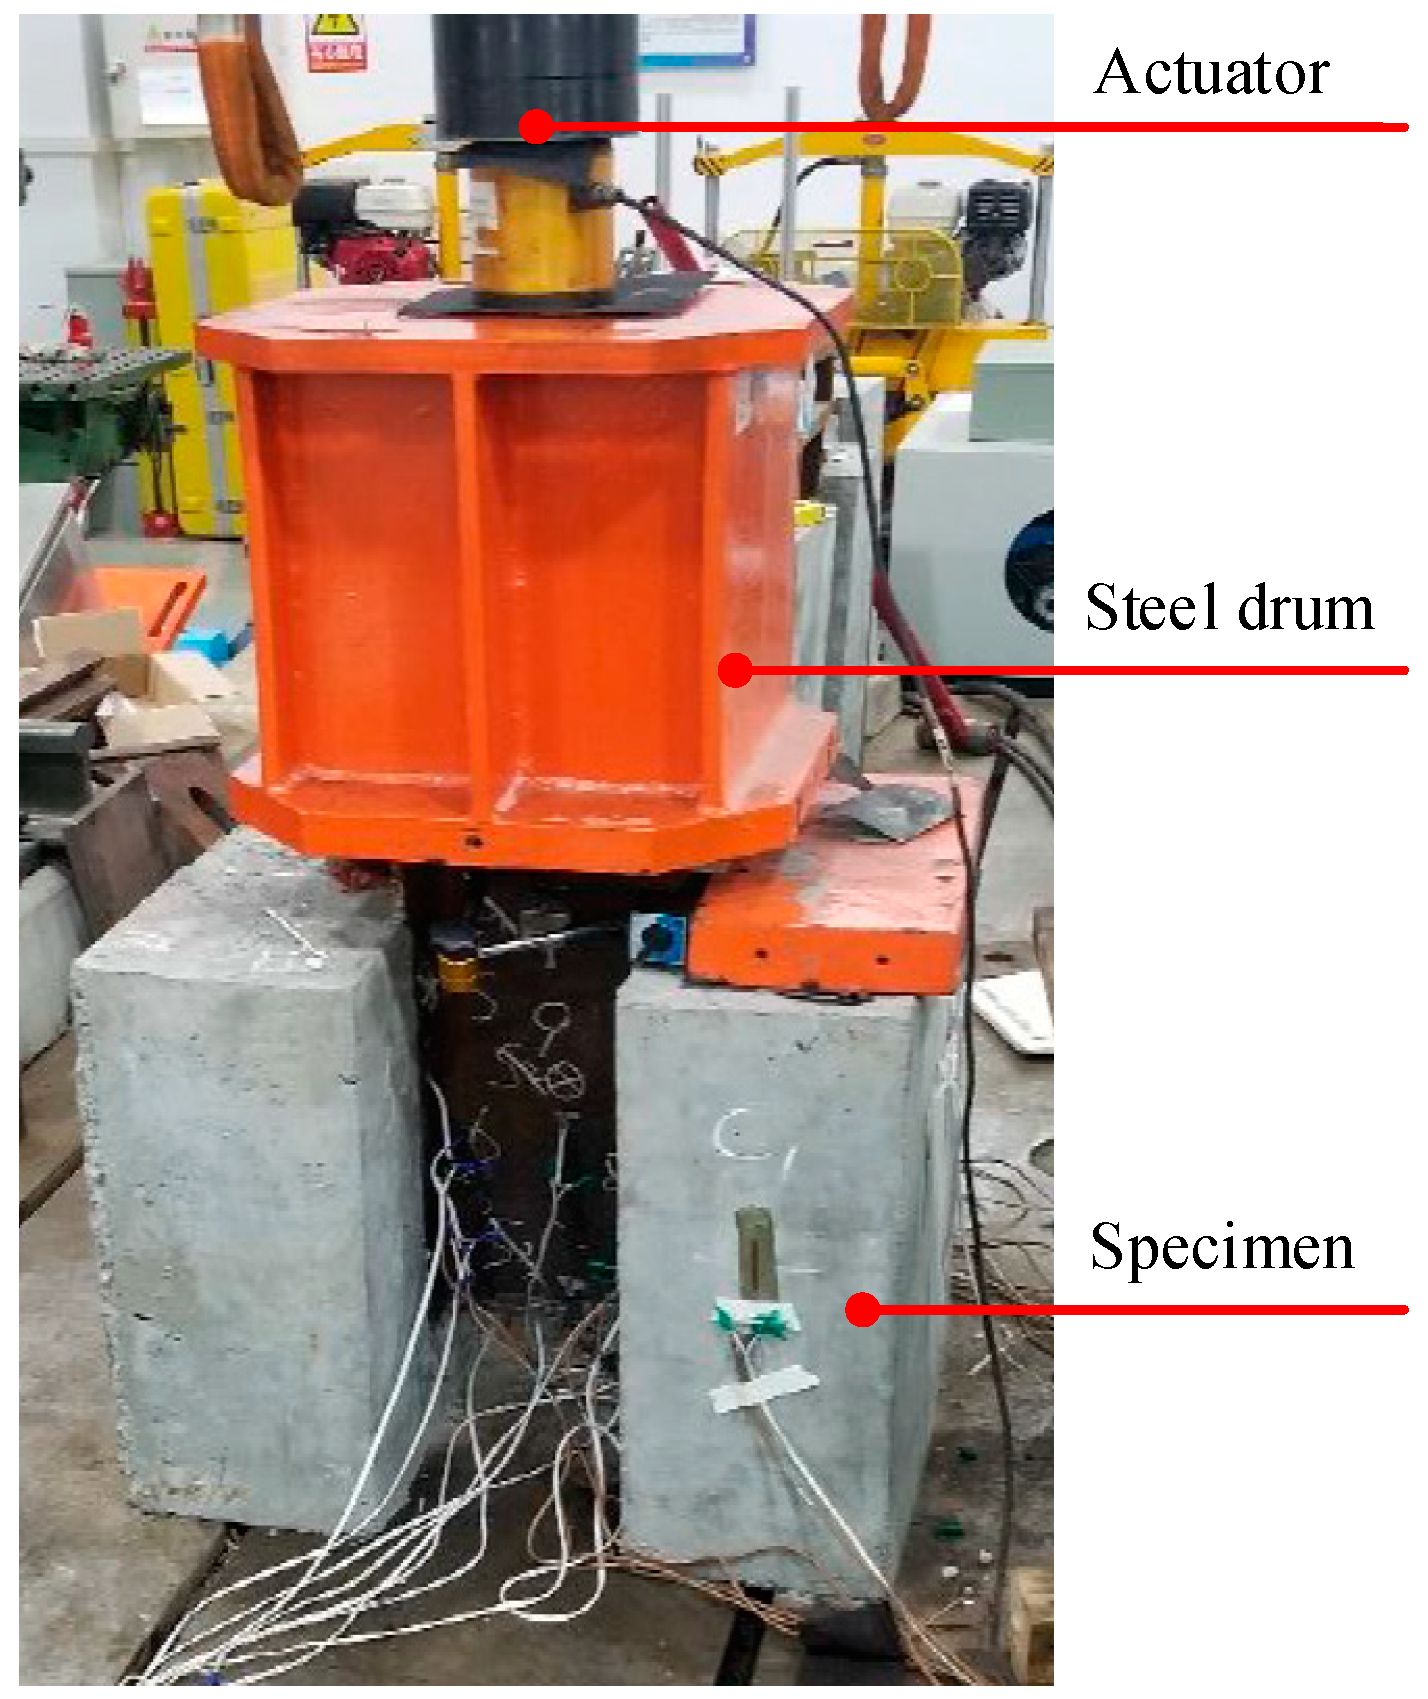
2.3. Test Instruments and Setup

A load cell was installed in the center of the steel load distribution plate to capture the loading details during the static and fatigue tests (Figure 3). The relative slip between the H-shaped steel column and concrete slabs of the specimen was measured using two linear variable differential transformers (LVDTs). The two LVDTs were vertically installed on the top of concrete slabs. The LVDTs were mounted on the concrete slabs, and the measuring tips were attached to the L-shaped steel plate fixed to the flange of the steel column (Figure 3). Additionally, unidirectional strain gauges were applied to allow for local strain measurements. A total of nine strain gauges were set on the H-shaped steel column of the specimen. They were mainly arranged on the surface of the web and flange plates (Figure 3). One strain gauge was arranged in the middle of the web plate to observe the global deformation, with a vertical distance 250 mm to the bottom of the steel column. The remaining eight strain gauges were arranged on the inner side of the flange plate at the headed shear studs location to measure shear stresses transferred through the studs. The strain gauges were named Sr1 to Sr8 in order corresponding to the stud number. Figure 3 shows the detailed layout of test instruments, including the load cell, LVDTs and strain gauges.
The push-out tests were carried out on a computer-controlled electro hydraulic servo fatigue testing machine, as shown in Figure 4. The loading frequency range of the fatigue testing machine was 1 Hz to 10 Hz. The maximum loading capacity of the actuator was 500 kN, both of which could realize force control and displacement control. The H-shaped steel column was loaded by an actuator through a steel drum (Figure 4). All the specimens were subjected to unidirectional loading during the static and fatigue tests.

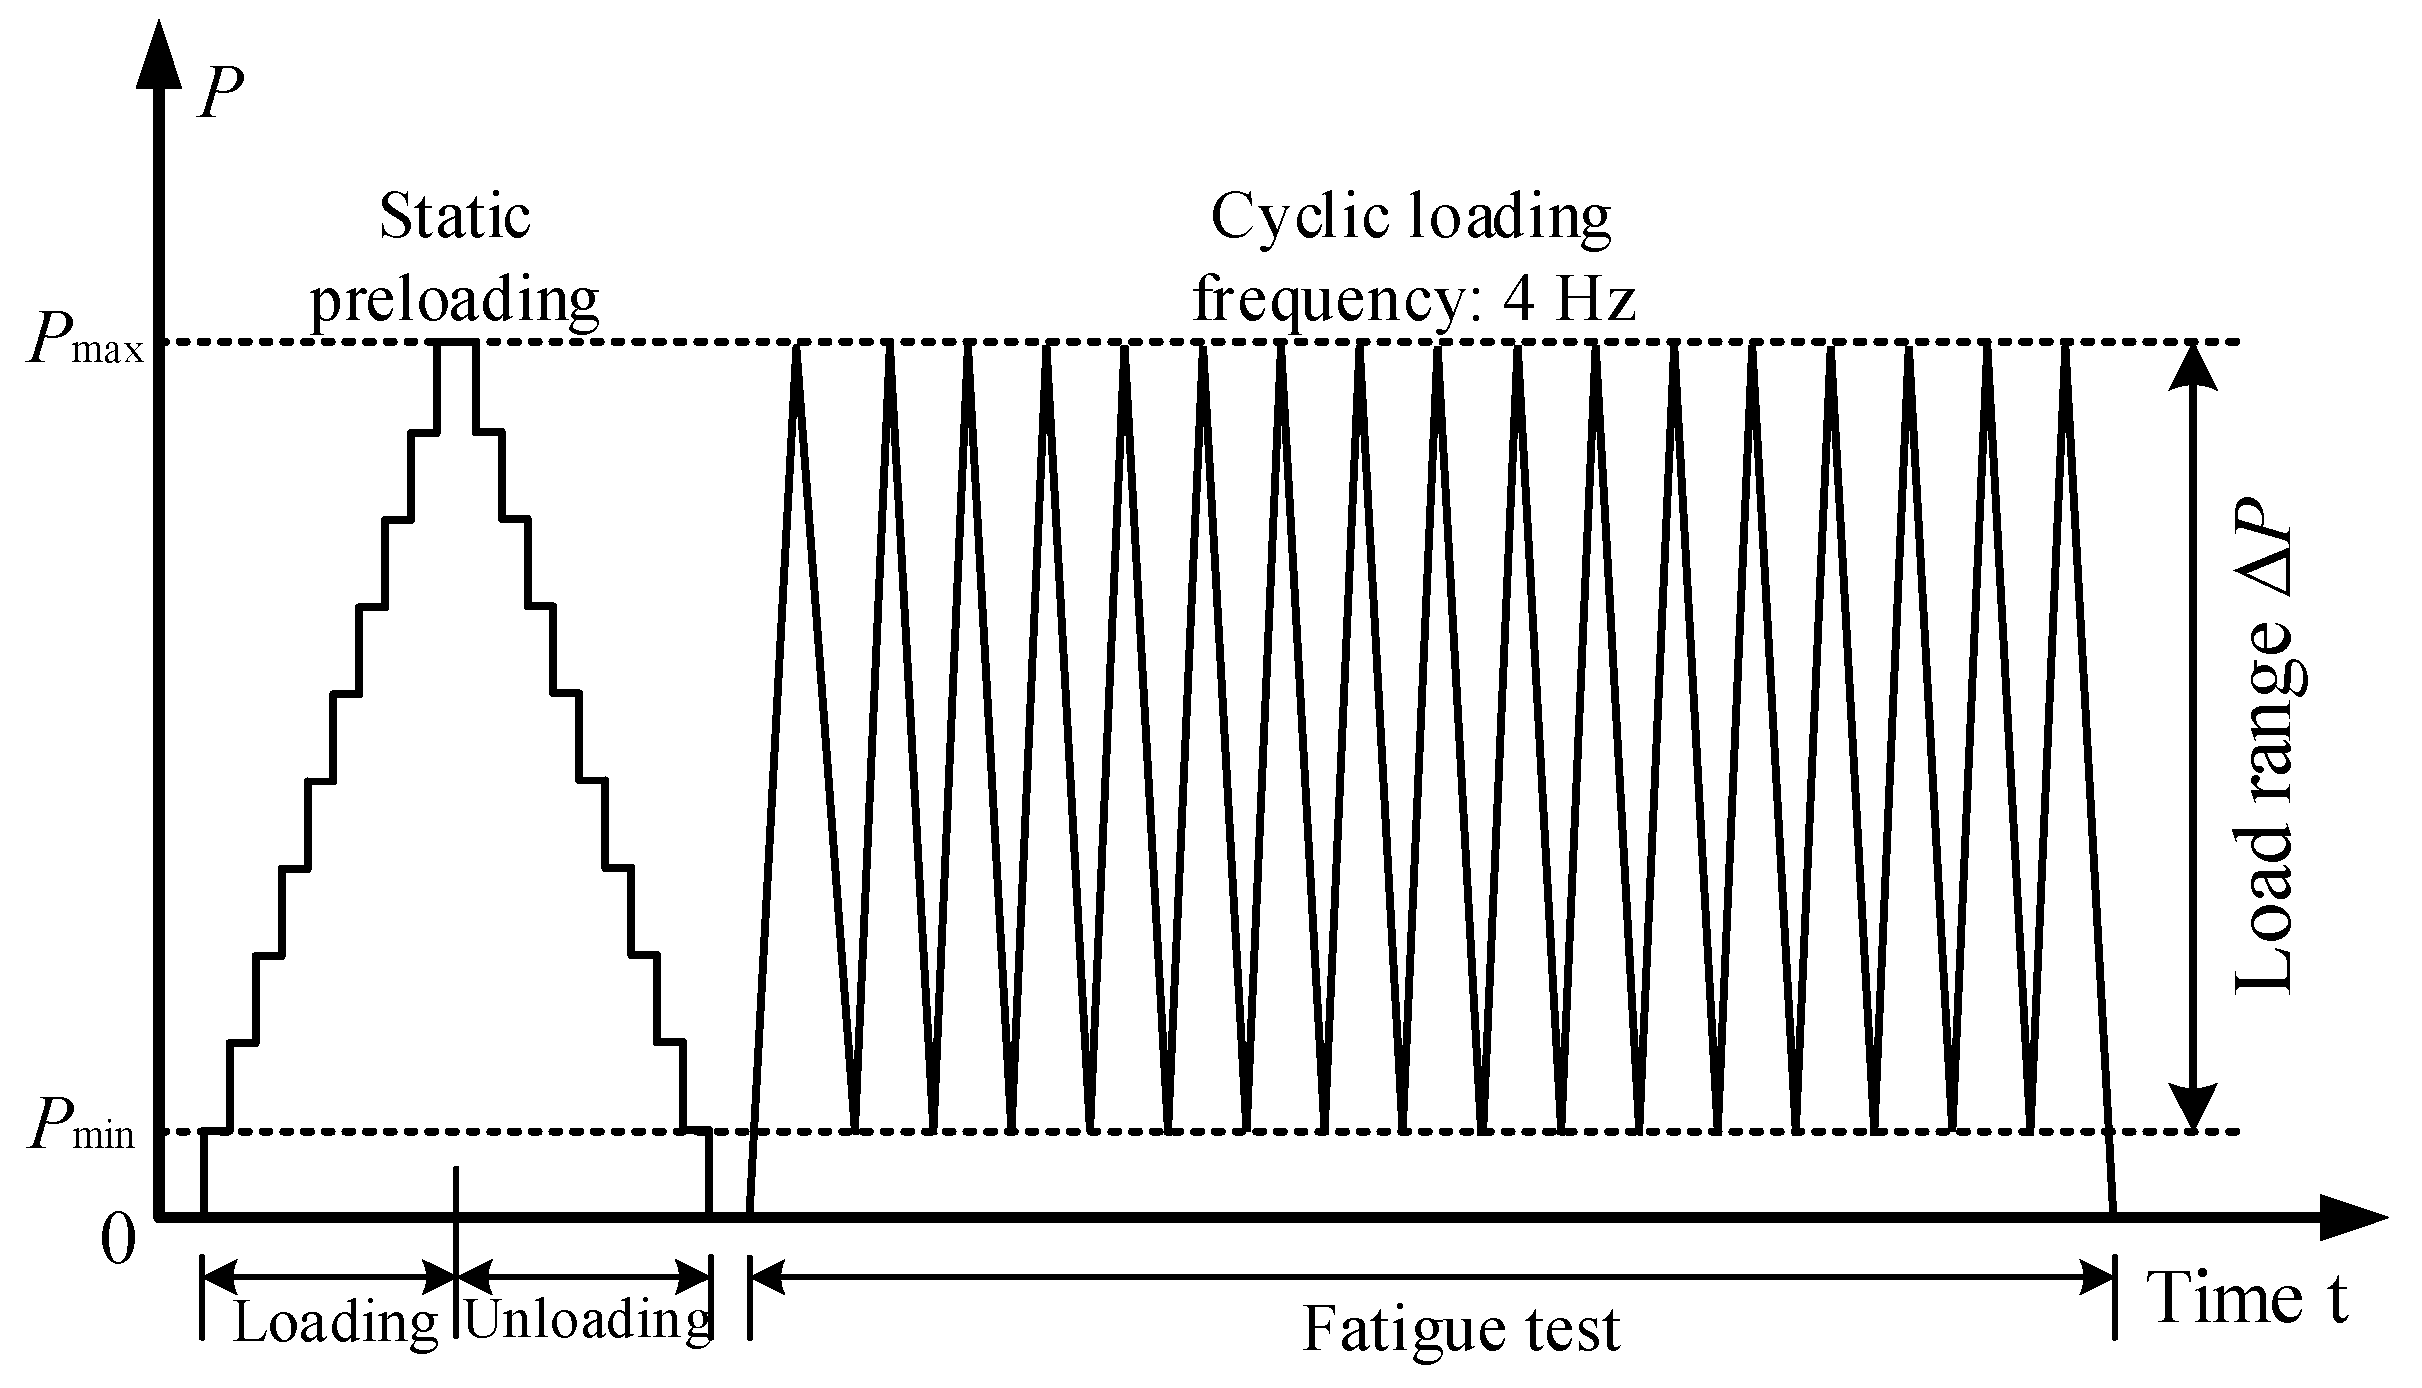
2.4. Fatigue Test Program

Before the fatigue test, a static preloading was applied to the specimens to check the normal working state of test instruments and fatigue testing machine and to remove the nonlinear reading of test instruments caused by the insufficient compression of the test specimens. When the specimen was statically preloaded, it was loaded to the maximum load Pmax by ten stages. After the static preloading, the fatigue test with constant amplitude load range was carried out. When the cyclic loading reached a certain number, the fatigue damage of shear studs was detected to explore whether there were fatigue cracks in studs and crack details. After the specimens were failed with fatigue damage, the fatigue loading cycles and failure modes were recorded. During the fatigue test, the relative slip and the local strain were measured. The whole loading procedure of specimens is shown in Figure 5.
The three specimens (S-1, S-2 and S-3) with the same dimensions were tested under fatigue loading. According to Eurocode 4 [38], the design shear capacity of single headed stud PRd was 101.4 kN. Thus, the static shear strength (Pu) of testing specimens was 810.9 kN (eight studs). To keep a steady fatigue crack growth process with appropriate loading cycles, the cyclic load ranges ΔPP = PmaxPmin) of 37%, 42% and 44.4% of the static shear strength Pu were applied on three testing specimens. Considering the load capacity of the actuator (500 kN), the maximum cyclic loads Pmax of the three testing specimens varied from 43.2% to 49.3% of the static shear strength Pu, respectively. For each specimen in the fatigue test, the load range ΔP and load ratio R (Pmin/Pmax) were also kept constant in testing, where the Pmin were the minimum fatigue loads. The load ratio R of the three specimens was all kept at about 0.1 to ensure that the fatigue machine would not separate from the specimen during the fatigue test. The nominal shear stress range of studs was derived by dividing the load range ΔP by all stud section areas. The maximum and minimum loads and the loading amplitude are presented in Table 2. In the fatigue test, the constant amplitude cyclic force of sine wave was adopted with the loading frequency of 4 Hz according to the target load range of specimens. The vertical load was applied using an actuator under force control.

3. Fatigue Test Results

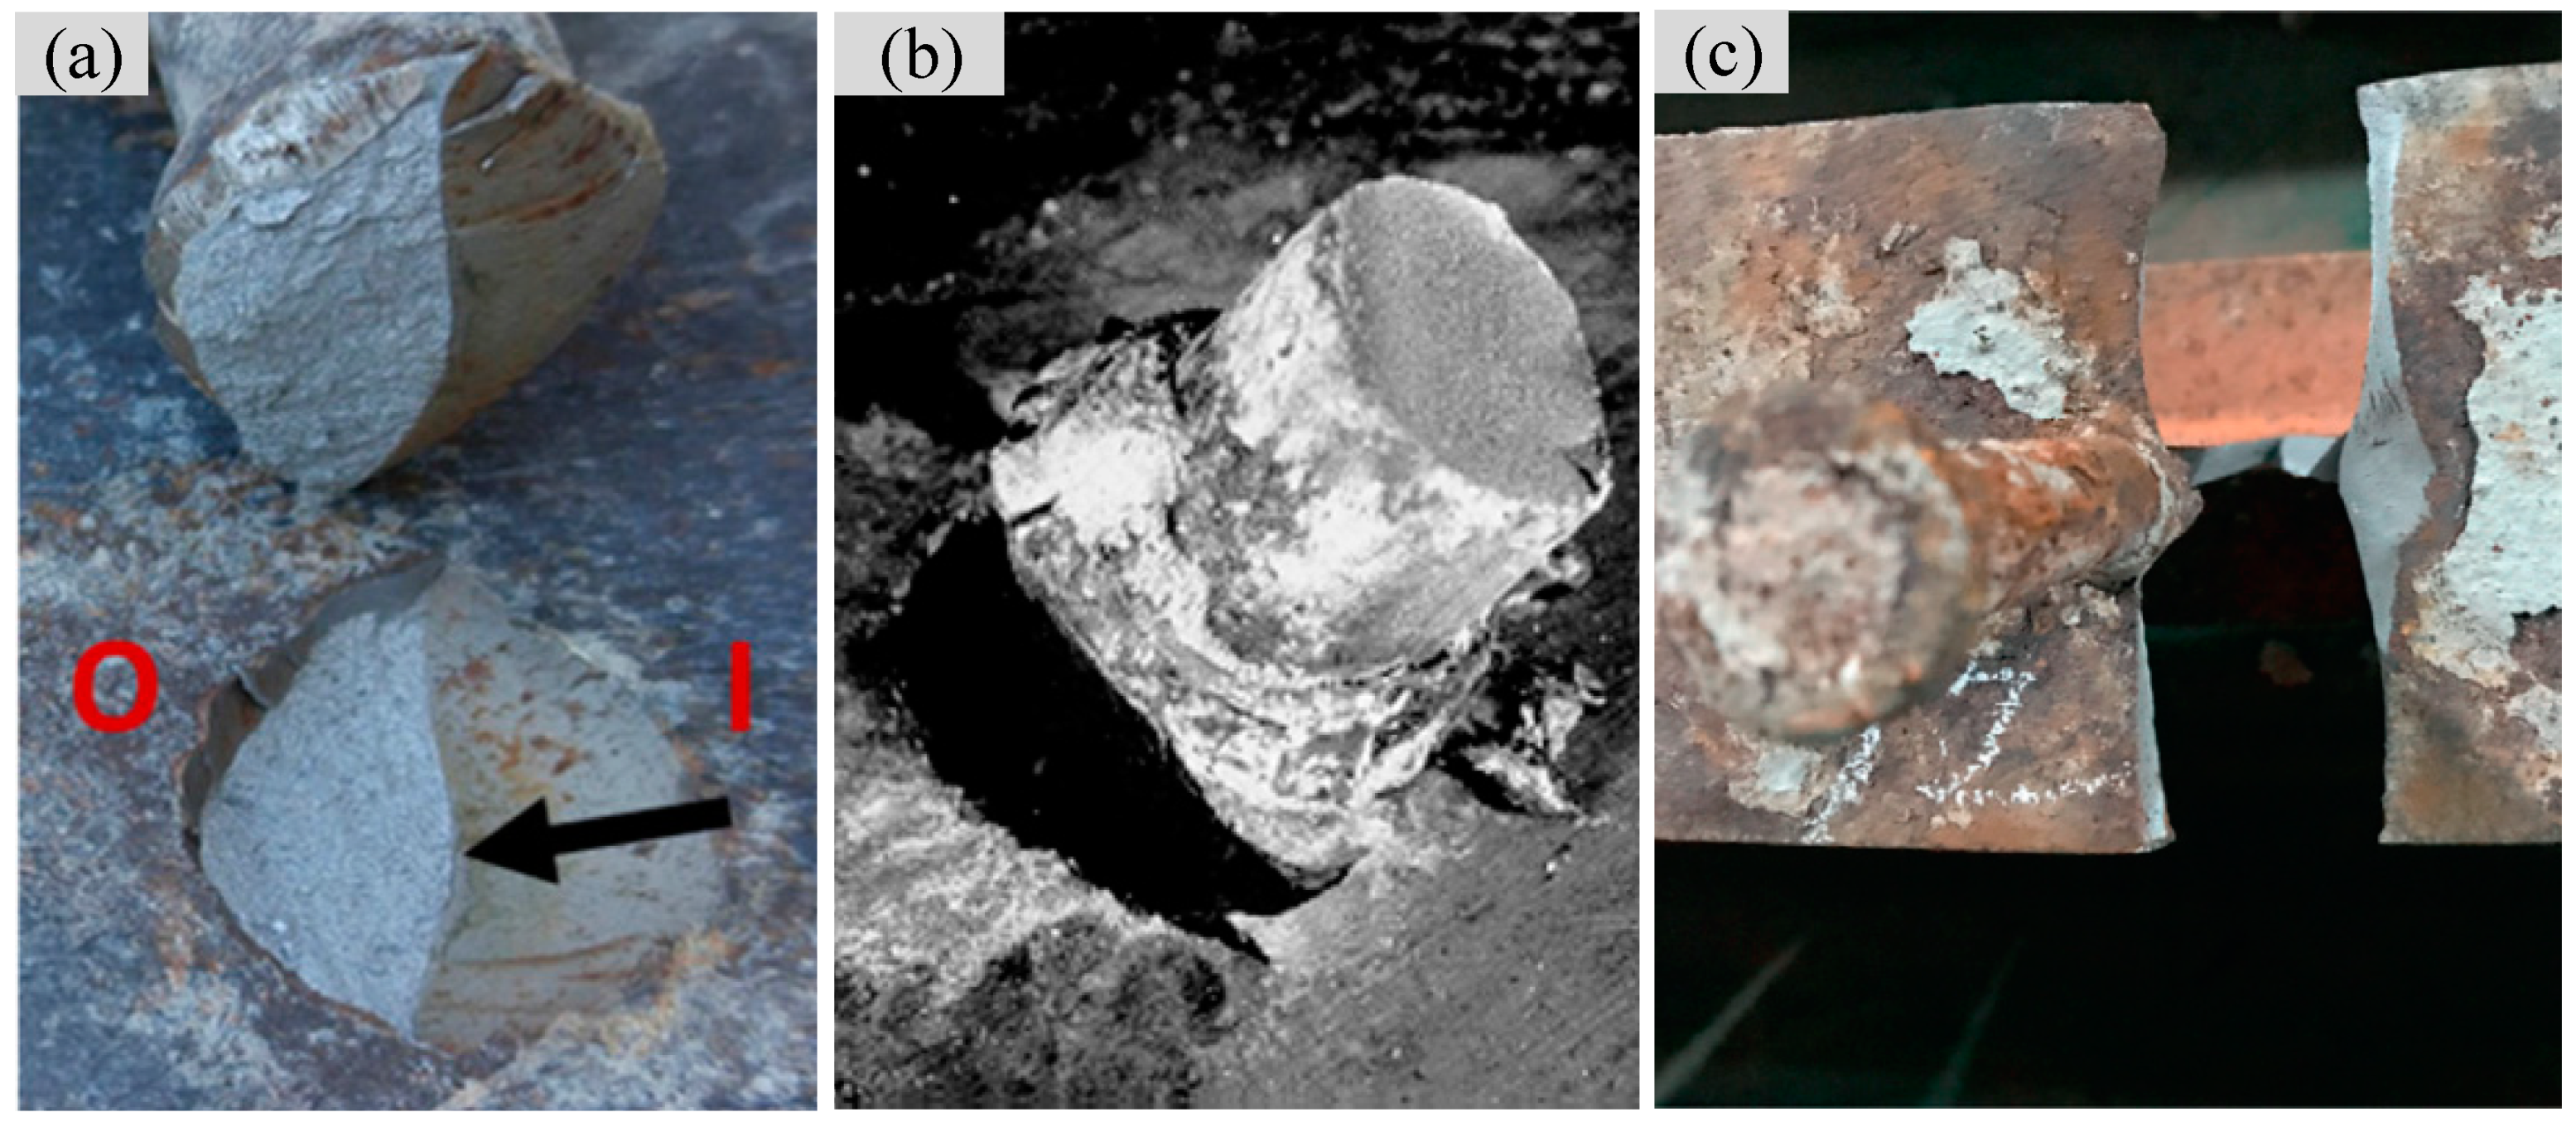
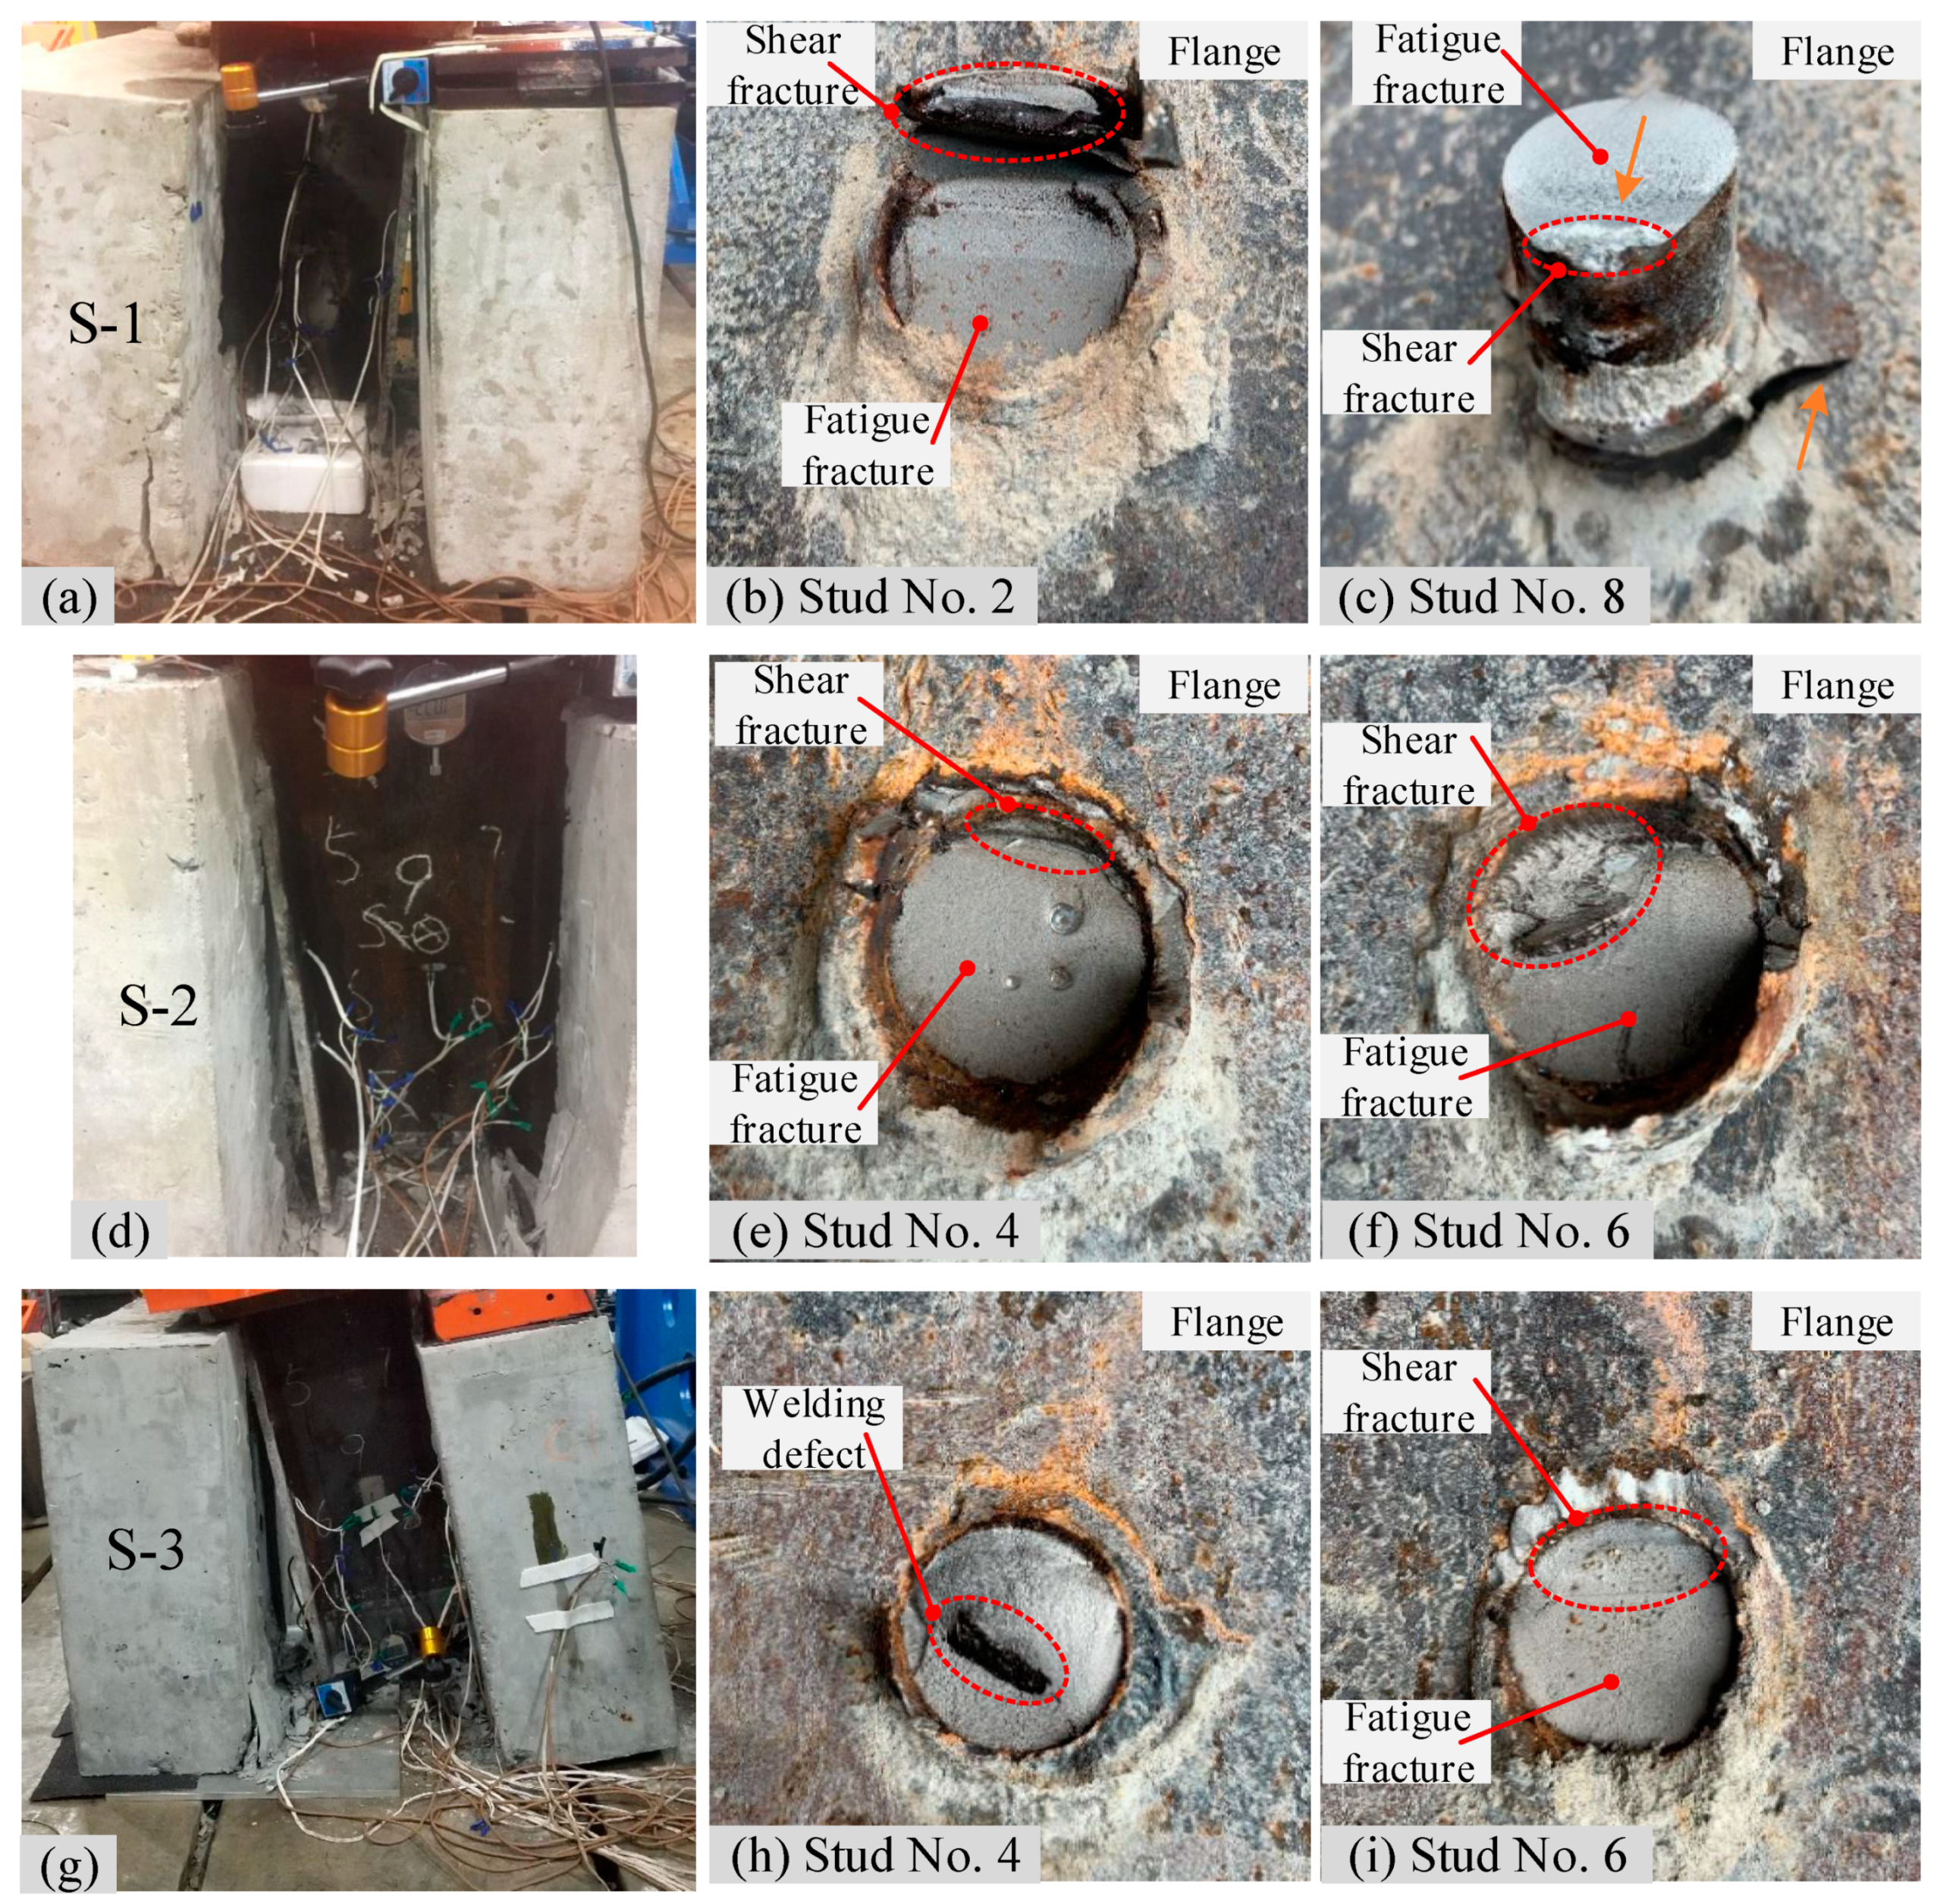
3.1. Fatigue Failure Mode

The failure details of the three specimens (S-1, S-2 and S-3) in the fatigue test are provided in Figure 6. The global failure pattern of all specimens was the fracture of headed shear studs without a large area crushing and cracking of the concrete slabs, leading to a separation between the concrete slab and the H-shaped steel column on one side (Figure 6a,d,g). As shown in Figure 6a, the bottom row shear studs (studs No. 2 and No. 8) in the left concrete slab fractured when specimen S-1 failed. For stud No. 2 of specimen S-1, the failure mode of the stud was rather peculiar (Figure 6b). The fatigue crack originated from the root of the stud and propagated through the stud shank. However, the crack propagation range exceeded the stud shank to the base metal of the steel flange plate. The final tear damage did not appear along the crack tip, but approximately perpendicular to the crack surface on the most unfavorable section of the unbroken part of the stud. It indicated that stud No. 2 was suddenly broken due to the impact effect of the suddenly increased shear load when stud No. 8 was first damaged by the fatigue load. The fatigue failure mode of stud No. 8 of specimen S-1 had some similarities with that of stud No. 2, but there were obvious differences. Except for the fatigue fracture in the stud shank, the fatigue crack growth at the root of stud No. 8 also exceeded the range of the stud shank to the steel flange plate (Figure 6c) [18]. The crack initiation positions were opposite for the two fatigue damages of stud No. 8 in the vertical direction, one at the top of the stud shank and the other one at the bottom of the welding root. Under cyclic loading, the two fatigue damages of stud No. 8 had opposite crack propagation directions, as shown in Figure 6c. However, the final failure of stud No. 8 was due to the crack on the cross-section of the stud shank that was about one stud diameter away from the welding root. Moreover, the fractured surface of shear studs (studs No. 2 and No. 8) consisted of a smooth and a rough region. The smooth region was the fatigue crack initiation and propagation surface, while the rough region was the final rupture surface caused by a critical shear load.
For specimen S-2, the bottom row studs (studs No. 4 and No. 6) in the right concrete slab fractured (Figure 6d), both of which shared the same local failure mode (Figure 6e,f). The fatigue crack started from the stud root, and propagated through the stud shank. After a certain number of fatigue loadings, the fatigue crack propagation caused a sufficient cross-section reduction in the stud and, finally, the two studs suffered the shear fracture. The global failure characteristics of specimen S-3 under cyclic loading were similar to that of specimen S-2, both of which were the fracture of studs No. 4 and No. 6 in the right concrete slab. The fractured surface of stud No. 6 (Figure 6i) at the root of the shear stud was consistent with that of the previous ruptured stud, i.e., including the fatigue and shear fracture part. However, there was a black stamp on the fracture surface of stud No. 4, which may be related to the welding defects (Figure 6h). The fracture surface of stud No. 4 was, thus, in the form of a shear fracture.
In summary, there were two kinds of local failure modes observed for headed shear studs under cyclic loading: a fracture in the root of studs (stud No. 2 of specimen S-1, studs No. 4 and No. 6 of specimens S-2 and S-3) and the fracture in the stud shank with a tearing failure from the weld collar to the steel flange plate (stud No. 8 of specimen S-1). Especially for stud No. 8 of specimen S-1, the fatigue damage occurred at both the welding root and the shank of the stud with opposite crack initiation positions in the vertical direction. The opposite crack initiation positions were due to the different material defect locations of the stud. There was a competitive relationship between the two fatigue damages of stud No. 8 in the cyclic loading. Considering the previous studies [13,17] and fatigue test results here, the final failure happened on the crack surface of the stud shank, which indicated that the fatigue cracks on the stud shank were more dangerous. From Figure 6, the steady fatigue crack growth process of all fractured studs was long, and the fatigue crack surface formed accounted for most of the cross-sectional area of the stud. The final fracture failure occurred only when the effective cross-sectional area of the stud was very small.

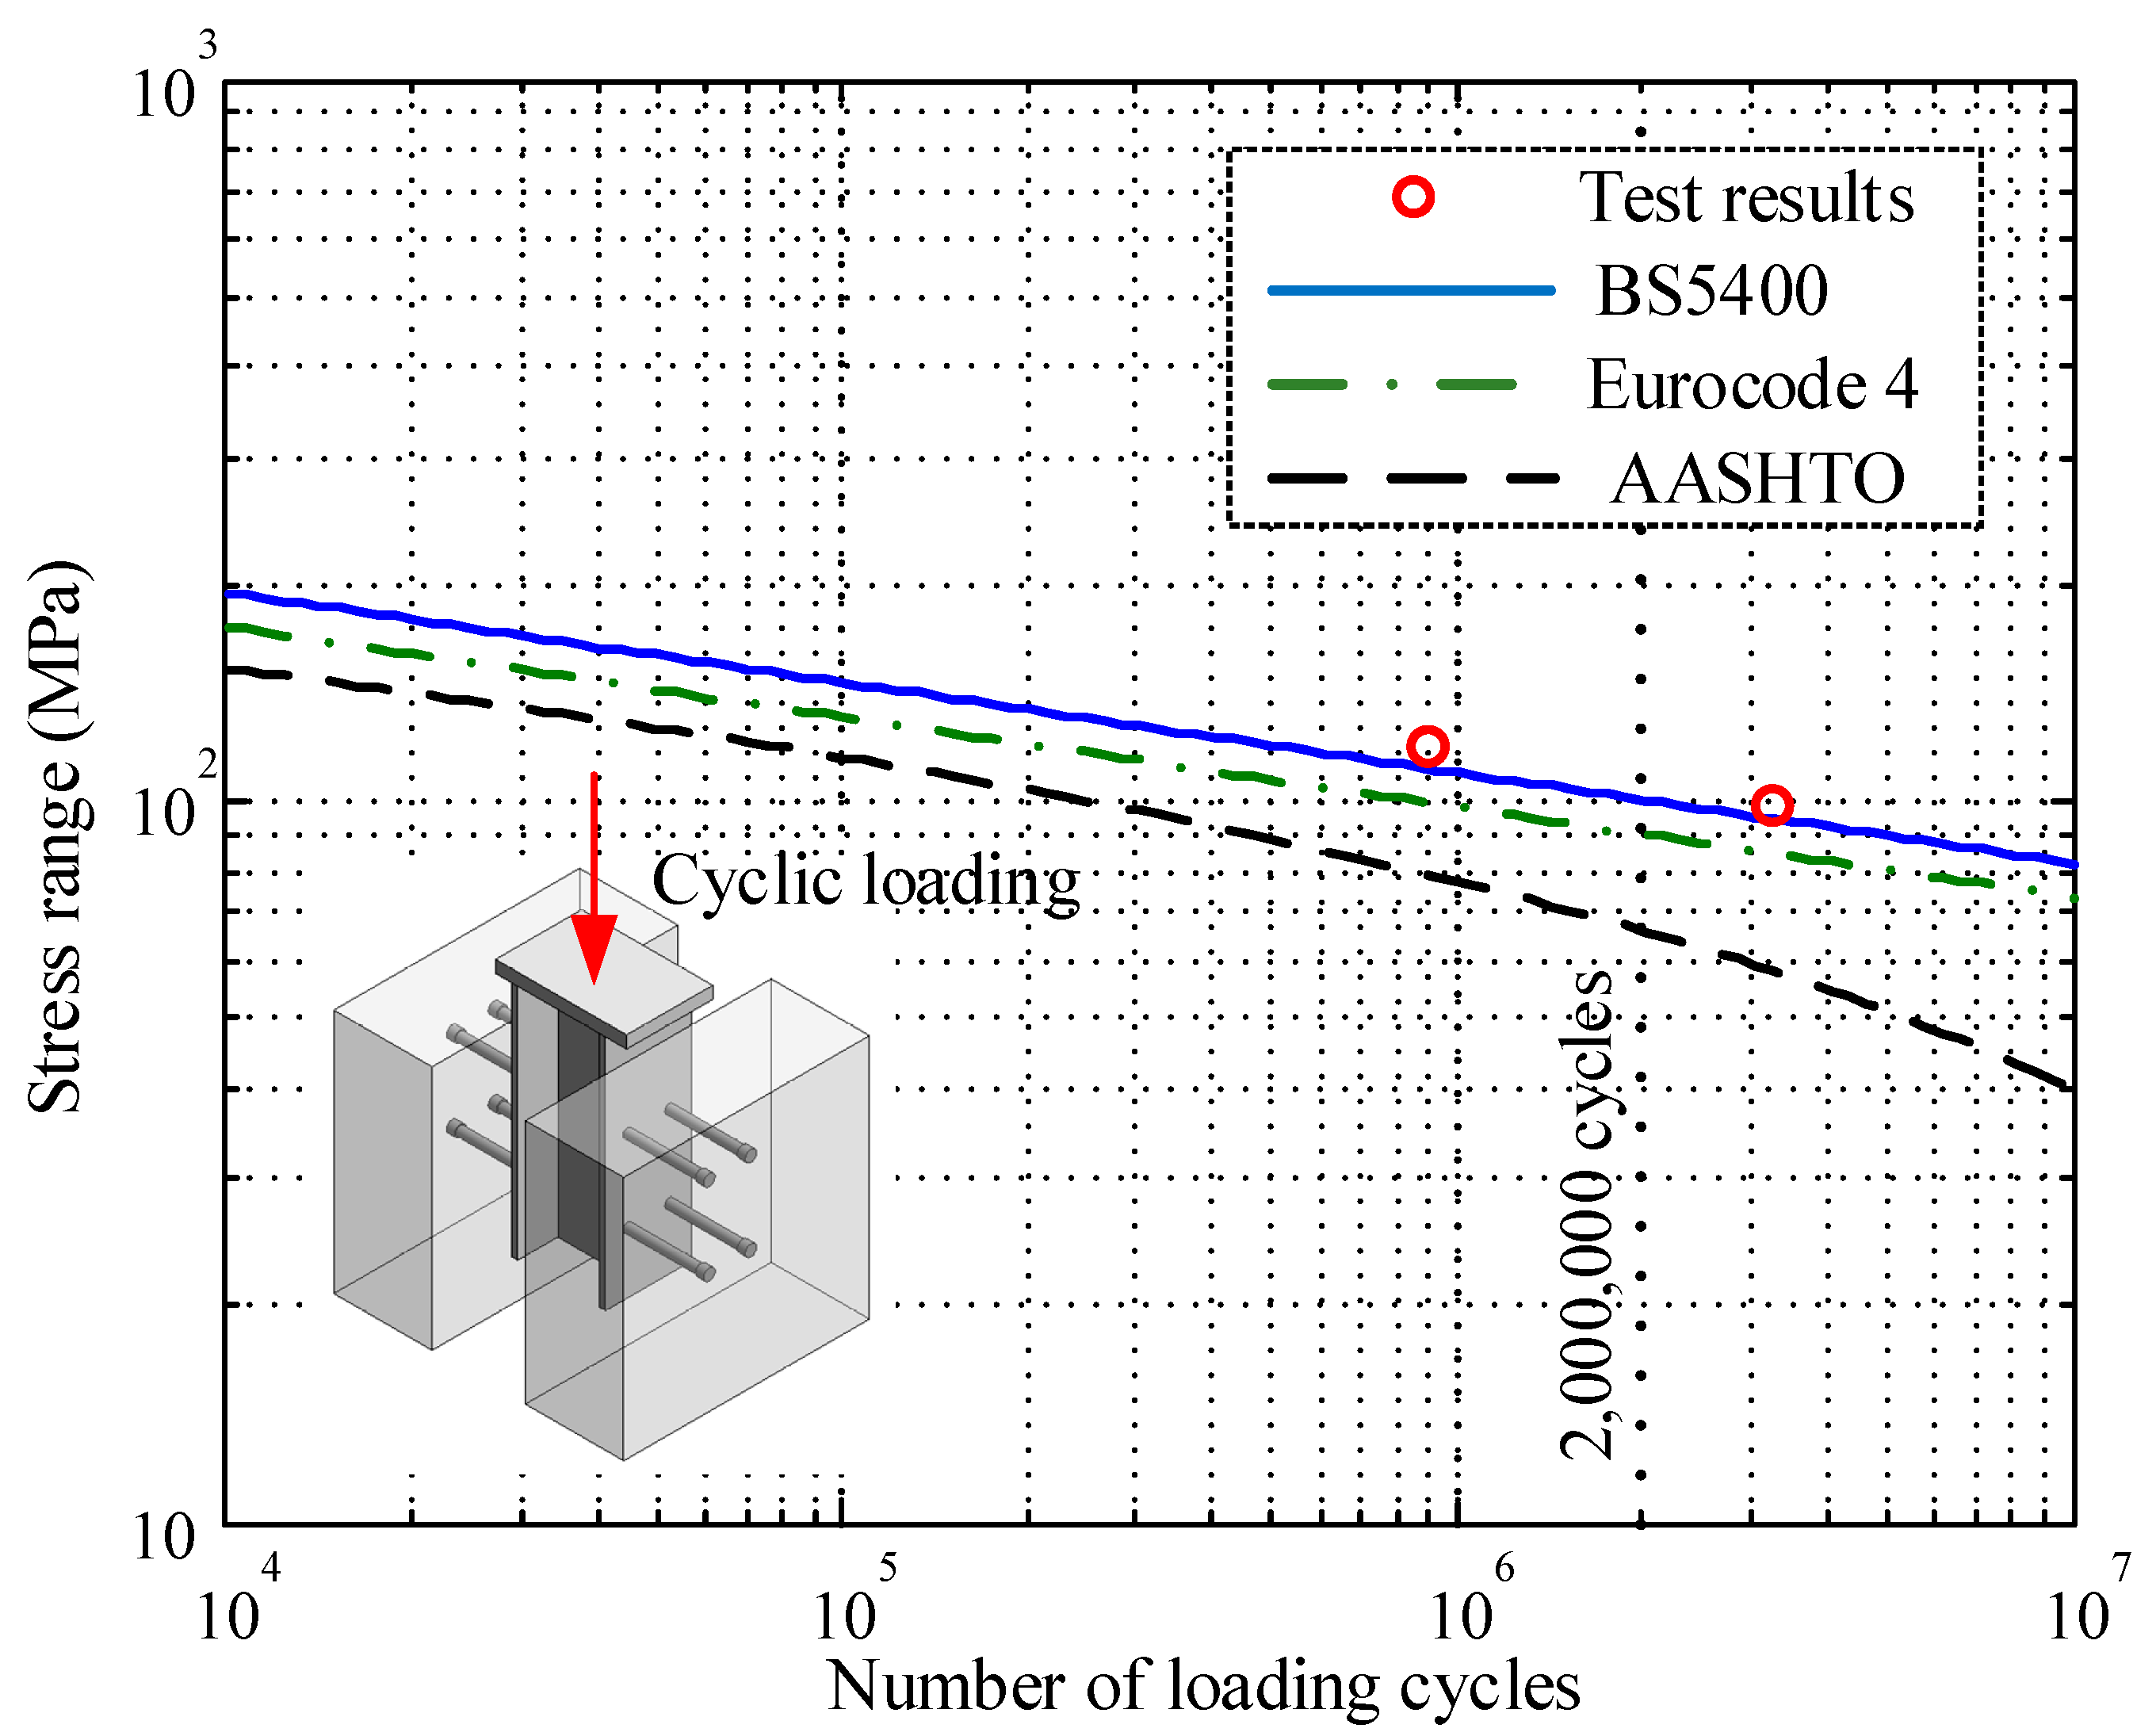
3.2. Fatigue Life Estimation

In the current different fatigue design specifications, fatigue strength curves were adopted to estimate the fatigue lives of headed shear studs according to the shear stress range as:
log(N) + mlog(Δτ) = C
where N is the number of loading cycles at a constant stress range Δτ, m is the slope of the SN curve in log–log coordinates and Δτ is the constant shear stress range of studs. C is a constant. Based on several typical civil specifications, i.e., the AASHTO [41], the Eurocode 4 [38] and the BS5400 [42], the fatigue lives of headed shear studs were estimated. The actual fatigue lives from the fatigue tests were compared with the estimated theoretical fatigue lives, as shown in Table 3.
Specimen S-1 failed after 3.28 million times of cyclic loading, and the specific failure mode is shown in Figure 6a–c. The global failure pattern of specimen S-2 was the fracture of studs No. 4 and No. 6 after loading 890,000 cycles (Figure 6d–f). For specimen S-3, it failed prematurely with the fracture of studs No. 4 and No. 6 after about 133,000 fatigue loading cycles. Then, the fracture details of studs No. 4 and No. 6 of specimen S-3 were analyzed in Figure 6h,i to find the reason behind it. For broken studs No. 2 and No. 8 of specimen S-1, No. 4 and No. 6 of specimen S-2 and No. 6 of specimen S-3 in fatigue testing, the crack initiation positions of these studs were all at the edge of the welding toe. However, for stud No. 4 of specimen S-3, the initial failure position was in the center of the stud section. This indicates that stud No. 4 of specimen S-3 had initial welding defects, which was also reflected by its fractured surface after the fatigue test in Figure 6h. With the initial welding defects, the stress concentration happened at the initial welding defects of stud No. 4 under fatigue loading, which caused the initial weld defects more prone to fatigue cracking than the welding toe. Compared with the estimated fatigue lives from Eurocode 4 and the BS5400, specimen S-3, thus, finally occurred fatigue failure prematurely after about 133,000 loading cycles. Due to the initial welding defects in stud No. 4 of specimen S-3; the fatigue life data of specimen S-3 were not included in the fatigue life analysis.
It can be seen from Table 3 that the actual fatigue lives obtained from the push-out tests were larger than the estimated fatigue lives based on different codes. The actual fatigue lives of specimens S-1 and S-2 were 11.9 and 10.9 times of the estimated fatigue lives from AASHTO, respectively. Compared with the Eurocode 4, the actual fatigue lives of the two specimens were 3.4 and 4.0 times of the corresponding estimated fatigue lives. According to Table 3, the actual fatigue lives of specimens S-1 and S-2 were 1.4 and 1.6 times of the estimated fatigue lives of the BS5400, separately. Figure 7 shows the stud fatigue lives from the push-out tests with the SN curves recommended in the AASHTO LRFD, the Eurocode 4 and the BS5400. In all the three codes, the safe fatigue life estimation of headed shear studs can be guaranteed. The safety redundancies of the three specifications were different. Compared with the SN curves of the BS5400 and the Eurocode 4, the AASHTO fatigue life evaluations had much more safety redundancies. It can be found that the push-out test results were closer to the SN curve of the BS5400 than the other two curves.

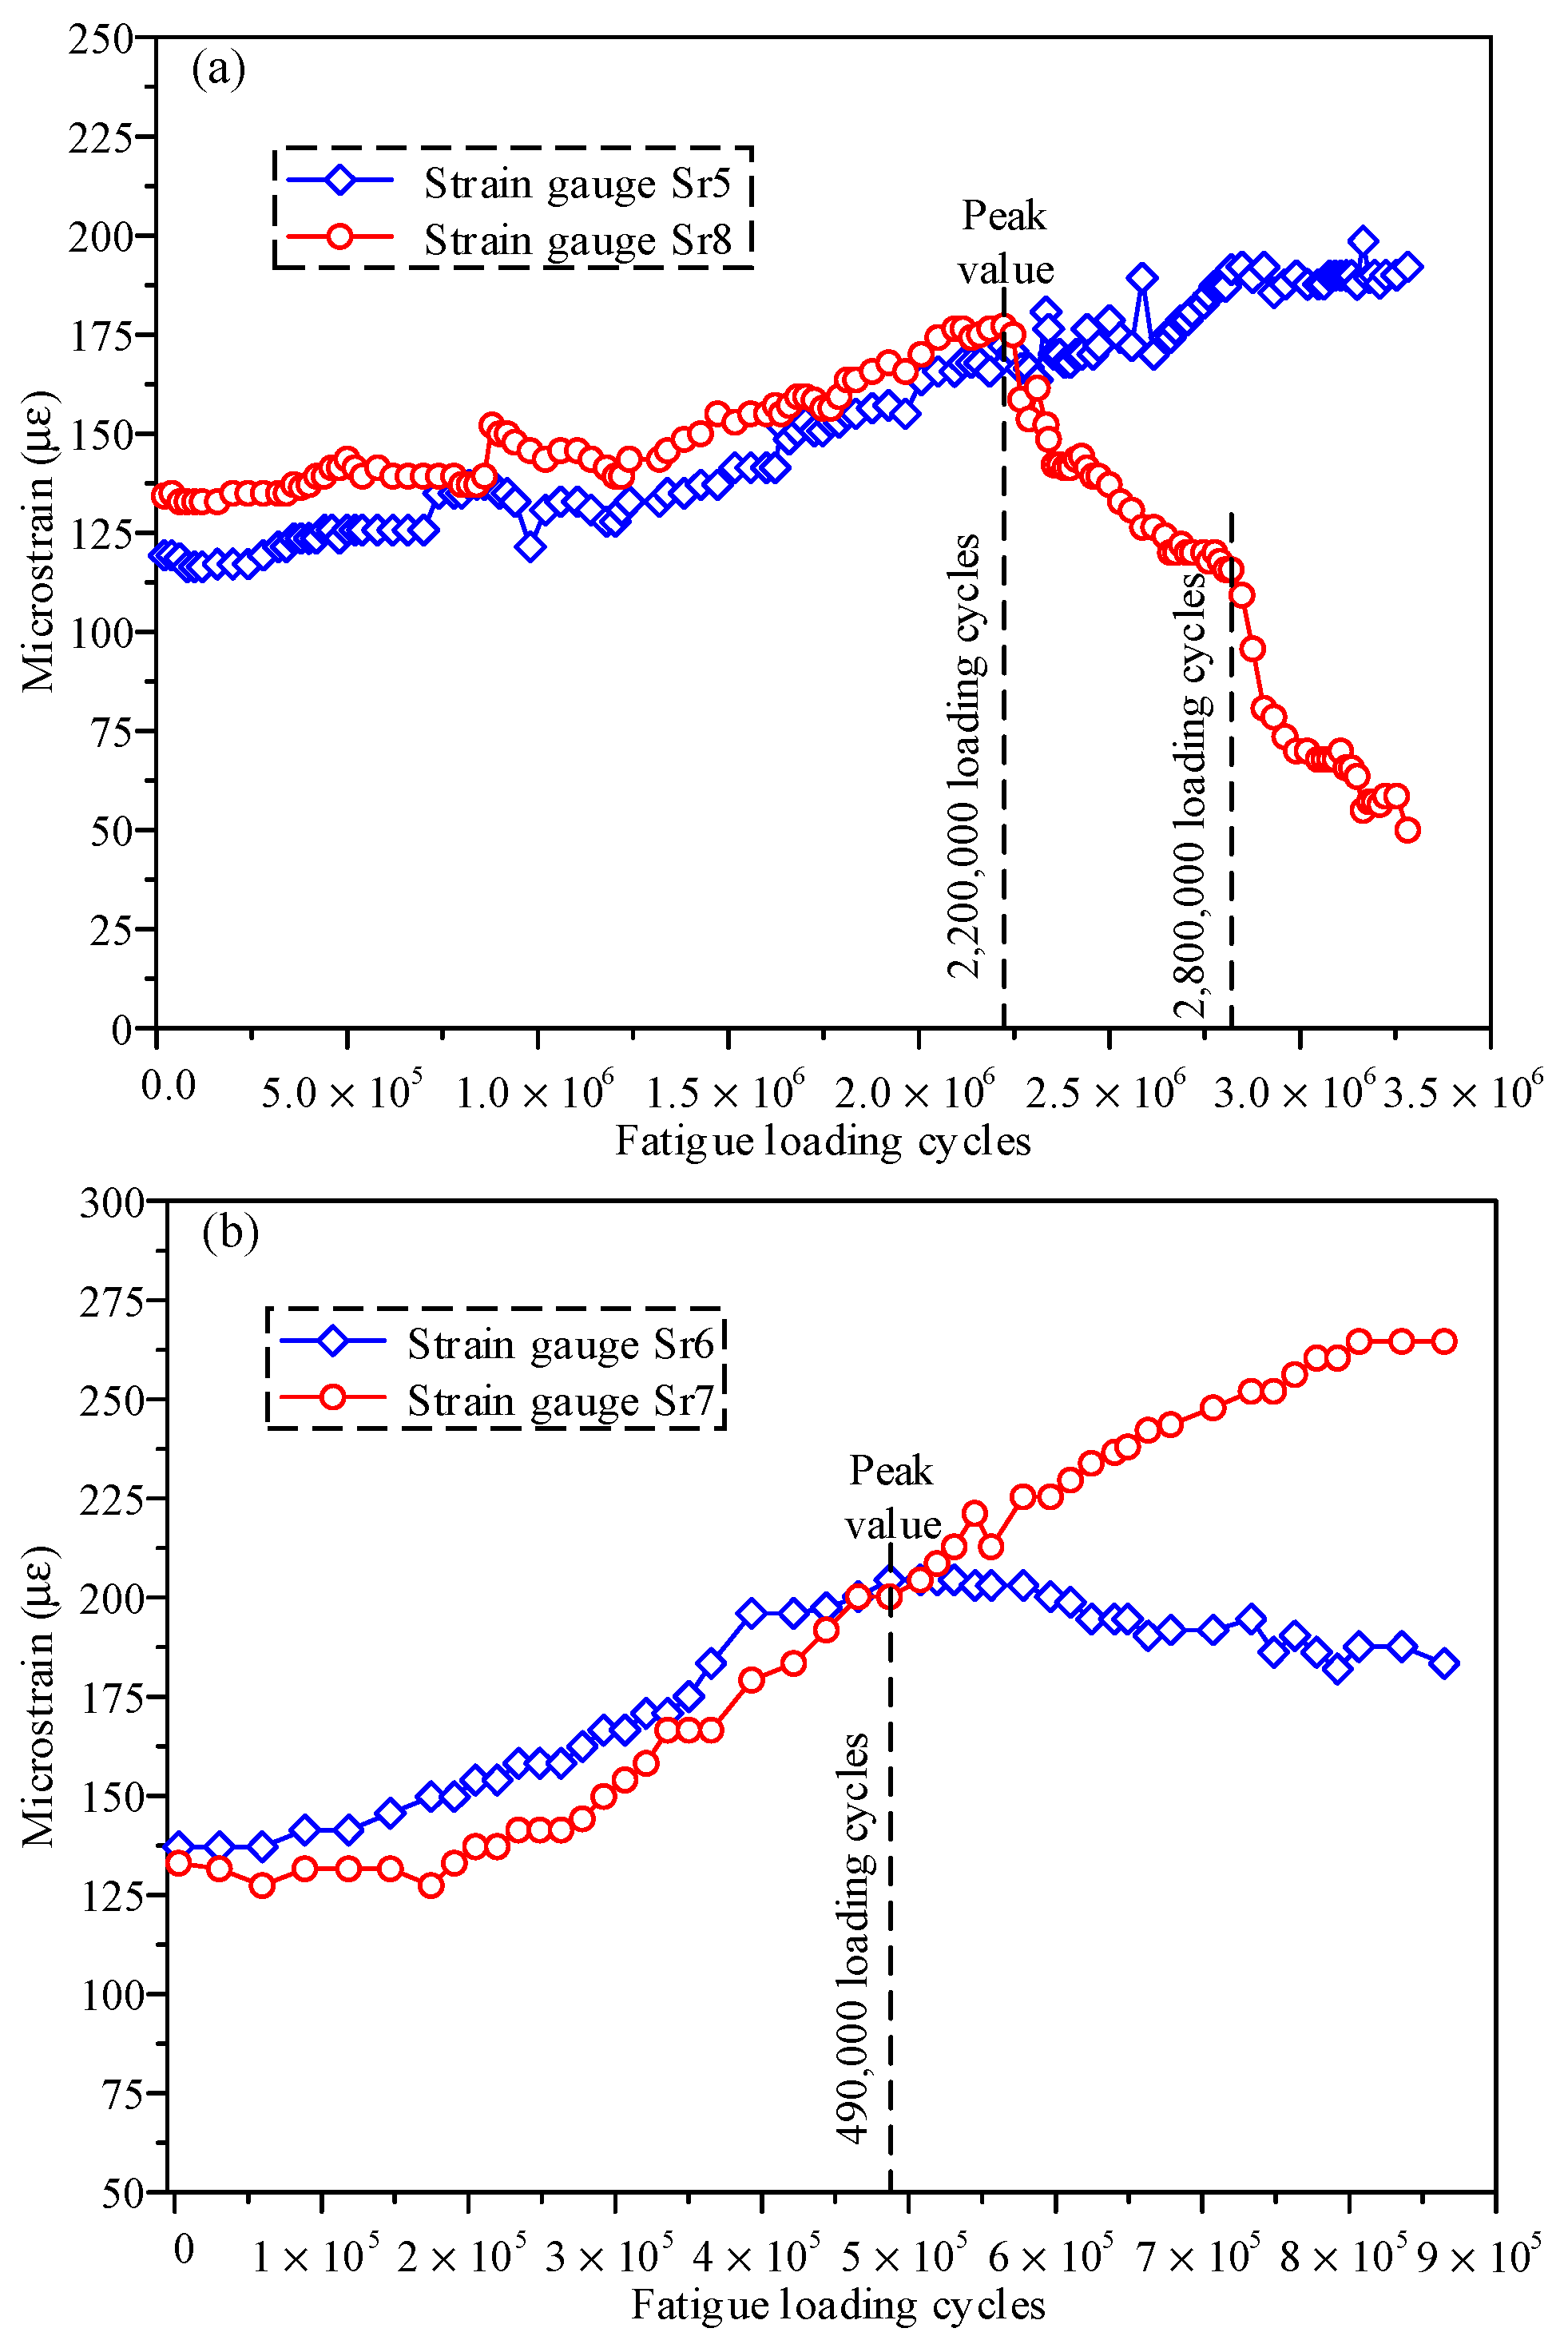
3.3. Strain Evolution under Cyclic Loading

The strain magnitudes of strain gauges in the fatigue test were not meaningful because the strain values were vulnerable to the environment and input current stability of strain gauges. However, the trend of the measured strains with the cyclic loading number reflected the damage evolution process. Studs No. 2 and No. 8 of specimen S-1 were broken when the specimen was finally in failure. Thus, the strain data from strain gauges near a good stud (Sr5) and a damaged stud (Sr8) were selected for analysis. The strains of the strain gauges Sr5 and Sr8 of specimen S-1 with the fatigue loading cycles are shown in Figure 8a. It can be seen that, in the fatigue test of specimen S-1, the strain change of strain gauge Sr8 could be divided into three stages with the loading cycles. Before 2.2 million fatigue loading cycles, the strain of Sr8 gradually increased to the peak value with the loading cycles. At about 2.2 million loading cycles, the strain of Sr8 changed abruptly, which should be due to the initiation of the fatigue crack damage in stud No. 8. From 2.2 million to 2.8 million loading cycles, the strain of Sr8 decreased slowly at a relatively uniform rate. The strain of Sr8 decreased rapidly when loading from 2.8 million to 3.0 million cycles. Stud No. 8 was damaged to a certain extent, and the stiffness decreased rapidly when it was loaded to 2.8 million cycles. The strain reached the minimum value when the specimen failed, which was only about 1/3 of the initial value. In contrast, the strain of measurement point Sr5 corresponding to the normal shear stud increased linearly and slowly with the loading cycles until the specimen failure. Finally, the strain of Sr5 was 1.6 times of the initial value. Due to the fatigue damage to some studs, the bearing capacities of shear forces decreased. With the redistribution of internal force, the shear stress borne by the good shear studs then gradually increased.
For specimen S-2, strain gauges Sr7 near a good stud (stud No. 7) and Sr6 near a fractured stud (stud No. 6) were selected to analyze the strain data, as shown in Figure 8b. Before 490,000 fatigue loading cycles, the strains of the two strain gauges increased slowly with the fatigue loading cycles, and the two values were basically in the same order. However, after loading 490,000 cycles, the strains of the two strain gauges showed an obvious differentiation. The strain of strain gauge Sr6 decreased gradually with the loading cycles, while the strain of strain gauge Sr7 continued to increase linearly at the previous speed. Thus, the strain of Sr6 reached the peak value at 490,000 fatigue loading cycles. The strain of Sr7 attained the maximum at the final failure of the specimen. It indicated that stud No. 6 corresponding to strain gauge Sr6 may have had fatigue crack damage and led to the decrease in stud stiffness at 490,000 fatigue loading cycles. After 890,000 fatigue loading cycles, specimen S-2 failed. Compared with the peak value, the strain of Sr6 decreased slightly with a small range. This is due to the larger stress amplitude (118.4 MPa) of specimen S-2 that lead to the short fatigue life and crack propagation period.
From the above analysis, the strain from the strain gauge near the good shear stud gradually increased with the fatigue loading cycles until the failure of the specimen. When a shear stud occurred fatigue damage, the strain from the corresponding strain gauge showed a consistent increasing trend followed by a decreasing behavior after reaching the peak value with the loading cycles. Additionally, the strain would not decrease to zero, even if the shear stud was fractured. It was that the mechanical interaction would still be present because of the shapes of shear studs and the flange plate at the fracture surface, which results in a residual capacity to transfer shear force even after the fatigue failure of the specimen. The effect of a fatigue crack on the shear stiffness is usually ignored in an engineering fatigue analysis. However, as shown in Figure 6, all the studs fractured only when the effective cross-sectional area was less than 10% of the nominal value of the stud. Obviously, the effect of the effective cross-sectional area reduction on the shear stiffness of the stud cannot be ignored. It was also verified by the strain evolution of intact and damaged studs in Figure 8. Although the strain measurements were helpful in estimating damage within the embedded studs over time, more detailed investigations are required to determine whether fatigue cracks actually exist.

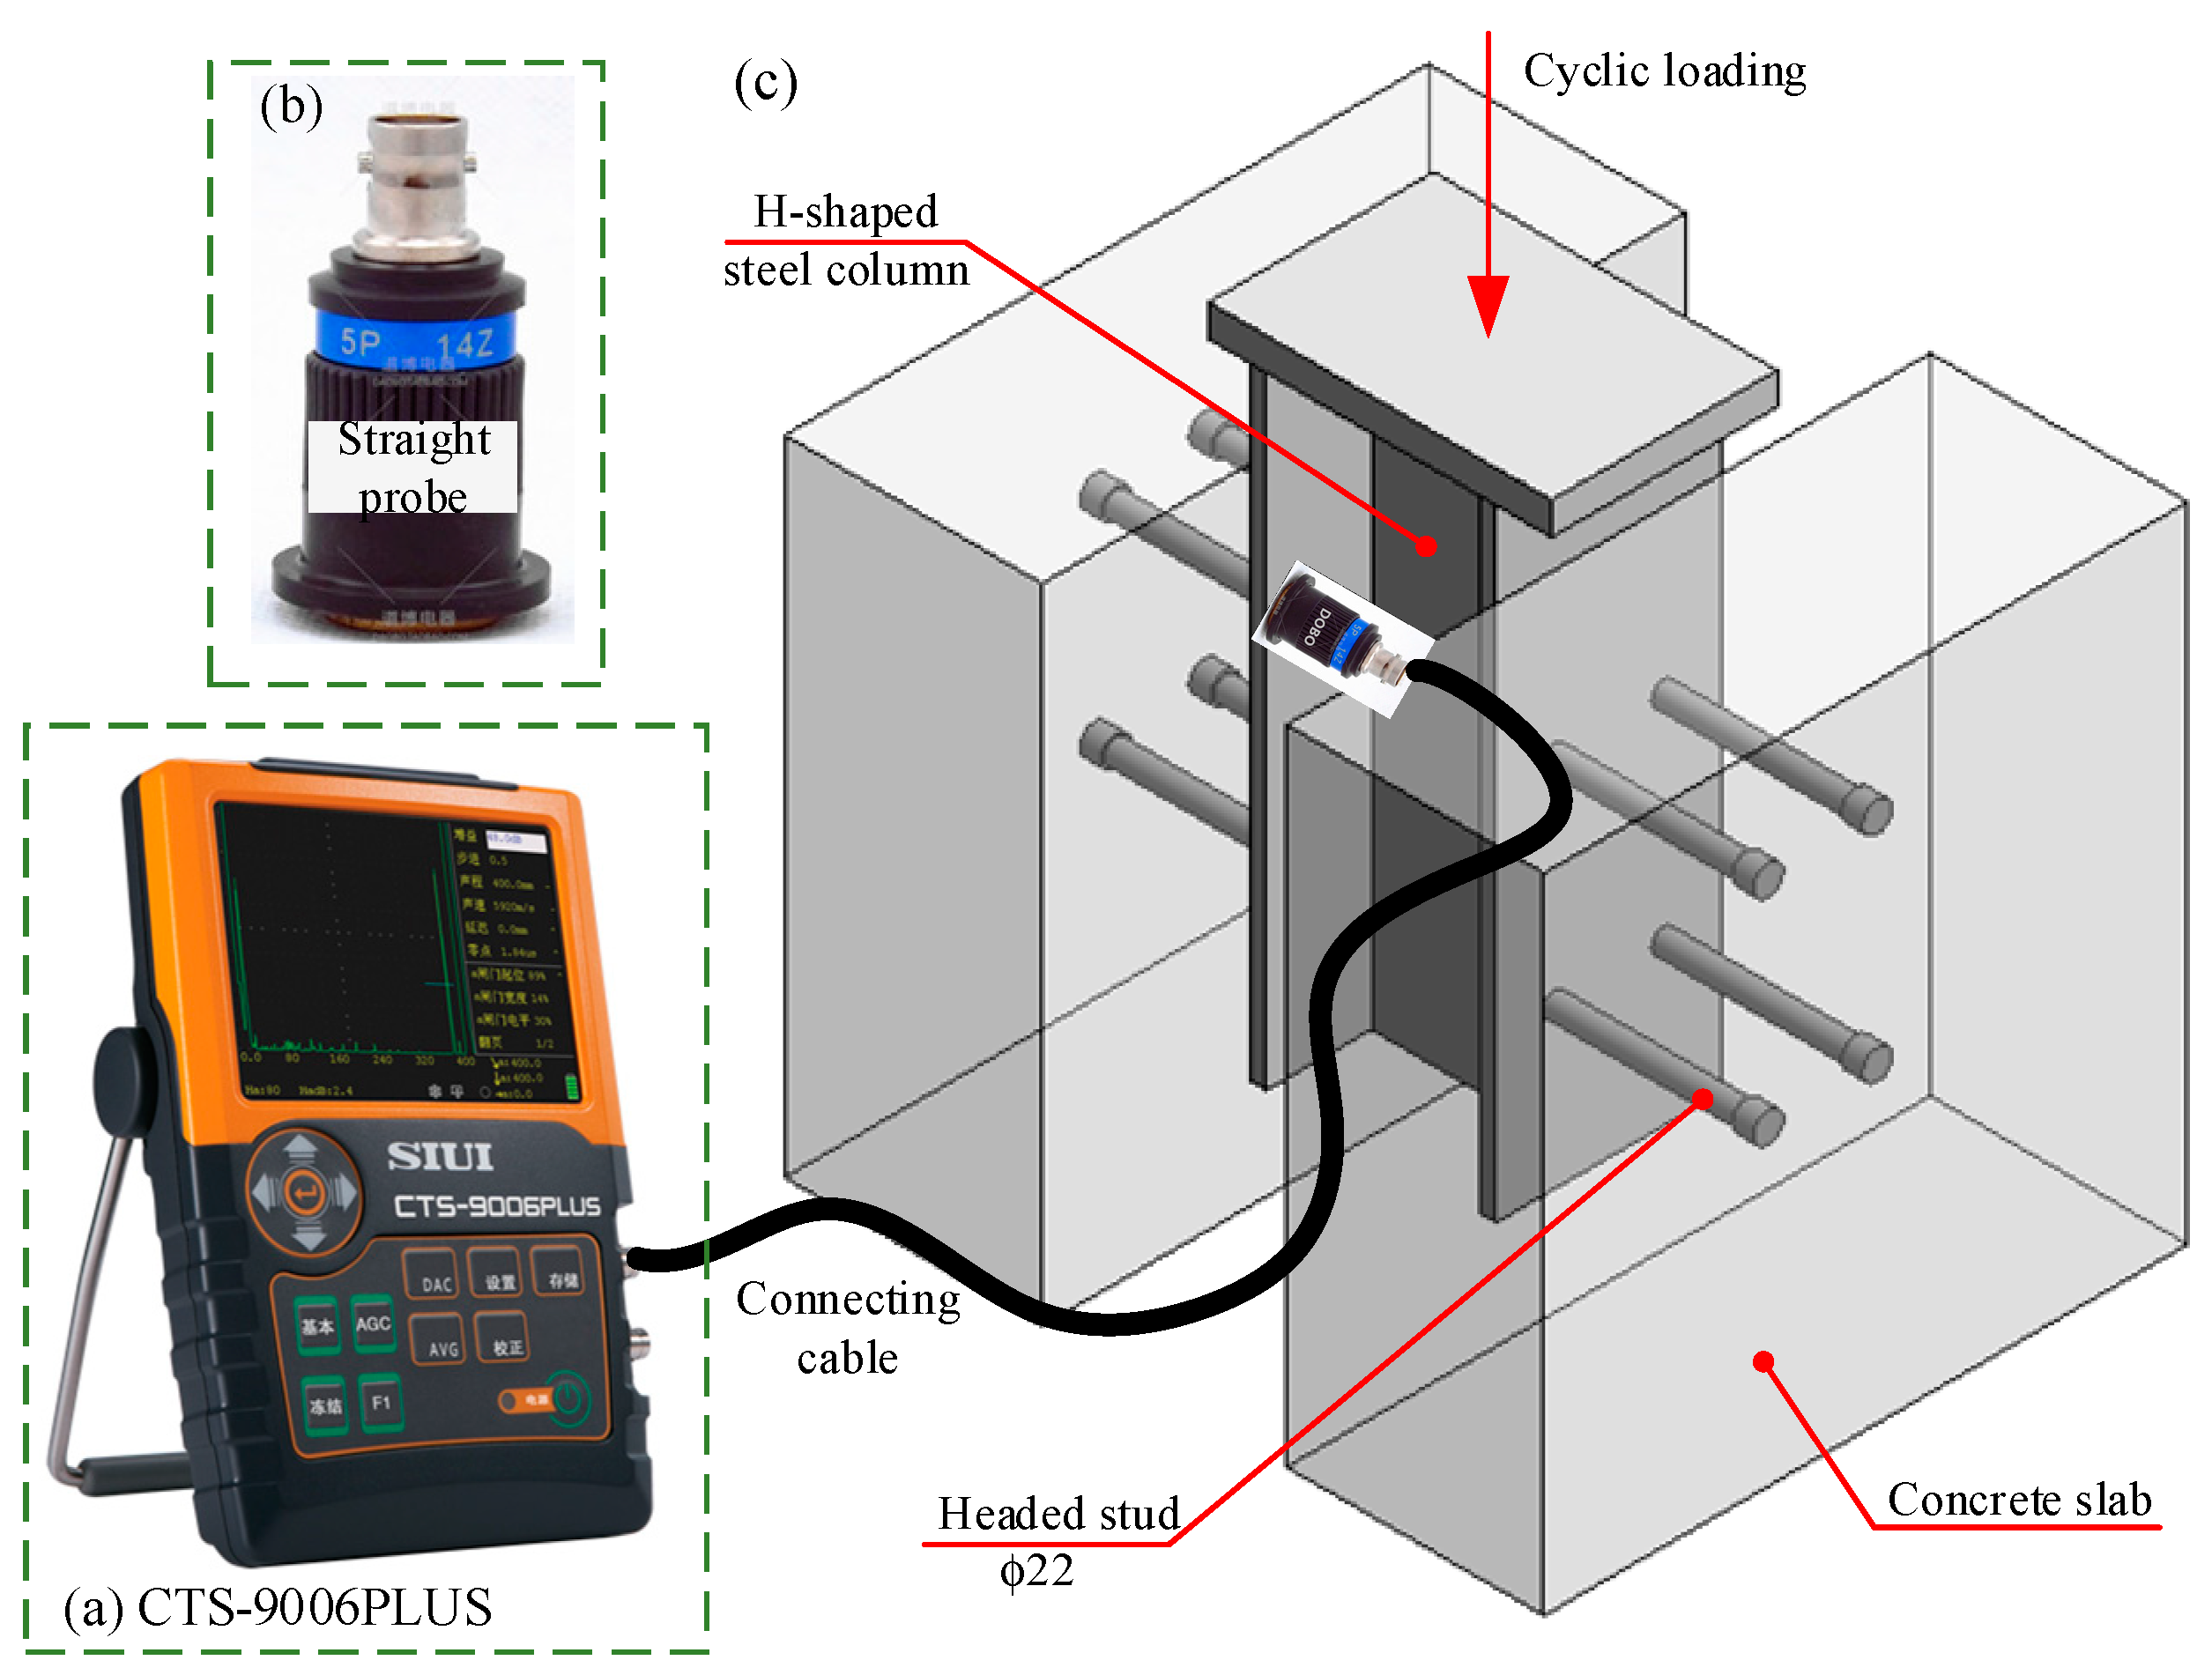
4. Ultrasonic Non-Destructive Testing of Headed Shear Studs

In the process of the fatigue test, the ultrasonic non-destructive testing was used to detect shear studs to explore whether there were fatigue cracks in shear studs and crack details. The existence of cracks in shear studs would cause the discontinuity of the steel material, which would lead to the inconsistency of acoustic impedance. The ultrasonic wave would be reflected at the interface of two kinds of media with different acoustic impedance [43].

4.1. Ultrasonic Non-Destructive Testing Equipment and Distance–Amplitude Curve

In the crack detection of headed shear studs, the digital ultrasonic flaw detector (CTS-9006PLUS) was used (Figure 9a). The detection range of the digital ultrasonic flaw detector (CTS-9006PLUS) was 0 mm to 13,000 mm, and the working frequency range was 0.5 MHz to 10 MHz. The data acquisition module of the CTS-9006PLUS was equipped with a 10-bit A/D resolution and 240 MHz maximum sampling frequency. The size of the data acquisition module was 152 mm × 240 mm × 52 mm. The vertical linearity error of the CTS-9006PLUS was less than 3%, while the corresponding value for the horizontal linearity error was 0.5%.
The longitudinal wave probe (straight probe) was employed to detect the crack properties when the studs were inspected by the ultrasonic non-destructive testing. The straight probe (5P14Z) is shown in Figure 9b. The chip diameter was 14 mm and the probe frequency could reach 5 MHz. The engine oil was adopted as the coupling agent because of the good lubrication and bonding effect between the probe and the workpiece surface. When the cyclic loading reached a certain number, the ultrasonic non-destructive crack testing was conducted to several target studs of the specimens following the detection scheme in Figure 9c. The straight probe was pasted on the inner side of the flange plate of the H-shaped steel column at the headed shear studs location by a coupling agent.
With the increase in the detection depth, the echo amplitude decreased exponentially due to the influence of signal attenuation and sound beam diffusion. The distance–amplitude curve (DAC) was to connect the reflected echo amplitudes of the same defect at different depths [44]. In the DAC, the abscissa was the ultrasonic path, and the ordinate represented the echo signal amplitude. A smooth curve (called generatrix) was used to connect several wave peaks in the DAC, which represented the trend of the curve peak. Based on the generatrix, the DB values of waste line, quantitative line and evaluation line were determined by the corresponding flaw detection standards [45]. By recording the DAC of reflection echoes, the crack details of shear studs could be obtained.

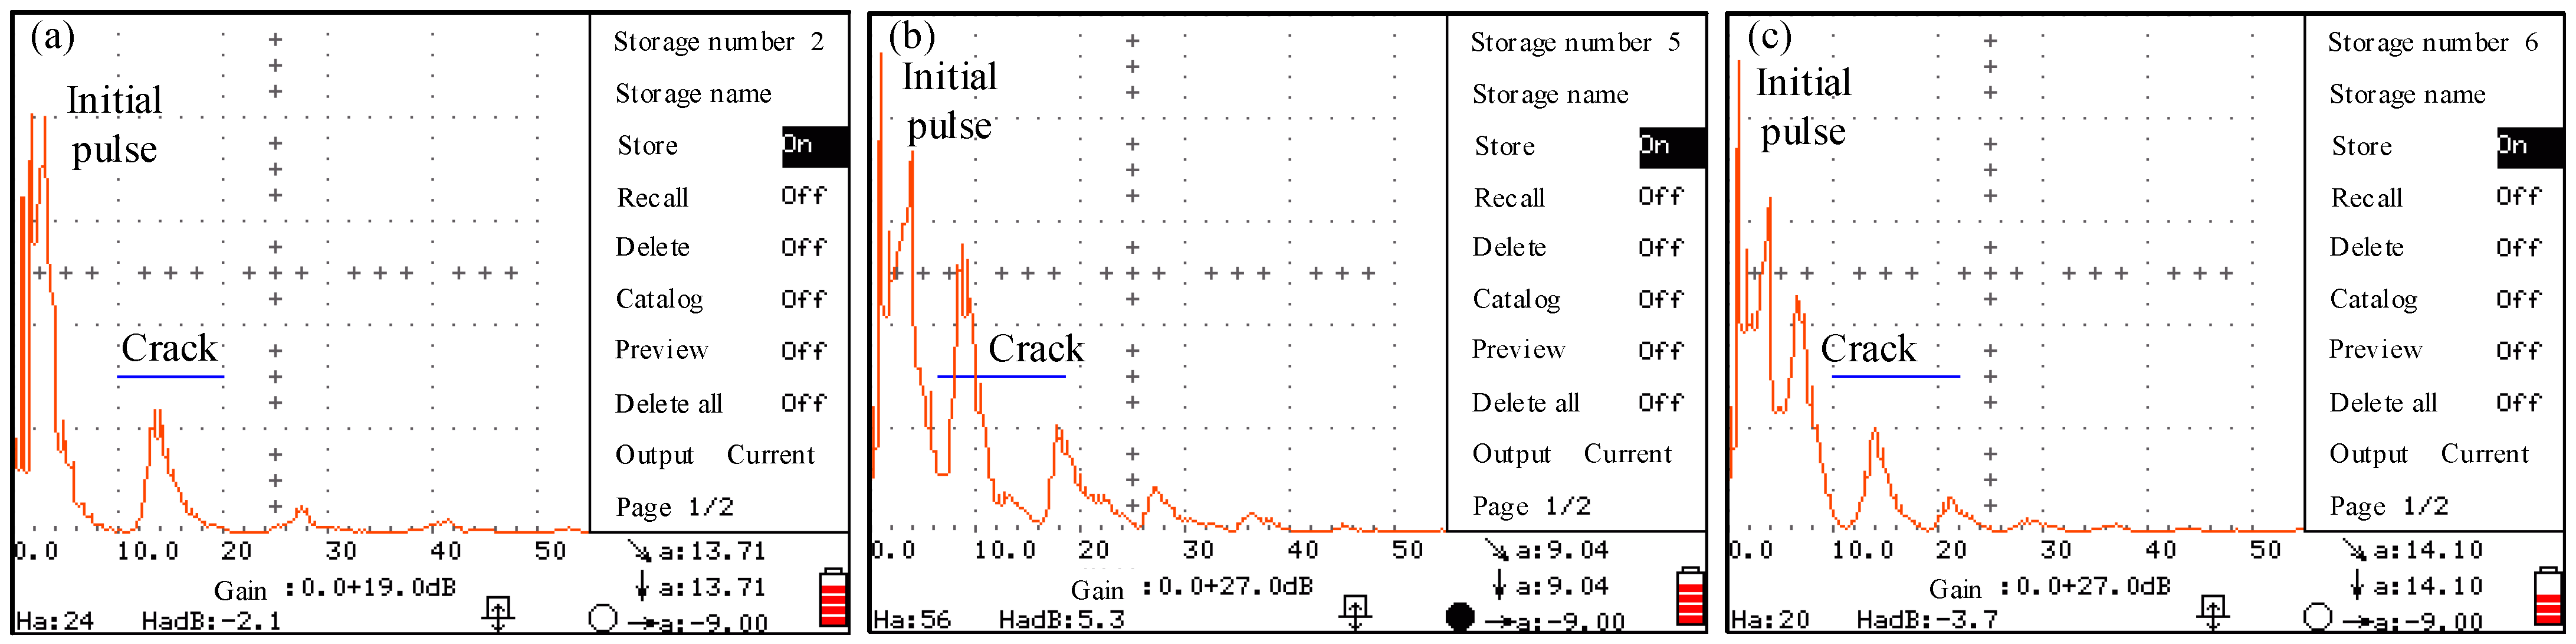
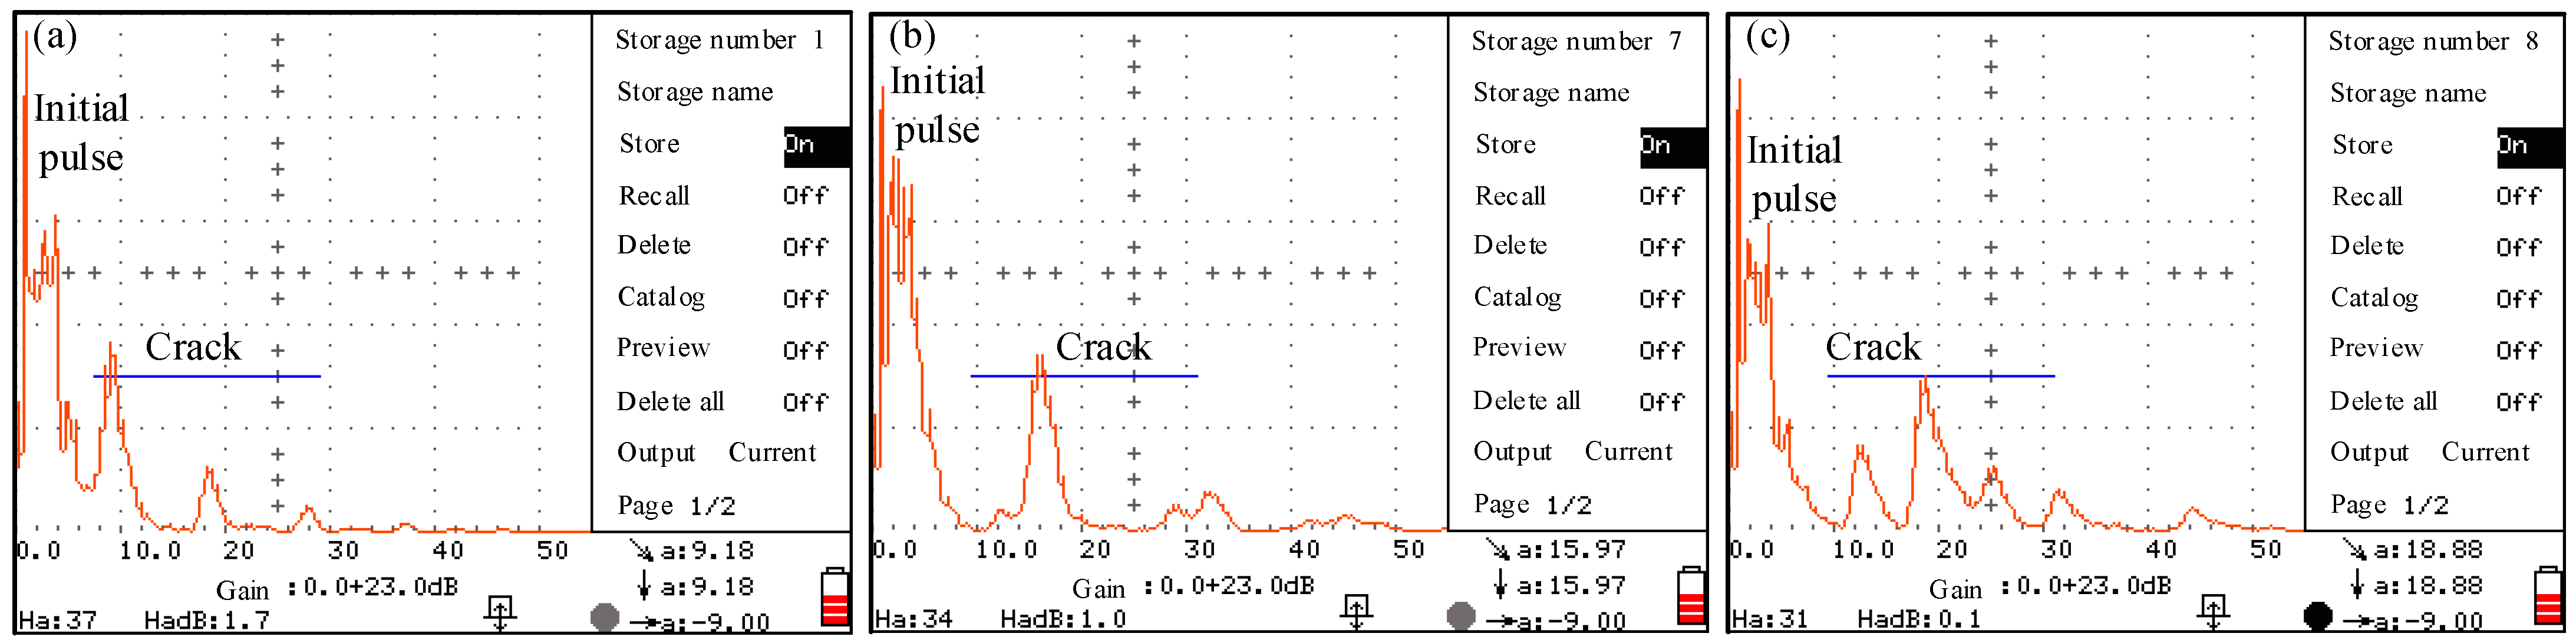
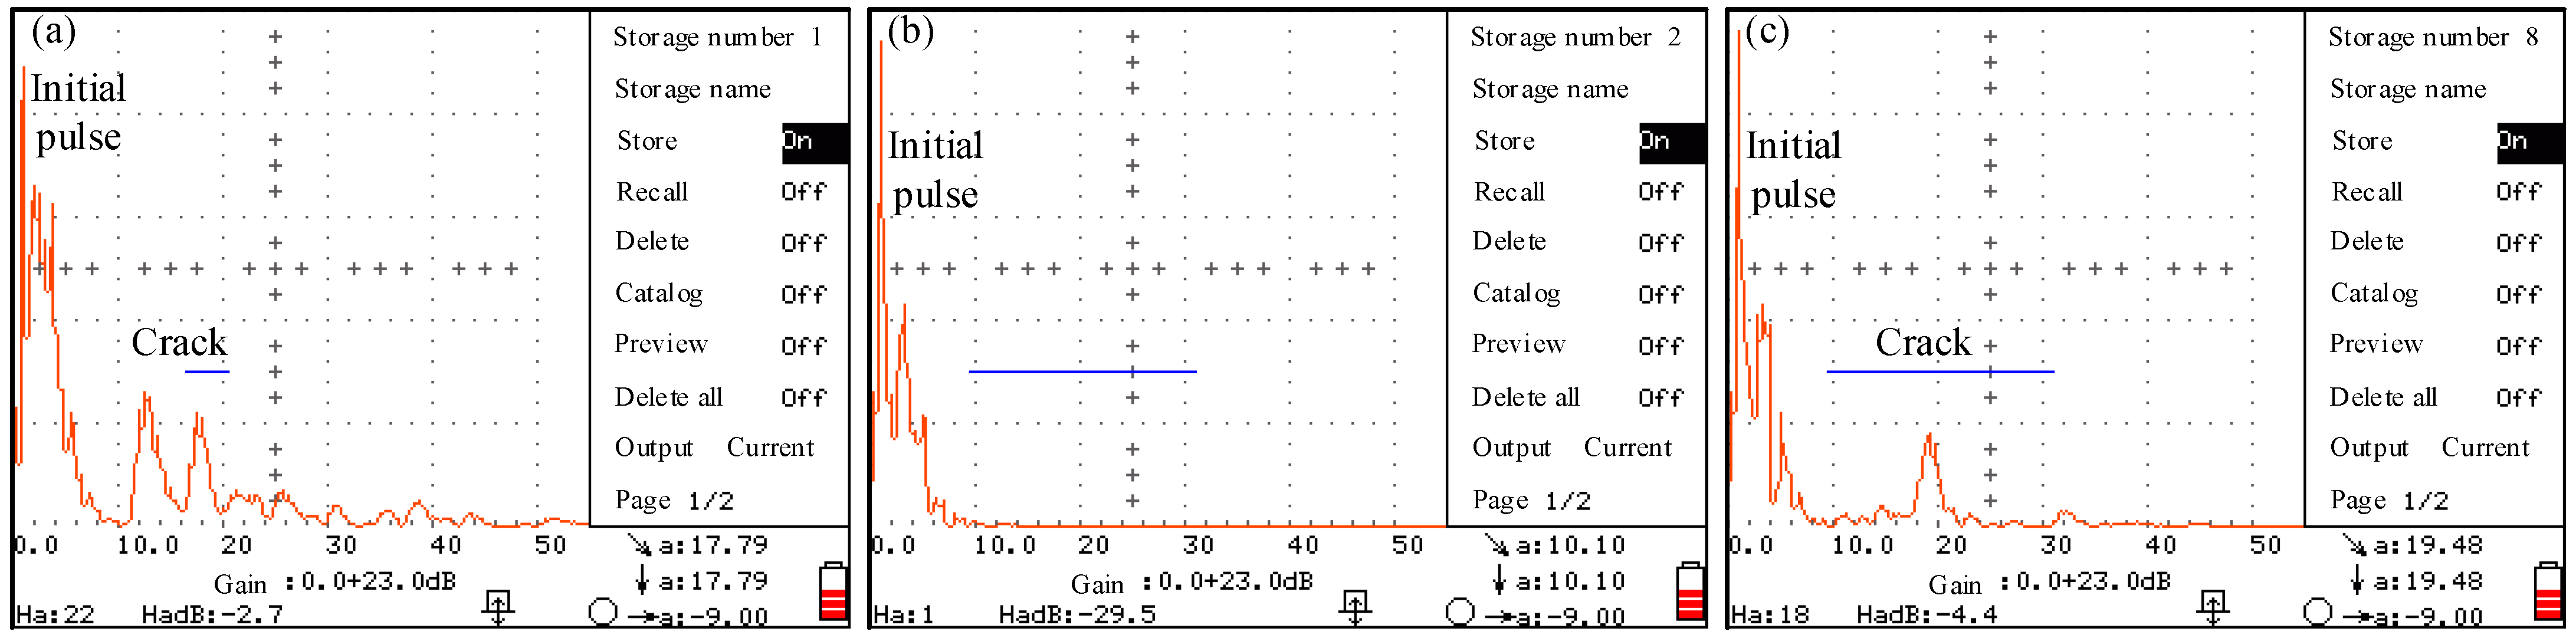
4.2. Crack Detection Results of Headed Shear Studs

Specimen S-1 was detected by the ultrasonic testing at before loading, 860,000 loading cycles, 1,240,000 loading cycles, 2,200,000 loading cycles, 2,870,000 loading cycles and the final failure time (3,280,000 loading cycles). No obvious structural damage caused by fatigue loading was found for specimen S-1 in the first four times of non-destructive testing. After 2.87 million loading cycles, a fatigue crack was detected in stud No. 2 of specimen S-1, and the rest of the studs were in good condition. In the DAC of stud No. 2 (Figure 10a), the abnormal echo appeared at the downward vertical distance 13.71 mm. At the blue gate position, the peak signal of the reflected wave was different from the material itself. With the deepening of the detection depth, the reflected echo amplitude gradually attenuated until it disappeared. It meant that there were cracks in stud No. 2 at the corresponding depth 13.71 mm. It is worth mentioning that stud No. 2 broke when specimen S-1 finally failed (Figure 6b). Thus, the ultrasonic non-destructive testing was effective in detecting failure for headed shear studs in the fatigue test. In the further analysis, the depth of the abnormal echo was also compared with the detailed size of the test specimen. When using the straight probe, the depth of the abnormal echo (the value of 13.71 mm) was basically consistent with the thickness of the flange plate with a value of 14.00 mm of the H-shaped steel column. The crack appeared at the root of stud No. 2, and the steel flange plate was also damaged.
After 3.28 million fatigue loading cycles, specimen S-1 was subjected to the sixth ultrasonic crack testing, and the studs (studs No. 3 to No. 6) at the apparently intact side were inspected. The testing results indicated that studs No. 3 and No. 4 were still intact without fatigue cracks when specimen S-1 reached the ultimate global failure. In the DAC of stud No. 5 (Figure 10b), the abnormal echo appears at the downward vertical distance 9.04 mm and 18.20 mm. The cracks, thus, appeared in the flange plate of the H-shaped steel column and the shear stud shank. The crack in the depth of 9.04 mm would lead to the tear damage to the steel flange plate. Although there was a crack in the stud shank (18.20 mm in depth), the damage in the stud shank was not serious. For stud No. 6, the depth of the abnormal echo was 14.10 mm (Figure 10c), which was consistent with the thickness of the steel flange plate. The crack developed from the root of the shear stud to the steel flange plate. Except for the depth of 14.10 mm, the echo amplitude of stud No. 6 in a deeper position was very small. Thus, there was no obvious fatigue damage in other positions.
For specimen S-2, three times ultrasonic crack testing was carried out at before fatigue loading, 700,000 loading cycles and the final failure time (890,000 loading cycles). Before loading and after loading 700,000 cycles, the ultrasonic testing results showed that the shear studs of specimen S-2 had no obvious fatigue damage. After the failure of specimen S-2 (890,000 cycles of fatigue loading), the four studs (studs No. 1, No. 2, No. 7 and No. 8) on the unbroken side were tested by using ultrasonic testing for the third time, as shown in Figure 11. The abnormal echo of stud No. 1 happened at the depth of 9.18 mm and 18.40 mm, which represented that there were cracks in the steel flange plate and the stud shank (Figure 11a). Comparatively, for stud No. 1, the fatigue damage in the steel flange plate was more serious, while the crack in the stud shank was very lighter. There was no abnormal echo in the DAC of stud No. 2, which proved that it was intact in the fatigue test. In the DAC of stud No. 7 (Figure 11b), there was an obvious abnormal echo at the depth of 15.97 mm. The damage was cracking from the root of the stud to the steel flange plate. The abnormal echo peak of stud No. 8 appeared in a deeper position (the value of 18.88 mm) in the DAC (Figure 11c). There were also abnormal echo peaks with different amplitudes near the depth of 18.88 mm. It indicated that stud No. 8 was seriously damaged at this position because of the cracks in the stud shank.
The test specimen S-3 failed earlier than expected due to the welding quality (Figure 5). An ultrasonic crack testing was still carried out after the failure (133,000 fatigue loading cycles), as shown in Figure 12. The studs on the unbroken side were detected, i.e., studs No. 1, No. 2, No. 7 and No. 8. The detection results showed that there was no abnormal echo in the DAC of studs No. 2 and No. 7 (Figure 12b). Thus, no crack existed in studs No. 2 and No. 7 in the fatigue test. However, studs No. 1 and No. 8 were found to have fatigue crack damage. The abnormal echo mainly occurred at the depth of 13.00 mm and 17.79 mm in the DAC of stud No. 1 (Figure 12a). The fatigue crack damage was serious at the root of stud No. 1. However, the abnormal echo appears at the depth of 19.48 mm for stud No. 8, and there was no obvious echo peak at other positions (Figure 12c). Thus, the fatigue damage region of stud No. 8 was small, only with a crack at the depth of 19.48 mm.

5. Conclusions and Discussions

The fatigue behaviors and the fatigue damage detection of headed shear studs in steel–concrete composite beams were experimentally studied by a series of push-out tests. The fatigue failure modes and cyclic strain evolution of test specimens were analyzed. The actual fatigue lives of test specimens were compared with the SN curves of several current design codes. The ultrasonic non-destructive testing was also adopted to detect the fatigue crack details of the shear studs. With the above investigations, the following conclusions can be drawn:
(1)
The root fracture was the main fatigue failure mode for headed shear studs under cyclic fatigue loading. Based on all the three current codes (i.e., AASHTO, Eurocode 4 and BS5400), the safe fatigue life estimation of headed shear studs can be guaranteed only with different safety redundancies.
(2)
The strain at the good shear stud gradually increased with the fatigue loading cycles until the failure of the specimen. The strain at the shear stud with fatigue damage showed a consistent increasing trend followed by decreasing behavior after reaching the peak value with the loading cycles. The strain measurements were helpful to estimate the fatigue damage to the embedded studs.
(3)
With the combination of a strain measurement, the ultrasonic non-destructive testing for fatigue crack detection of headed shear studs was feasible. The fatigue crack location of headed shear studs under cyclic loads can be measured.
The fatigue behaviors, including the failure modes, the fatigue lives, the cyclic strain evolution and the fatigue crack details of headed shear studs, were experimentally investigated. The feasibility of the ultrasonic non-destructive testing with the combination of a strain measurement for shear studs crack detection in push-out tests was proved. However, there is still a lack of detailed monitoring of the fatigue crack growth process of shear studs. Thus, in future studies, the ultrasonic non-destructive testing should be applied to monitor the fatigue crack growth process of headed shear studs in push-out tests or actual in-service composite bridges. With the dynamical inspection of fatigue crack details, the further development of our previous numerical method [32] for the accurate simulation of the fatigue crack propagation process and mechanical principles of failure modes of headed shear studs in steel–concrete composite beams will be conducted.

Author Contributions

Conceptualization, J.X. and H.S.; methodology, J.X. and H.S.; experiments, J.X. and H.S.; investigation, J.X., H.S. and X.G.; writing—original draft preparation, H.S. and J.X.; writing—review and editing, W.C. and X.G.; visualization, X.G.; supervision, W.C.; All authors have read and agreed to the published version of the manuscript.

Funding

The research was financially supported by the scientific research fund of the Yangzhou University through grant no. 137,012,308, for which the corresponding author is most grateful.

Conflicts of Interest

The authors declare no conflict of interest.

References

  1. Han, Q.; Wang, Y.; Xu, J.; Xing, Y. Static behavior of stud shear connectors in elastic concrete–steel composite beams. J. Constr. Steel Res. 2015, 113, 115–126. [Google Scholar] [CrossRef]
  2. Shim, C.; Lee, P.-G.; Yoon, T.-Y. Static behavior of large stud shear connectors. Eng. Struct. 2004, 26, 1853–1860. [Google Scholar] [CrossRef]
  3. Sjaarda, M.; Porter, T.; West, J.S.; Walbridge, S. Fatigue behavior of welded shear studs in precast composite beams. J. Bridg. Eng. 2017, 22, 04017089. [Google Scholar] [CrossRef]
  4. Slutter, R.G.; Fisher, J.W. Fatigue Strength of Shear Connectors; Highway Research Record No: New York, NY, USA, 1966; Volume 147, pp. 65–88. [Google Scholar]
  5. Hallam, M.W. The Behavior of Stud Shear Connectors under Repeated Loading; Research Rep. R281; School of Civil Engineering, University of Sydney: Sydney, Australia, 1976. [Google Scholar]
  6. Oehlers, D.; Coughlan, C. The shear stiffness of stud shear connections in composite beams. J. Constr. Steel Res. 1986, 6, 273–284. [Google Scholar] [CrossRef]
  7. Seracino, R.; Oehlers, D.J.; Yeo, M.F. Behaviour of stud shear connectors subjected to bi-directional cyclic loading. Adv. Struct. Eng. 2003, 6, 65–75. [Google Scholar] [CrossRef]
  8. Hanswille, G.; Porsch, M.; Ustundag, C. Resistance of headed studs subjected to fatigue loading: Part I: Experimental study. J. Constr. Steel Res. 2007, 63, 475–484. [Google Scholar] [CrossRef]
  9. Hanswille, G.; Porsch, M.; Ustundag, C. Resistance of headed studs subjected to fatigue loading Part II: Analytical study. J. Constr. Steel Res. 2007, 63, 485–493. [Google Scholar] [CrossRef]
  10. Ovuoba, B.; Prinz, G.S. Fatigue capacity of headed shear studs in composite bridge girders. J. Bridg. Eng. 2016, 21, 04016094. [Google Scholar] [CrossRef] [Green Version]
  11. Maeda, Y.; Matsuyi, S. Effects of Concrete Placing Direction on Static and Fatigue Strengths of Stud; Technology Reports of the Osaka University: Osaka, Japan, 1983; pp. 397–406.
  12. Badie, S.S.; Tadros, M.K.; Kakish, H.F.; Splittgerber, D.L.; Baishya, M.C. Large shear studs for composite action in steel bridge girders. J. Bridg. Eng. 2002, 7, 195–203. [Google Scholar] [CrossRef]
  13. Lee, P.-G.; Shim, C.-S.; Chang, S.-P. Static and fatigue behavior of large stud shear connectors for steel–concrete composite bridges. J. Constr. Steel Res. 2005, 61, 1270–1285. [Google Scholar] [CrossRef]
  14. Okada, J.; Yoda, T.; Lebet, J.P. A study of the grouped arrangements of stud connectors on shear strength behavior. J. Struct. Mech. Earthq. Eng. 2006, 23, 75S–89S. [Google Scholar] [CrossRef] [Green Version]
  15. Shim, C.S.; Lee, P.G.; Kim, D.W.; Chung, C.H. Effects of group arrangement on the ultimate strength of stud shear connection. In Proceedings of the International Conference on Composite Construction in Steel and Concrete IV; Leon, R.T., Perea, T., Rassati, C.A., Lange, J., Eds.; ASCE: Reston, VA, USA, 2008; pp. 92–101. [Google Scholar]
  16. Xu, C.; Sugiura, K.; Su, Q.T. Fatigue behavior of the group stud shear connectors in steel-concrete composite bridges. J. Bridge Eng. 2018, 23, 04018055. [Google Scholar] [CrossRef]
  17. Huh, B.; Lam, C.; Tharmabala, B. Effect of shear stud clusters in composite girder bridge design. Can. J. Civ. Eng. 2015, 42, 259–272. [Google Scholar] [CrossRef]
  18. Oehlers, D.J.; Seracino, R.; Yeo, M.F. Fatigue behaviour of composite steel and concrete beams with stud shear connections. Prog. Struct. Eng. Mater. 2000, 2, 187–195. [Google Scholar] [CrossRef]
  19. Chen, J.; Zhang, H.; Yu, Q.-Q. Static and fatigue behavior of steel-concrete composite beams with corroded studs. J. Constr. Steel Res. 2019, 156, 18–27. [Google Scholar] [CrossRef]
  20. Ollgaard, J.G.; Slutter, R.G.; Fisher, J.W. Shear strength stud connect. lightweight normal-weight concrete. Aisc Eng. J. 1971, 8, 56–64. [Google Scholar]
  21. Xu, H.Y.; Tang, X.B. Research on the fatigue performance of lightweight aggregate concrete headed stud connectors. J. Railw. Eng. Soc. 2013, 176, 97–101. (In Chinese) [Google Scholar]
  22. Xu, C.; Su, Q.; Masuya, H. Static and fatigue behavior of the stud shear connector in lightweight concrete. Int. J. Steel Struct. 2018, 18, 569–581. [Google Scholar] [CrossRef]
  23. Kim, J.-S.; Kwark, J.; Joh, C.; Yoo, S.-W.; Lee, K.-C. Headed stud shear connector for thin ultrahigh-performance concrete bridge deck. J. Constr. Steel Res. 2015, 108, 23–30. [Google Scholar] [CrossRef]
  24. Cao, J.; Shao, X.; Deng, L.; Gan, Y. Static and fatigue behavior of short-headed studs embedded in a thin ultrahigh-performance concrete layer. J. Bridge Eng. 2017, 22, 04017005. [Google Scholar] [CrossRef]
  25. Kruszewski, D.; Wille, K.; Zaghi, A.E. Push-out behavior of headed shear studs welded on thin plates and embedded in UHPC. Eng. Struct. 2018, 173, 429–441. [Google Scholar] [CrossRef]
  26. Qian, S.; Li, V.C. Influence of concrete material ductility on shear response of stud connections. ACI Mater. J. 2006, 103, 60–66. [Google Scholar]
  27. Liu, Y.; Zhang, Q.; Bao, Y.; Bu, Y. Static and fatigue push-out tests of short headed shear studs embedded in Engineered Cementitious Composites (ECC). Eng. Struct. 2018, 182, 29–38. [Google Scholar] [CrossRef]
  28. Mafipour, M.S.; Tatlari, S.; Azad, A.R.G.; Shahverdi, M.; Mohammadi, S. Fatigue behavior of headed stud shear connectors in steel-concrete composite bridge girders. In Proceedings of the 3rd International Conference on Applied Research in Structural Engineering and Constructional Management, Tehran, Iran, 26–27 June 2019. [Google Scholar]
  29. Balkos, K.D.; Sjaarda, M.; West, J.S.; Walbridge, S. Static and fatigue tests of steel-precast composite beam specimens with through-bolt shear connectors. J. Bridg. Eng. 2019, 24, 04019036. [Google Scholar] [CrossRef]
  30. El-Lobody, E.; Lam, D. Finite element analysis of steel-concrete composite girders. Adv. Struct. Eng. 2003, 6, 267–281. [Google Scholar] [CrossRef]
  31. Mia, M.; Bhowmick, A.K. A finite element based approach for fatigue life prediction of headed shear studs. Structures 2019, 19, 161–172. [Google Scholar] [CrossRef] [Green Version]
  32. Xu, J.; Sun, H.; Xie, Z.; Sun, J. Fatigue behaviour study of the shear stud using crack box technology and m integral method. Int. J. Steel Struct. 2019, 19, 1249–1259. [Google Scholar] [CrossRef]
  33. Ovuoba, B.; Prinz, G. Investigation of residual fatigue life in shear studs of existing composite bridge girders following decades of traffic loading. Eng. Struct. 2018, 161, 134–145. [Google Scholar] [CrossRef]
  34. Liu, K.; De Roeck, G. Damage detection of shear connectors in composite bridges. Struct. Health Monit. 2009, 8, 345–356. [Google Scholar] [CrossRef]
  35. Ma, X.; Su, S.; Wang, W.; Yang, Y. Experimental and theoretical analysis of the correlation between cumulative plastic damage and SMFL of structural steel under low cycle fatigue. J. Magn. Magn. Mater. 2021, 538, 168292. [Google Scholar] [CrossRef]
  36. Nobile, R.; Saponaro, A. Real-time monitoring of fatigue damage by Electrical Resistance Change method. Int. J. Fatigue 2021, 151, 106404. [Google Scholar] [CrossRef]
  37. Lehner, P.; Gołaszewski, J. Relationship of different properties from non-destructive testing of heavy concrete from magnetite and serpentinite. Materials 2021, 14, 4288. [Google Scholar] [CrossRef] [PubMed]
  38. ENV 1994, Design of Composite Steel and Concrete Structures-Part 2: General Rules and Rules for Bridges; European Committee for Standardization: Brussels, Belgium, 2005.
  39. Ministry of Housing and Urban-Rural Development of the People’s Republic of China. Code for Design of Concrete Structures; GB 50010-2010; China Architecture & Building Press: Beijing, China, 2015.
  40. Structural Steel for Bridge; GB/T 714-2015; Standardization Administration of China: Beijing, China, 2015.
  41. LRFD Bridge Design Specifications, 6th ed.; AASHTO: Washington, DC, USA, 2012.
  42. Steel, Concrete and Composite Bridges-Part 10: Code of Practice for Fatigue; BS5400; British Standards Institute: London, UK, 1980.
  43. Krautkrämer, J.; Krautkrämer, H. Ultrasonic Testing of Materials; 4th Fully Revised Edition; Springer: New York, NY, USA; Berlin, Germany, 1990. [Google Scholar]
  44. Matlack, K.H.; Kim, J.-Y.; Jacobs, L.; Qu, J. Review of second harmonic generation measurement techniques for material state determination in metals. J. Nondestruct. Eval. 2014, 34, 273. [Google Scholar] [CrossRef]
  45. American Society for Nondestructive Testing. Nondestructive Testing Handbook, 3rd ed.; Ultrasonic Testing: Columbus, OH, USA, 2007; Volume 7. [Google Scholar]
Figure 1. Failure modes of headed shear studs: (a) in the root of the stud [3]; (b) in the root of the weld collar [18]; (c) from the root of weld collar and propagated to the flange [19].
Applsci 11 08297 g001
Figure 2. Geometric details of push-out specimens (unit: mm): (a) front view; (b) side view; (c) A–A view; (d) 3D drawing of specimens.
Applsci 11 08297 g002
Figure 3. Test instruments and the layout.
Applsci 11 08297 g003
Figure 4. Push-out test setup and test specimen layout.
Applsci 11 08297 g004
Figure 5. Fatigue loading procedure.
Applsci 11 08297 g005
Figure 6. Fatigue failure details of headed shear studs: (a) global failure of specimen S-1; (b) stud No. 2 of specimen S-1; (c) stud No. 8 of specimen S-1; (d) global failure of specimen S-2; (e) stud No. 4 of specimen S-2; (f) stud No. 6 of specimen S-2; (g) global failure of specimen S-3; (h) stud No. 4 of specimen S-1; (i) stud No. 6 of specimen S-1.
Applsci 11 08297 g006
Figure 7. SN curves in different specifications and fatigue test results of headed shear studs.
Applsci 11 08297 g007
Figure 8. Strain gauges data of the specimens in the fatigue test: (a) strains of specimen S-1; (b) strains of specimen S-2.
Applsci 11 08297 g008
Figure 9. Ultrasonic non-destructive crack testing of headed shear studs: (a) digital ultrasonic flaw detector (CTS-9006PLUS); (b) straight probe; (c) detection scheme.
Applsci 11 08297 g009
Figure 10. Ultrasonic crack testing results of shear studs of specimen S-1 in the fatigue test: (a) stud No. 2 after 2.87 million cycles; (b) stud No. 5 after 3.28 million cycles; (c) stud No. 6 after 3.28 million cycles.
Applsci 11 08297 g010
Figure 11. Ultrasonic crack testing results of shear studs of specimen S-2 after 890,000 loading cycles in the fatigue test: (a) stud No. 1; (b) stud No. 7; (c) stud No. 8.
Applsci 11 08297 g011
Figure 12. Ultrasonic crack testing results of shear studs of specimen S-3 after 133,000 cycles in the fatigue test: (a) stud No. 1; (b) stud No. 2; (c) stud No. 8.
Applsci 11 08297 g012
Table 1. Material properties of steel column, shear studs and reinforcement bars.
MaterialYield Strength (MPa)Tensile Strength (MPa)Elastic Modulus (MPa)
H-shaped steel column3454902.05 × 105
Headed shear studs2404002.05 × 105
Reinforcement bars3354552.00 × 105
Table 2. Fatigue loading details for push-out specimens.
SpecimensMinimum Load Pmin (kN)Maximum Load Pmax (kN)Load Range ΔP (kN)Load Ratio RStress Range Δτ (MPa)
S-1503503000.1498.6
S-2404003600.10118.4
S-3303703400.08111.8
Table 3. Actual and estimated fatigue lives for push-out tests.
SpecimenStress Range Δτ (MPa)Estimated Fatigue LivesActual Fatigue Lives
AASHTOEurocode 4BS5400
S-198.6274,372963,7282,328,3483,280,000
S-2118.481,598222,923538,579890,000
S-3111.8122,245352,724852,175133,000
Publisher’s Note: MDPI stays neutral with regard to jurisdictional claims in published maps and institutional affiliations.

