Article

The Study of Corrosion Behaviors of Carbon Steel Weldments and Their Inhibition in Simulated Pore Solution Using Multi-Electrode Array Technique

1
School of Innovation and Entrepreneurship, Dalian University of Technology, Dalian 116024, China
2
School of Naval Architecture and Ocean Engineering, Dalian University of Technology, Dalian 116024, China
3
School of Physics and Optoelectronic Engineering, Dalian University of Technology, Dalian 116024, China
4
Shenzhen-Zhongshan Link Administration Center, Zhongshan 528400, China
*
Author to whom correspondence should be addressed.
Appl. Sci. 2021, 11(18), 8278; https://doi.org/10.3390/app11188278
Submission received: 28 July 2021 / Revised: 26 August 2021 / Accepted: 31 August 2021 / Published: 7 September 2021

Abstract

:
A multi-electrode array sensor was developed to study the corrosion behaviors of carbon steel weldments and the effectiveness of the NaNO2 inhibitor in carbonated pore solution. The sensor can simulate a complete weldment, and the measurement results can match well with the coupon immersion test. The galvanic corrosion between the weld area, heat-affected area, and base metal area, as well as the effect of nitrite corrosion inhibitor on the weld area, were observed by measuring the open circuit potential, coupling potential, and galvanic current. The results show that corrosion is likely to happen around the weld metal area and its adjacent heat-affected zone. The intensive galvanic currents can accelerate the localized corrosion, while NaNO2 can inhibit it.

1. Introduction

Reinforced concrete is widely used in various constructions due to its versatility, durable and strong performance throughout its service life [1,2]. With the development of ocean engineering, reinforced concrete is extended into the building of ocean and coastal structures such as the sea-crossing bridge, subsea tunnel, seafloor mining operations, and marine fishery [3,4]. The carbon steel rebar is always passive in the concrete by forming a thin layer of hydroxides in alkalinity conditions [5]. However, once the seawater permeates into the pore of the concrete, the passive film may be broken by aggressive ions such as chloride and sulfate ions which are largely contained in the seawater [4,6,7]. To decrease the construction period and cost reduction, various welded structures [8,9,10], such as the welded steel plate, welded steel tube, and welded wire fabric are applied in the dam, bridge deck, and the slab reinforcement of the ocean structures. Though the application of the welding technique can save the cost and ensure the structural strength, it may cause the increase of susceptibility to localized corrosion because the welding process can lead to the changes of the microstructures of the steel, formation of thermal oxide, and residual stresses [11,12,13]. The passive state of the welded carbon steel is not homogeneous in the mortar [8]. Especially in the marine environment, the breakdown of the passive film on a local area may result in a high localized corrosion rate and cause damage to the ocean structure [14,15]. Because different metals existed in the welded zone (WZ) and the heat-affected zone (HAZ), once the passive film firstly degrades in these areas, galvanic corrosion may occur among the weld metal (WM) area and base metal (BM) area [16]. Since the area of the WZ and the HAZ is much smaller than the BM area, serious localized corrosion will happen when both areas become anodes.
Various electrochemical methods have been used for the study of rebar corrosion and its inhibition in pore solution and mortar [5,15,17,18]. However, traditional electrochemical techniques such as half-cell potential, linear polarization resistance (LPR), and electrochemical impendence measurement (EIS) only can qualitatively assess the corrosion status and evaluate the average corrosion rate [19]. The localized penetration rate is hard to be captured by using these traditional methods. In addition, the high resistance of the concrete gives a large limitation of these methods to be used in practice engineering [20]. In recent studies, electrochemical noise (EN) measurement has been adopted in monitoring rebar pitting corrosion and its inhibition [21,22,23]. The transients of the coupled potential and current can directly reflect the breakdown and recovery of the passive film [24]. The corrosion patterns and corrosion rate also can be revealed from the EN by calculating the localized corrosion index and the noise resistance [25]. Though the metastable corrosion process and pitting corrosion process can be analyzed from the EN signal, the time and spatial propagation of the pitting corrosion process cannot be obtained by EN measurement [22]. Meanwhile, it is difficult to be evaluated the highest localized corrosion rate based on EN signals, solely. Therefore, coupled multi-electrode array sensor is developed for monitoring localized corrosion in various studies [26]. Through coupling the dispensing of small electrodes by current meter, the new sensor can simulate a one-piece electrode. The current distributions can be well measured by the new sensor and the highest localized penetration rate of the metal can be calculated from the max anodic current [27,28]. Yang [29] studied the threshold chloride levels for localized carbon steel corrosion in simulated concrete pore solution by using a newly designed sensor. The threshold level of Cl/OH in different pH solutions can be seen from the transfers of the max anodic current. Another multi-electrode sensor was designed as a wire beam electrode (WBE) which was also applied in the study of localized corrosion [30]. WBE is composed of 100 tiny electrodes and more detailed current and potential distribution maps can be obtained by using WBE [31]. Tan [32] firstly applied WBE in the study of localized corrosion processes beneath the high resistance media. Dong [33] used WBE in monitoring localized corrosion caused by the rust layers in mortar. Yang [34] also studied the interaction effect of sulfate and chloride ions on reinforcements in simulated pore solution by using the WBE technique. Based on the measurement principle of WBE, the multi-channel electrode sensor was used to study the corrosion behavior of the weldments or other steel structures [35]. The coupled multi-electrode sensors can be used as an effective method for the study of localized corrosion in concrete structures compared with traditional electrochemical methods.
Although lots of experimental studies on localized corrosion of reinforcements have been conducted in concrete and pore solution, the study of corrosion behavior of weldment in the concrete is rare. In this work, the galvanic corrosion behavior among the WM zone, HAZ, and BM zone in chloride-contained pore solution was studied by using a multi-electrode array sensor system. The inhibition effect of traditional inhibitor NaNO2 [24] on corrosion of weldments was also tested in the simulated pore solution through the observation of the changes of the coupled potential and the galvanic currents among the electrodes.

2. Experimental Methods

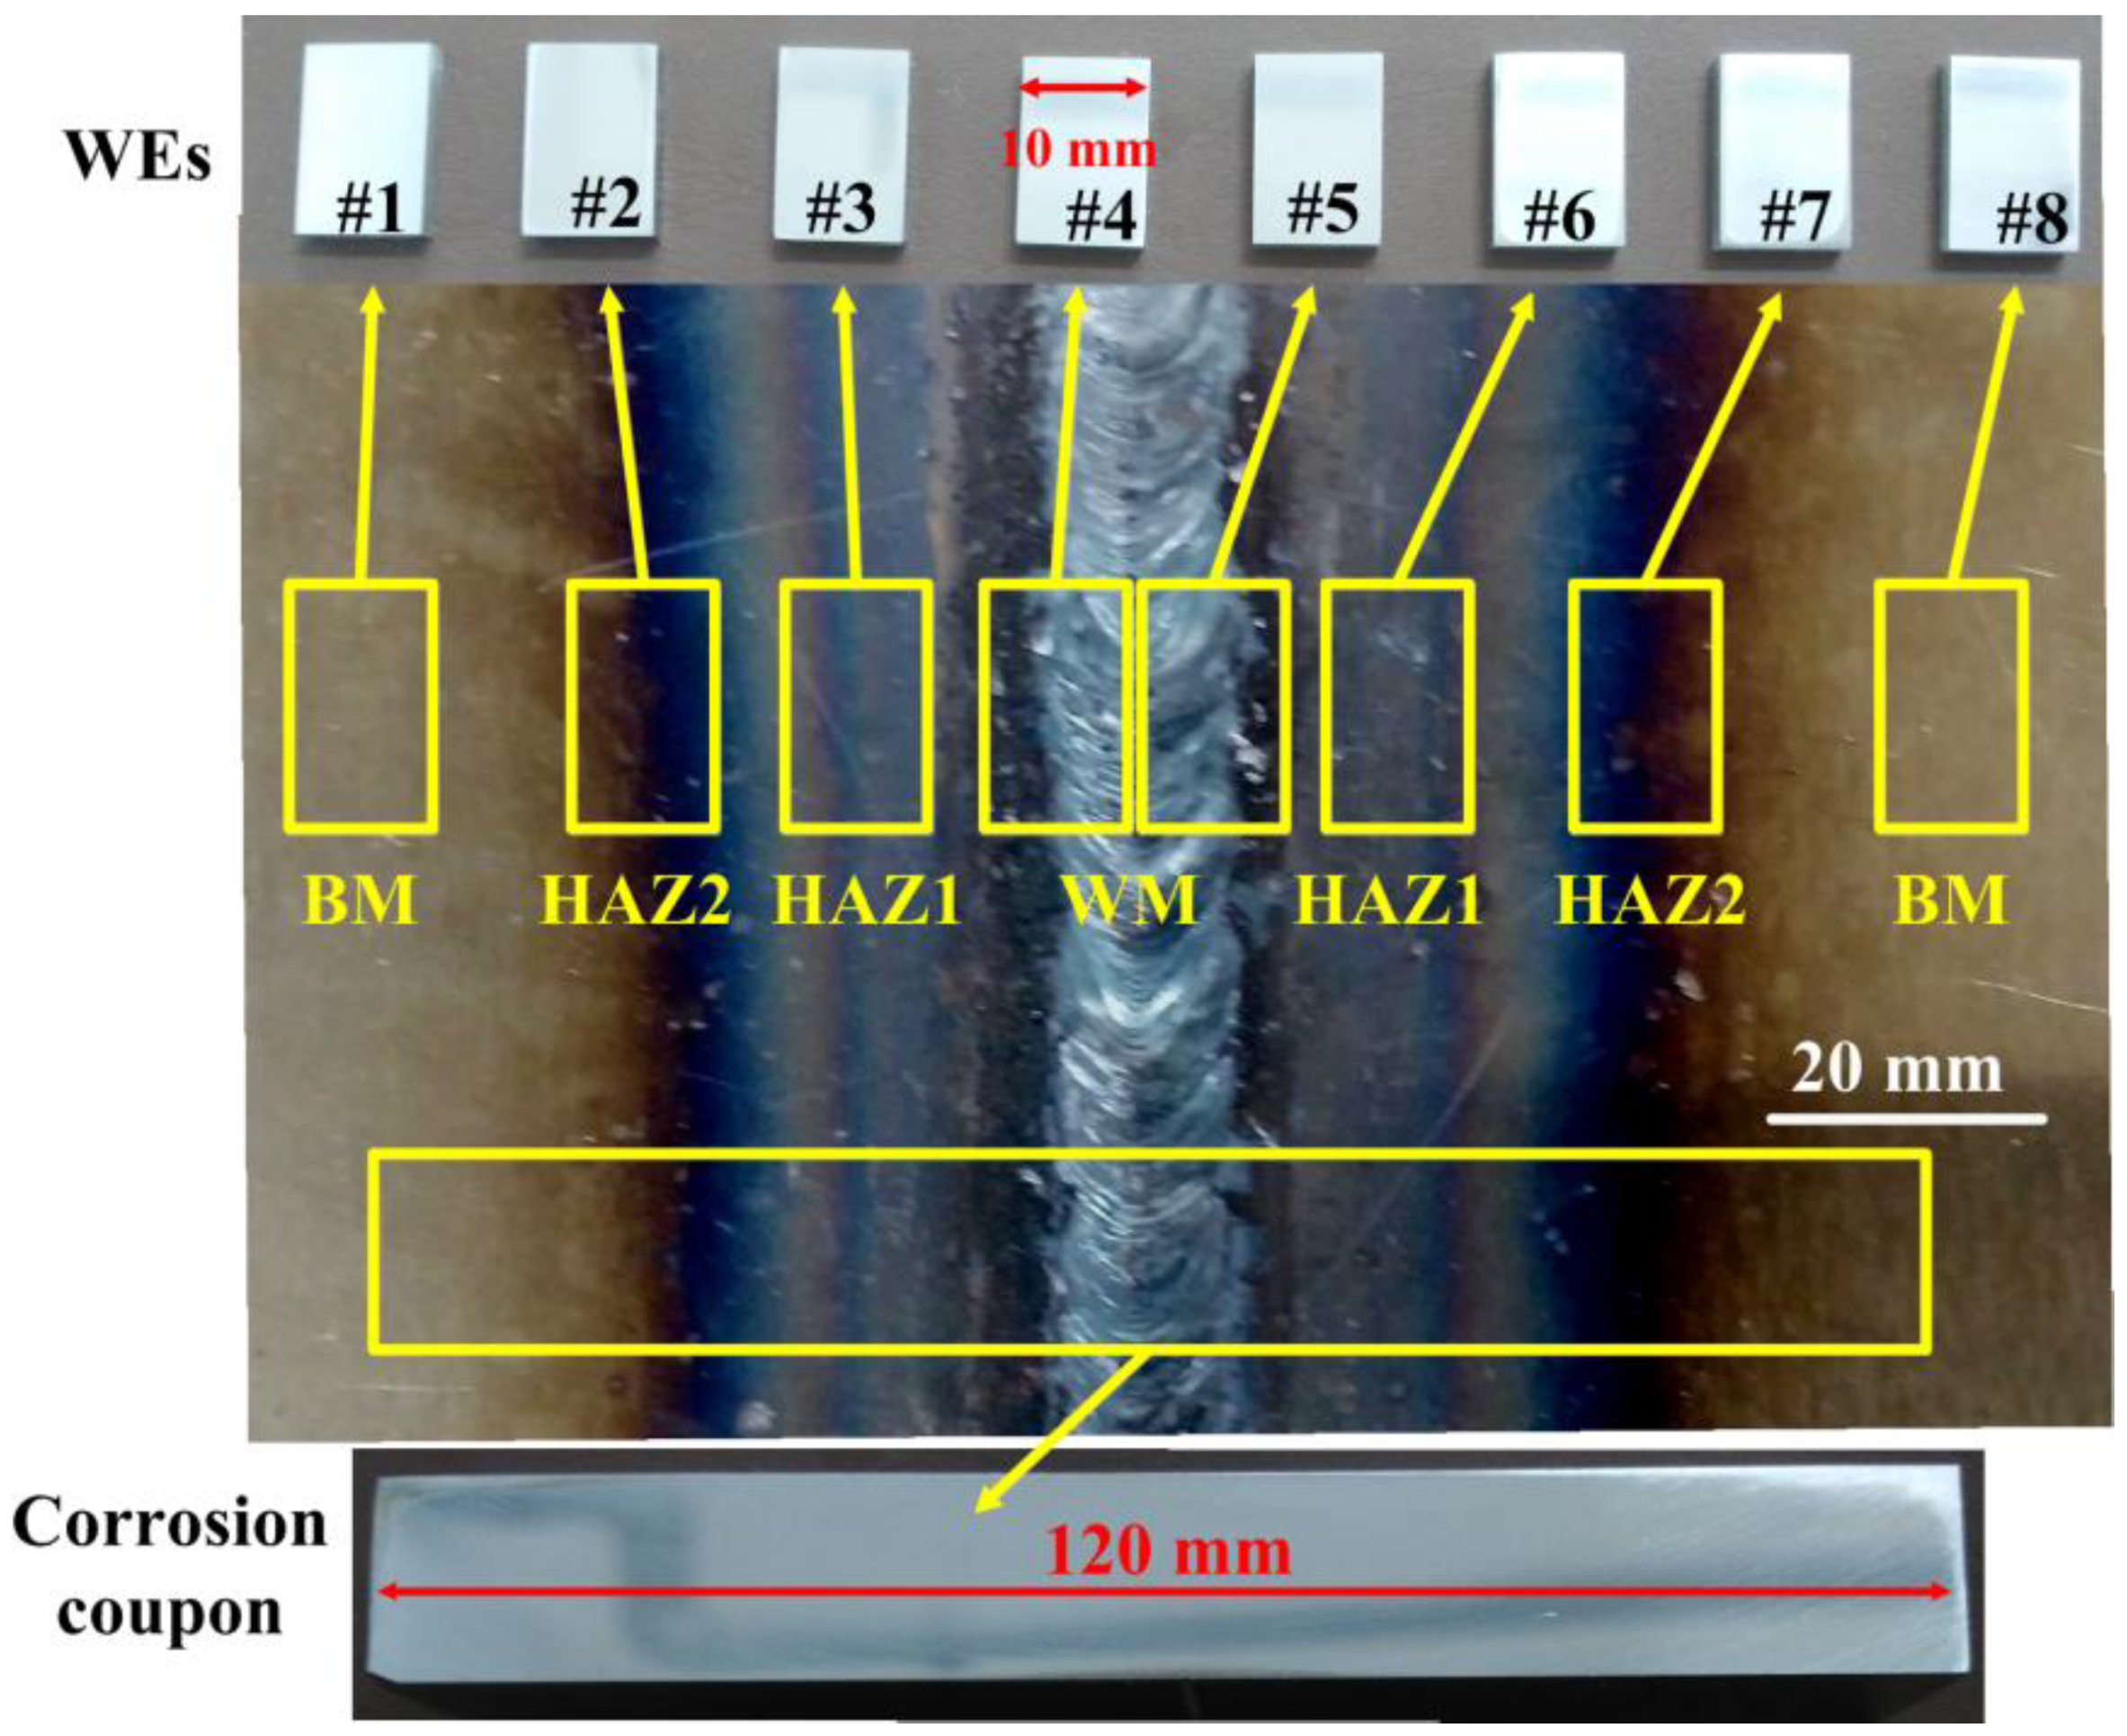
2.1. The Preparation of the Electrodes and the Corrosion Coupon

Two pieces of Q235 carbon steel plates with 15 mm thickness were used as the base metal. The welding material was J442 (E4303) welding rod. The chemical composition of the steel plate and the welding rod is listed in Table 1. It can be seen from Table 1 that the chemical components of the base metal and the welding metal are similar. The welded joints were fabricated using the Manual Arc Welding (MAW) technique. The weldment composed of the two steel plates is shown in Figure 1. The length of the welding joint is nearly 20 mm and the designated zones of WM zone, HAZ 1, HAZ 2, and BM zone can be observed from Figure 1. Through the cutting of the weldment, eight specimens at different zones were obtained. The specimens were machined to 15 mm × 10 mm × 4 mm and grounded consequentially with 500 to 1200 grit silicon carbide paper [36]. Since different surface roughness could lead to different corrosion susceptibility, all the steel samples are fine polished to the same level to keep the surface status at similar conditions The specimens were sealed with epoxy resin with the end face exposed to the test solution and the backside pasted on a resin plate. Copper wires were welded at the side faces of the specimens and sealed in epoxy resin. After the curing of the epoxy, the edge areas of the specimens were coated with lacquer to avoid possible crevice corrosion. The final working area of the specimens used as working electrodes (WEs) was close to 10 mm × 10 mm. The electrodes were numbered from WE 1 to WE 8 as shown in Figure 1.
A corrosion coupon that completely contained BM zone, HAZ, and WM zone was directly cut from the weldment with a dimension of 120 mm × 16 mm × 15 mm as shown in Figure 1. The surface treatment and sealed method were the same as the WEs. The corrosion coupons were used for the immersion tests and surface observation. The corrosion morphology on the coupon can provide a comparison to the WEs measurement result. At the initiation of each test, the surfaces of the electrodes and corrosion coupons were degreased with alcohol and rinsed with deionized water.

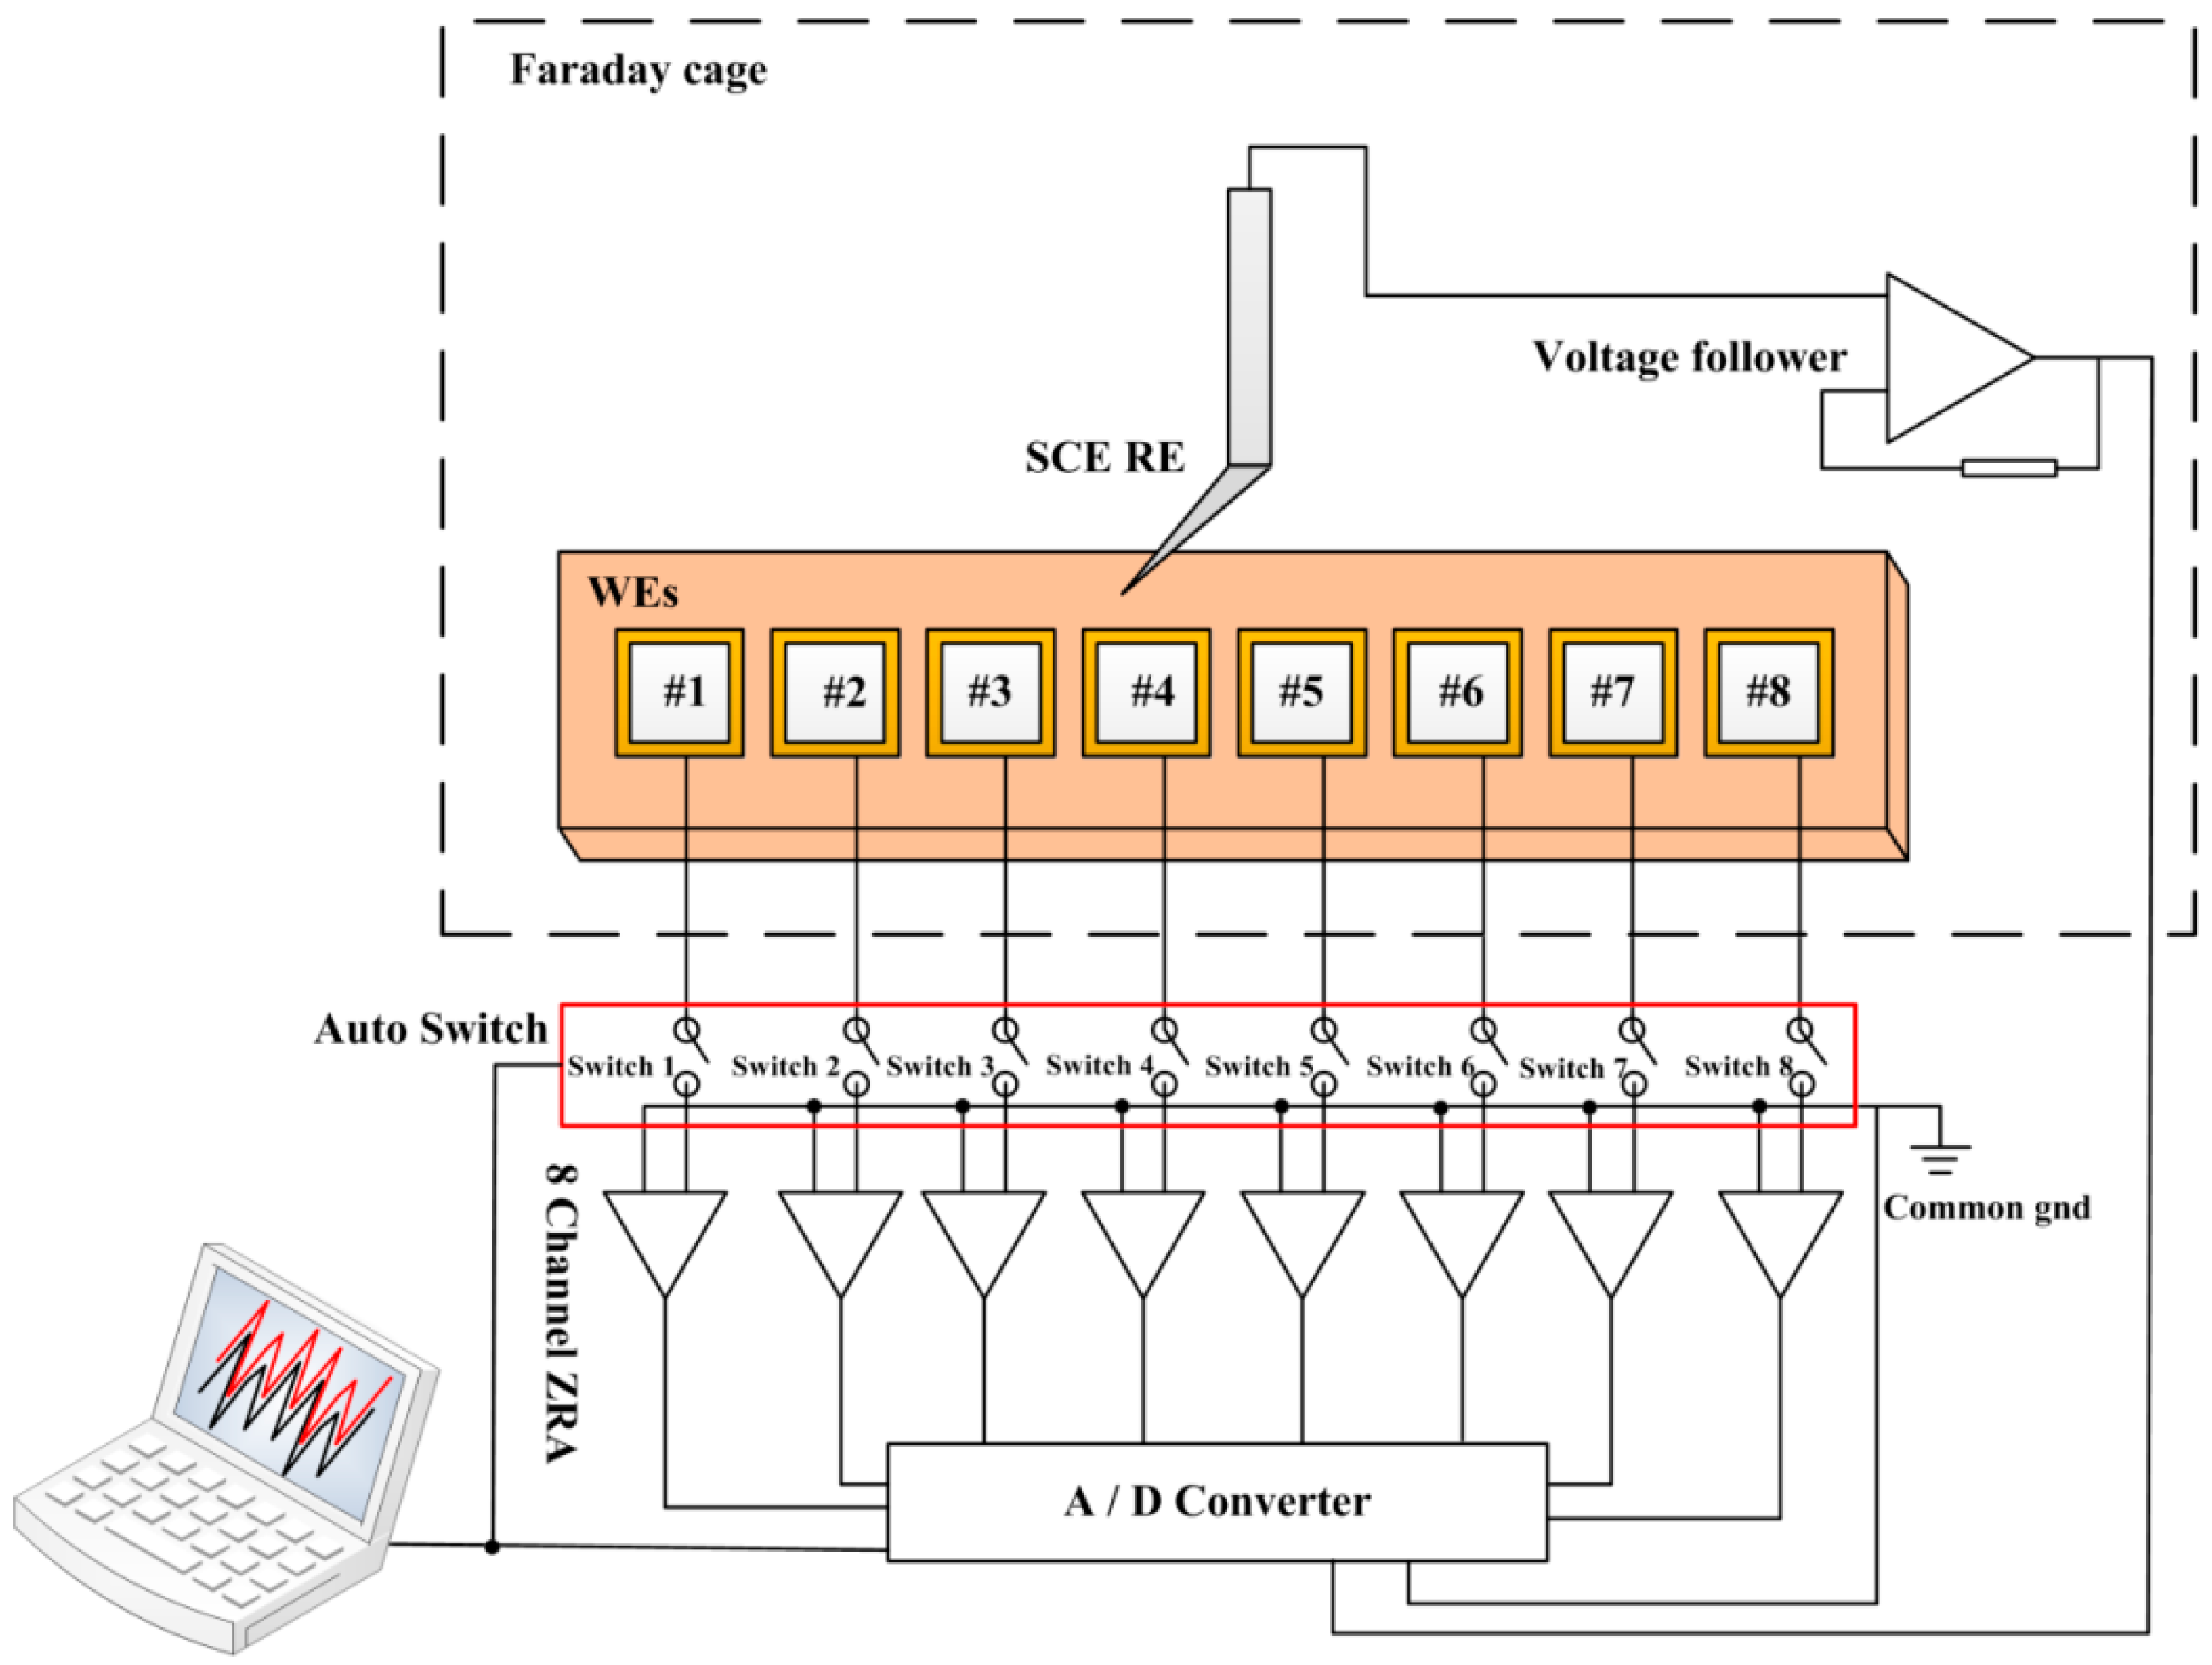
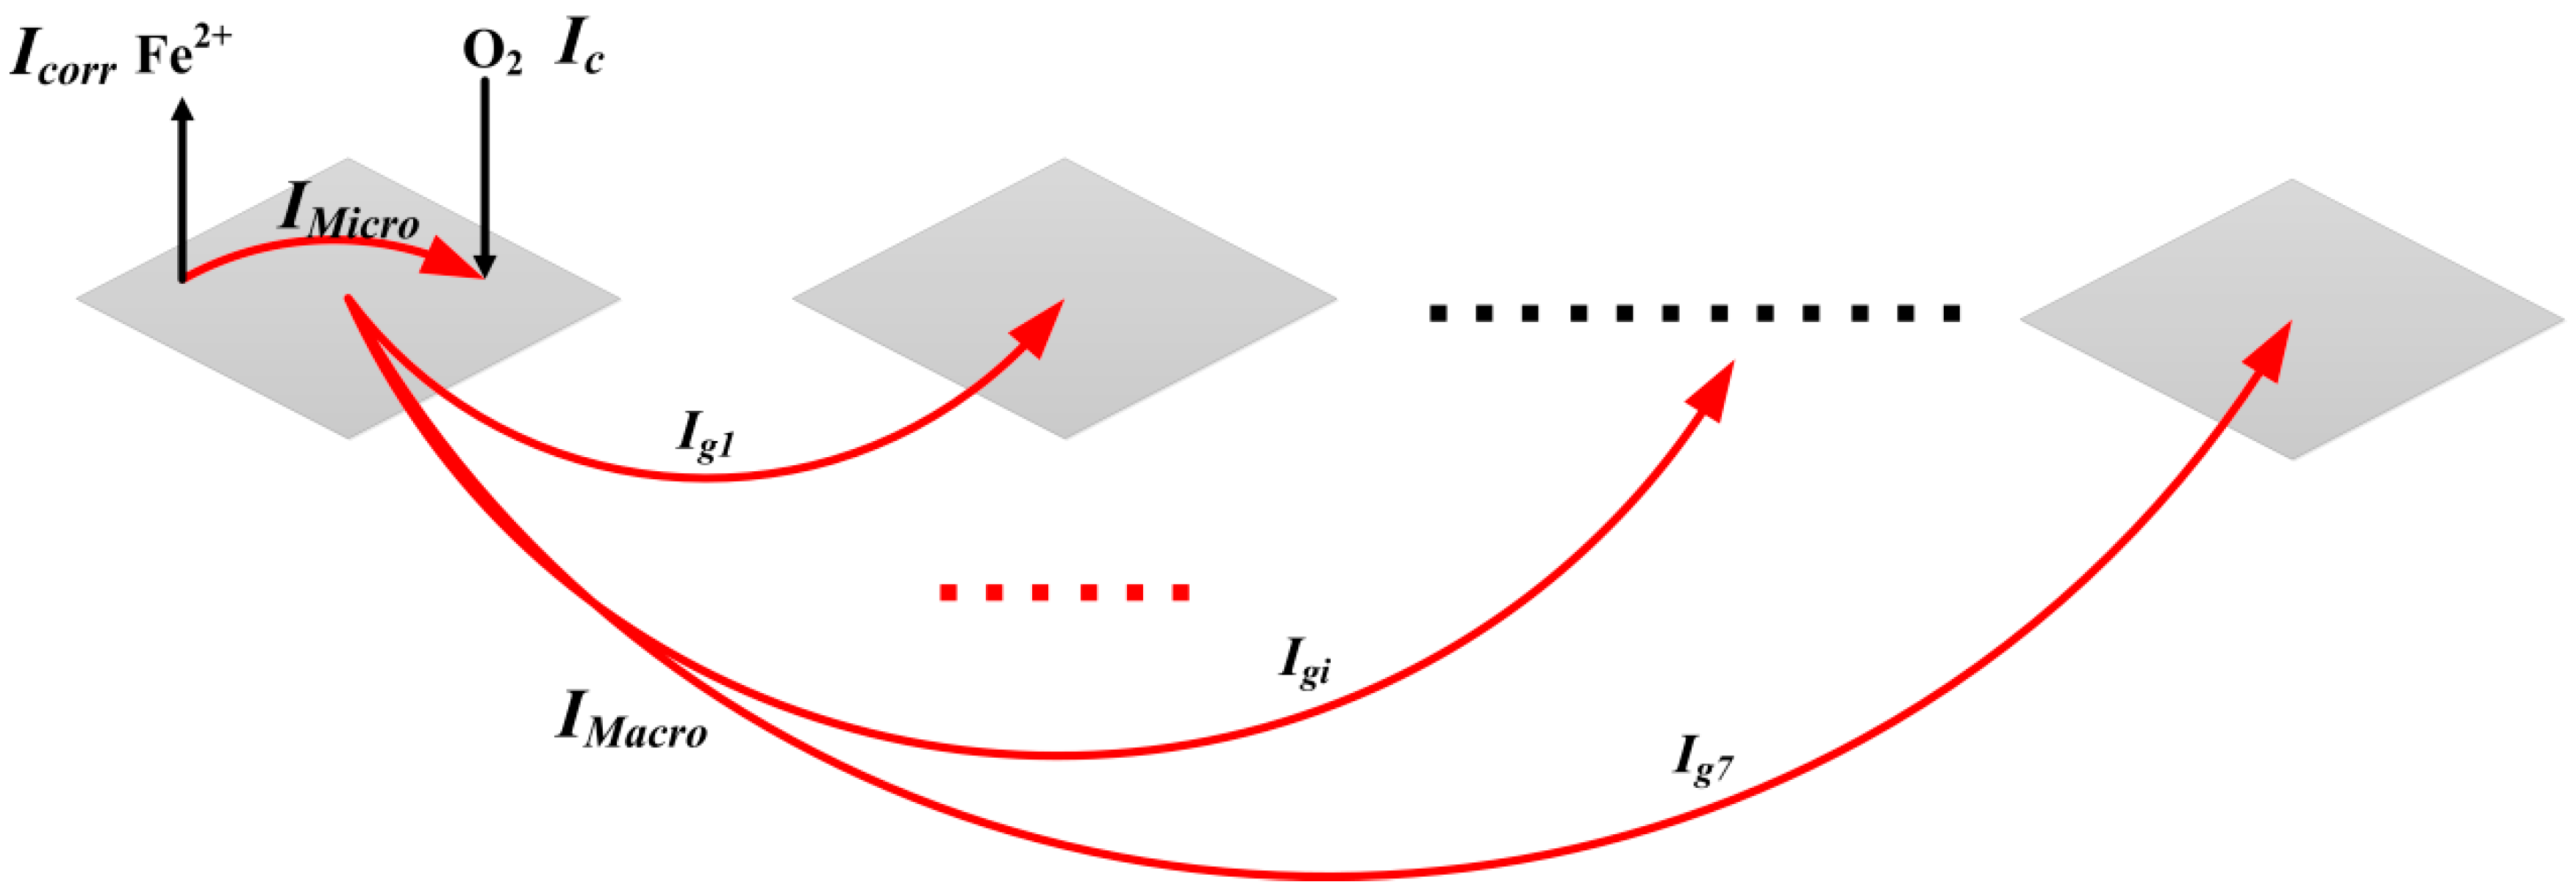
2.2. The Coupled Multi-Electrode Array Sensor System

The measurement principle diagram of the sensor system is shown in Figure 2. The sensor system consists of WEs, an eight-channel zero resistance ammeter (ZRA), a high resistance voltage follower, and an auto switch system. The working electrodes were arranged in the order as shown in Figure 1. The interval between the two adjacent electrodes was 5 mm. The electrodes can be coupled together through the eight-channel ZRAs to simulate a complete one-piece weldment. The sensor system can realize the open circuit potential (OCP) measurement, the coupled potential, and galvanic current monitoring for each electrode. During the galvanic currents and coupled potential measurement, the Switches 1 to 8 were kept closed. The current flowing through each electrode can be monitored simultaneously and the coupled potential of the electrodes can be measured with a high resistance voltage follower connected to a saturated glycerol electrode (SCE). The ZRAs and the voltage followers were provided by CST 508 Galvanic Corrosion Monitoring Device (CorroTest, China). In the OCP measurements, the working electrodes were connected sequentially to the voltage follower. During the OCP measurement of WE i (i = 1, 2, 3, …, 8), the Switch i (i = 1, 2, 3, …, 8) was kept closed, and the other switches were kept open. The measurement function of the sensor system can be switched through the control of the auto switches. A computer program that was coded with LabVIEW software package (National Instruments) was used to control the switches. All the measurement results were saved in a Structured Query Language database.

2.3. Experimental Procedures

The carbon dioxide in the air and the bicarbonate in the seawater can react with the alkaline compounds in the pore solution, leading to the carbonation of the concrete [37,38]. The real pH of the pore solution in a long-duration marine structure is always lower than 12. Therefore, the carbonated pore solution was used as the test solution. The test solution was first prepared as a pure saturated Ca(OH)2 solution. Then, the pH of the solution was adjusted to 11 by adding NaHCO3. In addition, NaCl was added into the solution to give a Cl concentration of 0.2 mol/L. The multi-electrode sensor was firstly pre-passivated in the pure saturated Ca(OH)2 solution for over 12 h. Following, they were transferred to the test solution. After the OCP of the electrodes became stable in the test solution, switches were kept closed. The coupled potential and the galvanic current were kept for continuous monitoring. The measurement frequency of the coupled potential and the galvanic current was 0.5 Hz. The OCP of the electrodes was measured every 24 h. The test period of each OCP measurement was only 1 min and it would not influence the corrosion processes on the electrodes. The test cell was placed in an air-conditioned room with the temperature fluctuation at 26 ± 1 ℃. The test solution was directly exposed to the air. After the sensor had been immersed in the test solution for nearly 60 h, the inhibitor NaNO2 was introduced into the solution. According to the reference [24,39], NaNO2 would have a good inhibition effect in the pore solution when the concentration ratio of the NO2 and Cl is above 0.3. Therefore, the ratio of the NO2 and Cl is set as 0.5. Moreover, 0.1 mol/L NaNO2 was introduced into the solution to make the ratio of the NO2 and Cl was 0.5. Its inhibition effect on the corrosion of weldments in pore solution was studied by the sensor system. The pH of the test solution had a little decrease from 11 to 10.6 after the inhibitor was added for 40 h. After the inhibitor was added for 50 h, the multi-electrode array was taken out and the surface morphologies of the electrodes were observed by KEYENCE VH-8000 optical microscope.
The corrosion coupon was also pre-passivated in the pure saturated Ca(OH)2 solution for over 12 h. Then it was immersed into the test solution for 144 h. After the coupon was carried out from the test solution, the surface morphology of the coupon was shot by a digital camera and it was also observed by KEYENCE VH-8000 optical microscope.

3. Experimental Results and Discussions

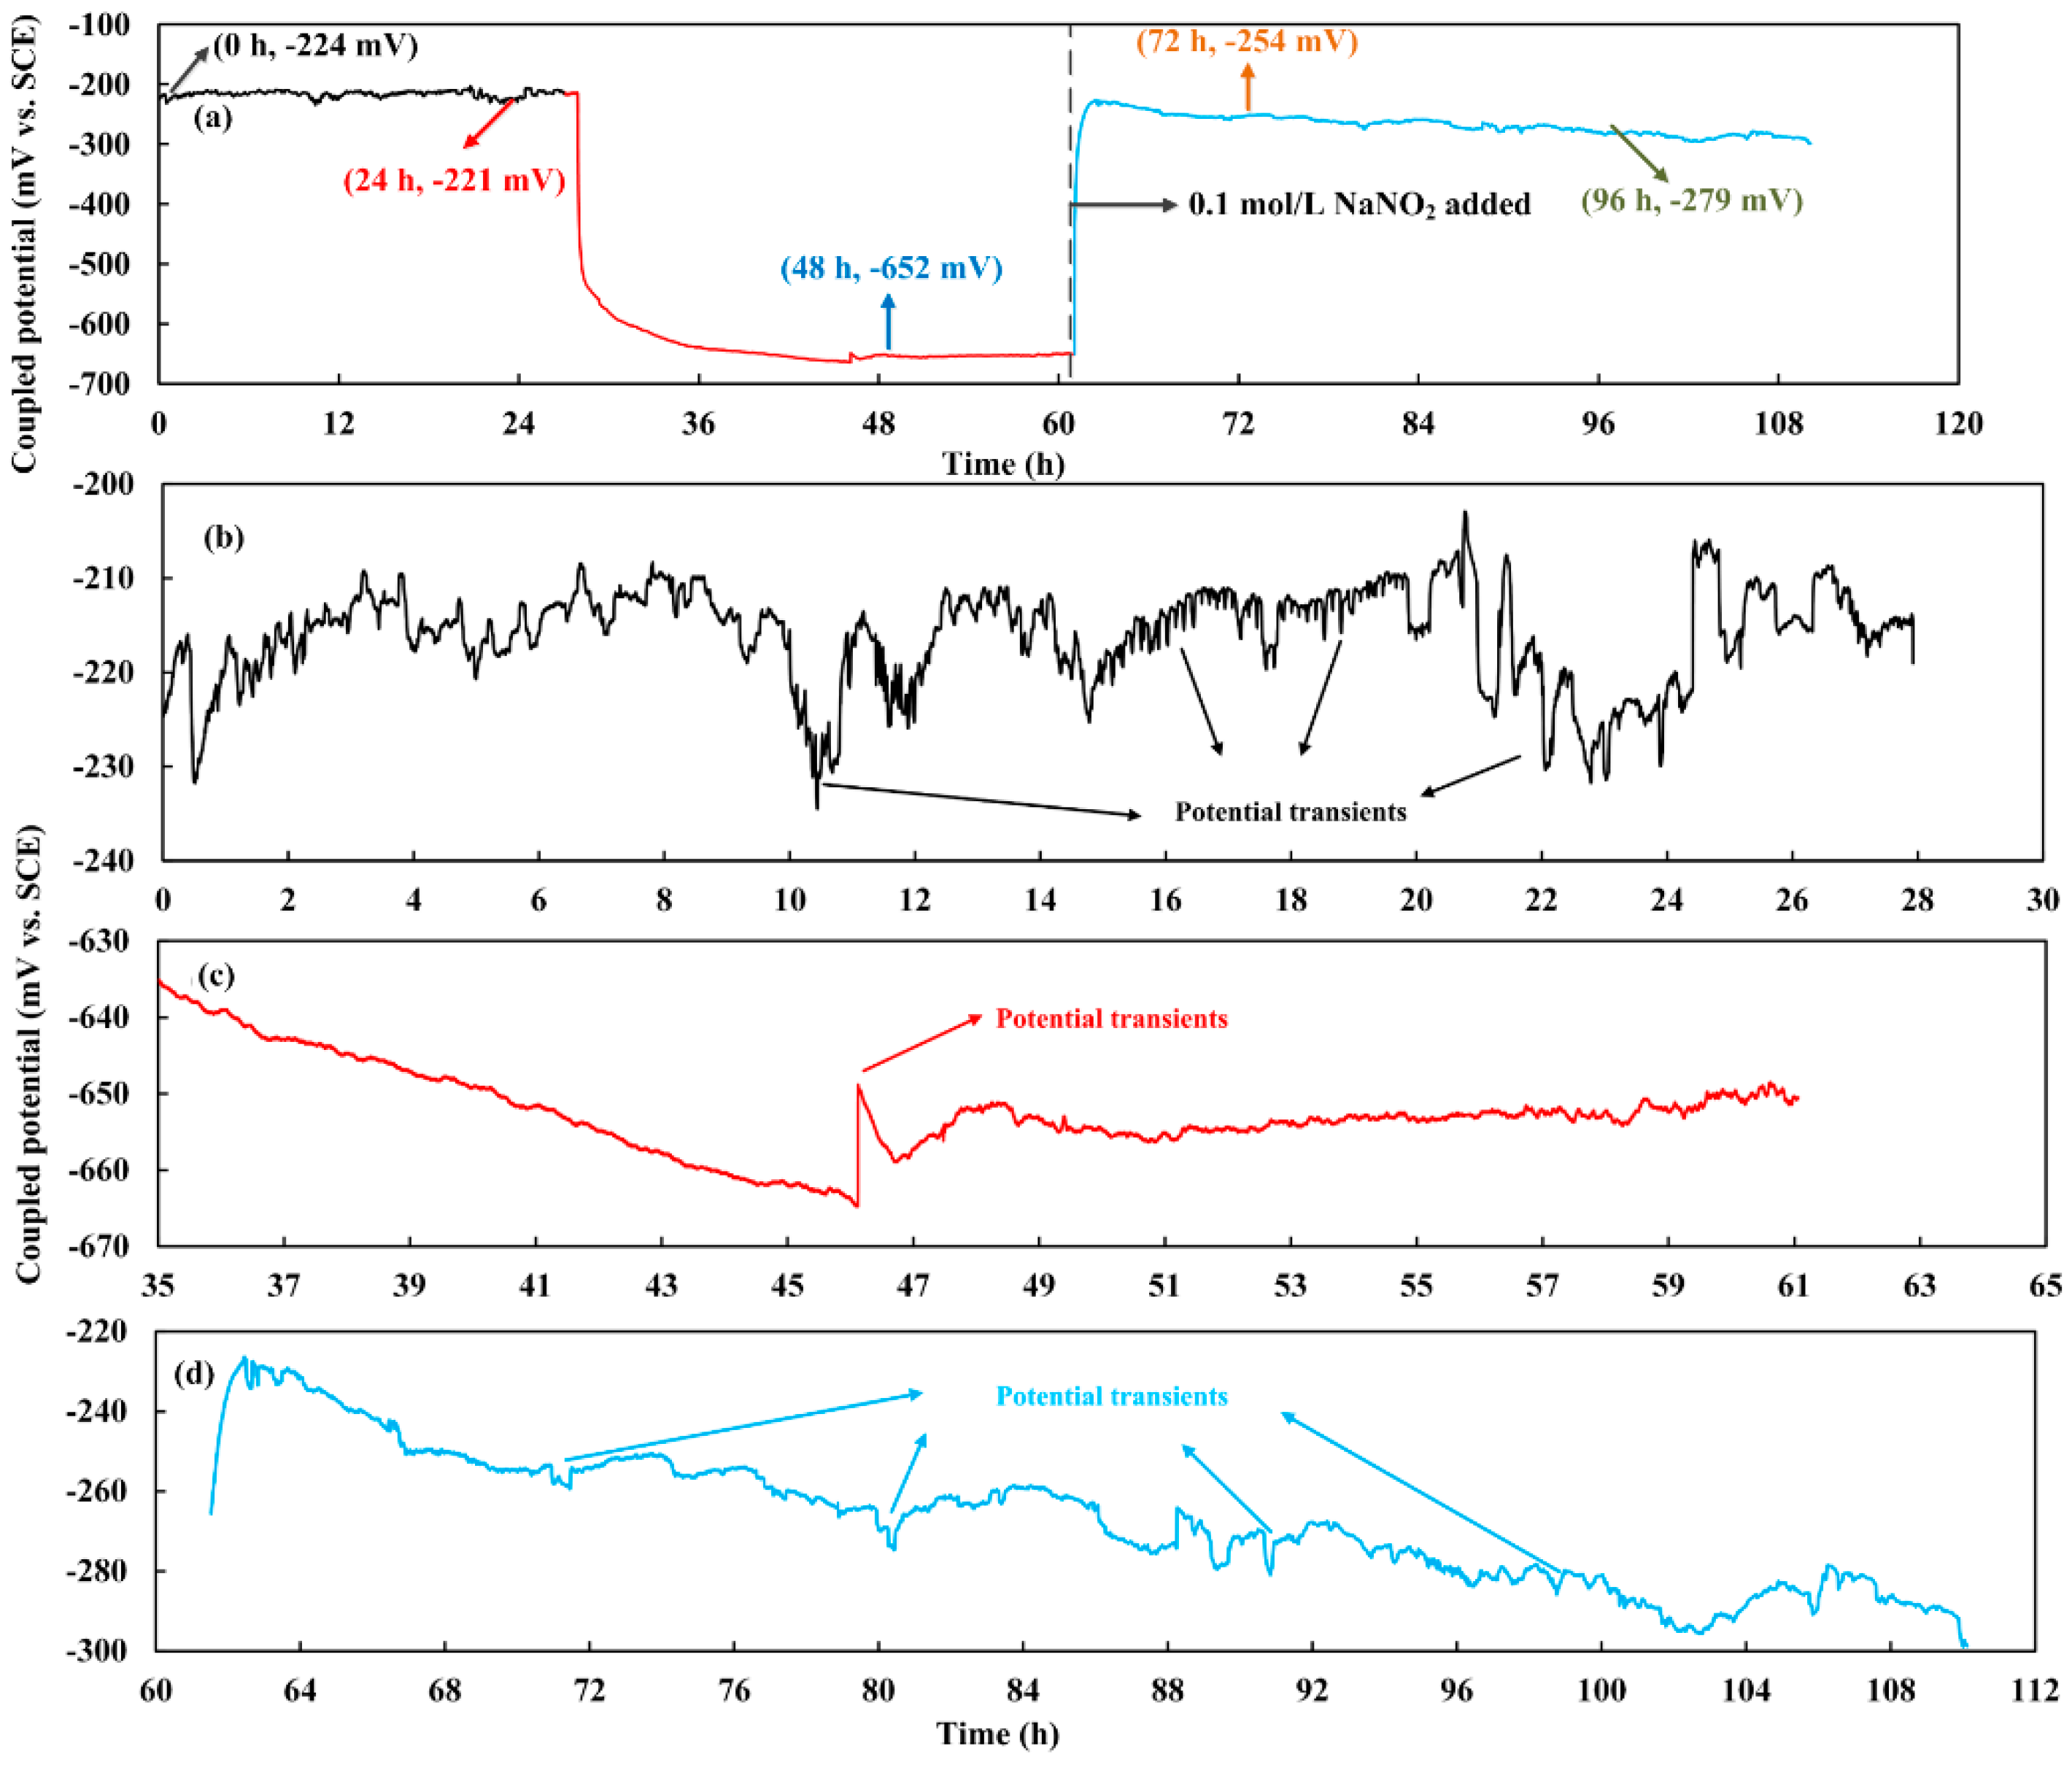
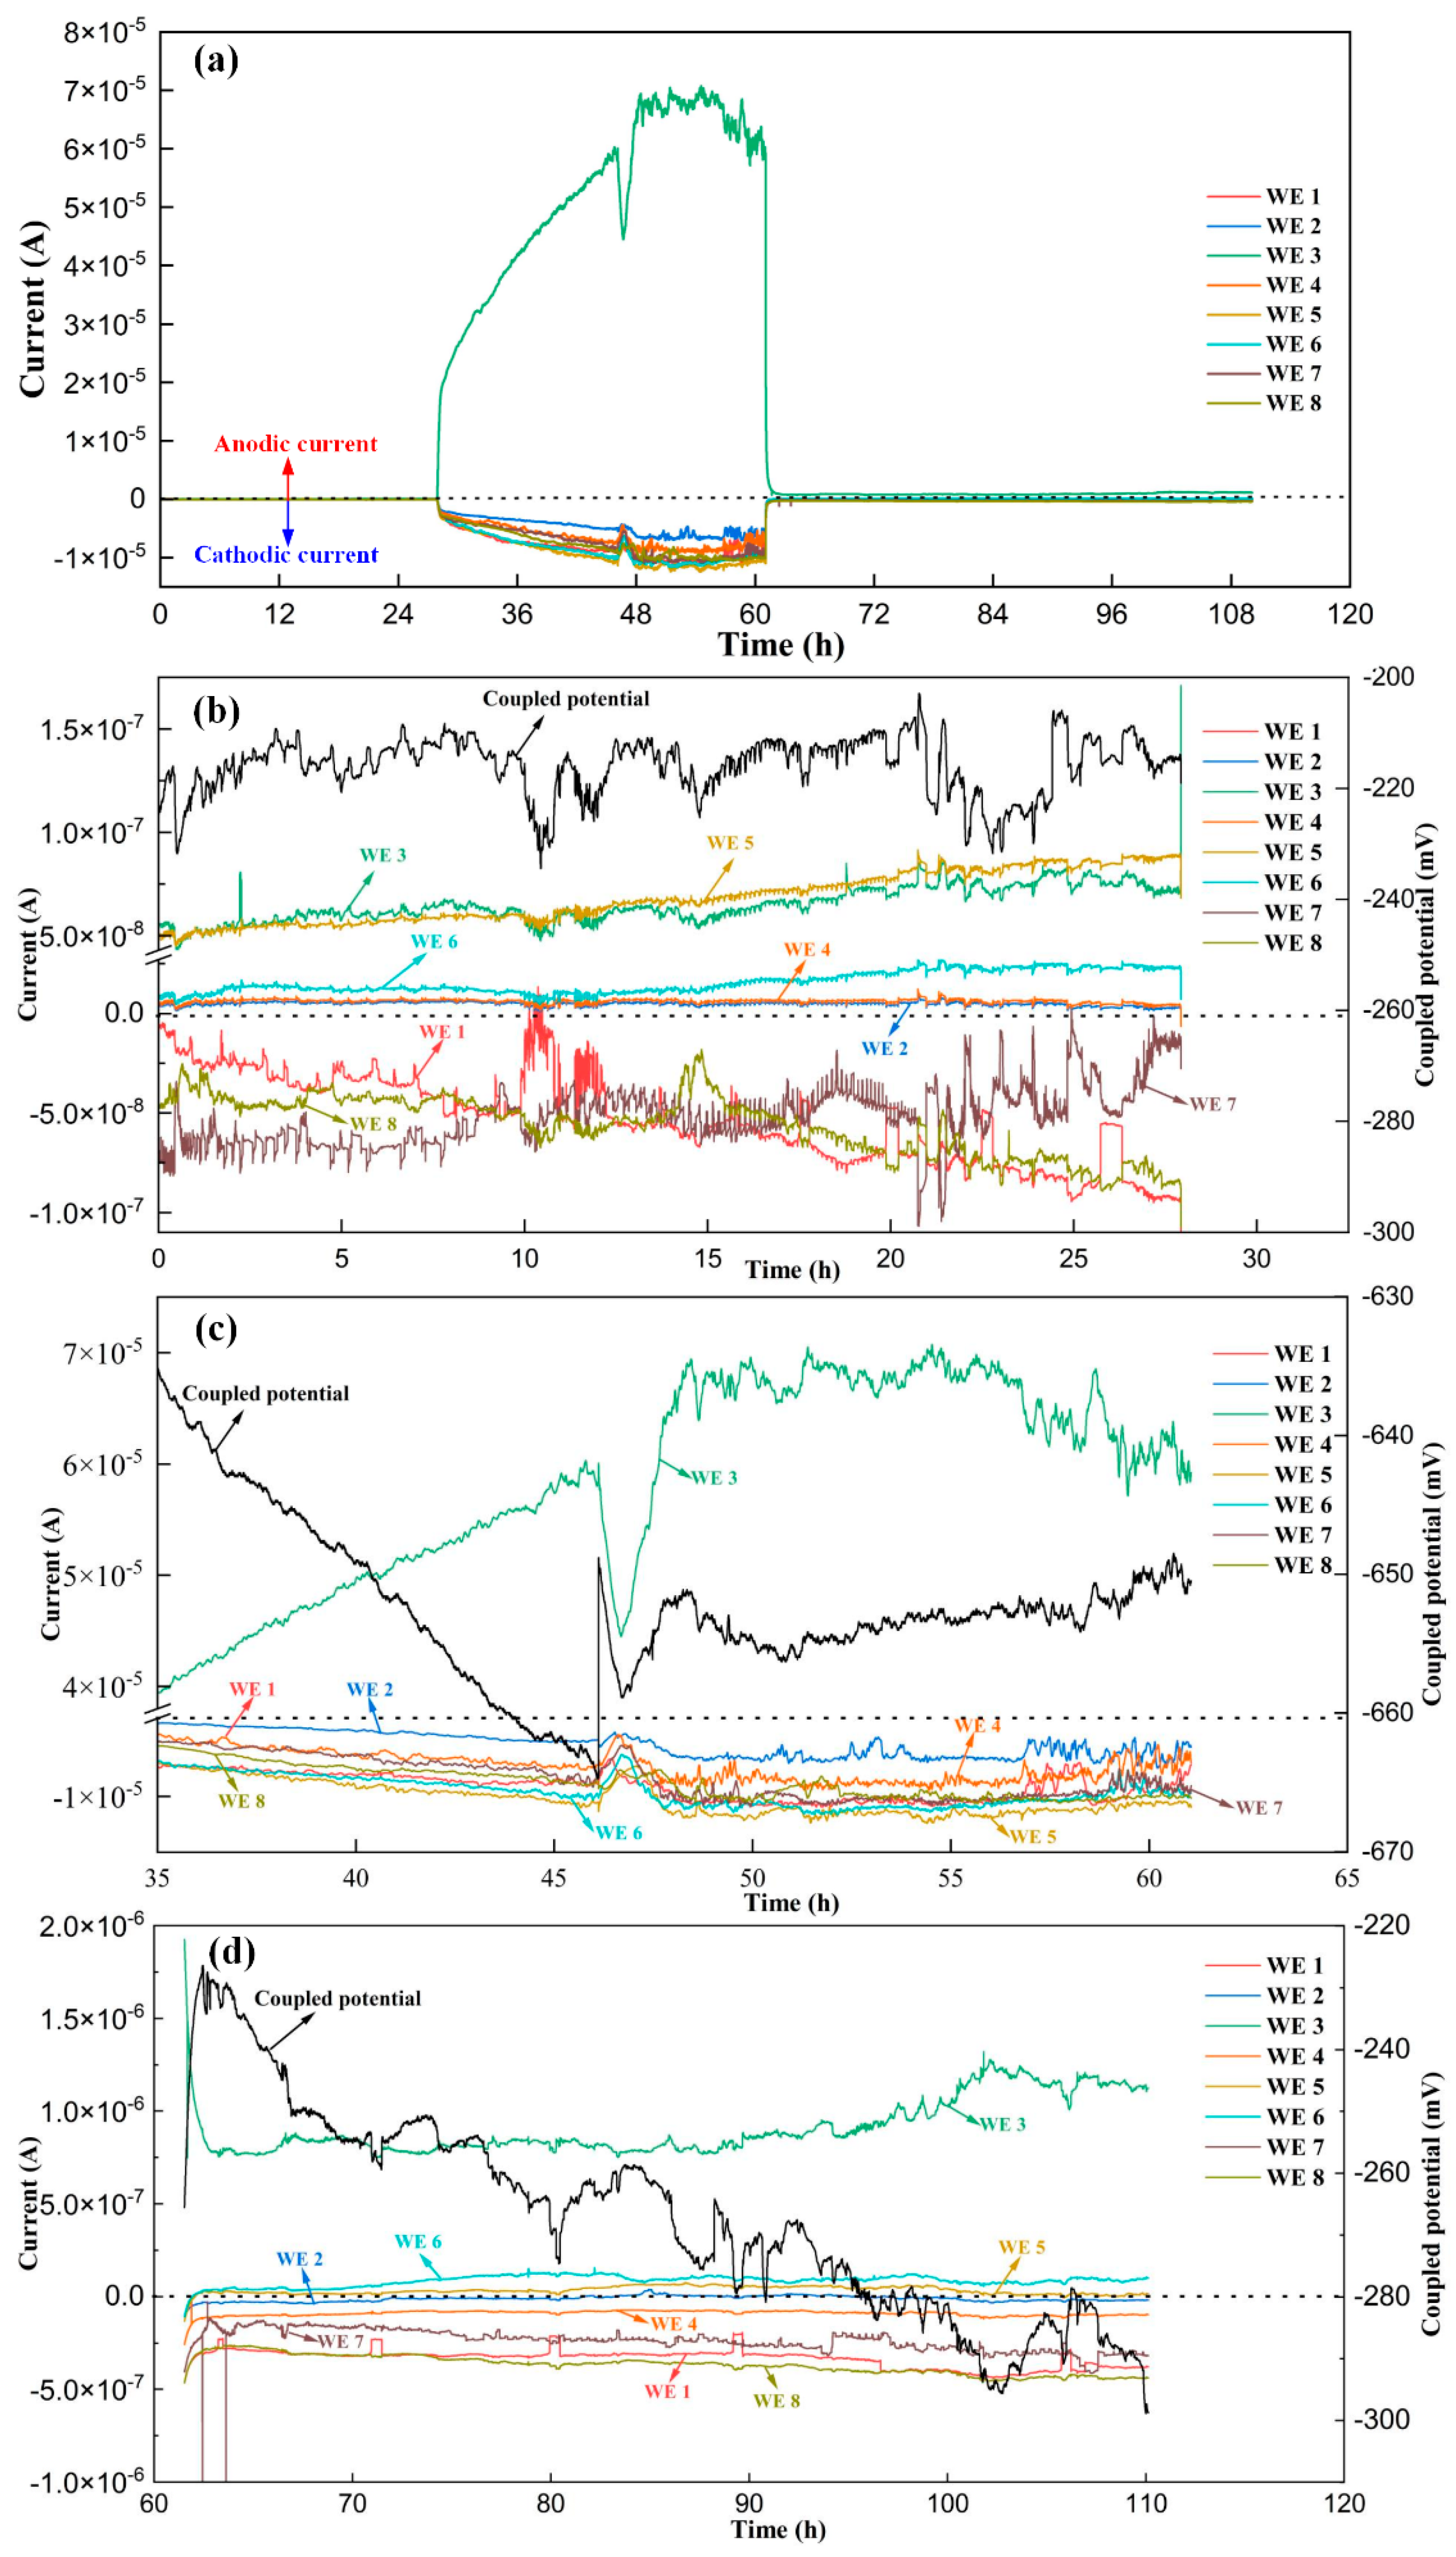
3.1. Measurement Results of the Coupled Potential and the OCP

After the electrodes were transferred to the test solution for 3 h, the OCP of the electrodes became stable. The switches were kept closed and the sensor system began to work. The OCP measurement results of the electrodes at different test periods are shown in Table 2 and the coupled potential measurement result is shown in Figure 3a. It can be seen the coupled potential was nearly −220 mV at the initial 28 h. A sudden decrease of the coupled potential from −220 mV to −650 mV can be seen from the curve. After the inhibitor NaNO2 was introduced into the solution at 60 h, the coupled potential recovered to −250 mV and gradually decreased to −280 mV.
It is observed that the OCP of the electrodes were all above −280 mV at the initiation of the test in Table 2. According to ASTM standard and the previous studies [29,40], the corrosion probability of carbon steel rebar in a reinforced concrete structure is 90% if the corrosion potential of the rebar is below −280 mV vs. SCE. Therefore, the OCP of the electrodes at the initiation of the test means a low corrosion probability. After the electrodes were coupled for 24 h, the OCP of the WE 1 and WE 8 both had a little rise to −173 mV and −169 mV indicating well protective films form on the BM areas. The OCP of the WE 2 and WE 7 nearly had no changes compared to the initiation period showing a low corrosion risk. However, the OCP of the WE 3 to WE 6 both had different degrees decreases after were coupled together. Especially for WE 3, its OCP had a significant decrease to −327 mV suggesting a high localized corrosion potential. Detailed information of the coupled potential at the initial 28 h is shown in Figure 3b. It is seen that, although the coupled potential was kept at −220 mV, frequent negative potential transients can be observed. The fluctuation of the coupled potential was nearly 10 mV in the initial 28 h. This signal may correspond to the metastable corrosion process on the electrodes.
As shown in Table 2, the OCP of WE 3 decreased to −697 mV after the electrodes were coupled for 48 h suggesting stable localized corrosion occurred on the HAZ 1. The OCP of the WE 1 and WE 8 were still higher than −180 mV. It demonstrates the passive film on the BM zone was intact. The OCP of the other electrodes all had significant decreases during this period. The OCP of the WE 4, WE 5, and WE 6 reached −283 mV, −310 mV, and −279 mV, respectively. It suggests localized corrosion may also happen on the HAZ 1 and WM zone. It can be seen from Figure 3c that the potential transients disappeared except for a sudden positive potential change.
After the introduction of the inhibitor, the coupled potential recovered to −250 mV soon. The OCP of the electrodes also had dramatic increases which can be observed from Figure 3a. The OCP of WE 3 recovered to −289 mV indicating the repair of the passive film. The OCP of the other electrodes were all higher than −250 mV at 72 h which the corrosion process of the weldment was effectively inhibited by the NO2. The coupled potential and the OCP of the electrodes had a slight reduction after the inhibitor was added for nearly 36 h. The small decrease of the OCP may be caused by the decrease in the pH of the test solution. The negative potential transients reappeared which can be seen from Figure 3d. The transient frequency was lower than that shown in Figure 3b.

3.2. Measurement Results of the Coupled Potential and the OCP

More intuitive corrosion processes and anodic transients can be reflected by the galvanic current flowing through each electrode. It is seen from Figure 4a, the anodic and cathodic currents were all close to zero at the initial period. With the sudden decrease of the coupled potential. The WE 3 became the only anode and the anodic current of WE 3 which had an intensive increase to nearly 6 × 10⁻⁵ A. After the introduction of the inhibitor, both anodic current and cathodic current recovered to a small order of magnitude close to 10−6 A.
More detailed information of the currents distribution at a different time can be seen from Figure 4b–d. As shown in Figure 4b, during the initial 28 h test, WE 2, WE 3, WE 4, WE 5, and WE 6 presented as anodic areas. The anodic currents of WE 2 and WE 4 were very small. WE 3 and WE 5 performed as major anodic areas. The maximum anodic current Iamax was near 8 × 10⁻⁸ A and the maximum corrosion rate CRmax caused by the anodic current can be calculated as [41]:
CR max = I a max M / A ρ n F
where M is the molecular weight of the metal, A is the working surface area of the electrode, ρ is the mass density of metal, n is valence, and F is Faraday’s constant. The max corrosion rate caused by the galvanic current was 9.42 × 10⁻⁴ mm/a. Note that CRmax is the corrosion rate caused by the anodic galvanic current. It cannot represent the real corrosion rate of the electrode. Only when most of the metal loss was induced by the galvanic current, the CRmax can be considered as the real corrosion rate of the electrode. It can be found that the max corrosion rate caused by the anodic current was quite low which indicated the galvanic current nearly did not influence the damage of the passive film. However, through the comparison of the OCP and galvanic currents, it can be deduced that the preferential corrosion was potentially occurring on the WM zone and HAZ 1. Frequent current spikes also can be observed from Figure 4b which suggests metastable corrosion processes on the surfaces of the electrodes.
It can be seen from Figure 4c that when WE 3 became the stable anodic area, the other electrodes soon transferred to the cathodic area. The maximum anodic current reached nearly 7 × 10⁻⁵ A which means the CRmax was 0.82 mm/a. The CRmax was nearly 4 times higher than the general corrosion rate measured by the LPR method in pore solution with 3.5% NaCl added [34]. In this situation, the anodic galvanic current is the main cause of the localized corrosion and CRmax can be used as the highest localized penetration rate of the electrode. It is known that localized corrosion is the most dangerous corrosion pattern for reinforcements. The corrosion rate of 0.82 mm/a will cause the soon failure of the structure. It can be also found that once stable pitting corrosion is formed on a local area, the current transients will also disappear, suggesting the cathodic current will provide a protective effect for other electrodes and inhibit the potential metastable corrosion process [42]. The fluctuation of the current significantly increased to 10−5 A during this period.
After the introduction of the inhibitor, the maximum anodic current on WE 3 soon decreased to 9 × 10⁻⁷ A suggesting the highest localized corrosion rate was 0.01 mm/a. It demonstrates that NO2 has a remarkable inhibition effect on the localized corrosion of the Figure 3 weldment. The passive layer recovered effectively on WE 3. With the dramatic decrease of the maximum anodic current, WE 5 and WE 6 transferred to anodic areas again. The current transients and current mutations also reappeared which can be seen from Figure 3d, indicating that the breakdown and recovery of the passive film occurred again. Repeat experiments were conducted to verify the experimental conclusion, and the results of the repeat experiments are shown in Figures S1 and S2 in the Supplementary Materials.
The anodic and cathodic electric charges of the eight electrodes are shown in Figure 5. It can be seen that WE 3 was the pure anode and the WE 8 is the pure cathode through the whole test. The anodic electric charge of WE 1, WE 2, and WE 7 were quite low which can be neglected. In addition to the WE 3, WE 5 and WE 6 performed as the second major anodic electrodes. The corrosion depth d of each electrode can be expressed as:
d = Q A M / A ρ n F
where QA is the anodic charges.
The largest corrosion depth was 2.32 μm on the WE 3. The corrosion depths of the other electrodes were relatively small.
Through the potential and galvanic current measurement results, it can be found that the passive films on the WM zone and HAZ 1 were preferred to be damaged by the aggressive ions in carbonate pore solution. It suggests a high corrosion risk of weldment in marine structures. The OCP of the HAZ 1 and WM zone was nearly 80 mV lower than the BM area in the initial period. It means the HAZ 1 and WM zone will act as an anode in the complete welded structure. The fragile passive film and the weak anodic current will firstly lead to the dissolution of the passive film in these areas. When a stable pit forms on these areas, the aggressive ions will soon come into the occluded pit sites leading to the continued breakdown of the passive film [34]. Consequently, a large potential difference will be generated between the BM area and the WM area or HAZ 1. The large galvanic current will further cause the propagation of the pitting corrosion and lead to a high localized penetration rate. In actual marine structures, the WM zone and HAZ were much smaller than the BM area. The preferential corrosion behavior of these areas will bring high failure risks to the ocean structures. Therefore, the weldment should be intensively monitored to avoid potential failures. The common inhibitor NaNO2 had an effective inhibition effect for corrosion of weldments in the carbonated pore solution. The localized penetration rate decreased nearly 80 times with the introduction of the inhibitor. However, the corrosion rate of the HAZ 1 remained high. In consideration of the more serious galvanic corrosion risk and high chloride ion concentration in the actual marine environment, the localized corrosion rate may be higher than 0.01 mm/a with NO2 injected into concrete. Thus, more effective inhibitors should be developed for the inhibition of localized corrosion that occurred in weldments in concrete structures.

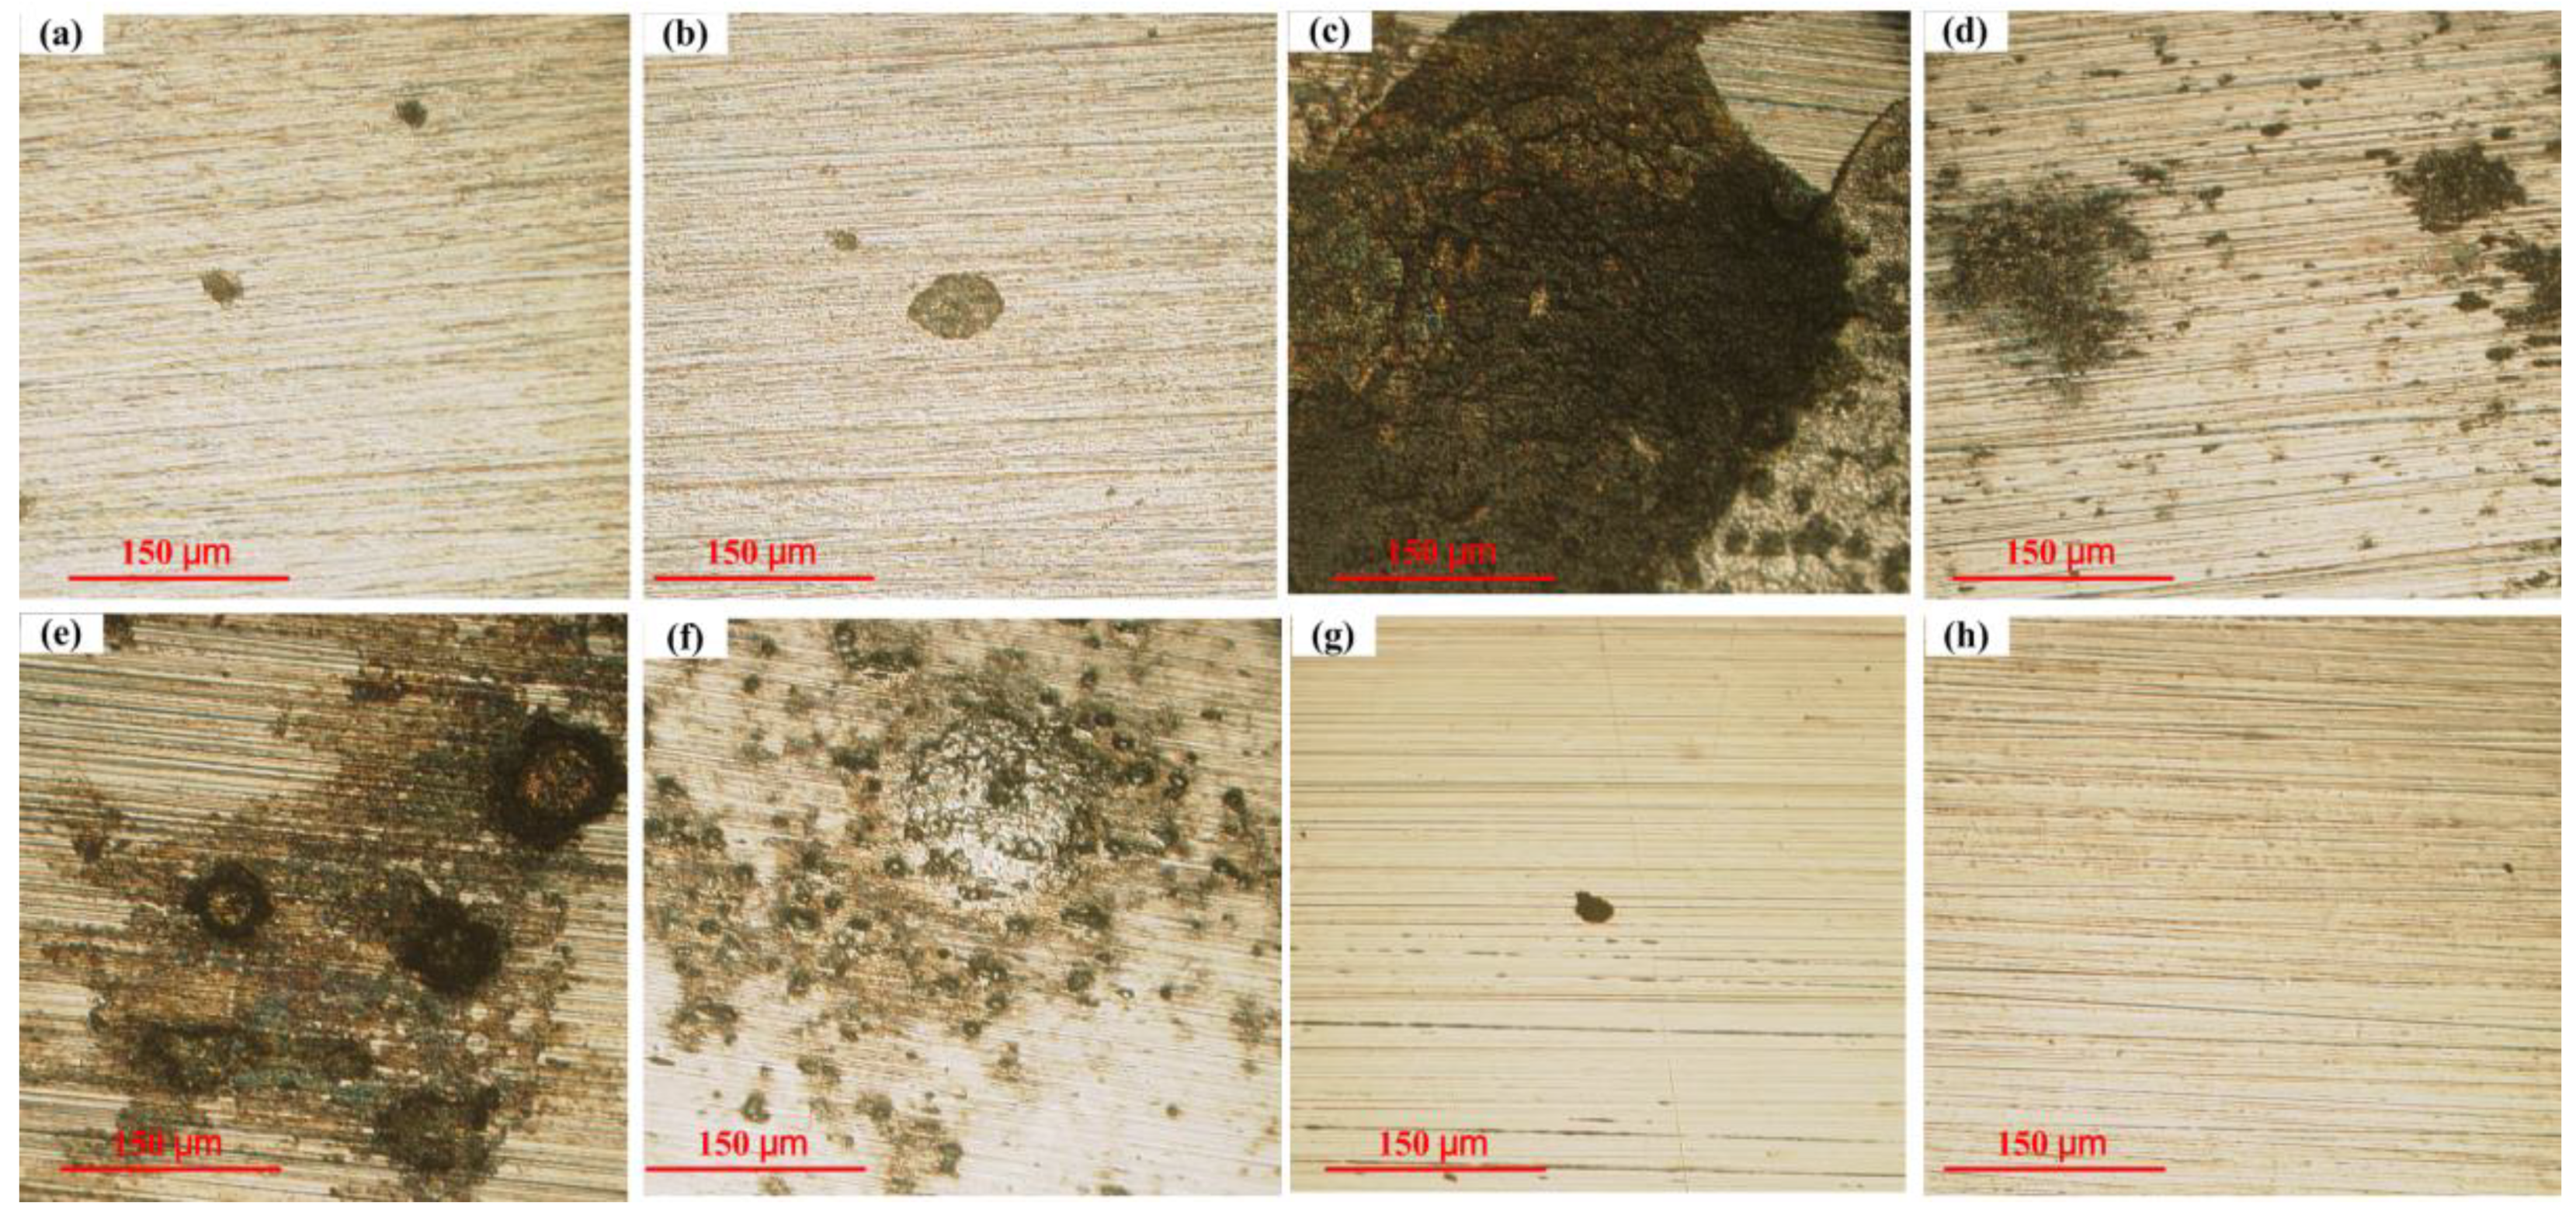
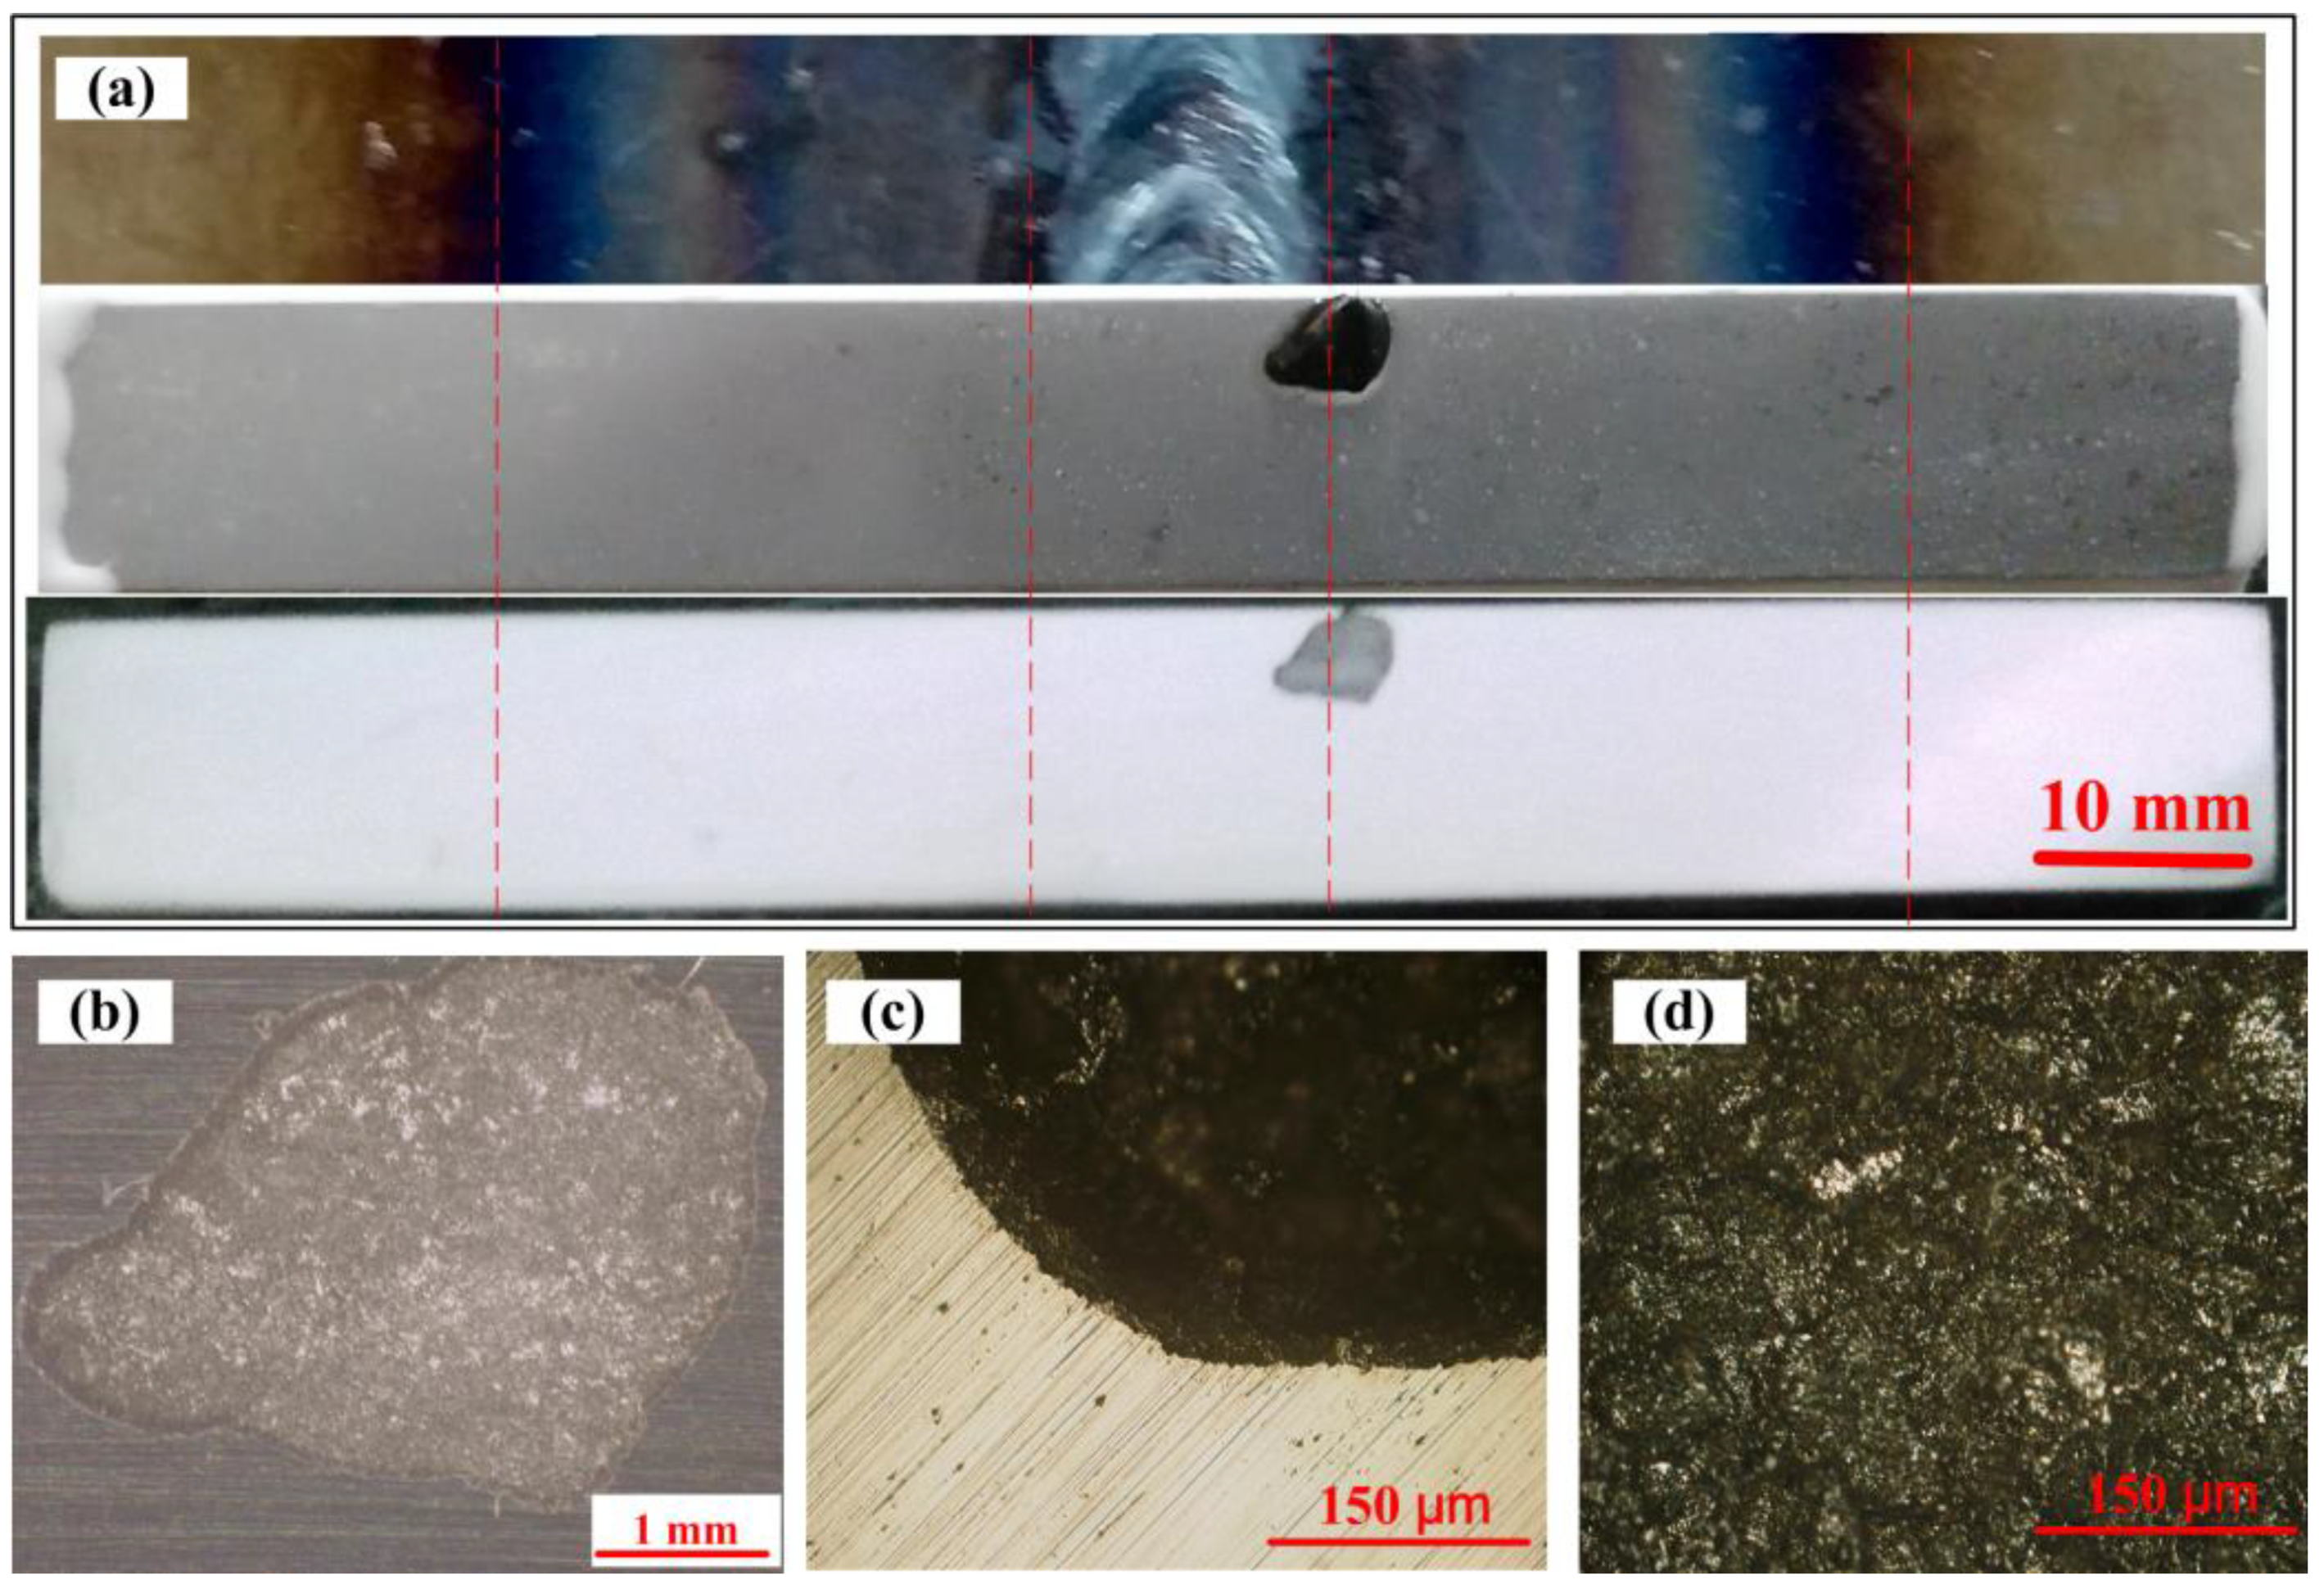
3.3. The Morphologies of the Working Electrodes and the Corrosion Coupon

After removing the loose rust layers on the electrodes, the surface morphologies of the working electrodes were observed and shown from Figure 6a–h. It can be seen from the surfaces of WE 1, WE 2, WE 7, and WE 8 which had minor anodic electric charges were smooth and the scratches can be seen. However, a few tiny pits can still be seen on the electrode surfaces, indicating slight localized corrosion happened on these electrodes. Serious localized corrosion can be found on WE 3 to WE 6. The WE 3 suffered the most severe corrosion with a large localized corrosion area on its surface. Obvious pitting corrosion can be found on the surfaces of WE 5 and WE 6. As the anodic electric charge of WE 4 was relatively small, the localized corrosion level on WE 4 was lower than those on WE 5 and WE 6. The surface morphologies of the electrodes clearly show that the welding metal and heat-affected areas will suffer more serious localized corrosion in a welded structure. The observed results are in accordance with the measurement results obtained by the coupled multi-electrode array sensor.
Once the passive film on the steel surface is broken, a stable pit will soon form and a large quantity of Fe2+ will enrich the pitting corrosion area. Meanwhile, with the enrichment of the Fe2+, a mass of Cl will also migrate into the pit. It can be seen from Figure 7a that a green rust layer appeared on the steel surface, suggesting the formation of FeCl2·4H2O [43] according to Equation (1):
Fe 2 + + 2 Cl + 4 H 2 O FeCl 2 · 4 H 2 O
Because β-FeOOH always appears in the corrosion product, the rust layer showed a dark green color. As shown in Figure 7a, an obvious pit can be seen on the corrosion coupon after a longer immersion test. The whole surface morphology as well as the edge and inner morphologies of the pit can be seen from Figure 7b–d. It can be seen that the pitting corrosion area was located in the WM zone and the HAZ bordering the WM area. The pitting corrosion area was more serious and concentrated compared with the multi-electrode sensor system. The immersion test result was in accordance with the measurement results obtained by the sensor system that the breakdown of the passive film firstly occurs at the WM zone and HAZ 1. Except for the pitting corrosion area, nearly no obvious corrosion happened on the other areas of the weldment. It further confirms that once a stable pit is forming on the weldment, the galvanic current can provide protection to the other areas and accelerate the localized corrosion at the pitting area.

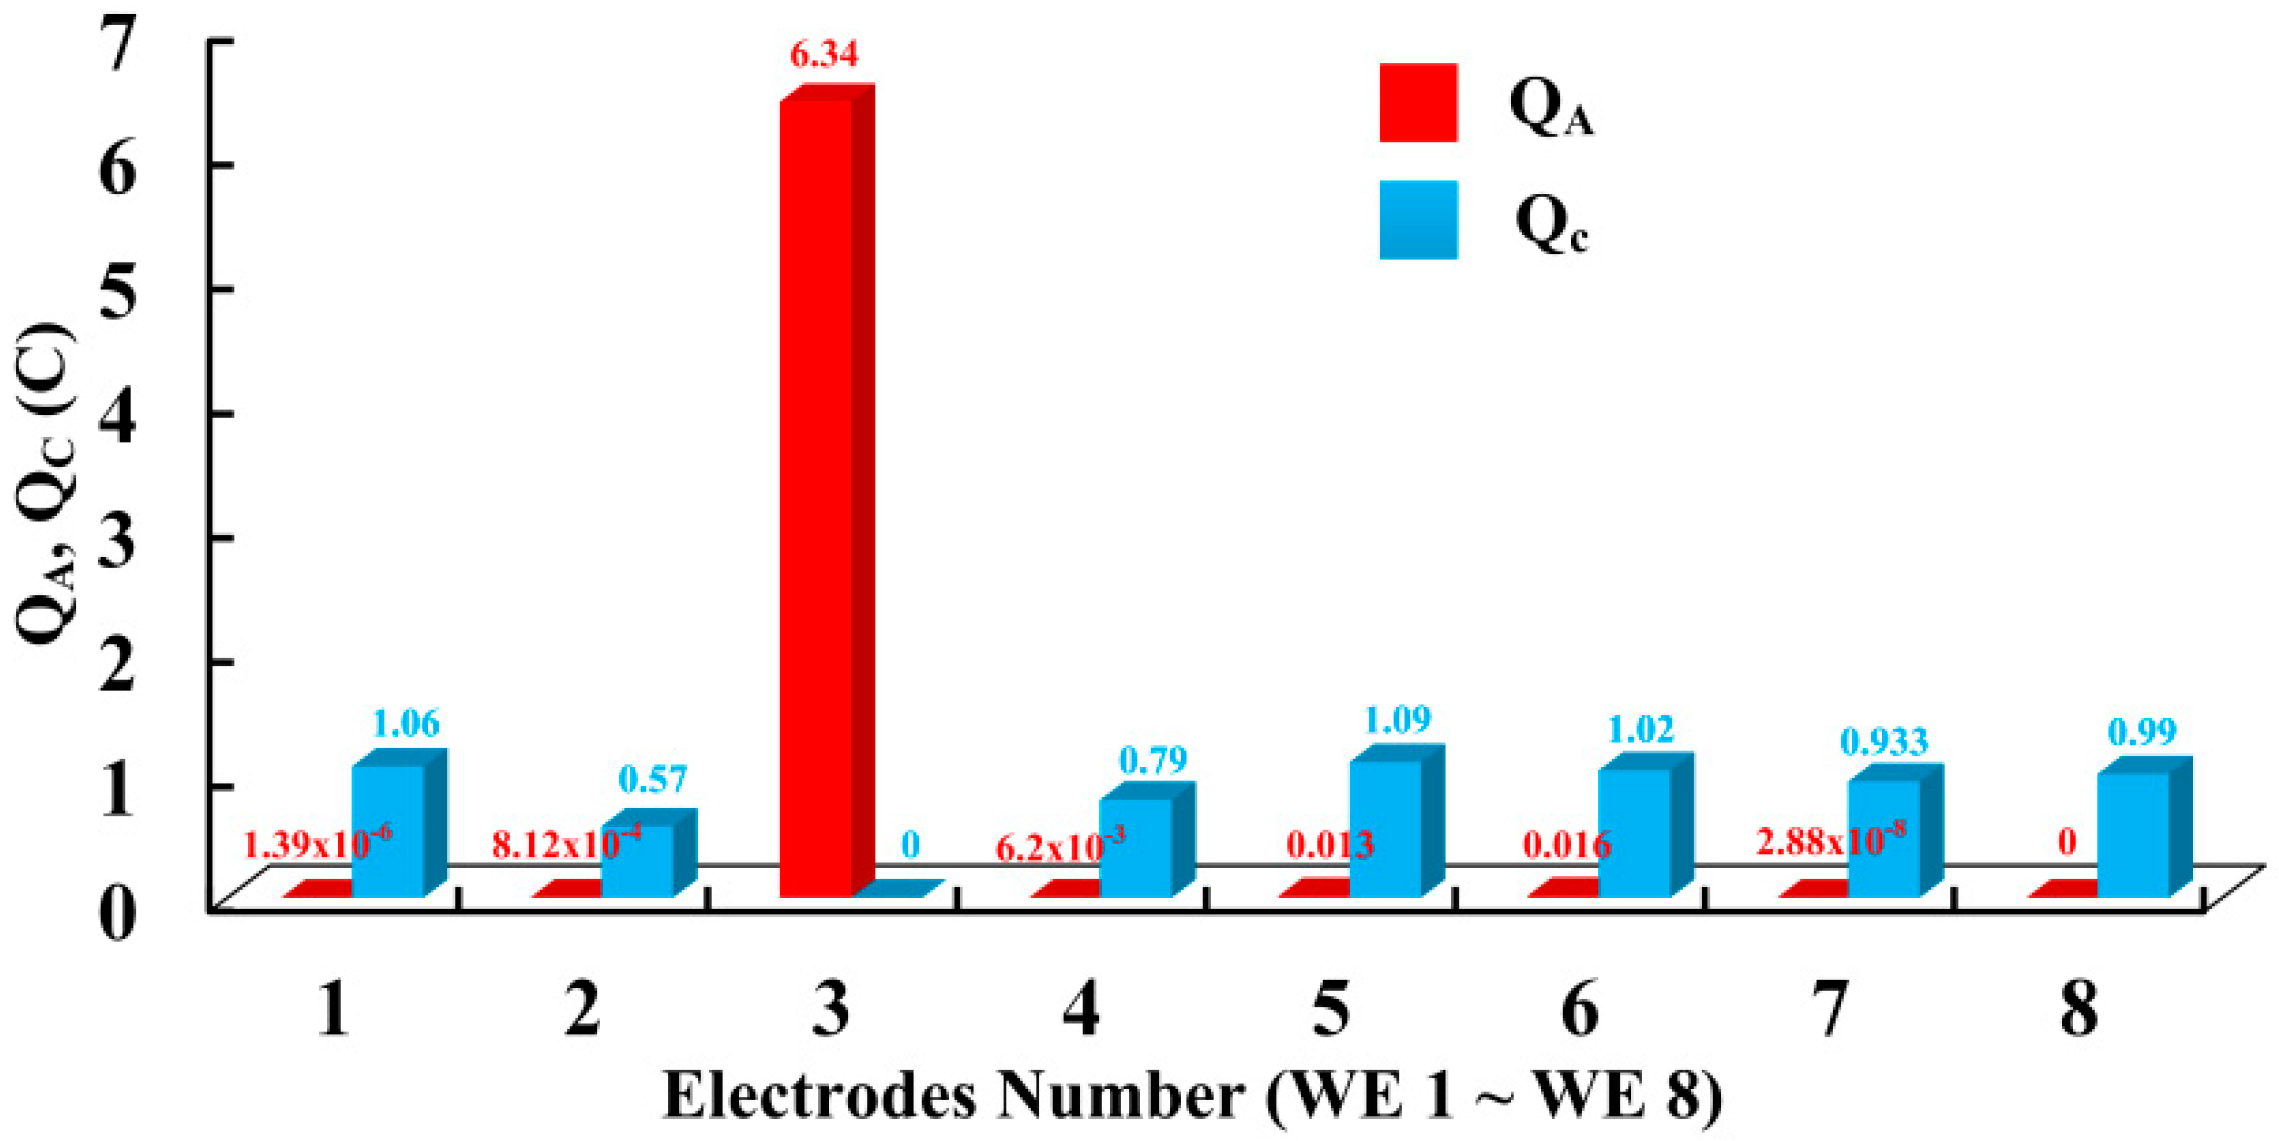
3.4. The Measurement Error Analysis of the Multi-Electrode Sensor System

It can be seen from Figure 6 that serious localized corrosion also happened on WE 5 and WE 6. Tiny pits can also be observed on WE 1, WE 2, and WE 7 as well. According to the calculating results of the anodic electric charge, the corrosion depths of WE 4 and WE 5 were only 4.7 × 10⁻³ μm and 5.9 × 10⁻³ μm, respectively. Andrade [44] pointed out that the corrosion current in a corroding area on the rebar is composed of the macrocell current between the non-corroding zones and corroding zones and microcell current produced within the corroding zones. The galvanic current is not directly equal to the corrosion current. This theory well explained the measurement error of the multi-electrode system. The multi-electrode array is a more complex system. As shown in Figure 8, the corrosion current of one electrode Icorr can be expressed as:
I c o r r = I M a c r o + I M i c r o = I M i c r o + i = 1 7 I g i
where IMacro is the sum of the galvanic current flowing to the other electrodes, IMicro is the corrosion current within the electrode. Through the ZRA, only IMacro can be measured. In general studies, it is thought that the electrode will act as a cathode when the IMacro is positive. However, it cannot be guaranteed the whole galvanic current (Ig1, Ig2, …, Ig7) are all positive. In other words, even if the electrode obtained an electron in the system, it cannot be determined as the pure cathodic area. In this test, during the period from 35 h to 63 h, except for the only anodic electrode WE 3, the other electrodes all acted as cathodes and a large cathodic current was flowing to these electrodes. Nevertheless, the OCP of WE 4, WE 5, and WE 6 were −283 mV, −310 mV, and −279 mV at 48 h which was much lower than the other cathodic electrodes. Meanwhile, the OCP also indicated the passive film on these electrodes which were not intact. Both IMicro and anodic galvanic current should exist on the three electrodes and it will lead to underestimates of the corrosion degree on the electrodes. This phenomenon also appeared in Legat’s [45] studies that serious corrosion occurred on the cathodic electrodes by using the multi-electrode array.
For the pure anodic electrodes WE 3, since the OCP was the most negative, it can ensure that all the galvanic currents were negative. The measurement error caused by the galvanic current can be ignored. The IMicro became the only factor for the measurement error of the pure anodic electrode. It can be seen from Figure 8, when the pure anodic electrode was coupled with the other cathodic electrodes, the potentials of the electrodes will be polarized to the same coupling potential Ecouple [25]. The corrosion current Icorr was the anodic reaction current and it can be calculated from the Ecouple as shown in Figure 8. Meanwhile, the cathodic reaction current Ic also can be obtained. The corrosion current can be deduced from the diagram:
I c o r r = I M a c r o + I c
Combined with Equation (4), it can be found that IMicro is equal to the cathodic reaction current. The Icorr0 shown in Figure 9 is the corrosion current at the OCP and it can be accurately measured by LPR method. It can be seen that Ic is smaller than Icorr0. In this test, when serious localized corrosion happened on WE 3, the OCP of the WE 3 was −697 mV which was close to the coupled potential of −650 mV. Therefore, the Icorr0 can be used to qualitatively estimate the Imicro. Because the anodic polarization may impact the surface of the electrode, the measurement of the Icorr0 was not conducted into this test to ensure the in-situ monitoring status of the sensor system. In previous studies, the corrosion rate of the Q235 carbon steel in the simulated pore solution with 3.5% NaCl added was between 0.15 mm/a and 0.28 mm/a after the breakdown of the passive film [34]. It can be used as reference data for the evaluation of the highest localized penetration rate in this test. The upper limit of the highest localized corrosion rate of the weldment may reach 1.1 mm/a based on the reference data.
However, in this test, the corrosion process of the welded structure in concrete is a typical localized corrosion pattern. The reference IMicro is almost four times smaller than the IMacro on WE 3. The highest localized corrosion rate can be well reflected by the sensor system. This parameter is also the most concerning factor for the failure evaluation of the marine structure. Consequently, the coupled multi-electrode array sensor system can be applied as an effective method for monitoring the localized corrosion in the ocean and coastal structures.

4. Conclusions

The study of the corrosion behavior of carbon steel weldments in carbonated pore solution by using the coupled multi-channel electrode shows the following results:
(1)
A complete welded structure can be well simulated by using the coupled multi-electrode array sensor system. The OCP of the electrodes, the coupled potential, and the galvanic currents among the electrodes can be online monitored. The maximum penetration rate of the weldment can be measured when serious localized corrosion happens. The metastable pitting corrosion and stable pitting corrosion process can also be revealed by the sensor system. This sensor system can be used as an effective method to monitor corrosion of weldments in marine concrete structures.
(2)
The passive film on the WM area and the HAZ closings to the WM area are fragile and it is easier for them to be destroyed by the aggressive ions in the marine environment. These areas will confront high preferential corrosion risks and they always act as anodes when coupled with the BM area. Once stable pits were formed on the WM area or the HAZ, a localized anodic area will form and leads to a high penetration rate. The high galvanic current among the WM zone, HAZ, and BM zone will also result in the acceleration of the localized corrosion. The highest localized corrosion rate of the weldment in the carbonated pore solution containing 0.2 mol/L Cl can reach a value higher than 0.8 mm/a, which will result in the fast failure of the marine structure.
(3)
The inhibitor NaNO2 has an obvious inhibition effect on the corrosion of weldments when the ratio of NO2 and Cl is 0.5. The maximum anodic current has a nearly 80 times decrease after the inhibitor was added. The OCP of the localized corrosion area also recovered with the introduction of the inhibitor. It indicates that NO2 has a strong repair function for the broken passive film on the WM zone and HAZ in carbonated pore solution.
(4)
The localized corrosion rate and the corrosion depths of the electrodes will be underestimated only based on the anodic current and anodic electric charges obtained by the sensor system. The electrodes with cathodic currents cannot be directly considered as the pure cathodic area. Both negative galvanic current and microcurrent may exist on these electrodes. For the pure anodic electrode, the main measurement error of the maximum localized corrosion rate is caused by its internal micro-current. When the coupled potential is close to the OCP of the pure anodic electrode, the measurement of the corrosion current at the OCP can provide a further evaluation of the maximum penetration rate.

Supplementary Materials

The following are available online at https://www.mdpi.com/article/10.3390/app11188278/s1, Figure S1: Time dependence of the galvanic currents among the repeat sample#1 (a), the galvanic currents at 0 h to 28 h (b), the galvanic currents at 38 h to 61 h (c), and the galvanic currents at 61 h to 108 h (d), Figure S2: Time dependence of the galvanic currents among the repeat sample#2 (a), the galvanic currents at 0 h to 25 h (b), the galvanic currents at 36 h to 61 h (c), and the galvanic currents at 61 h to 108 h (d).

Author Contributions

L.Y. and Z.M.: formulation, writing, and analysis of the paper. Y.Z. and X.W.: Data curation. Y.H., K.W., S.S. and W.J.: Supervision and Validation. All authors: data analysis, discussion, writing and revision of the manuscript. All authors have read and agreed to the published version of the manuscript.

Funding

This research was supported by the Key-Area Research and Development Program of Guangdong Province (No. 2019B111105002).

Institutional Review Board Statement

Not applicable.

Informed Consent Statement

Not applicable.

Data Availability Statement

Not applicable.

Acknowledgments

We thank Liang Liu for their technical support in the design of the experimental method.

Conflicts of Interest

We declare no conflict of interest.

References

  1. Hassan, M.K.; Subramaniana, K.B.; Saha, S. Behaviour of prefabricated steel-concrete composite slabs with a novel interlocking system -Numerical Analysis. Eng. Struct. 2021, 245, 112905. [Google Scholar] [CrossRef]
  2. Haryanto, Y.; Wariyatno, N.G.; Hu, H.T. Investigation on Structural Behavior of Bamboo Reinforced Concrete Slabs under Concentrated Load. Sains Malays. 2021, 50, 227–238. [Google Scholar] [CrossRef]
  3. Xie, J.H.; Wei, M.W.; Huang, P.Y. Fatigue behavior of the basalt fiber-reinforced polymer/concrete interface under wet-dry cycling in a marine environment. Constr. Build. Mater. 2019, 228, 117065. [Google Scholar] [CrossRef]
  4. Gholipour, G.; Zhang, C.; Mousavi, A.A. Nonlinear failure analysis of bridge pier subjected to vessel impact combined with blast loads. Ocean. Eng. 2021, 234, 109209. [Google Scholar] [CrossRef]
  5. Liu, Y.; Asselin, E. Communication—The Galvanic Effect on the Under-Deposit Corrosion of Titanium in Chloride Solutions. J. Electrochem. Soc. 2021, 168, 071512. [Google Scholar] [CrossRef]
  6. Sohail, M.G.; Laurens, S.; Deby, F.; Balayssac, J.P.; Al Nuaimi, N. Electrochemical corrosion parameters for active and passive reinforcing steel in carbonated and sound concrete. Mater. Corros. 2021. [Google Scholar] [CrossRef]
  7. Kim, H.S.; Kim, C.G.; Na, W.B.; Kim, J.K. Chemical degradation characteristics of reinforced concrete reefs in South Korea. Ocean. Eng. 2008, 35, 738–748. [Google Scholar] [CrossRef]
  8. Bautista, A.; Paredes, E.C.; Alvarez, S.M.; Velasco, F. Welded, sandblasted, stainless steel corrugated bars in non-carbonated and carbonated mortars: A 9-year corrosion study. Corros. Sci. 2016, 102, 363–372. [Google Scholar] [CrossRef] [Green Version]
  9. Gilbert, R.I.; Sakka, Z.I. Strength and ductility of reinforced concrete slabs containing welded wire fabric and subjected to support settlement. Eng. Struct. 2010, 32, 1509–1521. [Google Scholar] [CrossRef]
  10. Ayyub, B.M.; Mutairi, N.A.; Chang, P. Structural strength of bidge decks reinforces with welded wire fabric. J. Struct. Eng. 1996, 122, 989–997. [Google Scholar] [CrossRef]
  11. Zhu, Y.; Xu, Y.; Li, K. Experimental study on non-uniform corrosion of elbow-to-pipe weldment using multiple ring form electrical resistance sensor array. Measurement 2019, 138, 8–24. [Google Scholar] [CrossRef]
  12. Zhu, Y.; Xu, Y.; Song, S. Probing the nonuniform corrosion of pipeline weldments under stepwise increasing solution temperature using a coupled multielement electrical resistance sensor. Mater. Corros. 2020, 71, 1386–1399. [Google Scholar] [CrossRef]
  13. Mohammadi, F.; Eliyan, F.F.; Alfantazi, A. Corrosion of simulated weld HAZ of API X-80 pipeline steel. Corros. Sci. 2012, 63, 323–333. [Google Scholar] [CrossRef]
  14. Huang, Y.; Yang, L.J.; Xu, Y.Z.; Cao, Y.Z.; Song, S.D. A novel system for corrosion protection of reinforced steels in the underwater zone, Corrosion Engineering. Sci. Technol. 2016, 51, 566–572. [Google Scholar]
  15. James, A.; Bazarchi, E.; Chiniforush, A.A. Rebar corrosion detection, protection, and rehabilitation of reinforced concrete structures in coastal environments: A review. Constr. Build. Mater. 2019, 224, 1026–1039. [Google Scholar] [CrossRef]
  16. Zhu, J.; Xu, L.; Feng, Z.; Frankel, G.S.; Lu, M.; Chang, W. Galvanic corrosion of a welded joint in 3Cr low alloy pipeline steel. Corros. Sci. 2016, 111, 391–403. [Google Scholar] [CrossRef]
  17. Scott, R.H.; Chikermane, S.; Vidakovic, M. Development of low cost packaged fibre optic sensors for use in reinforced concrete structures. Measurement 2019, 135, 617–624. [Google Scholar] [CrossRef]
  18. Bouzaffour, K.; Lescop, B.; Talbot, P. Development of an Embedded UHF-RFID Corrosion Sensor for Monitoring Corrosion of Steel in Concrete. IEEE Sens. J. 2021, 21, 12306–12312. [Google Scholar]
  19. Huang, Y.; Xu, Y.; Li, B.; Ying, L.; Yang, F.; Wang, X. Novel electrical resistance method to measure underdeposit corrosion and its inhibition in pipeline steels, Corrosion Engineering. Sci. Technol. 2016, 51, 211–222. [Google Scholar]
  20. Tan, Y.; Fwu, Y.; Bhardwaj, K. Electrochemical evaluation of under-deposit corrosion and its inhibition using the wire beam electrode method. Corros. Sci. 2011, 53, 1254–1261. [Google Scholar] [CrossRef]
  21. Karelina, M.Y.; Didmanidze, O.N. Methods of electrochemical research of corrosion resistance of metal treated with corrosion inhibitors, created on the basis of plant-based raw materials. In IOP Conference Series: Materials Science and Engineering, Proceedings of the International Conference on Digital Solutions for Automotive Industry, Roadway Maintenance and Traffic Control (DS ART 2020), Moscow, Russia, 14–16 December 2020; IOP Publishing: Bristol, UK, 2021; Volume 1159, p. 012086. [Google Scholar]
  22. Tan, Y. Sensing localised corrosion by means of electrochemical noise detection and analysis. Sens. Actuators B Chem. 2009, 139, 688–698. [Google Scholar] [CrossRef] [Green Version]
  23. Dong, Z.H.; Shi, W.; Guo, X.P. Initiation and repassivation of pitting corrosion of carbon steel in carbonated concrete pore solution. Corros. Sci. 2011, 53, 1322–1330. [Google Scholar] [CrossRef]
  24. Dong, Z.H.; Shi, W.; Zhang, G.A.; Guo, X.P. The role of inhibitors on the repassivation of pitting corrosion of carbon steel in synthetic carbonated concrete pore solution. Electrochim. Acta 2011, 56, 5890–5897. [Google Scholar] [CrossRef]
  25. Xu, Y.Z.; Yang, L.J.; He, L.M.; Huang, Y.; Wang, X.N. The monitoring of galvanic corrosion behaviour caused by mineral deposit in pipeline working conditions using ring form electronic resistance sensor system. Corros. Eng. Sci. Technol. 2016, 51, 606–620. [Google Scholar] [CrossRef]
  26. Sun, X.; Sun, D.; Yang, L. Corrosion monitoring under cathodic protection conditions using multielectrode array sensors. In Techniques for Corrosion Monitoring, 2nd ed.; Woodhead Publishing: Cambridge, UK, 2021. [Google Scholar]
  27. Naganuma, A.; Fushimi, K.; Azumi, K.; Habazaki, H.; Konno, H. Application of the multichannel electrode method to monitoring of corrosion of steel in an artificial crevice. Corros. Sci. 2010, 52, 1179–1186. [Google Scholar] [CrossRef] [Green Version]
  28. Yang, L.T.; Sun, X.D. Measurement of cumulative localized corrosion rate using coupled multielectrode array sensors. In Proceedings of the Corrosion Conference and Expo (CORROSION 2007), Nashville, TN, USA, 11 March 2007. [Google Scholar]
  29. Yang, L.T.; Chiang, K.T.; Yu, H.; Pabalan, R.T.; Dasgupta, B.; Ibarra, L. Threshold chloride levels for localized carbon steel corrosion in simulated concrete pore solutions using coupled multielectrode array sensor. Corrosion 2014, 70, 850–857. [Google Scholar] [CrossRef]
  30. Liu, Z.; Wang, W.; Wang, J.; Peng, X.; Wang, Y.; Zhang, P. Study of corrosion behavior of carbon steel under seawater film using the wire beam electrode method. Corros. Sci. 2014, 80, 523–527. [Google Scholar] [CrossRef]
  31. Huo, Y.; Tan, M.Y.; Forsyth, M. Visualising dynamic passivation and localised corrosion processes occurring on buried steel surfaces under the effect of anodic transients. Electrochem. Commun. 2016, 66, 21–24. [Google Scholar] [CrossRef]
  32. Tan, Y. Experimental methods designed for measuring corrosion in highly resistive and inhomogeneous media. Corros. Sci. 2011, 53, 1145–1155. [Google Scholar] [CrossRef]
  33. Bastos, A.C.; Ferreira, M. Application of the scanning vibrating electrode technique to the characterization of modern coatings. In Handbook of Modern Coating Technologies; Elsevier: Amsterdam, The Netherlands, 2021; pp. 1–43. [Google Scholar]
  34. Yang, L.J.; Xu, Y.Z.; Zhu, Y.S. Evaluation of Interaction Effect of Sulfate and Chloride Ions on Reinforcements in Simulated Marine Environment Using Electrochemical Methods. Int. J. Electrochem. Sci. 2016, 11, 6943–6958. [Google Scholar] [CrossRef]
  35. Liu, L.; Zhu, Y.; Xu, Y.Z. The Roles of Fluid Hydrodynamics, Mass Transfer, Rust Layer and Macro-Cell Current on Flow Accelerated Corrosion of Carbon Steel in Oxygen Containing Electrolyte. J. Electrochem. Soc. 2020, 167, 141510. [Google Scholar] [CrossRef]
  36. Wood, M.H.; Welbourn, R.J.L. An X-ray and Neutron Reflectometry Study of Iron Corrosion in Seawater. Langmuir 2018, 34, 5990–6002. [Google Scholar] [CrossRef]
  37. Köliö, A.; Honkanen, M.; Lahdensivu, J. Corrosion products of carbonation induced corrosion in existing reinforced concrete facades. Cem. Concr. Res. 2015, 78, 200–207. [Google Scholar] [CrossRef]
  38. Yohai, L.; Schreiner, W.; Vázquez, M. Phosphate ions as effective inhibitors for carbon steel in carbonated solutions contaminated with chloride ions. Electrochim. Acta 2016, 202, 231–242. [Google Scholar] [CrossRef]
  39. Zhu, Y.; Ding, J.; Zhang, J. Effects of Sodium Phosphate and Sodium Nitrite on the Pitting Corrosion Process of X70 Carbon Steel in Sodium Chloride Solution. Materials 2020, 13, 5392. [Google Scholar] [CrossRef] [PubMed]
  40. ASTM International. ASTM C876-91, Standard Test Method for Half-Cell Potentials of Uncoated Reinforcing Steel in Concrete; Annual Book of ASTM Standards; ASTM International: West Conshohocken, PA, USA, 1991. [Google Scholar]
  41. Xu, Y.Z.; Huang, Y.; Ying, L. Corrosion behavior of pipeline steel under deposit corrosion and the inhibition performance of organic phosphine inhibitor. Acta Metall. Sin. 2016, 52, 320–330. [Google Scholar]
  42. Gsa, B.; Vca, B.; Nbc, D. On the in-situ characterisation of metastable pitting using 316L stainless steel as a case study. Corros. Sci. 2020, 177, 109004. [Google Scholar]
  43. Glasser, F.P.; Sagoe-Crentsil, K.K. Steel in concrete: Part II Electron microscopy analysis. Mag. Concr. Res. 1989, 149, 213–220. [Google Scholar] [CrossRef]
  44. Andrade, C.; Garcés, P.; Martínez, I. Galvanic currents and corrosion rates of reinforcements measured in cells simulating different pitting areas caused by chloride attack in sodium hydroxide. Corros. Sci. 2008, 50, 2959–2964. [Google Scholar] [CrossRef]
  45. Legat, A. Monitoring of steel corrosion in concrete by electrode arrays and electrical resistance probes. Electrochim. Acta 2007, 52, 7590–7598. [Google Scholar] [CrossRef]
Figure 1. The designated zones of WM, HAZ 1, HAZ 2, and BM on the steel weldment and the photos of the working electrodes and corrosion coupon.
Applsci 11 08278 g001
Figure 2. The measurement principle diagram of the coupled multi-electrode array sensor system.
Applsci 11 08278 g002
Figure 3. Time dependence of the coupled potential (a), the coupled potential at 0 h to 28 h (b), the coupled potential at 35 h to 61 h (c), and the coupled potential at 61 h to 110 h (d).
Applsci 11 08278 g003
Figure 4. Time dependence of the galvanic currents among the electrodes (a), the galvanic currents at 0 h to 28 h (b), the galvanic currents at 35 h to 61 h (c), and the galvanic currents at 61 h to 110 h (d).
Applsci 11 08278 g004
Figure 5. Anodic and cathodic electric charges of the electrodes.
Applsci 11 08278 g005
Figure 6. Surface morphologies of the electrodes taken 50 h after the inhibitor was added, (a) the surface of WE 1 (b) WE 2 (c) WE 3 (d) WE 4 (e) WE 5 (f) WE 6 (g) WE 7 and (h) WE 8.
Applsci 11 08278 g006
Figure 7. The photo of the corrosion coupon after immersed in the test solution for 144 h with and without the rust layer (a), the whole surface morphology of the pitting corrosion area (b), the edge of the pitting corrosion area (c), and the inner surface of the pitting corrosion area (d).
Applsci 11 08278 g007
Figure 8. Representation of the macro current among the electrodes and microcurrent within the corroding electrode.
Applsci 11 08278 g008
Figure 9. Schematic Evan’s Diagram illustrating the Icorr, IMacro, Icorr0, and Ic.
Applsci 11 08278 g009
Table 1. Chemical components of Q235 steel plate and J442 welding rod.
CSiMnPSCrNiFe
Q2350.22%0.30%0.40%0.04%0.04%0.01%0.01%Bal.
J4420.25%0.18%0.31%0.04%0.03%<0.01%<0.01%Bal.
Table 2. The OCP of the electrodes at different times.
Time (h)The OCP of the Electrodes (mV)
WE 1WE 2WE 3WE 4WE 5WE 6WE 7WE 8
0−180−210−275−219−247−240−224−185
24−173−207−327−221−263−253−237−169
48−158−237−697−283−310−279−258−166
72−150−200−289−190−224−240−175−148
96−161−235−313−232−247−259−203−157
Publisher’s Note: MDPI stays neutral with regard to jurisdictional claims in published maps and institutional affiliations.

